Embed Size (px)
Citation preview
Government of the People’s Republic of Bangladesh
Monthly Release
Foreign Trade Statistics July 2017
Issue-126
National Accounting Wing
BANGLADESH BUREAU OF STATISTICS
Statistics and Informatics Division
Ministry of Planning
Monthly Release of
Foreign Trade Statistics (FTS) July’17
Bangladesh Bureau of Statistics (BBS) of Statistics and Informatics Division (SID) compiles and
publishes Foreign Trade Statistics (FTS) on a regular basis. This publication presents monthly trend of
Bangladesh foreign trade statistics including statistics on top trading partners, essential import
commodities, and last twelve months scenario of major export and import goods for July, 2017.
Merchandise trade data of this publication are provided by National Board of Revenue (NBR) and
while data on services from Bangladesh Bank. Data presented in this publication are provisional and
subject to revision. All these provisional data will be subsequently reviewed and revised. Revised
data are being presented in next issues.
In July, 2017 total export and import of goods and services is recorded at decreased by Tk. 5.48 and
decreased by Tk. 97.36 billion respectively resulting in a trade deficit at goods and services of Tk.
91.88 billion. The growth of export and import in July, 2017 decreased by 101.96 and decreased by
125.78 percent respectively comparing to June, 2017 and it is decreased by 6919 and decreased by
29030 percent respectively comparing to July, 2016.
For the three months ending in July, 2017 the moving average of export of goods and services was Tk.
179.64 billion, while the moving average of import of goods and services was Tk. 246.81 billion
resulting in an average trade deficit of Tk. 67.17 billion. For the three months ending in June, 2017
the average trade deficit was Tk. 161.17 billion, reflecting average exports of Tk. 263.25 billion and
average imports of Tk. 424.42 billion.
Indicators of this publication are expected to provide a good idea about the trend of export and
import of the country over the previous months of a year. This monthly release would be a useful
document for planners, policy makers, researchers, development partners/agencies, academicians
and other stakeholders.
2
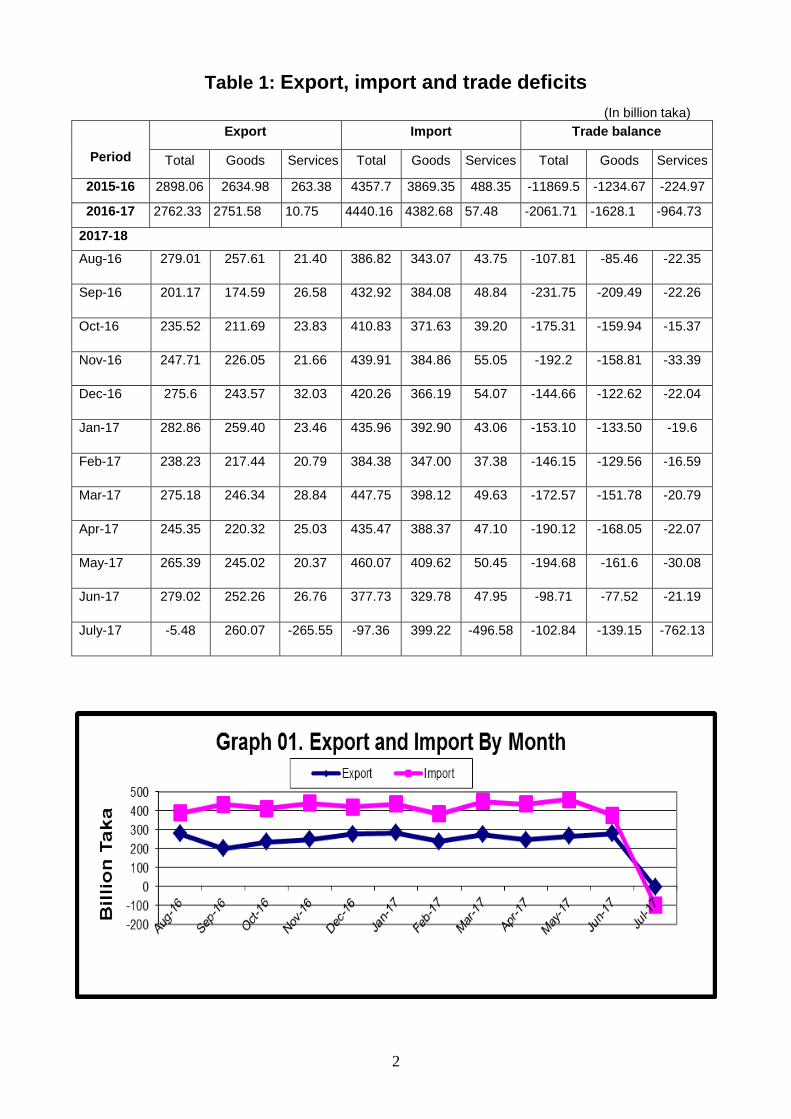
Table 1: Export, import and trade deficits
(In billion taka)
Period
Export Import Trade balance
Total Goods Services Total Goods Services Total Goods Services
2015-16 2898.06 2634.98 263.38 4357.7 3869.35 488.35 -11869.5 -1234.67 -224.97
2016-17 2762.33 2751.58 10.75 4440.16 4382.68 57.48 -2061.71 -1628.1 -964.73
2017-18
Aug-16 279.01 257.61 21.40 386.82 343.07 43.75 -107.81 -85.46 -22.35
Sep-16 201.17 174.59 26.58 432.92 384.08 48.84 -231.75 -209.49 -22.26
Oct-16 235.52 211.69 23.83 410.83 371.63 39.20 -175.31 -159.94 -15.37
Nov-16 247.71 226.05 21.66 439.91 384.86 55.05 -192.2 -158.81 -33.39
Dec-16 275.6 243.57 32.03 420.26 366.19 54.07 -144.66 -122.62 -22.04
Jan-17 282.86 259.40 23.46 435.96 392.90 43.06 -153.10 -133.50 -19.6
Feb-17 238.23 217.44 20.79 384.38 347.00 37.38 -146.15 -129.56 -16.59
Mar-17 275.18 246.34 28.84 447.75 398.12 49.63 -172.57 -151.78 -20.79
Apr-17 245.35 220.32 25.03 435.47 388.37 47.10 -190.12 -168.05 -22.07
May-17 265.39 245.02 20.37 460.07 409.62 50.45 -194.68 -161.6 -30.08
Jun-17 279.02 252.26 26.76 377.73 329.78 47.95 -98.71 -77.52 -21.19
July-17 -5.48 260.07 -265.55 -97.36 399.22 -496.58 -102.84 -139.15 -762.13
3
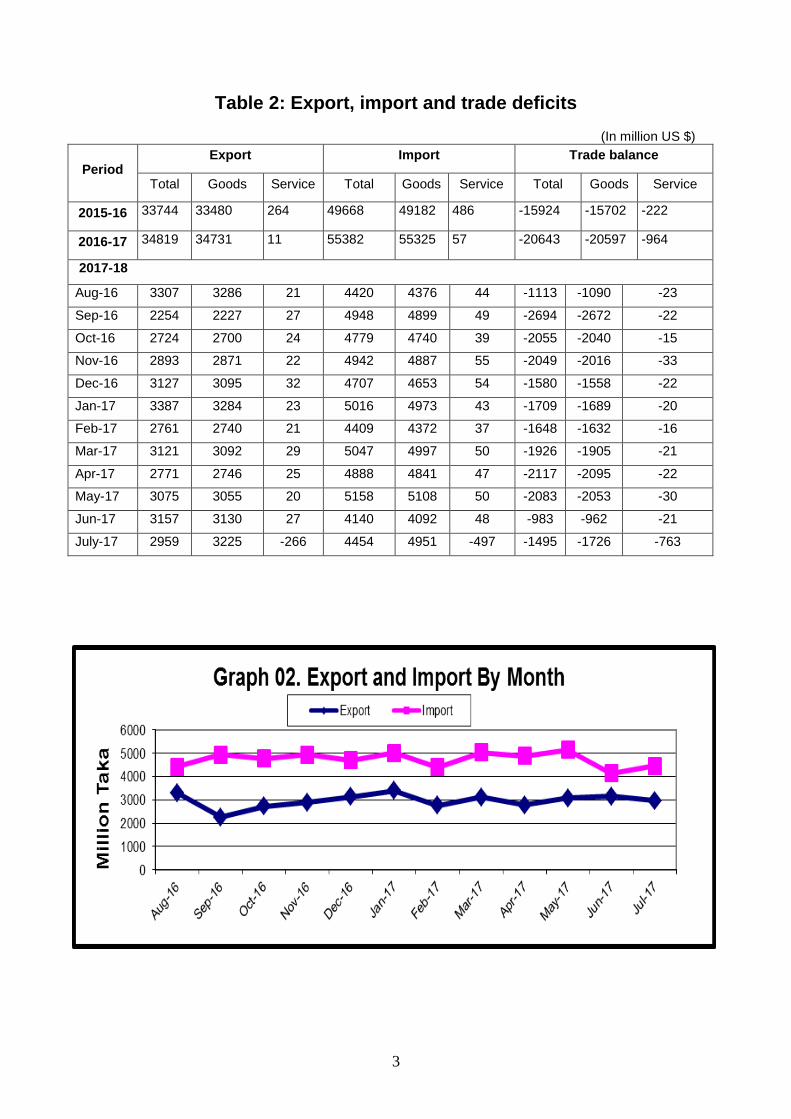
Table 2: Export, import and trade deficits
(In million US $)
Period Export Import Trade balance
Total Goods Service Total Goods Service Total Goods Service
2015-16 33744 33480 264 49668 49182 486 -15924 -15702 -222
2016-17 34819 34731 11 55382 55325 57 -20643 -20597 -964
2017-18
Aug-16 3307 3286 21 4420 4376 44 -1113 -1090 -23
Sep-16 2254 2227 27 4948 4899 49 -2694 -2672 -22
Oct-16 2724 2700 24 4779 4740 39 -2055 -2040 -15
Nov-16 2893 2871 22 4942 4887 55 -2049 -2016 -33
Dec-16 3127 3095 32 4707 4653 54 -1580 -1558 -22
Jan-17 3387 3284 23 5016 4973 43 -1709 -1689 -20
Feb-17 2761 2740 21 4409 4372 37 -1648 -1632 -16
Mar-17 3121 3092 29 5047 4997 50 -1926 -1905 -21
Apr-17 2771 2746 25 4888 4841 47 -2117 -2095 -22
May-17 3075 3055 20 5158 5108 50 -2083 -2053 -30
Jun-17 3157 3130 27 4140 4092 48 -983 -962 -21
July-17 2959 3225 -266 4454 4951 -497 -1495 -1726 -763
4
Table 3. Percent change from the previous month (goods)
(In million taka)
Items 2016-17
June’17 July’17 Percent change from the previous month
1. Export (Commodities ) 252258 260072
3.10
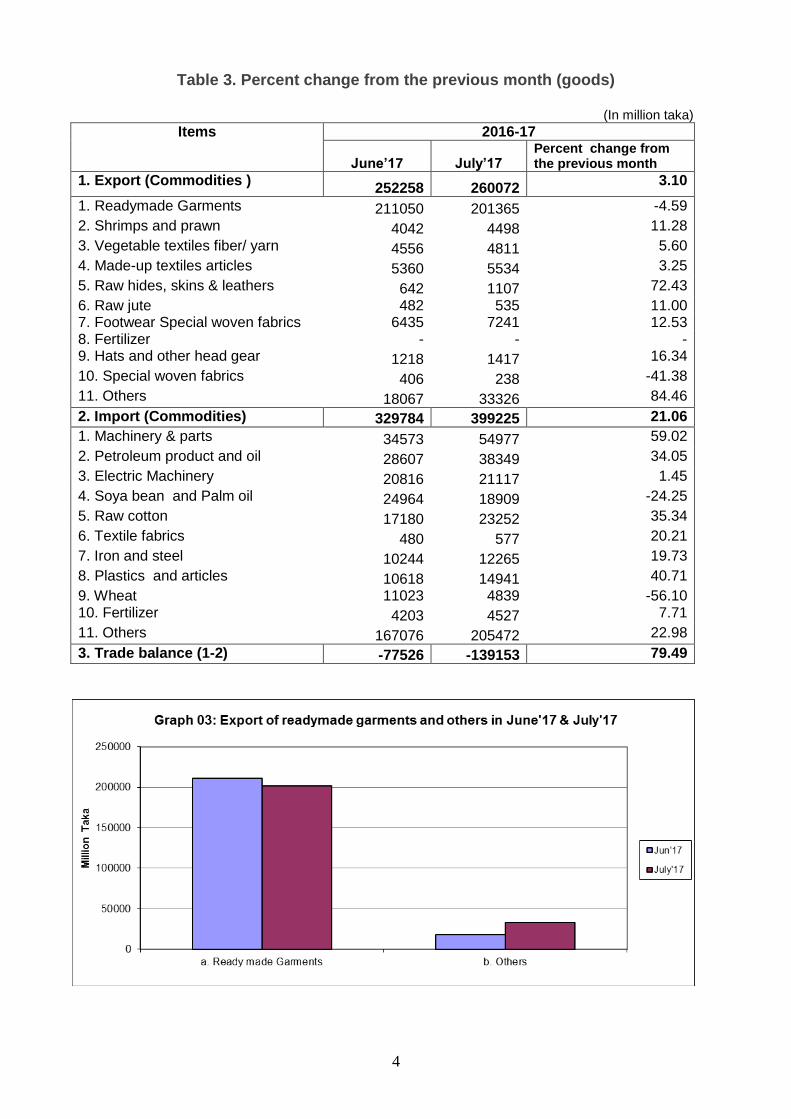
1. Readymade Garments 211050 201365 -4.59
2. Shrimps and prawn 4042 4498 11.28
3. Vegetable textiles fiber/ yarn 4556 4811 5.60
4. Made-up textiles articles 5360 5534 3.25
5. Raw hides, skins & leathers 642 1107 72.43
6. Raw jute 482 535 11.00 7. Footwear Special woven fabrics 6435 7241 12.53 8. Fertilizer - - - 9. Hats and other head gear 1218 1417 16.34
10. Special woven fabrics 406 238 -41.38
11. Others 18067 33326 84.46
2. Import (Commodities) 329784 399225 21.06
1. Machinery & parts 34573 54977 59.02
2. Petroleum product and oil 28607 38349 34.05
3. Electric Machinery 20816 21117 1.45
4. Soya bean and Palm oil 24964 18909 -24.25
5. Raw cotton 17180 23252 35.34
6. Textile fabrics 480 577 20.21
7. Iron and steel 10244 12265 19.73
8. Plastics and articles 10618 14941 40.71
9. Wheat 11023 4839 -56.10 10. Fertilizer 4203 4527 7.71
11. Others 167076 205472 22.98
3. Trade balance (1-2) -77526 -139153 79.49
5
Table 4. Import of Essential Commodities Quantity in M. Ton
Items 2016-17
June’17 July’17 Percent change from
the previous month
Cumulative
(July -17)
Import (Commodities)
1. Raw sugar 275042 316134 14.94 316134 2. Palm oil 293224 231359 -21.10 231359 3. Soya bean oil 135878 94069 -30.77 94069 4. Milk & Cream 7503 9733 29.72 9733 5. Ginger - - - - 6. Chillies - - - - 7. Wheat 587539 245870 -58.15 245870 8. Rice 61511 261322 324.84 261322 9. Lentil & other 19314 35727 84.98 35727 10.Onion 87906 104152 18.48 104152 11.Garlic 3543 5961 68.25 5961 12.Tea 82 7 -91.46 7 13.Oil seed 210200 141290 -32.78 141290 14. Gram/Anchor 41 - - - 15. Tarmaric 2437 1341 -44.97 1341
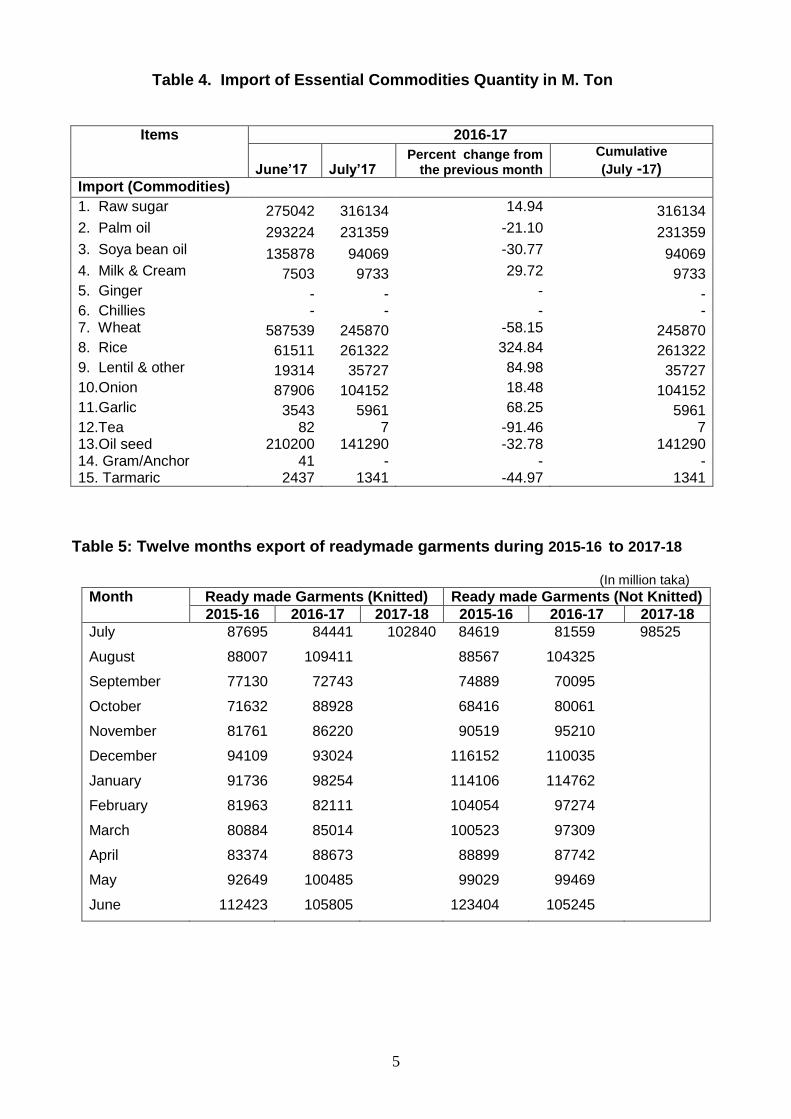
Table 5: Twelve months export of readymade garments during 2015-16 to 2017-18
(In million taka)
Month Ready made Garments (Knitted) Ready made Garments (Not Knitted)
2015-16 2016-17 2017-18 2015-16 2016-17 2017-18
July 87695 84441 102840 84619 81559 98525
August 88007 109411 88567 104325
September 77130 72743 74889 70095
October 71632 88928 68416 80061
November 81761 86220 90519 95210
December 94109 93024 116152 110035
January 91736 98254 114106 114762
February 81963 82111 104054 97274
March 80884 85014 100523 97309
April 83374 88673 88899 87742
May 92649 100485 99029 99469
June 112423 105805 123404 105245
6
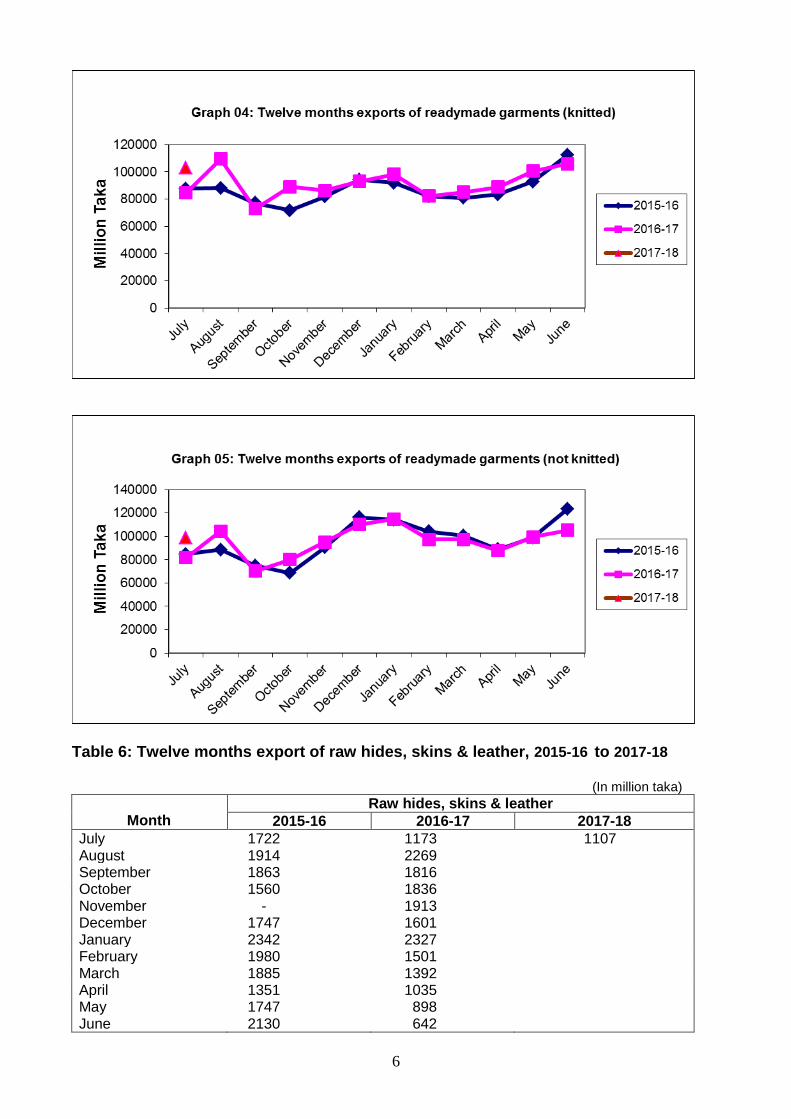
Table 6: Twelve months export of raw hides, skins & leather, 2015-16 to 2017-18
(In million taka)
Month
Raw hides, skins & leather
2015-16 2016-17 2017-18
July 1722 1173 1107 August 1914 2269 September 1863 1816 October 1560 1836 November - 1913 December 1747 1601 January 2342 2327 February 1980 1501 March 1885 1392 April 1351 1035 May 1747 898 June 2130 642
7
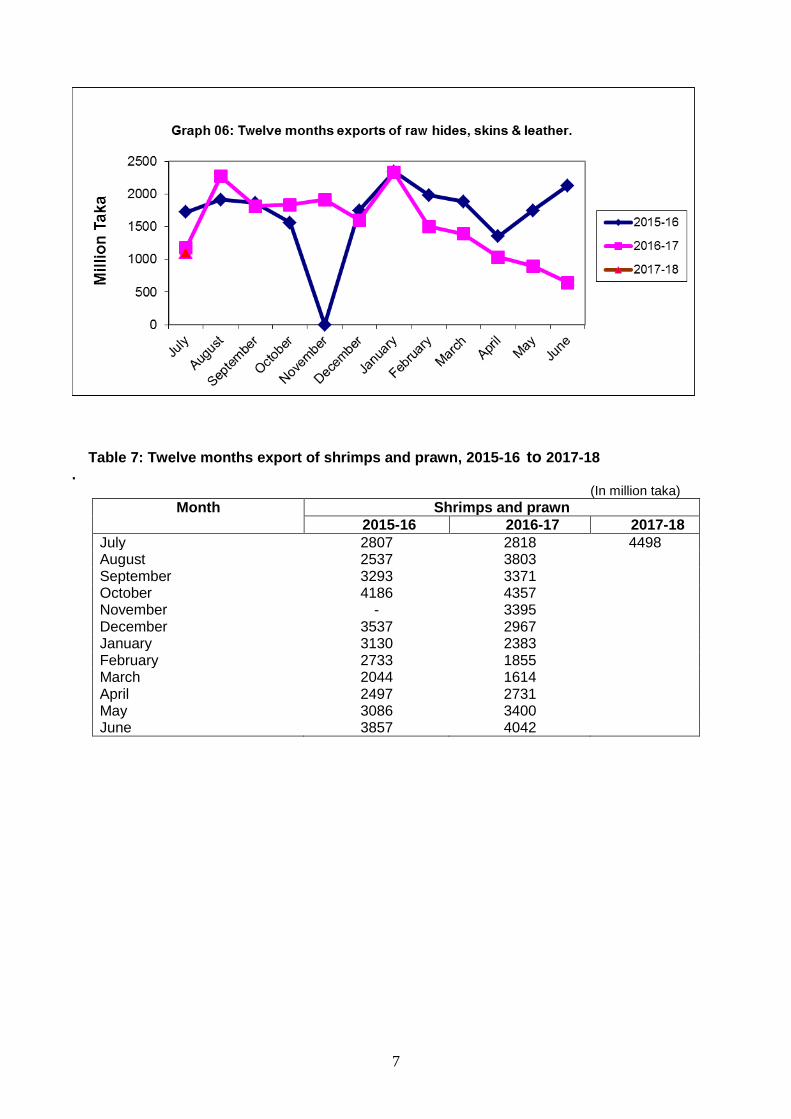
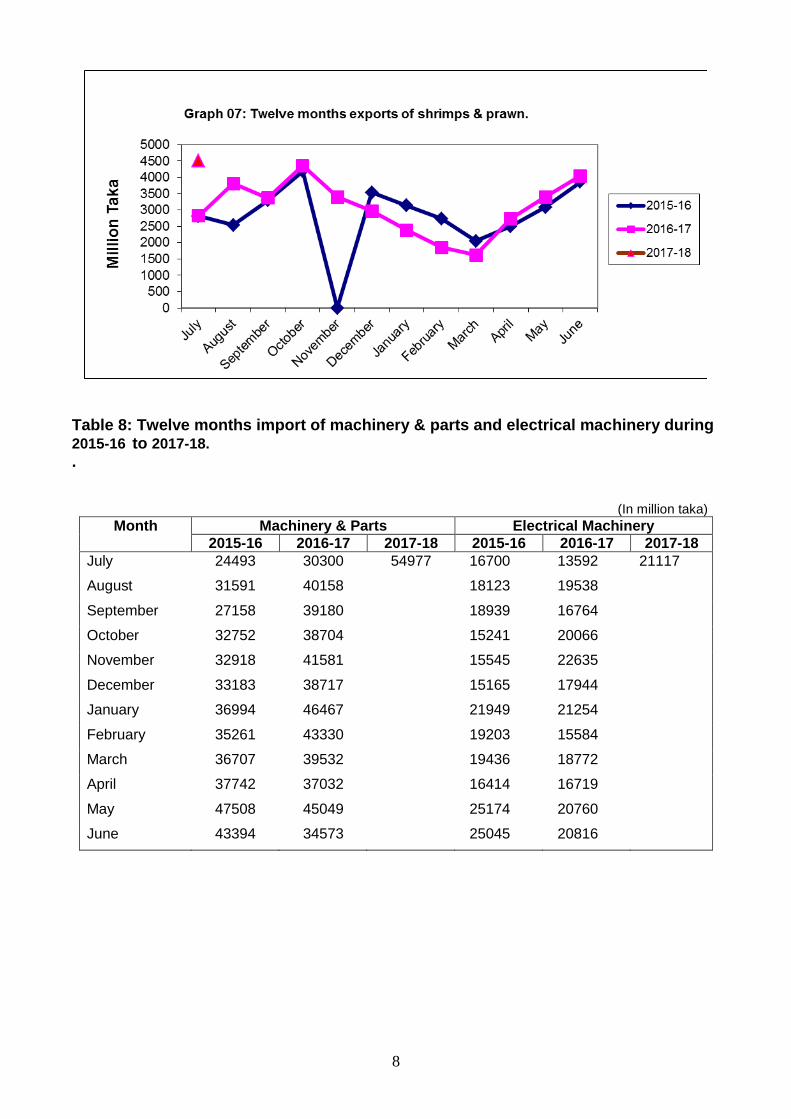
Table 7: Twelve months export of shrimps and prawn, 2015-16 to 2017-18 .
(In million taka)
Month Shrimps and prawn
2015-16 2016-17 2017-18
July 2807 2818 4498 August 2537 3803 September 3293 3371 October 4186 4357 November - 3395 December 3537 2967 January 3130 2383 February 2733 1855 March 2044 1614 April 2497 2731 May 3086 3400 June 3857 4042
8
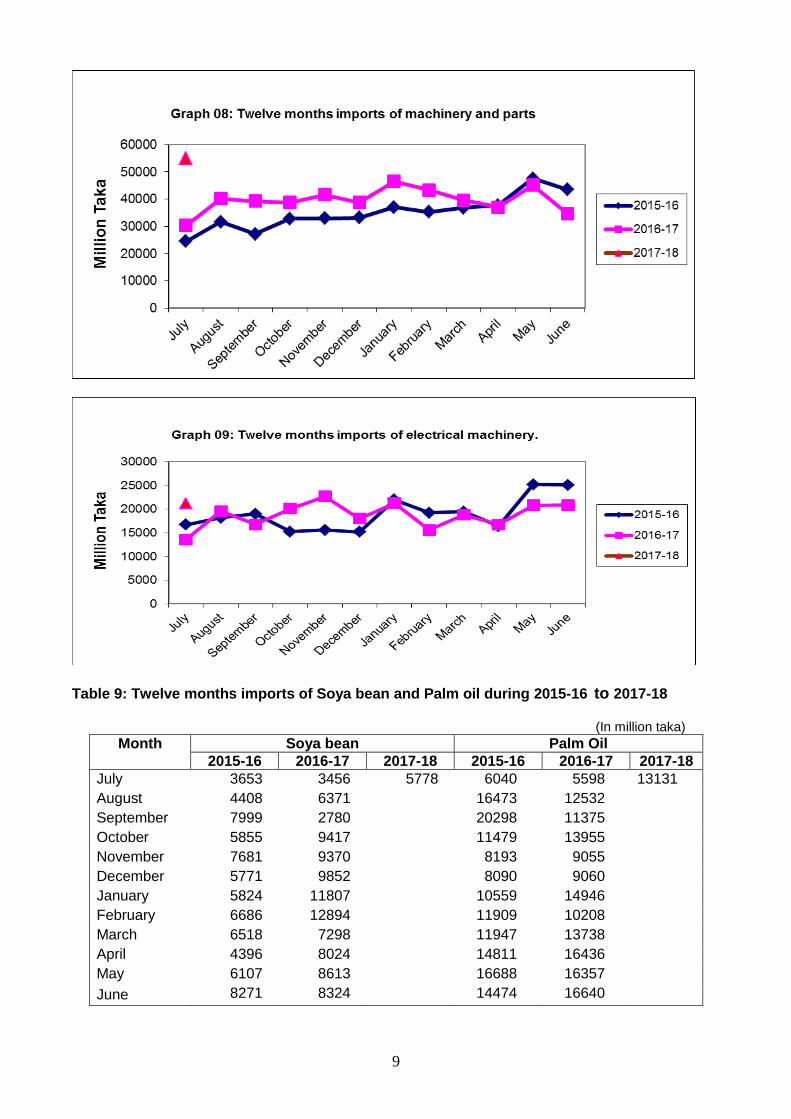
Table 8: Twelve months import of machinery & parts and electrical machinery during 2015-16 to 2017-18.
.
(In million taka)
Month Machinery & Parts Electrical Machinery
2015-16 2016-17 2017-18 2015-16 2016-17 2017-18
July 24493 30300 54977 16700 13592 21117
August 31591 40158 18123 19538
September 27158 39180 18939 16764
October 32752 38704 15241 20066
November 32918 41581 15545 22635
December 33183 38717 15165 17944
January 36994 46467 21949 21254
February 35261 43330 19203 15584
March 36707 39532 19436 18772
April 37742 37032 16414 16719
May 47508 45049 25174 20760
June 43394 34573 25045 20816
9
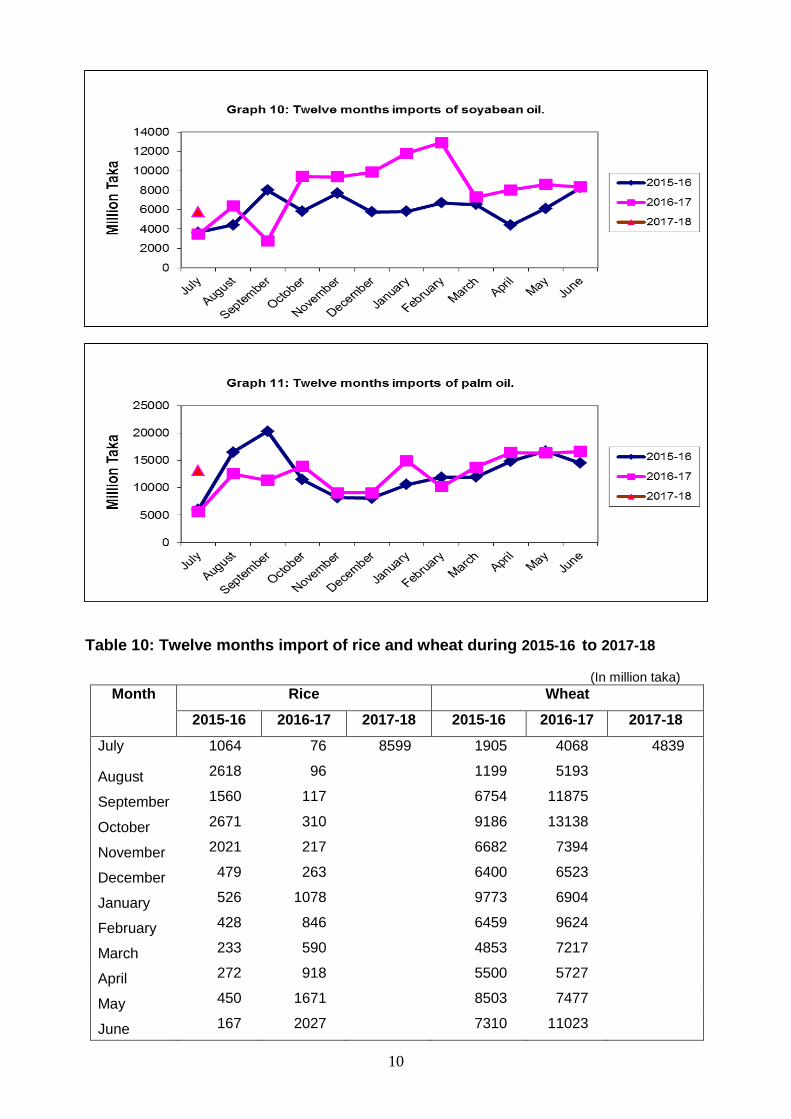
Table 9: Twelve months imports of Soya bean and Palm oil during 2015-16 to 2017-18
(In million taka)
Month Soya bean Palm Oil
2015-16 2016-17 2017-18 2015-16 2016-17 2017-18
July 3653 3456 5778 6040 5598 13131
August 4408 6371 16473 12532
September 7999 2780 20298 11375
October 5855 9417 11479 13955
November 7681 9370 8193 9055
December 5771 9852 8090 9060
January 5824 11807 10559 14946
February 6686 12894 11909 10208
March 6518 7298 11947 13738
April 4396 8024 14811 16436
May 6107 8613 16688 16357
June 8271 8324 14474 16640
10
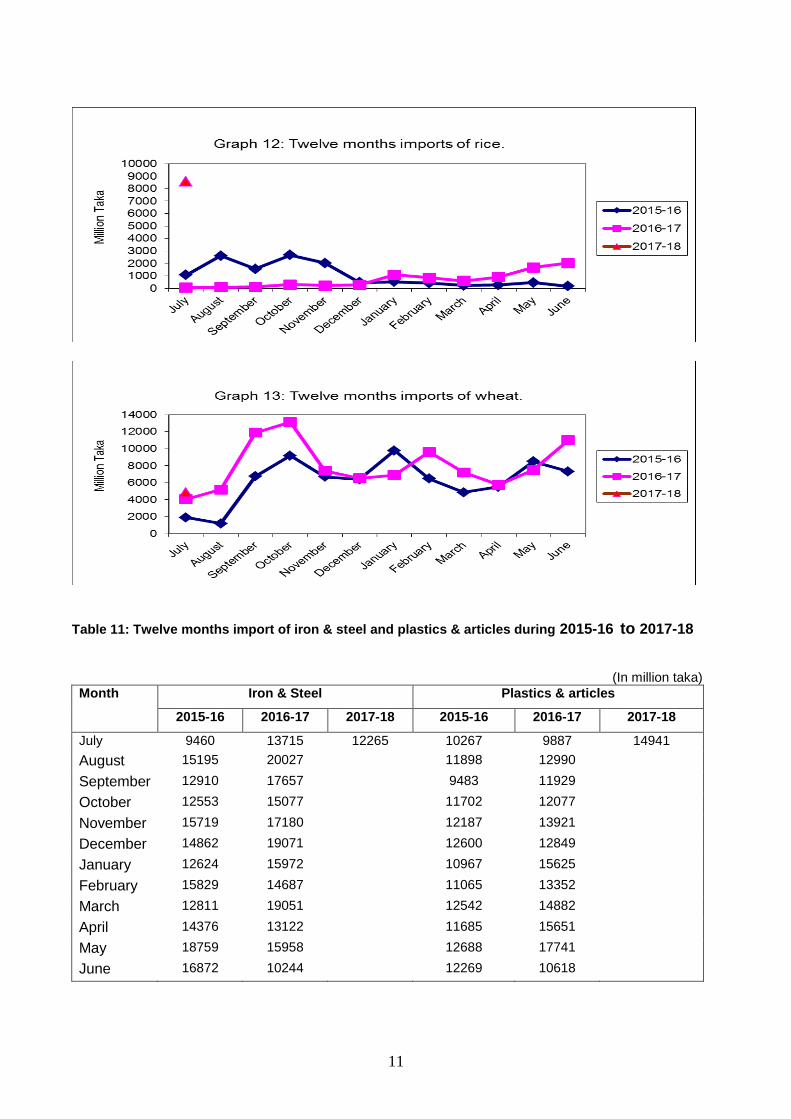
Table 10: Twelve months import of rice and wheat during 2015-16 to 2017-18
(In million taka)
Month Rice Wheat
2015-16 2016-17 2017-18 2015-16 2016-17 2017-18
July 1064 76 8599 1905 4068 4839
August 2618 96 1199 5193
September 1560 117 6754 11875
October 2671 310 9186 13138
November 2021 217 6682 7394
December 479 263 6400 6523
January 526 1078 9773 6904
February 428 846 6459 9624
March 233 590 4853 7217
April 272 918 5500 5727
May 450 1671 8503 7477
June 167 2027 7310 11023
11
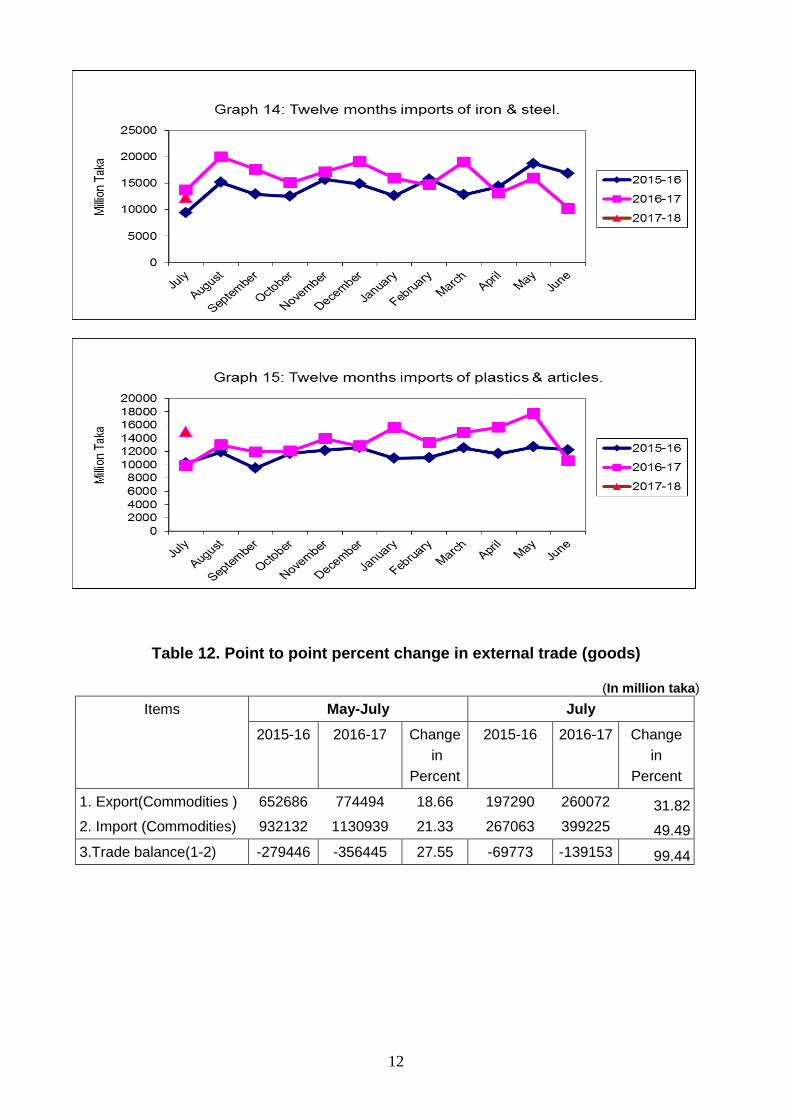
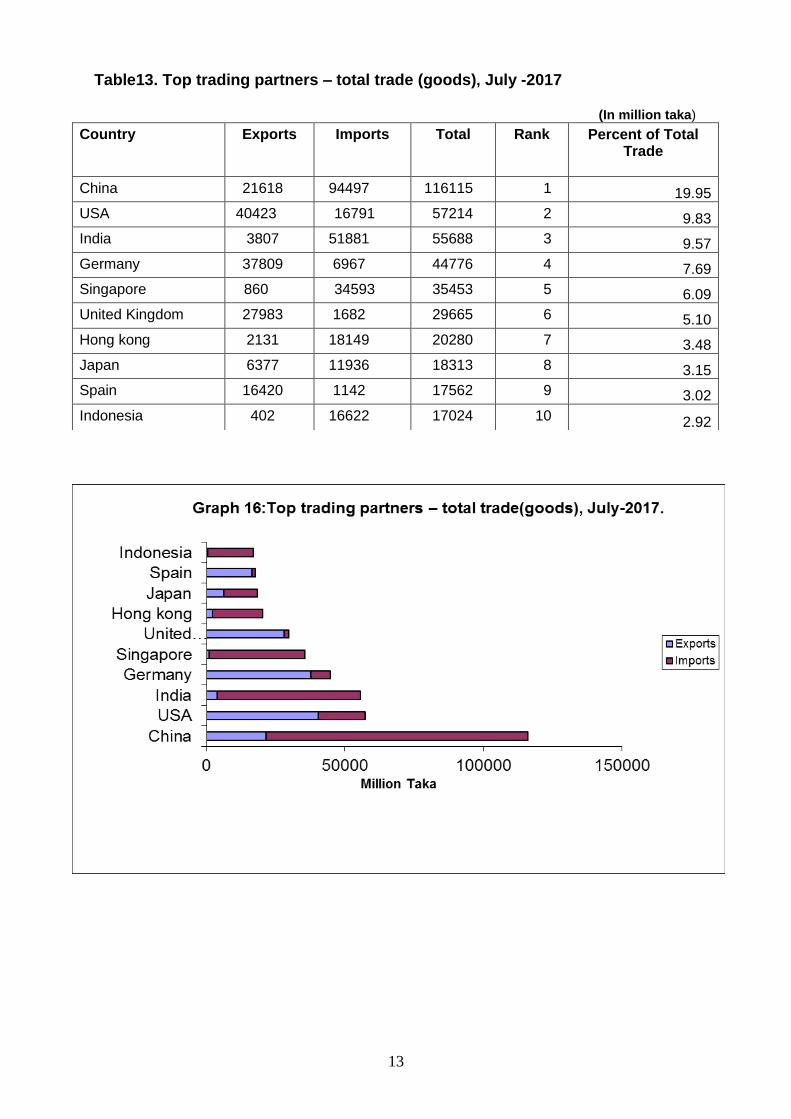
Table 11: Twelve months import of iron & steel and plastics & articles during 2015-16 to 2017-18
(In million taka)
Month Iron & Steel Plastics & articles
2015-16 2016-17 2017-18 2015-16 2016-17 2017-18
July 9460 13715 12265 10267 9887 14941
August 15195 20027 11898 12990
September 12910 17657 9483 11929
October 12553 15077 11702 12077
November 15719 17180 12187 13921
December 14862 19071 12600 12849
January 12624 15972 10967 15625
February 15829 14687 11065 13352
March 12811 19051 12542 14882
April 14376 13122 11685 15651
May 18759 15958 12688 17741
June 16872 10244 12269 10618
12
Table 12. Point to point percent change in external trade (goods)
(In million taka)
Items May-July July
2015-16 2016-17 Change
in
Percent
2015-16 2016-17 Change
in
Percent
1. Export(Commodities ) 652686 774494 18.66 197290 260072 31.82
2. Import (Commodities) 932132 1130939 21.33 267063 399225 49.49
3.Trade balance(1-2) -279446 -356445 27.55 -69773 -139153 99.44
13
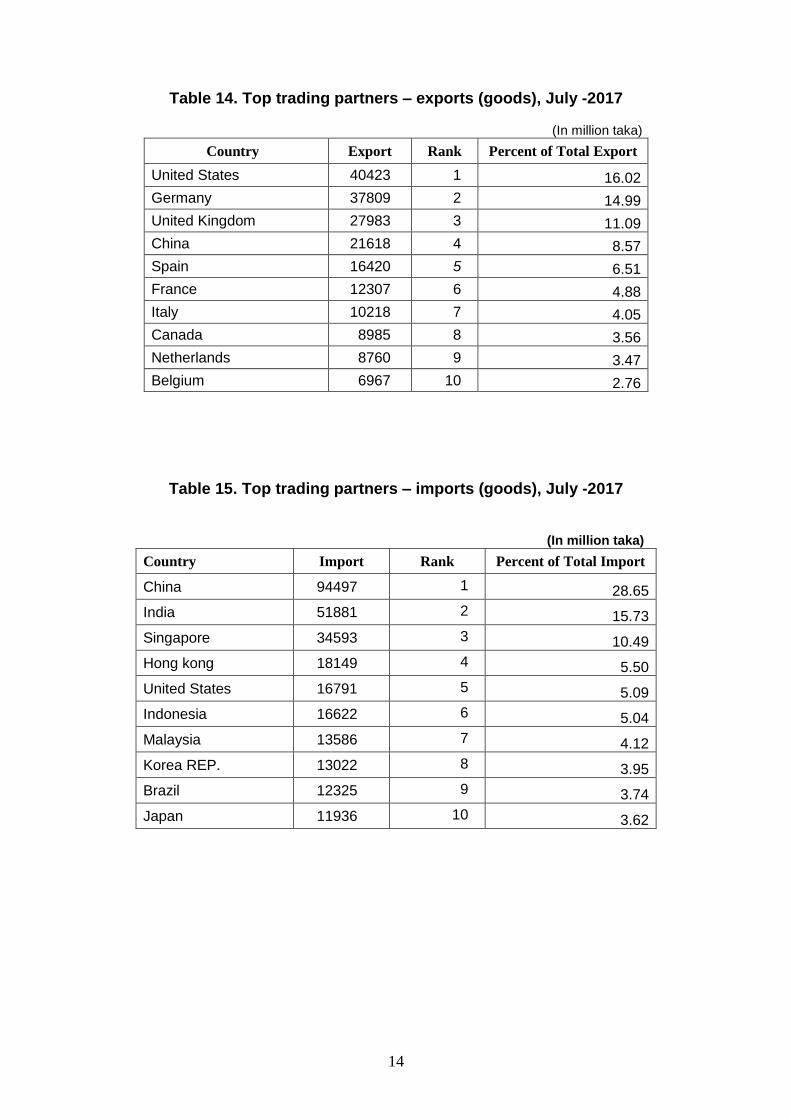
Table13. Top trading partners – total trade (goods), July -2017 (In million taka)
Country Exports Imports Total Rank Percent of Total Trade
China 21618 94497 116115 1 19.95
USA 40423 16791 57214 2 9.83
India 3807 51881 55688 3 9.57
Germany 37809 6967 44776 4 7.69
Singapore 860 34593 35453 5 6.09
United Kingdom 27983 1682 29665 6 5.10
Hong kong 2131 18149 20280 7 3.48
Japan 6377 11936 18313 8 3.15
Spain 16420 1142 17562 9 3.02
Indonesia 402 16622 17024 10 2.92
14
Table 14. Top trading partners – exports (goods), July -2017
(In million taka)
Country Export Rank Percent of Total Export
United States 40423 1 16.02
Germany 37809 2 14.99
United Kingdom 27983 3 11.09
China 21618 4 8.57
Spain 16420 5 6.51
France 12307 6 4.88
Italy 10218 7 4.05
Canada 8985 8 3.56
Netherlands 8760 9 3.47
Belgium 6967 10 2.76
Table 15. Top trading partners – imports (goods), July -2017
(In million taka)
Country Import Rank Percent of Total Import
China 94497 1 28.65
India 51881 2 15.73
Singapore 34593 3 10.49
Hong kong 18149 4 5.50
United States 16791 5 5.09
Indonesia 16622 6 5.04
Malaysia 13586 7 4.12
Korea REP. 13022 8 3.95
Brazil 12325 9 3.74
Japan 11936 10 3.62
15
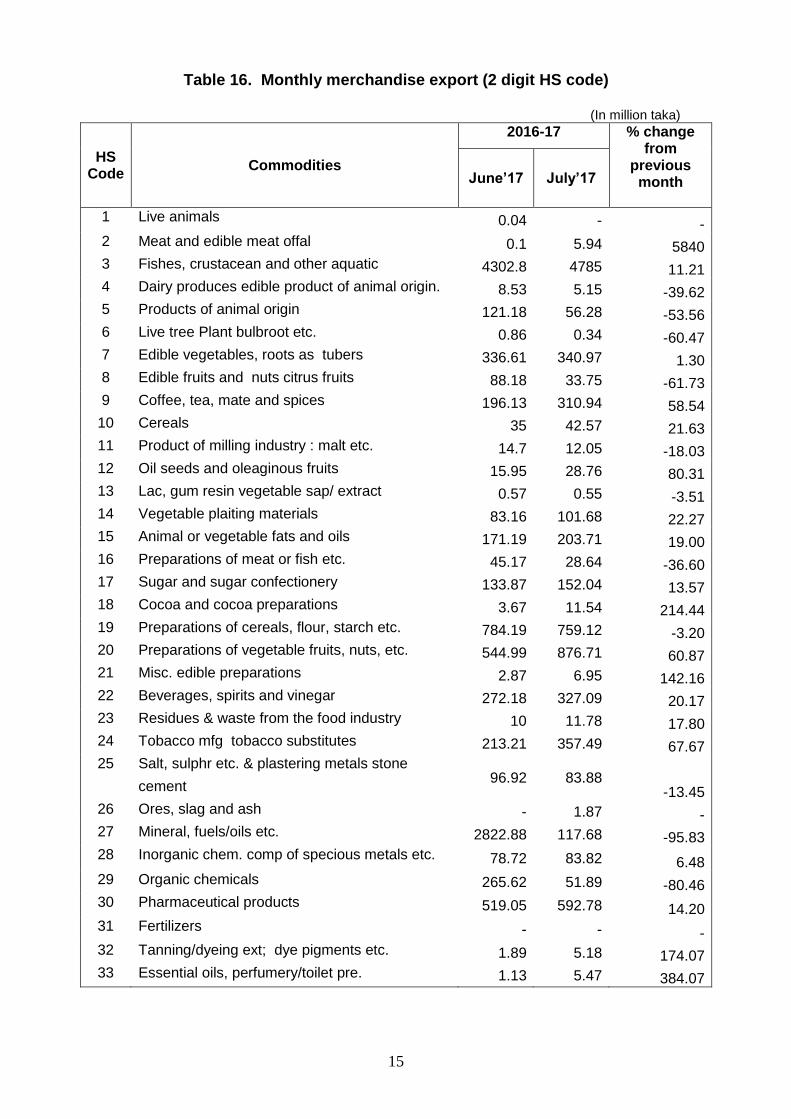
Table 16. Monthly merchandise export (2 digit HS code)
(In million taka)
HS Code
Commodities
2016-17 % change from
previous month
June’17 July’17
1 Live animals 0.04 - - 2 Meat and edible meat offal 0.1 5.94 5840 3 Fishes, crustacean and other aquatic 4302.8 4785 11.21 4 Dairy produces edible product of animal origin. 8.53 5.15 -39.62 5 Products of animal origin 121.18 56.28 -53.56 6 Live tree Plant bulbroot etc. 0.86 0.34 -60.47 7 Edible vegetables, roots as tubers 336.61 340.97 1.30 8 Edible fruits and nuts citrus fruits 88.18 33.75 -61.73 9 Coffee, tea, mate and spices 196.13 310.94 58.54
10 Cereals 35 42.57 21.63 11 Product of milling industry : malt etc. 14.7 12.05 -18.03 12 Oil seeds and oleaginous fruits 15.95 28.76 80.31 13 Lac, gum resin vegetable sap/ extract 0.57 0.55 -3.51 14 Vegetable plaiting materials 83.16 101.68 22.27 15 Animal or vegetable fats and oils 171.19 203.71 19.00 16 Preparations of meat or fish etc. 45.17 28.64 -36.60 17 Sugar and sugar confectionery 133.87 152.04 13.57 18 Cocoa and cocoa preparations 3.67 11.54 214.44 19 Preparations of cereals, flour, starch etc. 784.19 759.12 -3.20 20 Preparations of vegetable fruits, nuts, etc. 544.99 876.71 60.87 21 Misc. edible preparations 2.87 6.95 142.16 22 Beverages, spirits and vinegar 272.18 327.09 20.17 23 Residues & waste from the food industry 10 11.78 17.80 24 Tobacco mfg tobacco substitutes 213.21 357.49 67.67 25 Salt, sulphr etc. & plastering metals stone
cement 96.92 83.88
-13.45 26 Ores, slag and ash - 1.87 - 27 Mineral, fuels/oils etc. 2822.88 117.68 -95.83 28 Inorganic chem. comp of specious metals etc. 78.72 83.82 6.48 29 Organic chemicals 265.62 51.89 -80.46 30 Pharmaceutical products 519.05 592.78 14.20 31 Fertilizers - - - 32 Tanning/dyeing ext; dye pigments etc. 1.89 5.18 174.07 33 Essential oils, perfumery/toilet pre. 1.13 5.47 384.07
16
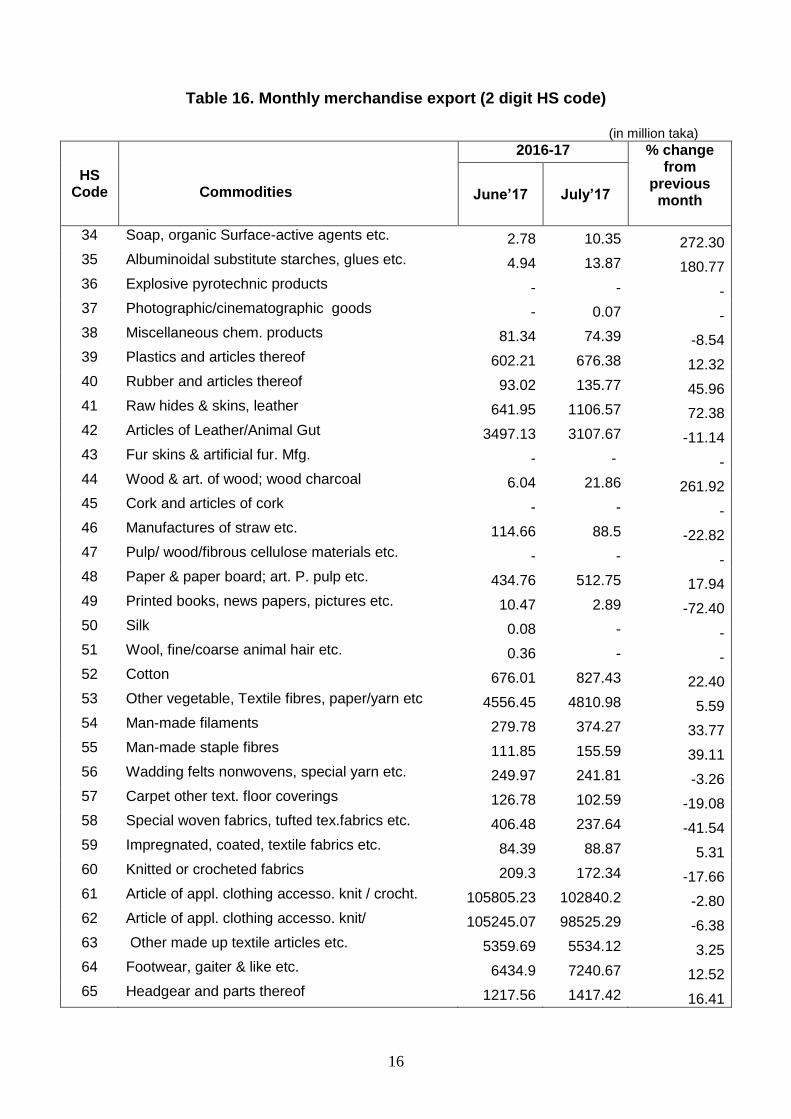
Table 16. Monthly merchandise export (2 digit HS code)
(in million taka)
HS Code
Commodities
2016-17 % change from
previous month
June’17 July’17
34 Soap, organic Surface-active agents etc. 2.78 10.35 272.30 35 Albuminoidal substitute starches, glues etc. 4.94 13.87 180.77 36 Explosive pyrotechnic products - - - 37 Photographic/cinematographic goods - 0.07 - 38 Miscellaneous chem. products 81.34 74.39 -8.54 39 Plastics and articles thereof 602.21 676.38 12.32 40 Rubber and articles thereof 93.02 135.77 45.96 41 Raw hides & skins, leather 641.95 1106.57 72.38 42 Articles of Leather/Animal Gut 3497.13 3107.67 -11.14 43 Fur skins & artificial fur. Mfg. - - - 44 Wood & art. of wood; wood charcoal 6.04 21.86 261.92 45 Cork and articles of cork - - - 46 Manufactures of straw etc. 114.66 88.5 -22.82 47 Pulp/ wood/fibrous cellulose materials etc. - - - 48 Paper & paper board; art. P. pulp etc. 434.76 512.75 17.94 49 Printed books, news papers, pictures etc. 10.47 2.89 -72.40 50 Silk 0.08 - - 51 Wool, fine/coarse animal hair etc. 0.36 - - 52 Cotton 676.01 827.43 22.40 53 Other vegetable, Textile fibres, paper/yarn etc 4556.45 4810.98 5.59 54 Man-made filaments 279.78 374.27 33.77 55 Man-made staple fibres 111.85 155.59 39.11 56 Wadding felts nonwovens, special yarn etc. 249.97 241.81 -3.26 57 Carpet other text. floor coverings 126.78 102.59 -19.08 58 Special woven fabrics, tufted tex.fabrics etc. 406.48 237.64 -41.54 59 Impregnated, coated, textile fabrics etc. 84.39 88.87 5.31 60 Knitted or crocheted fabrics 209.3 172.34 -17.66 61 Article of appl. clothing accesso. knit / crocht. 105805.23 102840.2 -2.80 62 Article of appl. clothing accesso. knit/ 105245.07 98525.29 -6.38 63 Other made up textile articles etc. 5359.69 5534.12 3.25 64 Footwear, gaiter & like etc. 6434.9 7240.67 12.52 65 Headgear and parts thereof 1217.56 1417.42 16.41
17
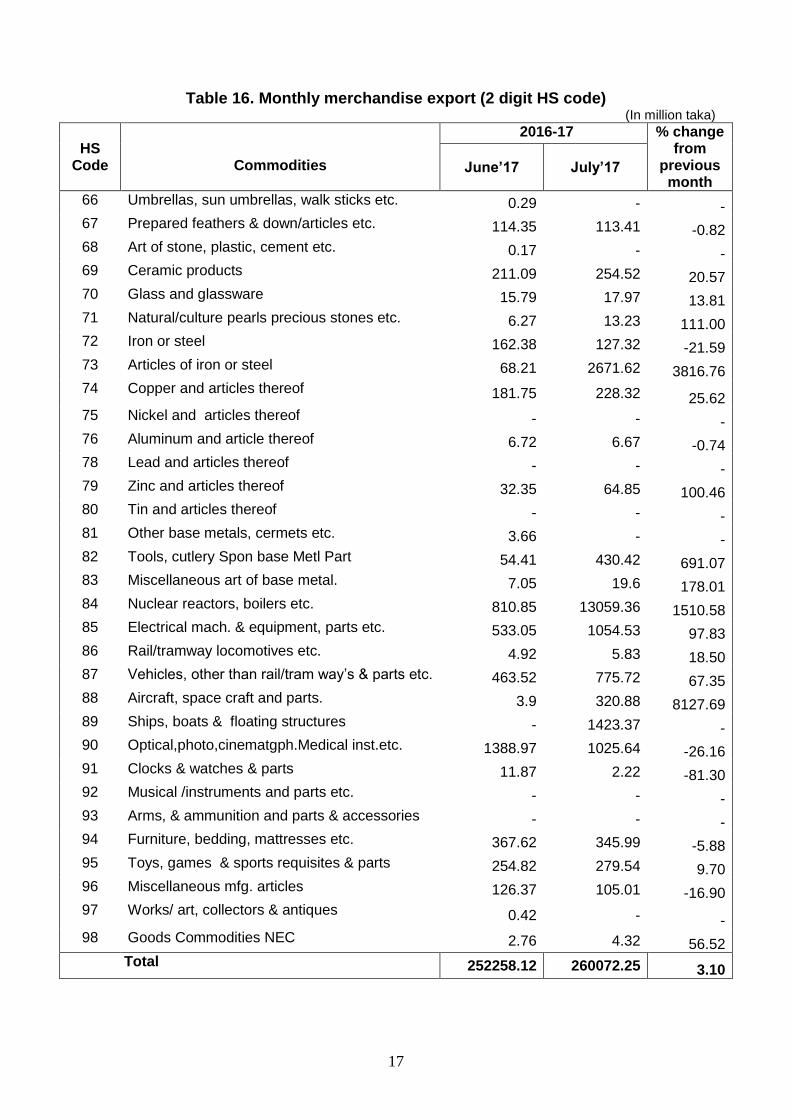
Table 16. Monthly merchandise export (2 digit HS code)
(In million taka)
HS Code
Commodities
2016-17 % change from
previous month
June’17 July’17
66 Umbrellas, sun umbrellas, walk sticks etc. 0.29 - - 67 Prepared feathers & down/articles etc. 114.35 113.41 -0.82 68 Art of stone, plastic, cement etc. 0.17 - - 69 Ceramic products 211.09 254.52 20.57 70 Glass and glassware 15.79 17.97 13.81 71 Natural/culture pearls precious stones etc. 6.27 13.23 111.00 72 Iron or steel 162.38 127.32 -21.59 73 Articles of iron or steel 68.21 2671.62 3816.76 74 Copper and articles thereof 181.75 228.32 25.62 75 Nickel and articles thereof - - - 76 Aluminum and article thereof 6.72 6.67 -0.74 78 Lead and articles thereof - - - 79 Zinc and articles thereof 32.35 64.85 100.46 80 Tin and articles thereof - - - 81 Other base metals, cermets etc. 3.66 - - 82 Tools, cutlery Spon base Metl Part 54.41 430.42 691.07 83 Miscellaneous art of base metal. 7.05 19.6 178.01 84 Nuclear reactors, boilers etc. 810.85 13059.36 1510.58 85 Electrical mach. & equipment, parts etc. 533.05 1054.53 97.83 86 Rail/tramway locomotives etc. 4.92 5.83 18.50 87 Vehicles, other than rail/tram way’s & parts etc. 463.52 775.72 67.35 88 Aircraft, space craft and parts. 3.9 320.88 8127.69 89 Ships, boats & floating structures - 1423.37 - 90 Optical,photo,cinematgph.Medical inst.etc. 1388.97 1025.64 -26.16 91 Clocks & watches & parts 11.87 2.22 -81.30 92 Musical /instruments and parts etc. - - - 93 Arms, & ammunition and parts & accessories - - - 94 Furniture, bedding, mattresses etc. 367.62 345.99 -5.88 95 Toys, games & sports requisites & parts 254.82 279.54 9.70 96 Miscellaneous mfg. articles 126.37 105.01 -16.90 97 Works/ art, collectors & antiques 0.42 - - 98 Goods Commodities NEC 2.76 4.32 56.52
Total 252258.12 260072.25 3.10
18
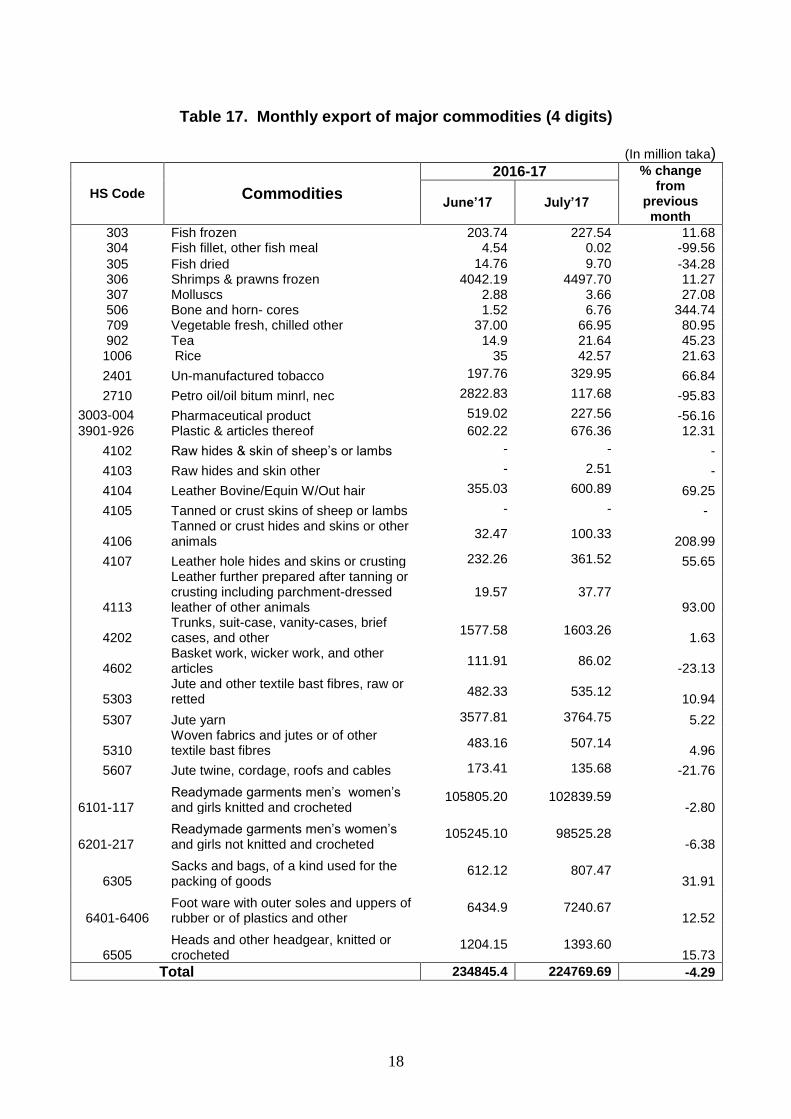
Table 17. Monthly export of major commodities (4 digits)
(In million taka)
HS Code Commodities
2016-17 % change from
previous month
June’17 July’17
303 Fish frozen 203.74 227.54 11.68 304 Fish fillet, other fish meal 4.54 0.02 -99.56
305 Fish dried 14.76 9.70 -34.28 306 Shrimps & prawns frozen 4042.19 4497.70 11.27 307 Molluscs 2.88 3.66 27.08 506 Bone and horn- cores 1.52 6.76 344.74 709 Vegetable fresh, chilled other 37.00 66.95 80.95 902 Tea 14.9 21.64 45.23 1006 Rice 35 42.57 21.63
2401 Un-manufactured tobacco 197.76 329.95 66.84
2710 Petro oil/oil bitum minrl, nec 2822.83 117.68 -95.83
3003-004 Pharmaceutical product 519.02 227.56 -56.16 3901-926 Plastic & articles thereof 602.22 676.36 12.31
4102 Raw hides & skin of sheep’s or lambs - - -
4103 Raw hides and skin other - 2.51 -
4104 Leather Bovine/Equin W/Out hair 355.03 600.89 69.25
4105 Tanned or crust skins of sheep or lambs - - -
4106 Tanned or crust hides and skins or other animals
32.47 100.33 208.99
4107 Leather hole hides and skins or crusting 232.26 361.52 55.65
4113
Leather further prepared after tanning or crusting including parchment-dressed leather of other animals
19.57 37.77 93.00
4202 Trunks, suit-case, vanity-cases, brief cases, and other
1577.58 1603.26 1.63
4602 Basket work, wicker work, and other articles
111.91 86.02 -23.13
5303 Jute and other textile bast fibres, raw or retted
482.33 535.12 10.94
5307 Jute yarn 3577.81 3764.75 5.22
5310 Woven fabrics and jutes or of other textile bast fibres
483.16 507.14 4.96
5607 Jute twine, cordage, roofs and cables 173.41 135.68 -21.76
6101-117 Readymade garments men’s women’s and girls knitted and crocheted
105805.20 102839.59 -2.80
6201-217 Readymade garments men’s women’s and girls not knitted and crocheted
105245.10 98525.28 -6.38
6305 Sacks and bags, of a kind used for the packing of goods
612.12 807.47 31.91
6401-6406 Foot ware with outer soles and uppers of rubber or of plastics and other
6434.9 7240.67 12.52
6505 Heads and other headgear, knitted or crocheted
1204.15 1393.60 15.73
Total 234845.4 224769.69 -4.29
19
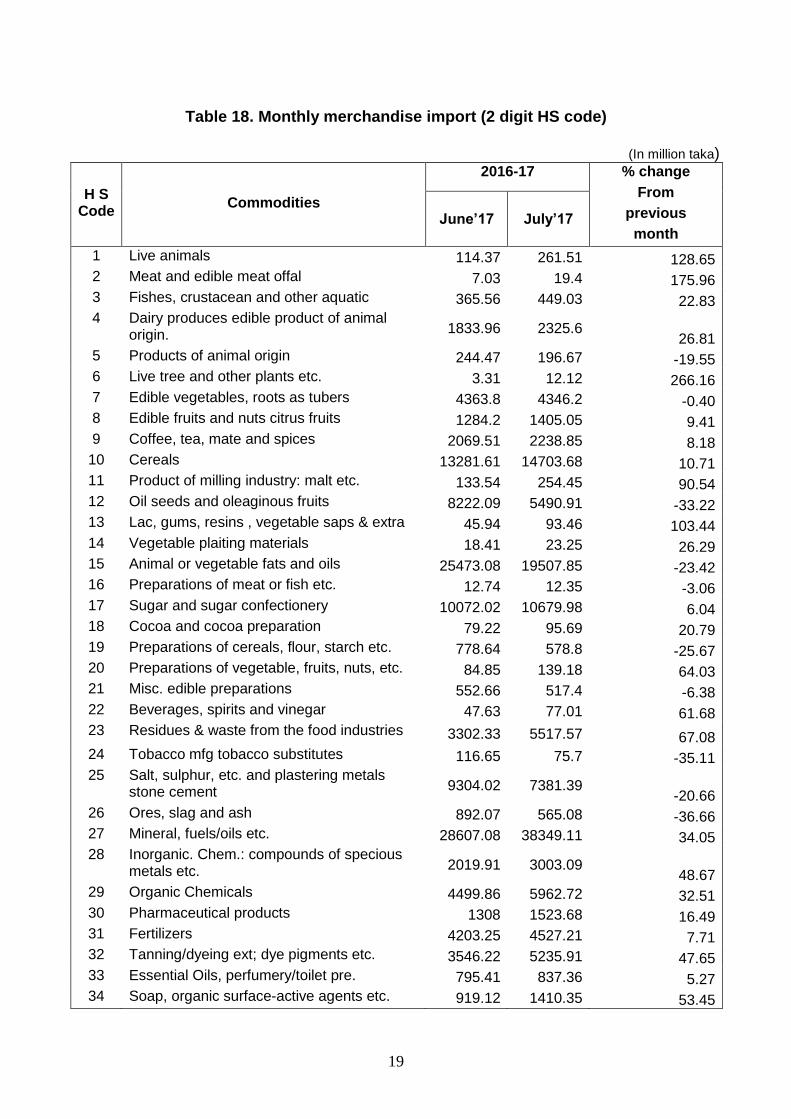
Table 18. Monthly merchandise import (2 digit HS code)
(In million taka)
H S Code
Commodities
2016-17 % change
From
previous
month June’17 July’17
1 Live animals 114.37 261.51 128.65 2 Meat and edible meat offal 7.03 19.4 175.96 3 Fishes, crustacean and other aquatic 365.56 449.03 22.83 4 Dairy produces edible product of animal
origin. 1833.96 2325.6 26.81
5 Products of animal origin 244.47 196.67 -19.55 6 Live tree and other plants etc. 3.31 12.12 266.16 7 Edible vegetables, roots as tubers 4363.8 4346.2 -0.40 8 Edible fruits and nuts citrus fruits 1284.2 1405.05 9.41 9 Coffee, tea, mate and spices 2069.51 2238.85 8.18
10 Cereals 13281.61 14703.68 10.71 11 Product of milling industry: malt etc. 133.54 254.45 90.54 12 Oil seeds and oleaginous fruits 8222.09 5490.91 -33.22 13 Lac, gums, resins , vegetable saps & extra 45.94 93.46 103.44 14 Vegetable plaiting materials 18.41 23.25 26.29 15 Animal or vegetable fats and oils 25473.08 19507.85 -23.42 16 Preparations of meat or fish etc. 12.74 12.35 -3.06 17 Sugar and sugar confectionery 10072.02 10679.98 6.04 18 Cocoa and cocoa preparation 79.22 95.69 20.79 19 Preparations of cereals, flour, starch etc. 778.64 578.8 -25.67 20 Preparations of vegetable, fruits, nuts, etc. 84.85 139.18 64.03 21 Misc. edible preparations 552.66 517.4 -6.38 22 Beverages, spirits and vinegar 47.63 77.01 61.68 23 Residues & waste from the food industries 3302.33 5517.57 67.08 24 Tobacco mfg tobacco substitutes 116.65 75.7 -35.11 25 Salt, sulphur, etc. and plastering metals
stone cement 9304.02 7381.39 -20.66
26 Ores, slag and ash 892.07 565.08 -36.66 27 Mineral, fuels/oils etc. 28607.08 38349.11 34.05 28 Inorganic. Chem.: compounds of specious
metals etc. 2019.91 3003.09 48.67
29 Organic Chemicals 4499.86 5962.72 32.51 30 Pharmaceutical products 1308 1523.68 16.49 31 Fertilizers 4203.25 4527.21 7.71 32 Tanning/dyeing ext; dye pigments etc. 3546.22 5235.91 47.65 33 Essential Oils, perfumery/toilet pre. 795.41 837.36 5.27 34 Soap, organic surface-active agents etc. 919.12 1410.35 53.45
20
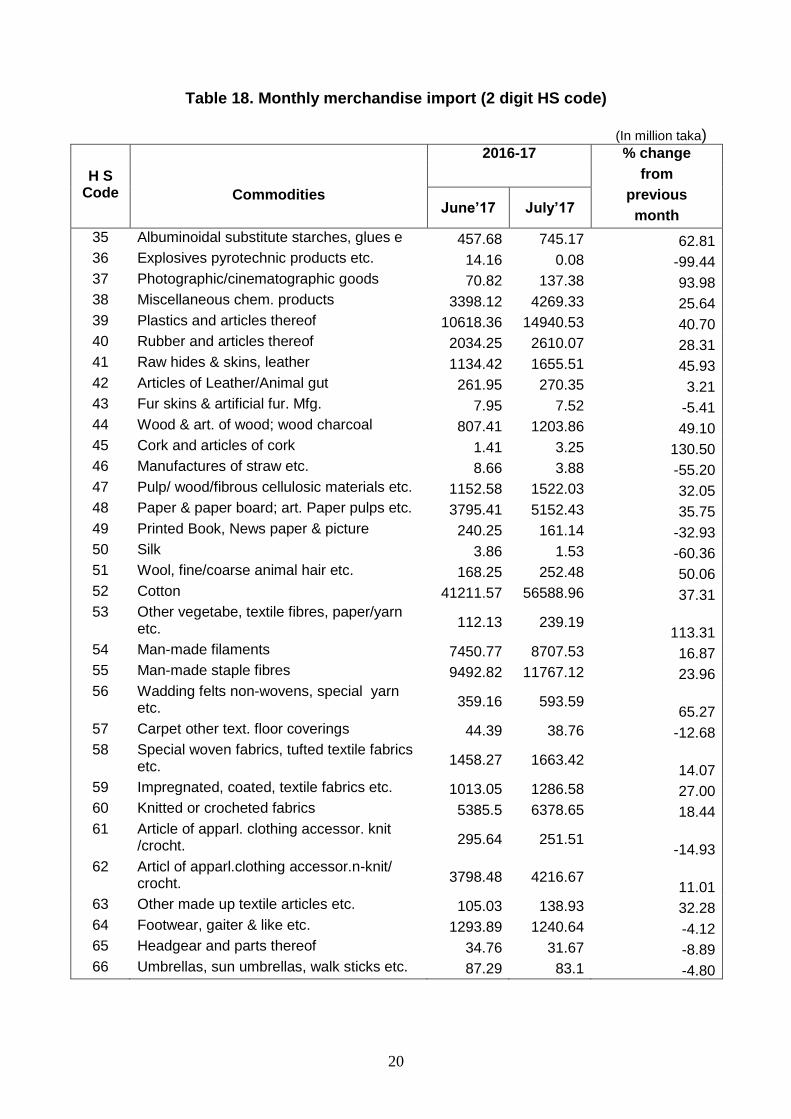
Table 18. Monthly merchandise import (2 digit HS code)
(In million taka)
H S Code
Commodities
2016-17 % change
from
previous
month June’17 July’17
35 Albuminoidal substitute starches, glues e 457.68 745.17 62.81 36 Explosives pyrotechnic products etc. 14.16 0.08 -99.44 37 Photographic/cinematographic goods 70.82 137.38 93.98 38 Miscellaneous chem. products 3398.12 4269.33 25.64 39 Plastics and articles thereof 10618.36 14940.53 40.70 40 Rubber and articles thereof 2034.25 2610.07 28.31 41 Raw hides & skins, leather 1134.42 1655.51 45.93 42 Articles of Leather/Animal gut 261.95 270.35 3.21 43 Fur skins & artificial fur. Mfg. 7.95 7.52 -5.41 44 Wood & art. of wood; wood charcoal 807.41 1203.86 49.10 45 Cork and articles of cork 1.41 3.25 130.50 46 Manufactures of straw etc. 8.66 3.88 -55.20 47 Pulp/ wood/fibrous cellulosic materials etc. 1152.58 1522.03 32.05 48 Paper & paper board; art. Paper pulps etc. 3795.41 5152.43 35.75 49 Printed Book, News paper & picture 240.25 161.14 -32.93 50 Silk 3.86 1.53 -60.36 51 Wool, fine/coarse animal hair etc. 168.25 252.48 50.06 52 Cotton 41211.57 56588.96 37.31 53 Other vegetabe, textile fibres, paper/yarn
etc. 112.13 239.19 113.31
54 Man-made filaments 7450.77 8707.53 16.87 55 Man-made staple fibres 9492.82 11767.12 23.96 56 Wadding felts non-wovens, special yarn
etc. 359.16 593.59 65.27
57 Carpet other text. floor coverings 44.39 38.76 -12.68 58 Special woven fabrics, tufted textile fabrics
etc. 1458.27 1663.42 14.07
59 Impregnated, coated, textile fabrics etc. 1013.05 1286.58 27.00 60 Knitted or crocheted fabrics 5385.5 6378.65 18.44 61 Article of apparl. clothing accessor. knit
/crocht. 295.64 251.51 -14.93
62 Articl of apparl.clothing accessor.n-knit/ crocht. 3798.48 4216.67
11.01 63 Other made up textile articles etc. 105.03 138.93 32.28 64 Footwear, gaiter & like etc. 1293.89 1240.64 -4.12 65 Headgear and parts thereof 34.76 31.67 -8.89 66 Umbrellas, sun umbrellas, walk sticks etc. 87.29 83.1 -4.80
21
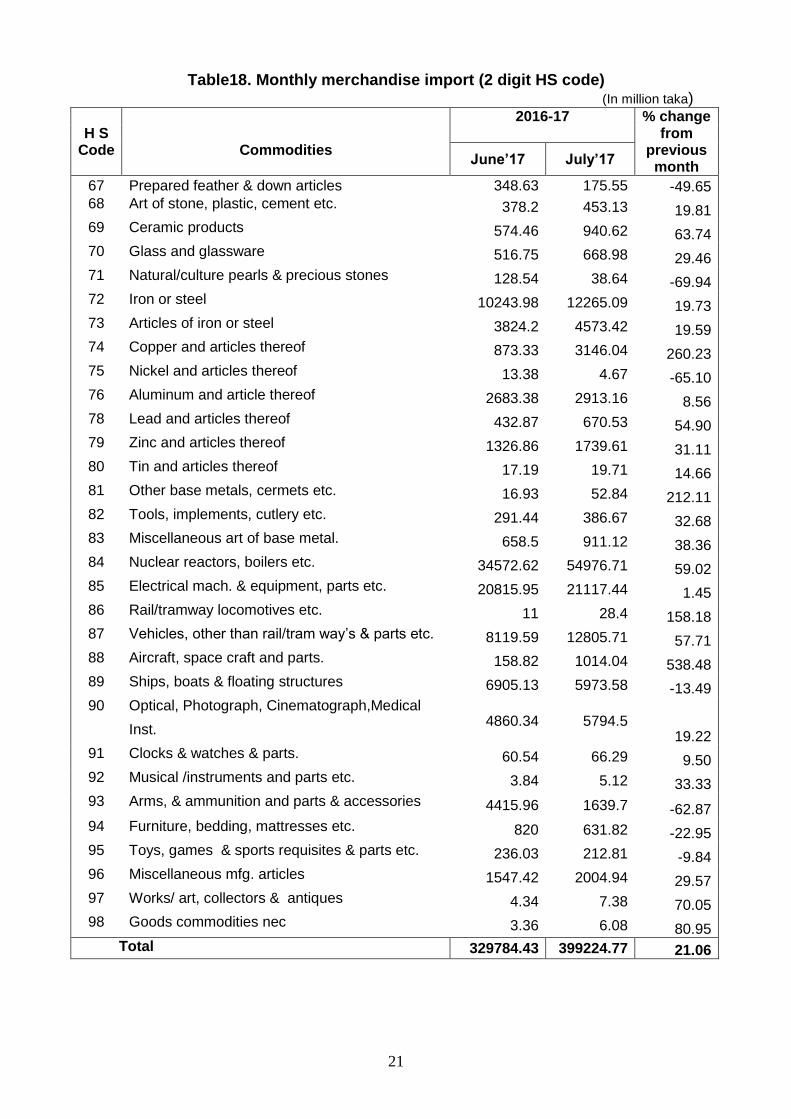
Table18. Monthly merchandise import (2 digit HS code) (In million taka)
H S Code
Commodities
2016-17 % change from
previous month
June’17 July’17
67 Prepared feather & down articles 348.63 175.55 -49.65 68 Art of stone, plastic, cement etc. 378.2 453.13 19.81 69 Ceramic products 574.46 940.62 63.74 70 Glass and glassware 516.75 668.98 29.46 71 Natural/culture pearls & precious stones 128.54 38.64 -69.94 72 Iron or steel 10243.98 12265.09 19.73 73 Articles of iron or steel 3824.2 4573.42 19.59 74 Copper and articles thereof 873.33 3146.04 260.23 75 Nickel and articles thereof 13.38 4.67 -65.10 76 Aluminum and article thereof 2683.38 2913.16 8.56 78 Lead and articles thereof 432.87 670.53 54.90 79 Zinc and articles thereof 1326.86 1739.61 31.11 80 Tin and articles thereof 17.19 19.71 14.66 81 Other base metals, cermets etc. 16.93 52.84 212.11 82 Tools, implements, cutlery etc. 291.44 386.67 32.68 83 Miscellaneous art of base metal. 658.5 911.12 38.36 84 Nuclear reactors, boilers etc. 34572.62 54976.71 59.02 85 Electrical mach. & equipment, parts etc. 20815.95 21117.44 1.45 86 Rail/tramway locomotives etc. 11 28.4 158.18 87 Vehicles, other than rail/tram way’s & parts etc. 8119.59 12805.71 57.71 88 Aircraft, space craft and parts. 158.82 1014.04 538.48 89 Ships, boats & floating structures 6905.13 5973.58 -13.49 90 Optical, Photograph, Cinematograph,Medical
Inst. 4860.34 5794.5
19.22 91 Clocks & watches & parts. 60.54 66.29 9.50 92 Musical /instruments and parts etc. 3.84 5.12 33.33 93 Arms, & ammunition and parts & accessories 4415.96 1639.7 -62.87 94 Furniture, bedding, mattresses etc. 820 631.82 -22.95 95 Toys, games & sports requisites & parts etc. 236.03 212.81 -9.84 96 Miscellaneous mfg. articles 1547.42 2004.94 29.57 97 Works/ art, collectors & antiques 4.34 7.38 70.05 98 Goods commodities nec 3.36 6.08 80.95
Total 329784.43 399224.77 21.06
22
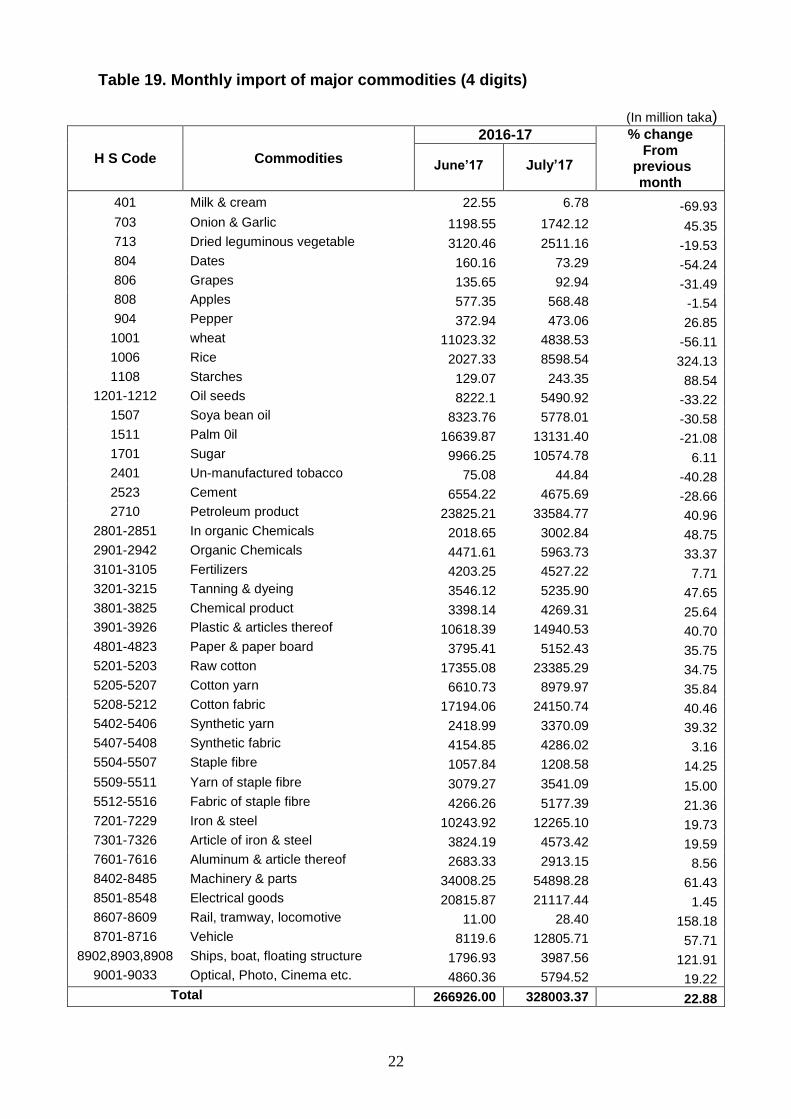
Table 19. Monthly import of major commodities (4 digits)
(In million taka)
H S Code Commodities
2016-17 % change From
previous month
June’17 July’17
401 Milk & cream 22.55 6.78 -69.93
703 Onion & Garlic 1198.55 1742.12 45.35 713 Dried leguminous vegetable 3120.46 2511.16 -19.53 804 Dates 160.16 73.29 -54.24 806 Grapes 135.65 92.94 -31.49 808 Apples 577.35 568.48 -1.54 904 Pepper 372.94 473.06 26.85 1001 wheat 11023.32 4838.53 -56.11 1006 Rice 2027.33 8598.54 324.13 1108 Starches 129.07 243.35 88.54
1201-1212 Oil seeds 8222.1 5490.92 -33.22 1507 Soya bean oil 8323.76 5778.01 -30.58 1511 Palm 0il 16639.87 13131.40 -21.08 1701 Sugar 9966.25 10574.78 6.11 2401 Un-manufactured tobacco 75.08 44.84 -40.28 2523 Cement 6554.22 4675.69 -28.66 2710 Petroleum product 23825.21 33584.77 40.96
2801-2851 In organic Chemicals 2018.65 3002.84 48.75 2901-2942 Organic Chemicals 4471.61 5963.73 33.37 3101-3105 Fertilizers 4203.25 4527.22 7.71 3201-3215 Tanning & dyeing 3546.12 5235.90 47.65 3801-3825 Chemical product 3398.14 4269.31 25.64 3901-3926 Plastic & articles thereof 10618.39 14940.53 40.70 4801-4823 Paper & paper board 3795.41 5152.43 35.75 5201-5203 Raw cotton 17355.08 23385.29 34.75 5205-5207 Cotton yarn 6610.73 8979.97 35.84 5208-5212 Cotton fabric 17194.06 24150.74 40.46 5402-5406 Synthetic yarn 2418.99 3370.09 39.32 5407-5408 Synthetic fabric 4154.85 4286.02 3.16 5504-5507 Staple fibre 1057.84 1208.58 14.25
5509-5511 Yarn of staple fibre 3079.27 3541.09 15.00 5512-5516 Fabric of staple fibre 4266.26 5177.39 21.36 7201-7229 Iron & steel 10243.92 12265.10 19.73 7301-7326 Article of iron & steel 3824.19 4573.42 19.59 7601-7616 Aluminum & article thereof 2683.33 2913.15 8.56 8402-8485 Machinery & parts 34008.25 54898.28 61.43 8501-8548 Electrical goods 20815.87 21117.44 1.45 8607-8609 Rail, tramway, locomotive 11.00 28.40 158.18 8701-8716 Vehicle 8119.6 12805.71 57.71
8902,8903,8908 Ships, boat, floating structure 1796.93 3987.56 121.91 9001-9033 Optical, Photo, Cinema etc. 4860.36 5794.52 19.22
Total 266926.00 328003.37 22.88
23
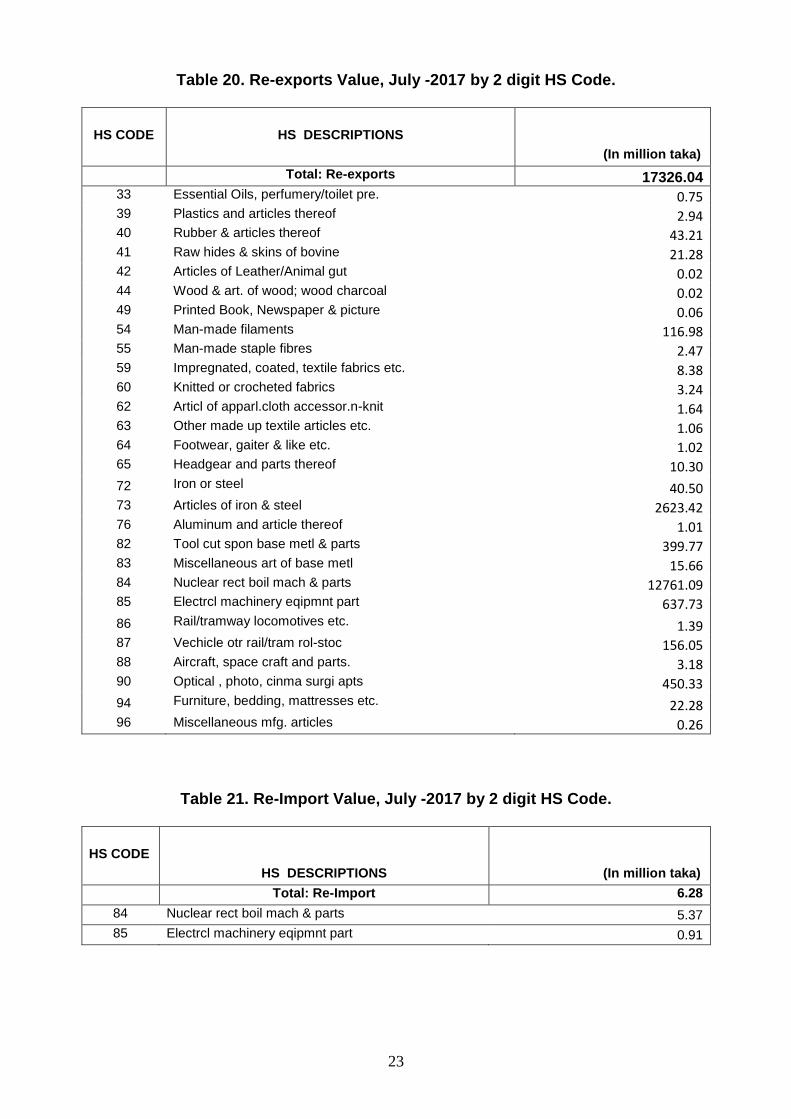
Table 20. Re-exports Value, July -2017 by 2 digit HS Code.
HS CODE
HS DESCRIPTIONS
(In million taka)
Total: Re-exports 17326.04 33 Essential Oils, perfumery/toilet pre. 0.75 39 Plastics and articles thereof 2.94 40 Rubber & articles thereof 43.21 41 Raw hides & skins of bovine 21.28 42 Articles of Leather/Animal gut 0.02 44 Wood & art. of wood; wood charcoal 0.02 49 Printed Book, Newspaper & picture 0.06 54 Man-made filaments 116.98 55 Man-made staple fibres 2.47 59 Impregnated, coated, textile fabrics etc. 8.38 60 Knitted or crocheted fabrics 3.24 62 Articl of apparl.cloth accessor.n-knit 1.64 63 Other made up textile articles etc. 1.06 64 Footwear, gaiter & like etc. 1.02 65 Headgear and parts thereof 10.30
72 Iron or steel 40.50 73 Articles of iron & steel 2623.42 76 Aluminum and article thereof 1.01 82 Tool cut spon base metl & parts 399.77 83 Miscellaneous art of base metl 15.66 84 Nuclear rect boil mach & parts 12761.09 85 Electrcl machinery eqipmnt part 637.73
86 Rail/tramway locomotives etc. 1.39 87 Vechicle otr rail/tram rol-stoc 156.05 88 Aircraft, space craft and parts. 3.18 90 Optical , photo, cinma surgi apts 450.33
94 Furniture, bedding, mattresses etc. 22.28 96 Miscellaneous mfg. articles 0.26
Table 21. Re-Import Value, July -2017 by 2 digit HS Code.
HS CODE
HS DESCRIPTIONS (In million taka)
Total: Re-Import 6.28
84 Nuclear rect boil mach & parts 5.37
85 Electrcl machinery eqipmnt part 0.91
24
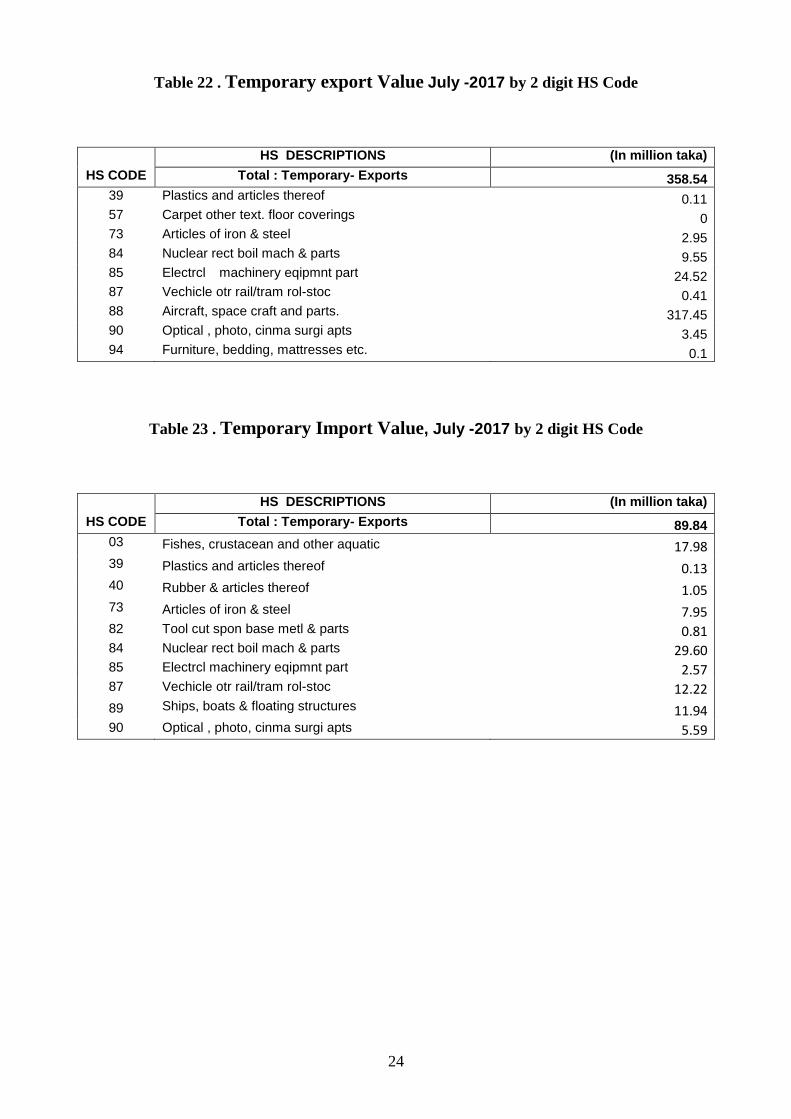
Table 22 . Temporary export Value July -2017 by 2 digit HS Code
HS CODE
HS DESCRIPTIONS (In million taka)
Total : Temporary- Exports 358.54
39 Plastics and articles thereof 0.11 57 Carpet other text. floor coverings 0 73 Articles of iron & steel 2.95 84 Nuclear rect boil mach & parts 9.55 85 Electrcl machinery eqipmnt part 24.52 87 Vechicle otr rail/tram rol-stoc 0.41 88 Aircraft, space craft and parts. 317.45 90 Optical , photo, cinma surgi apts 3.45 94 Furniture, bedding, mattresses etc. 0.1
Table 23 . Temporary Import Value, July -2017 by 2 digit HS Code
HS CODE
HS DESCRIPTIONS (In million taka)
Total : Temporary- Exports 89.84
03 Fishes, crustacean and other aquatic 17.98 39 Plastics and articles thereof 0.13 40 Rubber & articles thereof 1.05 73 Articles of iron & steel 7.95 82 Tool cut spon base metl & parts 0.81 84 Nuclear rect boil mach & parts 29.60 85 Electrcl machinery eqipmnt part 2.57 87 Vechicle otr rail/tram rol-stoc 12.22
89 Ships, boats & floating structures 11.94 90 Optical , photo, cinma surgi apts 5.59