Embed Size (px)
Citation preview
Weekly January 16 2009 Vol 58 No 1
department of health and human servicesCenters for disease Control and Prevention
Morbidity and Mortality Weekly Reportwwwcdcgovmmwr
Pneumonia Hospitalizations Among Young Children Before and After Introduction of Pneumococcal Conjugate Vaccine mdash United States 1997ndash2006
Streptococcus pneumoniae is the leading bacterial cause of community-acquired pneumonia hospitalizations and an important cause of bacteremia and meningitis especially among young children and older adults (12) A 7-valent pneumococcal conjugate vaccine (PCV7) was licensed and the Advisory Committee on Immunization Practices formu-lated recommendations for its use in infants and children in February 2000 (2) Vaccination coverage rapidly increased during the second half of 2000 in part through funding by CDCrsquos Vaccines for Children program Subsequently active population- and laboratory-based surveillance demonstrated substantial reductions in invasive pneumococcal disease (IPD) among children and adults (3) In addition decreases in hospi-talizations and ambulatory-care visits for all-cause pneumonia also were reported (45) To gauge whether the effects of PCV7 on reducing pneumonia continue CDC is monitoring pneu-monia hospitalizations by using data from the Nationwide Inpatient Sample This report provides an update for 2005 and 2006 the most recent years for which information is available In 2005 and 2006 the incidence rates for all-cause pneumonia hospitalizations among children aged lt2 years were 91 per 1000 and 81 per 1000 respectively In 2006 the rate for all-cause pneumonia among children aged lt2 years was approximately 35 lower than during 1997ndash1999 Most of this decrease occurred soon after the vaccine was licensed in 2000 and the rates have remained relatively stable since then The rate for all-cause pneumonia among children aged 2ndash4 years did not change after PCV7 licensure and has remained stable Continued monitoring of pneumonia-related hospi-talizations among children is needed to track the effects of pneumococcal immunization programs
The Nationwide Inpatient Sample contains data on inpatient stays from states that participate in the Healthcare Cost and
Utilization Project sponsored by the Agency for Healthcare Research and Quality The project is a stratified probability sample of US acute-care hospitals and the largest all-payer inpatient-care database available in the United States In 2006 this database recorded information from approximately 8 mil-lion hospitalizations (approximately 20 of all US hospital-izations) from 1045 hospitals in 38 states Data are weighted to generate national estimates while accounting for complex sampling design (6) For this analysis all-cause pneumonia hospitalization was defined as a record in which International Classification of Diseases Ninth Revision Clinical Modification (ICD-9-CM) codes 480ndash486 (pneumonia) or 4870 (influenza with pneumonia) were assigned as the primary diagnosis
Trends in hospitalizations for nonpneumonia acute respira-tory illness (ARI) also were evaluated to assess the possibility that after PCV7 introduction practitioners were less likely to assign a pneumonia code for respiratory conditions in a vaccinated child and more likely to make other respiratory diagnoses A nonpneumonia ARI hospitalization was defined as a record with any of the following ICD-9-CM codes assigned as the primary diagnosis 381ndash383 (otitis media and mastoiditis) 460ndash466 (acute respiratory infections including acute bronchitis bronchiolitis acute nasopharyngitis sinusitis pharyngitis tonsillitis laryngitis tracheitis and other acute upper respiratory infections) 487 (influenza excluding 4870) 490 (bronchitis) 491 (chronic bronchitis) or 493 (asthma)
INSIDE
4 Possible Congenital Infection with La Crosse Encephalitis Virus mdash West Virginia 2006ndash2007
7 Updated Guidelines for the Use of Nucleic Acid Amplification Tests in the Diagnosis of Tuberculosis
Editorial BoardWilliam L Roper MD MPH Chapel Hill NC Chairman
Virginia A Caine MD Indianapolis INDavid W Fleming MD Seattle WA
William E Halperin MD DrPH MPH Newark NJMargaret A Hamburg MD Washington DC
King K Holmes MD PhD Seattle WADeborah Holtzman PhD Atlanta GA
John K Iglehart Bethesda MDDennis G Maki MD Madison WI
Sue Mallonee MPH Oklahoma City OKPatricia Quinlisk MD MPH Des Moines IA
Patrick L Remington MD MPH Madison WIBarbara K Rimer DrPH Chapel Hill NCJohn V Rullan MD MPH San Juan PR
William Schaffner MD Nashville TNAnne Schuchat MD Atlanta GA
Dixie E Snider MD MPH Atlanta GAJohn W Ward MD Atlanta GA
The MMWR series of publications is published by the Coordinating Center for Health Information and Service Centers for Disease Control and Prevention (CDC) US Department of Health and Human Services Atlanta GA 30333Suggested Citation Centers for Disease Control and Prevention [Article title] MMWR 200958[inclusive page numbers]
Centers for Disease Control and PreventionJulie L Gerberding MD MPH
DirectorTanja Popovic MD PhD
Chief Science OfficerJames W Stephens PhD
Associate Director for ScienceSteven L Solomon MD
Director Coordinating Center for Health Information and ServiceJay M Bernhardt PhD MPH
Director National Center for Health MarketingKatherine L Daniel PhD
Deputy Director National Center for Health Marketing
Editorial and Production StaffFrederic E Shaw MD JD
Editor MMWR SeriesSusan F Davis MD
(Acting) Assistant Editor MMWR SeriesRobert A Gunn MD MPH
Associate Editor MMWR SeriesTeresa F Rutledge
Managing Editor MMWR SeriesDouglas W Weatherwax
Lead Technical Writer-EditorDonald G Meadows MA
Jude C RutledgeWriters-EditorsMartha F Boyd
Lead Visual Information SpecialistMalbea A LaPete
Stephen R SpriggsVisual Information Specialists
Kim L Bright MBAQuang M Doan MBA
Phyllis H KingInformation Technology Specialists
2 MMWR January 16 2009
Some of these diagnoses such as asthma bronchiolitis or acute bronchitis generally are not considered to be caused by S pneumoniae
Hospitalization rates among children aged lt2 years and 2ndash4 years were calculated by dividing the total number of yearly hospitalizations by age-specific population denominators from US census data Baseline rates before introduction of PCV7 were defined as the average annualized rates during 1997ndash1999 incidence rate ratios (RRs) were calculated by dividing esti-mated rates for 2006 by the baseline rates Point estimates and 95 confidence intervals (CIs) were calculated using outcome-specific Poisson regression models that accounted for the Nationwide Inpatient Sample sampling design Rate differences between baseline and 2006 rates were multiplied by age-specific census data to estimate changes in the absolute number of hospitalizations during 2006 To examine changes in the distribution of causes of hospitalization after introduction of PCV7 the proportion of all nonbirth-related hospitaliza-tions that were coded as pneumonia and nonpneumonia ARI among children aged lt2 years during 1997ndash1999 and 2006 were calculated
In 2005 a total of 74559 children aged lt2 years were hos-pitalized in the United States for all-cause pneumonia and 67430 were hospitalized in 2006 accounting for approxi-mately 8 of yearly nonbirth-related hospitalizations in this age group The rates of all-cause pneumonia hospitalization per 1000 children aged lt2 years were 91 in 2005 and 81 in 2006 Although the rate of all-cause pneumonia in 2005 was higher than in 2004 (80) this increase was not statistically significant The 2005 and 2006 rates were 27 and 35 lower than the baseline rate of 125 per 1000 (Table) For 2006 the rate reduction represented an estimated 36300 fewer pneumonia hospitalizations among children aged lt2 years during 2006 compared with the average annual number of hospitalizations during 1997ndash1999 Among children aged 2ndash4 years the rate of all-cause pneumonia hospitalization did not change signifi-cantly during the study years (Table Figure)
Among children aged lt2 years the rate of nonpneumonia ARI hospitalizations was 246 per 1000 in 2005 and 219 per 1000 in 2006 The rate in 2006 represented a signifi-cant decline from the rate of 281 during the baseline period (RR = 08) For 2006 this rate reduction represented an estimated 51500 fewer nonpneumonia ARI hospitalizations among children aged lt2 years during 2006 compared with the average annual number of hospitalizations during 1997ndash1999 Among children aged 2ndash4 years the rate of nonpneumonia ARI hospitalizations was 65 per 1000 in 2005 and 56 per 1000 in 2006 The 2006 rate was not significantly different compared with the baseline period (RR = 10)
Vol 58 No 1 MMWR 3
Annual rates for all nonbirth-related hospitalizations among children aged lt2 years were 120 per 1000 children in 2005 and 100 per 1000 children in 2006 compared with 117 per 1000 children during the baseline period The proportion of total annual nonbirth-related hospitalizations coded as pneumonia was 8 in 2006 compared with 11 during the baseline period (plt0001) The proportion of such hospitalizations coded as nonpneumonia ARI was 22 in 2006 compared with 24 during the baseline period (p=0005)Reported by CG Grijalva MD MR Griffin MD Vanderbilt Univ Nashville Tennessee JP Nuorti MD Respiratory Diseases Br National Center for Immunization and Respiratory Diseases ND Walter MD EIS Officer CDCEditorial Note The results of this analysis cannot by them-selves establish a causal relationship between the advent of PCV7 and trends in childhood pneumonia hospitalizations
However the updated analysis of national hospital discharge data suggests that reductions in all-cause pneumonia hospital-izations among US children aged lt2 years after routine PCV7 use have been sustained and that the benefits of PCV7 might extend beyond the documented changes in IPD (3) to hospi-talizations for pneumonia Moreover rates of nonpneumonia ARI also declined after introduction of PCV7 indicating that the decreases in pneumonia hospitalizations likely were not the result of a shift in coding of respiratory hospitalizations to nonpneumonia ARI codes In addition the analysis suggests that the declines were unlikely to result from a reduction in total hospitalization rates The transient increase in all-cause pneumonia rates from 2004 to 2005 might reflect increased circulation of respiratory viruses or other seasonal variation
Although many nonpneumonia ARI diagnoses traditionally have not been considered manifestations of S pneumoniae infection recent data indicate that the pneumococcus might contribute to a wider range of childhood respiratory illness than previously thought A randomized clinical trial performed in child care centers in Israel suggested that immunization with a 9-valent pneumococcal conjugate vaccine reduced reported episodes of upper respiratory infections lower respiratory infec-tions and otitis media by 15 16 and 17 respectively (7) Furthermore in a trial of 9-valent pneumococcal conjugate vaccine among South African children vaccinated children had 45 fewer influenza Andashassociated pneumonia episodes than unvaccinated children suggesting that S pneumoniae might be a copathogen in illnesses diagnosed as influenza (8)
Although rates of IPD have decreased substantially among children aged 2ndash4 years after PCV7 introduction (3) a reduction in all-cause pneumonia hospitalizations was not observed in this age group The reasons for this are unknown but might be associated with lower overall rates of pneumo-coccal infection in this age group In addition other etiologic agents are becoming more common causes of pneumonia in children aged gt2 years (1)
FIGURE Annual all-cause pneumonia hospitalizations rates among children aged lt2 years and 2ndash4 years mdash Nationwide Inpatient Sample United States 1997ndash2006
0
2
4
6
8
10
12
14
16
1997
dagger
1998 1999 2000 2001 2002 2003 2004 2005 2006sect
Year
Aged lt2 yrs
Aged 2ndash4 yrs
Rate
Per 1000 populationdagger 95 confidence intervalsect 7-valent pneumococcal conjugate vaccine licensed in February 2000
TABLE Hospitalization rates for all-cause pneumonia and nonpneumonia acute respiratory illness among children aged lt2 years and 2ndash4 years before and after pneumococcal conjugate vaccine introduction mdash Nationwide Inpatient Sample United States 1997ndash1999 2005 and 2006
SyndromeAge group
1997ndash1999Rate ratio 2006 vs 1997ndash1999Average
annualized rate (95 CIdagger)
2005 2006
Rate (95 CI) Rate (95 CI) Rate ratio (95 CI)
All-cause pneumonialt2 yrs 125 (118ndash133) 91 (81ndash103) 81 (75ndash89) 07 (06ndash07)2ndash4 yrs 41 (38ndash43) 48 (43ndash53) 39 (35ndash43) 10 (09ndash11)
Nonpneumonia ARIsect
lt2 yrs 281 (264ndash300) 246 (214ndash283) 219 (197ndash243) 08 (07ndash09)2ndash4 yrs 58 (56ndash61) 65 (61ndash70) 56 (52ndash60) 10 (09ndash10)
Per 1000 population dagger Confidence interval sect Acute respiratory illness
4 MMWR January 16 2009
The findings in this report are subject to at least three limita-tions First identification of hospitalizations for pneumonia and nonpneumonia ARI was based on ICD-9-CM codes and might be subject to misclassification despite internal quality control and validation for consistency within the Nationwide Inpatient Sample Second establishing the etiology of pneu-monia is difficult Nationwide Inpatient Sample data are deidentified before public release and chart reviews cannot be performed to confirm recorded diagnoses Because most pneu-mococcal pneumonias are classified as pneumonias without further characterization this report provides an estimate of the effect of PCV7 on all-cause pneumonia without regard to pneumococcal serotypes Furthermore serotyping is not part of routine diagnostic work-ups and this information would not be recorded in medical charts However the decrease in non-pneumonia ARI hospitalizations among children aged lt2 years suggests that the decreases in pneumonia hospitalizations were unlikely to result from a shift in coding of pneumonia to nonpneumonia ARI codes Finally factors other than shifts in coding could affect hospitalization rates Reduced clinician concerns for severe pneumococcal disease among immunized children for example might lead to outpatient treatment rather than hospitalization However other data indicate that ambulatory-care visits for pneumonia among children aged lt2 years also have decreased since introduction of PCV7 (5) In addition the proportion of all hospitalizations that were attributable to pneumonia or nonpneumonia ARI decreased significantly suggesting that the declines were unlikely to result from a secular reduction in overall hospitalization rate
Despite the substantial morbidity associated with childhood pneumonia no pneumonia-specific prospective population-based surveillance system exists for monitoring trends in the incidence of pneumonia hospitalizations or pneumonia-related ambulatory-care visits in the United States Monitoring child-hood pneumonia is important for the evaluation of effects of current and future pneumococcal immunization programs Increases in pneumococcal disease caused by serotypes not included in PCV7 could result in some increase in pneumonia even though observed increases in non-PCV7 serotype IPD have been modest thus far (9) In addition extended-valency pneumococcal conjugate vaccines are expected to be licensed by late 2009 to early 2010 and might further reduce pneumo-nia rates Finally vaccination of children against influenza as recommended by the Advisory Committee on Immunization Practices is increasing and also might reduce pneumonia hospitalization rates (10)References 1 McIntosh K Community-acquired pneumonia in children N Engl
J Med 2002346429ndash37
2 CDC Preventing pneumococcal disease among infants and young chil-dren recommendations of the Advisory Committee on Immunization Practices (ACIP) MMWR 200049(No RR-9)
3 CDC Invasive pneumococcal disease in children 5 years after con-jugate vaccine introductionmdasheight states 1998ndash2005 MMWR 200857144ndash8
4 Grijalva CG Nuorti JP Arbogast PG Martin SW Edwards KM Griffin MR Decline in pneumonia admissions after routine childhood immu-nisation with pneumococcal conjugate vaccine in the USA a time-series analysis Lancet 20073691179ndash86
5 Zhou F Kyaw MH Shefer A Winston CA Nuorti JP Health care uti-lization for pneumonia in young children after routine pneumococcal conjugate vaccine use in the United States Arch Pediatr Adolesc Med 20071611162ndash8
6 Agency for Healthcare Research and Quality Introduction to the HCUP Nationwide Inpatient Sample (NIS) 2006 Rockville MD Agency for Healthcare Research and Quality 2006 Available at httpwwwhcup-usahrqgovdbnationnisNIS_Introduction_2006jsp
7 Dagan R Sikuler-Cohen M Zamir O Janco J Givon-Lavi N Fraser D Effect of a conjugate pneumococcal vaccine on the occurrence of respiratory infections and antibiotic use in day-care center attendees Pediatr Infect Dis J 200120951ndash8
8 Madhi SA Klugman KP Vaccine Trialist Group A role for Streptococcus pneumoniae in virus-associated pneumonia Nat Med 200410811ndash3
9 Hicks LA Harrison LH Flannery B et al Incidence of pneumococcal disease due to non-pneumococcal conjugate vaccine (PCV7) serotypes in the United States during the era of widespread PCV7 vaccination 1998ndash2004 J Infect Dis 20071961346ndash54
10 CDC Prevention and control of influenza recommendations of the Advisory Committee on Immunization Practices (ACIP) 2007 MMWR 200756(No RR-6)
Possible Congenital Infection with La Crosse Encephalitis Virus mdash
West Virginia 2006ndash2007La Crosse encephalitis virus (LACV) is a mosquitoborne
bunyavirus of the California encephalitis serogroup (1) During 2003ndash2007 West Virginia had the greatest number of cases (95) and highest incidence of LACV disease (51 cases per 100000 population) of any state The majority of persons infected with LACV either have no symptoms or a mild febrile illness a limited number experience encephalitis (2) Although only 1ndash4 of those infected with LACV develop any symptoms children aged lt16 years are at highest risk for severe neurologic disease and possible long-term sequelae (23) The effects of LACV infection during pregnancy and the potential for intrauterine transmission and adverse birth or developmental outcomes are unknown This report describes the first known case of LACV infection in a pregnant woman with evidence of possible congenital infection with LACV in her infant based on the presence of immunoglobulin M (IgM)
Confirmed and probable California serogroup viral (mainly La Crosse) encephalitis cases human United States 1964ndash2007 by state Available at httpwwwcdcgovncidoddvbidarborpdfcal_lacpdf
Vol 58 No 1 MMWR 5
antibodies in umbilical cord serum at delivery The infant was born healthy with normal neurologic and cognitive functions and no LACV symptoms Further investigation is needed to confirm the potential for intrauterine LACV transmission and to identify immediate and long-term health risks posed to infants Because of the potential for congenital infection pregnant women in areas where LACV is endemic should be advised to avoid mosquitoes health-care providers should monitor for LACV infection and sequelae among infants born to women infected with LACV during pregnancy
In August 2006 a previously healthy woman aged 43 years in week 21 of her pregnancy was admitted to a West Virginia hospital after experiencing severe headaches photophobia stiff neck fever weakness confusion and a red papular rash The patient had reported a 3-month history of severe headaches which were diagnosed initially as migraines and treated with morphine for pain Two previous pregnancies had proceeded without complication and each resulted in delivery of a healthy infant The patientrsquos medical history included anxiety depres-sion and hypothyroidism for which she received ongoing thyroid hormone replacement therapy
After hospital admission analysis of cerebrospinal fluid revealed an elevated white blood cell count (556 cellsmm3
[94 lymphocytes 5 monocytes and 1 polymor-phonuclear neutrophilic leukocytes]) elevated protein (66 mgdL) and normal glucose (55 mgdL) A diagnostic panel for viral encephalitis was performed and the patientrsquos serum was determined positive for the presence of LACV-specific IgM and immunoglobulin G (IgG) antibodies by immunofluorescence assay and for IgM by capture enzyme-
linked immunosorbent assay (ELISA) (Table) The patientrsquos serum was negative for IgM and IgG antibodies to the other three diseases in the diagnostic panel eastern equine encepha-litis western equine encephalitis and St Louis encephalitis A diagnosis of La Crosse encephalitis was made and supportive therapy was initiated During hospitalization the patient experienced a low-grade fever and exhibited panleukocytosis (absolute neutrophil count 12800microL) which persisted after discharge despite resolution of clinical signs
After reporting the case to the West Virginia Department of Health and Human Resources active follow-up of the patient and her fetus was initiated in collaboration with the patientrsquos primary-care providers and CDC With her consent the patientrsquos medical and prenatal histories were reviewed Because guidelines for evaluating pregnant women infected with LACV do not exist interim guidelines for West Nile virus were used to direct maternal and infant follow-up (4) Specifically col-lection of blood and tissue products at time of delivery was arranged with the patientrsquos obstetrician Umbilical cord serum and maternal serum were tested for LACV-specific antibodies by ELISA and serum-dilution plaque-reduction neutralization test (PRNT) Sera also were tested for neutralizing antibodies to the closely related Jamestown Canyon virus by PRNT to rule out potential cross-reactivity Umbilical cord and placental tissue were tested for LACV RNA by reverse transcriptionndashpolymerase chain reaction (RT-PCR) Data were collected regarding the infantrsquos health at delivery and through routine well-child visits during the first 6 months of life
The patient had a normal spontaneous vaginal delivery of a healthy girl at approximately 40 weeks gestation The child
TABLE Summary of laboratory test results during investigation and follow-up of possible congenital infection with La Crosse encephalitis virus (LACV) mdash West Virginia 2006ndash2007Collection date Specimen Test Result
August 20 2006 Maternal serum LACV IgMcapture ELISAdagger PositiveMaternal serum LACV IgM IFAsect PositiveMaternal serum LACV IgGpara IFA PositiveMaternal serum LACV neutralizing antibodies PRNT PositiveMaternal serum JCVdaggerdagger neutralizing antibodies PRNT Negative
January 5 2007 Placental tissue LACV RNA RT-PCRsectsect NegativeUmbilical cord tissue LACV RNA RT-PCR NegativeUmbilical cord serum LACV IgM capture ELISA PositiveUmbilical cord serum LACV IgG capture ELISA EquivocalUmbilical cord serum LACV neutralizing antibodies PRNT PositiveUmbilical cord serum JCV neutralizing antibodies PRNT Negative
March 23 2007 Maternal serum LACV IgM capture ELISA NegativeMaternal serum LACV IgG capture ELISA Positive
Immunoglobulin M dagger Enzyme-linked immunosorbent assay sect Immunofluorescence assay para Immunoglobulin G Plaque-reduction neutralization test daggerdagger Jamestown Canyon virus sectsect Reverse transcriptionndashpolymerase chain reaction
6 MMWR January 16 2009
had normal birth weight (2970 g) length (52 cm) and head circumference (33 cm) Apgar scores at 1 minute and 5 minutes postpartum were within normal limits (8 and 9 respectively) LACV-specific IgM antibodies were detected in umbilical cord serum although no evidence of LACV RNA was detected in umbilical cord tissue or placental tissue by RT-PCR (Table)
The mother declined collection of additional specimens of infant serum for confirmation of congenital LACV infection Maternal serum collected at 11 weeks postpartum was positive for LACV IgG antibodies but negative for IgM Except for intermittent nasal congestion associated with upper respiratory infections the infant remained healthy and exhibited appropri-ate growth and development through the first 6 months of life No neurologic abnormalities or decreased cognitive functions were observedReported by A Hinckley PhD Div of Vector-Borne Infectious Diseases National Center for Zoonotic Vector-Borne and Enteric Diseases A Hall DVM EIS Officer CDCEditorial Note This report summarizes the first case of symptomatic LACV infection identified during pregnancy Congenital LACV infection of the fetus was suggested through identification of IgM antibodies in umbilical cord serum although the newborn was asymptomatic and development was normal Although unlikely to cross the placental barrier LACV IgM antibodies detected in cord serum might have been attributable to transplacental leakage induced by uterine contractions that disrupt placental barriers during labor which has been documented for anti-Toxoplasma IgM antibodies (5) Because specificity of standard laboratory techniques used to detect LACV IgM antibodies in cord serum or newborn serum is unknown a follow-up evaluation of infant serum is neces-sary to confirm congenital infection However in this case the mother declined collection of any additional specimens from her infant
Certain infectious diseases have more severe clinical presenta-tions in pregnant women (6) Symptomatic LACV infection is rare among adults therefore effects of pregnancy on the risk for or severity of illness are unknown Because LACV-specific IgM can be present for as long as 9 months after infection (1) LACV might not have been responsible for the symptoms reported during this womanrsquos pregnancy However the woman resided in an area where LACV is known to be endemic during 2006 16 (24) of 67 LACV cases in the United States reported to CDC occurred in West Virginia including three other cases from the same county as this patientdagger Although antimicrobial treatment of pregnant women often is controversial because of limited information regarding efficacy and risk to the
developing infant (7) certain in vitro evidence indicates that the antiviral agent ribavirin might be useful for treating LACV infection in nonpregnant patients (2) However supportive treatment continues as the standard of care for managing all LACV patients (2)
Congenital infection with other arboviral diseases has been reviewed and documented previously (8) Although no human congenital infection with a bunyavirus of the California serogroup has been reported congenital infection with other bunyaviruses of the Bunyamwera serogroup has been associ-ated with macrocephaly In addition animal studies have determined that infection with LACV during pregnancy can cause teratogenic effects in domestic rabbits Mongolian gerbils and sheep (910)
Pregnant women in areas where LACV is endemic should take precautions to reduce risk for infection by avoiding mos-quitoes wearing protective clothing and applying a mosquito repellent to skin and clothing Additionally health-care pro-viders serving areas where LACV is endemic should consider LACV in the differential diagnosis of viral encephalitis As a nationally notifiable disease all probable and confirmed cases of LACV should be reported to the appropriate state and local public health authorities When LACV infection is suspected in a pregnant woman or infant appropriate serologic and virologic testing by a public health reference laboratory is recommended Testing breast milk for the presence of LACV also might be reasonable to evaluate the potential for maternal-infant transmission and to determine the suitability for continued breastfeeding Additional investigations are needed to confirm the potential for congenital infection with LACV and to identify immediate and long-term health risks LACV poses to infants
AcknowledgmentsThis report is based in part on contributions by the collaborat-
ing physicians and health-care providers D Bixler MD and M del Rosario MD West Virginia Dept of Health and Human Resources E Hayes MD N Lindsey MS O Kosoy MA A Lambert J Laven and R Lanciotti PhD Div of Vector-Borne Infectious Diseases National Center for Zoonotic Vector-Borne and Enteric Diseases and D Bensyl PhD Office of Workforce and Career Development CDC
References 1 McJunkin JE Minnich LL Tsai TE La Crosse encephalitis and other
California serogroup viruses In Feigin RD Cherry JD eds Textbook of pediatric infectious diseases 5th ed Philadelphia PA WB Saunders 20042403ndash11
2 McJunkin JE Khan RR Tsai TF California-La Crosse encephalitis Infect Dis Clin North Am 19981283ndash93
3 Kappus KD Monath TP Kaminski RM et al Reported encephalitis associated with California serogroup virus infections in the United States 1963ndash1981 In Thompson WH Calisher CD eds California serogroup viruses New York NY Alan R Liss 198331ndash41
dagger La Crosse encephalitis human cumulative 2006 data Available at httpdisease mapsusgsgov2006lac_us_humanhtml
Vol 58 No 1 MMWR 7
4 CDC Interim guidelines for the evaluation of infants born to moth-ers infected with West Nile virus during pregnancy MMWR 2004 53154ndash7
5 Pinon JM Dumon H Chemla C et al Strategy for diagnosis of con-genital toxoplasmosis evaluation of methods comparing mothers and newborns and standard methods for postnatal detection of immuno-globulin G M and A antibodies J Clin Microbiol 2001392267ndash71
6 Jamieson DJ Theiler RN Rasmussen SA Emerging infections and pregnancy Emerg Infect Dis 2006121638ndash43
7 Cono J Cragan JD Jamieson DJ Rasmussen SA Prophylaxis and treatment of pregnant women for emerging infections and bioterrorism emergencies Emerg Infect Dis 2006121631ndash7
8 Tsai TF Congenital arboviral infections something new something old Pediatrics 2006117936ndash9
9 Osorio JE Schoepp RJ Yuill TM Effects of La Crosse infection on pregnant domestic rabbits and Mongolian gerbils Am J Trop Med Hyg 199655384ndash90
10 Edwards JF Karabatsos N Collisson EW de la Concha Bermejillo A Ovine fetal malformations induced by in utero inoculation with Main Drain San Angelo and LaCrosse viruses Am J Trop Med Hyg 199756171ndash6
Updated Guidelines for the Use of Nucleic Acid Amplification Tests in the Diagnosis of Tuberculosis
Guidelines for the use of nucleic acid amplification (NAA) tests for the diagnosis of tuberculosis (TB) were published in 1996 (1) and updated in 2000 (2) Since then NAA testing has become a routine procedure in many settings because NAA tests can reliably detect Mycobacterium tuberculosis bacteria in specimens 1 or more weeks earlier than culture (3) Earlier laboratory confirmation of TB can lead to earlier treatment initiation improved patient outcomes increased opportunities to interrupt transmission and more effective public health interventions (45) Because of the increasing use of NAA tests and the potential impact on patient care and public health in June 2008 CDC and the Association of Public Health Laboratories (APHL) convened a panel of clini-cians laboratorians and TB control officials to assess existing guidelines (12) and make recommendations for using NAA tests for laboratory confirmation of TB On the basis of the panelrsquos report and consultations with the Advisory Council for the Elimination of TB (ACET) CDC recommends that NAA testing be performed on at least one respiratory specimen from each patient with signs and symptoms of pulmonary TB for whom a diagnosis of TB is being considered but has not yet been established and for whom the test result would alter case management or TB control activities such as contact
investigations These guidelines update the previously pub-lished guidelines (12)
BackgroundConventional tests for laboratory confirmation of TB include
acid-fast bacilli (AFB) smear microscopy which can produce results in 24 hours and culture which requires 2ndash6 weeks to produce results (56) Although rapid and inexpensive AFB smear microscopy is limited by its poor sensitivity (45ndash80 with culture-confirmed pulmonary TB cases) and its poor positive predictive value (50ndash80) for TB in settings in which nontuberculous mycobacteria are commonly isolated (367)
NAA tests can provide results within 24ndash48 hours The Amplified Mycobacterium tuberculosis Direct Test (MTD Gen-Probe San Diego California) was approved by the Food and Drug Administration (FDA) in 1995 for use with AFB smear-positive respiratory specimens and in a supplement application an enhanced MTD test was approved in 1999 for use with AFB smear-negative respiratory specimens from patients suspected to have TB In addition the Amplicor Mycobacterium tuberculosis Test (Amplicor Roche Diagnostics Basel Switzerland) was approved by FDA in 1996 for use with AFB smear-positive respiratory specimens from patients suspected to have TB NAA tests for TB that have not been FDA-approved also have been used clinically (eg NAA tests based on analyte specific reagents often called ldquohome-brewrdquo or ldquoin-houserdquo tests) (89)
Compared with AFB smear microscopy the added value of NAA testing lies in its 1) greater positive predictive value (gt95) with AFB smear-positive specimens in settings in which nontuberculous mycobacteria are common and 2) ability to confirm rapidly the presence of M tuberculosis in 50ndash80 of AFB smear-negative culture-positive specimens (37ndash9) Compared with culture NAA tests can detect the presence of M tuberculosis bacteria in a specimen weeks earlier than culture for 80ndash90 of patients suspected to have pulmonary TB whose TB is ultimately confirmed by culture (389) These advantages can impact patient care and TB control efforts such as by avoiding unnecessary contact investigations or respiratory isolation for patients whose AFB smear-positive specimens do not contain M tuberculosis
Despite being commercially available for more than a decade (1) NAA tests for TB have not been widely used in the United States largely because of 1) an uncertainty as to whether NAA test results influence case-management decisions or TB control activities 2) a lack of information on the overall cost-effectiveness of NAA testing for TB and 3) a lack of demand from clinicians and public health authorities However recent Additional information regarding ACET is available at httpwwwcdcgov
masofacmfacmacethtm
8 MMWR January 16 2009
studies showed that 1) clinicians already rely on the NAA test result as the deciding factor for the initiation of therapy for 20ndash50 of TB cases in settings where NAA testing is a rou-tine practice (47) and 2) overall cost savings can be achieved by using NAA test results for prioritizing contact investigations making decisions regarding respiratory isolation or reducing nonindicated TB treatment (47)
In response to the increasing demand for NAA testing for TB and recognition of the importance of prompt laboratory results in TB diagnosis and control ACET requested that APHL and CDC convene a panel to evaluate the available information (eg current practices existing guidelines and publications) and to propose new guidelines for the use of NAA tests for TB diagnosis The panel met in June 2008 and included TB clinicians TB control officials laboratory direc-tors or supervisors from small medium and large public health laboratories hospital laboratories and commercial laboratories and representatives from the TB Regional Training and Medical Consultation Centers ACET APHL and CDC In brief the panel recommendeddagger that NAA testing become a standard practice in the United States to aid in the initial diagnosis of patients suspected to have TB rather than just being a reason-able approach as suggested in previously published guidelines (12) On the basis of the panelrsquos report and consultations with ACET CDC developed revised guidelines
Updated RecommendationNAA testing should be performed on at least one respira-
tory specimen from each patient with signs and symptoms of pulmonary TB for whom a diagnosis of TB is being considered but has not yet been established and for whom the test result would alter case management or TB control activities The following testing and interpretation algorithm is proposed
Revised Testing and Interpretation Algorithm1 Routinely collect respiratory specimens (eg sputum)
process (liquefy decontaminate and concentrate) and test by AFB smear microscopy and culture as previously recommended (6) Specimen collection and microbiologic testing should not be delayed to await NAA test results
2 At least one specimen preferably the first diagnostic speci-men from each patient to be tested by NAA should be processed suspended in a sufficient volume of buffer to ensure adequate sample volume for all planned tests (eg microscopy culture and NAA) and tested using an NAA
test for TB NAA testing should be performed in accordance with the manufacturerrsquos instructions or a validated standard operating procedure
3 Interpret NAA test results in correlation with the AFB smear resultsa If the NAA result is positive and the AFB smear result is
positive presume the patient has TB and begin anti-TB treatment while awaiting culture results The positive predictive value of FDA-approved NAA tests for TB is gt95 in AFB smear-positive cases (8)
b If the NAA result is positive and the AFB smear result is negative use clinical judgment whether to begin anti-TB treatment while awaiting culture results and determine if additional diagnostic testing is needed Consider testing an additional specimen using NAA to confirm the NAA result A patient can be presumed to have TB pending culture results if two or more specimens are NAA positive
c If the NAA result is negative and the AFB smear result is positive a test for inhibitors should be performed and an additional specimen should be tested with NAA Sputum specimens (3ndash7) might contain inhibitors that prevent or reduce amplification and cause false-negative NAA results (89)i If inhibitors are detected the NAA test is of no diag-
nostic help for this specimen Use clinical judgment to determine whether to begin anti-TB treatment while awaiting results of culture and additional diagnostic testing
ii If inhibitors are not detected use clinical judgment to determine whether to begin anti-TB treatment while awaiting culture results and determine if addi-tional diagnostic testing is needed A patient can be presumed to have an infection with nontuberculous mycobacteria if a second specimen is smear positive and NAA negative and has no inhibitors detected
d If the NAA result is negative and the AFB smear result is negative use clinical judgment to determine whether to begin anti-TB treatment while awaiting results of culture and additional diagnostic tests Currently available NAA tests are not sufficiently sensitive (detecting 50ndash80 of AFB smear-negative culture-positive pulmonary TB cases) to exclude the diagnosis of TB in AFB smear-negative patients suspected to have TB (89)
CautionsCulture remains the gold standard for laboratory con-
firmation of TB and is required for isolating bacteria for drug-susceptibility testing and genotyping In accordance
dagger The full report and recommendations of the panel (released in December 2008) are available at httpwwwcdcgovtbamplification_testsamplification_testspdf
Vol 58 No 1 MMWR 9
with current recommendations (6) sufficient numbers and portions of specimens should always be reserved for culturing Nonetheless NAA testing should become standard practice for patients suspected to have TB and all clinicians and public health TB programs should have access to NAA testing for TB to shorten the time needed to diagnose TB from 1ndash2 weeks to 1ndash2 days (3) More rapid laboratory results should lead to earlier treatment initiation improved patient outcomes and increased opportunities to interrupt transmission (45) Rapid laboratory confirmation of TB also can help reduce inap-propriate use of fluoroquinolones as empiric monotherapy of pneumonias a practice which is suspected to lead to develop-ment of fluoroquinolone-resistant M tuberculosis and delays in initiating appropriate anti-TB therapy (10)
To maximize benefits of NAA testing the interval from specimen collection to communication of the laboratory report to the treating clinician should be as brief as possible NAA test results should be available within 48 hours of specimen collection Laboratorians should treat an initial positive NAA test result as a critical test value immediately report the result to the clinician and public health authorities and be available for consultation regarding test interpretation and the possible need for additional testing
Although NAA testing is recommended to aid in the ini-tial diagnosis of persons suspected to have TB the currently available NAA tests should not be ordered routinely when the clinical suspicion of TB is low because the positive predictive value of the NAA test is lt50 for such cases (8) Clinicians laboratorians and TB control officials should be aware of the appropriate uses of NAA tests
Clinicians should interpret all laboratory results on the basis of the clinical situation A single negative NAA test result should not be used as a definitive result to exclude TB especially when the clinical suspicion of TB is moderate to high Rather the negative NAA test result should be used as additional information in making clinical decisions to expedite testing for an alternative diagnosis or to prevent unnecessary TB treatment Consultation with a TB expert should be con-sidered if the clinician is not experienced in the interpretation of NAA tests or the diagnosis and treatment of TB
Although FDA-approved NAA tests for TB are eligible for Medicare or Medicaid reimbursement the costs of adding NAA testing to the routine testing of respiratory specimens from patients suspected to have TB might be considerable (eg operating costs exceed $100 per MTD test) (8) However NAA testing has the potential to provide overall cost savings to the treatment center and TB control program through reduced costs for isolation reduced costs of contact investigations of persons who do not have TB and increased opportuni-ties to prevent transmission Within the parameters of these
guidelines each TB control or treatment program should evalu-ate the overall costs and benefits of NAA testing in deciding the value and optimal use of the test in their setting
Because the testing algorithm includes NAA testing of AFB smear-negative specimens laboratories must use an FDA-approved test for such specimens or a test produced and validated in accordance with applicable FDA and Clinical Laboratory Improvement Amendments (CLIA) regulationssect However the performance of in-house tests or FDA-approved tests used for nonapproved indications (off-label use) is vari-able (89) and insufficient information is available to provide recommendations on the use of such tests for the diagnosis of TB Their use should be guided by the clinical context and the results of such tests should be interpreted on the basis of per-formance in the local laboratory and in validation studies
For procedural and economic reasons NAA testing might be impractical in laboratories with a small volume of testing Referral of samples for NAA testing to high-volume laborato-ries might be preferable to improve cost-efficiency proficiency and turnaround times The New York and Florida Fast Track Programs are successful NAA testing services that could serve as models for a regional service (5)
Information is limited regarding NAA test performance for nonrespiratory specimens or specimens from patients under treatment (8) NAA results often remain positive after culture results become negative during therapy Further research is needed before specific recommendations can be made on the use of NAA testing in the diagnosis of extrapulmonary TB and TB in children who cannot produce sputum however evidence exists for the utility of such testing in individual cases (8)
These guidelines do not address the use of molecular tests for detecting drug resistance which is an urgent public health and diagnostic need No molecular drug-susceptibility tests (DSTs) have been approved by FDA for use in the United States although well-characterized molecular DSTs are commercially available in Europe and elsewherepara Nonetheless a proposed revision of the Diagnostic Standards and Classification of Tuberculosis in Adults and Children (6) is likely to support the use of molecular DSTs for AFB smear-positive sputum sediments from TB patients who are suspected to have drug-resistant disease or who are from a region or population with a high prevalence of drug resistanceReported by Div of Tuberculosis Elimination National Center for HIVAIDS Viral Hepatitis STD and TB Prevention CDC
sect Information on ASR regulations (21 CFR 80910(e) 80930 and 8644020) is available at httpwwwfdagovcdrhoivdguidance1590html Information on the Clinical Laboratory Improvement Amendments (42 CFR 493) is available at httpwwwncdcgovcliaregstocaspx
para Additional information available at httpwwwwhointtbfeatures_archiveexpert_group_report_june08pdf
10 MMWR January 16 2009
AcknowledgmentsThis report is based on contributions of an ad hoc panel of
external consultants convened by CDC and the Assoc of Public Health Laboratories (D Alland MD New Jersey Medical School J Bernardo MD Boston Univ School of Medicine Massachusetts B Hanna PhD New York Univ School of Medicine RL Kaplan PhD Quest Diagnostics Madison New Jersey M Kawamura MD TB Control Section San Francisco Dept of Public Health S Liska DrPH San Francisco Public Health Laboratory C Nivens Missouri State Tuberculosis Laboratory M Salfinger MD Bur of Laboratories Florida Dept of Health B Seaworth MD Heartland National TB Center San Antonio Texas D Warshauer PhD Wisconsin State Laboratory of Hygiene and KE Wroblewski MPH Assoc of Public Health Laboratories) and K Castro MD L Diem J Jereb MD P Lobue MD S Marks MPH J Mazurek MD B Metchock DrPH T Shinnick PhD and A Vernon MD Div of Tuberculosis Elimination National Center for HIVAIDS Viral Hepatitis STD and TB Prevention CDC
References 1 CDC Nucleic acid amplification tests for tuberculosis MMWR
199645950ndash1 2 CDC Update nucleic acid amplification tests for tuberculosis MMWR
200049593ndash4 3 Moore DF Guzman JA Mikhail LT Reduction in turnaround time for
laboratory diagnosis of pulmonary tuberculosis by routine use of a nucleic acid amplification test Diagn Microbiol Infect Dis 200552247ndash54
4 Taegtmeyer M Beeching NJ Scott J et al Clinical impact of nucleic acid amplification tests on the diagnosis and management of tuberculosis in a British hospital Thorax 200863317ndash21
5 CDC National plan for reliable tuberculosis laboratory services using a systems approach recommendations from CDC and the Association of Public Health Laboratories Task Force on Tuberculosis Laboratory Services MMWR 200554(No RR-6)1ndash12
6 American Thoracic Society CDC Council of the Infectious Disease Society of America Diagnostic standards and classification of tuberculosis in adults and children Am J Respir Crit Care Med 20001611376ndash95
7 Guerra RL Hooper NM Baker JF et al Use of the Amplified Mycobacterium tuberculosis Direct Test in a public health laboratory test performance and impact on clinical care Chest 2007132946ndash51
8 Dinnes J Deeks J Kunst H et al A systematic review of rapid diagnostic tests for the detection of tuberculosis infection Health Technol Assess 2007111ndash196
9 Flores LL Pai M Colford JM Jr Riley LW In-house nucleic acid amplification tests for the detection of Mycobacterium tuberculosis in sputum specimens meta-analysis and meta-regression BMC Microbiol 2005555
10 Wang Y Hsueh P-R Jan I-S et al Empirical treatment with a fluoro-quinolone delays the treatment for tuberculosis and is associated with a poor prognosis in endemic areas Thorax 200661903ndash8
Erratum Vol 57 No 40
In the report ldquoVaccination Coverage Among Adolescents Aged 13ndash17 Years mdash United States 2007rdquo on page 1100 in the second footnote an error occurred The first sentence of the footnote should read as follows
ldquodagger NISndashTeen 2007 was conducted during the fourth quarter 2007 only eligible participants were born during October 5 1989ndashFebruary 14 1995rdquo
Vol 58 No 1 MMWR 11
TABLE I Provisional cases of infrequently reported notifiable diseases (lt1000 cases reported during the preceding year) mdash United States week ending January 10 2009 (1st week)
DiseaseCurrent
weekCum 2009
5-year weekly
averagedagger
Total cases reported for previous years States reporting cases
during current week (No)2008 2007 2006 2005 2004
Anthrax mdash mdash mdash mdash 1 1 mdash mdashBotulism foodborne mdash mdash 0 13 32 20 19 16 infant mdash mdash 2 98 85 97 85 87 other (wound and unspecified) mdash mdash 1 24 27 48 31 30Brucellosis mdash mdash 3 84 131 121 120 114Chancroid mdash mdash 0 31 23 33 17 30Cholera mdash mdash 0 2 7 9 8 6Cyclosporiasissect 1 1 2 127 93 137 543 160 FL (1)Diphtheria mdash mdash mdash mdash mdash mdash mdash mdashDomestic arboviral diseasessectpara California serogroup mdash mdash mdash 40 55 67 80 112 eastern equine mdash mdash mdash 2 4 8 21 6 Powassan mdash mdash mdash 1 7 1 1 1 St Louis mdash mdash 0 10 9 10 13 12 western equine mdash mdash mdash mdash mdash mdash mdash mdashEhrlichiosisAnaplasmosissect Ehrlichia chaffeensis 3 3 16 855 828 578 506 338 ME (1) NC (1) FL (1) Ehrlichia ewingii mdash mdash mdash 9 mdash mdash mdash mdash Anaplasma phagocytophilum mdash mdash 25 494 834 646 786 537 undetermined mdash mdash 2 69 337 231 112 59Haemophilus influenzaedaggerdagger
invasive disease (age lt5 yrs) serotype b mdash mdash 1 27 22 29 9 19 nonserotype b 1 1 5 169 199 175 135 135 NC (1) unknown serotype 2 2 5 191 180 179 217 177 NY (1) FL (1)Hansen diseasesect mdash mdash 2 72 101 66 87 105Hantavirus pulmonary syndromesect mdash mdash 1 16 32 40 26 24Hemolytic uremic syndrome postdiarrhealsect 1 1 6 237 292 288 221 200 CA (1)Hepatitis C viral acute 90 90 21 840 845 766 652 720 OH (3) IN (1) KY (2) TN (1) TX (1) AZ (81) CA (1)HIV infection pediatric (age lt13 years)sectsect mdash mdash 2 mdash mdash mdash 380 436Influenza-associated pediatric mortalitysectparapara mdash mdash 1 90 77 43 45 mdashListeriosis 7 7 17 670 808 884 896 753 NY (1) OH (1) GA (1) TN (1) CA (3)Measles mdash mdash 1 134 43 55 66 37Meningococcal disease invasivedaggerdaggerdagger A C Y and W-135 1 1 7 302 325 318 297 mdash NV (1) serogroup B mdash mdash 5 154 167 193 156 mdash other serogroup mdash mdash 1 30 35 32 27 mdash unknown serogroup 6 6 19 593 550 651 765 mdash OH (2) VA (1) NC (1) FL (1) CA (1)Mumps 2 2 15 391 800 6584 314 258 TN (1) HI (1)Novel influenza A virus infections mdash mdash mdash 1 4 N N NPlague mdash mdash 0 1 7 17 8 3Poliomyelitis paralytic mdash mdash mdash mdash mdash mdash 1 mdashPolio virus infection nonparalyticsect mdash mdash mdash mdash mdash N N NPsittacosissect 1 1 0 12 12 21 16 12 PA (1)Q fever totalsectsectsectsect mdash mdash 2 116 171 169 136 70 acute mdash mdash 0 103 mdash mdash mdash mdash chronic mdash mdash mdash 13 mdash mdash mdash mdashRabies human mdash mdash 0 1 1 3 2 7Rubellaparaparapara 2 2 0 17 12 11 11 10 AZ (1) UT (1)Rubella congenital syndrome mdash mdash mdash mdash mdash 1 1 mdashSARS-CoVsect mdash mdash mdash mdash mdash mdash mdash mdashSmallpoxsect mdash mdash mdash mdash mdash mdash mdash mdashStreptococcal toxic-shock syndromesect mdash mdash 4 131 132 125 129 132Syphilis congenital (age lt1 yr) mdash mdash 7 229 430 349 329 353Tetanus 1 1 1 16 28 41 27 34 UT (1)Toxic-shock syndrome (staphylococcal)sect 1 1 3 69 92 101 90 95 TN (1)Trichinellosis mdash mdash 0 37 5 15 16 5Tularemia mdash mdash 2 106 137 95 154 134Typhoid fever 1 1 9 396 434 353 324 322 CA (1)Vancomycin-intermediate Staphylococcus aureussect mdash mdash 0 33 37 6 2 mdashVancomycin-resistant Staphylococcus aureussect mdash mdash 0 mdash 2 1 3 1Vibriosis (noncholera Vibrio species infections)sect 3 3 4 451 549 N N N NC (2) FL (1)Yellow fever mdash mdash mdash mdash mdash mdash mdash mdash
See Table I footnotes on next page
12 MMWR January 16 2009
TABLE I (Continued) Provisional cases of infrequently reported notifiable diseases (lt1000 cases reported during the preceding year) mdash United States week ending January 10 2009 (1st week)mdash No reported cases N Not notifiable Cum Cumulative year-to-date counts Incidence data for reporting year 2008 and 2009 are provisional whereas data for 2004 2005 2006 and 2007 are finalized dagger Calculated by summing the incidence counts for the current week the 2 weeks preceding the current week and the 2 weeks following the current week for a total of
5 preceding years Additional information is available at httpwwwcdcgovepodphsiphsfiles5yearweeklyaveragepdf sect Not notifiable in all states Data from states where the condition is not notifiable are excluded from this table except starting in 2007 for the domestic arboviral diseases and
influenza-associated pediatric mortality and in 2003 for SARS-CoV Reporting exceptions are available at httpwwwcdcgovepodphsiphsinfdishtm para Includes both neuroinvasive and nonneuroinvasive Updated weekly from reports to the Division of Vector-Borne Infectious Diseases National Center for Zoonotic Vector-
Borne and Enteric Diseases (ArboNET Surveillance) Data for West Nile virus are available in Table II The names of the reporting categories changed in 2008 as a result of revisions to the case definitions Cases reported prior to 2008 were reported in the categories Ehrlichiosis
human monocytic (analogous to E chaffeensis) Ehrlichiosis human granulocytic (analogous to Anaplasma phagocytophilum) and Ehrlichiosis unspecified or other agent (which included cases unable to be clearly placed in other categories as well as possible cases of E ewingii)
daggerdagger Data for H influenzae (all ages all serotypes) are available in Table II sectsect Updated monthly from reports to the Division of HIVAIDS Prevention National Center for HIVAIDS Viral Hepatitis STD and TB Prevention Implementation of HIV reporting
influences the number of cases reported Updates of pediatric HIV data have been temporarily suspended until upgrading of the national HIVAIDS surveillance data management system is completed Data for HIVAIDS when available are displayed in Table IV which appears quarterly
parapara Updated weekly from reports to the Influenza Division National Center for Immunization and Respiratory Diseases No confirmed influenza-associated pediatric deaths have been reported for the current 2008-09 season
No measles cases were reported for the current week daggerdaggerdagger Data for meningococcal disease (all serogroups) are available in Table II sectsectsect In 2008 Q fever acute and chronic reporting categories were recognized as a result of revisions to the Q fever case definition Prior to that time case counts were not
differentiated with respect to acute and chronic Q fever cases paraparapara The two rubella cases reported for the current week were unknown Updated weekly from reports to the Division of Viral and Rickettsial Diseases National Center for Zoonotic Vector-Borne and Enteric Diseases
Ratio of current 4-week total to mean of 15 4-week totals (from previous comparable and subsequent 4-week periods for the past 5 years) The point where the hatched area begins is based on the mean and two standard deviations of these 4-week totals
FIGURE I Selected notifiable disease reports United States comparison of provisional 4-week totals January 10 2009 with historical data
Notifiable Disease Data Team and 122 Cities Mortality Data Team Patsy A HallDeborah A Adams Rosaline DharaWillie J Anderson Michael S WodajoLenee Blanton Pearl C Sharp
Ratio (Log scale)
DISEASE
Beyond historical limits
DECREASE INCREASECASES CURRENT
4 WEEKS
414
39
112
118
70
1
22
11
486
Hepatitis A acute
Hepatitis B acute
Hepatitis C acute
Legionellosis
Measles
Mumps
Pertussis
Meningococcal disease
421050250125
Giardiasis
Vol 58 No 1 MMWR 13
TABLE II Provisional cases of selected notifiable diseases United States weeks ending January 10 2009 and January 5 2008 (1st week)
Reporting area
Chlamydiadagger Coccidiodomycosis Cryptosporidiosis
Current week
Previous 52 weeks Cum
2009Cum 2008
Current week
Previous 52 weeks Cum
2009Cum 2008
Current week
Previous 52 week Cum
2009Cum 2008Med Max Med Max Med Max
United States 8115 21476 25221 8115 13869 103 122 322 103 308 20 100 431 20 85New England 369 707 1048 369 441 mdash 0 1 mdash mdash mdash 5 20 mdash 40
Connecticut mdash 210 473 mdash 78 N 0 0 N N mdash 0 0 mdash 38Mainesect 56 51 72 56 43 N 0 0 N N mdash 0 6 mdash mdashMassachusetts 225 329 623 225 244 N 0 0 N N mdash 1 9 mdash 1New Hampshire 32 42 64 32 17 mdash 0 1 mdash mdash mdash 1 4 mdash 1Rhode Islandsect 29 55 208 29 53 mdash 0 0 mdash mdash mdash 0 3 mdash mdashVermontsect 27 15 52 27 6 N 0 0 N N mdash 1 7 mdash mdash
Mid Atlantic 315 2763 5097 315 1593 mdash 0 0 mdash mdash 1 12 34 1 7New Jersey mdash 442 576 mdash 298 N 0 0 N N mdash 0 2 mdash 1New York (Upstate) 145 532 1355 145 5 N 0 0 N N 1 4 17 1 mdashNew York City mdash 1011 3412 mdash 578 N 0 0 N N mdash 2 6 mdash 2Pennsylvania 170 814 1088 170 712 N 0 0 N N mdash 5 15 mdash 4
EN Central 975 3528 4285 975 3008 mdash 1 3 mdash 1 4 25 126 4 18Illinois 37 1084 1394 37 749 N 0 0 N N mdash 2 13 mdash 2Indiana 313 377 713 313 463 N 0 0 N N mdash 3 12 mdash mdashMichigan 585 841 1226 585 494 mdash 0 3 mdash mdash mdash 5 13 mdash 6Ohio mdash 805 1261 mdash 930 mdash 0 2 mdash 1 4 6 59 4 7Wisconsin 40 320 615 40 372 N 0 0 N N mdash 9 46 mdash 3
WN Central 165 1268 1696 165 806 mdash 0 2 mdash mdash 3 16 68 3 3Iowa mdash 174 240 mdash 71 N 0 0 N N mdash 4 30 mdash 3Kansas 107 179 529 107 110 N 0 0 N N mdash 1 8 mdash mdashMinnesota mdash 266 373 mdash 195 mdash 0 0 mdash mdash mdash 4 15 mdash mdashMissouri mdash 490 566 mdash 272 mdash 0 2 mdash mdash 2 3 13 2 mdashNebraskasect mdash 80 244 mdash 70 N 0 0 N N 1 2 8 1 mdashNorth Dakota 3 34 58 3 52 N 0 0 N N mdash 0 2 mdash mdashSouth Dakota 55 55 85 55 36 N 0 0 N N mdash 1 9 mdash mdash
S Atlantic 2919 3645 6324 2919 1889 mdash 0 1 mdash mdash 11 17 46 11 9Delaware 48 69 150 48 36 mdash 0 1 mdash mdash mdash 0 2 mdash mdashDistrict of Columbia 99 127 207 99 81 mdash 0 0 mdash mdash mdash 0 2 mdash mdashFlorida 1135 1368 1571 1135 824 N 0 0 N N 7 7 35 7 5Georgia 4 458 1307 4 159 N 0 0 N N 4 4 13 4 1Marylandsect 367 439 692 367 179 mdash 0 1 mdash mdash mdash 1 4 mdash mdashNorth Carolina mdash 0 1208 mdash mdash N 0 0 N N mdash 0 16 mdash mdashSouth Carolinasect 840 478 3043 840 260 N 0 0 N N mdash 1 4 mdash 1Virginiasect 420 621 1059 420 314 N 0 0 N N mdash 1 4 mdash mdashWest Virginia 6 60 102 6 36 N 0 0 N N mdash 0 3 mdash 2
ES Central 954 1567 2302 954 1026 mdash 0 0 mdash mdash mdash 3 9 mdash 1Alabamasect mdash 456 561 mdash 363 N 0 0 N N mdash 1 6 mdash 1Kentucky 374 240 373 374 155 N 0 0 N N mdash 0 4 mdash mdashMississippi mdash 390 1048 mdash 187 N 0 0 N N mdash 0 2 mdash mdashTennesseesect 580 534 792 580 321 N 0 0 N N mdash 1 6 mdash mdash
WS Central 329 2781 3530 329 1901 mdash 0 1 mdash mdash mdash 5 155 mdash mdashArkansassect 329 276 455 329 118 N 0 0 N N mdash 0 6 mdash mdashLouisiana mdash 417 775 mdash 132 mdash 0 1 mdash mdash mdash 1 5 mdash mdashOklahoma mdash 157 392 mdash 232 N 0 0 N N mdash 1 16 mdash mdashTexassect mdash 1947 2343 mdash 1419 N 0 0 N N mdash 2 140 mdash mdash
Mountain 889 1264 1804 889 828 71 86 182 71 90 mdash 8 37 mdash 4Arizona 283 470 650 283 261 71 86 181 71 89 mdash 1 9 mdash 2Colorado 279 238 579 279 207 N 0 0 N N mdash 1 12 mdash mdashIdahosect mdash 65 314 mdash 69 N 0 0 N N mdash 1 5 mdash 1Montanasect 12 59 87 12 36 N 0 0 N N mdash 1 3 mdash mdashNevadasect 89 177 415 89 110 mdash 0 6 mdash 1 mdash 0 1 mdash mdashNew Mexicosect 194 130 455 194 85 mdash 0 3 mdash mdash mdash 1 23 mdash 1Utah 6 107 253 6 60 mdash 0 3 mdash mdash mdash 0 6 mdash mdashWyomingsect 26 31 58 26 mdash mdash 0 1 mdash mdash mdash 0 4 mdash mdash
Pacific 1200 3663 4231 1200 2377 32 32 159 32 217 1 8 18 1 3Alaska 45 85 137 45 11 N 0 0 N N mdash 0 1 mdash mdashCalifornia 866 2875 3301 866 1876 32 32 159 32 217 mdash 5 14 mdash 1Hawaii 5 103 161 5 56 N 0 0 N N mdash 0 1 mdash mdashOregonsect mdash 191 631 mdash 134 N 0 0 N N 1 1 4 1 2Washington 284 356 634 284 300 N 0 0 N N mdash 1 11 mdash mdash
American Samoa mdash 0 20 mdash mdash N 0 0 N N N 0 0 N NCNMI mdash mdash mdash mdash mdash mdash mdash mdash mdash mdash mdash mdash mdash mdash mdashGuam mdash 4 24 mdash mdash mdash 0 0 mdash mdash mdash 0 0 mdash mdashPuerto Rico 53 116 333 53 mdash N 0 0 N N N 0 0 N NUS Virgin Islands mdash 13 23 mdash 6 mdash 0 0 mdash mdash mdash 0 0 mdash mdash
CNMI Commonwealth of Northern Mariana IslandsU Unavailable mdash No reported cases N Not notifiable Cum Cumulative year-to-date counts Med Median Max Maximum Incidence data for reporting year 2008 and 2009 are provisional Data for HIVAIDS AIDS and TB when available are displayed in Table IV which appears quarterlydagger Chlamydia refers to genital infections caused by Chlamydia trachomatissect Contains data reported through the National Electronic Disease Surveillance System (NEDSS)
14 MMWR January 16 2009
TABLE II (Continued) Provisional cases of selected notifiable diseases United States weeks ending January 10 2009 and January 5 2008 (1st week)
Reporting area
Giardiasis GonorrheaHaemophilus influenzae invasive
All ages all serotypesdagger
Current week
Previous 52 weeks Cum
2009Cum 2008
Current week
Previous 52 weeks Cum
2009Cum 2008
Current week
Previous 52 weeks Cum
2009Cum 2008Med Max Med Max Med Max
United States 84 304 588 84 183 2302 5909 6818 2302 4312 30 46 81 30 58New England 6 24 49 6 22 39 97 171 39 68 1 2 8 1 4
Connecticut mdash 6 14 mdash 7 mdash 50 129 mdash 14 mdash 0 7 mdash mdashMainesect 3 3 12 3 mdash 2 2 6 2 mdash 1 0 2 1 mdashMassachusetts mdash 8 17 mdash 9 31 39 69 31 48 mdash 0 5 mdash 4New Hampshire 2 3 11 2 2 1 2 6 1 mdash mdash 0 1 mdash mdashRhode Islandsect mdash 1 8 mdash 1 4 6 13 4 6 mdash 0 7 mdash mdashVermontsect 1 3 13 1 3 1 0 3 1 mdash mdash 0 3 mdash mdash
Mid Atlantic 12 60 108 12 32 129 621 988 129 319 7 10 18 7 6New Jersey mdash 7 14 mdash 10 mdash 101 167 mdash 68 mdash 1 7 mdash 3New York (Upstate) 8 21 51 8 1 53 117 274 53 mdash 2 3 7 2 mdashNew York City mdash 16 29 mdash 8 mdash 180 633 mdash 91 mdash 1 6 mdash 1Pennsylvania 4 16 46 4 13 76 213 270 76 160 5 4 8 5 2
EN Central 20 48 88 20 50 402 1197 1650 402 1287 4 7 17 4 10Illinois mdash 11 31 mdash 18 12 361 482 12 320 mdash 2 6 mdash 7Indiana N 0 0 N N 114 148 284 114 243 mdash 1 12 mdash mdashMichigan 3 12 22 3 9 248 320 657 248 187 mdash 0 2 mdash mdashOhio 16 17 31 16 16 mdash 277 531 mdash 424 4 2 6 4 1Wisconsin 1 9 20 1 7 28 83 176 28 113 mdash 0 2 mdash 2
WN Central 7 28 143 7 12 24 316 425 24 238 2 3 15 2 7Iowa mdash 6 18 mdash 4 mdash 28 48 mdash 20 mdash 0 1 mdash 1Kansas mdash 3 11 mdash 1 12 40 130 12 26 mdash 0 3 mdash mdashMinnesota mdash 0 106 mdash mdash mdash 55 92 mdash 55 mdash 0 10 mdash mdashMissouri 5 8 22 5 4 mdash 149 199 mdash 113 2 1 6 2 4Nebraskasect 1 4 10 1 3 mdash 25 47 mdash 21 mdash 0 2 mdash 2North Dakota mdash 0 3 mdash mdash mdash 2 6 mdash 3 mdash 0 3 mdash mdashSouth Dakota 1 2 10 1 mdash 12 7 20 12 mdash mdash 0 0 mdash mdash
S Atlantic 20 54 87 20 27 909 1229 2007 909 715 11 12 25 11 17Delaware mdash 1 3 mdash 2 7 20 44 7 14 mdash 0 2 mdash mdashDistrict of Columbia mdash 1 5 mdash mdash 51 52 101 51 28 mdash 0 2 mdash mdashFlorida 18 24 57 18 13 383 447 522 383 318 8 3 9 8 mdashGeorgia mdash 9 27 mdash 8 3 165 442 3 37 mdash 2 9 mdash 9Marylandsect 2 5 12 2 1 85 117 206 85 74 1 2 6 1 4North Carolina N 0 0 N N mdash 0 831 mdash mdash 2 1 9 2 mdashSouth Carolinasect mdash 2 6 mdash 1 265 185 829 265 114 mdash 1 7 mdash 1Virginiasect mdash 7 17 mdash 2 113 182 486 113 123 mdash 1 6 mdash 2West Virginia mdash 1 5 mdash mdash 2 14 26 2 7 mdash 0 3 mdash 1
ES Central 1 8 21 1 2 350 547 837 350 374 1 3 8 1 4Alabamasect mdash 5 12 mdash 2 mdash 172 250 mdash 168 mdash 0 2 mdash 2Kentucky N 0 0 N N 124 89 153 124 51 mdash 0 1 mdash mdashMississippi N 0 0 N N mdash 134 401 mdash 50 mdash 0 2 mdash 1Tennesseesect 1 3 13 1 mdash 226 163 297 226 105 1 2 6 1 1
WS Central 3 7 20 3 1 86 944 1297 86 703 mdash 2 8 mdash mdashArkansassect mdash 2 8 mdash mdash 86 86 167 86 56 mdash 0 2 mdash mdashLouisiana mdash 2 10 mdash mdash mdash 170 317 mdash 63 mdash 0 1 mdash mdashOklahoma 3 2 9 3 1 mdash 56 124 mdash 98 mdash 1 7 mdash mdashTexassect N 0 0 N N mdash 629 763 mdash 486 mdash 0 2 mdash mdash
Mountain 1 27 62 1 8 104 206 337 104 158 3 5 14 3 8Arizona 1 2 8 1 2 43 64 93 43 51 2 2 11 2 1Colorado mdash 10 27 mdash 1 34 57 99 34 38 mdash 1 5 mdash 2Idahosect mdash 3 14 mdash mdash mdash 3 13 mdash 6 mdash 0 4 mdash mdashMontanasect mdash 1 9 mdash mdash mdash 2 7 mdash mdash mdash 0 1 mdash 1Nevadasect mdash 1 8 mdash mdash 8 39 129 8 32 mdash 0 2 mdash 1New Mexicosect mdash 1 7 mdash 3 19 23 47 19 28 mdash 0 4 mdash 3Utah mdash 6 18 mdash 1 mdash 10 20 mdash 3 1 1 5 1 mdashWyomingsect mdash 0 3 mdash 1 mdash 2 9 mdash mdash mdash 0 2 mdash mdash
Pacific 14 53 85 14 29 259 595 759 259 450 1 2 6 1 2Alaska 3 2 10 3 1 10 10 17 10 3 mdash 0 2 mdash mdashCalifornia 9 34 56 9 21 201 497 633 201 363 mdash 0 3 mdash 1Hawaii mdash 1 4 mdash 1 2 11 22 2 7 mdash 0 2 mdash mdashOregonsect 2 8 18 2 6 mdash 23 48 mdash 35 1 1 4 1 1Washington mdash 8 34 mdash mdash 46 53 90 46 42 mdash 0 2 mdash mdash
American Samoa mdash 0 0 mdash mdash mdash 0 1 mdash mdash mdash 0 0 mdash mdashCNMI mdash mdash mdash mdash mdash mdash mdash mdash mdash mdash mdash mdash mdash mdash mdashGuam mdash 0 0 mdash mdash mdash 1 15 mdash mdash mdash 0 0 mdash mdashPuerto Rico mdash 2 13 mdash mdash 1 5 25 1 mdash mdash 0 0 mdash mdashUS Virgin Islands mdash 0 0 mdash mdash mdash 2 6 mdash mdash N 0 0 N N
CNMI Commonwealth of Northern Mariana IslandsU Unavailable mdash No reported cases N Not notifiable Cum Cumulative year-to-date counts Med Median Max Maximum Incidence data for reporting year 2008 and 2009 are provisional dagger Data for H influenzae (age lt5 yrs for serotype b nonserotype b and unknown serotype) are available in Table Isect Contains data reported through the National Electronic Disease Surveillance System (NEDSS)
Vol 58 No 1 MMWR 15
TABLE II (Continued) Provisional cases of selected notifiable diseases United States weeks ending January 10 2009 and January 5 2008 (1st week)
Reporting area
Hepatitis (viral acute) by typedagger
LegionellosisA B
Current week
Previous 52 weeks Cum
2009Cum 2008
Current week
Previous 52 weeks Cum
2009Cum 2008
Current week
Previous 52 weeks Cum
2009Cum 2008Med Max Med Max Med Max
United States 12 45 76 12 37 34 66 92 34 45 20 44 145 20 32New England mdash 2 7 mdash 1 mdash 1 7 mdash mdash mdash 2 16 mdash 1
Connecticut mdash 0 4 mdash mdash mdash 0 7 mdash mdash mdash 0 5 mdash mdashMainesect mdash 0 2 mdash mdash mdash 0 2 mdash mdash mdash 0 2 mdash mdashMassachusetts mdash 0 5 mdash 1 mdash 0 1 mdash mdash mdash 0 2 mdash mdashNew Hampshire mdash 0 2 mdash mdash mdash 0 2 mdash mdash mdash 0 5 mdash mdashRhode Islandsect mdash 0 2 mdash mdash mdash 0 1 mdash mdash mdash 0 14 mdash mdashVermontsect mdash 0 1 mdash mdash mdash 0 1 mdash mdash mdash 0 1 mdash 1
Mid Atlantic mdash 6 12 mdash 6 2 9 14 2 10 5 14 59 5 8New Jersey mdash 1 4 mdash mdash mdash 2 7 mdash 5 mdash 1 8 mdash 1New York (Upstate) mdash 1 4 mdash mdash mdash 1 6 mdash mdash 3 5 19 3 mdashNew York City mdash 2 6 mdash 3 mdash 2 6 mdash mdash mdash 2 12 mdash 2Pennsylvania mdash 1 6 mdash 3 2 3 8 2 5 2 6 33 2 5
EN Central 3 6 16 3 5 13 8 13 13 8 7 8 40 7 11Illinois mdash 2 10 mdash 1 mdash 2 6 mdash 3 mdash 1 10 mdash 3Indiana mdash 0 4 mdash mdash mdash 1 4 mdash mdash 1 1 6 1 mdashMichigan mdash 2 7 mdash 3 1 2 6 1 1 1 2 16 1 4Ohio 3 1 4 3 1 12 2 8 12 3 5 3 18 5 4Wisconsin mdash 0 2 mdash mdash mdash 0 1 mdash 1 mdash 0 3 mdash mdash
WN Central mdash 4 16 mdash 8 1 2 7 1 1 mdash 2 9 mdash mdashIowa mdash 1 7 mdash 4 mdash 0 2 mdash mdash mdash 0 2 mdash mdashKansas mdash 0 3 mdash 1 mdash 0 3 mdash mdash mdash 0 1 mdash mdashMinnesota mdash 0 8 mdash mdash mdash 0 4 mdash mdash mdash 0 4 mdash mdashMissouri mdash 1 3 mdash mdash 1 1 4 1 1 mdash 1 7 mdash mdashNebraskasect mdash 0 5 mdash 2 mdash 0 2 mdash mdash mdash 0 4 mdash mdashNorth Dakota mdash 0 0 mdash mdash mdash 0 1 mdash mdash mdash 0 0 mdash mdashSouth Dakota mdash 0 1 mdash 1 mdash 0 0 mdash mdash mdash 0 1 mdash mdash
S Atlantic 6 7 14 6 5 9 17 34 9 13 4 8 22 4 7Delaware mdash 0 1 mdash mdash mdash 0 3 mdash mdash mdash 0 2 mdash mdashDistrict of Columbia U 0 0 U U U 0 0 U U mdash 0 2 mdash 1Florida 4 2 8 4 1 5 6 12 5 2 1 3 7 1 2Georgia 1 1 4 1 1 4 3 8 4 3 mdash 0 4 mdash mdashMarylandsect 1 1 3 1 2 mdash 2 4 mdash 2 3 2 10 3 4North Carolina mdash 0 9 mdash mdash mdash 0 17 mdash mdash mdash 0 7 mdash mdashSouth Carolinasect mdash 0 3 mdash mdash mdash 1 6 mdash 2 mdash 0 2 mdash mdashVirginiasect mdash 1 5 mdash 1 mdash 2 7 mdash 1 mdash 1 4 mdash mdashWest Virginia mdash 0 1 mdash mdash mdash 1 4 mdash 3 mdash 0 3 mdash mdash
ES Central 1 1 9 1 1 2 7 13 2 2 2 2 10 2 3Alabamasect mdash 0 2 mdash mdash mdash 2 6 mdash 1 mdash 0 2 mdash mdashKentucky mdash 0 3 mdash 1 mdash 2 5 mdash mdash 1 1 4 1 3Mississippi mdash 0 2 mdash mdash 1 1 3 1 mdash mdash 0 1 mdash mdashTennesseesect 1 0 6 1 mdash 1 3 8 1 1 1 0 5 1 mdash
WS Central mdash 3 12 mdash mdash 2 12 23 2 1 mdash 1 9 mdash mdashArkansassect mdash 0 1 mdash mdash mdash 0 4 mdash mdash mdash 0 2 mdash mdashLouisiana mdash 0 1 mdash mdash mdash 1 4 mdash 1 mdash 0 2 mdash mdashOklahoma mdash 0 3 mdash mdash mdash 2 8 mdash mdash mdash 0 6 mdash mdashTexassect mdash 3 11 mdash mdash 2 8 19 2 mdash mdash 1 5 mdash mdash
Mountain 1 4 12 1 1 1 4 12 1 4 2 2 8 2 1Arizona 1 2 11 1 1 mdash 1 5 mdash 1 2 0 2 2 1Colorado mdash 0 3 mdash mdash mdash 0 3 mdash 2 mdash 0 2 mdash mdashIdahosect mdash 0 3 mdash mdash mdash 0 2 mdash mdash mdash 0 1 mdash mdashMontanasect mdash 0 1 mdash mdash mdash 0 1 mdash mdash mdash 0 1 mdash mdashNevadasect mdash 0 3 mdash mdash mdash 0 3 mdash mdash mdash 0 2 mdash mdashNew Mexicosect mdash 0 3 mdash mdash mdash 0 2 mdash 1 mdash 0 1 mdash mdashUtah mdash 0 2 mdash mdash 1 0 3 1 mdash mdash 0 2 mdash mdashWyomingsect mdash 0 1 mdash mdash mdash 0 1 mdash mdash mdash 0 0 mdash mdash
Pacific 1 10 24 1 10 4 7 17 4 6 mdash 4 10 mdash 1Alaska mdash 0 1 mdash mdash 1 0 2 1 mdash mdash 0 1 mdash mdashCalifornia 1 7 24 1 9 3 5 13 3 4 mdash 3 8 mdash 1Hawaii mdash 0 2 mdash mdash mdash 0 1 mdash 1 mdash 0 1 mdash mdashOregonsect mdash 0 3 mdash 1 mdash 1 3 mdash 1 mdash 0 2 mdash mdashWashington mdash 1 5 mdash mdash mdash 1 4 mdash mdash mdash 0 3 mdash mdash
American Samoa mdash 0 0 mdash mdash mdash 0 0 mdash mdash N 0 0 N NCNMI mdash mdash mdash mdash mdash mdash mdash mdash mdash mdash mdash mdash mdash mdash mdashGuam mdash 0 0 mdash mdash mdash 0 0 mdash mdash mdash 0 0 mdash mdashPuerto Rico mdash 0 2 mdash mdash mdash 0 5 mdash 1 mdash 0 1 mdash mdashUS Virgin Islands mdash 0 0 mdash mdash mdash 0 0 mdash mdash mdash 0 0 mdash mdash
CNMI Commonwealth of Northern Mariana IslandsU Unavailable mdash No reported cases N Not notifiable Cum Cumulative year-to-date counts Med Median Max Maximum Incidence data for reporting year 2008 and 2009 are provisional dagger Data for acute hepatitis C viral are available in Table Isect Contains data reported through the National Electronic Disease Surveillance System (NEDSS)
16 MMWR January 16 2009
TABLE II (Continued) Provisional cases of selected notifiable diseases United States weeks ending January 10 2009 and January 5 2008 (1st week)
Reporting area
Lyme disease MalariaMeningococcal disease invasivedagger
All serotypes
Current week
Previous 52 weeks Cum
2009Cum 2008
Current week
Previous 52 weeks Cum
2009Cum 2008
Current week
Previous 52 weeks Cum
2009Cum 2008Med Max Med Max Med Max
United States 56 440 1455 56 128 5 20 44 5 10 7 19 47 7 21New England 1 43 260 1 23 mdash 0 6 mdash 1 mdash 0 3 mdash 1
Connecticut mdash 0 0 mdash mdash mdash 0 3 mdash mdash mdash 0 1 mdash mdashMainesect mdash 3 73 mdash mdash mdash 0 1 mdash mdash mdash 0 1 mdash mdashMassachusetts mdash 11 114 mdash 16 mdash 0 2 mdash 1 mdash 0 3 mdash 1New Hampshire mdash 13 141 mdash 7 mdash 0 2 mdash mdash mdash 0 0 mdash mdashRhode Islandsect mdash 0 0 mdash mdash mdash 0 1 mdash mdash mdash 0 0 mdash mdashVermontsect 1 3 40 1 mdash mdash 0 1 mdash mdash mdash 0 0 mdash mdash
Mid Atlantic 15 245 1003 15 73 mdash 4 14 mdash 4 mdash 2 6 mdash 1New Jersey mdash 31 211 mdash 27 mdash 0 0 mdash mdash mdash 0 2 mdash 1New York (Upstate) 2 99 497 2 4 mdash 0 5 mdash mdash mdash 0 3 mdash mdashNew York City mdash 0 4 mdash 2 mdash 3 10 mdash 4 mdash 0 2 mdash mdashPennsylvania 13 84 531 13 40 mdash 1 3 mdash mdash mdash 1 5 mdash mdash
EN Central mdash 11 145 mdash 7 1 2 7 1 2 2 3 9 2 4Illinois mdash 0 11 mdash mdash mdash 1 6 mdash 1 mdash 1 5 mdash 3Indiana mdash 0 8 mdash mdash mdash 0 2 mdash mdash mdash 0 4 mdash mdashMichigan mdash 1 10 mdash 1 mdash 0 2 mdash mdash mdash 0 3 mdash 1Ohio mdash 1 5 mdash mdash 1 0 3 1 1 2 1 4 2 mdashWisconsin mdash 10 129 mdash 6 mdash 0 3 mdash mdash mdash 0 2 mdash mdash
WN Central mdash 8 156 mdash mdash mdash 1 10 mdash mdash mdash 2 8 mdash 1Iowa mdash 1 8 mdash mdash mdash 0 3 mdash mdash mdash 0 3 mdash 1Kansas mdash 0 1 mdash mdash mdash 0 2 mdash mdash mdash 0 2 mdash mdashMinnesota mdash 4 152 mdash mdash mdash 0 8 mdash mdash mdash 0 7 mdash mdashMissouri mdash 0 1 mdash mdash mdash 0 3 mdash mdash mdash 0 3 mdash mdashNebraskasect mdash 0 2 mdash mdash mdash 0 2 mdash mdash mdash 0 1 mdash mdashNorth Dakota mdash 0 1 mdash mdash mdash 0 0 mdash mdash mdash 0 1 mdash mdashSouth Dakota mdash 0 1 mdash mdash mdash 0 0 mdash mdash mdash 0 1 mdash mdash
S Atlantic 35 66 219 35 23 1 5 15 1 1 3 2 10 3 3Delaware 3 12 37 3 5 mdash 0 1 mdash mdash mdash 0 1 mdash mdashDistrict of Columbia mdash 2 11 mdash mdash mdash 0 2 mdash mdash mdash 0 0 mdash mdashFlorida 3 2 10 3 1 mdash 1 7 mdash mdash 1 1 3 1 2Georgia mdash 0 3 mdash mdash mdash 1 5 mdash 1 mdash 0 2 mdash mdashMarylandsect 29 29 158 29 13 mdash 1 7 mdash mdash mdash 0 4 mdash mdashNorth Carolina mdash 0 7 mdash mdash 1 0 7 1 mdash 1 0 3 1 mdashSouth Carolinasect mdash 0 2 mdash mdash mdash 0 1 mdash mdash mdash 0 3 mdash 1Virginiasect mdash 13 52 mdash 4 mdash 1 3 mdash mdash 1 0 2 1 mdashWest Virginia mdash 1 11 mdash mdash mdash 0 0 mdash mdash mdash 0 1 mdash mdash
ES Central mdash 0 5 mdash mdash mdash 0 2 mdash mdash mdash 1 6 mdash 2Alabamasect mdash 0 3 mdash mdash mdash 0 1 mdash mdash mdash 0 2 mdash mdashKentucky mdash 0 2 mdash mdash mdash 0 1 mdash mdash mdash 0 2 mdash 1Mississippi mdash 0 1 mdash mdash mdash 0 1 mdash mdash mdash 0 2 mdash mdashTennesseesect mdash 0 3 mdash mdash mdash 0 2 mdash mdash mdash 0 3 mdash 1
WS Central mdash 2 8 mdash mdash mdash 1 11 mdash mdash mdash 2 7 mdash 2Arkansassect mdash 0 0 mdash mdash mdash 0 0 mdash mdash mdash 0 2 mdash mdashLouisiana mdash 0 1 mdash mdash mdash 0 1 mdash mdash mdash 0 3 mdash 1Oklahoma mdash 0 0 mdash mdash mdash 0 2 mdash mdash mdash 0 3 mdash 1Texassect mdash 2 8 mdash mdash mdash 1 11 mdash mdash mdash 1 5 mdash mdash
Mountain 1 0 4 1 mdash mdash 0 3 mdash 1 1 1 4 1 4Arizona mdash 0 2 mdash mdash mdash 0 2 mdash mdash mdash 0 2 mdash mdashColorado mdash 0 1 mdash mdash mdash 0 1 mdash 1 mdash 0 1 mdash mdashIdahosect mdash 0 2 mdash mdash mdash 0 1 mdash mdash mdash 0 1 mdash mdashMontanasect mdash 0 1 mdash mdash mdash 0 0 mdash mdash mdash 0 1 mdash mdashNevadasect mdash 0 2 mdash mdash mdash 0 3 mdash mdash 1 0 1 1 1New Mexicosect mdash 0 2 mdash mdash mdash 0 1 mdash mdash mdash 0 1 mdash mdashUtah 1 0 1 1 mdash mdash 0 1 mdash mdash mdash 0 1 mdash 3Wyomingsect mdash 0 1 mdash mdash mdash 0 0 mdash mdash mdash 0 1 mdash mdash
Pacific 4 5 11 4 2 3 2 10 3 1 1 5 19 1 3Alaska mdash 0 2 mdash mdash mdash 0 2 mdash mdash mdash 0 2 mdash mdashCalifornia 4 3 10 4 2 2 2 8 2 mdash 1 3 19 1 2Hawaii N 0 0 N N mdash 0 1 mdash mdash mdash 0 1 mdash mdashOregonsect mdash 1 4 mdash mdash 1 0 2 1 1 mdash 1 3 mdash 1Washington mdash 0 4 mdash mdash mdash 0 3 mdash mdash mdash 0 3 mdash mdash
American Samoa N 0 0 N N mdash 0 0 mdash mdash mdash 0 0 mdash mdashCNMI mdash mdash mdash mdash mdash mdash mdash mdash mdash mdash mdash mdash mdash mdash mdashGuam mdash 0 0 mdash mdash mdash 0 2 mdash mdash mdash 0 0 mdash mdashPuerto Rico N 0 0 N N 1 0 1 1 mdash mdash 0 1 mdash mdashUS Virgin Islands N 0 0 N N mdash 0 0 mdash mdash mdash 0 0 mdash mdash
CNMI Commonwealth of Northern Mariana IslandsU Unavailable mdash No reported cases N Not notifiable Cum Cumulative year-to-date counts Med Median Max Maximum Incidence data for reporting year 2008 and 2009 are provisional dagger Data for meningococcal disease invasive caused by serogroups A C Y and W-135 serogroup B other serogroup and unknown serogroup are available in Table Isect Contains data reported through the National Electronic Disease Surveillance System (NEDSS)
Vol 58 No 1 MMWR 17
TABLE II (Continued) Provisional cases of selected notifiable diseases United States weeks ending January 10 2009 and January 5 2008 (1st week)
Reporting area
Pertussis Rabies animal Rocky Mountain spotted fever
Current week
Previous 52 weeks
Cum 2009
Cum 2008
Current week
Previous 52 weeks
Cum 2009
Cum 2008
Current week
Previous 52 weeks
Cum 2009
Cum 2008Med Max Med Max Med Max
United States 89 182 351 89 96 19 102 168 19 37 2 31 145 2 5New England mdash 11 32 mdash 35 mdash 7 20 mdash mdash mdash 0 2 mdash mdash
Connecticut mdash 0 4 mdash 3 mdash 4 17 mdash mdash mdash 0 0 mdash mdashMainedagger mdash 0 5 mdash mdash mdash 1 5 mdash mdash N 0 0 N NMassachusetts mdash 7 24 mdash 32 N 0 0 N N mdash 0 1 mdash mdashNew Hampshire mdash 1 4 mdash mdash mdash 0 3 mdash mdash mdash 0 1 mdash mdashRhode Islanddagger mdash 1 7 mdash mdash N 0 0 N N mdash 0 2 mdash mdashVermontdagger mdash 0 2 mdash mdash mdash 1 6 mdash mdash mdash 0 0 mdash mdash
Mid Atlantic 5 20 42 5 7 4 33 67 4 12 mdash 1 5 mdash 2New Jersey mdash 1 6 mdash 2 mdash 0 0 mdash mdash mdash 0 2 mdash 1New York (Upstate) 1 7 24 1 mdash 4 9 20 4 8 mdash 0 2 mdash mdashNew York City mdash 0 5 mdash 2 mdash 0 2 mdash 1 mdash 0 2 mdash 1Pennsylvania 4 8 35 4 3 mdash 21 52 mdash 3 mdash 0 2 mdash mdash
EN Central 29 31 189 29 19 1 3 28 1 1 mdash 1 15 mdash mdashIllinois mdash 6 43 mdash 1 1 1 21 1 1 mdash 1 10 mdash mdashIndiana 1 1 27 1 mdash mdash 0 2 mdash mdash mdash 0 3 mdash mdashMichigan 2 6 14 2 1 mdash 0 8 mdash mdash mdash 0 1 mdash mdashOhio 26 10 176 26 15 mdash 1 7 mdash mdash mdash 0 4 mdash mdashWisconsin mdash 2 7 mdash 2 N 0 0 N N mdash 0 1 mdash mdash
WN Central 30 17 120 30 9 mdash 3 13 mdash mdash mdash 4 32 mdash 1Iowa mdash 2 20 mdash 5 mdash 0 5 mdash mdash mdash 0 2 mdash mdashKansas mdash 1 13 mdash mdash mdash 0 0 mdash mdash mdash 0 0 mdash mdashMinnesota mdash 2 26 mdash mdash mdash 0 10 mdash mdash mdash 0 0 mdash mdashMissouri 28 6 50 28 2 mdash 1 8 mdash mdash mdash 4 31 mdash 1Nebraskadagger 2 2 35 2 1 mdash 0 0 mdash mdash mdash 0 4 mdash mdashNorth Dakota mdash 0 1 mdash mdash mdash 0 7 mdash mdash mdash 0 0 mdash mdashSouth Dakota mdash 0 7 mdash 1 mdash 0 2 mdash mdash mdash 0 1 mdash mdash
S Atlantic 16 17 44 16 7 11 37 101 11 21 2 12 71 2 1Delaware mdash 0 3 mdash mdash mdash 0 0 mdash mdash mdash 0 5 mdash mdashDistrict of Columbia mdash 0 1 mdash 1 mdash 0 0 mdash mdash mdash 0 2 mdash mdashFlorida 7 5 20 7 1 7 0 77 7 mdash mdash 0 3 mdash mdashGeorgia mdash 1 7 mdash 1 mdash 5 42 mdash 4 mdash 1 8 mdash mdashMarylanddagger 5 2 8 5 3 mdash 8 17 mdash 8 mdash 1 7 mdash 1North Carolina mdash 0 15 mdash mdash 4 9 16 4 7 2 3 55 2 mdashSouth Carolinadagger 4 2 11 4 mdash mdash 0 0 mdash mdash mdash 1 9 mdash mdashVirginiadagger mdash 3 10 mdash 1 mdash 11 24 mdash 2 mdash 2 15 mdash mdashWest Virginia mdash 0 2 mdash mdash mdash 1 9 mdash mdash mdash 0 1 mdash mdash
ES Central 3 7 28 3 7 mdash 3 7 mdash mdash mdash 3 23 mdash mdashAlabamadagger mdash 1 5 mdash 2 mdash 0 0 mdash mdash mdash 1 8 mdash mdashKentucky 2 2 11 2 mdash mdash 0 4 mdash mdash mdash 0 1 mdash mdashMississippi mdash 2 5 mdash 5 mdash 0 1 mdash mdash mdash 0 3 mdash mdashTennesseedagger 1 1 14 1 mdash mdash 2 6 mdash mdash mdash 2 19 mdash mdash
WS Central 1 28 113 1 mdash mdash 1 11 mdash mdash mdash 1 41 mdash mdashArkansasdagger mdash 1 19 mdash mdash mdash 0 6 mdash mdash mdash 0 14 mdash mdashLouisiana mdash 1 7 mdash mdash mdash 0 0 mdash mdash mdash 0 1 mdash mdashOklahoma mdash 0 21 mdash mdash mdash 0 10 mdash mdash mdash 0 26 mdash mdashTexasdagger 1 26 108 1 mdash mdash 0 1 mdash mdash mdash 1 6 mdash mdash
Mountain 2 15 34 2 8 mdash 1 8 mdash 2 mdash 1 3 mdash 1Arizona mdash 4 10 mdash 1 N 0 0 N N mdash 0 2 mdash mdashColorado mdash 3 7 mdash 6 mdash 0 0 mdash mdash mdash 0 1 mdash mdashIdahodagger 1 0 5 1 mdash mdash 0 0 mdash mdash mdash 0 1 mdash mdashMontanadagger mdash 1 11 mdash mdash mdash 0 2 mdash mdash mdash 0 1 mdash mdashNevadadagger mdash 0 7 mdash 1 mdash 0 4 mdash mdash mdash 0 2 mdash mdashNew Mexicodagger mdash 1 8 mdash mdash mdash 0 3 mdash 2 mdash 0 1 mdash 1Utah 1 4 17 1 mdash mdash 0 6 mdash mdash mdash 0 1 mdash mdashWyomingdagger mdash 0 2 mdash mdash mdash 0 3 mdash mdash mdash 0 2 mdash mdash
Pacific 3 25 83 3 4 3 3 13 3 1 mdash 0 1 mdash mdashAlaska 3 3 21 3 mdash 2 0 4 2 mdash N 0 0 N NCalifornia mdash 8 23 mdash mdash 1 3 12 1 1 mdash 0 1 mdash mdashHawaii mdash 0 2 mdash mdash mdash 0 0 mdash mdash N 0 0 N NOregondagger mdash 3 10 mdash 4 mdash 0 4 mdash mdash mdash 0 1 mdash mdashWashington mdash 6 63 mdash mdash mdash 0 0 mdash mdash N 0 0 N N
American Samoa mdash 0 0 mdash mdash N 0 0 N N N 0 0 N NCNMI mdash mdash mdash mdash mdash mdash mdash mdash mdash mdash mdash mdash mdash mdash mdashGuam mdash 0 0 mdash mdash mdash 0 0 mdash mdash N 0 0 N NPuerto Rico mdash 0 0 mdash mdash mdash 1 5 mdash mdash N 0 0 N NUS Virgin Islands mdash 0 0 mdash mdash N 0 0 N N N 0 0 N N
CNMI Commonwealth of Northern Mariana IslandsU Unavailable mdash No reported cases N Not notifiable Cum Cumulative year-to-date counts Med Median Max Maximum Incidence data for reporting year 2008 and 2009 are provisional dagger Contains data reported through the National Electronic Disease Surveillance System (NEDSS)
18 MMWR January 16 2009
TABLE II (Continued) Provisional cases of selected notifiable diseases United States weeks ending January 10 2009 and January 5 2008 (1st week)
Reporting area
Salmonellosis Shiga toxin-producing E coli (STEC)dagger Shigellosis
Current week
Previous 52 weeks Cum
2009Cum 2008
Current week
Previous 52 weeks Cum
2009Cum 2008
Current week
Previous 52 weeks Cum
2009Cum 2008Med Max Med Max Med Max
United States 336 839 1493 336 883 28 82 251 28 72 187 421 609 187 244New England 1 19 63 1 513 mdash 3 14 mdash 47 mdash 2 7 mdash 39
Connecticut mdash 0 0 mdash 484 mdash 0 0 mdash 44 mdash 0 0 mdash 38Mainesect mdash 3 8 mdash mdash mdash 0 3 mdash 1 mdash 0 6 mdash mdashMassachusetts mdash 14 52 mdash 23 mdash 1 11 mdash 2 mdash 1 5 mdash 1New Hampshire mdash 2 10 mdash 4 mdash 1 3 mdash mdash mdash 0 1 mdash mdashRhode Islandsect mdash 2 9 mdash 1 mdash 0 3 mdash mdash mdash 0 1 mdash mdashVermontsect 1 1 7 1 1 mdash 0 3 mdash mdash mdash 0 2 mdash mdash
Mid Atlantic 13 88 177 13 48 1 6 192 1 2 6 44 96 6 24New Jersey mdash 13 30 mdash 15 mdash 0 3 mdash 1 mdash 12 38 mdash 14New York (Upstate) 5 26 60 5 3 1 3 188 1 mdash mdash 10 35 mdash mdashNew York City mdash 23 53 mdash 10 mdash 1 5 mdash mdash mdash 13 35 mdash 5Pennsylvania 8 27 78 8 20 mdash 1 8 mdash 1 6 3 23 6 5
EN Central 31 91 193 31 76 1 11 74 1 9 41 78 121 41 44Illinois mdash 26 72 mdash 25 mdash 1 10 mdash mdash mdash 19 34 mdash 16Indiana mdash 9 53 mdash mdash mdash 1 14 mdash mdash 1 10 39 1 5Michigan 3 17 38 3 12 mdash 2 43 mdash 4 mdash 3 20 mdash 1Ohio 28 26 65 28 24 1 3 17 1 mdash 40 40 80 40 17Wisconsin mdash 14 50 mdash 15 mdash 4 20 mdash 5 mdash 8 33 mdash 5
WN Central 19 49 151 19 13 2 12 59 2 3 2 16 39 2 5Iowa mdash 8 16 mdash 4 mdash 2 21 mdash 3 mdash 3 11 mdash mdashKansas 3 7 31 3 1 1 1 7 1 mdash 1 1 5 1 mdashMinnesota mdash 13 70 mdash mdash mdash 3 21 mdash mdash mdash 5 25 mdash mdashMissouri 13 14 48 13 7 1 2 11 1 mdash 1 3 14 1 4Nebraskasect 2 4 13 2 1 mdash 2 29 mdash mdash mdash 0 3 mdash mdashNorth Dakota mdash 0 7 mdash mdash mdash 0 1 mdash mdash mdash 0 5 mdash mdashSouth Dakota 1 2 9 1 mdash mdash 1 4 mdash mdash mdash 0 9 mdash 1
S Atlantic 191 241 457 191 113 19 13 50 19 7 54 58 100 54 48Delaware mdash 2 9 mdash mdash mdash 0 2 mdash 1 mdash 0 1 mdash mdashDistrict of Columbia mdash 1 4 mdash 1 mdash 0 1 mdash 1 mdash 0 3 mdash mdashFlorida 68 100 174 68 68 7 2 11 7 4 12 14 34 12 26Georgia 18 42 86 18 13 mdash 1 7 mdash mdash 10 20 48 10 14Marylandsect 8 13 36 8 10 3 2 10 3 mdash 5 2 8 5 1North Carolina 92 23 106 92 mdash 9 1 19 9 mdash 26 3 27 26 mdashSouth Carolinasect 5 18 55 5 6 mdash 1 4 mdash mdash 1 9 32 1 6Virginiasect mdash 18 42 mdash 3 mdash 3 25 mdash mdash mdash 4 26 mdash 1West Virginia mdash 3 6 mdash 12 mdash 0 3 mdash 1 mdash 0 3 mdash mdash
ES Central 14 58 138 14 34 mdash 5 21 mdash 4 6 35 67 6 47Alabamasect mdash 14 47 mdash 15 mdash 1 17 mdash 2 mdash 7 18 mdash 14Kentucky 8 9 18 8 7 mdash 1 7 mdash 1 1 3 24 1 7Mississippi mdash 14 57 mdash 7 mdash 0 2 mdash mdash mdash 5 18 mdash 17Tennesseesect 6 14 60 6 5 mdash 2 7 mdash 1 5 17 44 5 9
WS Central 1 128 265 1 9 mdash 6 27 mdash mdash 51 92 215 51 5Arkansassect mdash 11 40 mdash mdash mdash 1 3 mdash mdash mdash 11 27 mdash mdashLouisiana mdash 17 50 mdash 6 mdash 0 1 mdash mdash mdash 11 25 mdash 4Oklahoma 1 14 36 1 mdash mdash 1 19 mdash mdash mdash 3 11 mdash mdashTexassect mdash 91 179 mdash 3 mdash 5 12 mdash mdash 51 62 188 51 1
Mountain 11 59 110 11 34 mdash 10 39 mdash mdash 18 20 53 18 13Arizona 6 19 45 6 12 mdash 1 5 mdash mdash 14 10 34 14 9Colorado mdash 12 43 mdash 5 mdash 3 18 mdash mdash mdash 2 11 mdash 1Idahosect 2 3 14 2 2 mdash 2 15 mdash mdash mdash 0 2 mdash mdashMontanasect mdash 2 8 mdash mdash mdash 0 3 mdash mdash mdash 0 1 mdash mdashNevadasect 3 3 9 3 5 mdash 0 2 mdash mdash 4 4 13 4 mdashNew Mexicosect mdash 6 33 mdash 7 mdash 1 6 mdash mdash mdash 1 10 mdash 2Utah mdash 6 19 mdash mdash mdash 1 9 mdash mdash mdash 1 3 mdash mdashWyomingsect mdash 1 4 mdash 3 mdash 0 1 mdash mdash mdash 0 1 mdash 1
Pacific 55 112 523 55 43 5 10 48 5 mdash 9 29 82 9 19Alaska 1 1 4 1 1 mdash 0 1 mdash mdash mdash 0 1 mdash mdashCalifornia 44 81 507 44 28 5 6 39 5 mdash 7 26 74 7 14Hawaii 8 4 15 8 5 mdash 0 2 mdash mdash mdash 1 3 mdash 2Oregonsect 2 7 20 2 9 mdash 1 8 mdash mdash 2 1 10 2 3Washington mdash 12 71 mdash mdash mdash 2 15 mdash mdash mdash 2 9 mdash mdash
American Samoa mdash 0 1 mdash mdash mdash 0 0 mdash mdash mdash 0 0 mdash 1CNMI mdash mdash mdash mdash mdash mdash mdash mdash mdash mdash mdash mdash mdash mdash mdashGuam mdash 0 2 mdash mdash mdash 0 0 mdash mdash mdash 0 3 mdash mdashPuerto Rico mdash 10 29 mdash 6 mdash 0 1 mdash mdash mdash 0 4 mdash mdashUS Virgin Islands mdash 0 0 mdash mdash mdash 0 0 mdash mdash mdash 0 0 mdash mdash
CNMI Commonwealth of Northern Mariana IslandsU Unavailable mdash No reported cases N Not notifiable Cum Cumulative year-to-date counts Med Median Max Maximum Incidence data for reporting year 2008 and 2009 are provisional dagger Includes E coli O157H7 Shiga toxin-positive serogroup non-O157 and Shiga toxin-positive not serogroupedsect Contains data reported through the National Electronic Disease Surveillance System (NEDSS)
Vol 58 No 1 MMWR 19
TABLE II (Continued) Provisional cases of selected notifiable diseases United States weeks ending January 10 2009 and January 5 2008 (1st week)
Reporting area
Streptococcal diseases invasive group AStreptococcus pneumoniae invasive disease nondrug resistantdagger
Age lt5 years
Current week
Previous 52 weeks Cum
2009Cum 2008
Current week
Previous 52 weeks Cum
2009Cum 2008Med Max Med Max
United States 63 87 181 63 89 15 33 55 15 33New England mdash 5 31 mdash 9 mdash 1 11 mdash 2
Connecticut mdash 0 26 mdash mdash mdash 0 11 mdash mdashMainesect mdash 0 3 mdash mdash mdash 0 1 mdash mdashMassachusetts mdash 2 8 mdash 7 mdash 0 5 mdash 1New Hampshire mdash 0 2 mdash 2 mdash 0 1 mdash 1Rhode Islandsect mdash 0 9 mdash mdash mdash 0 2 mdash mdashVermontsect mdash 0 3 mdash mdash mdash 0 1 mdash mdash
Mid Atlantic 4 18 43 4 14 1 3 12 1 6New Jersey mdash 2 11 mdash 3 mdash 1 4 mdash 3New York (Upstate) 1 6 17 1 1 1 2 11 1 mdashNew York City mdash 4 10 mdash 4 mdash 0 6 mdash 3Pennsylvania 3 7 16 3 6 N 0 0 N N
EN Central 9 15 42 9 10 5 5 15 5 9Illinois mdash 4 16 mdash 4 mdash 1 5 mdash 3Indiana mdash 2 9 mdash 1 mdash 0 5 mdash mdashMichigan mdash 3 10 mdash 2 1 1 5 1 4Ohio 9 5 14 9 3 4 1 4 4 1Wisconsin mdash 1 10 mdash mdash mdash 1 4 mdash 1
WN Central 5 5 39 5 2 2 2 11 2 4Iowa mdash 0 0 mdash mdash mdash 0 0 mdash mdashKansas 1 0 5 1 mdash 1 0 3 1 mdashMinnesota mdash 0 35 mdash mdash mdash 0 9 mdash mdashMissouri 2 2 10 2 2 1 1 2 1 2Nebraskasect 2 1 3 2 mdash mdash 0 1 mdash 2North Dakota mdash 0 3 mdash mdash mdash 0 2 mdash mdashSouth Dakota mdash 0 2 mdash mdash mdash 0 1 mdash mdash
S Atlantic 28 21 37 28 28 7 6 16 7 4Delaware mdash 0 2 mdash mdash mdash 0 0 mdash mdashDistrict of Columbia mdash 0 4 mdash 2 mdash 0 1 mdash mdashFlorida 9 5 10 9 5 2 1 4 2 mdashGeorgia 9 4 14 9 8 2 1 4 2 mdashMarylandsect 5 4 8 5 6 3 1 5 3 2North Carolina 3 2 10 3 mdash N 0 0 N NSouth Carolinasect 1 1 4 1 5 mdash 1 5 mdash 2Virginiasect 1 3 9 1 1 mdash 0 6 mdash mdashWest Virginia mdash 0 3 mdash 1 mdash 0 1 mdash mdash
ES Central 2 3 9 2 1 mdash 2 6 mdash mdashAlabamasect N 0 0 N N N 0 0 N NKentucky mdash 1 3 mdash mdash N 0 0 N NMississippi N 0 0 N N mdash 0 3 mdash mdashTennesseesect 2 3 6 2 1 mdash 1 5 mdash mdash
WS Central 8 9 27 8 2 mdash 5 13 mdash 1Arkansassect mdash 0 2 mdash mdash mdash 0 2 mdash mdashLouisiana mdash 0 2 mdash 1 mdash 0 2 mdash 1Oklahoma 7 2 8 7 1 mdash 1 3 mdash mdashTexassect 1 6 20 1 mdash mdash 3 13 mdash mdash
Mountain 2 10 20 2 22 mdash 4 13 mdash 7Arizona 2 3 9 2 7 mdash 2 8 mdash 4Colorado mdash 2 8 mdash 6 mdash 1 4 mdash 3Idahosect mdash 0 2 mdash mdash mdash 0 1 mdash mdashMontanasect N 0 0 N N mdash 0 1 mdash mdashNevadasect mdash 0 1 mdash 1 N 0 0 N NNew Mexicosect mdash 1 8 mdash 7 mdash 0 3 mdash mdashUtah mdash 1 4 mdash 1 mdash 0 4 mdash mdashWyomingsect mdash 0 2 mdash mdash mdash 0 1 mdash mdash
Pacific 5 3 8 5 1 mdash 0 2 mdash mdashAlaska 1 1 4 1 mdash N 0 0 N NCalifornia mdash 0 0 mdash mdash N 0 0 N NHawaii 4 2 8 4 1 mdash 0 2 mdash mdashOregonsect N 0 0 N N N 0 0 N NWashington N 0 0 N N N 0 0 N N
American Samoa mdash 0 12 mdash mdash N 0 0 N NCNMI mdash mdash mdash mdash mdash mdash mdash mdash mdash mdashGuam mdash 0 0 mdash mdash mdash 0 0 mdash mdashPuerto Rico N 0 0 N N N 0 0 N NUS Virgin Islands mdash 0 0 mdash mdash N 0 0 N N
CNMI Commonwealth of Northern Mariana IslandsU Unavailable mdash No reported cases N Not notifiable Cum Cumulative year-to-date counts Med Median Max Maximum Incidence data for reporting year 2008 and 2009 are provisional dagger Includes cases of invasive pneumococcal disease in children aged lt5 years caused by S pneumoniae which is susceptible or for which susceptibility testing is not available
(NNDSS event code 11717)sect Contains data reported through the National Electronic Disease Surveillance System (NEDSS)
20 MMWR January 16 2009
TABLE II (Continued) Provisional cases of selected notifiable diseases United States weeks ending January 10 2009 and January 5 2008 (1st week)
Reporting area
Streptococcus pneumoniae invasive disease drug resistantdagger
Syphilis primary and secondaryAll ages Aged lt5 years
Current week
Previous 52 weeks Cum
2009Cum 2008
Current week
Previous 52 weeks Cum
2009Cum 2008
Current week
Previous 52 weeks Cum
2009Cum 2008Med Max Med Max Med Max
United States 64 54 105 64 89 4 8 23 4 10 97 238 300 97 164New England 1 1 48 1 2 mdash 0 5 mdash mdash 3 5 14 3 4
Connecticut mdash 0 48 mdash mdash mdash 0 5 mdash mdash mdash 0 3 mdash mdashMainesect mdash 0 2 mdash 1 mdash 0 1 mdash mdash mdash 0 2 mdash mdashMassachusetts mdash 0 0 mdash mdash mdash 0 0 mdash mdash 3 4 11 3 2New Hampshire mdash 0 0 mdash mdash mdash 0 0 mdash mdash mdash 0 2 mdash 1Rhode Islandsect mdash 0 2 mdash mdash mdash 0 1 mdash mdash mdash 0 5 mdash 1Vermontsect 1 0 2 1 1 mdash 0 1 mdash mdash mdash 0 2 mdash mdash
Mid Atlantic mdash 4 13 mdash 7 mdash 0 2 mdash mdash 4 33 53 4 21New Jersey mdash 0 0 mdash mdash mdash 0 0 mdash mdash mdash 4 10 mdash 1New York (Upstate) mdash 1 4 mdash mdash mdash 0 1 mdash mdash mdash 3 7 mdash mdashNew York City mdash 1 6 mdash 1 mdash 0 0 mdash mdash mdash 20 36 mdash 17Pennsylvania mdash 1 9 mdash 6 mdash 0 2 mdash mdash 4 5 12 4 3
EN Central 18 12 41 18 25 1 2 7 1 3 17 22 37 17 33Illinois mdash 0 10 mdash 16 mdash 0 2 mdash 3 1 7 17 1 13Indiana mdash 2 31 mdash mdash mdash 0 5 mdash mdash 1 3 10 1 1Michigan 1 0 3 1 1 mdash 0 1 mdash mdash 4 2 21 4 10Ohio 17 7 17 17 8 1 1 4 1 mdash 10 6 15 10 8Wisconsin mdash 0 0 mdash mdash mdash 0 0 mdash mdash 1 1 4 1 1
WN Central 3 2 9 3 10 mdash 0 2 mdash 1 mdash 8 14 mdash 7Iowa mdash 0 0 mdash mdash mdash 0 0 mdash mdash mdash 0 2 mdash mdashKansas mdash 1 5 mdash 5 mdash 0 1 mdash 1 mdash 0 5 mdash mdashMinnesota mdash 0 0 mdash mdash mdash 0 0 mdash mdash mdash 2 5 mdash 1Missouri 3 1 8 3 5 mdash 0 1 mdash mdash mdash 4 10 mdash 6Nebraskasect mdash 0 0 mdash mdash mdash 0 0 mdash mdash mdash 0 1 mdash mdashNorth Dakota mdash 0 0 mdash mdash mdash 0 0 mdash mdash mdash 0 0 mdash mdashSouth Dakota mdash 0 1 mdash mdash mdash 0 1 mdash mdash mdash 0 1 mdash mdash
S Atlantic 30 21 53 30 35 2 3 13 2 4 47 52 104 47 12Delaware mdash 0 1 mdash mdash mdash 0 0 mdash mdash mdash 0 4 mdash mdashDistrict of Columbia mdash 0 3 mdash mdash mdash 0 1 mdash mdash 8 2 9 8 mdashFlorida 23 13 30 23 20 2 3 12 2 2 13 19 37 13 9Georgia 6 6 23 6 12 mdash 1 5 mdash 2 mdash 12 33 mdash 1Marylandsect 1 0 2 1 mdash mdash 0 1 mdash mdash 4 6 14 4 1North Carolina N 0 0 N N N 0 0 N N 18 5 19 18 mdashSouth Carolinasect mdash 0 0 mdash mdash mdash 0 0 mdash mdash 1 2 6 1 mdashVirginiasect N 0 0 N N N 0 0 N N 3 5 16 3 1West Virginia mdash 1 9 mdash 3 mdash 0 2 mdash mdash mdash 0 1 mdash mdash
ES Central 10 5 19 10 8 1 1 4 1 mdash 13 21 37 13 16Alabamasect N 0 0 N N N 0 0 N N mdash 8 17 mdash 7Kentucky 5 1 6 5 3 1 0 2 1 mdash 1 1 10 1 3Mississippi mdash 0 2 mdash mdash mdash 0 1 mdash mdash mdash 3 19 mdash mdashTennesseesect 5 3 17 5 5 mdash 1 3 mdash mdash 12 8 19 12 6
WS Central 2 2 7 2 2 mdash 0 2 mdash 2 5 41 63 5 31Arkansassect 2 0 4 2 mdash mdash 0 1 mdash mdash 5 2 19 5 1Louisiana mdash 1 6 mdash 2 mdash 0 1 mdash 2 mdash 10 31 mdash 2Oklahoma N 0 0 N N N 0 0 N N mdash 1 5 mdash 5Texassect mdash 0 0 mdash mdash mdash 0 0 mdash mdash mdash 26 47 mdash 23
Mountain mdash 2 14 mdash mdash mdash 0 4 mdash mdash 3 9 16 3 6Arizona mdash 0 0 mdash mdash mdash 0 0 mdash mdash mdash 5 13 mdash 2Colorado mdash 0 0 mdash mdash mdash 0 0 mdash mdash 1 2 7 1 mdashIdahosect N 0 1 N N N 0 1 N N mdash 0 2 mdash mdashMontanasect mdash 0 1 mdash mdash mdash 0 0 mdash mdash mdash 0 7 mdash mdashNevadasect N 0 1 N N N 0 0 N N mdash 1 6 mdash 1New Mexicosect mdash 0 1 mdash mdash mdash 0 0 mdash mdash 2 1 4 2 3Utah mdash 2 13 mdash mdash mdash 0 4 mdash mdash mdash 0 2 mdash mdashWyomingsect mdash 0 1 mdash mdash mdash 0 0 mdash mdash mdash 0 1 mdash mdash
Pacific mdash 0 1 mdash mdash mdash 0 1 mdash mdash 5 44 64 5 34Alaska N 0 0 N N N 0 0 N N mdash 0 1 mdash mdashCalifornia N 0 0 N N N 0 0 N N 3 40 58 3 26Hawaii mdash 0 1 mdash mdash mdash 0 1 mdash mdash mdash 0 2 mdash 1Oregonsect N 0 0 N N N 0 0 N N mdash 0 3 mdash 2Washington N 0 0 N N N 0 0 N N 2 3 9 2 5
American Samoa N 0 0 N N N 0 0 N N mdash 0 0 mdash mdashCNMI mdash mdash mdash mdash mdash mdash mdash mdash mdash mdash mdash mdash mdash mdash mdashGuam mdash 0 0 mdash mdash mdash 0 0 mdash mdash mdash 0 0 mdash mdashPuerto Rico mdash 0 0 mdash mdash mdash 0 0 mdash mdash mdash 3 11 mdash mdashUS Virgin Islands mdash 0 0 mdash mdash mdash 0 0 mdash mdash mdash 0 0 mdash mdash
CNMI Commonwealth of Northern Mariana IslandsU Unavailable mdash No reported cases N Not notifiable Cum Cumulative year-to-date counts Med Median Max Maximum Incidence data for reporting year 2008 and 2009 are provisional dagger Includes cases of invasive pneumococcal disease caused by drug-resistant S pneumoniae (DRSP) (NNDSS event code 11720)sect Contains data reported through the National Electronic Disease Surveillance System (NEDSS)
Vol 58 No 1 MMWR 21
TABLE II (Continued) Provisional cases of selected notifiable diseases United States weeks ending January 10 2009 and January 5 2008 (1st week)
West Nile virus diseasedagger
Reporting area
Varicella (chickenpox) Neuroinvasive Nonneuroinvasivesect
Current week
Previous 52 weeks Cum
2009Cum 2008
Current week
Previous 52 weeks Cum
2009Cum 2008
Current week
Previous 52 weeks Cum
2009Cum 2008Med Max Med Max Med Max
United States 173 508 1001 173 310 mdash 1 76 mdash mdash mdash 1 73 mdash mdashNew England 8 11 22 8 11 mdash 0 2 mdash mdash mdash 0 1 mdash mdash
Connecticut mdash 0 0 mdash mdash mdash 0 2 mdash mdash mdash 0 1 mdash mdashMainepara mdash 0 0 mdash mdash mdash 0 0 mdash mdash mdash 0 0 mdash mdashMassachusetts mdash 0 1 mdash mdash mdash 0 0 mdash mdash mdash 0 0 mdash mdashNew Hampshire 6 5 13 6 7 mdash 0 0 mdash mdash mdash 0 0 mdash mdashRhode Islandpara mdash 0 0 mdash mdash mdash 0 1 mdash mdash mdash 0 0 mdash mdashVermontpara 2 5 17 2 4 mdash 0 0 mdash mdash mdash 0 0 mdash mdash
Mid Atlantic 2 45 81 2 51 mdash 0 8 mdash mdash mdash 0 5 mdash mdashNew Jersey N 0 0 N N mdash 0 1 mdash mdash mdash 0 1 mdash mdashNew York (Upstate) N 0 0 N N mdash 0 5 mdash mdash mdash 0 2 mdash mdashNew York City N 0 0 N N mdash 0 2 mdash mdash mdash 0 2 mdash mdashPennsylvania 2 45 81 2 51 mdash 0 2 mdash mdash mdash 0 1 mdash mdash
EN Central 62 138 312 62 95 mdash 0 8 mdash mdash mdash 0 3 mdash mdashIllinois 4 23 64 4 7 mdash 0 4 mdash mdash mdash 0 2 mdash mdashIndiana mdash 0 0 mdash mdash mdash 0 1 mdash mdash mdash 0 1 mdash mdashMichigan 9 58 116 9 30 mdash 0 4 mdash mdash mdash 0 2 mdash mdashOhio 48 46 106 48 58 mdash 0 3 mdash mdash mdash 0 1 mdash mdashWisconsin 1 4 50 1 mdash mdash 0 2 mdash mdash mdash 0 1 mdash mdash
WN Central 22 21 71 22 11 mdash 0 6 mdash mdash mdash 0 21 mdash mdashIowa N 0 0 N N mdash 0 2 mdash mdash mdash 0 1 mdash mdashKansas 2 6 40 2 3 mdash 0 2 mdash mdash mdash 0 5 mdash mdashMinnesota mdash 0 0 mdash mdash mdash 0 2 mdash mdash mdash 0 4 mdash mdashMissouri 20 10 51 20 8 mdash 0 3 mdash mdash mdash 0 1 mdash mdashNebraskapara N 0 0 N N mdash 0 1 mdash mdash mdash 0 8 mdash mdashNorth Dakota mdash 0 39 mdash mdash mdash 0 2 mdash mdash mdash 0 11 mdash mdashSouth Dakota mdash 0 5 mdash mdash mdash 0 5 mdash mdash mdash 0 6 mdash mdash
S Atlantic 24 86 173 24 89 mdash 0 3 mdash mdash mdash 0 3 mdash mdashDelaware mdash 1 5 mdash mdash mdash 0 0 mdash mdash mdash 0 1 mdash mdashDistrict of Columbia mdash 0 3 mdash 2 mdash 0 0 mdash mdash mdash 0 0 mdash mdashFlorida 21 29 87 21 17 mdash 0 2 mdash mdash mdash 0 0 mdash mdashGeorgia N 0 0 N N mdash 0 1 mdash mdash mdash 0 1 mdash mdashMarylandpara N 0 0 N N mdash 0 2 mdash mdash mdash 0 2 mdash mdashNorth Carolina N 0 0 N N mdash 0 0 mdash mdash mdash 0 0 mdash mdashSouth Carolinapara 1 14 67 1 9 mdash 0 0 mdash mdash mdash 0 1 mdash mdashVirginiapara mdash 21 81 mdash 25 mdash 0 0 mdash mdash mdash 0 1 mdash mdashWest Virginia 2 12 33 2 36 mdash 0 1 mdash mdash mdash 0 0 mdash mdash
ES Central 4 17 101 4 13 mdash 0 7 mdash mdash mdash 0 8 mdash mdashAlabamapara 4 17 101 4 13 mdash 0 3 mdash mdash mdash 0 3 mdash mdashKentucky N 0 0 N N mdash 0 1 mdash mdash mdash 0 0 mdash mdashMississippi mdash 0 2 mdash mdash mdash 0 4 mdash mdash mdash 0 7 mdash mdashTennesseepara N 0 0 N N mdash 0 1 mdash mdash mdash 0 3 mdash mdash
WS Central 47 113 435 47 10 mdash 0 8 mdash mdash mdash 0 7 mdash mdashArkansaspara mdash 9 52 mdash mdash mdash 0 1 mdash mdash mdash 0 1 mdash mdashLouisiana 1 1 10 1 1 mdash 0 3 mdash mdash mdash 0 5 mdash mdashOklahoma N 0 0 N N mdash 0 1 mdash mdash mdash 0 1 mdash mdashTexaspara 46 99 422 46 9 mdash 0 6 mdash mdash mdash 0 4 mdash mdash
Mountain mdash 40 90 mdash 28 mdash 0 12 mdash mdash mdash 0 22 mdash mdashArizona mdash 0 0 mdash mdash mdash 0 10 mdash mdash mdash 0 8 mdash mdashColorado mdash 14 44 mdash 7 mdash 0 4 mdash mdash mdash 0 10 mdash mdashIdahopara N 0 0 N N mdash 0 1 mdash mdash mdash 0 6 mdash mdashMontanapara mdash 5 27 mdash 6 mdash 0 0 mdash mdash mdash 0 2 mdash mdashNevadapara N 0 0 N N mdash 0 2 mdash mdash mdash 0 3 mdash mdashNew Mexicopara mdash 3 18 mdash 5 mdash 0 2 mdash mdash mdash 0 1 mdash mdashUtah mdash 12 55 mdash 9 mdash 0 2 mdash mdash mdash 0 5 mdash mdashWyomingpara mdash 0 4 mdash 1 mdash 0 0 mdash mdash mdash 0 2 mdash mdash
Pacific 4 2 8 4 2 mdash 0 38 mdash mdash mdash 0 24 mdash mdashAlaska 4 1 6 4 1 mdash 0 0 mdash mdash mdash 0 0 mdash mdashCalifornia mdash 0 0 mdash mdash mdash 0 37 mdash mdash mdash 0 19 mdash mdashHawaii mdash 1 5 mdash 1 mdash 0 0 mdash mdash mdash 0 0 mdash mdashOregonpara N 0 0 N N mdash 0 2 mdash mdash mdash 0 4 mdash mdashWashington N 0 0 N N mdash 0 1 mdash mdash mdash 0 1 mdash mdash
American Samoa N 0 0 N N mdash 0 0 mdash mdash mdash 0 0 mdash mdashCNMI mdash mdash mdash mdash mdash mdash mdash mdash mdash mdash mdash mdash mdash mdash mdashGuam mdash 1 17 mdash mdash mdash 0 0 mdash mdash mdash 0 0 mdash mdashPuerto Rico mdash 7 20 mdash 4 mdash 0 0 mdash mdash mdash 0 0 mdash mdashUS Virgin Islands mdash 0 0 mdash mdash mdash 0 0 mdash mdash mdash 0 0 mdash mdash
CNMI Commonwealth of Northern Mariana IslandsU Unavailable mdash No reported cases N Not notifiable Cum Cumulative year-to-date counts Med Median Max Maximum Incidence data for reporting year 2008 and 2009 are provisional dagger Updated weekly from reports to the Division of Vector-Borne Infectious Diseases National Center for Zoonotic Vector-Borne and Enteric Diseases (ArboNET Surveillance)
Data for California serogroup eastern equine Powassan St Louis and western equine diseases are available in Table Isect Not notifiable in all states Data from states where the condition is not notifiable are excluded from this table except starting in 2007 for the domestic arboviral diseases and
influenza-associated pediatric mortality and in 2003 for SARS-CoV Reporting exceptions are available at httpwwwcdcgovepodphsiphsinfdishtmpara Contains data reported through the National Electronic Disease Surveillance System (NEDSS)
22 MMWR January 16 2009
TABLE III Deaths in 122 US cities week ending January 10 2009 (1st week)
Reporting area
All causes by age (years)
PampIdagger Total Reporting area
All causes by age (years)
PampIdagger Total
All Ages gt65 45ndash64 25ndash44 1ndash24 lt1
All Ages gt65 45ndash64 25ndash44 1ndash24 lt1
New England 614 452 118 28 6 10 67 S Atlantic 1534 992 382 96 29 33 102Boston MA 171 116 43 5 3 4 19 Atlanta GA 119 73 29 14 2 1 8Bridgeport CT 11 9 1 1 mdash mdash 1 Baltimore MD 140 92 34 8 3 3 25Cambridge MA 16 12 3 mdash 1 mdash 2 Charlotte NC 140 104 25 8 2 1 5Fall River MA 50 42 6 1 mdash 1 5 Jacksonville FL 260 166 59 17 9 8 16Hartford CT 57 38 14 4 mdash 1 6 Miami FL 95 53 28 5 3 5 9Lowell MA 31 27 4 mdash mdash mdash 5 Norfolk VA 75 51 17 4 2 1 1Lynn MA 12 7 5 mdash mdash mdash 3 Richmond VA 69 43 23 1 1 1 6New Bedford MA 31 28 1 1 mdash 1 2 Savannah GA 74 43 23 6 2 mdash 8New Haven CT U U U U U U U St Petersburg FL 78 49 21 7 mdash 1 6Providence RI 72 52 13 5 1 1 6 Tampa FL 360 252 78 18 5 7 14Somerville MA 4 1 1 2 mdash mdash mdash Washington DC 103 55 37 7 mdash 4 2Springfield MA 43 31 7 4 mdash 1 6 Wilmington DE 21 11 8 1 mdash 1 2Waterbury CT 40 27 8 4 1 mdash 5 ES Central 978 662 215 53 26 22 69Worcester MA 76 62 12 1 mdash 1 7 Birmingham AL 151 105 34 5 3 4 17
Mid Atlantic 2639 1832 586 145 45 31 152 Chattanooga TN 117 86 23 3 1 4 6Albany NY 51 32 15 4 mdash mdash 3 Knoxville TN 140 104 31 5 mdash mdash 10Allentown PA 34 25 9 mdash mdash mdash mdash Lexington KY 65 39 18 7 mdash 1 4Buffalo NY 97 61 29 4 2 1 12 Memphis TN 136 81 33 10 7 5 7Camden NJ 26 9 12 2 1 2 1 Mobile AL 71 52 10 4 5 mdash 5Elizabeth NJ 19 14 3 2 mdash mdash mdash Montgomery AL 73 42 21 7 2 1 5Erie PA 69 55 11 2 1 mdash 3 Nashville TN 225 153 45 12 8 7 15Jersey City NJ 35 26 8 1 mdash mdash 2 WS Central 1847 1158 485 136 33 34 88New York City NY 1416 987 308 86 23 12 63 Austin TX 137 82 40 6 5 4 8Newark NJ 38 19 10 6 2 1 1 Baton Rouge LA 35 27 5 3 mdash mdash mdashPaterson NJ 10 4 5 1 mdash mdash 3 Corpus Christi TX U U U U U U UPhiladelphia PA 315 191 81 27 10 6 15 Dallas TX 238 152 50 21 3 11 16Pittsburgh PAsect 44 32 11 mdash mdash 1 7 El Paso TX 169 114 41 14 mdash mdash 10Reading PA 37 27 7 2 mdash 1 4 Fort Worth TX 209 140 57 5 2 5 3Rochester NY 163 132 23 4 1 3 18 Houston TX 440 252 128 39 13 8 15Schenectady NY 26 24 2 mdash mdash mdash 3 Little Rock AR 118 66 34 14 2 2 2Scranton PA 32 28 4 mdash mdash mdash 1 New Orleans LA U U U U U U USyracuse NY 151 108 34 2 4 3 14 San Antonio TX 263 179 63 17 3 1 24Trenton NJ 36 28 5 2 mdash 1 1 Shreveport LA 60 38 18 4 mdash mdash 3Utica NY 21 16 5 mdash mdash mdash mdash Tulsa OK 178 108 49 13 5 3 7Yonkers NY 19 14 4 mdash 1 mdash 1 Mountain 1092 732 215 100 27 18 81
EN Central 2820 1882 649 164 63 62 181 Albuquerque NM U U U U U U UAkron OH 84 53 23 7 1 mdash 5 Boise ID 56 38 10 4 1 3 3Canton OH 35 26 8 1 mdash mdash 4 Colorado Springs CO 43 26 11 4 1 1 2Chicago IL 341 196 100 30 13 2 24 Denver CO 84 57 18 7 2 mdash 6Cincinnati OH 125 83 22 8 1 11 7 Las Vegas NV 298 189 66 31 9 3 22Cleveland OH 301 219 57 14 4 7 9 Ogden UT 51 41 7 2 1 mdash 2Columbus OH 313 202 80 17 6 8 29 Phoenix AZ 166 100 31 25 6 4 14Dayton OH 190 136 37 13 3 1 12 Pueblo CO 46 31 10 3 1 1 2Detroit MI 259 133 77 28 12 9 15 Salt Lake City UT 147 105 23 13 3 3 7Evansville IN 75 49 18 6 2 mdash 5 Tucson AZ 201 145 39 11 3 3 23Fort Wayne IN 92 66 22 1 1 2 5 Pacific 2146 1534 434 108 49 21 196Gary IN 22 12 7 1 2 mdash 1 Berkeley CA 22 15 6 mdash mdash 1 4Grand Rapids MI 73 54 11 4 1 3 7 Fresno CA 69 51 12 4 1 1 4Indianapolis IN 270 180 60 11 10 9 20 Glendale CA 54 44 7 2 mdash 1 10Lansing MI 71 54 11 3 mdash 3 5 Honolulu HI 105 83 18 4 mdash mdash 11Milwaukee WI 147 102 37 8 mdash mdash 10 Long Beach CA 91 60 17 9 3 2 9Peoria IL 60 50 10 mdash mdash mdash 9 Los Angeles CA 313 209 71 22 7 4 34Rockford IL 59 44 9 3 1 2 2 Pasadena CA 24 14 8 mdash mdash 2 2South Bend IN 97 68 19 3 4 3 3 Portland OR 179 122 41 9 4 3 11Toledo OH 116 84 24 5 1 2 9 Sacramento CA 132 101 25 4 2 mdash 14Youngstown OH 90 71 17 1 1 mdash mdash San Diego CA 242 169 49 14 8 2 17
WN Central 663 440 151 33 19 20 51 San Francisco CA 156 111 35 5 3 2 15Des Moines IA 44 32 12 mdash mdash mdash 3 San Jose CA 252 183 47 15 6 1 31Duluth MN 41 33 6 1 1 mdash 3 Santa Cruz CA 49 36 10 2 1 mdash 6Kansas City KS 34 18 11 2 2 1 3 Seattle WA 202 147 36 12 6 1 10Kansas City MO 95 65 16 5 4 5 7 Spokane WA 81 64 12 2 2 1 10Lincoln NE 54 41 9 3 mdash 1 5 Tacoma WA 175 125 40 4 6 mdash 8Minneapolis MN 79 48 19 4 2 6 3 Totalpara 14333 9684 3235 863 297 251 987Omaha NE 105 74 20 6 5 mdash 11St Louis MO 69 36 23 5 2 3 5St Paul MN 70 49 15 3 1 2 6Wichita KS 72 44 20 4 2 2 5
U Unavailable mdashNo reported cases Mortality data in this table are voluntarily reported from 122 cities in the United States most of which have populations of gt100000 A death is reported by the place of its
occurrence and by the week that the death certificate was filed Fetal deaths are not includeddagger Pneumonia and influenzasect Because of changes in reporting methods in this Pennsylvania city these numbers are partial counts for the current week Complete counts will be available in 4 to 6 weekspara Total includes unknown ages
Vol 58 No 1 MMWR 23
TABLE IV Provisional cases of selected notifiable disease United States quarter ending January 3 2009 (53rd week)
Reporting area
Tuberculosis
Current quarter
Previous 4 quarters Cum
2008Cum 2007Min Max
United States 2218 2096 2797 9795 12859New England 19 19 46 144 186
Connecticut 9 9 33 90 108Maine 2 1 3 8 19Massachusetts mdash 0 0 mdash mdashNew Hampshire 5 2 5 16 11Rhode Island 3 3 8 26 45Vermont mdash 0 2 4 3
Mid Atlantic 544 410 544 1976 1918New Jersey 106 69 106 380 467New York (Upstate) 64 54 89 271 261New York City 243 196 253 938 914Pennsylvania 131 66 131 387 276
EN Central 223 154 228 806 1196Illinois 136 46 136 363 521Indiana 26 26 37 118 128Michigan mdash 0 20 52 226Ohio 49 49 58 212 251Wisconsin 12 10 20 61 70
WN Central 88 86 101 376 498Iowa mdash 0 15 34 43Kansas mdash 0 0 mdash 53Minnesota 62 35 62 189 238Missouri 16 16 40 105 119Nebraska 8 3 14 32 25North Dakota mdash 0 0 mdash 7South Dakota 2 2 9 16 13
S Atlantic 311 311 473 1576 2621Delaware mdash 0 7 12 20District of Columbia 6 6 16 49 60Florida 130 130 229 723 989Georgia 9 9 98 247 385Maryland 68 50 73 263 271North Carolina mdash 0 0 mdash 345South Carolina mdash 0 0 mdash 218Virginia 87 34 87 254 309West Virginia 11 4 11 28 24
ES Central 151 97 189 606 666Alabama 45 32 46 169 175Kentucky 18 4 30 80 120Mississippi 32 17 32 99 137Tennessee 56 44 85 258 234
WS Central 185 185 416 1341 1982Arkansas 22 8 22 72 106Louisiana mdash 0 0 mdash 218Oklahoma 24 18 28 94 148Texas 139 139 376 1175 1510
Mountain 80 80 94 348 603Arizona 53 43 61 212 301Colorado 1 0 1 3 109Idaho mdash 0 0 mdash mdashMontana mdash 0 0 mdash mdashNevada mdash 0 29 50 101New Mexico 19 10 19 58 51Utah 7 5 8 25 41Wyoming mdash 0 0 mdash mdash
Pacific 617 485 779 2622 3189Alaska 12 9 13 44 51California 564 449 730 2378 2725Hawaii 27 22 39 118 122Oregon mdash 0 0 mdash mdashWashington 14 1 58 82 291
American Samoa mdash 0 0 mdash 3CNMI mdash mdash mdash mdash mdashGuam mdash 0 0 mdash mdashPuerto Rico 9 8 18 51 98US Virgin Islands mdash 0 0 mdash mdash
CNMI Commonwealth of Northern Mariana IslandsU Unavailable mdash No reported cases N Not notifiableCum Cumulative year-to-date counts Med Median Max Maximum AIDS and HIVAIDS data are not updated for this quarter because of upgrading
of the national HIVAIDS surveillance data management system
MMWR
The Morbidity and Mortality Weekly Report (MMWR) Series is prepared by the Centers for Disease Control and Prevention (CDC) and is available free of charge in electronic format To receive an electronic copy each week send an e-mail message to listservlistservcdcgov The body content should read SUBscribe mmwr-toc Electronic copy also is available from CDCrsquos Internet server at httpwwwcdcgovmmwr or from CDCrsquos file transfer protocol server at ftpftpcdcgovpubpublicationsmmwr Paper copy subscriptions are available through the Superintendent of Documents US Government Printing Office Washington DC 20402 telephone 202-512-1800
Data in the weekly MMWR are provisional based on weekly reports to CDC by state health departments The reporting week concludes at close of business on Friday compiled data on a national basis are officially released to the public on the following Friday Data are compiled in the National Center for Public Health Informatics Division of Integrated Surveillance Systems and Services Address all inquiries about the MMWR Series including material to be considered for publication to Editor MMWR Series Mailstop E-90 CDC 1600 Clifton Rd NE Atlanta GA 30333 or to mmwrqcdcgov
All material in the MMWR Series is in the public domain and may be used and reprinted without permission citation as to source however is appreciated
Use of trade names and commercial sources is for identification only and does not imply endorsement by the US Department of Health and Human Services
References to non-CDC sites on the Internet are provided as a service to MMWR readers and do not constitute or imply endorsement of these organizations or their programs by CDC or the US Department of Health and Human Services CDC is not responsible for the content of these sites URL addresses listed in MMWR were current as of the date of publication
24 January 16 2009
US Government Printing Office 2009-523-01941149 Region IV ISSN 0149-2195
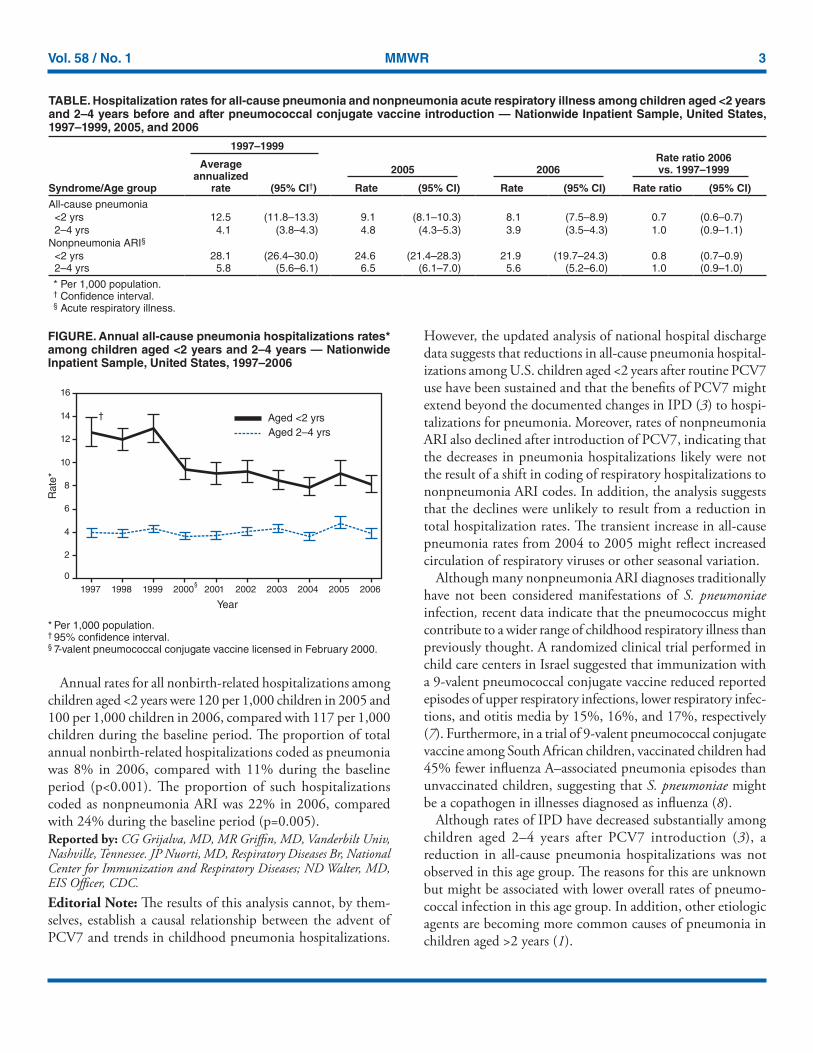
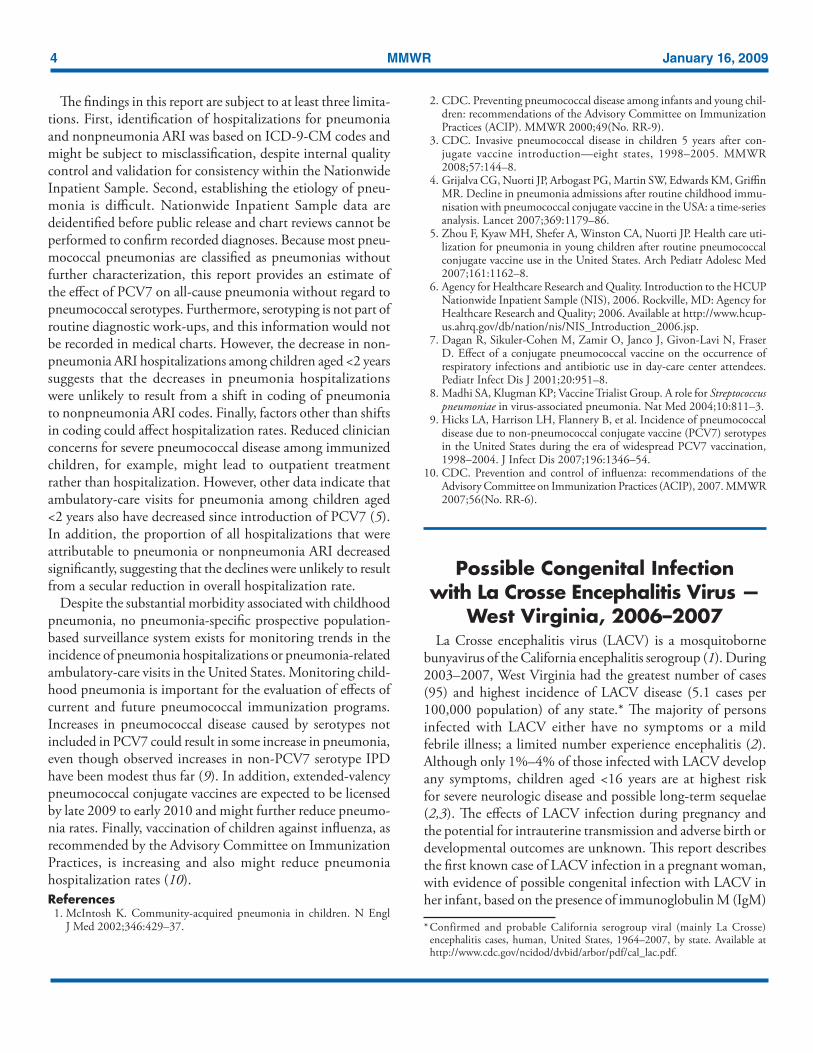
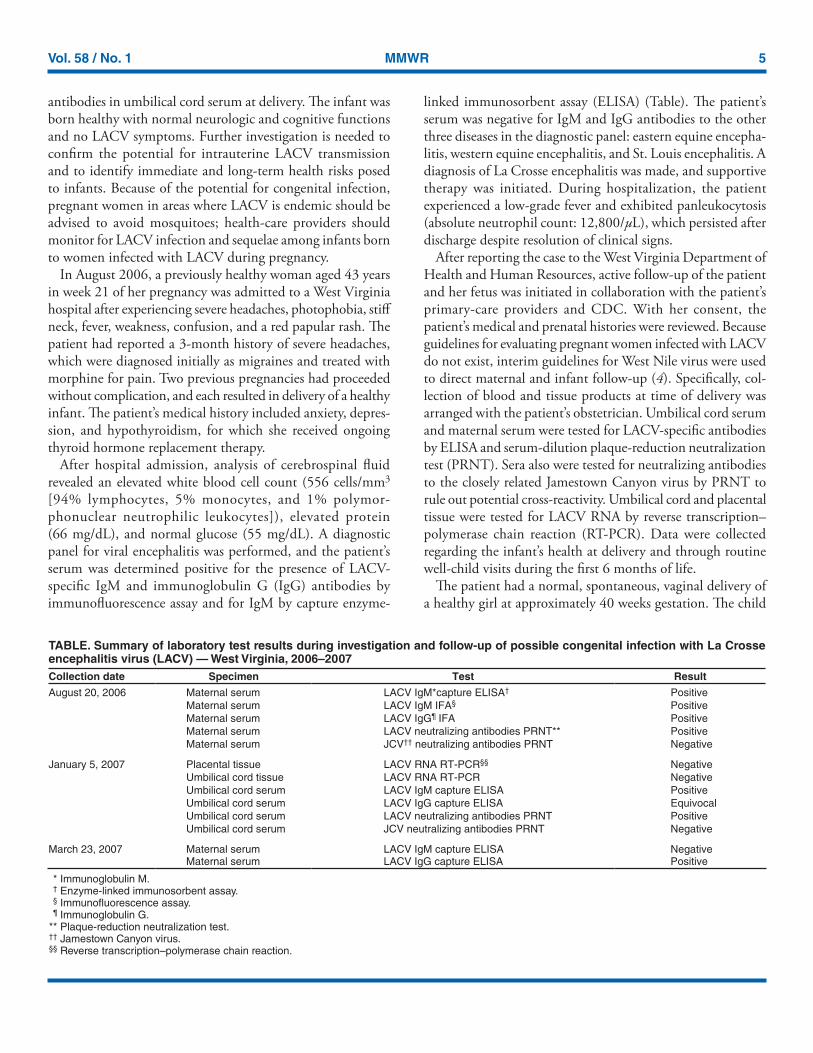
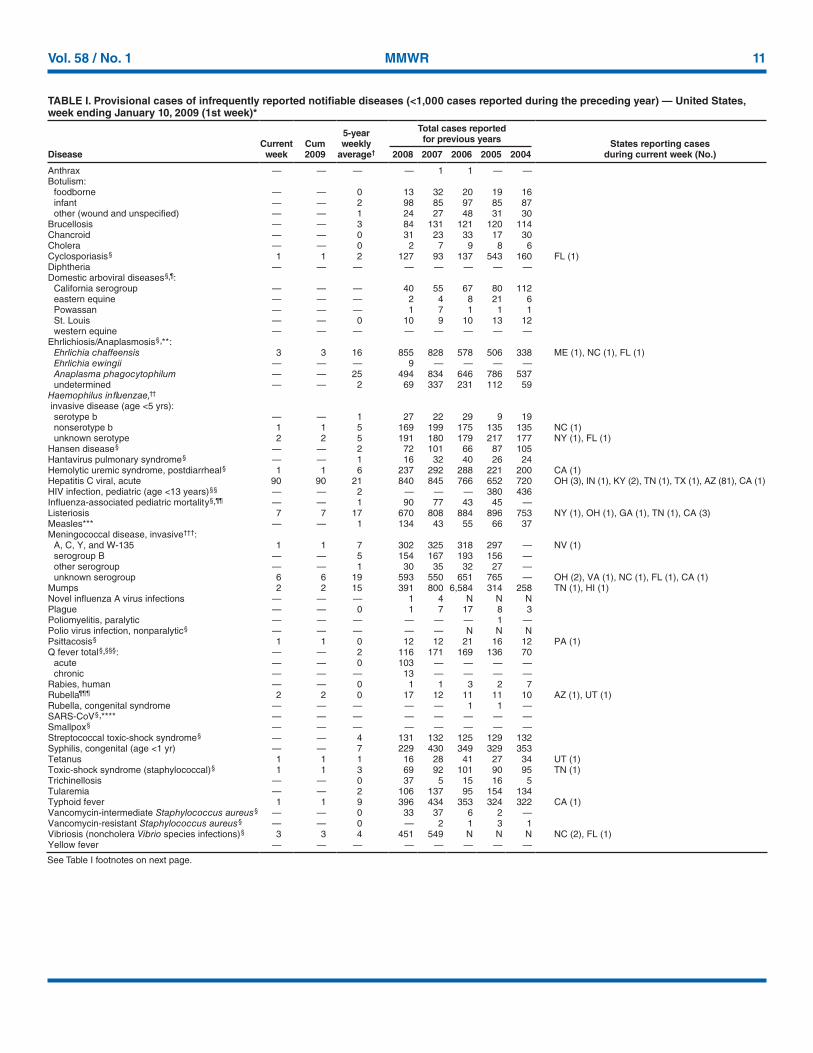
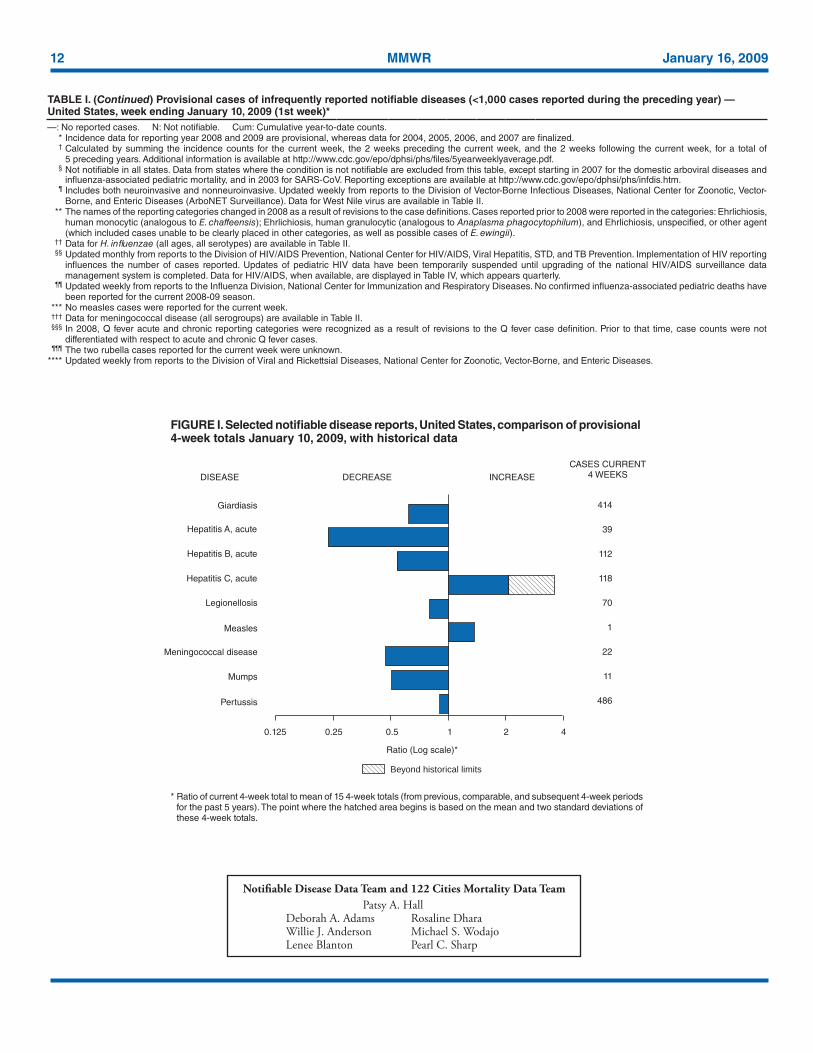
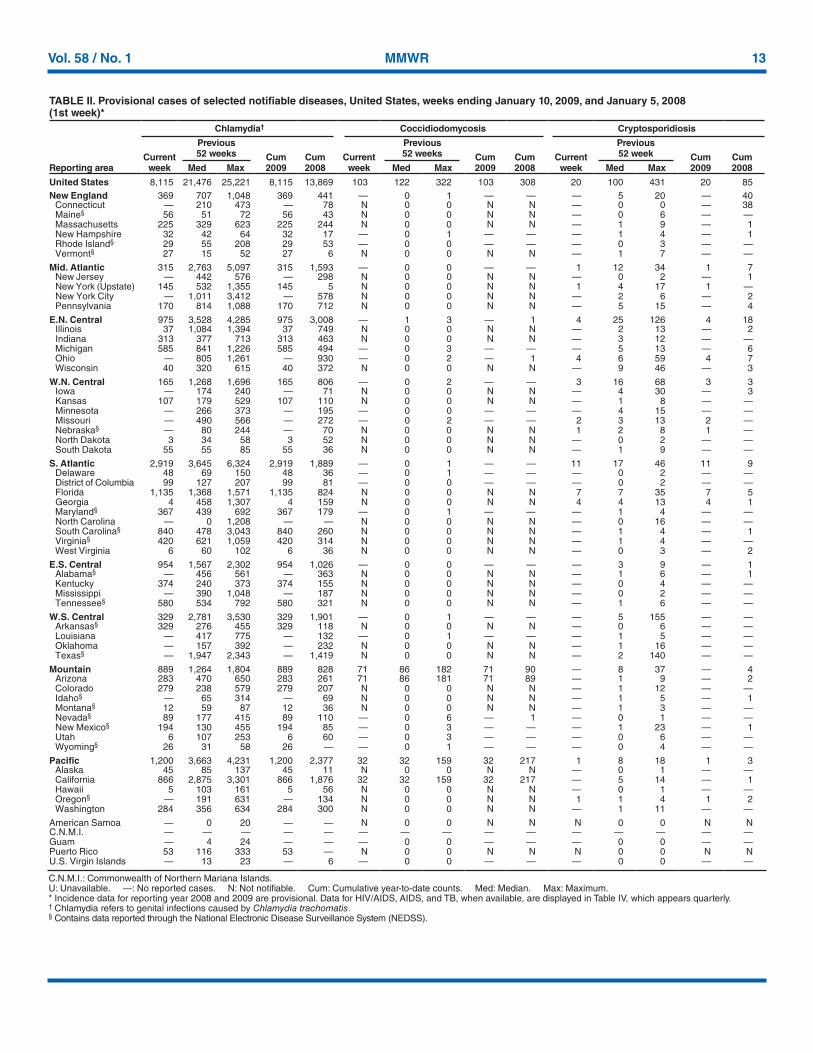
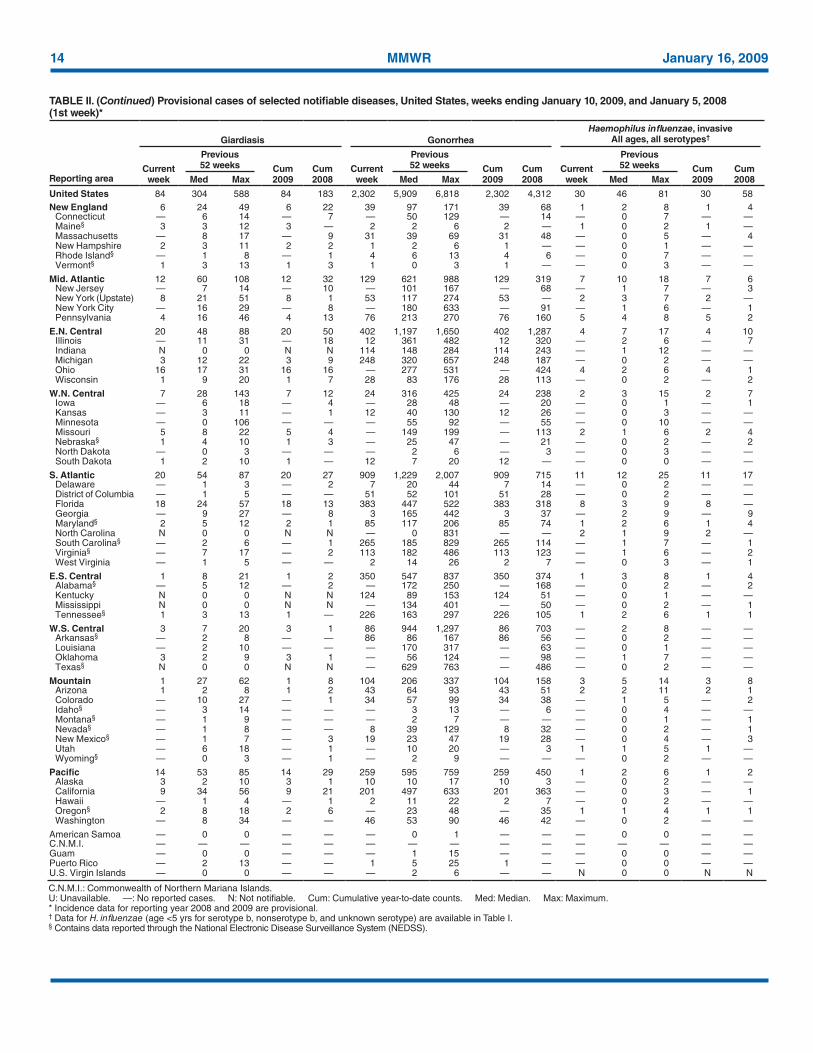
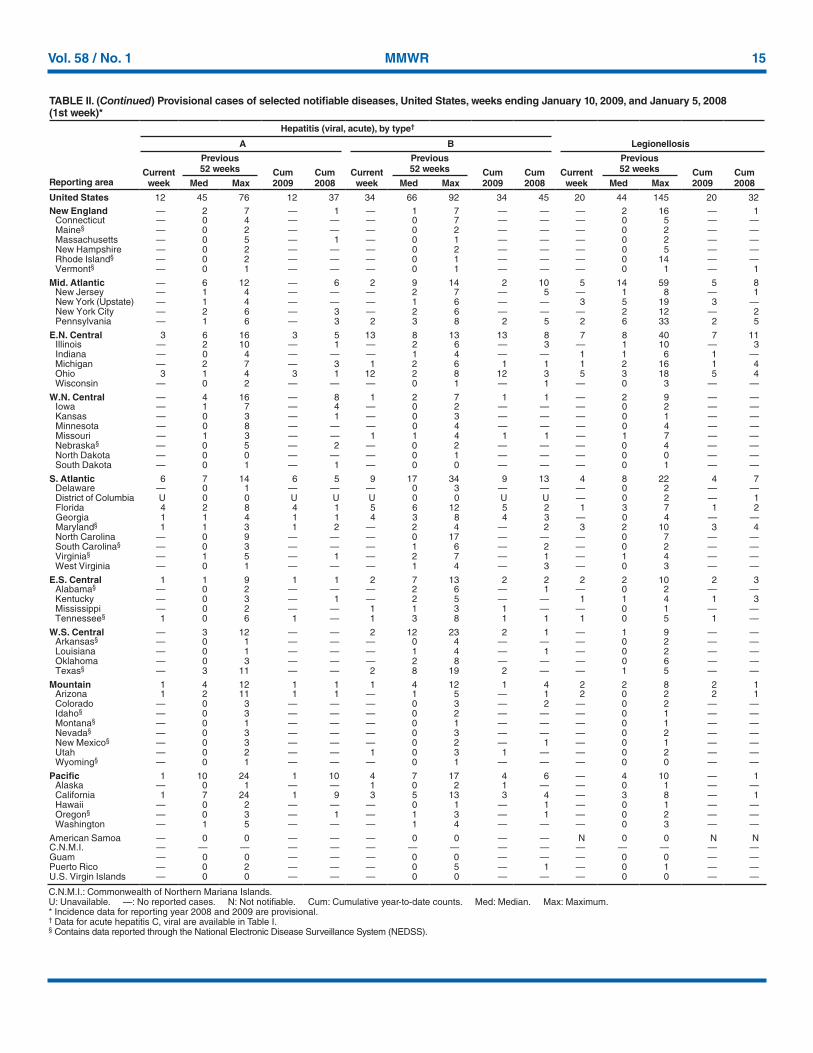
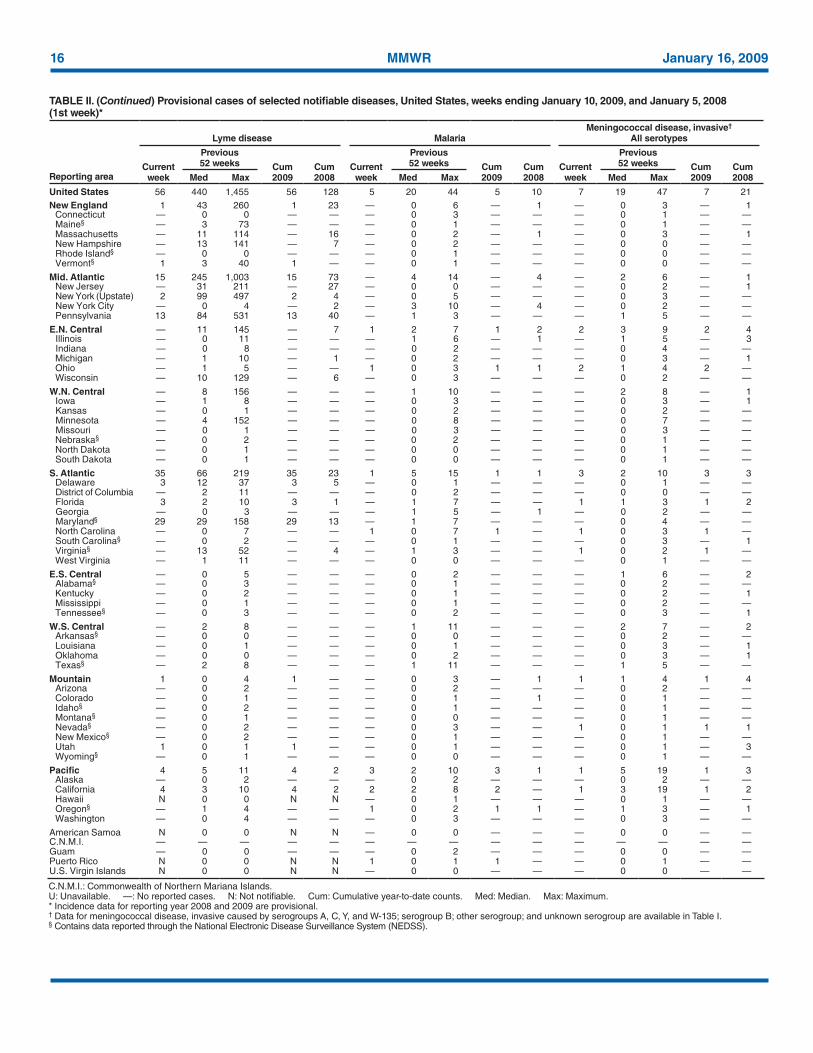
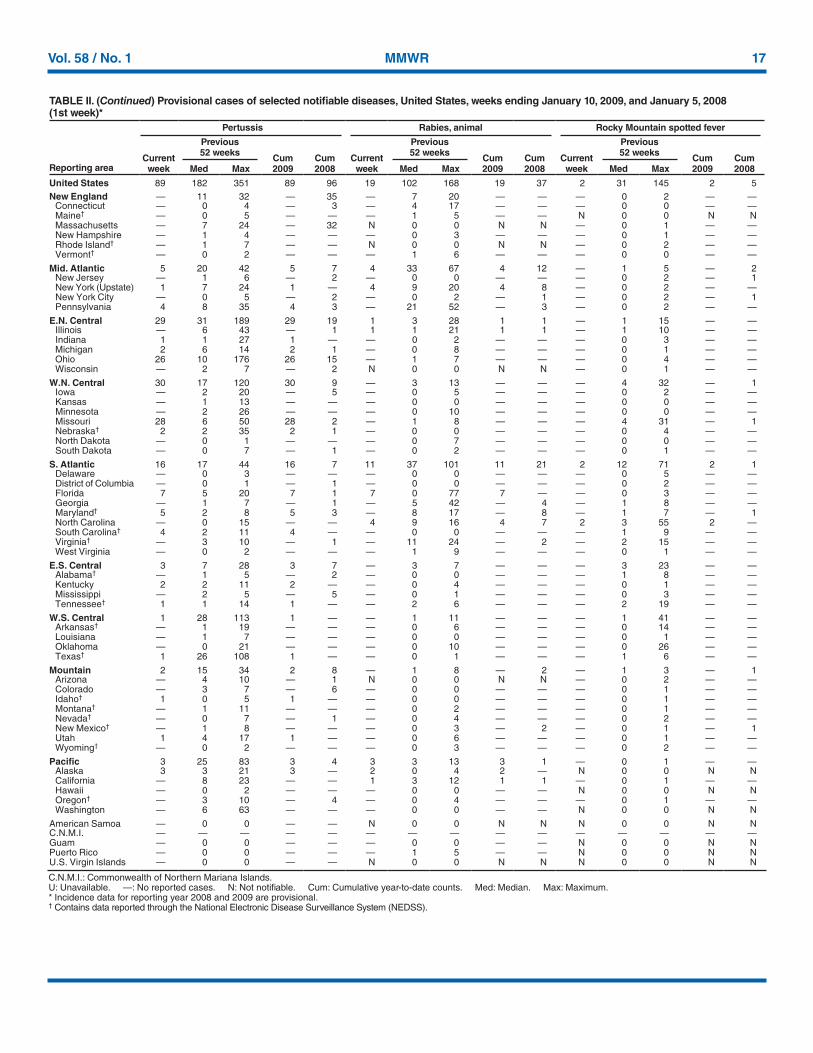
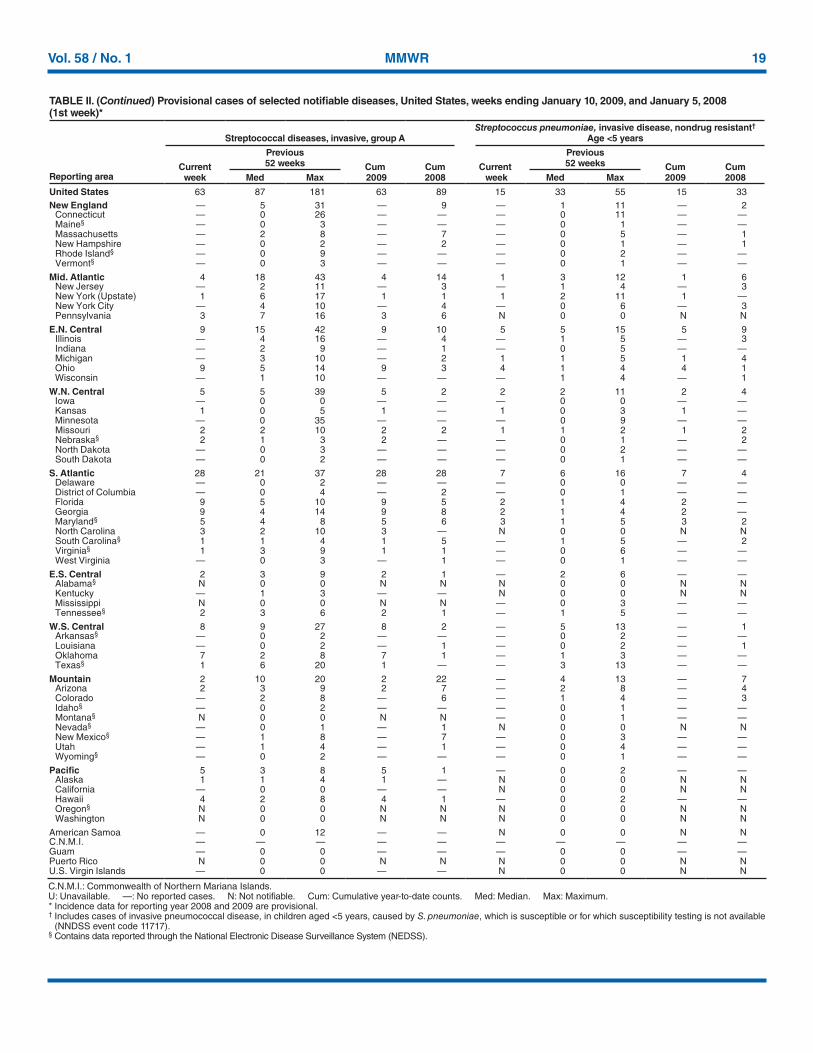
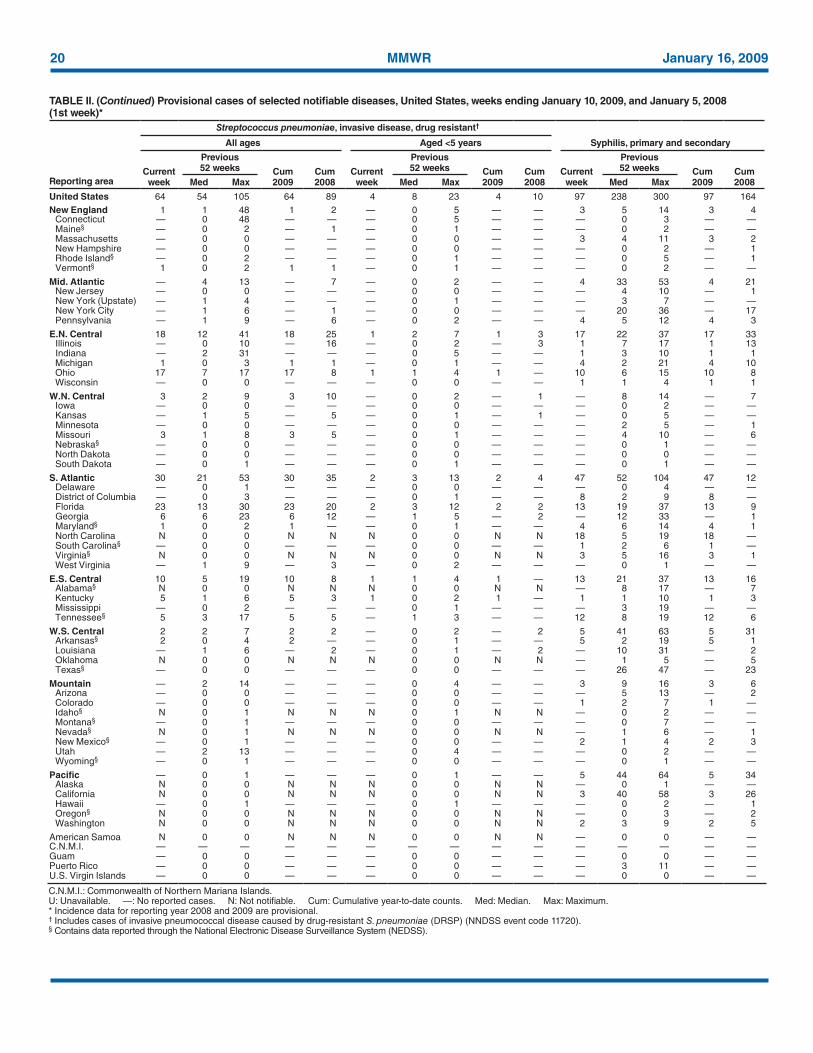
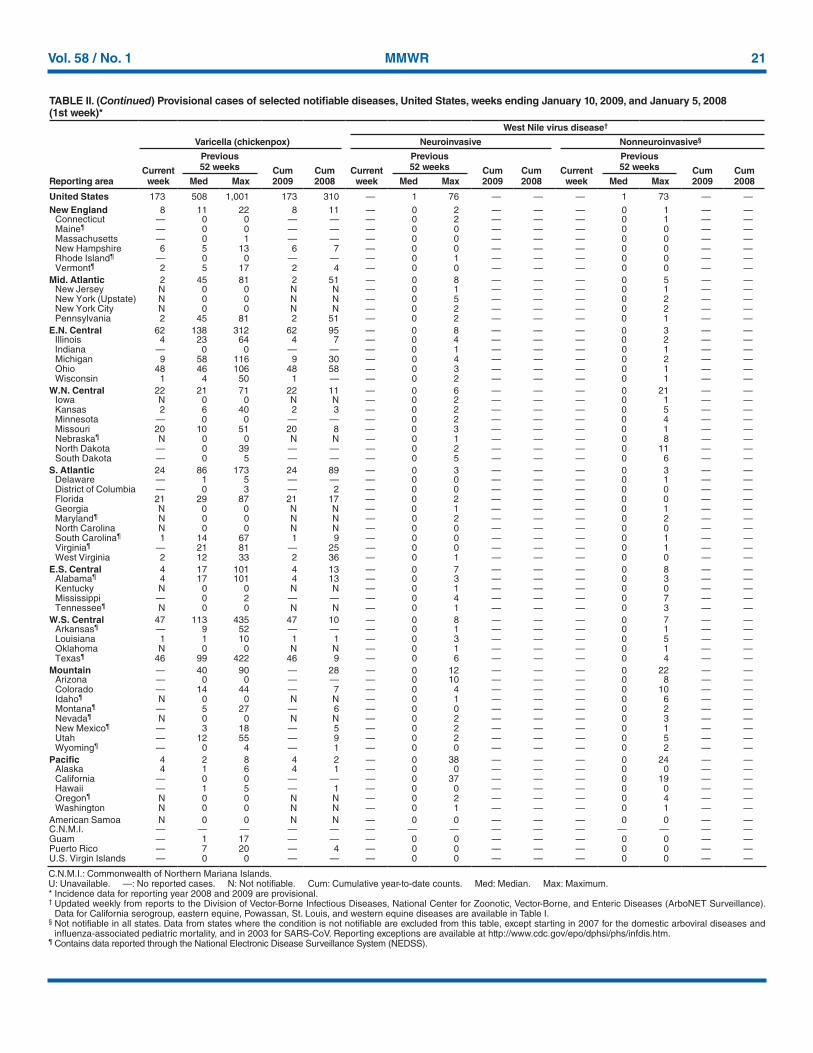
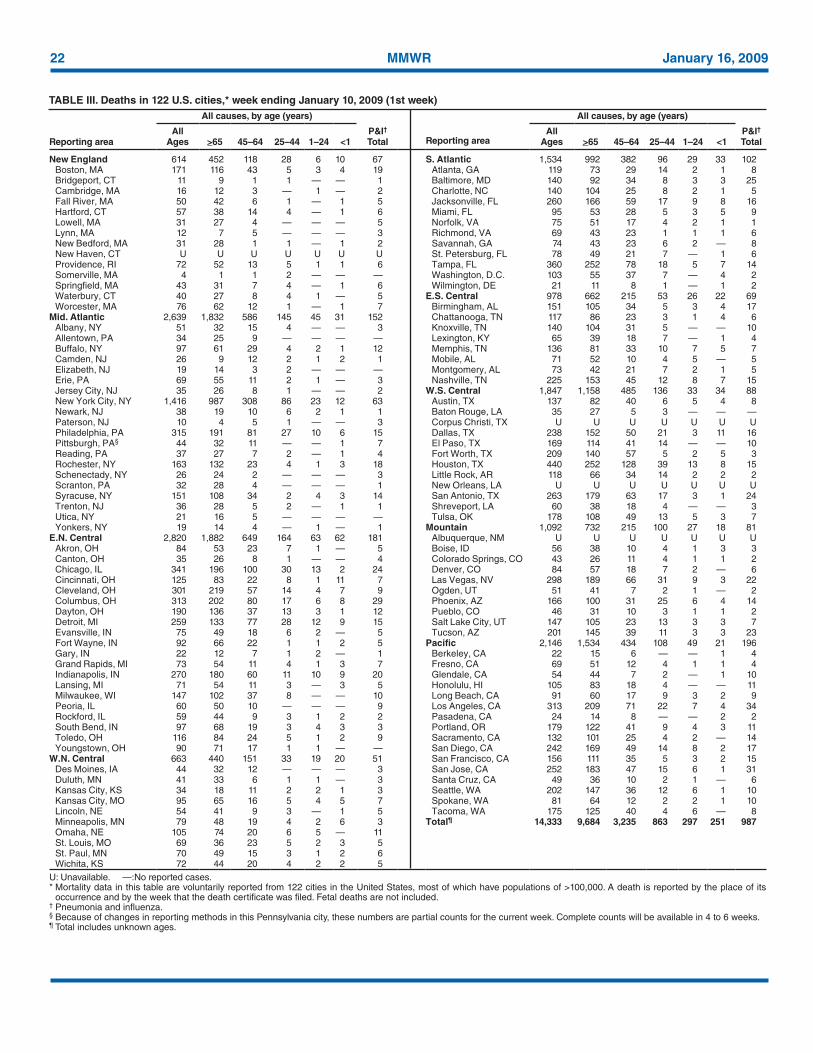
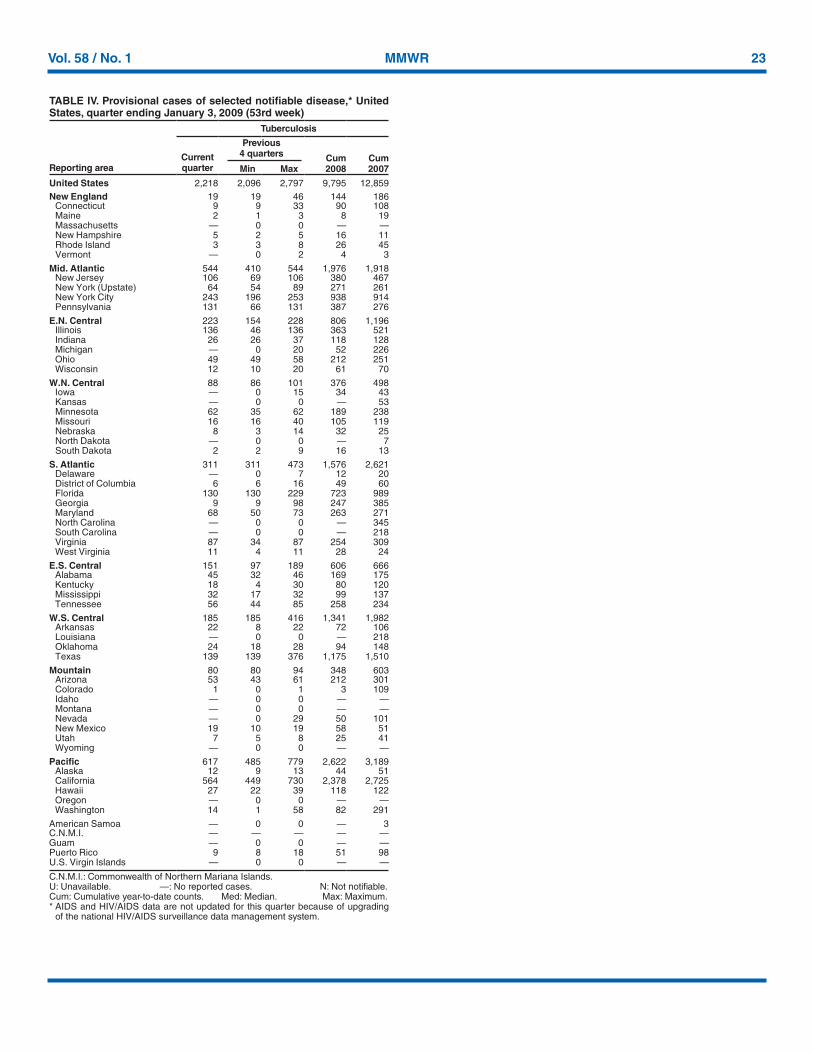