Embed Size (px)
Citation preview

MORGAN STANLEY ASIA INTERNATIONAL LIMITED
Interim Financial Disclosure Statements
For the six months ended 30 June 2016
MORGAN STANLEY ASIA INTERNATIONAL LIMITED
INTERIM FINANCIAL DISCLOSURE STATEMENTS
For the six months ended 30 June 2016
CONTENTS PAGE
Corporate Information 1
Unaudited income statement 2
Unaudited statement of comprehensive income 3
Unaudited statement of changes in equity 4
Unaudited statement of financial position 5
Notes to the unaudited financial information 6
MORGAN STANLEY ASIA INTERNATIONAL LIMITED
INTERIM FINANCIAL DISCLOSURE STATEMENTS
For the six months ended 30 June 2016
1
The directors of Morgan Stanley Asia International Limited (“the Company”) hereby announce the
unaudited interim financial disclosure statements of the Company for the period ended 30 June 2016.
The interim financial disclosure statements are prepared under the Banking (Disclosure) Rules pursuant
to Section 60A of the Hong Kong Banking Ordinance.
PRINCIPAL ACTIVITIES
The Company is a restricted licence bank under the Banking Ordinance in Hong Kong, regulated by the
Hong Kong Monetary Authority (“HKMA”). It is also a registered institution under the Hong Kong
Securities and Futures Ordinance. The Company is a private limited company incorporated in Hong
Kong, with a head office in Hong Kong and a branch in Singapore (“Branch”) which is regulated by the
Monetary Authority of Singapore (“MAS”).
The principal activities of the Company are to engage in the business of banking including deposit
taking and lending. It also acts as introducing broker for other subsidiaries of the Morgan Stanley
group of companies in connection with the provision of general investment, securities and futures
dealing, and custody services, as well as discretionary management.
The Company’s ultimate parent undertaking and controlling entity is Morgan Stanley which, together
with the Company and Morgan Stanley’s other subsidiary undertakings, form the Morgan Stanley
Group (the “Morgan Stanley Group”).
REQUIREMENT IN CONNECTION WITH PUBLICATION OF FINANCIAL STATEMENTS
The financial information relating to the year ended 31 December 2015 that is included in the
unaudited interim financial disclosure statements for the six months ended 30 June 2016 as
comparative information does not constitute the Company’s statutory annual financial statements for
the year ended 31 December 2015 but is derived from the audited financial statements for the year
ended 31 December 2015. Further information related to the audited financial statements for the year
ended 31 December 2015 required to be disclosed in accordance with section 436 of the Companies
Ordinance is as follows:
As the Company is a private company, the Company is not required to deliver its financial statements
to the Registrar of Companies, and has not done so.
The Company’s auditor has reported on the audited financial statements for the year ended 31
December 2015. The auditor’s report was unqualified; did not include a reference to any matter to
which the auditor drew attention by way of emphasis without qualifying its report; and did not contain
a statement under section 406(2), 407(2) or (3) of the Companies Ordinance.
INTERIM RESULTS
The half-yearly unaudited profit after tax for the period ended 30 June 2016 was US$1 million (period
ended 30 June 2015: US$26 million). The Company commenced business on 9 February 2015 and its
revenue is mainly contributed by fees and commission income relating to equities and fixed income
market activities. The reduction in the Company’s profit after tax is primarily due to the decrease in the
volume of transactions which has resulted in lower fees and commissions in the period.
Signed on behalf of the Board
Chui, Vincent Yik Chiu
Director
25 August 2016
MORGAN STANLEY ASIA INTERNATIONAL LIMITED
UNAUDITED INCOME STATEMENT
For the six months ended 30 June 2016
2
For the six
months ended For the six
months ended
Note 30 June 2016 30 June 2015
US$'000 US$'000
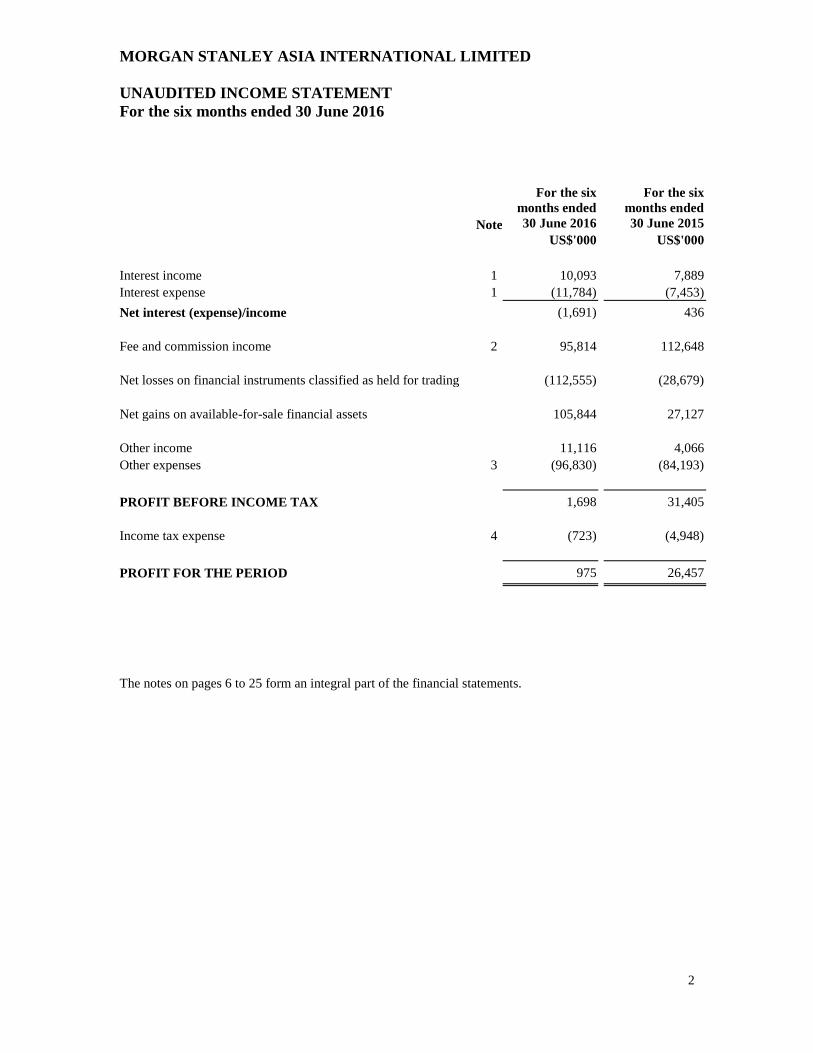
Interest income 1 10,093 7,889
Interest expense 1 (11,784) (7,453)
Net interest (expense)/income (1,691) 436
Fee and commission income 2 95,814 112,648
Net losses on financial instruments classified as held for trading (112,555) (28,679)
Net gains on available-for-sale financial assets 105,844 27,127
Other income 11,116 4,066
Other expenses 3 (96,830) (84,193)
PROFIT BEFORE INCOME TAX 1,698 31,405
Income tax expense 4 (723) (4,948)
1 PROFIT FOR THE PERIOD 975 26,457
The notes on pages 6 to 25 form an integral part of the financial statements.
MORGAN STANLEY ASIA INTERNATIONAL LIMITED
UNAUDITED STATEMENT OF COMPREHENSIVE INCOME
For the six months ended 30 June 2016
3
For the six
months ended For the six
months ended
30 June 2016 30 June 2015
US$'000 US$'000
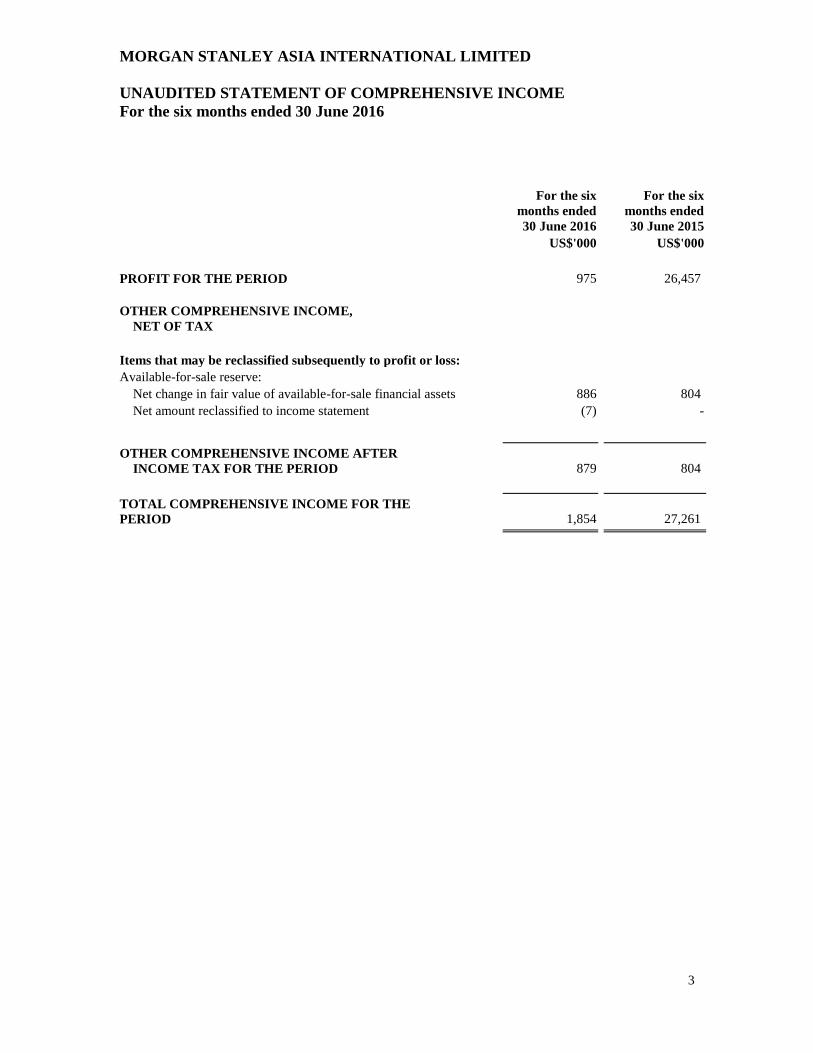
PROFIT FOR THE PERIOD 975 26,457
OTHER COMPREHENSIVE INCOME,
NET OF TAX
Items that may be reclassified subsequently to profit or loss:
Available-for-sale reserve:
Net change in fair value of available-for-sale financial assets 886 804
Net amount reclassified to income statement (7) -
OTHER COMPREHENSIVE (LOSSES)/INCOME AFTER OTHER COMPREHENSIVE INCOME AFTER
INCOME TAX FOR THE PERIOD 879 804
TOTAL COMPREHENSIVE INCOME FOR THE
PERIOD 1,854 27,261
MORGAN STANLEY ASIA INTERNATIONAL LIMITED
UNAUDITED STATEMENT OF CHANGES IN EQUITY
For the six months ended 30 June 2016
4
Share
capital
Available-
for-sale
reserve
Retained
earnings
Total
equity
US$'000 US$'000 US$'000 US$'000
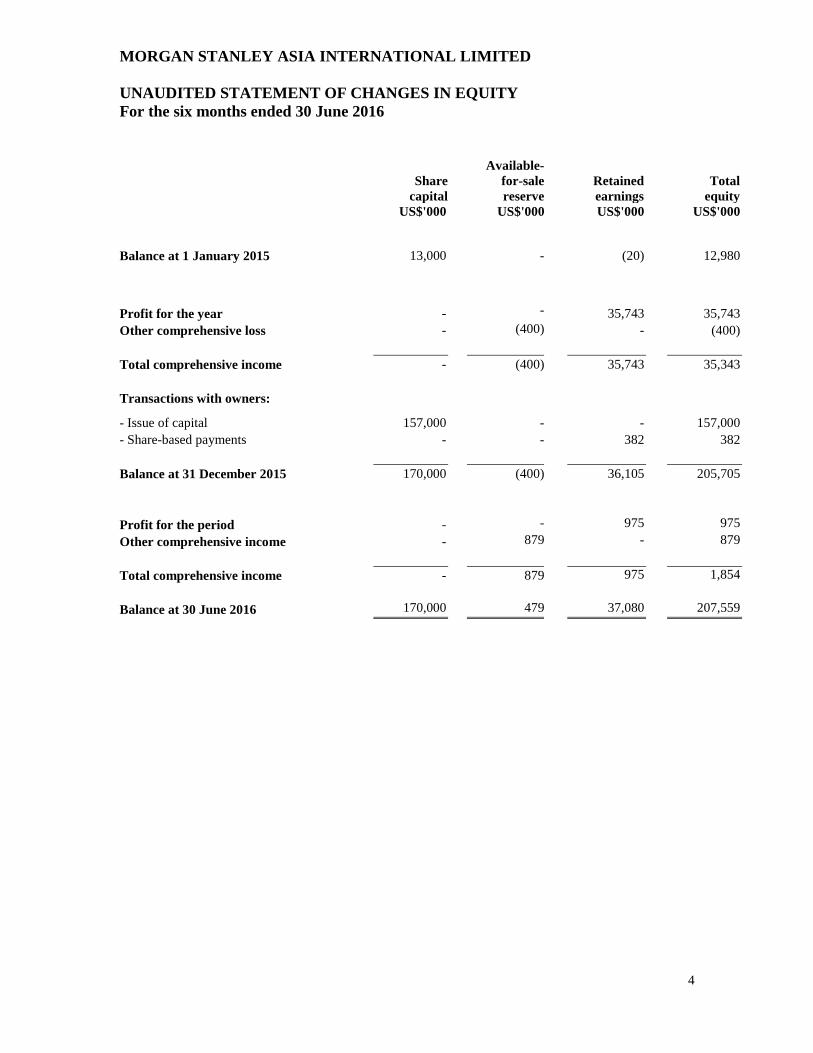
Balance at 1 January 2015 13,000 -
(20) 12,980
Profit for the year -
-
35,743 35,743
Other comprehensive loss - (400) - (400)
Total comprehensive income - (400) 35,743 35,343
Transactions with owners:
- Issue of capital 157,000 -
- 157,000
- Share-based payments - - 382 382
Balance at 31 December 2015 170,000 (400) 36,105 205,705
Profit for the period - - 975 975
Other comprehensive income - 879 - 879
Total comprehensive income - 879 975 1,854
Balance at 30 June 2016 170,000 479 37,080 207,559
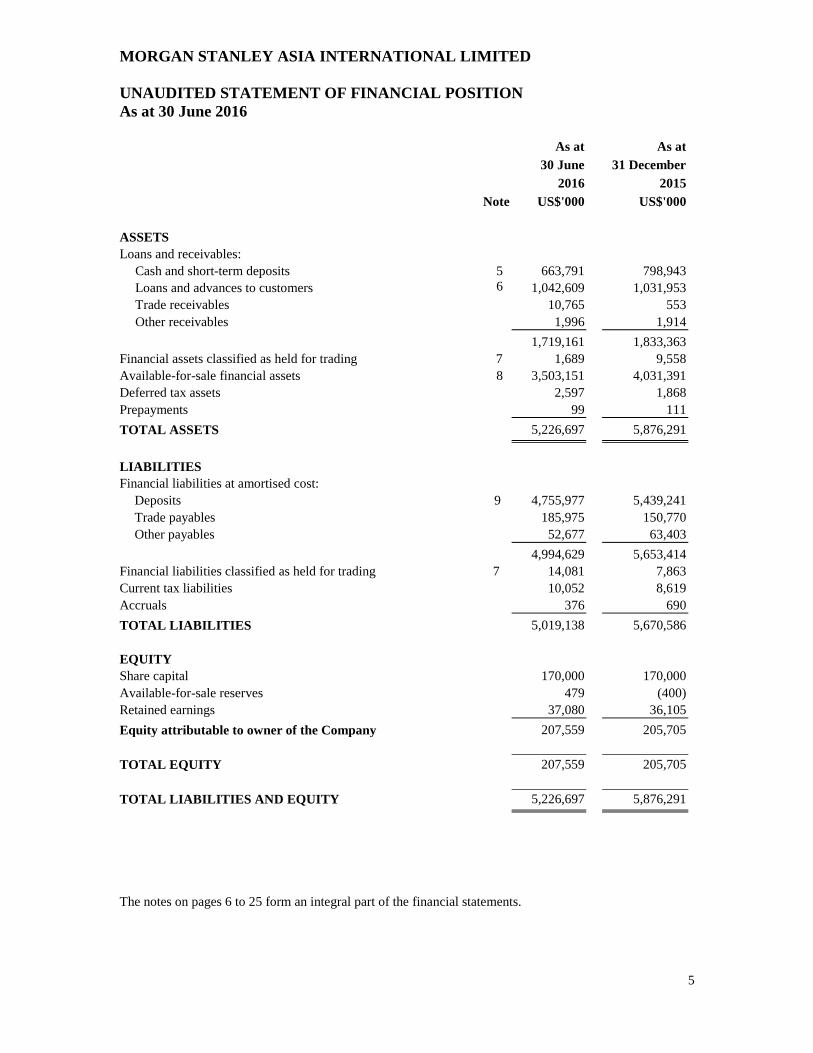
MORGAN STANLEY ASIA INTERNATIONAL LIMITED
UNAUDITED STATEMENT OF FINANCIAL POSITION
As at 30 June 2016
5
As at As at
30 June 31 December
2016 2015
Note US$'000 US$'000
ASSETS
Loans and receivables:
Cash and short-term deposits 5 663,791 798,943
Loans and advances to customers 6 1,042,609 1,031,953
Trade receivables 10,765 553
Other receivables 1,996 1,914
1,719,161 1,833,363
Financial assets classified as held for trading 7 1,689 9,558
Available-for-sale financial assets 8 3,503,151 4,031,391
Deferred tax assets 2,597 1,868
Prepayments 99 111
3 TOTAL ASSETS 5,226,697 5,876,291
LIABILITIES
Financial liabilities at amortised cost:
Deposits 9 4,755,977 5,439,241
Trade payables 185,975 150,770
Other payables 52,677 63,403
4,994,629 5,653,414
Financial liabilities classified as held for trading 7 14,081 7,863
Current tax liabilities 10,052 8,619
Accruals 376 690
6 TOTAL LIABILITIES 5,019,138 5,670,586
EQUITY
Share capital 170,000 170,000
Available-for-sale reserves 479 (400)
Retained earnings 37,080 36,105
Equity attributable to owner of the Company 207,559 205,705
TOTAL EQUITY 207,559 205,705
TOTAL LIABILITIES AND EQUITY 5,226,697 5,876,291
The notes on pages 6 to 25 form an integral part of the financial statements.
MORGAN STANLEY ASIA INTERNATIONAL LIMITED
NOTE TO THE UNAUDITED FINANCIAL INFORMATION
For the six months ended 30 June 2016
6
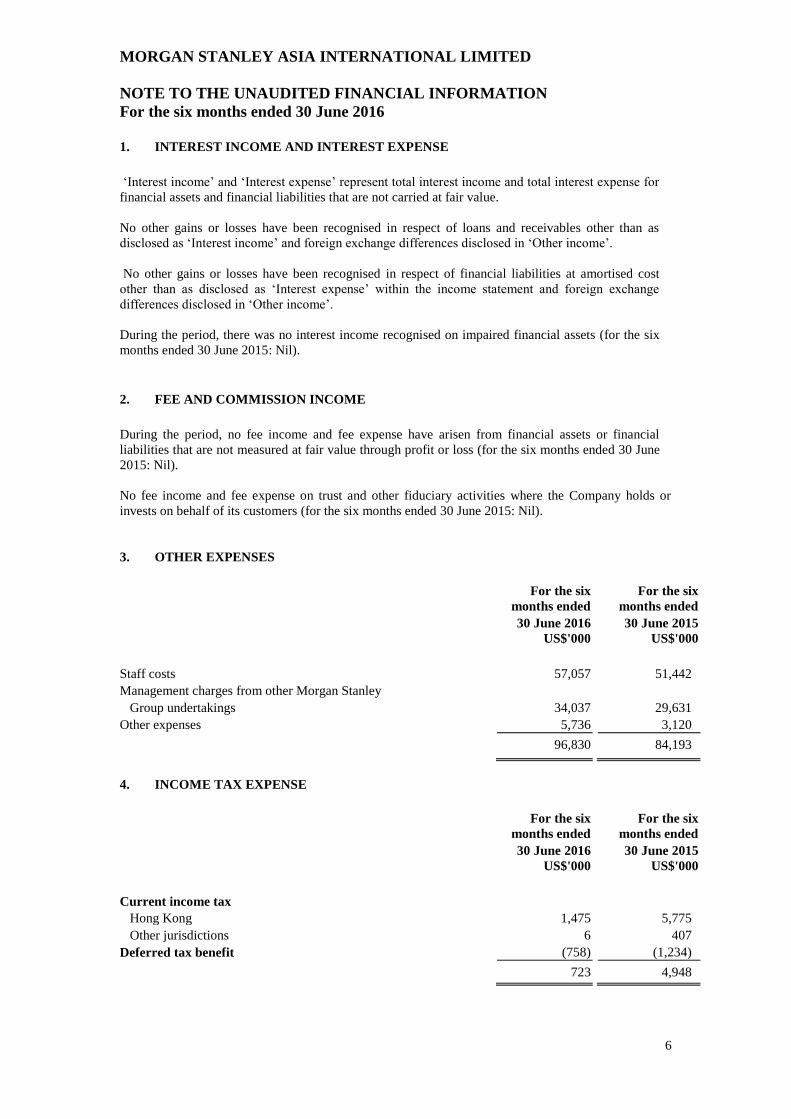
1. INTEREST INCOME AND INTEREST EXPENSE
‘Interest income’ and ‘Interest expense’ represent total interest income and total interest expense for
financial assets and financial liabilities that are not carried at fair value.
No other gains or losses have been recognised in respect of loans and receivables other than as
disclosed as ‘Interest income’ and foreign exchange differences disclosed in ‘Other income’.
No other gains or losses have been recognised in respect of financial liabilities at amortised cost
other than as disclosed as ‘Interest expense’ within the income statement and foreign exchange
differences disclosed in ‘Other income’.
During the period, there was no interest income recognised on impaired financial assets (for the six
months ended 30 June 2015: Nil).
2. FEE AND COMMISSION INCOME
During the period, no fee income and fee expense have arisen from financial assets or financial
liabilities that are not measured at fair value through profit or loss (for the six months ended 30 June
2015: Nil).
No fee income and fee expense on trust and other fiduciary activities where the Company holds or
invests on behalf of its customers (for the six months ended 30 June 2015: Nil).
3. OTHER EXPENSES
For the six
months ended
For the six
months ended
30 June 2016 30 June 2015
US$'000 US$'000
Staff costs 57,057 51,442
Management charges from other Morgan Stanley
Group undertakings 34,037 29,631
Other expenses 5,736 3,120
96,830 84,193
4. INCOME TAX EXPENSE
For the six
months ended
For the six
months ended
30 June 2016 30 June 2015
US$'000 US$'000
Current income tax
Hong Kong 1,475 5,775
Other jurisdictions 6 407
Deferred tax benefit (758) (1,234)
723 4,948
MORGAN STANLEY ASIA INTERNATIONAL LIMITED
NOTE TO THE UNAUDITED FINANCIAL INFORMATION
For the six months ended 30 June 2016
7
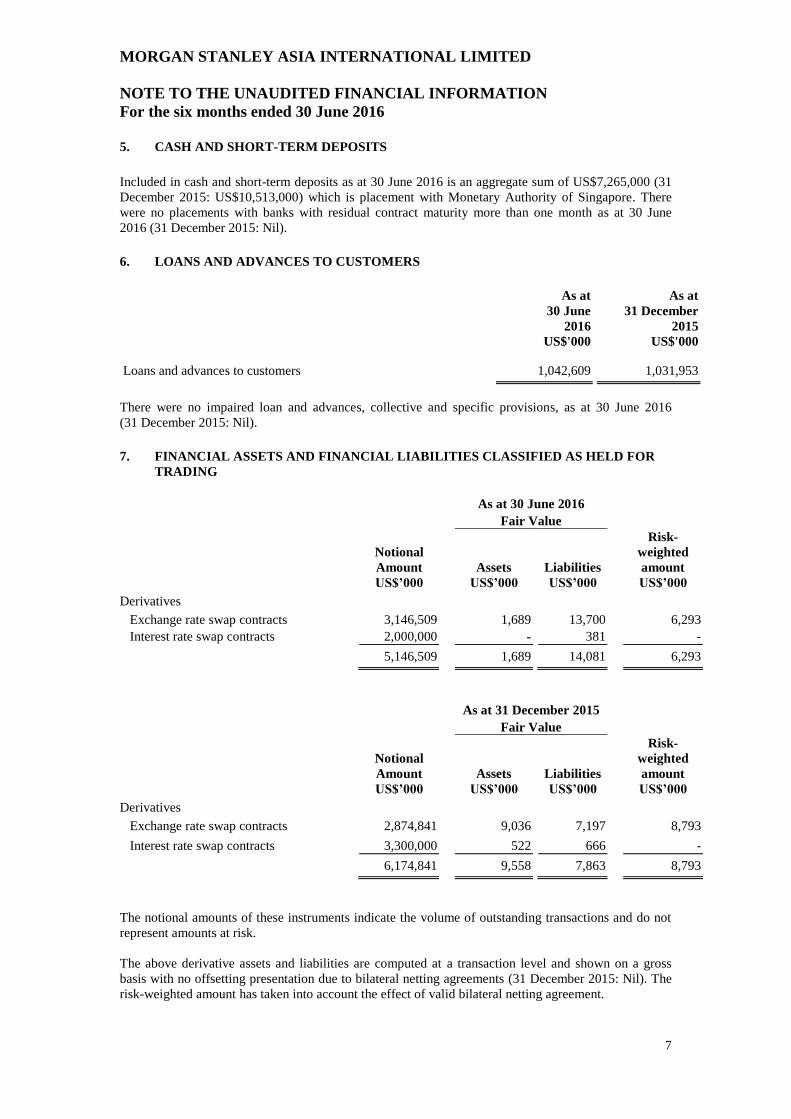
5. CASH AND SHORT-TERM DEPOSITS
Included in cash and short-term deposits as at 30 June 2016 is an aggregate sum of US$7,265,000 (31
December 2015: US$10,513,000) which is placement with Monetary Authority of Singapore. There
were no placements with banks with residual contract maturity more than one month as at 30 June
2016 (31 December 2015: Nil).
6. LOANS AND ADVANCES TO CUSTOMERS
As at
30 June
2016
As at
31 December
2015
US$'000 US$'000
Loans and advances to customers 1,042,609 1,031,953
There were no impaired loan and advances, collective and specific provisions, as at 30 June 2016
(31 December 2015: Nil).
7. FINANCIAL ASSETS AND FINANCIAL LIABILITIES CLASSIFIED AS HELD FOR
TRADING
As at 30 June 2016
Fair Value
Notional
Amount Assets Liabilities
Risk-
weighted
amount
US$’000 US$’000 US$’000 US$’000
Derivatives
Exchange rate swap contracts 3,146,509 1,689 13,700 6,293
Interest rate swap contracts 2,000,000 - 381 -
5,146,509 1,689 14,081 6,293
As at 31 December 2015
Fair Value
Notional
Amount Assets Liabilities
Risk-
weighted
amount
US$’000 US$’000 US$’000 US$’000
Derivatives
Exchange rate swap contracts 2,874,841 9,036 7,197 8,793
Interest rate swap contracts 3,300,000 522 666 -
6,174,841 9,558 7,863 8,793
The notional amounts of these instruments indicate the volume of outstanding transactions and do not
represent amounts at risk.
The above derivative assets and liabilities are computed at a transaction level and shown on a gross
basis with no offsetting presentation due to bilateral netting agreements (31 December 2015: Nil). The
risk-weighted amount has taken into account the effect of valid bilateral netting agreement.
MORGAN STANLEY ASIA INTERNATIONAL LIMITED
NOTE TO THE UNAUDITED FINANCIAL INFORMATION
For the six months ended 30 June 2016
8
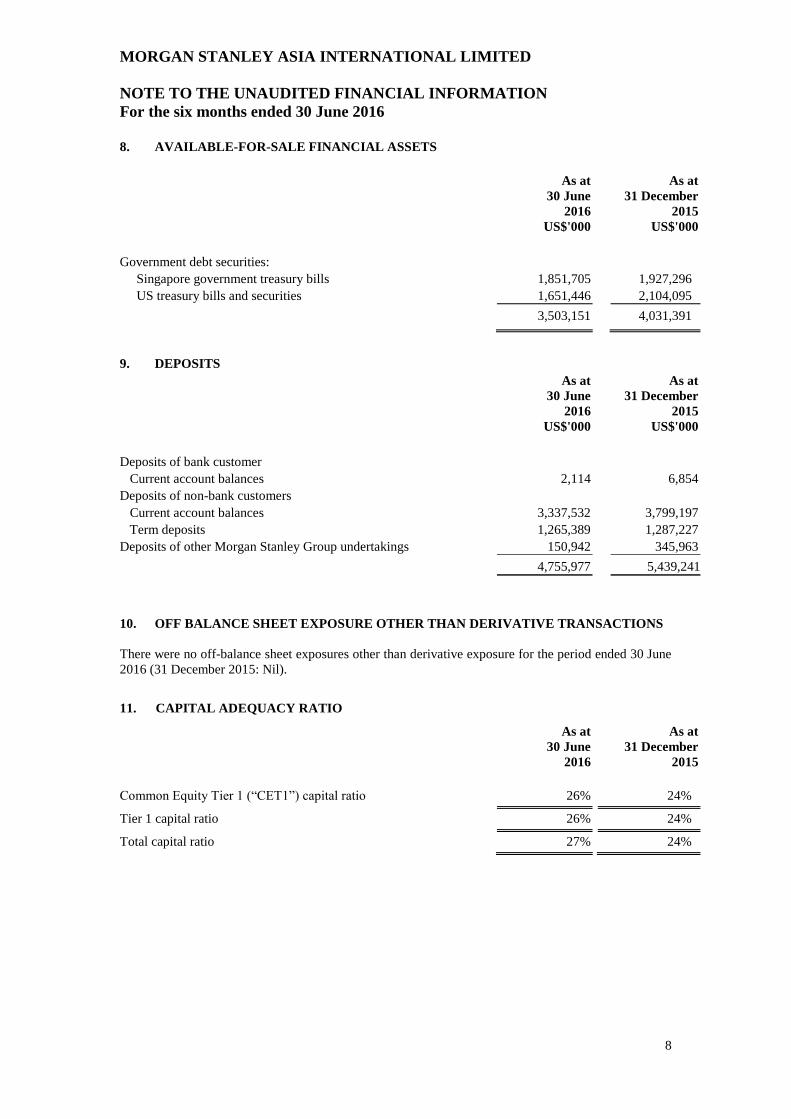
8. AVAILABLE-FOR-SALE FINANCIAL ASSETS
As at
30 June
2016
As at
31 December
2015
US$'000 US$'000
Government debt securities:
Singapore government treasury bills 1,851,705 1,927,296
US treasury bills and securities 1,651,446 2,104,095
3 3,503,151 4,031,391
9. DEPOSITS
As at
30 June
2016
As at
31 December
2015
US$'000 US$'000
Deposits of bank customer
Current account balances 2,114 6,854
Deposits of non-bank customers
Current account balances 3,337,532 3,799,197
Term deposits 1,265,389 1,287,227
Deposits of other Morgan Stanley Group undertakings 150,942 345,963
4,755,977 5,439,241
10.
OFF BALANCE SHEET EXPOSURE OTHER THAN DERIVATIVE TRANSACTIONS
There were no off-balance sheet exposures other than derivative exposure for the period ended 30 June
2016 (31 December 2015: Nil).
11. CAPITAL ADEQUACY RATIO
As at
30 June
2016
As at
31 December
2015
Common Equity Tier 1 (“CET1”) capital ratio 26% 24%
Retained earnings/(accumulated losses) (20)
Tier 1 capital ratio 26% 24%
Total capital ratio 27% 24%
MORGAN STANLEY ASIA INTERNATIONAL LIMITED
NOTE TO THE UNAUDITED FINANCIAL INFORMATION
For the six months ended 30 June 2016
9
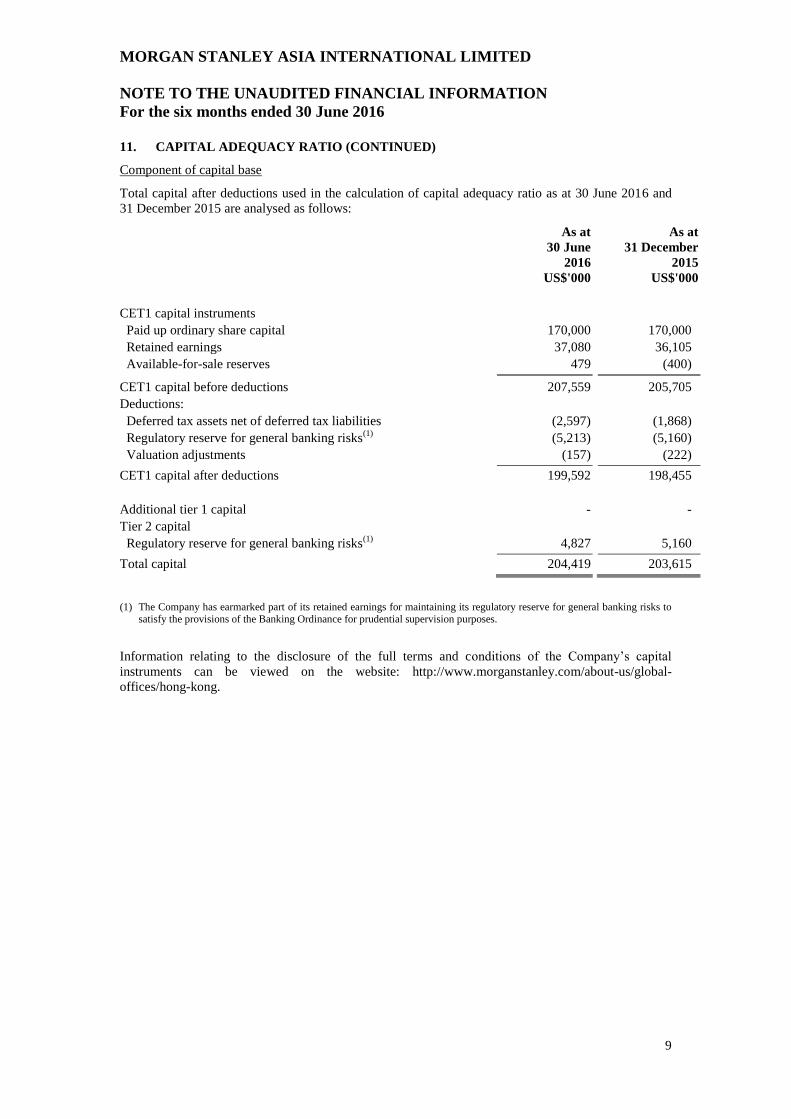
11. CAPITAL ADEQUACY RATIO (CONTINUED)
Component of capital base
Total capital after deductions used in the calculation of capital adequacy ratio as at 30 June 2016 and
31 December 2015 are analysed as follows:
As at
30 June
2016
As at
31 December
2015
US$'000 US$'000
CET1 capital instruments
Paid up ordinary share capital 170,000 170,000
Retained earnings 37,080 36,105
Available-for-sale reserves 479 (400)
CET1 capital before deductions 207,559 205,705
Deductions:
Deferred tax assets net of deferred tax liabilities (2,597) (1,868)
Regulatory reserve for general banking risks(1)
(5,213) (5,160)
Valuation adjustments (157) (222)
CET1 capital after deductions 199,592 198,455
Additional tier 1 capital - -
Tier 2 capital
Regulatory reserve for general banking risks(1)
4,827 5,160
Total capital 204,419 203,615
(1) The Company has earmarked part of its retained earnings for maintaining its regulatory reserve for general banking risks to satisfy the provisions of the Banking Ordinance for prudential supervision purposes.
Information relating to the disclosure of the full terms and conditions of the Company’s capital
instruments can be viewed on the website: http://www.morganstanley.com/about-us/global-
offices/hong-kong.
MORGAN STANLEY ASIA INTERNATIONAL LIMITED
NOTE TO THE UNAUDITED FINANCIAL INFORMATION
For the six months ended 30 June 2016
10
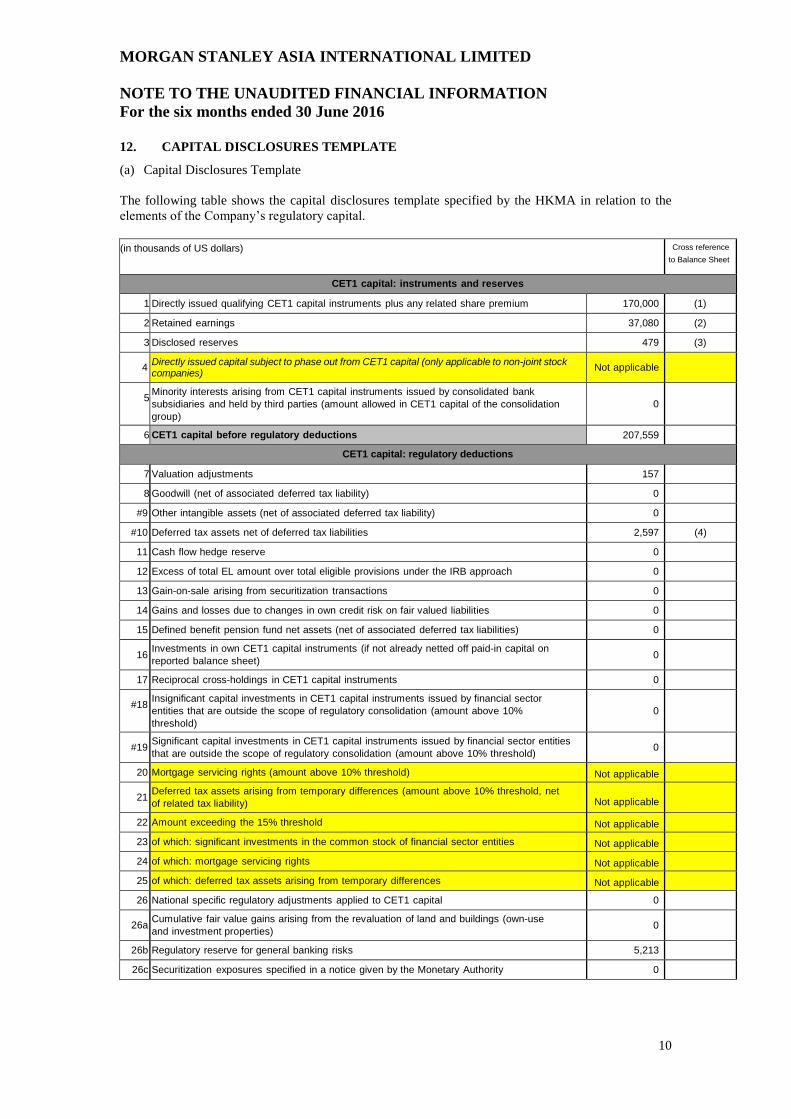
12. CAPITAL DISCLOSURES TEMPLATE
(a) Capital Disclosures Template
The following table shows the capital disclosures template specified by the HKMA in relation to the
elements of the Company’s regulatory capital.
(in thousands of US dollars) Cross reference
to Balance Sheet
CET1 capital: instruments and reserves
1 Directly issued qualifying CET1 capital instruments plus any related share premium 170,000 (1)
2 Retained earnings 37,080 (2)
3 Disclosed reserves 479 (3)
4 Directly issued capital subject to phase out from CET1 capital (only applicable to non-joint stock companies)
Not applicable
5 Minority interests arising from CET1 capital instruments issued by consolidated bank
subsidiaries and held by third parties (amount allowed in CET1 capital of the consolidation
group)
0
6 CET1 capital before regulatory deductions 207,559
CET1 capital: regulatory deductions
7 Valuation adjustments 157
8 Goodwill (net of associated deferred tax liability) 0
#9 Other intangible assets (net of associated deferred tax liability) 0
#10 Deferred tax assets net of deferred tax liabilities 2,597 (4)
11 Cash flow hedge reserve 0
12 Excess of total EL amount over total eligible provisions under the IRB approach 0
13 Gain-on-sale arising from securitization transactions 0
14 Gains and losses due to changes in own credit risk on fair valued liabilities 0
15 Defined benefit pension fund net assets (net of associated deferred tax liabilities) 0
16 Investments in own CET1 capital instruments (if not already netted off paid-in capital on
reported balance sheet) 0
17 Reciprocal cross-holdings in CET1 capital instruments 0
#18 Insignificant capital investments in CET1 capital instruments issued by financial sector
entities that are outside the scope of regulatory consolidation (amount above 10%
threshold)
0
#19 Significant capital investments in CET1 capital instruments issued by financial sector entities
that are outside the scope of regulatory consolidation (amount above 10% threshold) 0
20 Mortgage servicing rights (amount above 10% threshold) Not applicable
21 Deferred tax assets arising from temporary differences (amount above 10% threshold, net
of related tax liability)
Not applicable
22 Amount exceeding the 15% threshold Not applicable
23 of which: significant investments in the common stock of financial sector entities Not applicable
24 of which: mortgage servicing rights Not applicable
25 of which: deferred tax assets arising from temporary differences Not applicable
26 National specific regulatory adjustments applied to CET1 capital 0
26a Cumulative fair value gains arising from the revaluation of land and buildings (own-use
and investment properties) 0
26b Regulatory reserve for general banking risks 5,213 26c Securitization exposures specified in a notice given by the Monetary Authority 0
MORGAN STANLEY ASIA INTERNATIONAL LIMITED
NOTE TO THE UNAUDITED FINANCIAL INFORMATION
For the six months ended 30 June 2016
11
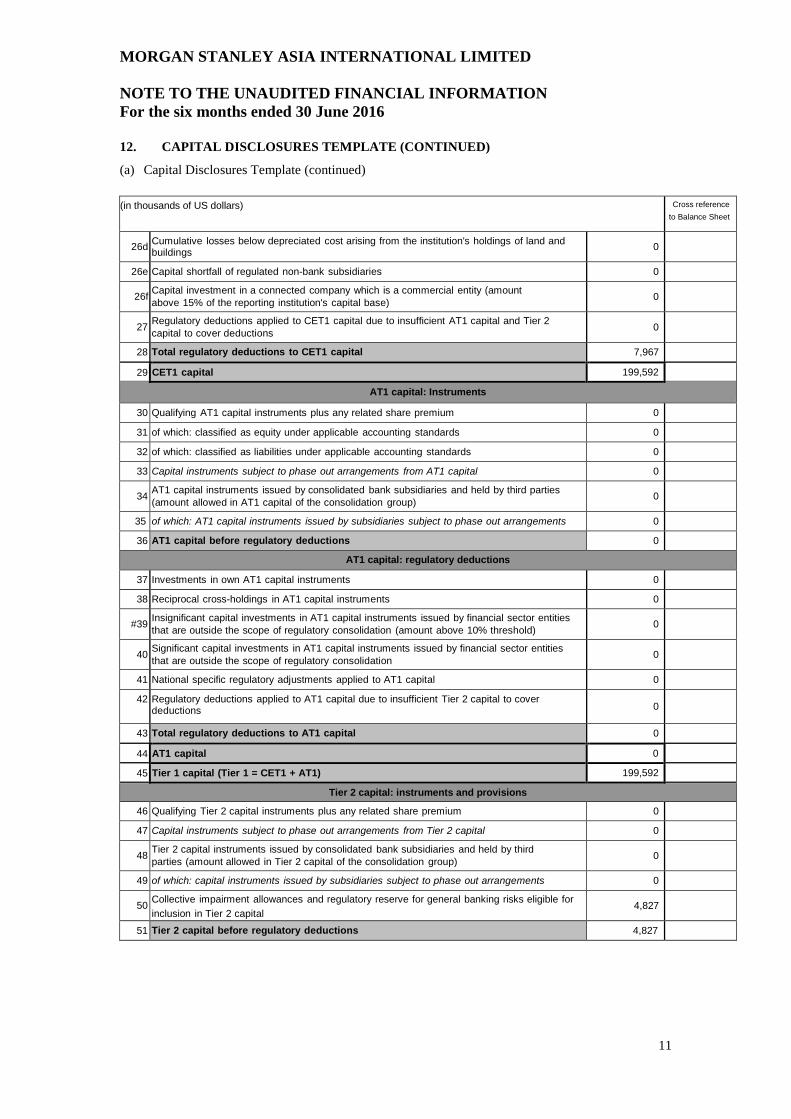
12. CAPITAL DISCLOSURES TEMPLATE (CONTINUED)
(a) Capital Disclosures Template (continued)
(in thousands of US dollars) Cross reference
to Balance Sheet
26d Cumulative losses below depreciated cost arising from the institution's holdings of land and buildings
0
26e Capital shortfall of regulated non-bank subsidiaries 0
26f Capital investment in a connected company which is a commercial entity (amount
above 15% of the reporting institution's capital base) 0
27 Regulatory deductions applied to CET1 capital due to insufficient AT1 capital and Tier 2
capital to cover deductions 0
28 Total regulatory deductions to CET1 capital 7,967
29 CET1 capital 199,592 AT1 capital: Instruments
30 Qualifying AT1 capital instruments plus any related share premium 0 31 of which: classified as equity under applicable accounting standards 0 32 of which: classified as liabilities under applicable accounting standards 0 33 Capital instruments subject to phase out arrangements from AT1 capital 0
34 AT1 capital instruments issued by consolidated bank subsidiaries and held by third parties
(amount allowed in AT1 capital of the consolidation group) 0
35 of which: AT1 capital instruments issued by subsidiaries subject to phase out arrangements 0
36 AT1 capital before regulatory deductions 0
AT1 capital: regulatory deductions
37 Investments in own AT1 capital instruments 0
38 Reciprocal cross-holdings in AT1 capital instruments 0
#39 Insignificant capital investments in AT1 capital instruments issued by financial sector entities
that are outside the scope of regulatory consolidation (amount above 10% threshold) 0
40 Significant capital investments in AT1 capital instruments issued by financial sector entities
that are outside the scope of regulatory consolidation 0
41 National specific regulatory adjustments applied to AT1 capital 0
42 Regulatory deductions applied to AT1 capital due to insufficient Tier 2 capital to cover deductions 0
43 Total regulatory deductions to AT1 capital 0
44 AT1 capital 0
45 Tier 1 capital (Tier 1 = CET1 + AT1) 199,592
Tier 2 capital: instruments and provisions
46 Qualifying Tier 2 capital instruments plus any related share premium 0
47 Capital instruments subject to phase out arrangements from Tier 2 capital 0
48 Tier 2 capital instruments issued by consolidated bank subsidiaries and held by third
parties (amount allowed in Tier 2 capital of the consolidation group) 0
49 of which: capital instruments issued by subsidiaries subject to phase out arrangements 0
50 Collective impairment allowances and regulatory reserve for general banking risks eligible for
inclusion in Tier 2 capital 4,827
51 Tier 2 capital before regulatory deductions 4,827
MORGAN STANLEY ASIA INTERNATIONAL LIMITED
NOTE TO THE UNAUDITED FINANCIAL INFORMATION
For the six months ended 30 June 2016
12
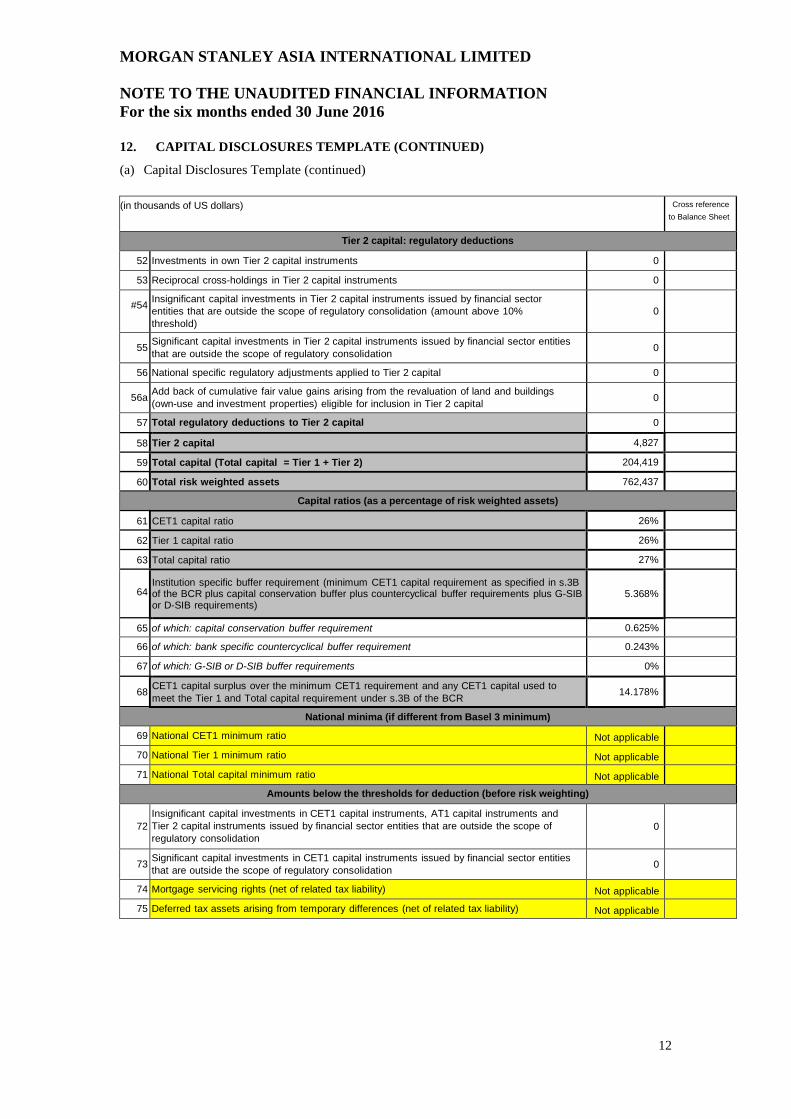
12. CAPITAL DISCLOSURES TEMPLATE (CONTINUED)
(a) Capital Disclosures Template (continued)
(in thousands of US dollars) Cross reference
to Balance Sheet
Tier 2 capital: regulatory deductions
52 Investments in own Tier 2 capital instruments 0
53 Reciprocal cross-holdings in Tier 2 capital instruments 0
#54 Insignificant capital investments in Tier 2 capital instruments issued by financial sector
entities that are outside the scope of regulatory consolidation (amount above 10%
threshold)
0
55 Significant capital investments in Tier 2 capital instruments issued by financial sector entities
that are outside the scope of regulatory consolidation 0
56 National specific regulatory adjustments applied to Tier 2 capital 0
56a Add back of cumulative fair value gains arising from the revaluation of land and buildings
(own-use and investment properties) eligible for inclusion in Tier 2 capital 0
57 Total regulatory deductions to Tier 2 capital 0
58 Tier 2 capital 4,827
59 Total capital (Total capital = Tier 1 + Tier 2) 204,419
60 Total risk weighted assets 762,437
Capital ratios (as a percentage of risk weighted assets)
61 CET1 capital ratio 26%
62 Tier 1 capital ratio 26%
63 Total capital ratio 27%
64
Institution specific buffer requirement (minimum CET1 capital requirement as specified in s.3B of the BCR plus capital conservation buffer plus countercyclical buffer requirements plus G-SIB or D-SIB requirements)
5.368%
65 of which: capital conservation buffer requirement 0.625%
66 of which: bank specific countercyclical buffer requirement 0.243% 67 of which: G-SIB or D-SIB buffer requirements 0%
68 CET1 capital surplus over the minimum CET1 requirement and any CET1 capital used to
meet the Tier 1 and Total capital requirement under s.3B of the BCR 14.178%
National minima (if different from Basel 3 minimum)
69 National CET1 minimum ratio Not applicable
70 National Tier 1 minimum ratio Not applicable
71 National Total capital minimum ratio Not applicable
Amounts below the thresholds for deduction (before risk weighting)
72
Insignificant capital investments in CET1 capital instruments, AT1 capital instruments and
Tier 2 capital instruments issued by financial sector entities that are outside the scope of
regulatory consolidation
0
73 Significant capital investments in CET1 capital instruments issued by financial sector entities
that are outside the scope of regulatory consolidation 0
74 Mortgage servicing rights (net of related tax liability) Not applicable
75 Deferred tax assets arising from temporary differences (net of related tax liability) Not applicable
MORGAN STANLEY ASIA INTERNATIONAL LIMITED
NOTE TO THE UNAUDITED FINANCIAL INFORMATION
For the six months ended 30 June 2016
13
12. CAPITAL DISCLOSURES TEMPLATE (CONTINUED)
(a) Capital Disclosures Template (continued)
(in thousands of US dollars) Cross reference
to Balance Sheet
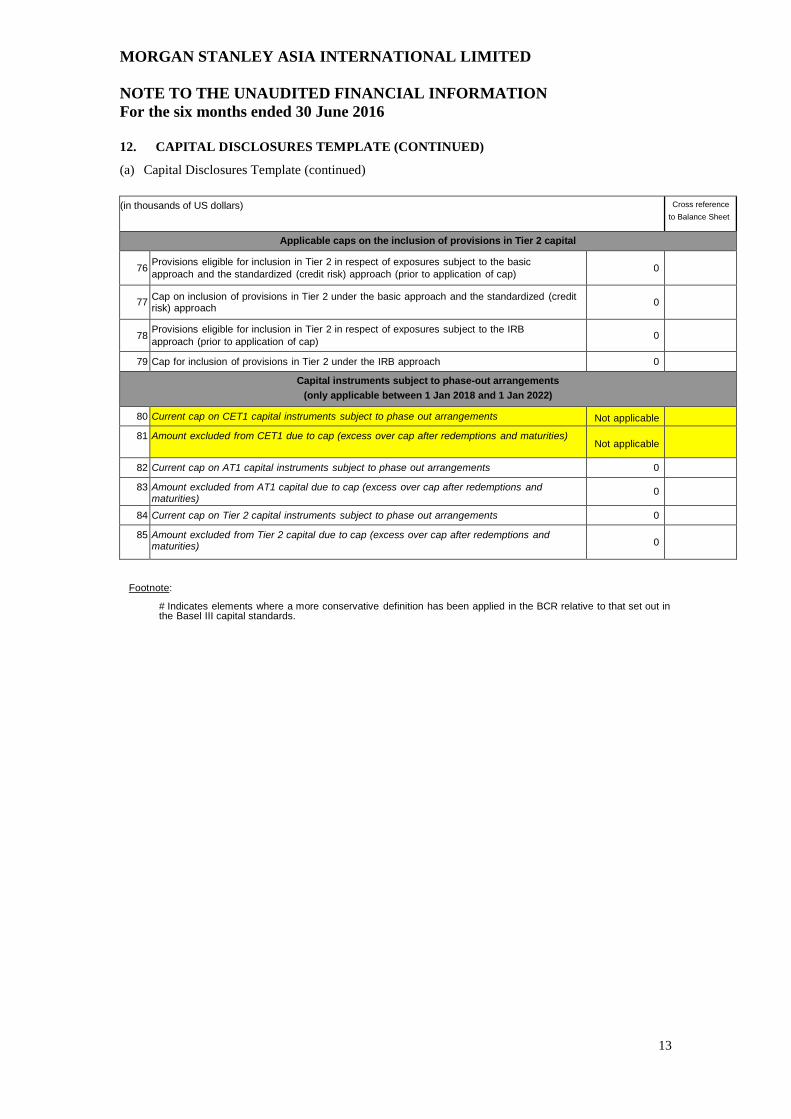
Applicable caps on the inclusion of provisions in Tier 2 capital
76
Provisions eligible for inclusion in Tier 2 in respect of exposures subject to the basic
approach and the standardized (credit risk) approach (prior to application of cap) 0
77
Cap on inclusion of provisions in Tier 2 under the basic approach and the standardized (credit risk) approach
0
78
Provisions eligible for inclusion in Tier 2 in respect of exposures subject to the IRB
approach (prior to application of cap) 0
79 Cap for inclusion of provisions in Tier 2 under the IRB approach 0 Capital instruments subject to phase-out arrangements
(only applicable between 1 Jan 2018 and 1 Jan 2022)
80 Current cap on CET1 capital instruments subject to phase out arrangements Not applicable
81 Amount excluded from CET1 due to cap (excess over cap after redemptions and maturities) Not applicable
82 Current cap on AT1 capital instruments subject to phase out arrangements 0 83 Amount excluded from AT1 capital due to cap (excess over cap after redemptions and
maturities) 0
84 Current cap on Tier 2 capital instruments subject to phase out arrangements 0 85 Amount excluded from Tier 2 capital due to cap (excess over cap after redemptions and
maturities) 0
Footnote:
# Indicates elements where a more conservative definition has been applied in the BCR relative to that set out in the Basel III capital standards.
MORGAN STANLEY ASIA INTERNATIONAL LIMITED
NOTE TO THE UNAUDITED FINANCIAL INFORMATION
For the six months ended 30 June 2016
14
12. CAPITAL DISCLOSURES TEMPLATE (CONTINUED)
(a) Capital Disclosures Template (continued) Notes to the template
Row
No.
Description Hong Kong basis
Basel III basis
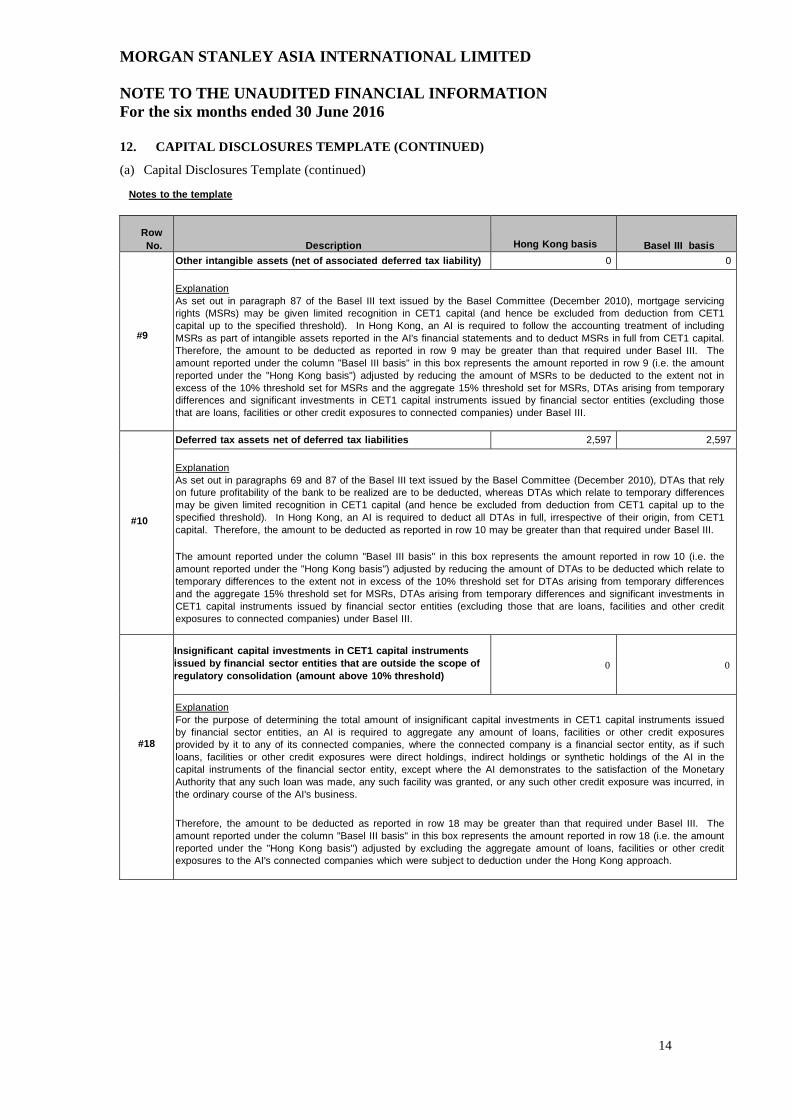
#9
Other intangible assets (net of associated deferred tax liability) 0 0
Explanation
As set out in paragraph 87 of the Basel III text issued by the Basel Committee (December 2010), mortgage servicing
rights (MSRs) may be given limited recognition in CET1 capital (and hence be excluded from deduction from CET1
capital up to the specified threshold). In Hong Kong, an AI is required to follow the accounting treatment of including
MSRs as part of intangible assets reported in the AI's financial statements and to deduct MSRs in full from CET1 capital.
Therefore, the amount to be deducted as reported in row 9 may be greater than that required under Basel III. The
amount reported under the column "Basel III basis" in this box represents the amount reported in row 9 (i.e. the amount
reported under the "Hong Kong basis") adjusted by reducing the amount of MSRs to be deducted to the extent not in
excess of the 10% threshold set for MSRs and the aggregate 15% threshold set for MSRs, DTAs arising from temporary
differences and significant investments in CET1 capital instruments issued by financial sector entities (excluding those
that are loans, facilities or other credit exposures to connected companies) under Basel III.
#10
Deferred tax assets net of deferred tax liabilities 2,597 2,597
Explanation
As set out in paragraphs 69 and 87 of the Basel III text issued by the Basel Committee (December 2010), DTAs that rely
on future profitability of the bank to be realized are to be deducted, whereas DTAs which relate to temporary differences
may be given limited recognition in CET1 capital (and hence be excluded from deduction from CET1 capital up to the
specified threshold). In Hong Kong, an AI is required to deduct all DTAs in full, irrespective of their origin, from CET1
capital. Therefore, the amount to be deducted as reported in row 10 may be greater than that required under Basel III.
The amount reported under the column "Basel III basis" in this box represents the amount reported in row 10 (i.e. the
amount reported under the "Hong Kong basis") adjusted by reducing the amount of DTAs to be deducted which relate to
temporary differences to the extent not in excess of the 10% threshold set for DTAs arising from temporary differences
and the aggregate 15% threshold set for MSRs, DTAs arising from temporary differences and significant investments in
CET1 capital instruments issued by financial sector entities (excluding those that are loans, facilities and other credit
exposures to connected companies) under Basel III.
#18
Insignificant capital investments in CET1 capital instruments
issued by financial sector entities that are outside the scope of
regulatory consolidation (amount above 10% threshold)
0 0
Explanation
For the purpose of determining the total amount of insignificant capital investments in CET1 capital instruments issued
by financial sector entities, an AI is required to aggregate any amount of loans, facilities or other credit exposures
provided by it to any of its connected companies, where the connected company is a financial sector entity, as if such
loans, facilities or other credit exposures were direct holdings, indirect holdings or synthetic holdings of the AI in the
capital instruments of the financial sector entity, except where the AI demonstrates to the satisfaction of the Monetary
Authority that any such loan was made, any such facility was granted, or any such other credit exposure was incurred, in
the ordinary course of the AI's business.
Therefore, the amount to be deducted as reported in row 18 may be greater than that required under Basel III. The
amount reported under the column "Basel III basis" in this box represents the amount reported in row 18 (i.e. the amount
reported under the "Hong Kong basis") adjusted by excluding the aggregate amount of loans, facilities or other credit
exposures to the AI's connected companies which were subject to deduction under the Hong Kong approach.
MORGAN STANLEY ASIA INTERNATIONAL LIMITED
NOTE TO THE UNAUDITED FINANCIAL INFORMATION
For the six months ended 30 June 2016
15
12. CAPITAL DISCLOSURES TEMPLATE (CONTINUED)
(a) Capital Disclosures Template (continued)
Notes to the template
Row
No.
Description Hong Kong
basis
Basel III
basis
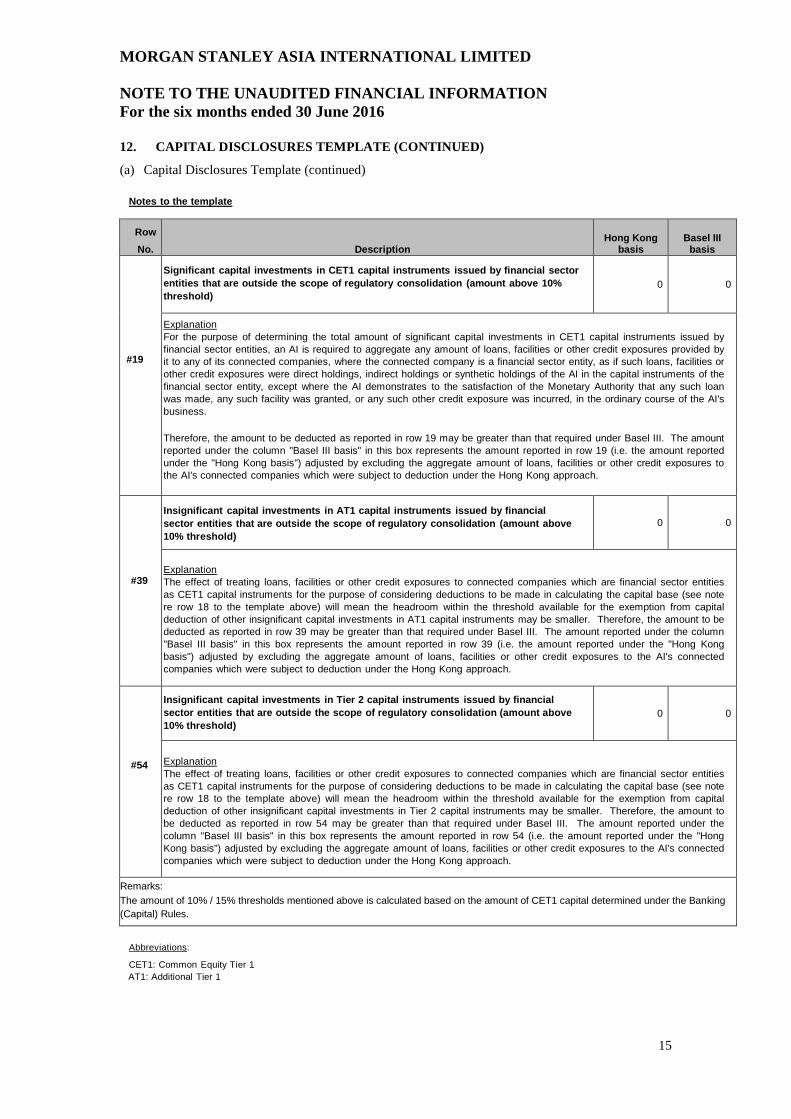
#19
Significant capital investments in CET1 capital instruments issued by financial sector
entities that are outside the scope of regulatory consolidation (amount above 10%
threshold)
0 0
Explanation
For the purpose of determining the total amount of significant capital investments in CET1 capital instruments issued by
financial sector entities, an AI is required to aggregate any amount of loans, facilities or other credit exposures provided by
it to any of its connected companies, where the connected company is a financial sector entity, as if such loans, facilities or
other credit exposures were direct holdings, indirect holdings or synthetic holdings of the AI in the capital instruments of the
financial sector entity, except where the AI demonstrates to the satisfaction of the Monetary Authority that any such loan
was made, any such facility was granted, or any such other credit exposure was incurred, in the ordinary course of the AI's
business.
Therefore, the amount to be deducted as reported in row 19 may be greater than that required under Basel III. The amount
reported under the column "Basel III basis" in this box represents the amount reported in row 19 (i.e. the amount reported
under the "Hong Kong basis") adjusted by excluding the aggregate amount of loans, facilities or other credit exposures to
the AI's connected companies which were subject to deduction under the Hong Kong approach.
#39
Insignificant capital investments in AT1 capital instruments issued by financial
sector entities that are outside the scope of regulatory consolidation (amount above
10% threshold)
0 0
Explanation
The effect of treating loans, facilities or other credit exposures to connected companies which are financial sector entities
as CET1 capital instruments for the purpose of considering deductions to be made in calculating the capital base (see note
re row 18 to the template above) will mean the headroom within the threshold available for the exemption from capital
deduction of other insignificant capital investments in AT1 capital instruments may be smaller. Therefore, the amount to be
deducted as reported in row 39 may be greater than that required under Basel III. The amount reported under the column
"Basel III basis" in this box represents the amount reported in row 39 (i.e. the amount reported under the "Hong Kong
basis") adjusted by excluding the aggregate amount of loans, facilities or other credit exposures to the AI's connected
companies which were subject to deduction under the Hong Kong approach.
#54
Insignificant capital investments in Tier 2 capital instruments issued by financial
sector entities that are outside the scope of regulatory consolidation (amount above
10% threshold)
0 0
Explanation
The effect of treating loans, facilities or other credit exposures to connected companies which are financial sector entities
as CET1 capital instruments for the purpose of considering deductions to be made in calculating the capital base (see note
re row 18 to the template above) will mean the headroom within the threshold available for the exemption from capital
deduction of other insignificant capital investments in Tier 2 capital instruments may be smaller. Therefore, the amount to
be deducted as reported in row 54 may be greater than that required under Basel III. The amount reported under the
column "Basel III basis" in this box represents the amount reported in row 54 (i.e. the amount reported under the "Hong
Kong basis") adjusted by excluding the aggregate amount of loans, facilities or other credit exposures to the AI's connected
companies which were subject to deduction under the Hong Kong approach.
Remarks:
The amount of 10% / 15% thresholds mentioned above is calculated based on the amount of CET1 capital determined under the Banking
(Capital) Rules.
Abbreviations:
CET1: Common Equity Tier 1
AT1: Additional Tier 1
MORGAN STANLEY ASIA INTERNATIONAL LIMITED
NOTE TO THE UNAUDITED FINANCIAL INFORMATION
For the six months ended 30 June 2016
16
12. CAPITAL DISCLOSURES TEMPLATE (CONTINUED)
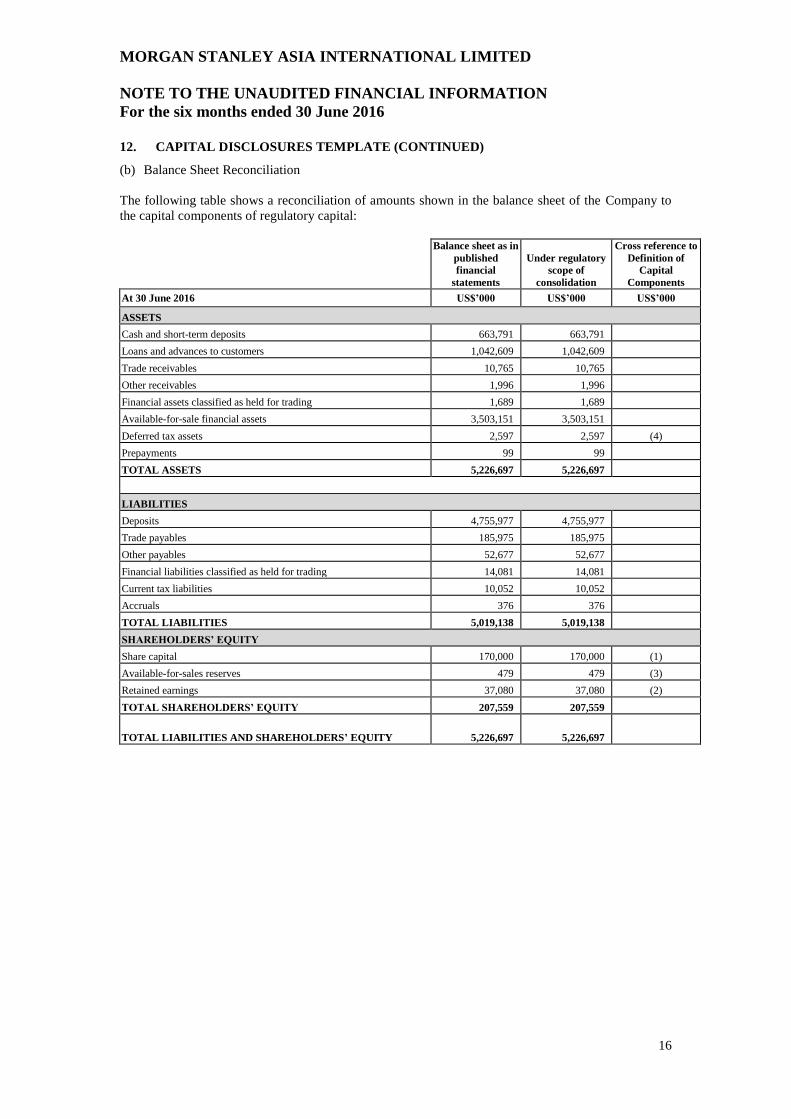
(b) Balance Sheet Reconciliation
The following table shows a reconciliation of amounts shown in the balance sheet of the Company to
the capital components of regulatory capital:
Balance sheet as in
published
financial
statements
Under regulatory
scope of
consolidation
Cross reference to
Definition of
Capital
Components
At 30 June 2016 US$’000 US$’000 US$’000
ASSETS
Cash and short-term deposits 663,791 663,791
Loans and advances to customers 1,042,609 1,042,609
Trade receivables 10,765 10,765
Other receivables 1,996 1,996
Financial assets classified as held for trading 1,689 1,689
Available-for-sale financial assets 3,503,151 3,503,151
Deferred tax assets 2,597 2,597 (4)
Prepayments 99 99
TOTAL ASSETS 5,226,697 5,226,697
LIABILITIES
Deposits 4,755,977 4,755,977
Trade payables 185,975 185,975
Other payables 52,677 52,677
Financial liabilities classified as held for trading 14,081 14,081
Current tax liabilities 10,052 10,052
Accruals 376 376
TOTAL LIABILITIES 5,019,138 5,019,138
SHAREHOLDERS’ EQUITY
Share capital 170,000 170,000 (1)
Available-for-sales reserves 479 479 (3)
Retained earnings 37,080 37,080 (2)
TOTAL SHAREHOLDERS’ EQUITY 207,559 207,559
TOTAL LIABILITIES AND SHAREHOLDERS’ EQUITY 5,226,697 5,226,697
MORGAN STANLEY ASIA INTERNATIONAL LIMITED
NOTE TO THE UNAUDITED FINANCIAL INFORMATION
For the six months ended 30 June 2016
17
12. CAPITAL DISCLOSURES TEMPLATE (CONTINUED)
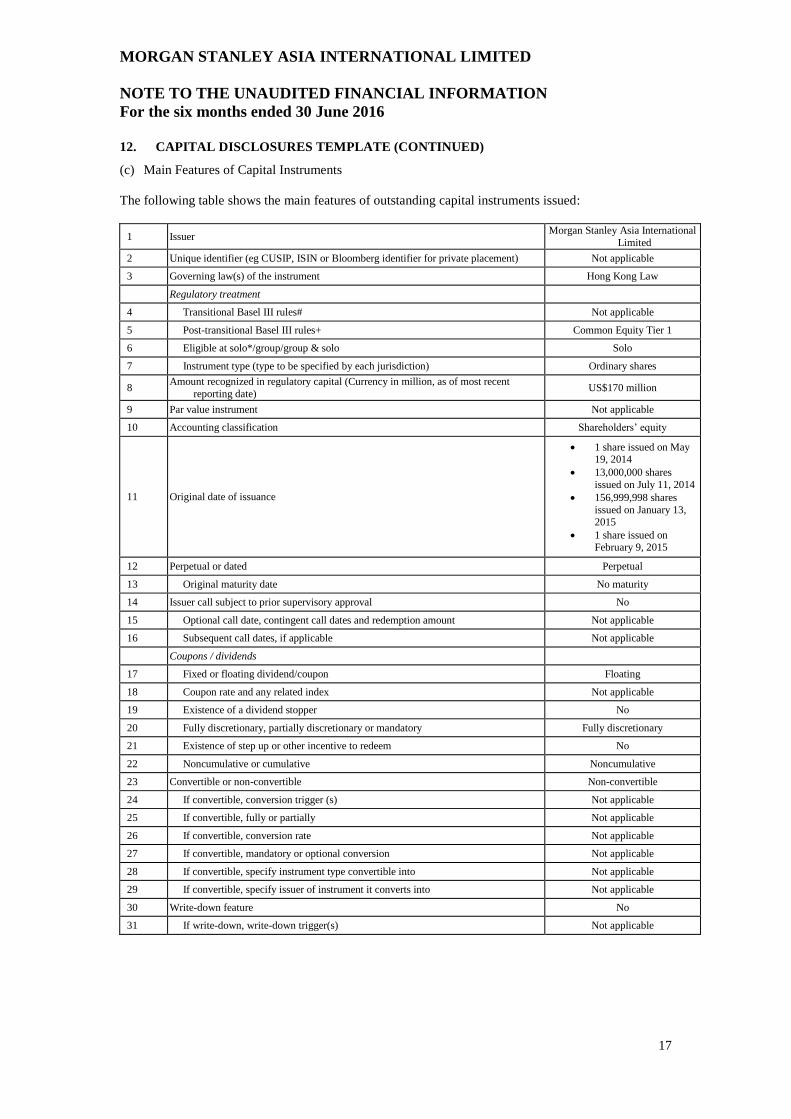
(c) Main Features of Capital Instruments
The following table shows the main features of outstanding capital instruments issued:
1 Issuer Morgan Stanley Asia International
Limited
2 Unique identifier (eg CUSIP, ISIN or Bloomberg identifier for private placement) Not applicable
3 Governing law(s) of the instrument Hong Kong Law
Regulatory treatment
4 Transitional Basel III rules# Not applicable
5 Post-transitional Basel III rules+ Common Equity Tier 1
6 Eligible at solo*/group/group & solo Solo
7 Instrument type (type to be specified by each jurisdiction) Ordinary shares
8 Amount recognized in regulatory capital (Currency in million, as of most recent
reporting date) US$170 million
9 Par value instrument Not applicable
10 Accounting classification Shareholders’ equity
11 Original date of issuance
1 share issued on May 19, 2014
13,000,000 shares
issued on July 11, 2014
156,999,998 shares
issued on January 13,
2015
1 share issued on February 9, 2015
12 Perpetual or dated Perpetual
13 Original maturity date No maturity
14 Issuer call subject to prior supervisory approval No
15 Optional call date, contingent call dates and redemption amount Not applicable
16 Subsequent call dates, if applicable Not applicable
Coupons / dividends
17 Fixed or floating dividend/coupon Floating
18 Coupon rate and any related index Not applicable
19 Existence of a dividend stopper No
20 Fully discretionary, partially discretionary or mandatory Fully discretionary
21 Existence of step up or other incentive to redeem No
22 Noncumulative or cumulative Noncumulative
23 Convertible or non-convertible Non-convertible
24 If convertible, conversion trigger (s) Not applicable
25 If convertible, fully or partially Not applicable
26 If convertible, conversion rate Not applicable
27 If convertible, mandatory or optional conversion Not applicable
28 If convertible, specify instrument type convertible into Not applicable
29 If convertible, specify issuer of instrument it converts into Not applicable
30 Write-down feature No
31 If write-down, write-down trigger(s) Not applicable
MORGAN STANLEY ASIA INTERNATIONAL LIMITED
NOTE TO THE UNAUDITED FINANCIAL INFORMATION
For the six months ended 30 June 2016
18
12. CAPITAL DISCLOSURES TEMPLATE (CONTINUED)
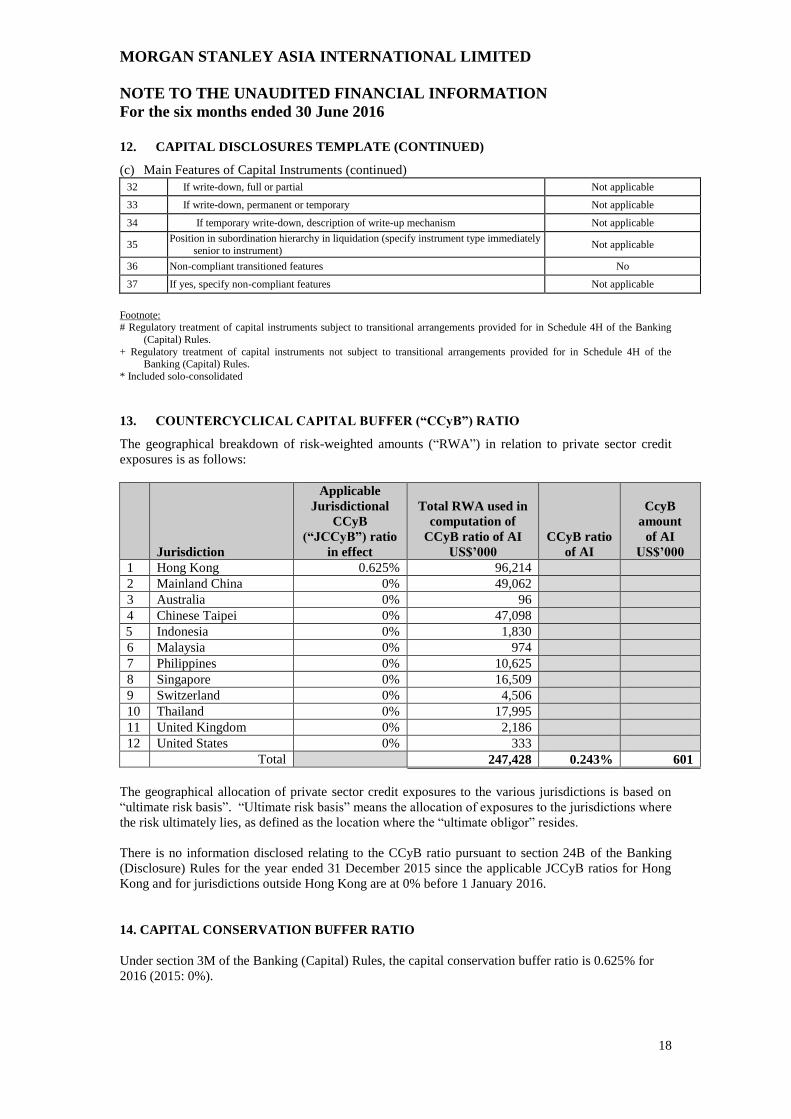
(c) Main Features of Capital Instruments (continued) 32 If write-down, full or partial Not applicable
33 If write-down, permanent or temporary Not applicable
34 If temporary write-down, description of write-up mechanism Not applicable
35 Position in subordination hierarchy in liquidation (specify instrument type immediately
senior to instrument) Not applicable
36 Non-compliant transitioned features No
37 If yes, specify non-compliant features Not applicable
Footnote: # Regulatory treatment of capital instruments subject to transitional arrangements provided for in Schedule 4H of the Banking
(Capital) Rules.
+ Regulatory treatment of capital instruments not subject to transitional arrangements provided for in Schedule 4H of the Banking (Capital) Rules.
* Included solo-consolidated
13. COUNTERCYCLICAL CAPITAL BUFFER (“CCyB”) RATIO
The geographical breakdown of risk-weighted amounts (“RWA”) in relation to private sector credit
exposures is as follows:
Jurisdiction
Applicable
Jurisdictional
CCyB
(“JCCyB”) ratio
in effect
Total RWA used in
computation of
CCyB ratio of AI
US$’000
CCyB ratio
of AI
CcyB
amount
of AI
US$’000
1 Hong Kong 0.625% 96,214
2 Mainland China 0% 49,062
3 Australia 0% 96
4 Chinese Taipei 0% 47,098
5 Indonesia 0% 1,830
6 Malaysia 0% 974
7 Philippines 0% 10,625
8 Singapore 0% 16,509
9 Switzerland 0% 4,506
10 Thailand 0% 17,995
11 United Kingdom 0% 2,186
12 United States 0% 333
Total 247,428 0.243% 601
The geographical allocation of private sector credit exposures to the various jurisdictions is based on
“ultimate risk basis”. “Ultimate risk basis” means the allocation of exposures to the jurisdictions where
the risk ultimately lies, as defined as the location where the “ultimate obligor” resides.
There is no information disclosed relating to the CCyB ratio pursuant to section 24B of the Banking
(Disclosure) Rules for the year ended 31 December 2015 since the applicable JCCyB ratios for Hong
Kong and for jurisdictions outside Hong Kong are at 0% before 1 January 2016.
14. CAPITAL CONSERVATION BUFFER RATIO
Under section 3M of the Banking (Capital) Rules, the capital conservation buffer ratio is 0.625% for
2016 (2015: 0%).
MORGAN STANLEY ASIA INTERNATIONAL LIMITED
NOTE TO THE UNAUDITED FINANCIAL INFORMATION
For the six months ended 30 June 2016
19
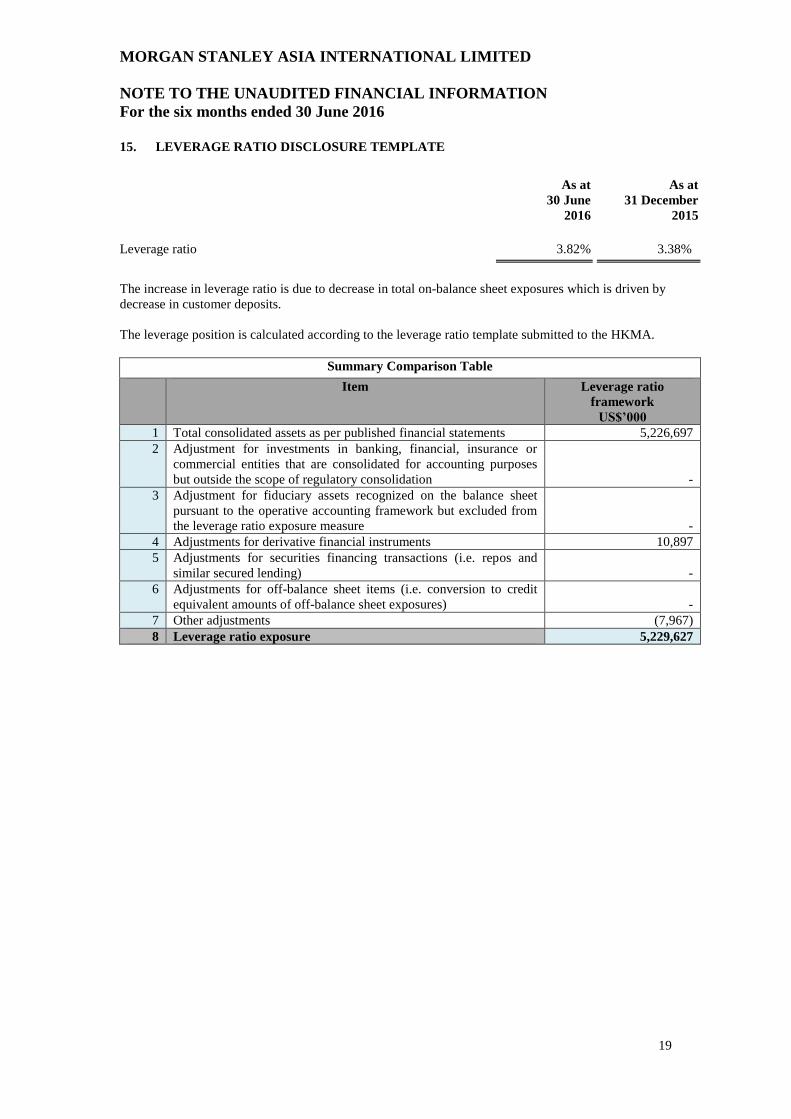
15. LEVERAGE RATIO DISCLOSURE TEMPLATE
As at
30 June
2016
As at
31 December
2015
Leverage ratio 3.82% 3.38%
The increase in leverage ratio is due to decrease in total on-balance sheet exposures which is driven by
decrease in customer deposits.
The leverage position is calculated according to the leverage ratio template submitted to the HKMA.
Summary Comparison Table
Item Leverage ratio
framework
US$’000
1 Total consolidated assets as per published financial statements 5,226,697
2 Adjustment for investments in banking, financial, insurance or
commercial entities that are consolidated for accounting purposes
but outside the scope of regulatory consolidation -
3 Adjustment for fiduciary assets recognized on the balance sheet
pursuant to the operative accounting framework but excluded from
the leverage ratio exposure measure -
4 Adjustments for derivative financial instruments 10,897
5 Adjustments for securities financing transactions (i.e. repos and
similar secured lending) -
6 Adjustments for off-balance sheet items (i.e. conversion to credit
equivalent amounts of off-balance sheet exposures) -
7 Other adjustments (7,967)
8 Leverage ratio exposure 5,229,627
MORGAN STANLEY ASIA INTERNATIONAL LIMITED
NOTE TO THE UNAUDITED FINANCIAL INFORMATION
For the six months ended 30 June 2016
20
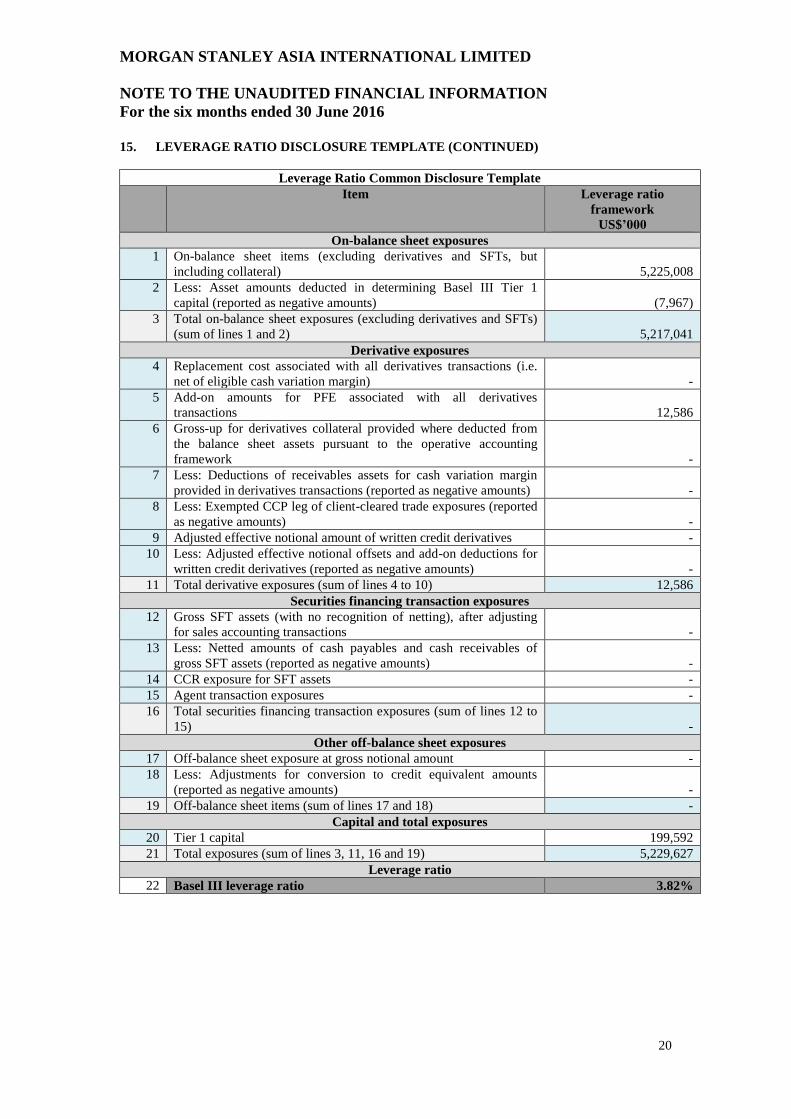
15. LEVERAGE RATIO DISCLOSURE TEMPLATE (CONTINUED)
Leverage Ratio Common Disclosure Template
Item Leverage ratio
framework
US$’000
On-balance sheet exposures
1 On-balance sheet items (excluding derivatives and SFTs, but
including collateral) 5,225,008
2 Less: Asset amounts deducted in determining Basel III Tier 1
capital (reported as negative amounts) (7,967)
3 Total on-balance sheet exposures (excluding derivatives and SFTs)
(sum of lines 1 and 2) 5,217,041
Derivative exposures
4 Replacement cost associated with all derivatives transactions (i.e.
net of eligible cash variation margin) -
5 Add-on amounts for PFE associated with all derivatives
transactions 12,586
6 Gross-up for derivatives collateral provided where deducted from
the balance sheet assets pursuant to the operative accounting
framework -
7 Less: Deductions of receivables assets for cash variation margin
provided in derivatives transactions (reported as negative amounts) -
8 Less: Exempted CCP leg of client-cleared trade exposures (reported
as negative amounts) -
9 Adjusted effective notional amount of written credit derivatives -
10 Less: Adjusted effective notional offsets and add-on deductions for
written credit derivatives (reported as negative amounts) -
11 Total derivative exposures (sum of lines 4 to 10) 12,586
Securities financing transaction exposures
12 Gross SFT assets (with no recognition of netting), after adjusting
for sales accounting transactions -
13 Less: Netted amounts of cash payables and cash receivables of
gross SFT assets (reported as negative amounts) -
14 CCR exposure for SFT assets -
15 Agent transaction exposures -
16 Total securities financing transaction exposures (sum of lines 12 to
15) -
Other off-balance sheet exposures
17 Off-balance sheet exposure at gross notional amount -
18 Less: Adjustments for conversion to credit equivalent amounts
(reported as negative amounts) -
19 Off-balance sheet items (sum of lines 17 and 18) -
Capital and total exposures
20 Tier 1 capital 199,592
21 Total exposures (sum of lines 3, 11, 16 and 19) 5,229,627
Leverage ratio
22 Basel III leverage ratio 3.82%
MORGAN STANLEY ASIA INTERNATIONAL LIMITED
NOTE TO THE UNAUDITED FINANCIAL INFORMATION
For the six months ended 30 June 2016
21
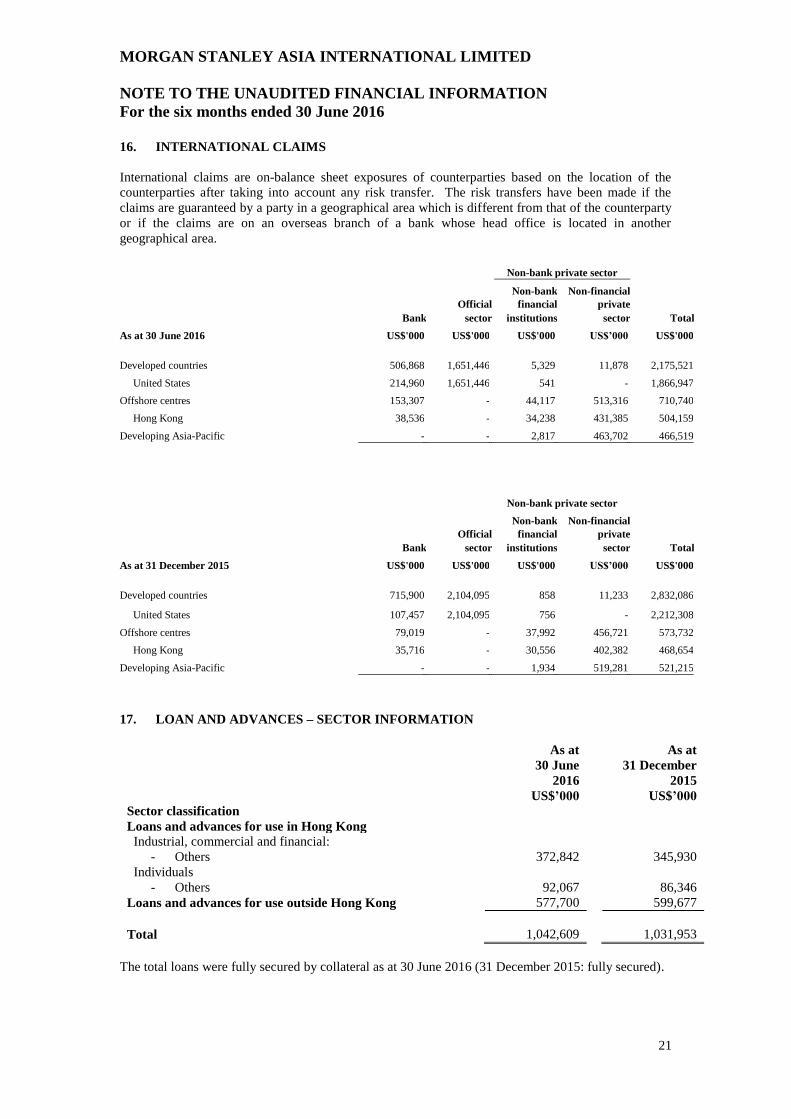
16. INTERNATIONAL CLAIMS
International claims are on-balance sheet exposures of counterparties based on the location of the
counterparties after taking into account any risk transfer. The risk transfers have been made if the
claims are guaranteed by a party in a geographical area which is different from that of the counterparty
or if the claims are on an overseas branch of a bank whose head office is located in another
geographical area.
Non-bank private sector
Non-bank Non-financial
Official financial private
Bank
sector institutions sector Total
As at 30 June 2016 US$'000 US$'000 US$'000
US$’000 US$'000
Developed countries 506,868 1,651,446 5,329 11,878 2,175,521
United States 214,960 1,651,446 541 - 1,866,947
Offshore centres 153,307 - 44,117 513,316 710,740
Hong Kong 38,536 - 34,238 431,385 504,159
Developing Asia-Pacific - - 2,817 463,702 466,519
Non-bank private sector
Non-bank Non-financial
Official financial private
Bank
sector institutions sector Total
As at 31 December 2015 US$'000 US$'000 US$'000
US$’000 US$'000
Developed countries 715,900 2,104,095 858 11,233 2,832,086
United States 107,457 2,104,095 756 - 2,212,308
Offshore centres 79,019 - 37,992 456,721 573,732
Hong Kong 35,716 - 30,556 402,382 468,654
Developing Asia-Pacific - - 1,934 519,281 521,215
17. LOAN AND ADVANCES – SECTOR INFORMATION
As at
30 June
2016
As at
31 December
2015
US$’000 US$’000
Sector classification
Loans and advances for use in Hong Kong
Industrial, commercial and financial:
- Others 372,842 345,930
Individuals
- Others 92,067 86,346
Loans and advances for use outside Hong Kong 577,700 599,677
Total 1,042,609 1,031,953
The total loans were fully secured by collateral as at 30 June 2016 (31 December 2015: fully secured).
MORGAN STANLEY ASIA INTERNATIONAL LIMITED
NOTE TO THE UNAUDITED FINANCIAL INFORMATION
For the six months ended 30 June 2016
22
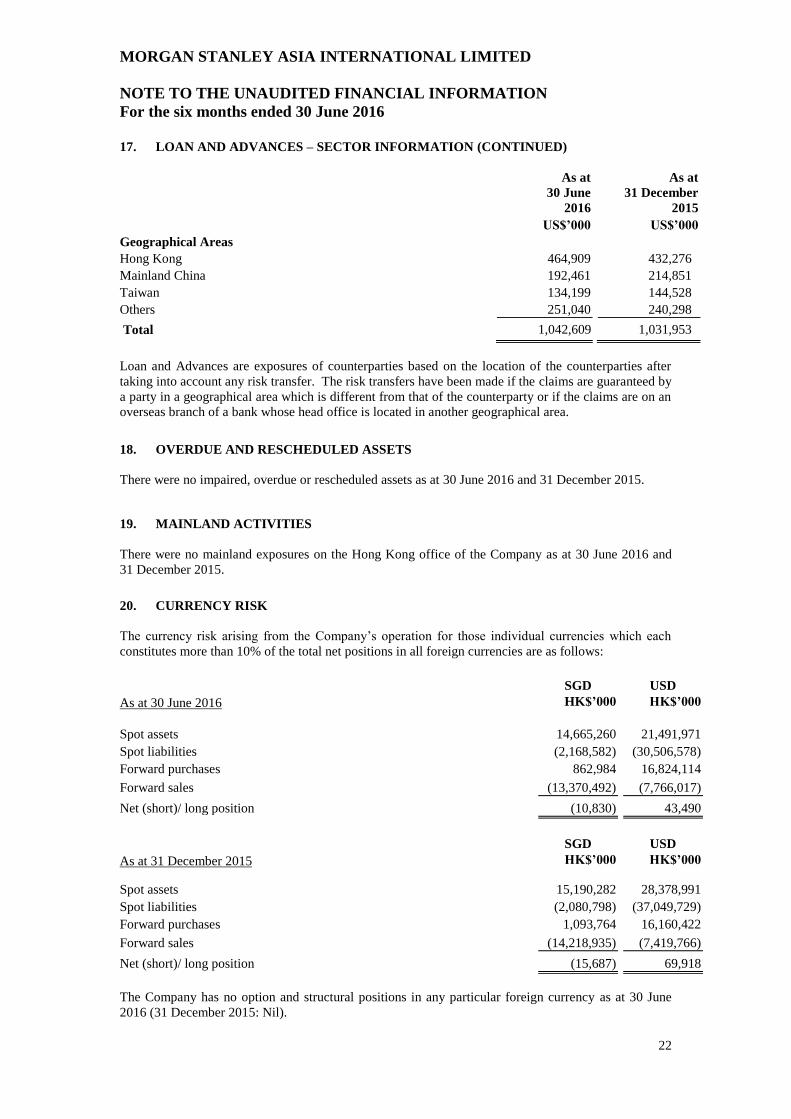
17. LOAN AND ADVANCES – SECTOR INFORMATION (CONTINUED)
As at
30 June
2016
As at
31 December
2015
US$’000 US$’000
Geographical Areas
Hong Kong 464,909 432,276
Mainland China 192,461 214,851
Taiwan 134,199 144,528
Others 251,040 240,298
Total 1,042,609 1,031,953
Loan and Advances are exposures of counterparties based on the location of the counterparties after
taking into account any risk transfer. The risk transfers have been made if the claims are guaranteed by
a party in a geographical area which is different from that of the counterparty or if the claims are on an
overseas branch of a bank whose head office is located in another geographical area.
18. OVERDUE AND RESCHEDULED ASSETS
There were no impaired, overdue or rescheduled assets as at 30 June 2016 and 31 December 2015.
19. MAINLAND ACTIVITIES
There were no mainland exposures on the Hong Kong office of the Company as at 30 June 2016 and
31 December 2015.
20. CURRENCY RISK
The currency risk arising from the Company’s operation for those individual currencies which each
constitutes more than 10% of the total net positions in all foreign currencies are as follows:
SGD USD
As at 30 June 2016 HK$’000 HK$’000
Spot assets 14,665,260 21,491,971
Spot liabilities (2,168,582) (30,506,578)
Forward purchases 862,984 16,824,114
Forward sales (13,370,492) (7,766,017)
(10,830) 43,490 Net (short)/ long position
SGD USD
As at 31 December 2015 HK$’000 HK$’000
Spot assets 15,190,282 28,378,991
Spot liabilities (2,080,798) (37,049,729)
Forward purchases 1,093,764 16,160,422
Forward sales (14,218,935) (7,419,766)
(15,687) 69,918 Net (short)/ long position
The Company has no option and structural positions in any particular foreign currency as at 30 June
2016 (31 December 2015: Nil).
MORGAN STANLEY ASIA INTERNATIONAL LIMITED
NOTE TO THE UNAUDITED FINANCIAL INFORMATION
For the six months ended 30 June 2016
23
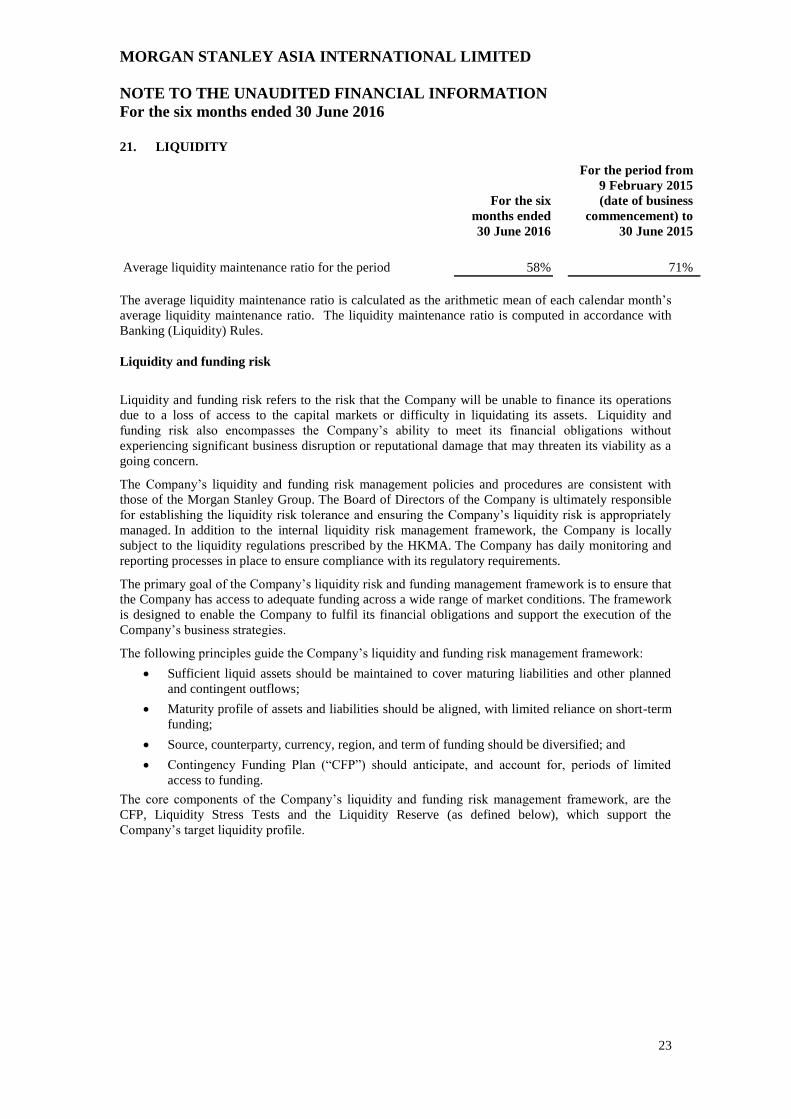
21. LIQUIDITY
For the six
months ended
30 June 2016
For the period from
9 February 2015
(date of business
commencement) to
30 June 2015
Average liquidity maintenance ratio for the period 58% 71%
The average liquidity maintenance ratio is calculated as the arithmetic mean of each calendar month’s
average liquidity maintenance ratio. The liquidity maintenance ratio is computed in accordance with
Banking (Liquidity) Rules.
Liquidity and funding risk
Liquidity and funding risk refers to the risk that the Company will be unable to finance its operations
due to a loss of access to the capital markets or difficulty in liquidating its assets. Liquidity and
funding risk also encompasses the Company’s ability to meet its financial obligations without
experiencing significant business disruption or reputational damage that may threaten its viability as a
going concern.
The Company’s liquidity and funding risk management policies and procedures are consistent with
those of the Morgan Stanley Group. The Board of Directors of the Company is ultimately responsible
for establishing the liquidity risk tolerance and ensuring the Company’s liquidity risk is appropriately
managed. In addition to the internal liquidity risk management framework, the Company is locally
subject to the liquidity regulations prescribed by the HKMA. The Company has daily monitoring and
reporting processes in place to ensure compliance with its regulatory requirements.
The primary goal of the Company’s liquidity risk and funding management framework is to ensure that
the Company has access to adequate funding across a wide range of market conditions. The framework
is designed to enable the Company to fulfil its financial obligations and support the execution of the
Company’s business strategies.
The following principles guide the Company’s liquidity and funding risk management framework:
Sufficient liquid assets should be maintained to cover maturing liabilities and other planned
and contingent outflows;
Maturity profile of assets and liabilities should be aligned, with limited reliance on short-term
funding;
Source, counterparty, currency, region, and term of funding should be diversified; and
Contingency Funding Plan (“CFP”) should anticipate, and account for, periods of limited
access to funding.
The core components of the Company’s liquidity and funding risk management framework, are the
CFP, Liquidity Stress Tests and the Liquidity Reserve (as defined below), which support the
Company’s target liquidity profile.
MORGAN STANLEY ASIA INTERNATIONAL LIMITED
NOTE TO THE UNAUDITED FINANCIAL INFORMATION
For the six months ended 30 June 2016
24
21. LIQUIDITY (CONTINUED)
Liquidity and funding risk (continued)
Contingency Funding Plan
CFP describes the data and information flows, limits, targets, operating environment indicators,
escalation procedures, roles and responsibilities, and available mitigating actions in the event of a
liquidity stress. The CFP also sets forth the principal elements of the liquidity stress testing which
identifies stress events of different severity and duration, assesses current funding sources and uses and
establishes a plan for monitoring and managing a potential liquidity stress event.
Liquidity Stress Tests
The Company uses Liquidity Stress Tests to model liquidity outflows across multiple scenarios over a
range of time horizons. These scenarios contain various combinations of idiosyncratic and systemic
stress events.
The assumptions underpinning the Liquidity Stress Tests include, but are not limited to, the following:
withdrawal of customer deposits;
no government support;
no access to equity and unsecured debt markets;
repayment of all unsecured debt maturing within the stress horizon;
additional collateral that would be required by trading counterparties, certain exchanges and
clearing organisations related to credit rating downgrades;
drawdowns on unfunded commitments provided to customers; and
limited access to the foreign exchange swap markets
The Liquidity Stress Tests are produced for the Company, to capture specific cash requirements and
cash availability. The Liquidity Stress Tests assume that a legal entity will use its own liquidity first to
fund its obligations before drawing liquidity from its ultimate parent undertaking, Morgan Stanley.
Morgan Stanley will support its subsidiaries and will not have access to subsidiaries’ liquidity reserve
that are subject to any regulatory, legal or tax constraints. In addition to the assumptions underpinning
the Liquidity Stress Tests, the Company takes into consideration the settlement risk related to intra-day
settlement and clearing of securities and financing activities.
At 30 June 2016, the Company maintained sufficient liquidity to meet current and contingent funding
obligations as modelled in its Liquidity Stress Tests.
Liquidity Reserve
The Company maintains sufficient liquidity reserves (“Liquidity Reserve”) to cover daily funding
needs and to meet strategic liquidity targets sized by the CFP and Liquidity Stress Tests. The size of
the Liquidity Reserve is actively managed by the Company. The following components are considered
in sizing the Liquidity Reserve; unsecured debt maturity profile, balance sheet size and composition,
funding needs in a stressed environment inclusive of contingent cash outflows and collateral
requirements. Additionally, the Company’s Liquidity Reserve includes an additional reserve, which is
primarily a discretionary surplus based on the Company’s risk tolerance and is subject to change
dependent on market and firm-specific events.
The Company holds its own Liquidity Reserve which is composed of diversified cash and cash
equivalents and unencumbered highly liquid securities.
Eligible unencumbered highly liquid securities include primarily non-US government securities in
addition to US government securities and other highly liquid investment grade securities.
MORGAN STANLEY ASIA INTERNATIONAL LIMITED
NOTE TO THE UNAUDITED FINANCIAL INFORMATION
For the six months ended 30 June 2016
25
21. LIQUIDITY (CONTINUED)
Liquidity and funding risk (continued)
Funding Management
The Company manages its funding in a manner that reduces the risk of disruption to the Company’s
operations. The Company pursues a strategy of diversification of secured and unsecured funding
sources and attempts to ensure that the tenor of the Company’s liabilities equals or exceeds the
expected holding period of the assets being financed.
The Company funds itself through diverse sources. These sources may include equity capital, long-
term debt and deposits.
Balance sheet management
In managing both the Morgan Stanley Group’s and the Company’s funding risk the composition and
size of the entire balance sheet, not just financial liabilities, is monitored and evaluated. A substantial
portion of the Morgan Stanley Group’s total assets consists of liquid marketable securities and short-
term receivables arising principally from its Institutional Securities business segment’s sales and
trading activities. The liquid nature of these assets provides the Morgan Stanley Group and the
Company with flexibility in managing the size of its balance sheet.