Embed Size (px)
Citation preview
Morphometric Analysis of Cartesian Coordinates of the Human Skull
ROBERT A. BENFER Department of Anthropology, University of Missouri-Columbia, Columbia, Missouri 65201
KEY WORDS Anthropometry . Multivariate . Skull.
ABSTRACT A method for locating the three dimensional coordinates of cra- nial landmarks with respect to the Frankfort, midsagittal, and coronal planes is presented. Sliding calipers were used to obtain the distances from left and right porion and apex to each landmark, except for a few points where spreading cal- ipers are required. In the present example, 35 landmarks (for a total of 105 mea- surements) were located for each of 35 Peruvian precolumbian skulls. These dis- tances were entered into a program (SKULL) which calculates the Cartesian coordinates of each landmark. The XYZ coordinates of each landmark contain all the information necessary for calculation of the distances between any two land- marks, and these distances may also be obtained as output from program SKULL, if desired (595 distances if all 35 landmarks are used).
Reliability of the location of coordinates was determined by comparing com- puted distances among selected landmarks from program SKULL with traditional anthropometric measurements. Satisfactory agreements were found. Direct multi- variate analysis of the coordinates of the landmarks produced insights not avail- able in traditional multivariate analysis of conventional anthropometric mea- suremen ts.
Traditional anthropometric expressions of the variability in the cranium and man- dible have usually emphasized distances and angles between two or more landmarks. Howells (‘69a) has suggested the value of radius measurements obtained by coordi- nate calipers. In the same report he also proposed that angles be computed rather than directly measured. In a photogram- metric study (Benfer and Page, ’71) land- marks were projected into two dimensions using the techniques of Gavan and others (‘52). Patterns of covariation revealed by factor analysis were not merely two dimen- sional in scope, despite intuitive expecta- tions. However, before analysis of these data, i t had occurred to me that any set of three dimensional coordinates of anatom- ical points contains all of the information developed by distances, radii obtained by coordinate calipers, and angles between landmarks. Oxnard (‘73, p 11) makes the same point. Subsequent work was directed toward developing a simple and reliable technique for obtaining these coordinates. While the automated methods of Thomp-
AM. J. P w s . ANTHROP., 42: 371-382.
son and Popovich (‘74) may be useful in many circumstances, I have found that accurate photogrammetry is very time con- suming and difficult to execute under field circumstances. For comparative studies in foreign museums and laboratories, a coordinate producing technique should re- quire a minimum of special equipment.
Another desirable feature of such coordi- nates would be to refer them to three func- tionally important planes. The Frankfort, midsagittal, and coronal planes were se- lected. Referring points to these three planes will parsimoniously store informa- tion from which distances and angles may easily be computed if desired. In addition, these coordinate data might be of consid- erable functional importance, since the planes correspond to the orientation of the skull during much of waking life. The prob- lem of spanning growth centers by tradi- tional measurements is also to some extent avoided.
French workers have independently de- vised a system for producing three di- mensional coordinates from radiographs
371
372 ROBERT A. BENFER
(Claude, '70), but one different plane of reference is chosen. Claude ('70) suggests problems of homology may be reduced using coordinate data instead of traditional measurements. A general approach to the study of form in three dimensions is under- way at the Biostereometrics Laboratory, Baylor College of Medicine (Herren, '73), and stereophotogrammetry and stereoradi- ography are under development at the Uni- versity of Missouri (James A. Gavan, direc- tor of research).
It is a simple matter to calculate one or two dimensional coordinates from photo- graphs or radiographs. The three dimen- sional methods of Thompson and Popovich ('74) are much more complex. A computer program. SKULL, has been prepared to translate simple measurements among land- marks into three dimensional coordinates. The solution was very time consuming, and the availability of this program should prove helpful to other workers interested in three dimensional analysis (Fortran IV listing available from author on request).
The process of referring landmarks to three planes is illustrated below with a small sample of Peruvian skulls. Rotated principal components factor analysis of the Cartesian coordinates produces interesting information about size and shape varia- tions in human crania.
SAMPLE
Thirty-five largely complete skulls pro- vided by Dr. Frederic Engel from the Insti- tuto de Antropologia y Agricultura Pre- colombina, Lima, Peru, were measured in Lima during July and August of 1970. Non- metric data and measurements and obser- vations for the postcranial remains are not discussed here. An expanded sample of den- tal materials was studied in the summer of 1973 (Scott, '73). The final sample con- sidered here is composed of 35 crania in- cluding both sexes, two juveniles, and two strongly and three weakly cranially de- formed individuals (table 1). Therefore, multivariate analysis of variation in the Cartesian coordinates includes several sources of crania within population varia- tion. In multivariate studies of human and nonhuman primates, for example, sexual dimorphism is often strongly expressed (al- though see Boyce, '64, for an example where sexual dimorphism was less impor-
TABLE 1
Estimated age and sex of skeletal material
Estimated Sex age in unesti- years Probably male Probably female mated
5-9 10-1 4 15-19 20-24
25-29 30-34
35-39 4 0 4 4 45-49 50-59
2 32 1
(including one of questionable sex)
32 42 61
(including one of questionable sex)
8 3 1
1 1 '
2
Totals 17 16 2
1 Includes one tabular erect deformed. 2 Includes one slight asymmetrical occipital deformed.
tant). However, some multivariate studies (Landauer, '62), have included males and females without mentioning sexual di- morphism. Blackith and Reyment ('71, Chap. 29) present a good review of multi- variate studies of sexual dimorphism. Age variability should produce a smaller source of variation due to the small number (two) of juveniles. Two deformed crania (tabular erect) and four possible occipitally deformed skulls are included in the sample, and in- fluenced the results (Page, '74, for a com- plete analysis of the effects of these biolog- ical sources of variation; Page also discusses the influence of diet and changing sub- sistence strategies). These 35 skulls are dated from associated remains by the Car- bon-14 radiometric method from 1,000 to 9,000 B.P. (Engel, '69). Most of the skulls come from the central coastal regions of Peru with a few from the coastal valleys. While small, this well documented and overall fairly homogeneous appearing sam- ple is large enough to serve as a realistic test of the method.
The small size of this sample may seem a disadvantage, and of course for some pur- poses it is. However, the quality (careful excavation, availability of extensive cultur- al information, restriction to a limited geo- graphic area, and preservation) is very good. Extremely large samples are not nec-
CARTESIAN COORDINATES OF THE SKULL 373
essarily superior to smaller, more adequate- ly documented series, except possibly for statistical inference where attention cen- ters on the rejection of hypotheses (Ben- fer, '68). [It is a common error to suppose that assumptions necessary for statistical inference must also be made for statistical description (for example see Kowalski, '72). Gower ('66) describes a descriptive multi- variate approach.] As a descriptive tool, multivariate analysis can be applied to any sample greater than three, and if multi- variate analysis is to continue to be a useful anthropological tool, it should be evaluated for use with samples of various sizes.
The heterogeneity of the sample with re- spect to sex, age, subsistence, and cranial deformation is a decided advantage in eval- uating reliability of the SKULL program and procedures, since a maximum amount of covariance is produced in a small sample. The heterogeneity would be a disadvantage in multivariate analyses if not recognized. However, John W. Page has completed work ('74) in analyzing the potential formation of biological patterns of covariation. These re- sults lend additional support to the use of multivariate analyses of small samples.
METHODS
All landmarks were marked by pencil directly on each skull. Each of 35 tradition- al landmarks (including paired lateral points) were measured from left and right porion and apex for a total of 105 measure- ments on complete specimens by myself and an associate, Dr. B. Miles Gilbert. We compared techniques and results during measurement of the sample to minimize interobserver error. Observed differences between Gilbert and myself were small, and no differences greater than would be expected by chance less than five times out of a hundred were found (Page, in prep- aration). No consistent biases were ob- served. Since this report is meant to serve as an introduction to a method rather than a final report, precise descriptions of the landmarks used are not given (see Page, '74, for a complete discussion). They corre- spond to those presented by Howells ('73); those not mentioned by Howells are docu- mented by Comas ('60). Most measurements from apex and porion to landmarks were obtained with sliding calipers, but spread- ing calipers were necessary for a few. The
105 distances were entered into a program prepared for the purpose of calculating three dimensional coordinates of each land- mark with respect to the Frankfort, coronal, and midsagittal planes (Program SKULL; written by James Davis). The program alge- braically calculates the three dimensional XYZ coordinates of each landmark. These coordinates measure, for each landmark, anterior or posterior distance from the cor- onal plane, the superior or inferior distance from the Frankfort plane, and the left or right lateral distance from the midsagittal plane. Posterior, inferior, and left distances are arbitrarily coded negative to distinguish them from anterior, superior, or right devi- ations from the respective planes. The ad- vantage of the technique is that using only simple anthropometric tools, sliding and spreading calipers and a headspanner, a three dimensional representation of each skull is produced. Traditional anthropomet- ric measurements focus on the distance of one landmark to another landmark or oc- casionally to a plane or axis. Simple dis- tances among landmarks are input to SKULL, output are coordinate measure- ments - the distance from each landmark to the three planes. The present version of program SKULL accepts up to 35 land- marks (table 2, column 1 for landmarks) in any order. Additional landmarks can be added by simple modification of the pro- gram, and missing or unwanted landmarks can simply be omitted. Distance between all combinations of landmarks may also be obtained as optional output. Thus n(n - 1)/2 = (35) x (34)/2 = 595measurements result from only 3n(3 X 35 = 105) original measurements, where n is the number of landmarks. An almost infinite number of angles between points, points and planes, and between planes could be calculated by additions to the program if desired. For this study selected computed distances be- tween landmarks were compared with a small sample of traditional anthropometric measurements of the skulls to assess relia- bility of the technique.
Howells ('69b) has described the advan- tages of multivariate analysis of human skeletal populations. The skeptical reader is referred to Blackith and Reyment ('71), Oxnard ('73), and Davis ('73) for a broader perspective as to the merits and limitations of multivariate research models. In the
3 74 ROBERT A. BENFER
present descriptive study, the distance of each landmark from each of the three planes is analyzed as data by principal components factor analysis of the correla- tion matrix. Since the sample of skulls is morphologically relatively homogeneous, common factor analysis may be a more appropriate model. Nevertheless, principal components factor analysis was selected since the operational difference between the two models usually involves only the choice of what value to place in the princi- pal diagonal. With so many variables (105), the choice of communality could not appre- ciably affect the results unless the off diag- onal correlations were all near zero, an unknown case with morphometric variables. Elsewhere I have extensively described and illustrated the factor analysis technique (Benfer, '72). A complete introduction to the method can be found in Rummel ('70). Brown ('67) compares various models with a sample of Australian crania. Oxnard ('73, pp 39-42) provides a simple introduc- tion and Gower ('66) and Howells ('73, Ap- pendix D), a more detailed examination of principal components analysis. Some re- cent successful studies using this approach have appeared in this journal (for example, Choi and Trotter, '70; Van Gerven, '72; Corrucc ini, '73).
Any symmetric matrix R may be repro- duced by right multiplying some matrix X by its transpose, X ' . This equation, ex- pressed in matrix algebra as R = X X ' is the basic theorem of factor analysis (Har- man, '67, pp. 24-28 for a clear proof'). The matrix X is a factor matrix when R is a normalized cross-products, variance-covar- iance, distance, correlation, or in general, any similarity matrix. The vectors of X give the direction cosines of lines passed through the sample mean. One widely used technique for producing such lines is prin- cipal components analysis, which maxi- mizes the sums of squares of the projec- tions of the points on the lines (Gower, '66, p. 327). The correlation matrix has been the starting point for most principal com- ponents analysis of measurements. Corre- lation coefficients are summaries of the linear relationships among pairs of mea- surements. Factors are summaries of the linear relationships among the correlation coefficients. At the most mundane level, factors are useful in interpreting correla-
tion matrices. Measurements which have similar loading patterns tend to be inter- correlated and vice-versa.
The first principal component is a straight line passed through the center of a swarm of standardized data points, where each point locates a single measurement in spec- imen space. In two dimensional space the first principal component may be visualized as the major axis of an ellipse formed from data points; in three or more dimensions, the major axis of an ellipsoid. A second line may be passed through the first at right an- gles (in an orthogonal solution) or oblique- ly, so that the sum of the squared deviations from it is also maximized, and the proce- dure can be continued until all or nearly all of the variance is removed. In an oblique solution, the axes or underlying patterns of covariation may be intercorrelated, a pos- sibly more realistic model for many func- tional complexes. However, an oblique solution with the present data resulted in very slight intercorrelations among the components (only 10 out of 231 were great- er than 0.20; none was greater than 0.25), and the orthogonal rotated solution is pre- sented. The intercorrelations among the components will be mentioned where appro- priate. The variance about each line (ei- genvalue for the unrotated components) indicates the importance of each compo- nent (eigenvector) with respect to the sam- ple of variables. The eigenvectors are usual- ly normalized to a length equal to their variance (eigenvalue). When the eigenval- ue drops below unity, subsequent compo- nents account for less variance than a sin- gle original variable. Small components are often considered trivial and discarded, although workers in other disciplines some- times find these latter components to be of special interest (Van de Geer, '71). The major axes of the ellipsoids locate each original data point. Often, a relatively small number of components will allow the points to be located in the reduced space while preserving to a great degree the dis- tance among entities that would be ob- tained by computation from all of the data (Gower, '66, p. 327). In the present exam- ple, correlations among all measured and estimated distances were obtained, and a principal components program with Vari- max rotation of all components with eigen- values greater than unity (Program FAC-
CARTESIAN COORDINATES OF THE SKULL 375
TOR, described in Veldman, ’67) was used to obtain components. Analysis of the cross- products matrix would have yielded some information lost by the standardization of variables in correlational analysis. But since the primary purpose of this paper is to demonstrate patterns of similarities in the relationships among the coordinate val- ues, the correlation matrix is more conve- nient. Rotating the axes to better indicate clusters of variables is not considered de- sirable by some workers (Gower, ’66; Black- ith and Reyment, ’71), as the unrotated components better account for the variance in the data where each is a maximum, a condition not usually preserved following rotation. However, rotated components are superior in parsimoniously locating clusters of intercorrelated variables (Cattell, ’65a). The major disadvantage of unrotated fac- tors or components is that “the factor load- ings for each variable are dependent on all the variables included in the analysis” (Rummel, ’70, p. 375), whereas rotated fac- tors may be invariant across samples.
“Invariant factors will delineate the same cluster of variables as long as some variables defining the clusters are included in the anal- ysis, regardless of the inclusion or exclusion of variables unrelated to the cluster” (Rum- mel, ’70, p. 381 ).
This vital property for comparisons is often overlooked by biologists whose primary in- terests are in patterns among specimens rather than in replicable patterns among complexes of measurements. For example, work is presently underway at the Univer- sity of Missouri to collect a larger sample of well documented American Indian crania from a variety of geographical locations and subsistence patterns for comparative co- ordinate analysis. Accidents of preserva- tion subtract landmarks from some sam- ples, and improved understanding of morphology from preliminary work have suggested additions to others. Meaningful comparison of the major unrotated compo- nents in these groups would be impossible. While canonical variates or discriminant function analysis could be used in such comparative studies, the obtained axes cannot be expected to make genetic or ana- tomical sense (Howells, ’73, p. 142). In any case, orthogonal rotation preserves all interpoint distances exactly as they were in unrotated space and therefore will serve
as one model for the explanation of the major patterns of morphological variability. In the present study, invariant clusters of measurements are desired to help evaluate the use of XYZ coordinate data.
RESULTS
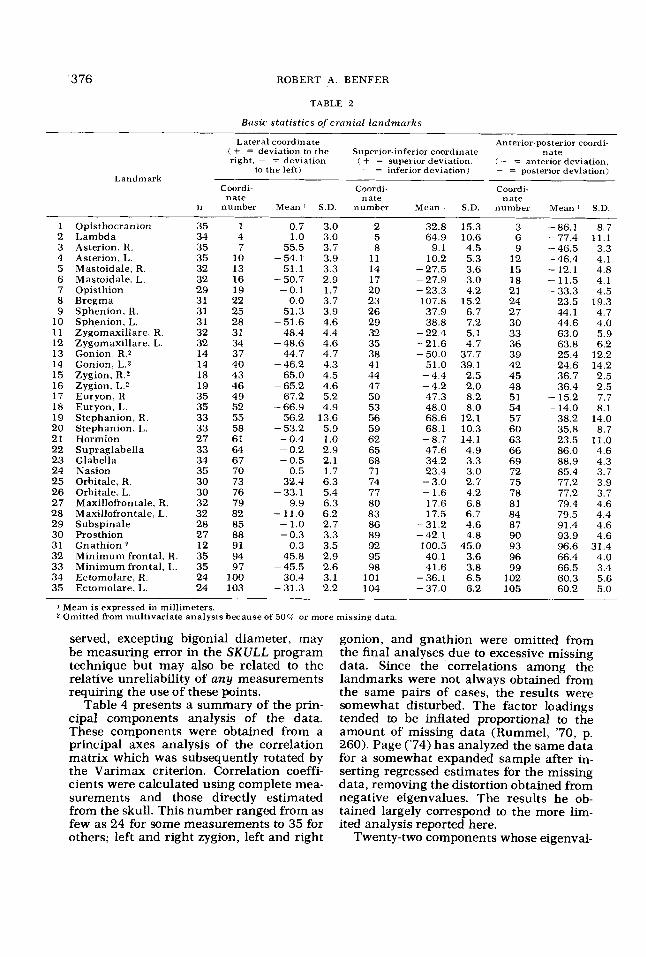
Table 2 lists the average distance of each landmark from each of the three planes. Opisthocranion, for example, is found to be on the average 86 mm posterior to the coronal plane. Glabella is found to be 89 mm anterior to the same plane. Since both points lie approximately in the midsagittal plane, we know the average length of cra- nia in this sample is 86 + 89 = 175 mm.
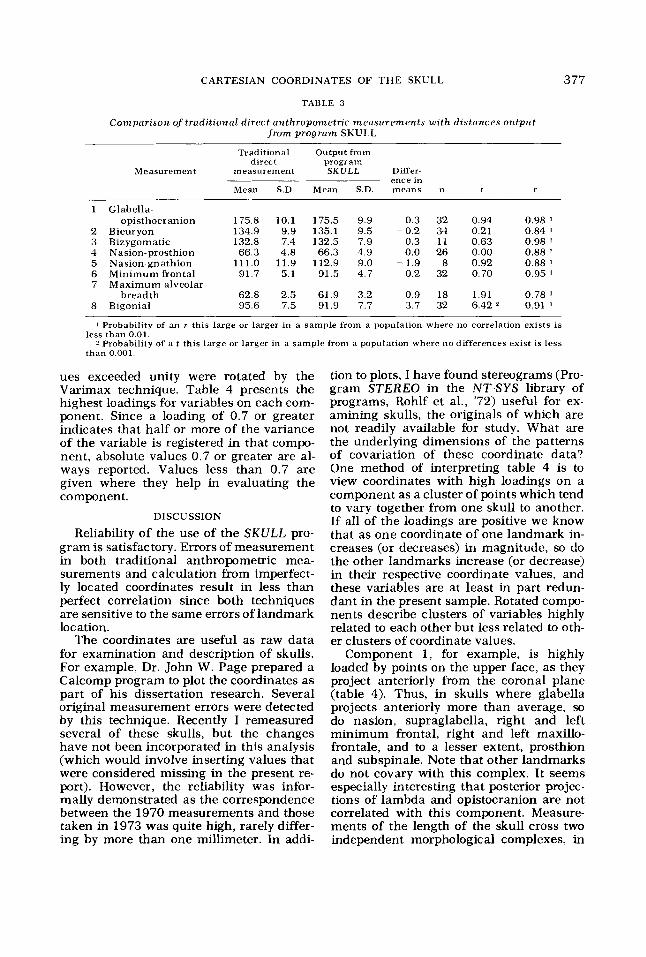
Table 3 presents the results of com- paring eight conventional anthropometric measurements with distances among the 16 landmarks computed by program SKULL. Differences among the means of the tradi- tional anthropometric measurements and the distances computed by program SKULL from the coordinates are found in table 3. Only one difference is observed to be great- er than might be expected by chance at the 0.05 level, the bigonial diameter. A problem with the location of gonion was de- tected in the field; the diameter measured with sliding calipers tended to incorrectly utilize the most lateral points on the gonial angle, whereas the points marked for loca- tion by the SKULL program were the most inferior lateral points on the gonial angle. Thus, the SKULL program bigonial diam- eter was systematically smaller than the traditional anthropometric measurement. Only two other measurements differed by as much as one mm on the average; the nasion-gnathion measurement and the maximum alveolar breadth. The difficulties of locating the maximum alveolar point were apparent in the field. Note that the standard deviations do not differ appre- ciably, and are smaller for the SKULL pro- cedure in half of the comparisons.
Intercorrelation of the eight pairs sug- gested that the similarities are much great- er than would be expected by chance (table 3). Note the bigonial diameter correlation of more than 0.9 between the conventional technique and the SKULL procedure. Over- all, the landmarks which produced the low- est agreement between the two approaches probably are intrinsically difficult to locate accurately. Thus the small differences ob-
3 76 ROBERT A. BENFER
TABLE 2
Basic statistics of cranial landmarks
Lateral coordinate Anterior-posterior coordi- ( + = deviation to the Superior-inferior coordinate nate right. - = deviation C + = superior deviation, ( + = anterior deviation,
to the left) - = inferior deviation) - = posterior deviation) Landmark
Coordi- Coordi- Coordi- nate nate nate
n number Mean I S.D. number Mean1 S.D. number Mean ' S.D.
1 2 3 4 5 6 7 8 9
10 11 12 13 14 15 16 17 18 19 20 21 22 23 24 25 26 27 28 29 30 31 32 33 34 35
Opisthocranion Lambda Asterion, R. Asterion, L. Mastoidale, R. Mastoidale, L. Opisthion Bregma Sphenion, R. Sph,enion, L. Zygomaxillare, R. Zygomaxillare, L. Gonion, R.2 Gonion, L.2 Zygion, R . 2 Zygion, L.2 Euryon, R. Euryon, L. Stephanion, R. Stephanion, L. Hormion Supraglabella Glabella Nasion Orbitale, R. Orbitale, L. Maxillofrontale, R. Maxillofrontale, L. Subspinale Prosthion Gnathion Minimum frontal, R Minimum frontal, L. Ectomolare, R. Ectomolare, L.
35 34 35 35 32 32 29 31 31 31 32 32 14 14 18 19 35 35 33 33 27 33 34 35 30 30 32 32 28 27 12 35 35 24 24
1 4 7
10 13 16 19 22 25 28 31 34 37 40 43 46 49 52 55 58 61 64 67 70 73 76 79 82 85 88 91 94 97
100 103
0.7 3.0 1.0 3.0
55.5 3.7 -54.1 3.9
51.1 3.3 -50.7 2.9 -0.1 1.7
0.0 3.7 51.3 3.9
-51.6 4.6 48.4 4.4
-48.6 4.6 44.7 4.7
-46.2 4.3 65.0 4.5
-65.2 4.6 67.2 5.2
-66.9 4.9 56.2 13.6
-53.2 5.9 -0.4 1.0 -0.2 2.9 -0.5 2.1 -0.5 1.7 32.4 6.3
-33.1 5.4 9.9 6.3
- 11.0 6.2 -1.0 2.7 -0.3 3.3
0.3 3.5 45.8 2.9
30.4 3.1 -45.5 2.6
-31.3 2.2
2 5 8
11 14 17 20 23 26 29 32 35 38 41 44 47 50 53 56 59 62 65 68 71 74 77 80 83 86 89 92 95 98
101 104
32.8 15.3 64.9 10.6
9.1 4.5 10.2 5.3
-27.5 3.6 -27.9 3.0 -23.3 4.2 107.8 15.2 37.9 6.7 38.8 7.2
-22.4 5.1 -21.6 4.7 -50.0 37.7 -51.0 39.1
-4.4 2.5 -4.2 2.0 47.3 8.2 48.0 8.0 68.6 12.1 68.1 10.3
-8.7 14.1 47.6 4.9 34.2 3.3 23.4 3.0
-3.0 2.7 - 1.6 4.2 17.6 6.8 17.5 6.7
-31.2 4.6 -42.1 4.8
-100.5 45.0 40.1 3.6 41.6 3.8
-36.1 6.5 -37.0 6.2
3 6 9
12 15 18 21 24 27 30 33 36 39 42 45 48 51 54 57 60 63 66 69 72 75 78 81 84 87 90 93 96 99
I02 I05
-86.1 8.7 -77.4 11.1 -46.5 3.3 -46.4 4.1 -12.1 4.8 -11.5 4.1 -33.3 4.5
23.5 19.3 44.1 4.7 44.6 4.0 63.0 5.9 63.8 6.2 25.4 12.2 24.6 14.2 36.7 2.5 36.4 2.5
- 15.2 7.7 - 14.0 8.1
38.2 14.0 35.8 8.7 23.5 11.0 86.0 4.6 88.9 4.3 85.4 3.7 77.2 3.9 77.2 3.7 79.4 4.6 79.5 4.4 91.4 4.6 93.9 4.6 96.6 31.4 66.4 4.0 66.5 3.4 60.3 5.6 60.2 5.0
I Mean is expressed in millimeters. 2 Omitted from multivariate analysis because of 5 0 4 or more missing data
served, excepting bigonial diameter, may be measuring error in the SKULL program technique but may also be related to the relative unreliability of any measurements requiring the use of these points.
Table 4 presents a summary of the prin- cipal components analysis of the data. These components were obtained from a principal axes analysis of the correlation matrix which was subsequently rotated by the Varimax criterion. Correlation coeffi- cients were calculated using complete mea- surements and those directly estimated from the skull. This number ranged from as few as 24 for some measurements to 35 for others; left and right zygion, left and right
gonion, and gnathion were omitted from the final analyses due to excessive missing data. Since the correlations among the landmarks were not always obtained from the same pairs of cases, the results were somewhat disturbed. The factor loadings tended to be inflated proportional to the amount of missing data (Rummel, '70, p. 260). Page ('74) has analyzed the same data for a somewhat expanded sample after in- serting regressed estimates for the missing data, removing the distortion obtained from negative eigenvalues. The results he ob- tained largely correspond to the more lim- ited analysis reported here.
Twenty-two components whose eigenval-
CARTESIAN COORDINATES OF THE SKULL
TABLE 3
C o m p a r i s o n of tradi t ional d i rec t an thropomet r i c m e a s u r e m e n t s with d i s tances o u t p u t f r o m p r o g r a m SKULL
377
Traditional Output from direct program
Measurement measurement S K U L L Ditfer- ence in
Mean S.D. Mean S.D. means n t r
1 Glabella- opisthocranion 175.8 10.1 175.5 9.9 0.3 32 0.94 0.98 I
2 Bieuryon 134.9 9.9 135.1 9.5 -0.2 34 0.21 0.84 I
4 Nasion-prosthion 66.3 4.8 66.3 4.9 0.0 26 0.00 0.88 1
5 Nasion-gnathion 1 1 1 . 0 11.9 112.9 9.0 -1 .9 8 0.92 0.88 1
6 Minimum frontal 91.7 5.1 91.5 4.7 0.2 32 0.70 0.95 I
7 Maximum alveolar breadth 62.8 2.5 61.9 3.2 0.9 18 1.91 0.78 I
8 Bigonial 95.6 7.5 91.9 7.7 3.7 32 6.422 0.91 I
3 Bizygomatic 132.8 7.4 132.5 7.9 0.3 1 1 0.63 0.98 I
1 Probability of an r this large or larger in a sample from a population where no correlation exists is
2 Probabilitv of a t this large or laraer in a sample from a population where no differences exist is less less than 0.01.
than 0.001.
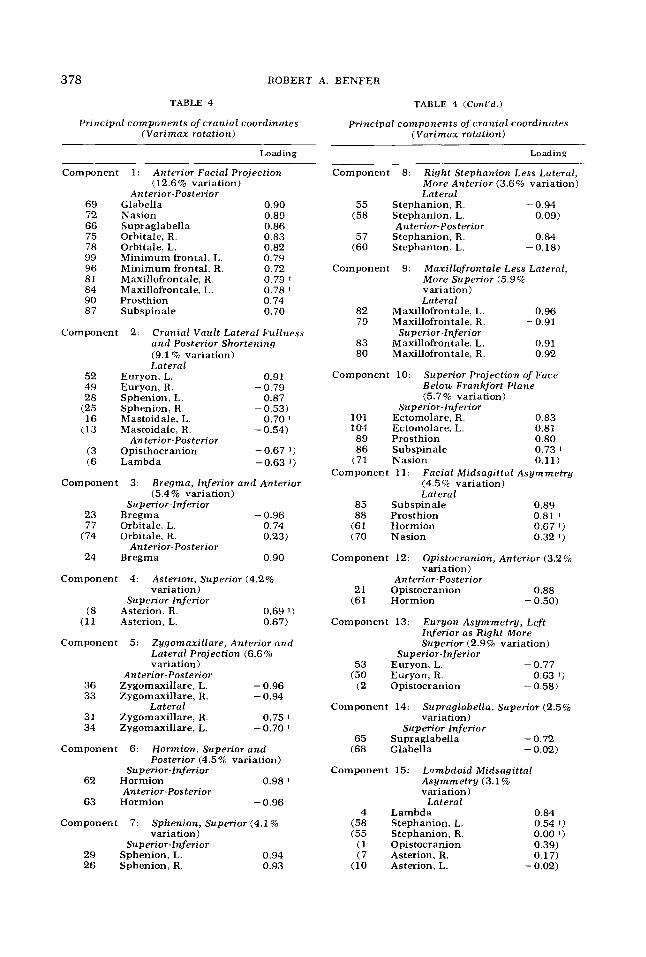
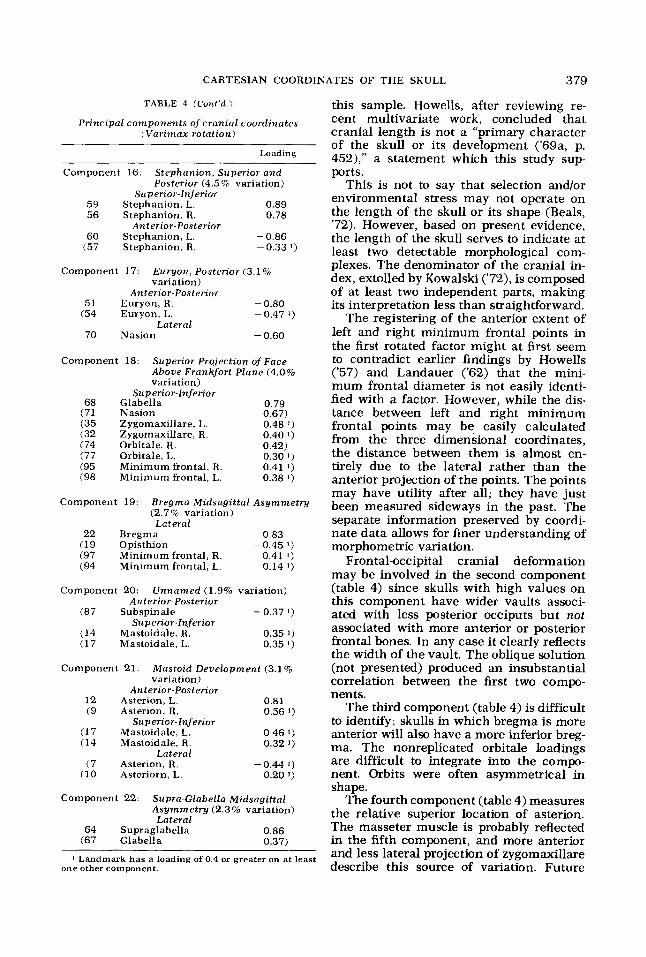
ues exceeded unity were rotated by the Varimax technique. Table 4 presents the highest loadings for variables on each com- ponent. Since a loading of 0.7 or greater indicates that half or more of the variance of the variable is registered in that compo- nent, absolute values 0.7 or greater are al- ways reported. Values less than 0.7 are given where they help in evaluating the component.
DISCUSSION
Reliability of the use of the SKULL pro- gram is satisfactory. Errors of measurement in both traditional anthropometric mea- surements and calculation from imperfect- ly located coordinates result in less than perfect correlation since both techniques are sensitive to the same errors of landmark location.
The coordinates are useful as raw data for examination and description of skulls. For example, Dr. John W. Page prepared a Calcomp program to plot the coordinates as part of his dissertation research. Several original measurement errors were detected by this technique. Recently I remeasured several of these skulls, but the changes have not been incorporated in this analysis (which would involve inserting values that were considered missing in the present re- port). However, the reliability was infor- mally demonstrated as the correspondence between the 1970 measurements and those taken in 1973 was quite high, rarely differ- ing by more than one millimeter. In addi-
tion to plots, I have found stereograms (Pro- gram STEREO in the NT-SYS library of programs, Rohlf et al., '72) useful for ex- amining skulls, the originals of which are not readily available for study. What are the underlying dimensions of the patterns of covariation of these coordinate data? One method of interpreting table 4 is to view coordinates with high loadings on a component as a cluster of points which tend to vary together from one skull to another. If all of the loadings are positive we know that as one coordinate of one landmark in- creases (or decreases) in magnitude, so do the other landmarks increase (or decrease) in their respective coordinate values, and these variables are at least in part redun- dant in the present sample. Rotated compo- nents describe clusters of variables highly related to each other but less related to oth- er clusters of coordinate values.
Component 1, for example, is highly loaded by points on the upper face, as they project anteriorly from the coronal plane (table 4). Thus, in skulls where glabella projects anteriorly more than average, so do nasion, supraglabella, right and left minimum frontal, right and left maxillo- frontale, and to a lesser extent, prosthion and subspinale. Note that other landmarks do not covary with this complex. It seems especially interesting that posterior projec- tions of lambda and opistocranion are not correlated with this component. Measure- ments of the length of the skull cross two independent morphological complexes, in
3 78 ROBERT A. BENFER
TABLE 4
Principal components of cranial coordinates (Var imax rotation)
Loading
TABLE 4 (Cont'd.)
principal components of cranial coordinates (Var imax rotation)
Lo adin g
Compon
69 72 66 75 78 99 96 81 84 90 87
ent 1: Anterior Facial Projection (12.6% variation)
Anterior-Posterior Glabella 0.90 Nasion 0.89 Supraglabella 0.86 Orbitale, R. 0.83 Orbitale, L. 0.82 Minimum frontal, L. 0.79 Minimum frontal, R. 0.72 Maxillofrontale, R. 0.79 1
Maxillofrontale, L. 0.78 I
Prosthion 0.74 Subspinale 0.70
Component 2: Cranial Vaul t Lateral Fullness and Posterior Shortening (9.1 9% variation) Lateral
52 Euryon,L. 0.91 49 Euryon,R. - 0.79 28 Sphenion, L. 0.87
(25 Sphenion, R. - 0.53) 16 Mastoidale, L. 0.70 I
(13 Mastoidale, R. - 0.54) A n terior-Posterior
(3 Opisthocranion -0.67 ') (6 Lambda -0.63 1)
Component 3: Bregma, Inferior and Anterior (5.4% variation)
Superior-Inferior 23 Bregma - 0.96 77 Orbitale, L. 0.74
(74 Orbitale, R. 0.23) A n terior-Posterior
24 Bregma 0.90
Component 4: Asterion, Superior (4.2%
Superior-Inferior variation)
(8 Asterion, R. 0.69 1)
(11 Asterion, L. 0.67)
Component 5: Zygomaxillare, Anterior and Lateral Projection (6.6% variation)
An terior-Posterior 36 Zygomaxillare, L. - 0.96 33 Zygomaxillare, R. - 0.94
Lateral 31 Zygomaxillare, R. 0.75 I
34 Zygomaxillare, L. -0.70
Component 6: Hormion, Superior and Posterior (4.5% variation)
Superior-Inferior
Anterior-Pos terior 62 Hormion 0.98 I
63 Hormion - 0.96
Component 7: Sphenion, Superior (4.1 %
Superior-Inferior variation)
29 Sphenion, L. 0.94 26 Sphenion, R. 0.93
Component 8: Right Stephanion Less Lateral, More Anterior (3.6% variation) Lateral
55 Stephanion, R. - 0.94 (58 Stephanion, L. 0.09)
A n terior-Posterior 57 Stephanion, R. 0.84
(60 Stephanion, L. -0.18)
Component 9: Maxillofrontale Less Lateral, More Superior (5.9% variation) Lateral
82 Maxillofrontale, L. 0.96 79 Maxillofrontale, R. - 0.91
83 Maxillofrontale, L. 0.91 Superior-Inferior
80 Maxillofrontale, R. 0.92
Component 10: Superior Projection of Face Below Frankfort Plane (5.7% variation)
Superior-Inferior 101 Ectomolare, R. 0.83 104 Ectomolare, L. 0.81 89 Prosthion 0.80 86 Subspinale 0.73 1
(71 Nasion 0.11) Component 11: Facial Midsagittal Asymmetry
(4.5% variation) Lat era1
85 Subspinale 0.89 88 Prosthion 0.81 I
(61 Hormion 0.67 1 )
(70 Nasion 0.32 1 )
Component 12: Opistocranion, Anterior (3.2% variation)
Anterior-Posterior 21 Opistocranion 0.88
(61 Hormion - 0.50)
Component 13: Euryon Asymmetry; Left Inferior as Right More Superior (2.9% variation)
Superior-Inferior 53 Euryon, L. - 0.77
(50 Euryon, R. 0.63 1)
(2 Opistocranion - 0.58)
Component 14: Supraglabella, Superior (2.5% variation)
Superior-Inferior 65 Supraglabella - 0.72
(68 Glabella - 0.02)
Component 15: Lambdoid Midsagittal Asymmetry (3.1 % variation)
Lateral 4 Lambda 0.84
(58 Stephanion, L. 0.54 1 )
(55 Stephanion, R. 0.00 1)
(1 Opistocranion 0.39) (7 Asterion, R. 0.17)
(10 Asterion, L. - 0.02)
CARTESIAN COORDINATES OF THE SKULL 379
TABLE 4 (Cont’d.)
Principal components of cranial coordinates (Varimax rotation)
~
Loading
Component 16: Stephanion, Superzor and Posterior (4.5% variation)
59 Stephanion, L. 0.89 56 Stephanion, R. 0.78
60 Stephanion, L. - 0.86
S u p erior-Inferior
Ant erior-Posterior
(57 Stephanion, R. - 0.33 1)
Component 17: Euryon, Posterior (3.1% variation)
Anterior-Posterior 51 Euryon,R. - 0.80
(54 Euryon, L. - 0.47 1 )
70 Nasion - 0.60 Lateral
Component 18: Superior Projection of Face Above Frankfort Plane (4.0% variation)
Superior-Inferior 68 Glabella 0.79
(71 Nasion 0.67) (35 Zygomaxillare, L. 0.48 1)
(32 Zygomaxillare, R. 0.40 1)
(74 Orbitale, R. 0.42) (77 Orbitale, L. 0.30 1 )
(95 Minimum frontal, R. 0.41 1)
(98 Minimum frontal, L. 0.38 1 )
Component 19: Bregma Midsagittal Asymmetry (2.7% variation) Lateral
22 Bregma 0.83 (19 Opisthion - 0.45 1)
(97 Minimum frontal, R. 0.41 1 )
(94 Minimum frontal, L. 0.14 1)
Component 20: Unnamed (1.9% variation) Anterior-Posterior
Superior-Inferior (87 Subspinale - 0.37 1)
(14 Mastoidale, R. 0.35 1)
(17 Mastoidale, L. 0.35 1 )
Component 21: Mastoid Deuelopment (3.1 % variation)
An terior-Posterior 12 Asterion, L. 0.81 (9 Asterion, R. 0.56 1)
(17 Mastoidale, L. 0.46 1)
(14 Mastoidale, R. 0.32 1)
(7 Asterion, R. -0.44 1 )
Superior-lnferior
Lateral
(10 Asteriorn, L. 0.20 1)
Component 22: Supra-Glabella Midsagittal
Lateral Asymmetry (2.3% variation)
64 Supraglabella 0.86 (67 Glabella 0.37)
I Landmark has a loading of 0.4 or greater on at least one other component.
this sample. Howells, after reviewing re- cent multivariate work, concluded that cranial length is not a “primary character of the skull or its development (‘69a, p. 452),” a statement which this study sup- ports.
This is not to say that selection and/or environmental stress may not operate on the length of the skull or its shape (Beals, ’72). However, based on present evidence, the length of the skull serves to indicate at least two detectable morphological com- plexes. The denominator of the cranial in- dex, extolled by Kowalski (’72), is composed of at least two independent parts, making its interpretation less than straightforward.
The registering of the anterior extent of left and right minimum frontal points in the first rotated factor might at first seem to contradict earlier findings by Howells (‘57) and Landauer (‘62) that the mini- mum frontal diameter is not easily identi- fied with a factor. However, while the dis- tance between left and right minimum frontal points may be easily calculated from the three dimensional coordinates, the distance between them is almost en- tirely due to the lateral rather than the anterior projection of the points. The points may have utility after all; they have just been measured sideways in the past. The separate information preserved by coordi- nate data allows for finer understanding of morphometric variation.
Frontal-occipital cranial deformation may be involved in the second component (table 4) since skulls with high values on this component have wider vaults associ- ated with less posterior occiputs but not associated with more anterior or posterior frontal bones. In any case it clearly reflects the width of the vault. The oblique solution (not presented) produced an insubstantial correlation between the first two compo- nents.
The third component (table 4) is difficult to identify; skulls in which bregma is more anterior will also have a more inferior breg- ma. The nonreplicated orbitale loadings are difficult to integrate into the compo- nent. Orbits were often asymmetrical in shape.
The fourth component (table 4) measures the relative superior location of asterion. The masseter muscle is probably reflected in the fifth component, and more anterior and less lateral projection of zygomaxillare describe this source of variation. Future
380 ROBERT A.
work with dissection room material where the major muscles of the skull could be weighed, and average fascicle length deter- mined (Tappan and Wickstrom, '61) would seem likely to add considerably to our knowledge of the sources of cranial var- iation.
Aconsistent pattern of more superior and less anterior junctions of the occipital and sphenoid bones is detected by component 6 (table 4). The superior or inferior height of sphenion, the point of articulation of fron- tal, parietal, and sphenoid bones is regis- tered in component 7. Skulls with more anterior and less lateral right stephanions score high on the eighth component. In- terestingly enough, the pattern is asym- metrical as left stephanion does not follow the pattern. Whether differential expansion of the frontal lobes or deformation is re- sponsible should be investigated in future work. Gundara and Zivanovic ('68) also found asymmetry most pronounced in the parietal and the occipital region. How- ever, the present coordinate approach more clearly describes asymmetry.
While the anterior projection of maxillo- frontale was registered on the first compo- nent, less lateral projections are found as- sociated with more superior locations of maxillofrontale in component 9 (table 4). Component 10 measures the superior ex- tent of the face below the Frankfort Plane. Component 18 described below registers superiorness of the face and lower frontal bone area above the Frankfort Plane. How- ever, in the oblique solution the two com- ponents are uncorrelated (r = 0.06). Thus, in this sample, a common measurement, upper facial height, crosses two morpholog- ical complexes, unrelated except for the small part of their variation associated with component 1, where the anterior pro- jection of both the upper and lower face is mildly redundant. The biological utility of the Frankfort Plane is reaffirmed, since these two complexes were discovered by measurements from landmarks to the plane.
Component 11 estimates the facial mid- sagittal asymmetry, obvious by inspection of the actual skulls, but hidden by coordi- nate means (table 2 ) where the asymmetric to the left skulls are balanced by those asymmetrical to the right. The anterior pro- jection of opisthocranion, which was con-
BENFER
spicuous by its absence on component 1, establishes component 12. Component 13 detects asymmetry of the parietals, a pat- tern of less inferior left euryon associated with a more superior right euryon. Ob- viously, our measurement of maximum breadth of the skull was not always taken perpendicular to the midsagittal plane. With two workers, it might be desirable to match a left handed individual with a right handed one to even out this error source. More seriously, both asymmetry and mea- surment bias may be revealed in this com- ponent. Here as elsewhere, dissection of a landmark into its three coordinates illumi- nates many aspects of cranial variability hidden by the traditional measurement of the distance between two points.
The height of supraglabella (but not gla- bella) is registered on component 14 (table 4). The anterior projection of supragla- bella is not correlated with this component (r = 0.12). The sexual difference in con- tour of the forehead is not the only possible source of variation, and differential rates of fusion of the metopic suture cannot be ruled out (Woo, '49).
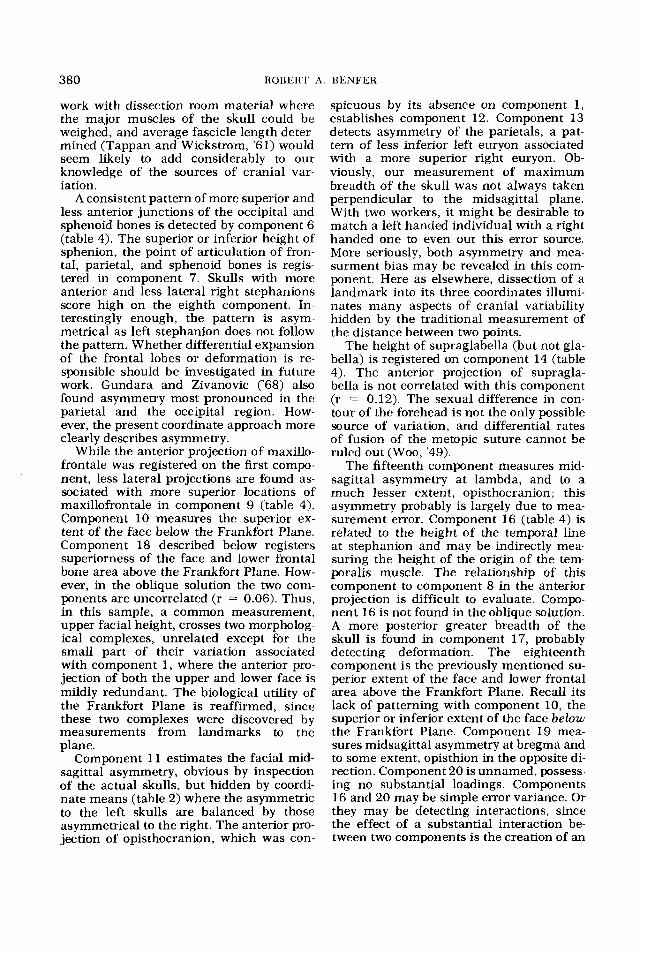
The fifteenth component measures mid- sagittal asymmetry at lambda, and to a much lesser extent, opisthocranion; this asymmetry probably is largely due to mea- surement error. Component 16 (table 4) is related to the height of the temporal line at stephanion and may be indirectly mea- suring the height of the origin of the tem- poralis muscle. The relationship of this component to component 8 in the anterior projection is difficult to evaluate. Compo- nent 16 is not found in theoblique solution. A more posterior greater breadth of the skull is found in component 17, probably detecting deformation. The eighteenth component is the previously mentioned su- perior extent of the face and lower frontal area above the Frankfort Plane. Recall its lack of patterning with component 10, the superior or inferior extent of the face below the Frankfort Plane. Component 19 mea- sures midsagittal asymmetry at bregma and to some extent, opisthion in the opposite di- rection. Component 20 is unnamed, possess- ing no substantial loadings. Components 16 and 20 may be simple error variance. Or they may be detecting interactions, since the effect of a substantial interaction be- tween two components is the creation of an
CARTESIAN COORDINATES OF T H E SKULL 38 1
additional component intercorrelated with each (Cattell, '65b, p. 431).
The twenty-first component measures variation in the occipital-temporal area. Perhaps the development of the mastoid is indicated, in part. The twenty-second com- ponent measures lateral asymmetry at su- praglabella and to a much lesser extent, at glabella.
The description of the components of variation underlying the intercorrelations among the landmarks should be viewed in the perspective of the small size of the sample. Nevertheless, the description pro- vides some insights into cranial variation and suggests that additional landmarks might provide additional information about the components which now have only one or two landmarks to identify their presence.
CONCLUSIONS
The technique of resolving cranial land- marks into three vectors corresponding to distances from the midsagittal, coronal, and Frankfort Planes has been demon- strated to be simple, reliable, and informa- tive. Simple measurements of the distance from left and right porion and apex to each landmark of interest are quickly processed by Program SKULL to produce the coordi- nates of each landmark referred to the planes. Measurement error with this tech- nique is probably no greater than tradition- al techniques (table 3). The morphomet- ric analysis of the sample by orthogonally rotated principal components produced in- teresting patterns of covariation. Both Brown ('67) and Solow ('66) have suggest- ed that correlations between two measure- ments with a common reference point should be avoided as they would contain less biological information. The common pattern of independent variation of the landmarks in one, two, or all three di- mensions reported here render this judge- ment conservative. In any case, analysis of the coordinates of the landmarks frees the results of any spurious correlation and is preferred.
I argue that distances among landmarks are, in general, more ambiguous and less capable of accurate morphological descrip- tion of cranial variation than coordinates. If, for example, the lateral fullness of the vault is an important source of morpholog- ical co-variation in a sample, rotated prin-
cipal components analysis of the coordinates will reveal the existence and magnitude of the source. While some landmarks did seem trivial, merely measuring the end points of traditional measurements, the large major- ity were much more informative. The simul- taneous description of variation in three dimensions frees morphometric analysis from two-dimensional staticness so that the irregular, three-dimensional nature of the biological structures can be evaluated (Her- ron, '72, p. 80). For example, the finding of more anterior zygomaxillares with less lat- eral projections of this landmark illustrates the obvious advantages of three-dimension- al analysis. The detection of facial asym- metry, measurement bias in the maximum breadth determination, and the unrelated- ness of anterior-posterior variation of the face and frontal with the occipital are just some of the present findings that would have been very difficult or impossible with conventional two-dimensional measure- ments. A more detailed analysis of this ma- terial (Page, '74) provides additional evi- dence for the value of the three-dimensional coordinate technique.
ACKNOWLEDGMENTS
Financial support from the Research Council of the University of Missouri-Co- lumbia is gratefully acknowledged. I espe- cially wish to thank Dr. Frederich Engel for inviting me to study his important sam- ple of skeletons and graciously providing assistance during the fieldwork and subse- quent parts of the study. A discussion of these remains more pertinent to the archae- ologist (Page, '74) will better repay part of our obligation.
Secondly I wish to acknowledge the help of Dr. John W. Page, Mr. Thomas C. Hutch- inson, and Dr. B. Miles Gilbert in the diffi- cult task of creating a new technique and applying it in the field. Without the help of Mr. James H. Davis, who wrote program SKULL for the project, the analysis would have been impossible. Dr. James A. Gavan and Mrs. Alice N. Benfer have offered in- valuable criticisms. Mrs. Luz Marie Wilson provided lodging and care for sometimes sick Norteamericanos. Mrs. Beverly Price and Miss Nancy Poehlman detected incon- sistencies in the draft manuscript and tables they carefully checked and typed; their help was appreciated.
382 ROBERT A. BENFER
LITERATURE CITED Beals, K. L. 1972 Head form and climatic stress.
Am. J. Phys. Anthrop., 37: 85-92. Benfer, R. A. 1968 The desirability of small sam-
ples for anthropological inference. Amer. An- throp., 70: 950-951.
1972 Factor analysis as numerical induc- tion: How to judge a book by its cover. Amer. Anthrop., 7 4 : 53G554.
Benfer, R. A., and J. W. Page 1971 Sexual di- morphism and primate numerical taxonomy. Paper presented to the 1971 meetings of the Amer. Anthrop. Assoc., New York.
Blackith, R. E., and R. A. Reyment 1971 Multi- variate Morphometrics. Academic Press, New York.
Boyce, A. J. 1964 The value of some methods of numerical taxonomy with reference to hominoid classification. Systematics Association, Publica- tion No. 6: 47-65.
Brown, T. 1967 Skull of the Australian Aborig- inal. Mimeographed, Department of Dental Sci- ence, University of Adelaide, Adelaide, South Australia.
Cattell, R. B. 1965a Factor analysis: An intro- duction to essentials. I. The purpose and under- lying models. Biometrics, 21 : 190-215.
1965b Factor analysis: An introduction to essentials. 11. The role of factor analysis in research. Biometrics, 21 : 405435 .
Choi, S. C., and Mildred Trotter 1970 A statis- tical study of the multivariate structure and race-sex differences of American white and Negro fetal skeletons. Am. J. Phys. Anthrop., 33: 307-312.
Claude, P. 1970 Analyse Tridimensionelle des Elements Cranio-faciaux d’une Population d e Melanesiens en Orientation Vestibulare: Com- paraison avec le Crane Europeen. These pour le Doctorat en Chirurgie Dentaire, Faculte d e Med- ecine de Paris.
Comas, J. 1960 Manual of Physical Anthropol- ogy. Revised Edition. Charles C Thomas, Springfield, Illinois.
Corruccini, R. S. 1973 Size and shape in similar- ity coefficients based on metric characters. Am. J. Phys. Anthrop., 38: 743-754.
Davis, J. A. 1970 Program S K U L L , on file with the Department of Anthropology, University of Missouri-Columbia.
Davis, J. C. 1973 Statistics and Data Analysis in Geology. John Wiley and Sons, Inc., New York.
Engel, F. 1969 On early man in the Americas. Current Anthropology, 10: 225.
Gavan, J. A, , S. L. Washburn and P. H. Lewis 1952 Photography: An anthropometric tool. Am. J. Phys. Anthrop., 10: 331-353.
Gower, J. C. 1966 Some distance properties of latent root and vector methods used in multi- variate analysis. Biometrika, 53: 325338.
Gundara, N., and S. Zivanovic 1968 Asymmetry in East African skulls. Amer. J. Phys. Anthrop., 28: 331-338.
Harman, H. H. 1967 Modern Factor Analysis. Revised Edition. University of Chicago Press, Chicago.
Herron, R. E. 1972 Biostereometric measure- ment of body form. Yearbook of Physical Anthro- pology, 16: 80-121.
Howells, W. W. 1957 The cranial vault: Factors of size and shape. Am. J. Phys. Anthrop., 1 5 : 1 9 4 8 .
1969a Criteria for selection of osteometric dimensions. Am. J. Phys. Anthrop., 30: 451458.
1969b The use of multivariate techniques in the study of skeletal populations. Am. J. Phys. Anthrop., 31 : 311-314.
Cranial variation in man. Papers of the Peabody Museum of Archaeology and Ethnology. Vol. 67. Harvard University.
Kowalski, C. J. 1972 A commentary on the use of multivariate statistical methods in anthropo- metric research. Am. J. Phys. Anthrop., 36: 119- 132.
Landauer, C. A. 1962 A factor analysis of the facial skeleton. Human Biology, 34: 239-253.
Oxnard, C . 1973 Form and Pattern in Human Evolution. University of Chicago Press, Chicago.
Page, J. W. 1974 Human evolution in Peru: 9,000-1,000 B.P. Unpublished Ph.D. dissertation, University of Missouri-Columbia.
Rohlf, F. J., J. Kishpaugh and D. Kirk 1972 N T - SYS. Numerical Taxonomy System of Multivar- iate Statistical Programs. The State University of New York at Stony Brook, New York.
Rummel, R. J . 1970 Applied Factor Analysis. Northwestern University Press, Evanston, Illi- nois.
Scott, E. C. 1973 Dental Attrition in Pre-Colom- bia Peru. Paper presented to the Seventy-second Meetings of the American Anthropological As- SOC., New Orleans.
Solow, B. 1966 The Pattern of Craniofacial As- sociations. Acta Odontologica Scandinavica, Vol. 24, supplement 46, Copenhagen.
Tappen, N. C., and J. Wickstrom 1961 A method for analyzing muscle function in locomotion. Surgical Forum, 12: 440-442.
Thompson, G. W., and F. Popovich 1974 Auto- mated processing of cephalograms, facial photo- graphs and dental casts. Amer. J. Phys. An- throp., 4 0 : 97-104.
Van d e Geer, J. P. 1971 Introduction to Multi- variate Analysis for the Social Sciences. W. H. Freeman and Company, San Francisco.
Van Gerven, D. P. 1972 The contribution of size and shape variation to patterns of sexual dimor- phism of the human femur. Am. J. Phys. An- throp., 37: 4 9 4 0 .
Veldman, D. J. 1967 Fortran Programming for the Behavioral Sciences. Holt, Rinehart, and Winston, New York.
Woo, J . K. 1949 Racial and sexual differences in the frontal curvature and its relation to meto- pism. Am. J. Phys. Anthrop., 7: 215-226.
1973