Embed Size (px)
Citation preview

1

Name And title
TITLE LINE 1 TITLE LINE 2
Date • Place
3
Confidentiality, Safe Harbor and Non-GAAP Results
This presentation contains confidential information regarding Tenneco Inc. By reviewing this information, the participants agree to treat the information confidentially, not to distribute it and not to use it for any purpose other than evaluating Tenneco Inc. as a potential supplier.
Please see the safe harbor statement and the tables that reconcile GAAP results with non-GAAP results in Tenneco’s corresponding financial results press release, which is incorporated herein by reference.
4
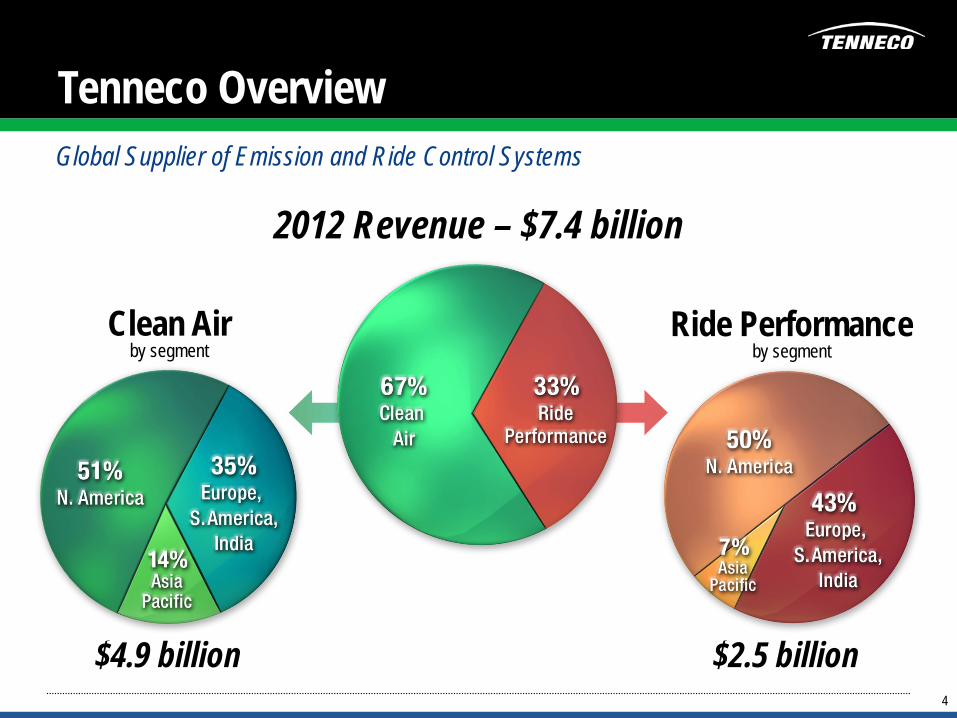
Tenneco Overview
Clean Air by segment
Global Supplier of Emission and Ride Control Systems
2012 Revenue – $7.4 billion
Ride Performance by segment
$4.9 billion $2.5 billion
5
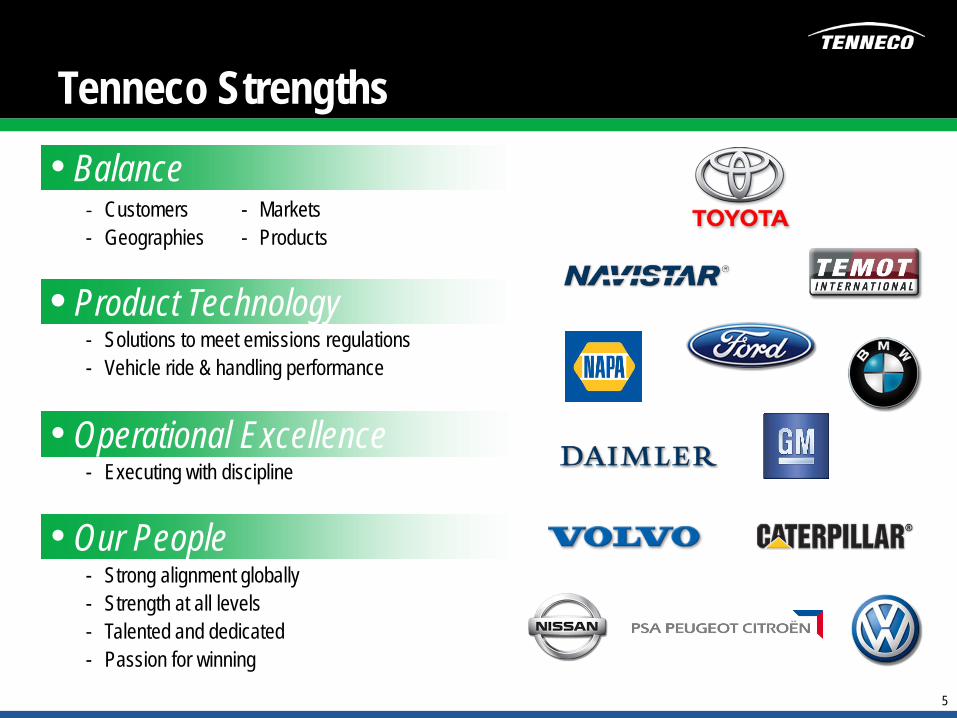
Tenneco Strengths
- Customers - Markets - Geographies - Products
- Solutions to meet emissions regulations - Vehicle ride & handling performance
- Executing with discipline
- Strong alignment globally - Strength at all levels - Talented and dedicated - Passion for winning
• Balance
• Product Technology
• Operational Excellence
• Our People
6
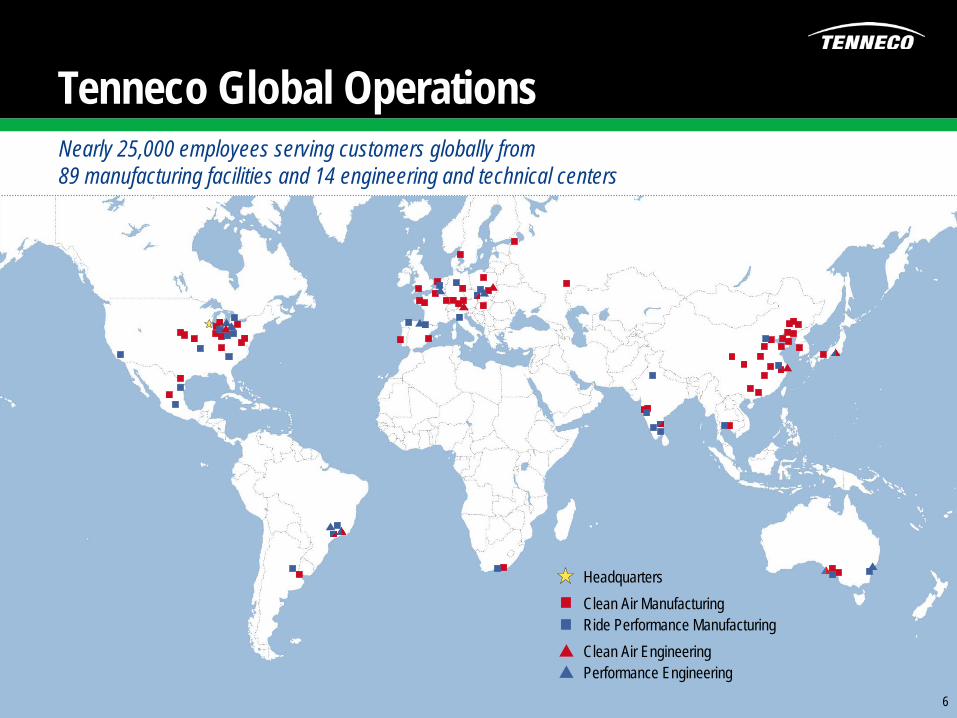
Tenneco Global Operations
6
Headquarters Clean Air Manufacturing Ride Performance Manufacturing Clean Air Engineering Performance Engineering
Nearly 25,000 employees serving customers globally from 89 manufacturing facilities and 14 engineering and technical centers
6
7
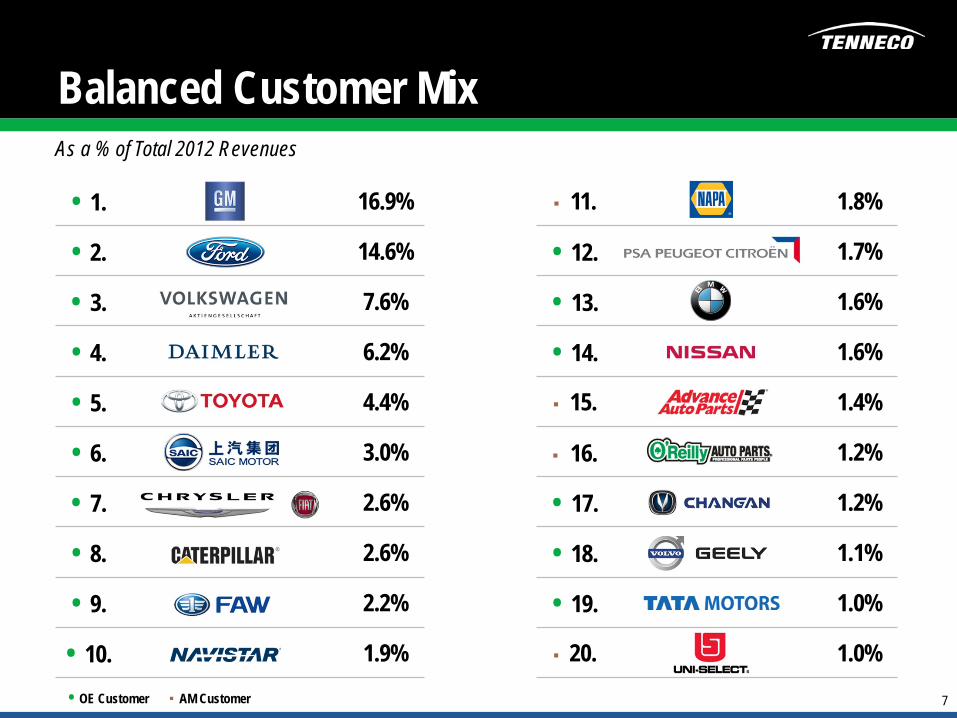
Balanced Customer Mix
• 1. 16.9% ■ 11. 1.8%
• 2. 14.6% • 12. 1.7%
• 3. 7.6% • 13. 1.6%
• 4. 6.2% • 14. 1.6%
• 5. 4.4% ■ 15. 1.4%
• 6. 3.0% ■ 16. 1.2%
• 7. 2.6% • 17. 1.2%
• 8. 2.6% • 18. 1.1%
• 9. 2.2% • 19. 1.0%
• 10. 1.9% ■ 20. 1.0%
As a % of Total 2012 Revenues
• OE Customer ■ AM Customer
8
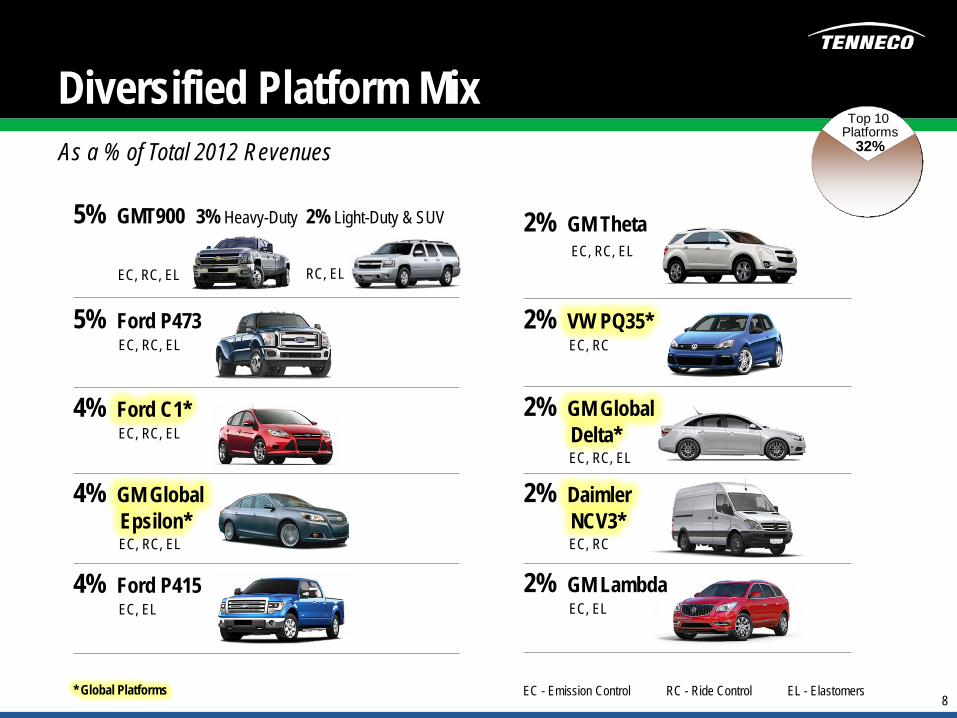
Diversified Platform Mix
2% GM Theta EC, RC, EL
2% VW PQ35* EC, RC
2% GM Global Delta* EC, RC, EL
2% Daimler NCV3* EC, RC
2% GM Lambda EC, EL
5% GMT900
EC, RC, EL
3% Heavy-Duty 2% Light-Duty & SUV
RC, EL
5% Ford P473 EC, RC, EL
4% Ford C1* EC, RC, EL
4% GM Global Epsilon* EC, RC, EL
4% Ford P415 EC, EL
As a % of Total 2012 Revenues
EC - Emission Control RC - Ride Control EL - Elastomers
Top 10 Platforms
32%
* Global Platforms
9
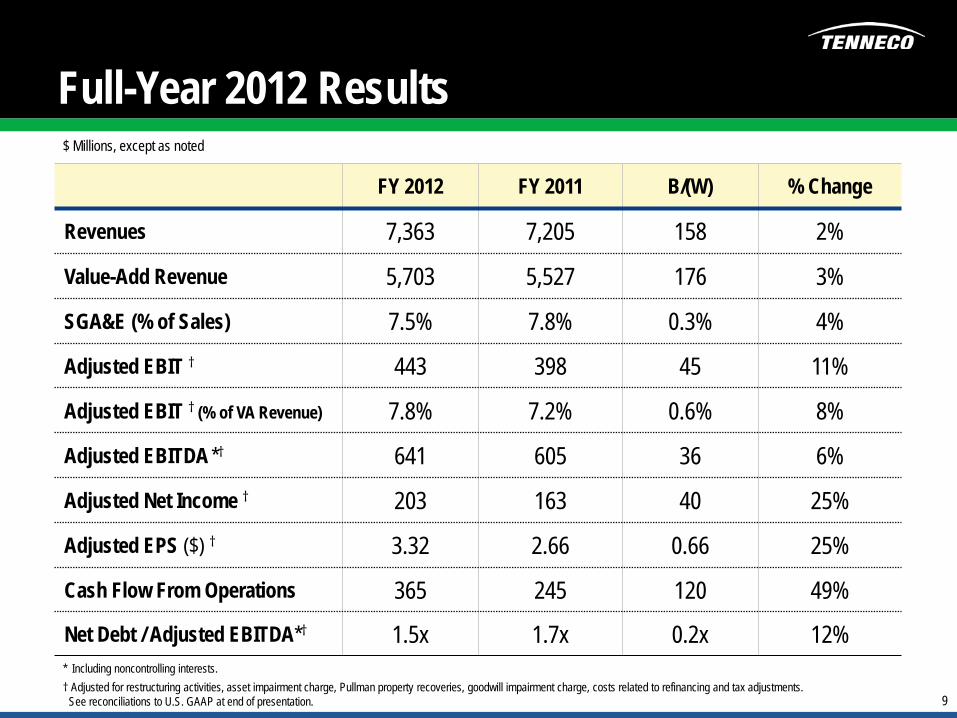
Full-Year 2012 Results
FY 2012 FY 2011 B/(W) % Change
Revenues 7,363 7,205 158 2%
Value-Add Revenue 5,703 5,527 176 3%
SGA&E (% of Sales) 7.5% 7.8% 0.3% 4%
Adjusted EBIT † 443 398 45 11%
Adjusted EBIT † (% of VA Revenue) 7.8% 7.2% 0.6% 8%
Adjusted EBITDA *† 641 605 36 6%
Adjusted Net Income † 203 163 40 25%
Adjusted EPS ($) † 3.32 2.66 0.66 25%
Cash Flow From Operations 365 245 120 49%
Net Debt / Adjusted EBITDA*† 1.5x 1.7x 0.2x 12% * Including noncontrolling interests. † Adjusted for restructuring activities, asset impairment charge, Pullman property recoveries, goodwill impairment charge, costs related to refinancing and tax adjustments. See reconciliations to U.S. GAAP at end of presentation.
$ Millions, except as noted
10
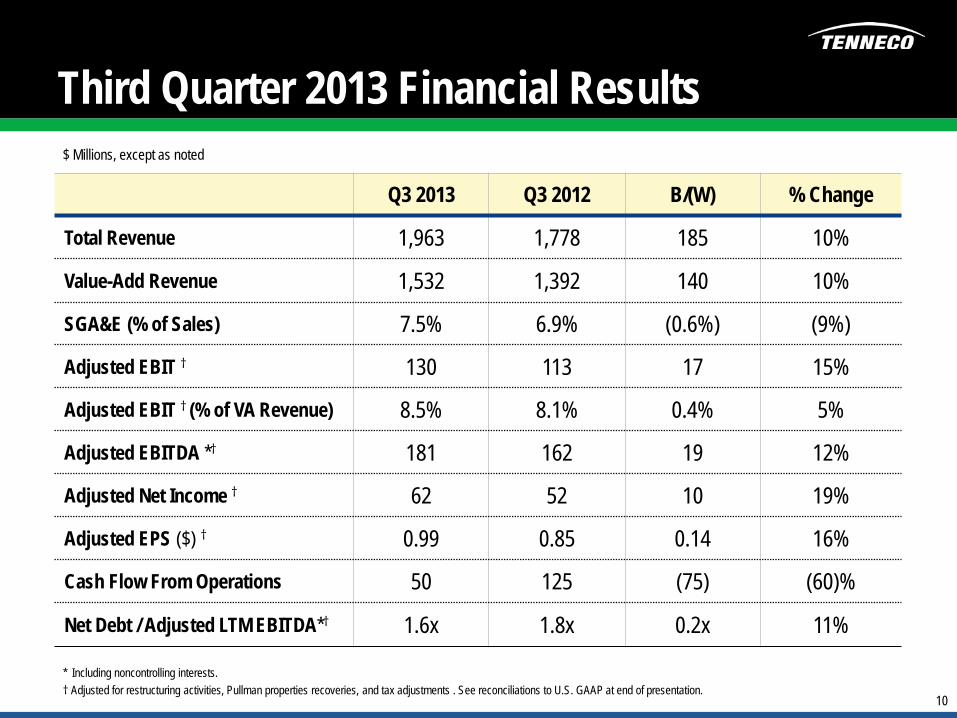
Third Quarter 2013 Financial Results $ Millions, except as noted
Q3 2013 Q3 2012 B/(W) % Change
Total Revenue 1,963 1,778 185 10%
Value-Add Revenue 1,532 1,392 140 10%
SGA&E (% of Sales) 7.5% 6.9% (0.6%) (9%)
Adjusted EBIT † 130 113 17 15%
Adjusted EBIT † (% of VA Revenue) 8.5% 8.1% 0.4% 5%
Adjusted EBITDA *† 181 162 19 12%
Adjusted Net Income † 62 52 10 19%
Adjusted EPS ($) † 0.99 0.85 0.14 16%
Cash Flow From Operations 50 125 (75) (60)%
Net Debt / Adjusted LTM EBITDA*† 1.6x 1.8x 0.2x 11%
* Including noncontrolling interests. † Adjusted for restructuring activities, Pullman properties recoveries, and tax adjustments . See reconciliations to U.S. GAAP at end of presentation.
11
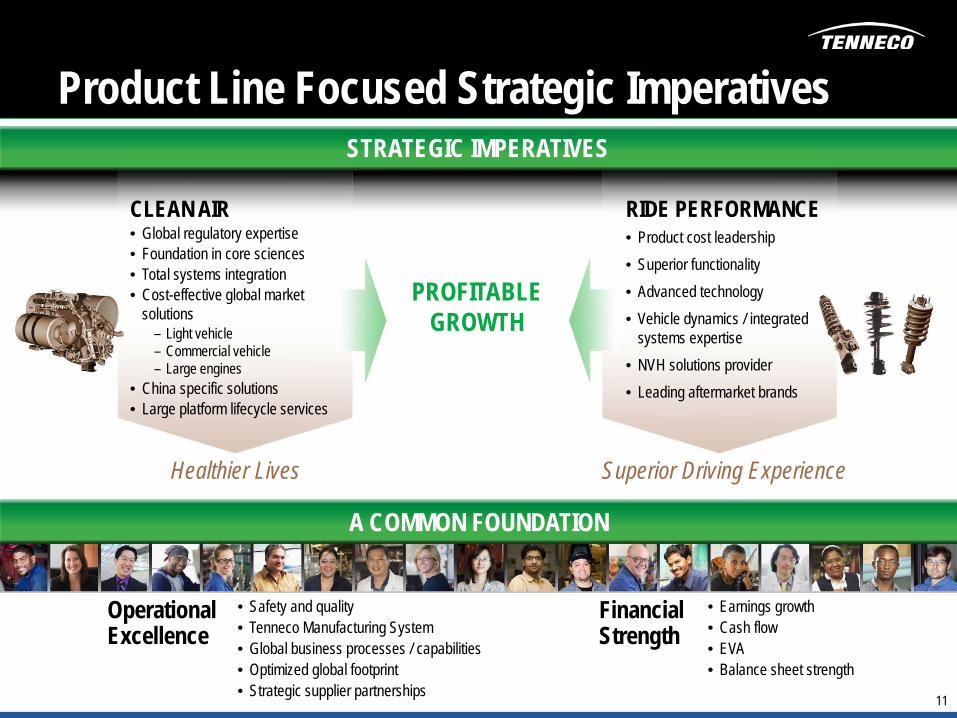
Product Line Focused Strategic Imperatives STRATEGIC IMPERATIVES
A COMMON FOUNDATION
PROFITABLE GROWTH
CLEAN AIR • Global regulatory expertise • Foundation in core sciences • Total systems integration • Cost-effective global market
solutions – Light vehicle – Commercial vehicle – Large engines • China specific solutions • Large platform lifecycle services
RIDE PERFORMANCE • Product cost leadership • Superior functionality • Advanced technology • Vehicle dynamics / integrated
systems expertise • NVH solutions provider • Leading aftermarket brands
Healthier Lives Superior Driving Experience
Operational Excellence
Financial Strength
• Safety and quality • Tenneco Manufacturing System • Global business processes / capabilities • Optimized global footprint • Strategic supplier partnerships
• Earnings growth • Cash flow • EVA • Balance sheet strength
12
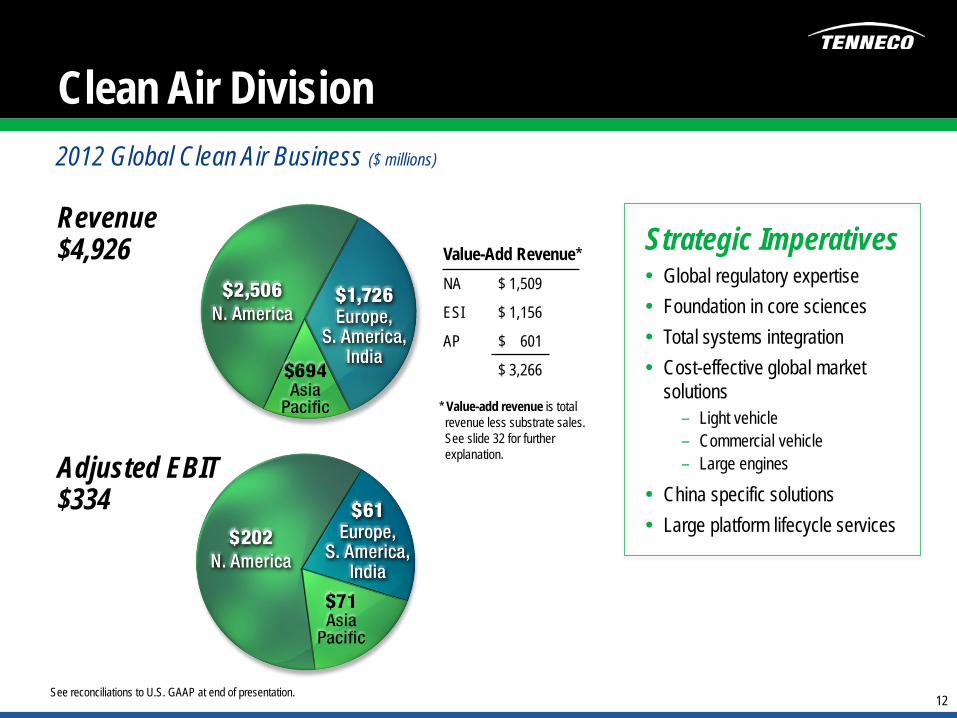
Clean Air Division 2012 Global Clean Air Business ($ millions)
Revenue $4,926
Adjusted EBIT $334
Value-Add Revenue* NA $ 1,509
ESI $ 1,156
AP $ 601
$ 3,266
Strategic Imperatives • Global regulatory expertise • Foundation in core sciences • Total systems integration • Cost-effective global market
solutions – Light vehicle – Commercial vehicle – Large engines
• China specific solutions • Large platform lifecycle services
See reconciliations to U.S. GAAP at end of presentation.
* Value-add revenue is total revenue less substrate sales. See slide 32 for further explanation.
13
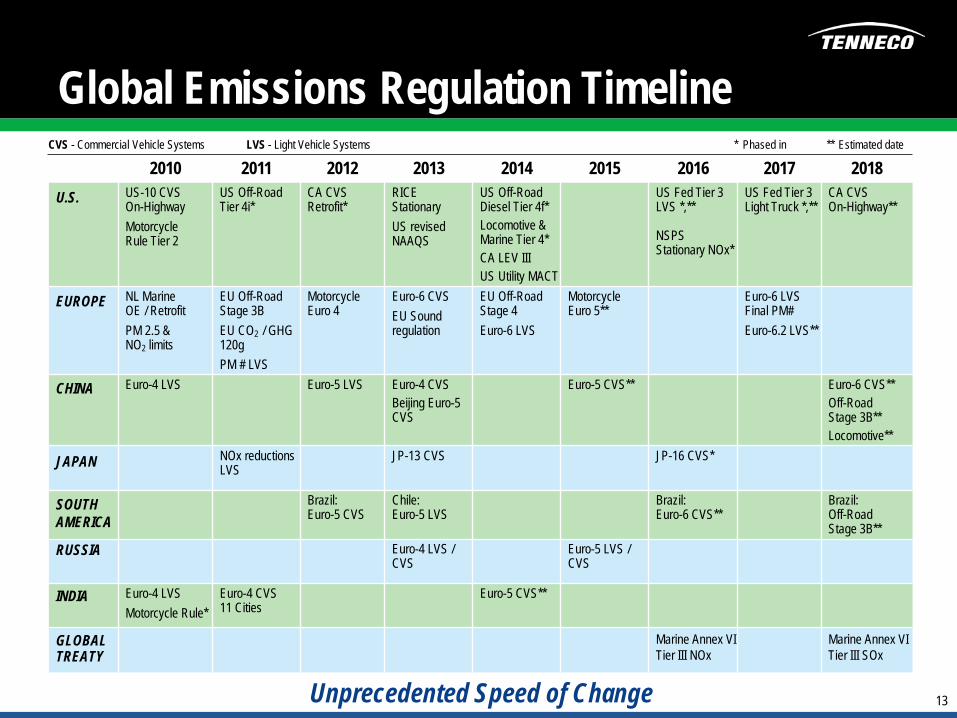
Global Emissions Regulation Timeline 2010 2011 2012 2013 2014 2015 2016 2017 2018
U.S. US-10 CVS On-Highway Motorcycle Rule Tier 2
US Off-Road Tier 4i*
CA CVS Retrofit*
RICE Stationary US revised NAAQS
US Off-Road Diesel Tier 4f* Locomotive & Marine Tier 4* CA LEV III US Utility MACT
US Fed Tier 3 LVS *,**
NSPS Stationary NOx*
US Fed Tier 3 Light Truck *,**
CA CVS On-Highway**
EUROPE NL Marine OE / Retrofit PM 2.5 & NO2 limits
EU Off-Road Stage 3B EU CO2 / GHG 120g PM # LVS
Motorcycle Euro 4
Euro-6 CVS EU Sound regulation
EU Off-Road Stage 4 Euro-6 LVS
Motorcycle Euro 5**
Euro-6 LVS Final PM# Euro-6.2 LVS**
CHINA Euro-4 LVS Euro-5 LVS Euro-4 CVS Beijing Euro-5 CVS
Euro-5 CVS** Euro-6 CVS** Off-Road Stage 3B** Locomotive**
JAPAN NOx reductions LVS
JP-13 CVS JP-16 CVS*
SOUTH AMERICA
Brazil: Euro-5 CVS
Chile: Euro-5 LVS
Brazil: Euro-6 CVS**
Brazil: Off-Road Stage 3B**
RUSSIA Euro-4 LVS / CVS
Euro-5 LVS / CVS
INDIA Euro-4 LVS Motorcycle Rule*
Euro-4 CVS 11 Cities
Euro-5 CVS**
GLOBAL TREATY
Marine Annex VI Tier III NOx
Marine Annex VI Tier III SOx
CVS - Commercial Vehicle Systems LVS - Light Vehicle Systems * Phased in ** Estimated date
Unprecedented Speed of Change
14
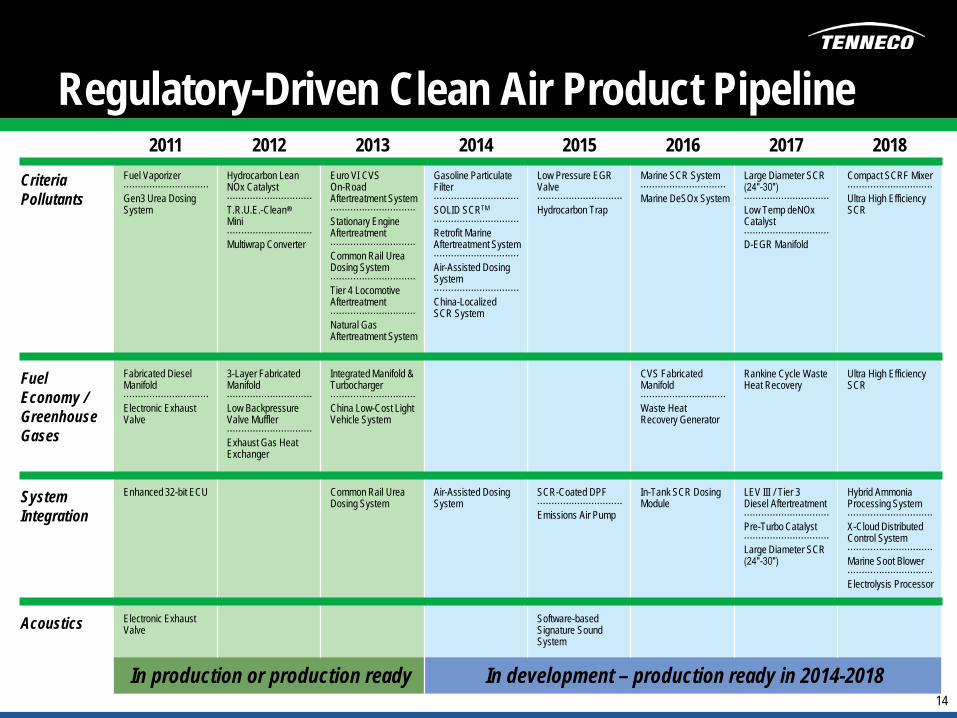
2011 2012 2013 2014 2015 2016 2017 2018
Criteria Pollutants
Fuel Vaporizer ······························ Gen3 Urea Dosing System
Hydrocarbon Lean NOx Catalyst ······························ T.R.U.E.-Clean®
Mini ······························ Multiwrap Converter
Euro VI CVS On-Road Aftertreatment System ······························ Stationary Engine Aftertreatment ······························ Common Rail Urea Dosing System ······························ Tier 4 Locomotive Aftertreatment ······························ Natural Gas Aftertreatment System
Gasoline Particulate Filter ······························ SOLID SCRTM
······························ Retrofit Marine Aftertreatment System ······························ Air-Assisted Dosing System ······························ China-Localized SCR System
Low Pressure EGR Valve ······························ Hydrocarbon Trap
Marine SCR System ······························ Marine DeSOx System
Large Diameter SCR (24″-30″) ······························ Low Temp deNOx Catalyst ······························ D-EGR Manifold
Compact SCRF Mixer ······························ Ultra High Efficiency SCR
Fuel Economy / Greenhouse Gases
Fabricated Diesel Manifold ······························ Electronic Exhaust Valve
3-Layer Fabricated Manifold ······························ Low Backpressure Valve Muffler ······························ Exhaust Gas Heat Exchanger
Integrated Manifold & Turbocharger ······························ China Low-Cost Light Vehicle System
CVS Fabricated Manifold ······························ Waste Heat Recovery Generator
Rankine Cycle Waste Heat Recovery
Ultra High Efficiency SCR
System Integration
Enhanced 32-bit ECU Common Rail Urea Dosing System
Air-Assisted Dosing System
SCR-Coated DPF ······························ Emissions Air Pump
In-Tank SCR Dosing Module
LEV III / Tier 3 Diesel Aftertreatment ······························ Pre-Turbo Catalyst ······························ Large Diameter SCR (24″-30″)
Hybrid Ammonia Processing System ······························ X-Cloud Distributed Control System ······························ Marine Soot Blower ······························ Electrolysis Processor
Acoustics Electronic Exhaust Valve
Software-based Signature Sound System
In production or production ready In development – production ready in 2014-2018
Regulatory-Driven Clean Air Product Pipeline
15
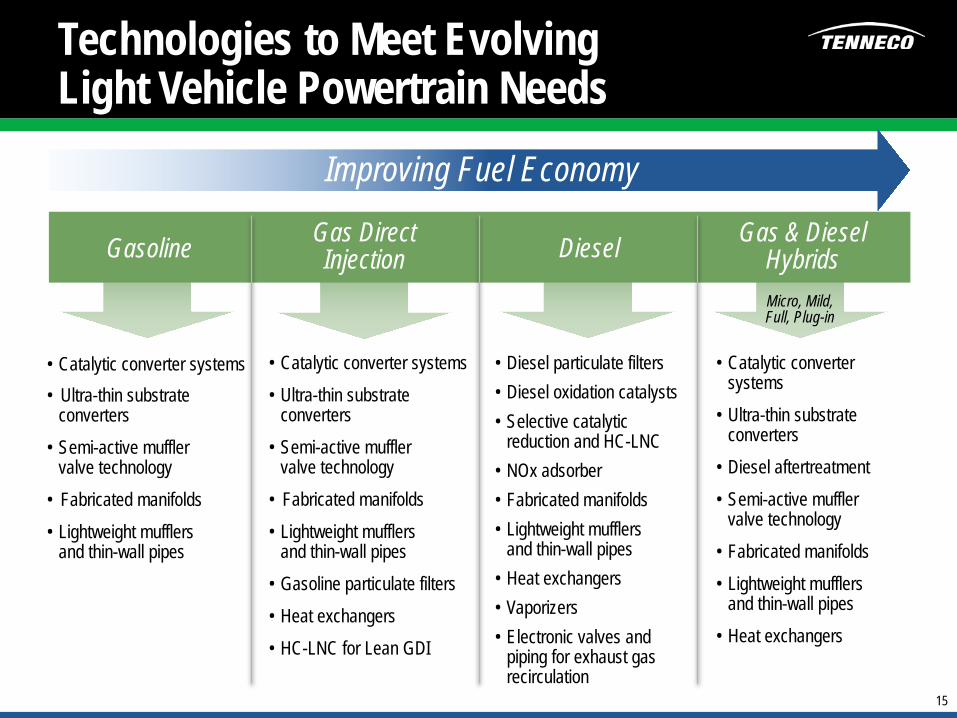
Technologies to Meet Evolving Light Vehicle Powertrain Needs
Improving Fuel Economy
Micro, Mild, Full, Plug-in
• Catalytic converter systems • Ultra-thin substrate
converters • Semi-active muffler
valve technology • Fabricated manifolds • Lightweight mufflers
and thin-wall pipes
• Catalytic converter systems • Ultra-thin substrate
converters • Semi-active muffler
valve technology • Fabricated manifolds • Lightweight mufflers
and thin-wall pipes • Gasoline particulate filters • Heat exchangers • HC-LNC for Lean GDI
• Catalytic converter systems
• Ultra-thin substrate converters
• Diesel aftertreatment • Semi-active muffler
valve technology • Fabricated manifolds • Lightweight mufflers
and thin-wall pipes • Heat exchangers
Gasoline Gas Direct Injection Diesel Gas & Diesel
Hybrids
• Diesel particulate filters • Diesel oxidation catalysts • Selective catalytic
reduction and HC-LNC • NOx adsorber • Fabricated manifolds • Lightweight mufflers
and thin-wall pipes • Heat exchangers • Vaporizers • Electronic valves and
piping for exhaust gas recirculation
16
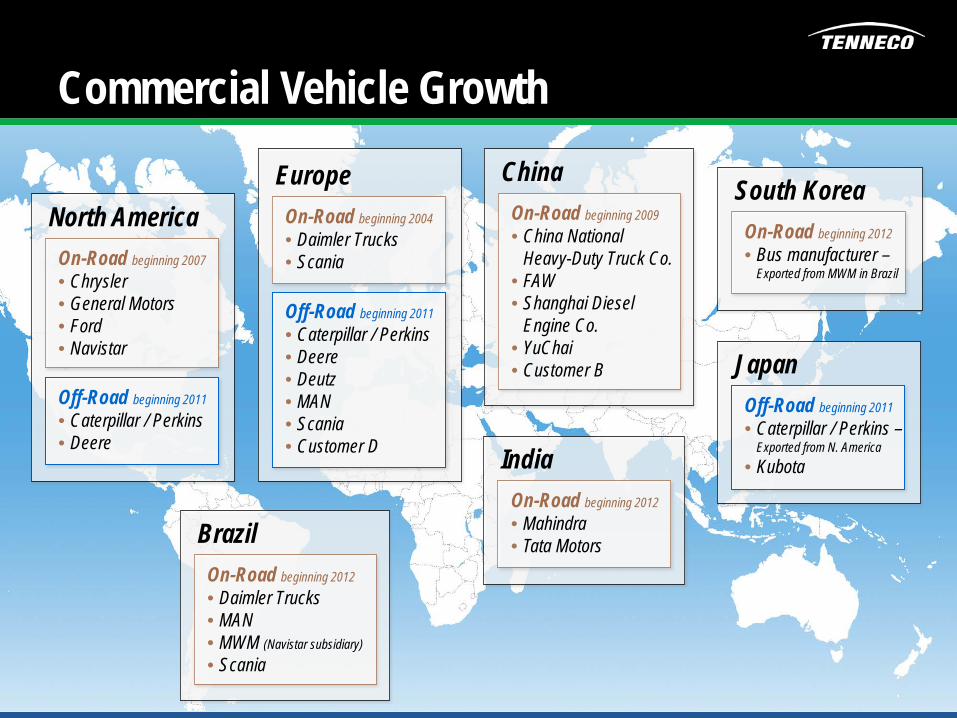
Commercial Vehicle Growth
North America On-Road beginning 2007
• Chrysler • General Motors • Ford • Navistar
Off-Road beginning 2011
• Caterpillar / Perkins • Deere
Europe On-Road beginning 2004
• Daimler Trucks • Scania
Off-Road beginning 2011
• Caterpillar / Perkins • Deere • Deutz • MAN • Scania • Customer D
Brazil On-Road beginning 2012
• Daimler Trucks • MAN • MWM (Navistar subsidiary) • Scania
India On-Road beginning 2012
• Mahindra • Tata Motors
China On-Road beginning 2009
• China National Heavy-Duty Truck Co.
• FAW • Shanghai Diesel
Engine Co. • YuChai • Customer B
South Korea On-Road beginning 2012
• Bus manufacturer –Exported from MWM in Brazil
Japan Off-Road beginning 2011
• Caterpillar / Perkins – Exported from N. America
• Kubota
17
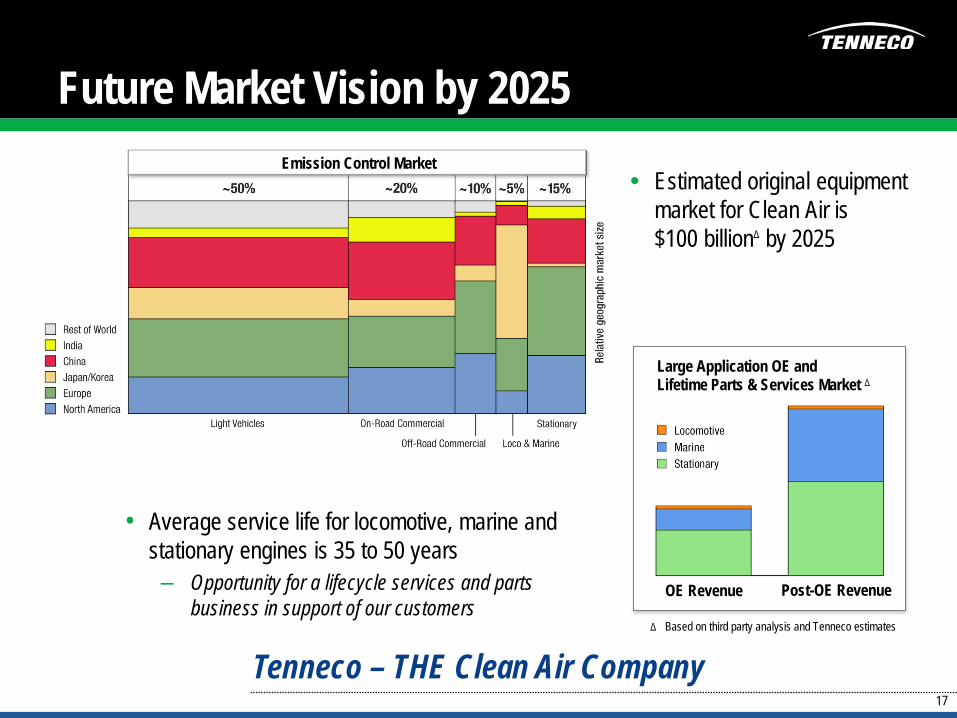
Future Market Vision by 2025
Tenneco – THE Clean Air Company
• Estimated original equipment market for Clean Air is $100 billionΔ by 2025
Δ Based on third party analysis and Tenneco estimates
Large Application OE and Lifetime Parts & Services Market Δ
OE Revenue Post-OE Revenue
Emission Control Market
• Average service life for locomotive, marine and stationary engines is 35 to 50 years – Opportunity for a lifecycle services and parts
business in support of our customers
18
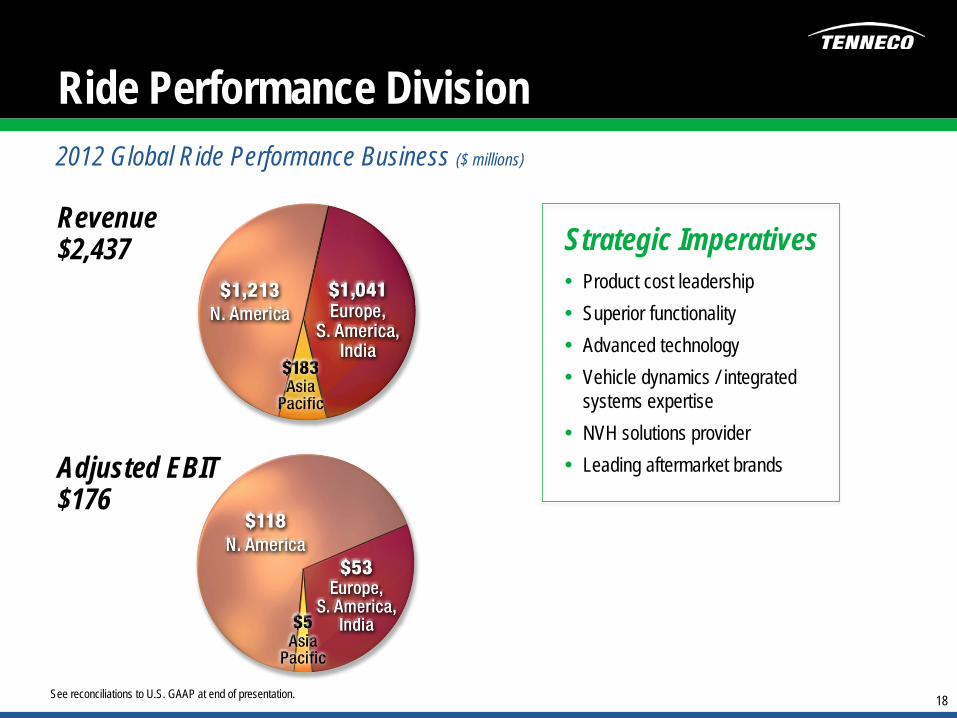
Ride Performance Division 2012 Global Ride Performance Business ($ millions)
Revenue $2,437
Adjusted EBIT $176
Strategic Imperatives • Product cost leadership • Superior functionality • Advanced technology • Vehicle dynamics / integrated
systems expertise • NVH solutions provider • Leading aftermarket brands
See reconciliations to U.S. GAAP at end of presentation.
19
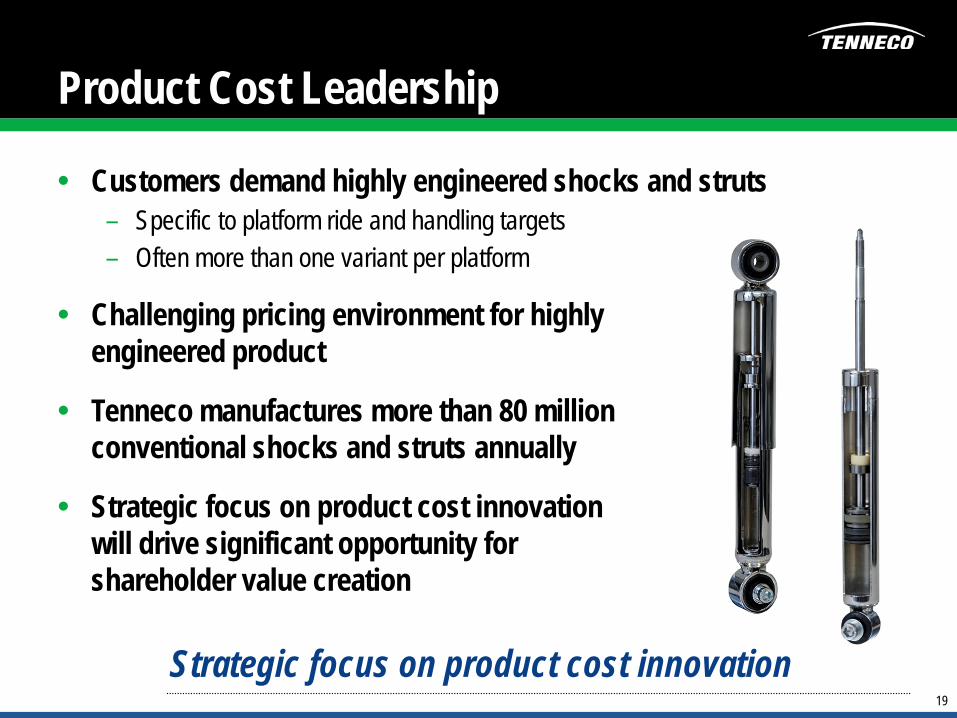
Product Cost Leadership
• Customers demand highly engineered shocks and struts – Specific to platform ride and handling targets – Often more than one variant per platform
• Challenging pricing environment for highly engineered product
• Tenneco manufactures more than 80 million conventional shocks and struts annually
• Strategic focus on product cost innovation will drive significant opportunity for shareholder value creation
Strategic focus on product cost innovation
20
Advanced Technologies
† CES is a registered trademark of Öhlins Racing AB CORPORATION SWEDEN. All other trademarks, service marks and logos used herein are the trademarks, service marks, or logos of their respective owners.
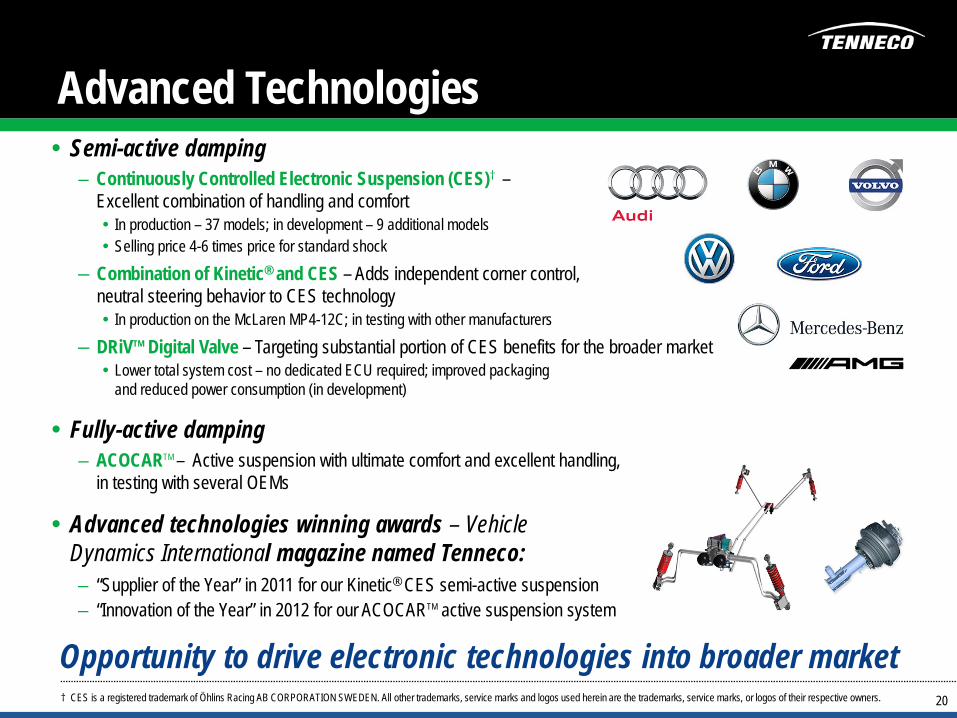
• Semi-active damping – Continuously Controlled Electronic Suspension (CES)† –
Excellent combination of handling and comfort • In production – 37 models; in development – 9 additional models • Selling price 4-6 times price for standard shock
– Combination of Kinetic® and CES – Adds independent corner control, neutral steering behavior to CES technology • In production on the McLaren MP4-12C; in testing with other manufacturers
– DRiVTM Digital Valve – Targeting substantial portion of CES benefits for the broader market • Lower total system cost – no dedicated ECU required; improved packaging
and reduced power consumption (in development)
• Fully-active damping – ACOCARTM – Active suspension with ultimate comfort and excellent handling,
in testing with several OEMs
• Advanced technologies winning awards – Vehicle Dynamics International magazine named Tenneco: – “Supplier of the Year” in 2011 for our Kinetic® CES semi-active suspension – “Innovation of the Year” in 2012 for our ACOCARTM active suspension system
Opportunity to drive electronic technologies into broader market
21 † CES is a registered trademark of Öhlins Racing AB CORPORATION SWEDEN. All other trademarks, service marks and logos used herein are the trademarks, service marks, or logos of their respective owners.
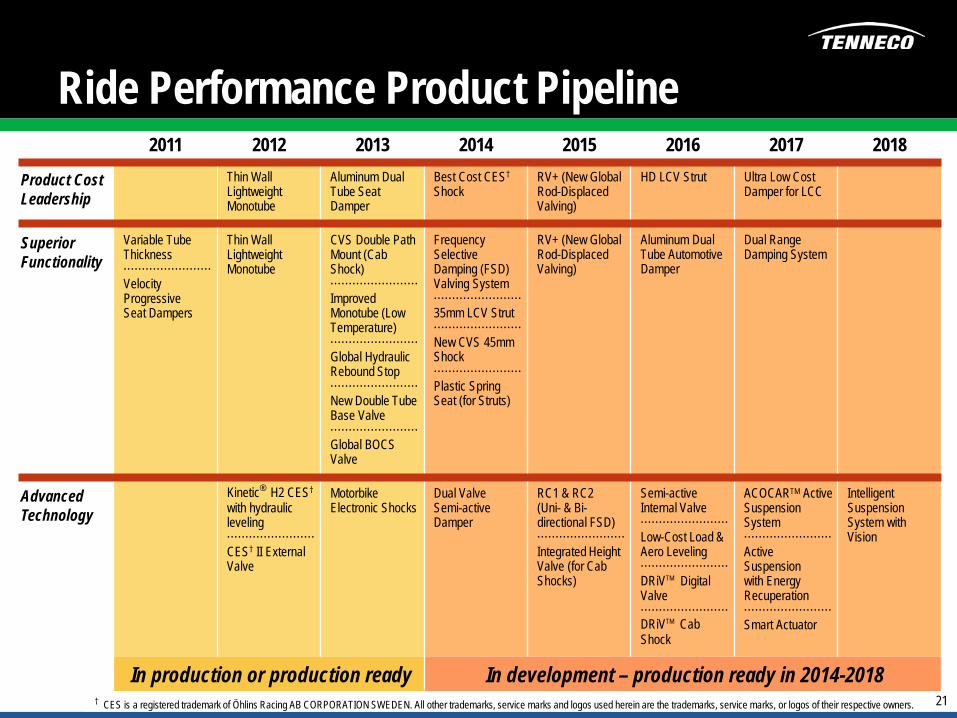
2011 2012 2013 2014 2015 2016 2017 2018
Product Cost Leadership
Thin Wall Lightweight Monotube
Aluminum Dual Tube Seat Damper
Best Cost CES† Shock
RV+ (New Global Rod-Displaced Valving)
HD LCV Strut Ultra Low Cost Damper for LCC
Superior Functionality
Variable Tube Thickness ························ Velocity Progressive Seat Dampers
Thin Wall Lightweight Monotube
CVS Double Path Mount (Cab Shock) ························ Improved Monotube (Low Temperature) ························ Global Hydraulic Rebound Stop ························ New Double Tube Base Valve ························ Global BOCS Valve
Frequency Selective Damping (FSD) Valving System ························ 35mm LCV Strut ························ New CVS 45mm Shock ························ Plastic Spring Seat (for Struts)
RV+ (New Global Rod-Displaced Valving)
Aluminum Dual Tube Automotive Damper
Dual Range Damping System
Advanced Technology
Kinetic® H2 CES† with hydraulic leveling ························ CES† II External Valve
Motorbike Electronic Shocks
Dual Valve Semi-active Damper
RC1 & RC2 (Uni- & Bi-directional FSD) ························ Integrated Height Valve (for Cab Shocks)
Semi-active Internal Valve ························ Low-Cost Load & Aero Leveling ························ DRiVTM Digital Valve ························ DRiVTM Cab Shock
ACOCARTM Active Suspension System ························ Active Suspension with Energy Recuperation ························ Smart Actuator
Intelligent Suspension System with Vision
In production or production ready In development – production ready in 2014-2018
Ride Performance Product Pipeline
22
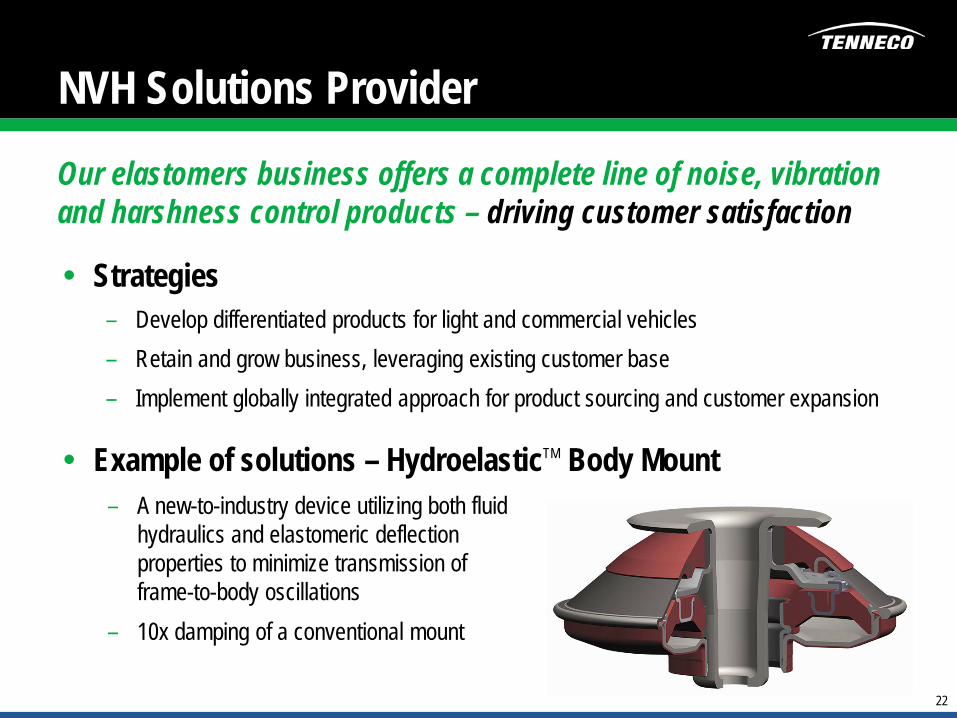
NVH Solutions Provider
Our elastomers business offers a complete line of noise, vibration and harshness control products – driving customer satisfaction
• Strategies – Develop differentiated products for light and commercial vehicles – Retain and grow business, leveraging existing customer base – Implement globally integrated approach for product sourcing and customer expansion
• Example of solutions – HydroelasticTM Body Mount – A new-to-industry device utilizing both fluid
hydraulics and elastomeric deflection properties to minimize transmission of frame-to-body oscillations
– 10x damping of a conventional mount
23
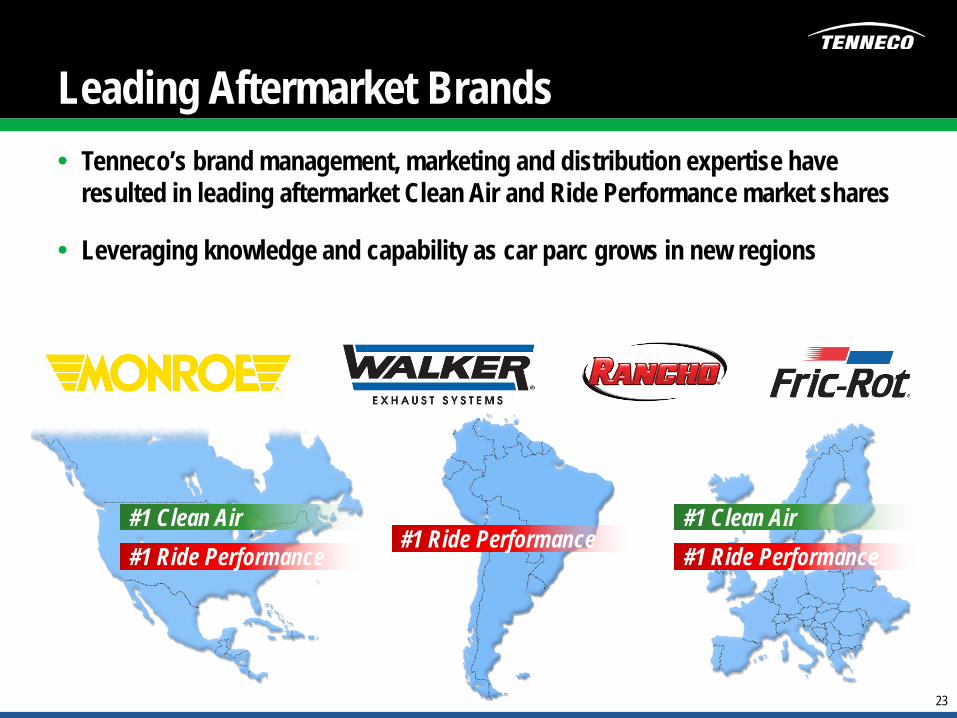
Leading Aftermarket Brands • Tenneco’s brand management, marketing and distribution expertise have
resulted in leading aftermarket Clean Air and Ride Performance market shares
• Leveraging knowledge and capability as car parc grows in new regions
#1 Clean Air #1 Ride Performance
#1 Clean Air #1 Ride Performance
#1 Ride Performance
24
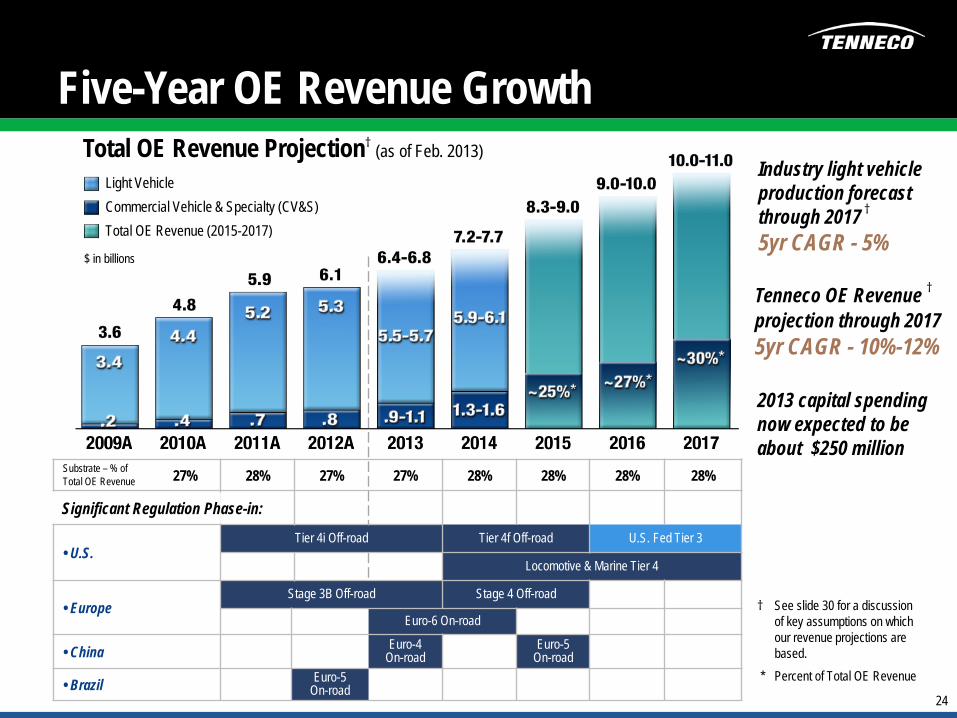
Five-Year OE Revenue Growth Total OE Revenue Projection† (as of Feb. 2013)
Light Vehicle Commercial Vehicle & Specialty (CV&S) Total OE Revenue (2015-2017)
† See slide 30 for a discussion of key assumptions on which our revenue projections are based.
* Percent of Total OE Revenue
Substrate – % of Total OE Revenue 27% 28% 27% 27% 28% 28% 28% 28%
• U.S. Tier 4i Off-road Tier 4f Off-road U.S. Fed Tier 3
Locomotive & Marine Tier 4
• Europe Stage 3B Off-road Stage 4 Off-road
Euro-6 On-road
• China Euro-4 On-road
Euro-5 On-road
• Brazil Euro-5 On-road
Significant Regulation Phase-in:
$ in billions
Industry light vehicle production forecast through 2017 † 5yr CAGR - 5%
Tenneco OE Revenue †
projection through 2017 5yr CAGR - 10%-12%
2013 capital spending now expected to be about $250 million
25
Tenneco Manufacturing System (T.M.S.) • Highly focused on global manufacturing performance
– Safety – Process driven quality – Process efficiency – Inventory management
• T.M.S. University Plants in all operating regions – Structured to drive focused development of core competencies and standardization – Leverage operational leadership and best practices
• Standardization of global processes are key to our success
– Global platform management – Industrialization of new technologies – Supplier management – Total capital efficiency
Driving Consistency Across Global Operations
Over $50 million – Process Excellence
savings in 2011 (Lean and Six Sigma)
TM
26
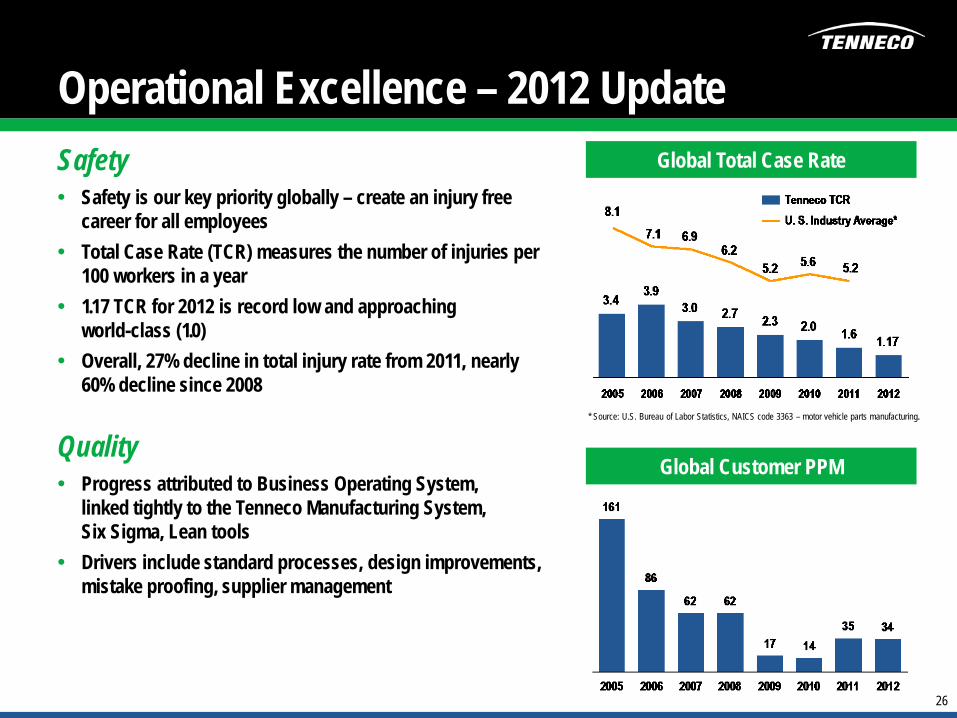
Operational Excellence – 2012 Update Safety • Safety is our key priority globally – create an injury free
career for all employees • Total Case Rate (TCR) measures the number of injuries per
100 workers in a year • 1.17 TCR for 2012 is record low and approaching
world-class (1.0) • Overall, 27% decline in total injury rate from 2011, nearly
60% decline since 2008
Quality • Progress attributed to Business Operating System,
linked tightly to the Tenneco Manufacturing System, Six Sigma, Lean tools
• Drivers include standard processes, design improvements, mistake proofing, supplier management
* Source: U.S. Bureau of Labor Statistics, NAICS code 3363 – motor vehicle parts manufacturing.
Global Total Case Rate
Global Customer PPM
27
Summary • History of growth, profitability and deleveraging • Clean Air regulations and technology drive growth opportunities
– Light vehicle content and market share growth – Content and market share growth in on-road and off-road commercial vehicles, and locomotive,
marine and stationary engines – Content and volume growth in emerging markets
• Market leading Ride Performance business – Product cost leadership leveraging scale of business – Semi-active and active damping technologies
• Sound business model with geographic, customer, end-market, product and platform balance
– Leading supplier of Clean Air and Ride Performance products and systems – No. 1 aftermarket supplier driven by leading brands
• Strong operational capabilities and manufacturing footprint • Demonstrated commitment to balance sheet strength and financial stability • Experienced management team
28
29
Tenneco’s OE Revenue Projections Tenneco’s revenue projections are as of February 2013, and the company does not otherwise intend to update these projections until February 2014. Revenue assumptions are based on projected customer production schedules, IHS Automotive January 2013 forecasts and Power Systems Research January 2013 forecasts. Our currency assumption is $1.27/€ for all years in our projection.
In addition to the information set forth on this slide and slide 25, Tenneco’s OE revenue projections are based on the type of information set forth under “Outlook” in Item 7 – “Management’s Discussion and Analysis of Financial Condition and Results of Operations” as set forth in Tenneco’s Annual Report on Form 10-K for the year ended December 31, 2012. Please see that disclosure for further information. Key additional assumptions and limitations described in that disclosure include:
• Revenue projections are based on original equipment manufacturers’ programs that have been formally awarded to the company; programs where the company is highly confident that it will be awarded business based on informal customer indications consistent with past practices; Tenneco’s status as supplier for the existing program and its relationship with the customer; and the actual original equipment revenues achieved by the company for each of the last several years compared to the amount of those revenues that the company estimated it would generate at the beginning of each year.
• Revenue projections are based on the anticipated pricing of each program over its life.
• Revenue projections assume a fixed foreign currency value. This value is used to translate foreign business to the U.S. dollar.
• Revenue projections are subject to increase or decrease due to changes in customer requirements, customer and consumer preferences, the number of vehicles actually produced by our customers, pricing and foreign currency.
30
Financial Results Disclaimer • Use of Non-GAAP Financial Information In addition to the results reported in accordance with accounting principles generally accepted in the United States (“GAAP”) included in this presentation, the company has provided information regarding certain non-GAAP financial measures. These measures include Earnings Before Interest Expense, Income Taxes, Noncontrolling Interests and Depreciation and Amortization (“EBITDA*”), Net Debt, Value-Add Revenue, Adjusted EBITDA*, Adjusted Earnings Before Interest Expense, Income Taxes and Noncontrolling Interests (“Adjusted EBIT”), Adjusted Net Income and Adjusted Earnings Per Share.
Reconciliations of these non-GAAP financial measures to the comparable GAAP measure are included in this presentation. * Including noncontrolling interests.
31
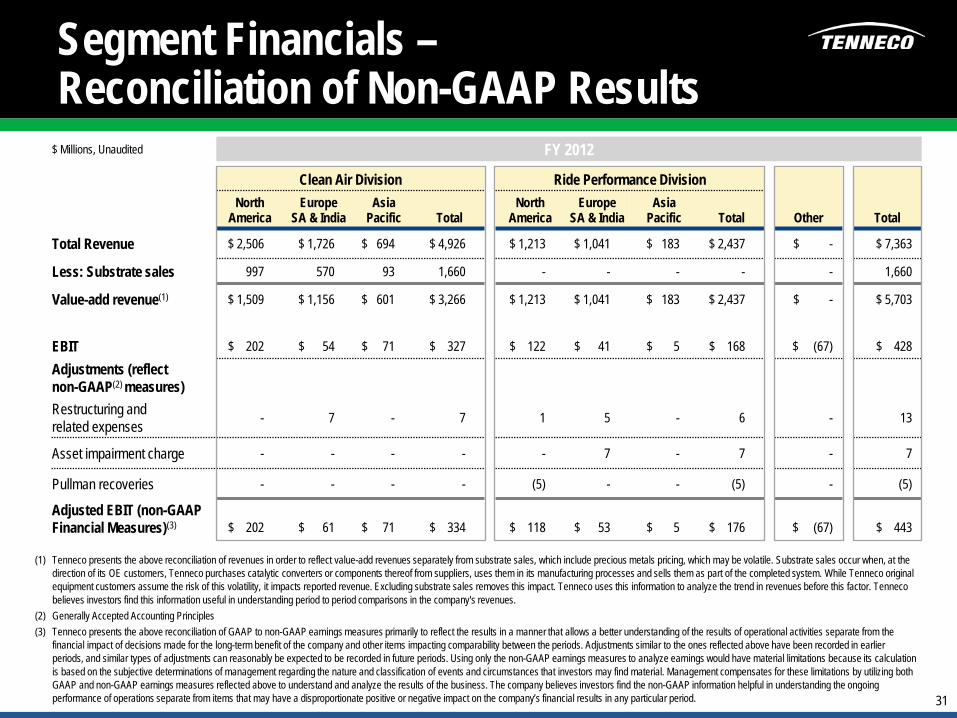
Segment Financials – Reconciliation of Non-GAAP Results
(1) Tenneco presents the above reconciliation of revenues in order to reflect value-add revenues separately from substrate sales, which include precious metals pricing, which may be volatile. Substrate sales occur when, at the direction of its OE customers, Tenneco purchases catalytic converters or components thereof from suppliers, uses them in its manufacturing processes and sells them as part of the completed system. While Tenneco original equipment customers assume the risk of this volatility, it impacts reported revenue. Excluding substrate sales removes this impact. Tenneco uses this information to analyze the trend in revenues before this factor. Tenneco believes investors find this information useful in understanding period to period comparisons in the company's revenues.
(2) Generally Accepted Accounting Principles (3) Tenneco presents the above reconciliation of GAAP to non-GAAP earnings measures primarily to reflect the results in a manner that allows a better understanding of the results of operational activities separate from the
financial impact of decisions made for the long-term benefit of the company and other items impacting comparability between the periods. Adjustments similar to the ones reflected above have been recorded in earlier periods, and similar types of adjustments can reasonably be expected to be recorded in future periods. Using only the non-GAAP earnings measures to analyze earnings would have material limitations because its calculation is based on the subjective determinations of management regarding the nature and classification of events and circumstances that investors may find material. Management compensates for these limitations by utilizing both GAAP and non-GAAP earnings measures reflected above to understand and analyze the results of the business. The company believes investors find the non-GAAP information helpful in understanding the ongoing performance of operations separate from items that may have a disproportionate positive or negative impact on the company’s financial results in any particular period.
$ Millions, Unaudited FY 2012
Clean Air Division Ride Performance Division North
America Europe
SA & India Asia
Pacific Total North
America Europe
SA & India Asia
Pacific Total Other Total
Total Revenue $ 2,506 $ 1,726 $ 694 $ 4,926 $ 1,213 $ 1,041 $ 183 $ 2,437 $ - $ 7,363
Less: Substrate sales 997 570 93 1,660 - - - - - 1,660
Value-add revenue(1) $ 1,509 $ 1,156 $ 601 $ 3,266 $ 1,213 $ 1,041 $ 183 $ 2,437 $ - $ 5,703
EBIT $ 202 $ 54 $ 71 $ 327 $ 122 $ 41 $ 5 $ 168 $ (67) $ 428
Adjustments (reflect non-GAAP(2) measures) Restructuring and related expenses - 7 - 7 1 5 - 6 - 13
Asset impairment charge - - - - - 7 - 7 - 7
Pullman recoveries - - - - (5) - - (5) - (5)
Adjusted EBIT (non-GAAP Financial Measures)(3) $ 202 $ 61 $ 71 $ 334 $ 118 $ 53 $ 5 $ 176 $ (67) $ 443
32
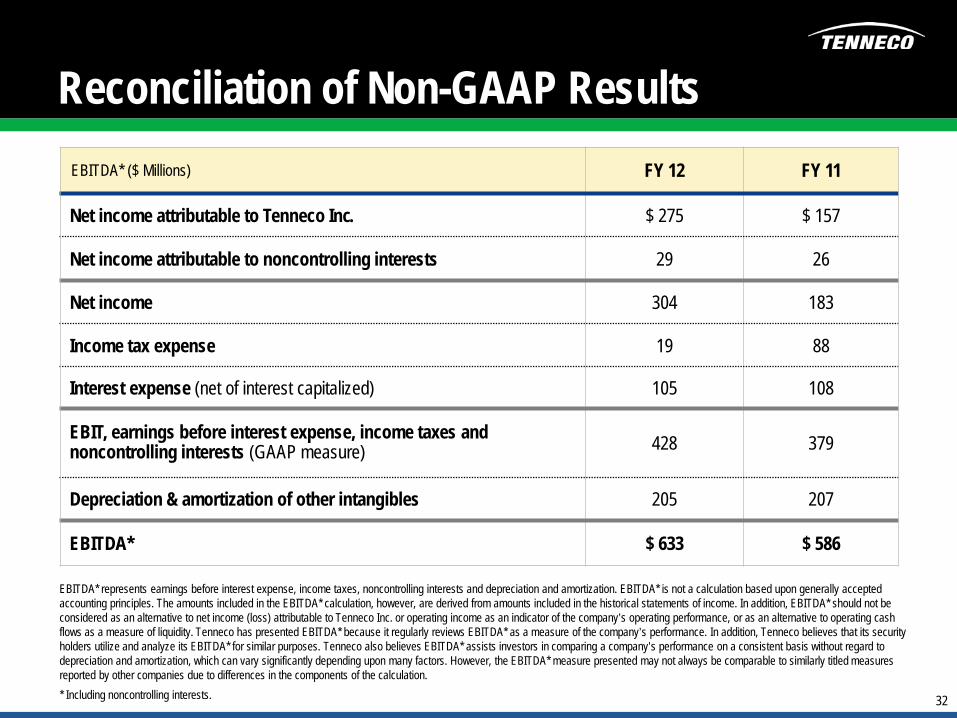
Reconciliation of Non-GAAP Results
FY 12 FY 11
Net income attributable to Tenneco Inc. $ 275 $ 157
Net income attributable to noncontrolling interests 29 26
Net income 304 183
Income tax expense 19 88
Interest expense (net of interest capitalized) 105 108
EBIT, earnings before interest expense, income taxes and noncontrolling interests (GAAP measure) 428 379
Depreciation & amortization of other intangibles 205 207
EBITDA* $ 633 $ 586
EBITDA* ($ Millions)
EBITDA* represents earnings before interest expense, income taxes, noncontrolling interests and depreciation and amortization. EBITDA* is not a calculation based upon generally accepted accounting principles. The amounts included in the EBITDA* calculation, however, are derived from amounts included in the historical statements of income. In addition, EBITDA* should not be considered as an alternative to net income (loss) attributable to Tenneco Inc. or operating income as an indicator of the company’s operating performance, or as an alternative to operating cash flows as a measure of liquidity. Tenneco has presented EBITDA* because it regularly reviews EBITDA* as a measure of the company’s performance. In addition, Tenneco believes that its security holders utilize and analyze its EBITDA* for similar purposes. Tenneco also believes EBITDA* assists investors in comparing a company’s performance on a consistent basis without regard to depreciation and amortization, which can vary significantly depending upon many factors. However, the EBITDA* measure presented may not always be comparable to similarly titled measures reported by other companies due to differences in the components of the calculation. * Including noncontrolling interests.
33
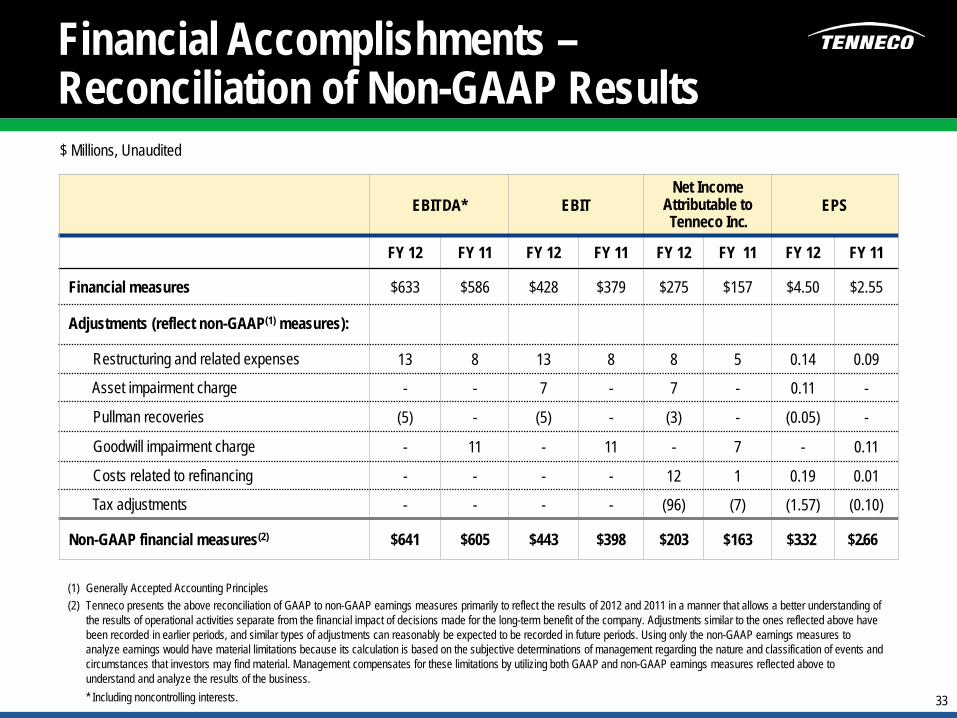
Financial Accomplishments – Reconciliation of Non-GAAP Results
EBITDA* EBIT Net Income
Attributable to Tenneco Inc.
EPS
FY 12 FY 11 FY 12 FY 11 FY 12 FY 11 FY 12 FY 11
Financial measures $633 $586 $428 $379 $275 $157 $4.50 $2.55
Adjustments (reflect non-GAAP(1) measures):
Restructuring and related expenses 13 8 13 8 8 5 0.14 0.09
Asset impairment charge - - 7 - 7 - 0.11 -
Pullman recoveries (5) - (5) - (3) - (0.05) -
Goodwill impairment charge - 11 - 11 - 7 - 0.11
Costs related to refinancing - - - - 12 1 0.19 0.01
Tax adjustments - - - - (96) (7) (1.57) (0.10)
Non-GAAP financial measures(2) $641 $605 $443 $398 $203 $163 $3.32 $2.66
(1) Generally Accepted Accounting Principles (2) Tenneco presents the above reconciliation of GAAP to non-GAAP earnings measures primarily to reflect the results of 2012 and 2011 in a manner that allows a better understanding of
the results of operational activities separate from the financial impact of decisions made for the long-term benefit of the company. Adjustments similar to the ones reflected above have been recorded in earlier periods, and similar types of adjustments can reasonably be expected to be recorded in future periods. Using only the non-GAAP earnings measures to analyze earnings would have material limitations because its calculation is based on the subjective determinations of management regarding the nature and classification of events and circumstances that investors may find material. Management compensates for these limitations by utilizing both GAAP and non-GAAP earnings measures reflected above to understand and analyze the results of the business.
* Including noncontrolling interests.
$ Millions, Unaudited
34
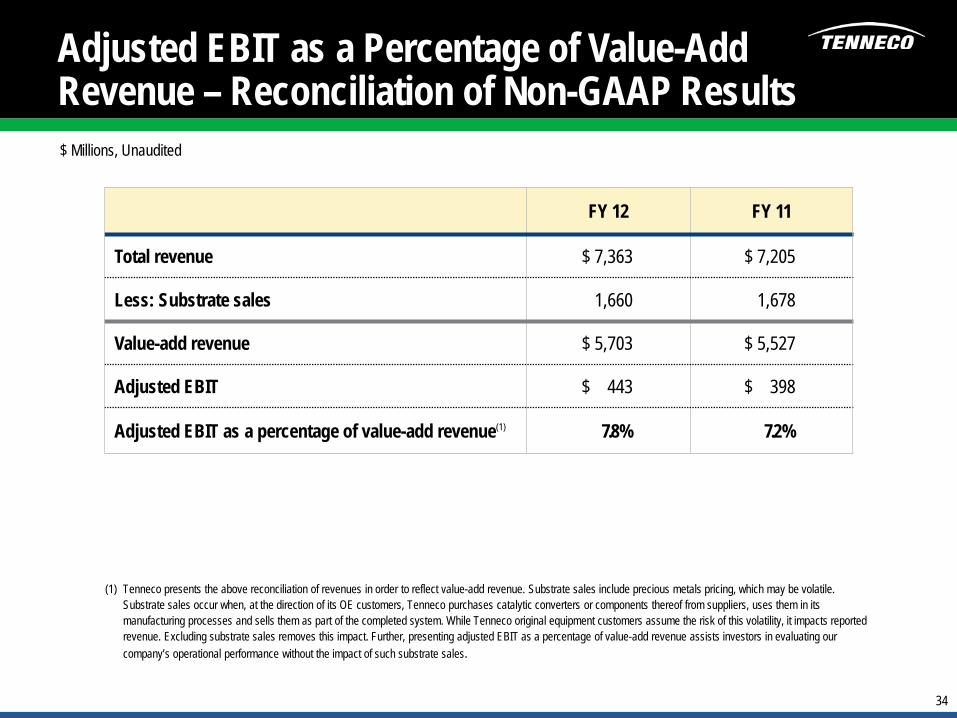
Adjusted EBIT as a Percentage of Value-Add Revenue – Reconciliation of Non-GAAP Results
FY 12 FY 11
Total revenue $ 7,363 $ 7,205
Less: Substrate sales 1,660 1,678
Value-add revenue $ 5,703 $ 5,527
Adjusted EBIT $ 443 $ 398
Adjusted EBIT as a percentage of value-add revenue(1) 7.8% 7.2%
(1) Tenneco presents the above reconciliation of revenues in order to reflect value-add revenue. Substrate sales include precious metals pricing, which may be volatile. Substrate sales occur when, at the direction of its OE customers, Tenneco purchases catalytic converters or components thereof from suppliers, uses them in its manufacturing processes and sells them as part of the completed system. While Tenneco original equipment customers assume the risk of this volatility, it impacts reported revenue. Excluding substrate sales removes this impact. Further, presenting adjusted EBIT as a percentage of value-add revenue assists investors in evaluating our company’s operational performance without the impact of such substrate sales.
$ Millions, Unaudited
35
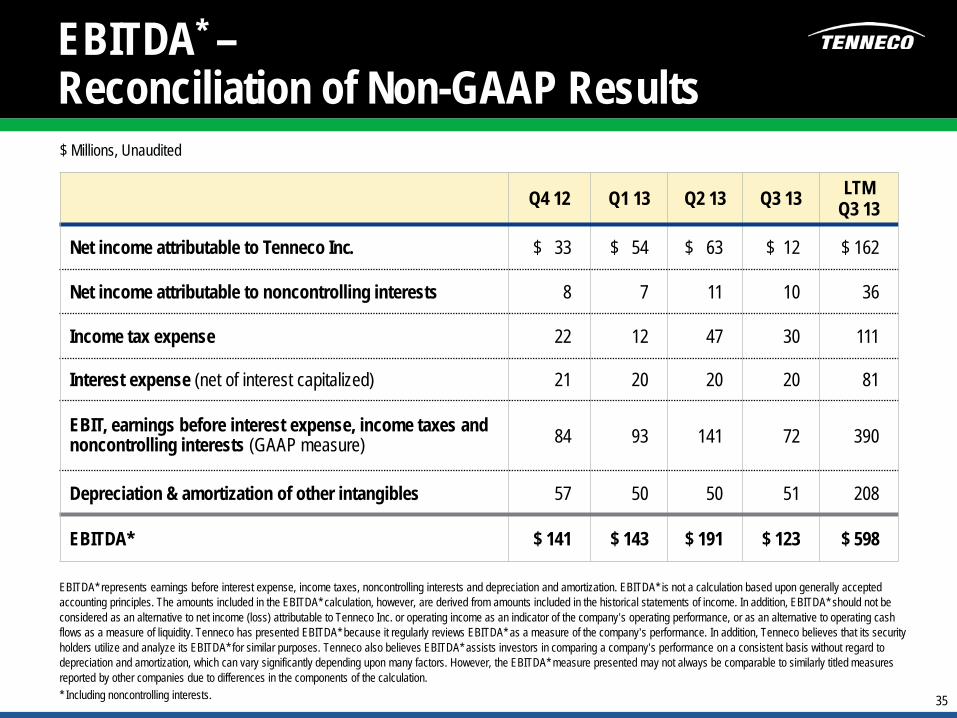
EBITDA* – Reconciliation of Non-GAAP Results
Q4 12 Q1 13 Q2 13 Q3 13 LTM Q3 13
Net income attributable to Tenneco Inc. $ 33 $ 54 $ 63 $ 12 $ 162
Net income attributable to noncontrolling interests 8 7 11 10 36
Income tax expense 22 12 47 30 111
Interest expense (net of interest capitalized) 21 20 20 20 81
EBIT, earnings before interest expense, income taxes and noncontrolling interests (GAAP measure) 84 93 141 72 390
Depreciation & amortization of other intangibles 57 50 50 51 208
EBITDA* $ 141 $ 143 $ 191 $ 123 $ 598
EBITDA* represents earnings before interest expense, income taxes, noncontrolling interests and depreciation and amortization. EBITDA* is not a calculation based upon generally accepted accounting principles. The amounts included in the EBITDA* calculation, however, are derived from amounts included in the historical statements of income. In addition, EBITDA* should not be considered as an alternative to net income (loss) attributable to Tenneco Inc. or operating income as an indicator of the company’s operating performance, or as an alternative to operating cash flows as a measure of liquidity. Tenneco has presented EBITDA* because it regularly reviews EBITDA* as a measure of the company’s performance. In addition, Tenneco believes that its security holders utilize and analyze its EBITDA* for similar purposes. Tenneco also believes EBITDA* assists investors in comparing a company’s performance on a consistent basis without regard to depreciation and amortization, which can vary significantly depending upon many factors. However, the EBITDA* measure presented may not always be comparable to similarly titled measures reported by other companies due to differences in the components of the calculation. * Including noncontrolling interests.
$ Millions, Unaudited
36
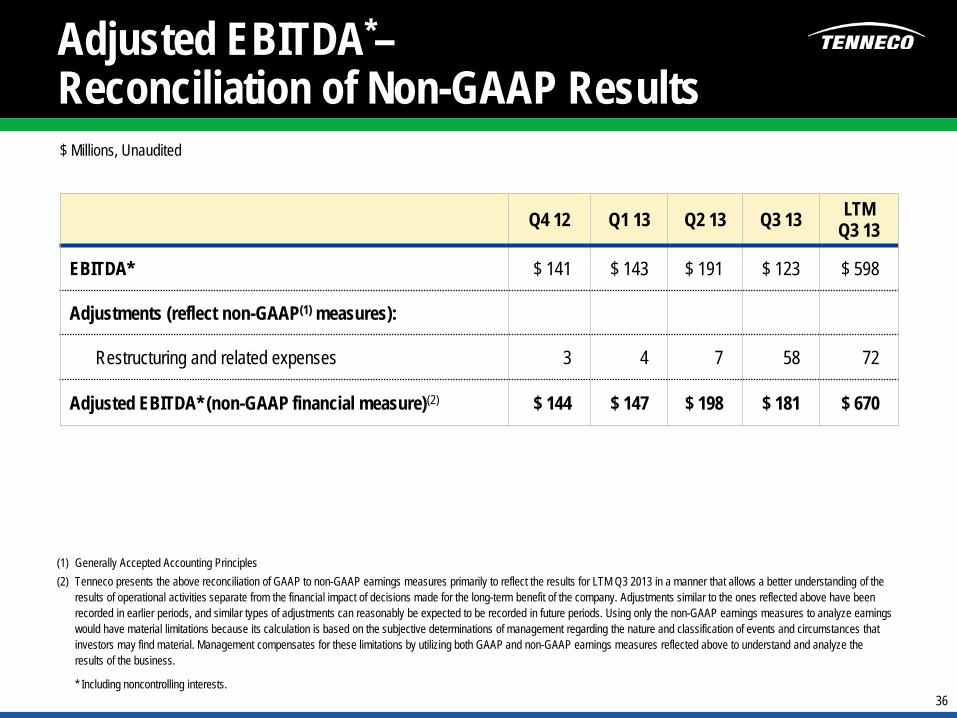
Adjusted EBITDA*– Reconciliation of Non-GAAP Results
(1) Generally Accepted Accounting Principles (2) Tenneco presents the above reconciliation of GAAP to non-GAAP earnings measures primarily to reflect the results for LTM Q3 2013 in a manner that allows a better understanding of the
results of operational activities separate from the financial impact of decisions made for the long-term benefit of the company. Adjustments similar to the ones reflected above have been recorded in earlier periods, and similar types of adjustments can reasonably be expected to be recorded in future periods. Using only the non-GAAP earnings measures to analyze earnings would have material limitations because its calculation is based on the subjective determinations of management regarding the nature and classification of events and circumstances that investors may find material. Management compensates for these limitations by utilizing both GAAP and non-GAAP earnings measures reflected above to understand and analyze the results of the business.
* Including noncontrolling interests.
$ Millions, Unaudited
Q4 12 Q1 13 Q2 13 Q3 13 LTM Q3 13
EBITDA* $ 141 $ 143 $ 191 $ 123 $ 598
Adjustments (reflect non-GAAP(1) measures):
Restructuring and related expenses 3 4 7 58 72
Adjusted EBITDA* (non-GAAP financial measure)(2) $ 144 $ 147 $ 198 $ 181 $ 670

37
EBITDA* – Reconciliation of Non-GAAP Results
Q4 11 Q1 12 Q2 12 Q3 12 LTM Q3 12
Net income attributable to Tenneco Inc. $ 30 $ 30 $ 87 $ 125 $ 272
Net income attributable to noncontrolling interests 8 6 8 7 29
Income tax expense (benefit) 23 18 21 (42) 20
Interest expense (net of interest capitalized) 27 42 21 21 111
EBIT, earnings before interest expense, income taxes and noncontrolling interests (GAAP measure) 88 96 137 111 432
Depreciation & amortization of other intangibles 51 49 50 49 199
EBITDA* $ 139 $ 145 $ 187 $ 160 $ 631
EBITDA* represents earnings before interest expense, income taxes, noncontrolling interests and depreciation and amortization. EBITDA* is not a calculation based upon generally accepted accounting principles. The amounts included in the EBITDA* calculation, however, are derived from amounts included in the historical statements of income. In addition, EBITDA* should not be considered as an alternative to net income (loss) attributable to Tenneco Inc. or operating income as an indicator of the company’s operating performance, or as an alternative to operating cash flows as a measure of liquidity. Tenneco has presented EBITDA* because it regularly reviews EBITDA* as a measure of the company’s performance. In addition, Tenneco believes that its security holders utilize and analyze its EBITDA* for similar purposes. Tenneco also believes EBITDA* assists investors in comparing a company’s performance on a consistent basis without regard to depreciation and amortization, which can vary significantly depending upon many factors. However, the EBITDA* measure presented may not always be comparable to similarly titled measures reported by other companies due to differences in the components of the calculation. * Including noncontrolling interests.
$ Millions, Unaudited
38
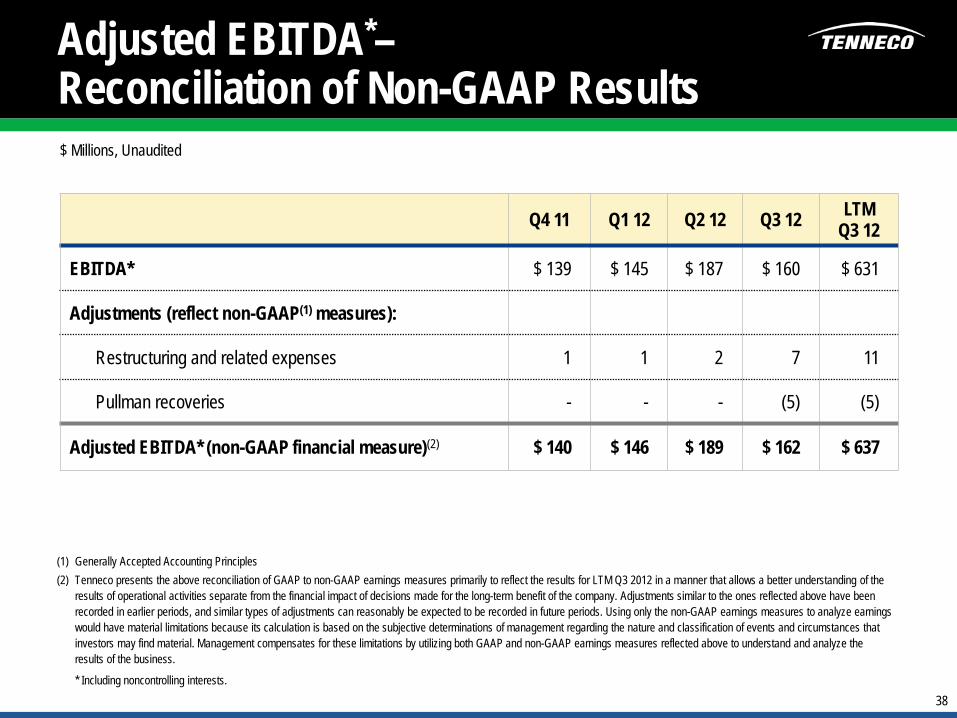
Adjusted EBITDA*– Reconciliation of Non-GAAP Results
(1) Generally Accepted Accounting Principles (2) Tenneco presents the above reconciliation of GAAP to non-GAAP earnings measures primarily to reflect the results for LTM Q3 2012 in a manner that allows a better understanding of the
results of operational activities separate from the financial impact of decisions made for the long-term benefit of the company. Adjustments similar to the ones reflected above have been recorded in earlier periods, and similar types of adjustments can reasonably be expected to be recorded in future periods. Using only the non-GAAP earnings measures to analyze earnings would have material limitations because its calculation is based on the subjective determinations of management regarding the nature and classification of events and circumstances that investors may find material. Management compensates for these limitations by utilizing both GAAP and non-GAAP earnings measures reflected above to understand and analyze the results of the business.
* Including noncontrolling interests.
$ Millions, Unaudited
Q4 11 Q1 12 Q2 12 Q3 12 LTM Q3 12
EBITDA* $ 139 $ 145 $ 187 $ 160 $ 631
Adjustments (reflect non-GAAP(1) measures):
Restructuring and related expenses 1 1 2 7 11
Pullman recoveries - - - (5) (5)
Adjusted EBITDA* (non-GAAP financial measure)(2) $ 140 $ 146 $ 189 $ 162 $ 637
39
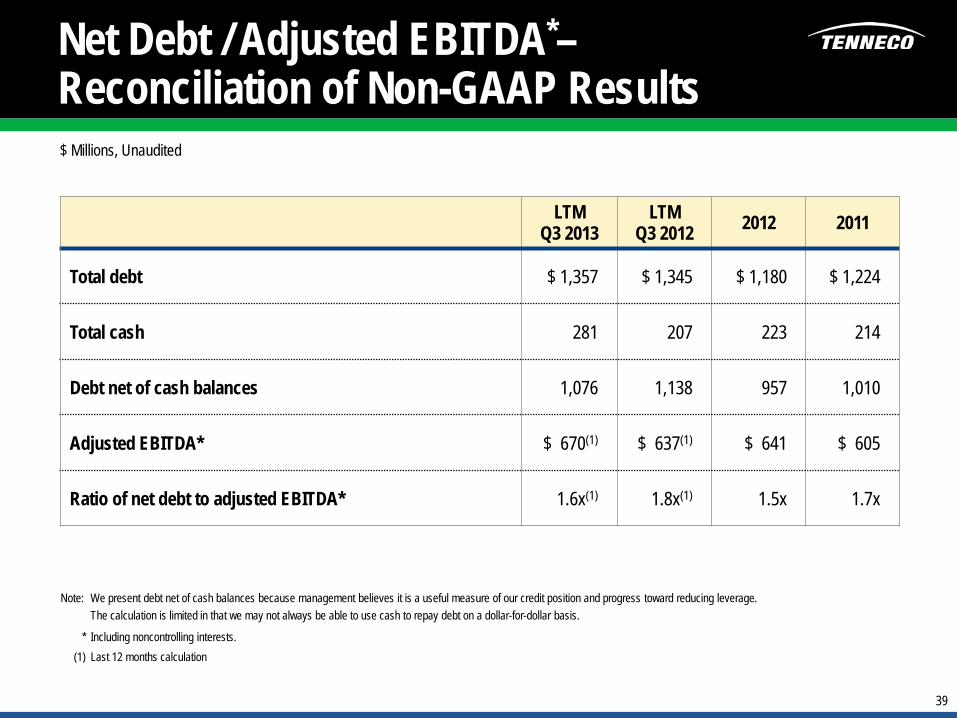
Net Debt / Adjusted EBITDA*– Reconciliation of Non-GAAP Results
Note: We present debt net of cash balances because management believes it is a useful measure of our credit position and progress toward reducing leverage. The calculation is limited in that we may not always be able to use cash to repay debt on a dollar-for-dollar basis.
* Including noncontrolling interests. (1) Last 12 months calculation
$ Millions, Unaudited
LTM Q3 2013
LTM Q3 2012 2012 2011
Total debt $ 1,357 $ 1,345 $ 1,180 $ 1,224
Total cash 281 207 223 214
Debt net of cash balances 1,076 1,138 957 1,010
Adjusted EBITDA* $ 670(1) $ 637(1) $ 641 $ 605
Ratio of net debt to adjusted EBITDA* 1.6x(1) 1.8x(1) 1.5x 1.7x
40
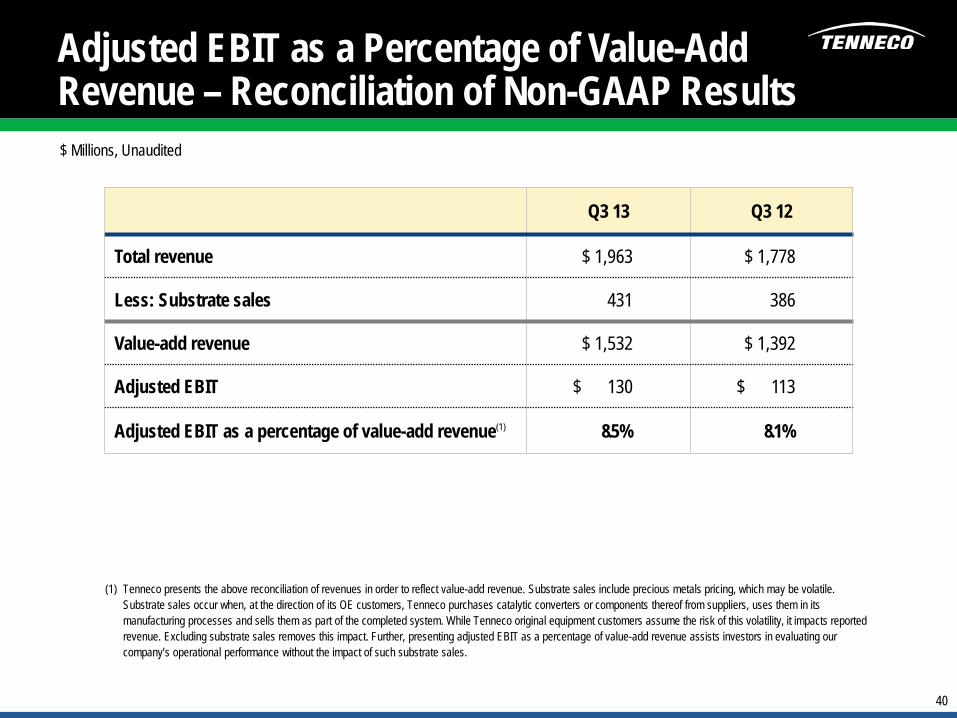
Adjusted EBIT as a Percentage of Value-Add Revenue – Reconciliation of Non-GAAP Results
Q3 13 Q3 12
Total revenue $ 1,963 $ 1,778
Less: Substrate sales 431 386
Value-add revenue $ 1,532 $ 1,392
Adjusted EBIT $ 130 $ 113
Adjusted EBIT as a percentage of value-add revenue(1) 8.5% 8.1%
(1) Tenneco presents the above reconciliation of revenues in order to reflect value-add revenue. Substrate sales include precious metals pricing, which may be volatile. Substrate sales occur when, at the direction of its OE customers, Tenneco purchases catalytic converters or components thereof from suppliers, uses them in its manufacturing processes and sells them as part of the completed system. While Tenneco original equipment customers assume the risk of this volatility, it impacts reported revenue. Excluding substrate sales removes this impact. Further, presenting adjusted EBIT as a percentage of value-add revenue assists investors in evaluating our company’s operational performance without the impact of such substrate sales.
$ Millions, Unaudited
41
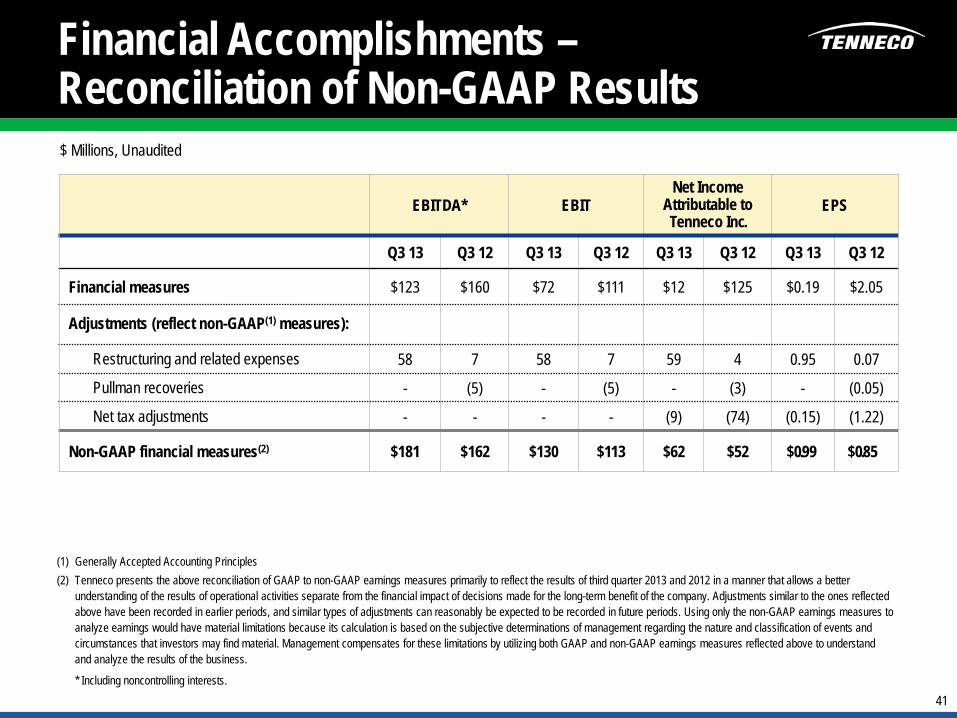
Financial Accomplishments – Reconciliation of Non-GAAP Results
EBITDA* EBIT Net Income
Attributable to Tenneco Inc.
EPS
Q3 13 Q3 12 Q3 13 Q3 12 Q3 13 Q3 12 Q3 13 Q3 12
Financial measures $123 $160 $72 $111 $12 $125 $0.19 $2.05
Adjustments (reflect non-GAAP(1) measures):
Restructuring and related expenses 58 7 58 7 59 4 0.95 0.07
Pullman recoveries - (5) - (5) - (3) - (0.05)
Net tax adjustments - - - - (9) (74) (0.15) (1.22)
Non-GAAP financial measures(2) $181 $162 $130 $113 $62 $52 $0.99 $0.85
(1) Generally Accepted Accounting Principles (2) Tenneco presents the above reconciliation of GAAP to non-GAAP earnings measures primarily to reflect the results of third quarter 2013 and 2012 in a manner that allows a better
understanding of the results of operational activities separate from the financial impact of decisions made for the long-term benefit of the company. Adjustments similar to the ones reflected above have been recorded in earlier periods, and similar types of adjustments can reasonably be expected to be recorded in future periods. Using only the non-GAAP earnings measures to analyze earnings would have material limitations because its calculation is based on the subjective determinations of management regarding the nature and classification of events and circumstances that investors may find material. Management compensates for these limitations by utilizing both GAAP and non-GAAP earnings measures reflected above to understand and analyze the results of the business.
* Including noncontrolling interests.
$ Millions, Unaudited