Embed Size (px)
Citation preview
Mott MacDonald
Our Ref. PA9270/JK/kos
Office of Climate, Licensing 8. Resource Use Environmental Protection Agency Headquarters PO Box 3000 Johnstown Castle Estate Co. Wexford
AGENCY
I u7JuL 20'' I Attention: Administration - Environmental Licensing Programme '-4 201 1
- Re: Waste Water Discharae Licence Rea. No. D0022-01 - Waterford Citv Aqqlomeration
Dear Sirs,
We refer to the letter dated 12 May 2011 from Ms. Marian Doyle, Inspector (Office of Climate, Licensing & Resource Use) in respect of an application for a technical amendment to the Waste Water Discharge Licence relating to the Waterford City agglomeration and submit the attached information on behalf of Waterford City Council.
When the Waterford Main Drainage Scheme was being designed a dispersion model was used to determine the optimum location for the discharge of treated effluent from the proposed Waterford City WWTP, and to determine the impact of such a discharge on water quality in the Suir Estuary.
Nitrogen was one of the parameters modelled, and was treated as a non-decaying (or persistent) parameter. Attached is an extract from the report on the modelling exercise, including predicted impacts on nitrogen concentrations at various locations along the Suir Estuary under dry weather river flow and neap tides. The results presented are therefore considered conservative.
Based on water quality data for the Suir Estuary since 2004 (EPA monitoring programmes) the predicted increases in nitrogen concentration due to the discharge from the Waterford City WWTP should not compromise the ability of the Suir Estuary in achieving its surface water objectives as required by S.I. No. 272 of 2009.
At the nitrogen load in the treated effluent that was utilised in the dispersion model, an Emission Limit Value of 35 mgll for total nitrogen is considered appropriate. We therefore request the inclusion of the following alternative Emission Limit Values in Schedule A of Licence Reg. No. D0022-01.
Emission Limit Value (mgll) Parameter
1 Total Nitrogen (as N) I 35 I I Total Oxidised Nitrogen (as N) I 35 I I Ammonia (as N) I 25 I
Mott MacDonald Ireland 5 Eastgate Avenue, Eastgate, Little Island, CO Cork, Ireland T +353 (0)21 4809 800 F +353 (0)21 4809 801 w www.mottmac.ie Directors T J OConnor BE CEng MlEl (Managing), S Brewitt BA BA1 CEng FIE1 MIStructE, K Howells BSc MBA CEng MICE MCIWEM (British)
F McGivem BSc DipEnvEng CEng MIEI, J T Murphy BE HDipMM CEng FIE1 CMCILT
C O'Donovan BE MBA CEng MIET, G Reilly BEng CEng MlEl MICE, K J Stovell BSc (Eng) ACGl (British)
lnnealtoiri Comhairleach (Consulting Engineers)
Company Secretary: E McCarthy FCCA
Registered in Ireland no. 53280 Registered office. South Block. Rockfield. Dundrm. Dublin 16, Ireland
Mott MacDonald Ireland Limited is a member of the Mott MacDonald Group
pa9270001 79n.doc 1
For
insp
ectio
n pur
pose
s only
.
Conse
nt of
copy
right
owne
r req
uired
for a
ny ot
her u
se.
EPA Export 17-06-2012:04:49:53

Mott MacDonald
We enclose an original and one copy of our submission setting out the basis for this request and for the proposed alternative Emission Limit Values. If you require any further information or clarification please do not hesitate to contact us.
Yours faithfully, For and on behalf of Mott MacDonald Ireland
J anne Kellleher
Cc Mr. Ray Mannix, S.E., Waterford City Council SB
E ncl .
pa9270001 79n.doc 2
For
insp
ectio
n pur
pose
s only
.
Conse
nt of
copy
right
owne
r req
uired
for a
ny ot
her u
se.
EPA Export 17-06-2012:04:49:53
a
d
s
pa9270001 78n.doc
WATERFORD CITY WASTE WATER TREATMENT PLANT
REQUEST FOR TECHNICAL AMENDMENT
TO
WASTE WATER DISCHARGE LICENCE
REGISTER NUMBER D0022-01
Mott MacDonald Ireland Consulting Engineers 5 Eastgate Avenue E as tgate Little Island Co. Cork.
Job Nr. : PA9270 July 2011
Doc. Nr. : PA9270-N-R-02-A i
For
insp
ectio
n pur
pose
s only
.
Conse
nt of
copy
right
owne
r req
uired
for a
ny ot
her u
se.
EPA Export 17-06-2012:04:49:53
pa927000 178n.doc
Rev. Description of Changes Nr.
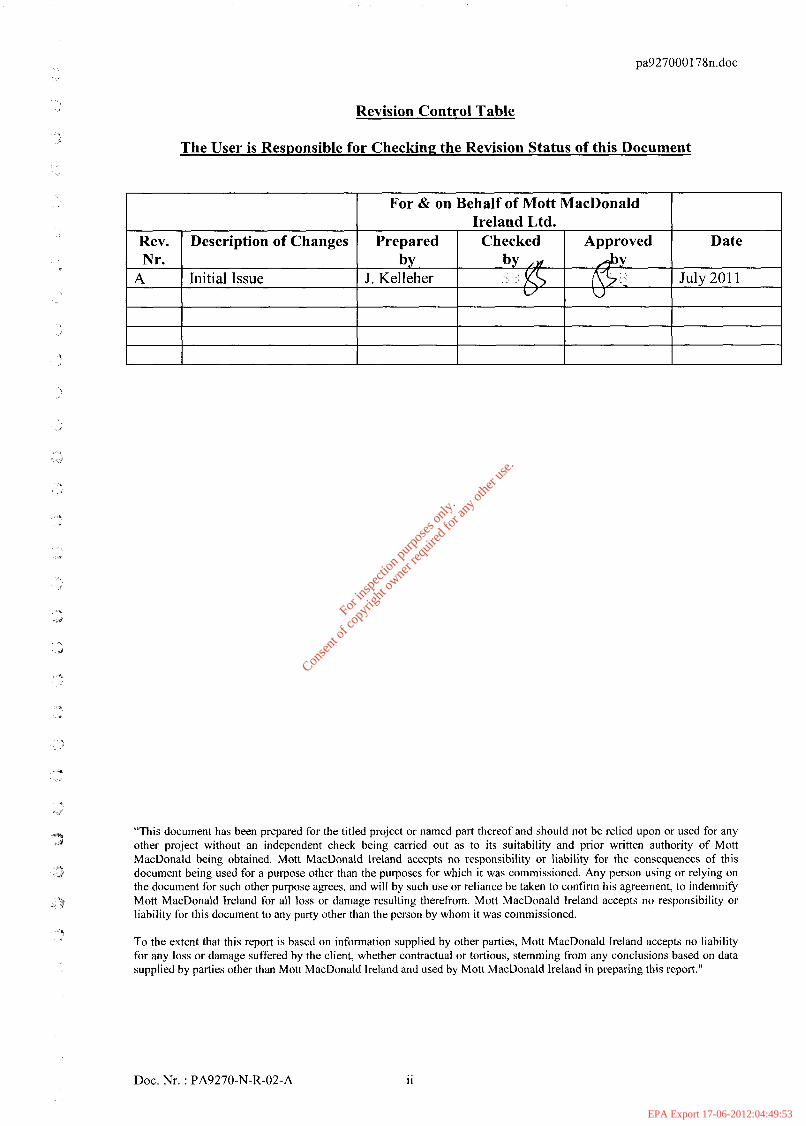
A Initial Issue
Revision Control Table
Ireland Ltd. Prepared Checked Approved Date
J. Kelleher - July 201 1 by by ,v Aby
W U
The User is Responsible for Checking the Revision Status of this Document
For & on Behalf of Mott MacDonald
“This document has been prepared for the titled project or named part thereof and should not be relied upon or used for any other project without an independent check being carried out as to its suitability and prior written authority of Mott MacDonald being obtained. Mott MacDonald Ireland accepts no responsibility or liability for the consequences of this document being used for a purpose other than the purposes for which it was commissioned. Any person using or relying on the document for such other purpose agrees, and will by such use or reliance be taken to confirm his agreement, to indemnify Mott MacDonald Ireland for all loss or damage resulting therefrom. Mott MacDonald Ireland accepts no responsibility or liability for this document to any party other than the person by whom it was commissioned.
To the extent that this report is based on information supplied by other parties, Mott MacDonald Ireland accepts no liability for any loss or damage suffered by the client, whether contractual or tortious, stemming from any conclusions based on data supplied by parties other than Mott MacDonald Ireland and used by Mott MacDonald Ireland in preparing this report.“
Doc. Nr. : PA9270-N-R-02-A 11
For
insp
ectio
n pur
pose
s only
.
Conse
nt of
copy
right
owne
r req
uired
for a
ny ot
her u
se.
EPA Export 17-06-2012:04:49:53
pa927000178n.doc
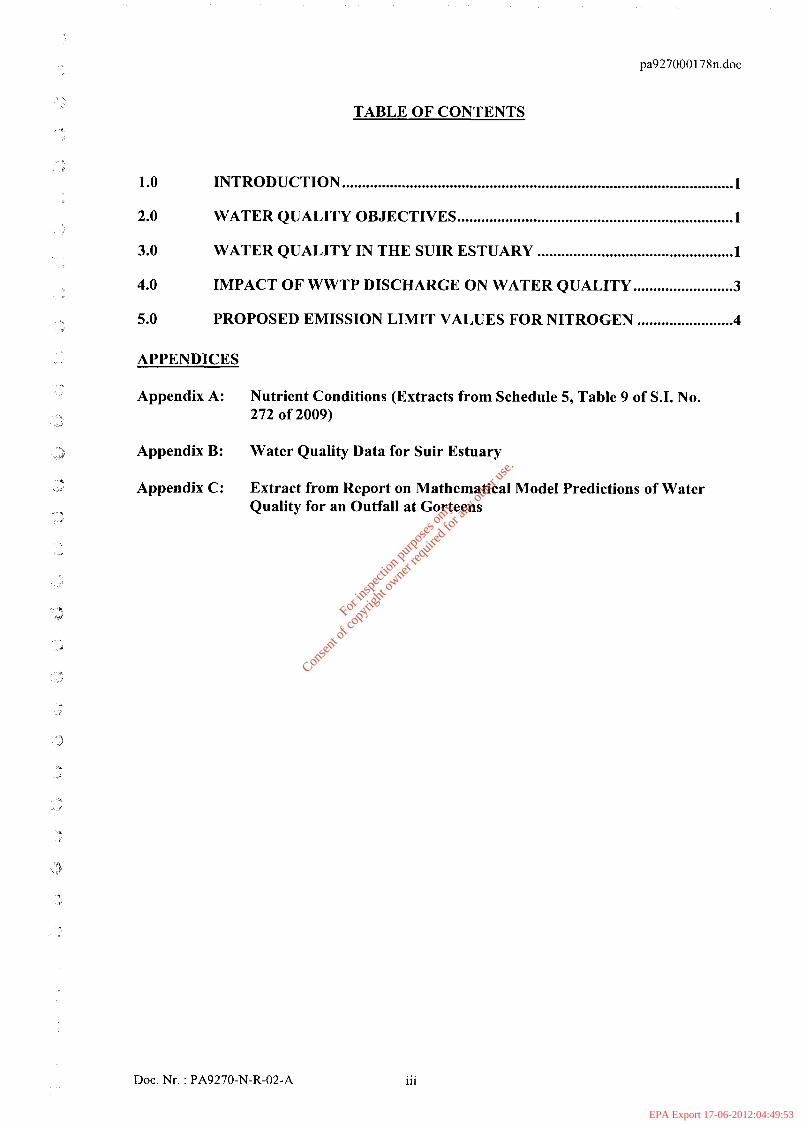
TABLE OF CONTENTS
1 .o INTRODUCTION .................................................................................................. 1
2.0
3.0
4.0
5.0
WATER QUALITY OBJECTIVES ..................................................................... 1
WATER QUALITY IN THE SUIR ESTUARY ................................................. 1
IMPACT OF WWTP DISCHARGE ON WATER QUALITY ......................... 3
PROPOSED EMISSION LIMIT VALUES FOR NITROGEN ........................ 4
APPENDICES
Appendix A: Nutrient Conditions (Extracts from Schedule 5, Table 9 of S.I. No. 272 of 2009)
Appendix B: Water Quality Data for Suir Estuary
Appendix C: Extract from Report on Mathematical Model Predictions of Water Quality for an Outfall at Gorteens
Doc. Nr. : PA9270-N-R-02-A ... 111
For
insp
ectio
n pur
pose
s only
.
Conse
nt of
copy
right
owne
r req
uired
for a
ny ot
her u
se.
EPA Export 17-06-2012:04:49:53
1 .o
2.0
3.0
pa927000 178n.doc
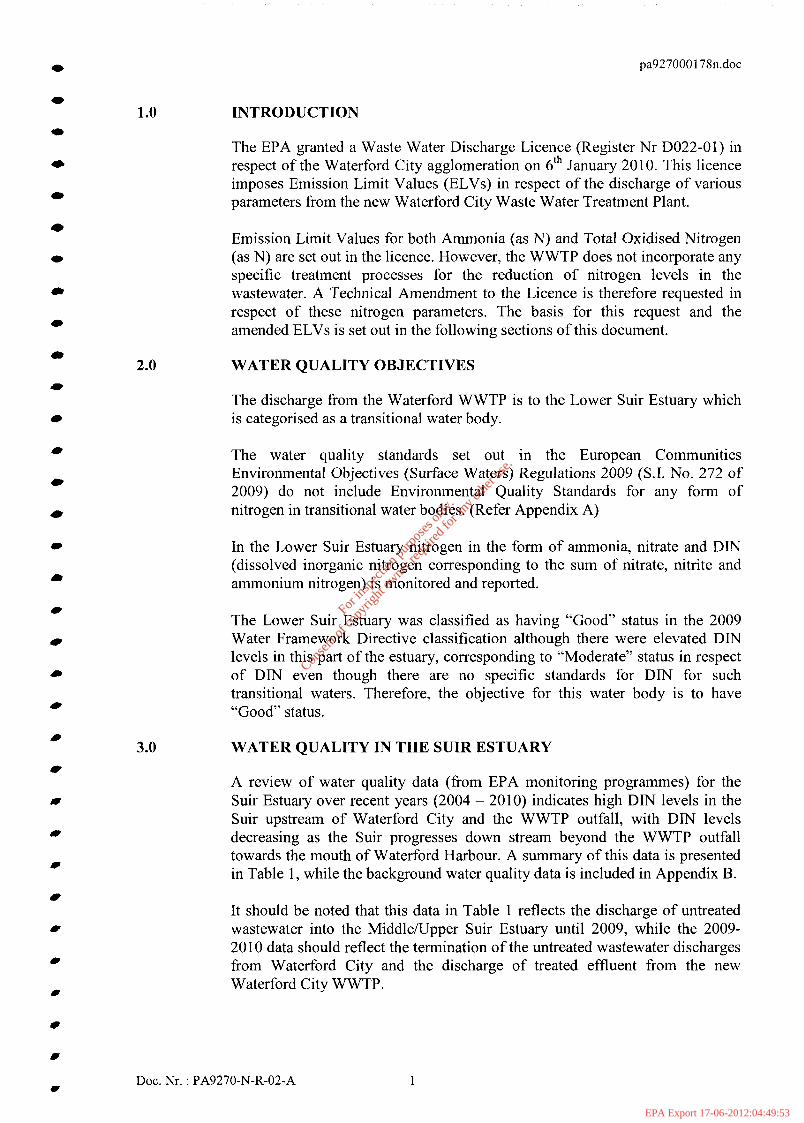
INTRODUCTION
The EPA granted a Waste Water Discharge Licence (Register Nr D022-01) in respect of the Waterford City agglomeration on 6th January 2010. This licence imposes Emission Limit Values (ELVs) in respect of the discharge of various parameters from the new Waterford City Waste Water Treatment Plant.
Emission Limit Values for both Ammonia (as N) and Total Oxidised Nitrogen (as N) are set out in the licence. However, the WWTP does not incorporate any specific treatment processes for the reduction of nitrogen levels in the wastewater. A Technical Amendment to the Licence is therefore requested in respect of these nitrogen parameters. The basis for this request and the amended ELVs is set out in the following sections of this document.
WATER QUALITY OBJECTIVES
The discharge from the Waterford WWTP is to the Lower Suir Estuary which is categorised as a transitional water body.
The water quality standards set out in the European Communities Environmental Objectives (Surface Waters) Regulations 2009 (S.I. No. 272 of 2009) do not include Environmental Quality Standards for any form of nitrogen in transitional water bodies. (Refer Appendix A)
In the Lower Suir Estuary nitrogen in the form of ammonia, nitrate and DIN (dissolved inorganic nitrogen corresponding to the sum of nitrate, nitrite and ammonium nitrogen) is monitored and reported.
The Lower Suir Estuary was classified as having “Good” status in the 2009 Water Framework Directive classification although there were elevated DIN levels in this part of the estuary, corresponding to “Moderate” status in respect of DIN even though there are no specific standards for DIN for such transitional waters. Therefore, the objective for this water body is to have “Good” status.
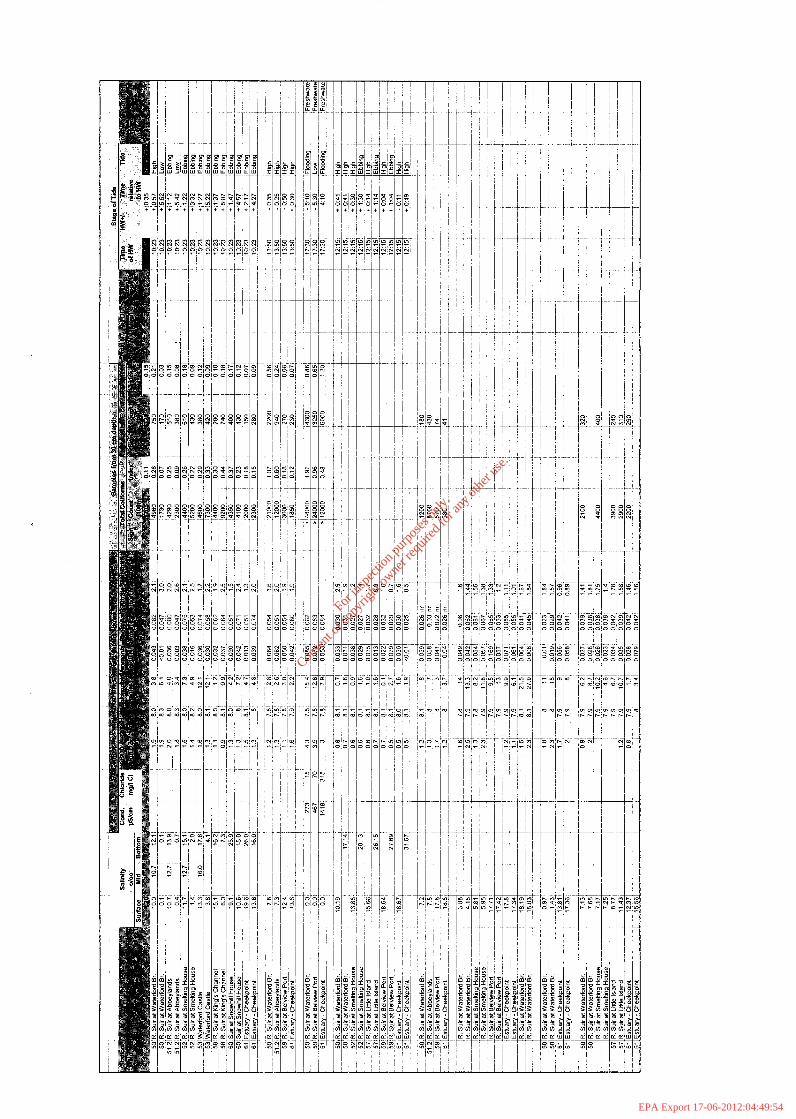
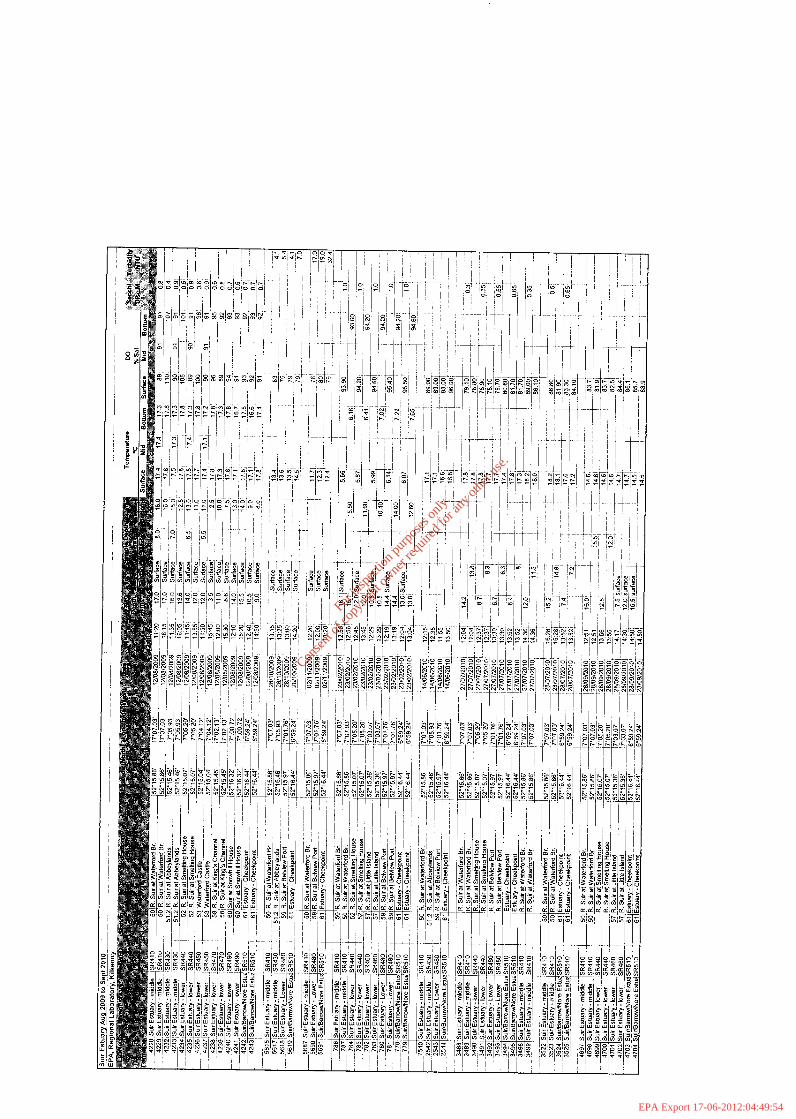
WATER QUALITY IN THE SUIR ESTUARY
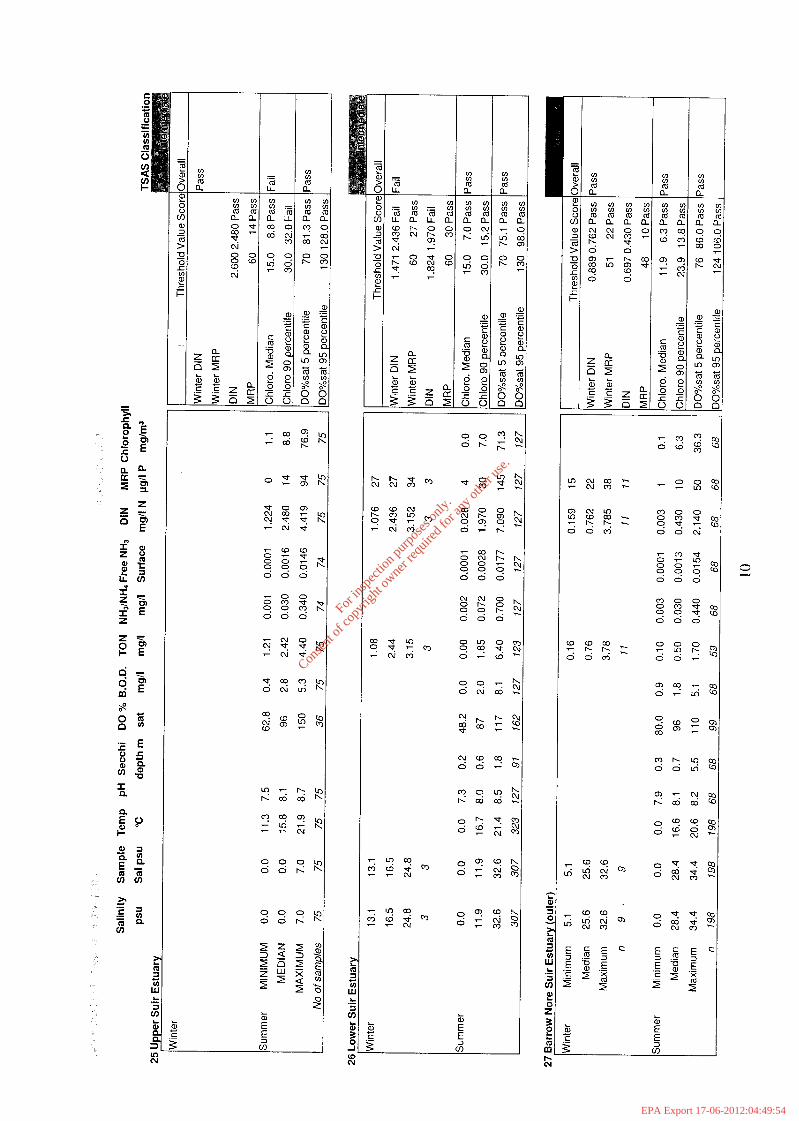
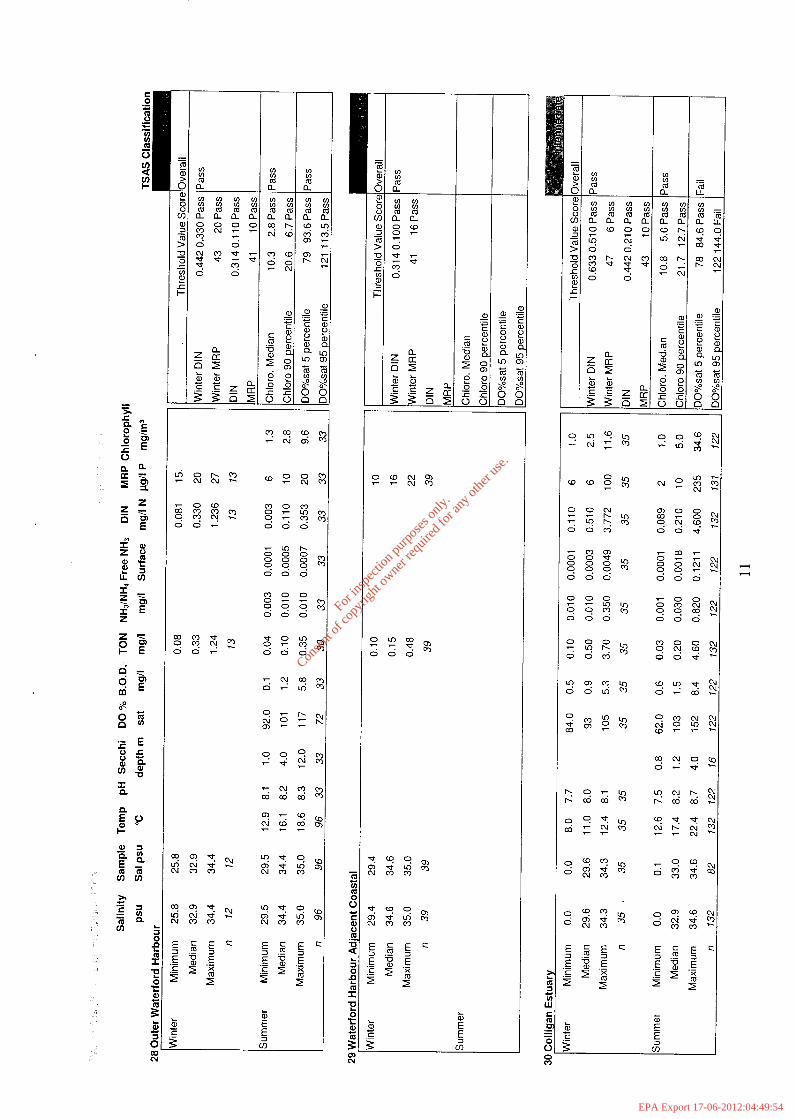
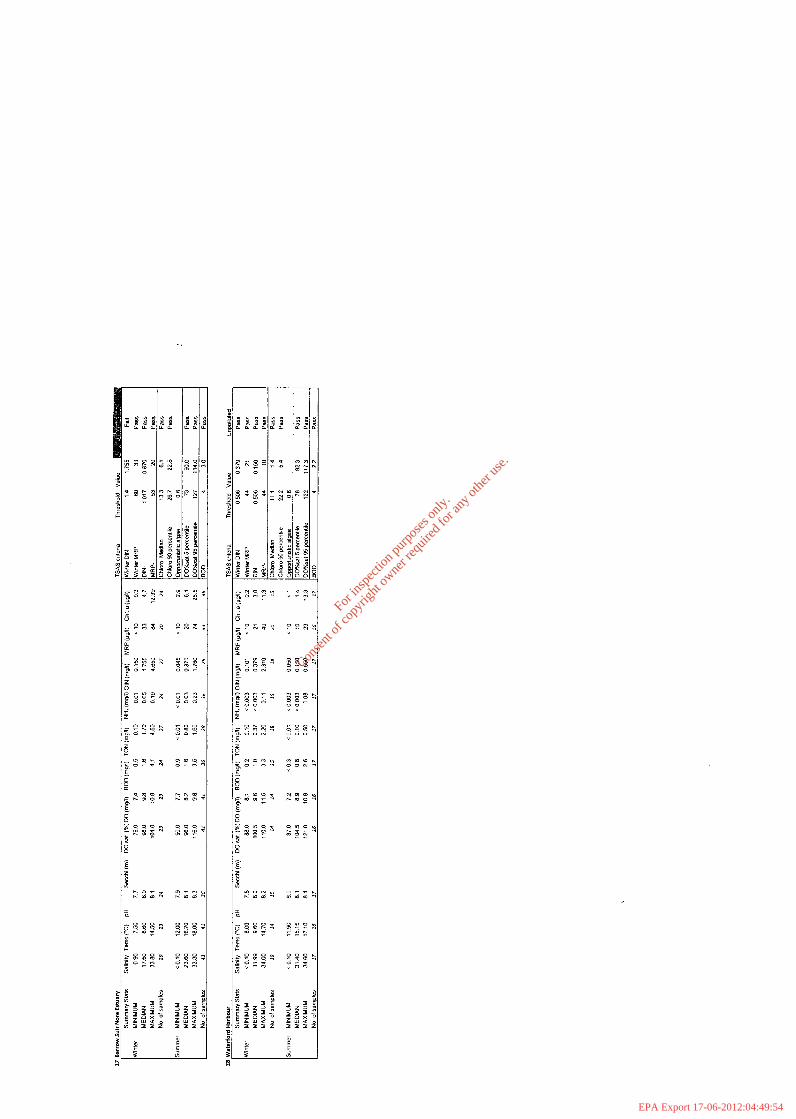
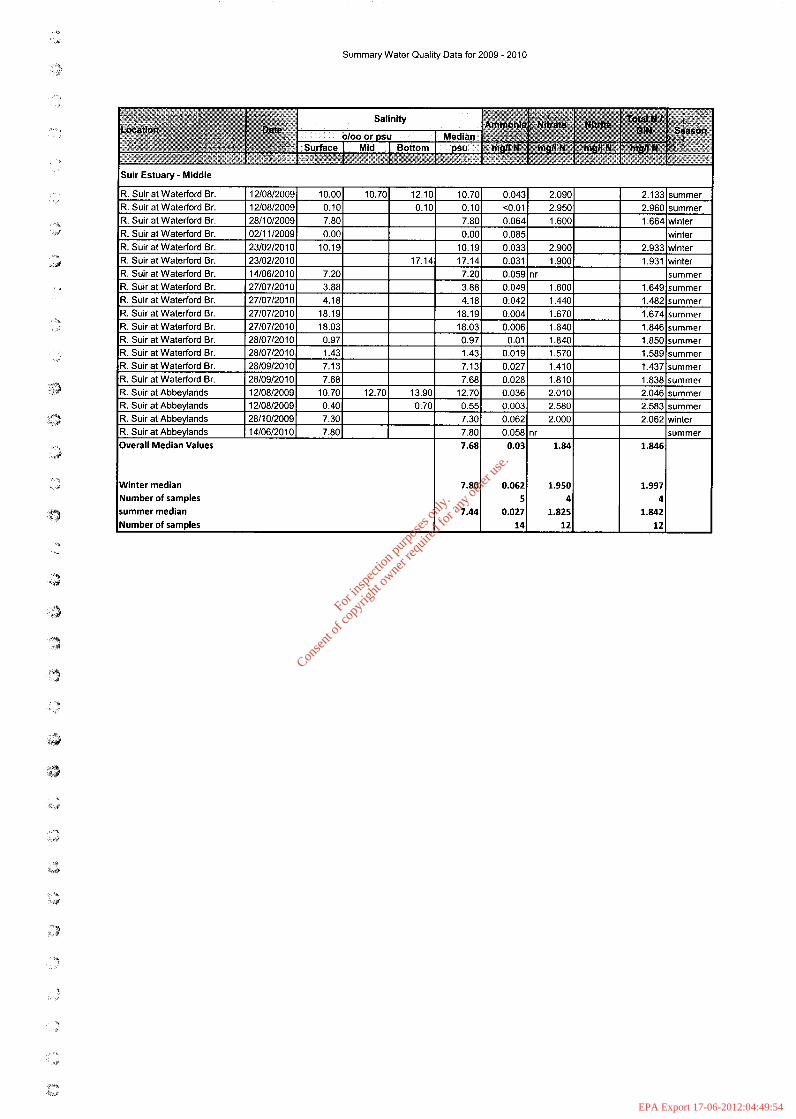
A review of water quality data (from EPA monitoring programmes) for the Suir Estuary over recent years (2004 - 2010) indicates high DIN levels in the Suir upstream of Waterford City and the WWTP outfall, with DIN levels decreasing as the Suir progresses down stream beyond the WWTP outfall towards the mouth of Waterford Harbour. A summary of this data is presented in Table 1, while the background water quality data is included in Appendix B.
It should be noted that this data in Table 1 reflects the discharge of untreated wastewater into the MiddlekJpper Suir Estuary until 2009, while the 2009- 20 10 data should reflect the termination of the untreated wastewater discharges from Waterford City and the discharge of treated effluent from the new Waterford City WWTP.
Doc. Nr. : PA9270-N-R-02-A 1
For
insp
ectio
n pur
pose
s only
.
Conse
nt of
copy
right
owne
r req
uired
for a
ny ot
her u
se.
EPA Export 17-06-2012:04:49:53
pa927000 178n.doc
5.0
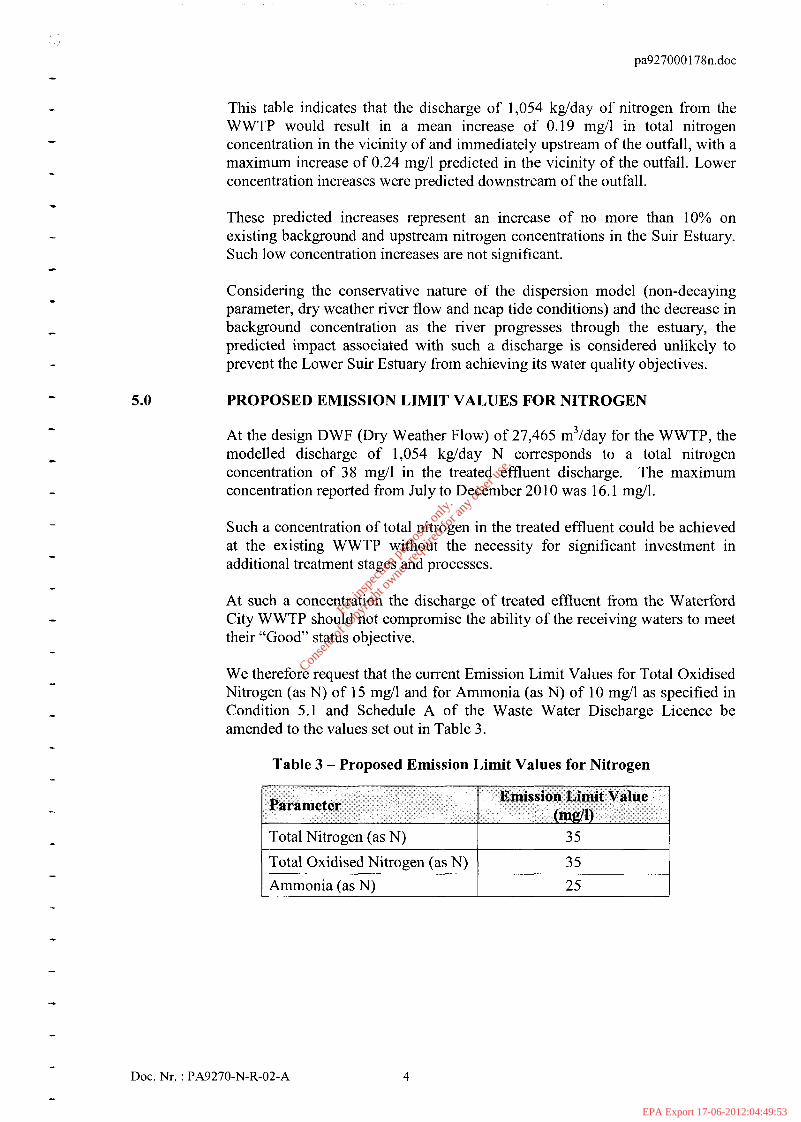
This table indicates that the discharge of 1,054 kg/day of nitrogen from the WWTP would result in a mean increase of 0.19 mg/l in total nitrogen concentration in the vicinity of and immediately upstream of the outfall, with a maxinium increase of 0.24 mg/l predicted in the vicinity of the outfall. Lower concentration increases were predicted downstream of the outfall.
These predicted increases represent an increase of no more than 10% on existing background and upstream nitrogen concentrations in the Suir Estuary. Such low concentration increases are not significant.
Considering the conservative nature of the dispersion model (non-decaying parameter, dry weather river flow and neap tide conditions) and the decrease in background concentration as the river progresses through the estuary, the predicted impact associated with such a discharge is considered unlikely to prevent the Lower Suir Estuary from achieving its water quality objectives.
PROPOSED EMISSION LIMIT VALUES FOR NITROGEN
At the design DWF (Dry Weather Flow) of 27,465 m3/day for the WWTP, the modelled discharge of 1,054 kg/day N corresponds to a total nitrogen concentration of 38 mg/l in the treated effluent discharge. The maximum concentration reported fi-om July to December 201 0 was 16.1 mg/l.
Such a concentration of total nitrogen in the treated effluent could be achieved at the existing WWTP without the necessity for significant investment in additional treatment stages and processes.
At such a concentration the discharge of treated effluent from the Waterford City WWTP should not compromise the ability of the receiving waters to meet their “Good” status objective.
We therefore request that the current Emission Limit Values for Total Oxidised Nitrogen (as N) of 15 mg/l and for Ammonia (as N) of 10 mg/l as specified in Condition 5.1 and Schedule A of the Waste Water Discharge Licence be amended to the values set out in Table 3.
Table 3 - Proposed Emission Limit Values for Nitrogen
Emission Limit Value (mg/l) Parameter
I Total Nitrogen (as N) I 35 I 1 Total Oxidised Nitrogen (as N) 1 35 I 1 Ammonia (as N) I 25 I
Doc. Nr. : PA9270-N-R-02-A 4
For
insp
ectio
n pur
pose
s only
.
Conse
nt of
copy
right
owne
r req
uired
for a
ny ot
her u
se.
EPA Export 17-06-2012:04:49:53
Y
40 [272J
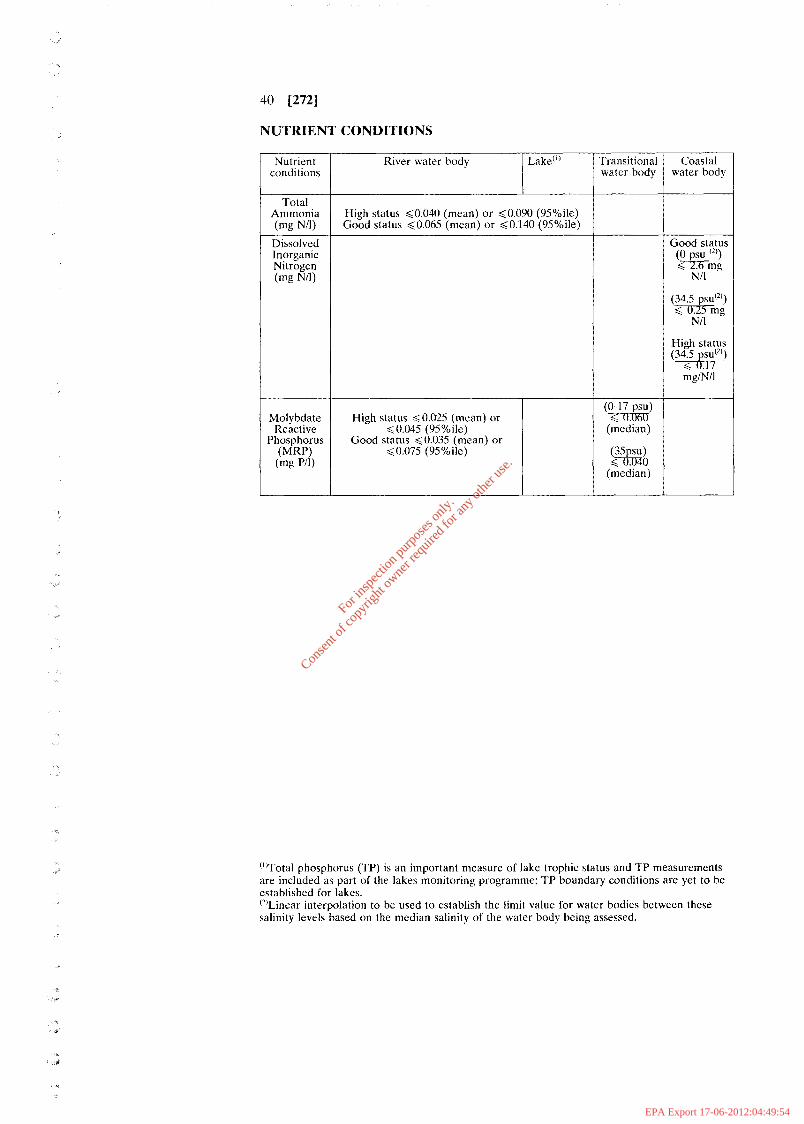
NUTRIENT CONDITIONS
Nutrient conditions
Total Ammonia
Dissolved Inorganic Nitrogen (mg Nil)
(ms Nil)
Molybdate Rcactive
Phosphorus (MRP) (mg P/1)
River water body Lake'')
High status g0.040 (mean) or <0.090 (9S%ile) Good status gO.065 (mean) or G'0.140 (95%ile)
High status G0.025 (mean) or ~ 0 . 0 4 5 (95%iIe)
Good status GO.035 (mean) or 6 0.075 (95 %ile)
Iransitional water body
(0-17 PSU) z.-uxim (median)
(35PSU) GT-KtRO
(median)
Coastal water body
Good status
< T m g NI1
(0 psu (2 ' )
"'Total phosphorus (TP) is an important measure of lake trophic status and TP measurements are included as part of the lakes monitoring programme: TP boundary conditions are yet to be established for lakes. "'Linear interpolation to be used to establish the limit value for water bodies between these salinity levels based on the median salinity of the water body being assessed.
R
For
insp
ectio
n pur
pose
s only
.
Conse
nt of
copy
right
owne
r req
uired
for a
ny ot
her u
se.
EPA Export 17-06-2012:04:49:54
pa9270001 78n.doc
APPENDIX B . -*
WATER QUALITY DATA FOR SUIR ESTUARY
Doc. Nr. : PA9270-N-R-02-A -*
For
insp
ectio
n pur
pose
s only
.
Conse
nt of
copy
right
owne
r req
uired
for a
ny ot
her u
se.
EPA Export 17-06-2012:04:49:54
r ? = ! o ! - m - X
s s 0 2
- - C U
o o r .
S S S E o o r .
e a m In W
U)
c.
L .- a
1 0 -1 (D N
- L I 0
0 a - 5 a w In W
U)
L .- a
E W c o k k Z
o o m
For
insp
ectio
n pur
pose
s only
.
Conse
nt of
copy
right
owne
r req
uired
for a
ny ot
her u
se.
EPA Export 17-06-2012:04:49:54
For
insp
ectio
n pur
pose
s only
.
Conse
nt of
copy
right
owne
r req
uired
for a
ny ot
her u
se.
EPA Export 17-06-2012:04:49:54
8 8 5 1 ; N ' O Z
For
insp
ectio
n pur
pose
s only
.
Conse
nt of
copy
right
owne
r req
uired
for a
ny ot
her u
se.
EPA Export 17-06-2012:04:49:54
For
insp
ectio
n pur
pose
s only
.
Conse
nt of
copy
right
owne
r req
uired
for a
ny ot
her u
se.
EPA Export 17-06-2012:04:49:54
ii
Winter median Number of samples summer median Number of samples
3
7.80 0.062 1.950 1.997 5 4 4
7.44 0.027 1.825 1.842 14 12 12
Summary Water Quality Data for 2009 - 2010
ISuir Estuary - Middle I
P
P
For
insp
ectio
n pur
pose
s only
.
Conse
nt of
copy
right
owne
r req
uired
for a
ny ot
her u
se.
EPA Export 17-06-2012:04:49:54
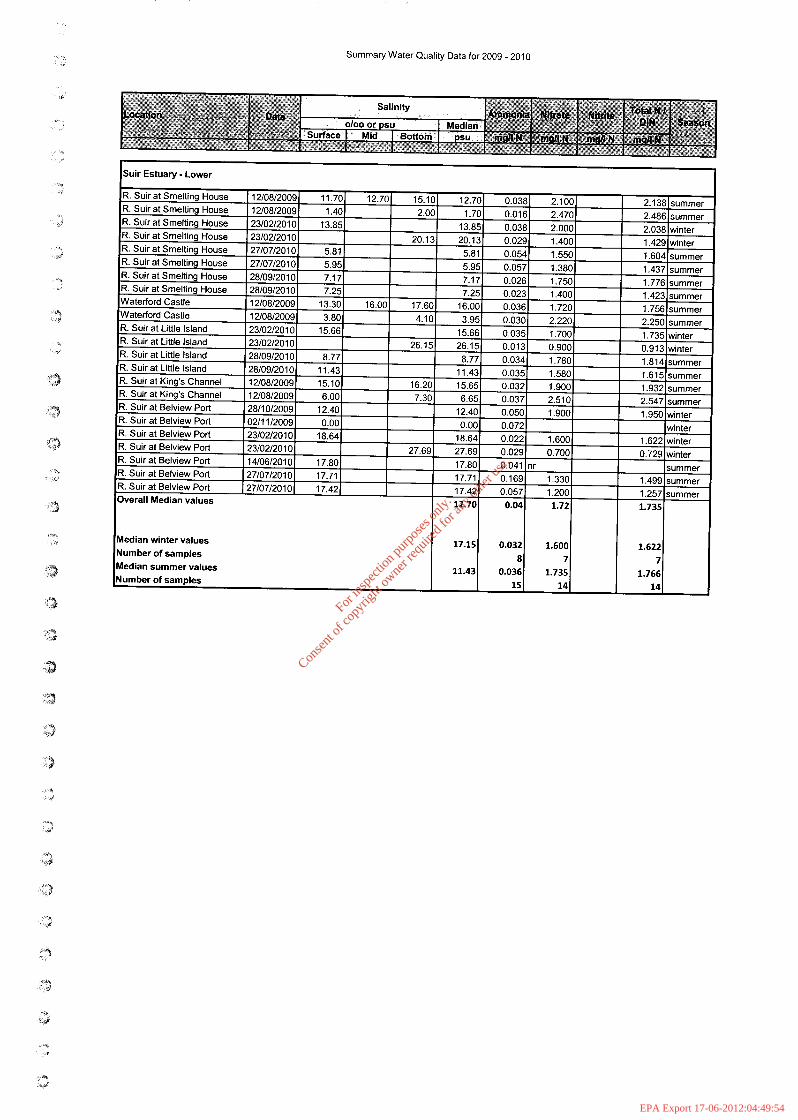
Summary Water Quality Data for 2009 - 2010
Suir Estuary - Lower
For
insp
ectio
n pur
pose
s only
.
Conse
nt of
copy
right
owne
r req
uired
for a
ny ot
her u
se.
EPA Export 17-06-2012:04:49:54
For
insp
ectio
n pur
pose
s only
.
Conse
nt of
copy
right
owne
r req
uired
for a
ny ot
her u
se.
EPA Export 17-06-2012:04:49:54
For
insp
ectio
n pur
pose
s only
.
Conse
nt of
copy
right
owne
r req
uired
for a
ny ot
her u
se.
EPA Export 17-06-2012:04:49:54
3
pa927000178n.doc
APPENDIX C
EXTRACT FROM REPORT ON MATHEMATICAL MODEL PREDICTIONS OF WATER QUALITY FOR AN OUTFALL AT GORTEENS
*bug .9
Doc. Nr. : PA9270-N-R-02-A $
For
insp
ectio
n pur
pose
s only
.
Conse
nt of
copy
right
owne
r req
uired
for a
ny ot
her u
se.
EPA Export 17-06-2012:04:49:54
iy*
** d BACKGROUND r * J
""5 J
* -d
-* v
I
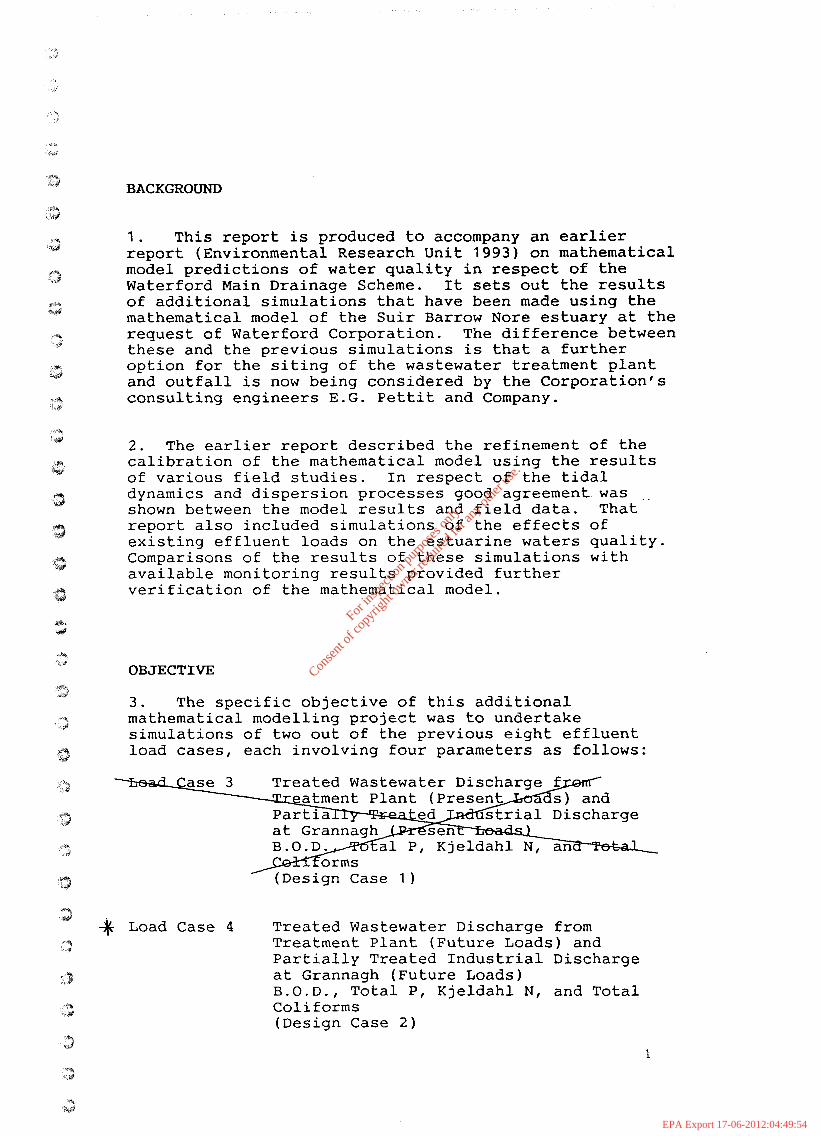
1. This report is produced to accompany an earlier report (Environmental Research Unit 1993) on mathematical model predictions of water quality in respect of the Waterford Main Drainage Scheme. It sets out the results of additional simulations that have been made using the mathematical model of the Suir Barrow Nore estuary at the request of Waterford Corporation. The difference between these and the previous simulations is that a further option for the siting of the wastewater treatment plant and outfall is now being considered by the Corporation's consulting engineers E . G . Pettit and Company.
2 . The earlier report described the refinement of the calibration of the mathematical model using the results of various field studies. In respect of the tidal dynamics and dispersion processes good agreement was ,.
shown between the model results and field data. That report also included simulations of the effects of existing effluent loads on the estuarine waters quality. Comparisons of the results of these simulations with available monitoring results provided further verification of the mathematical model.
OBJECTIVE
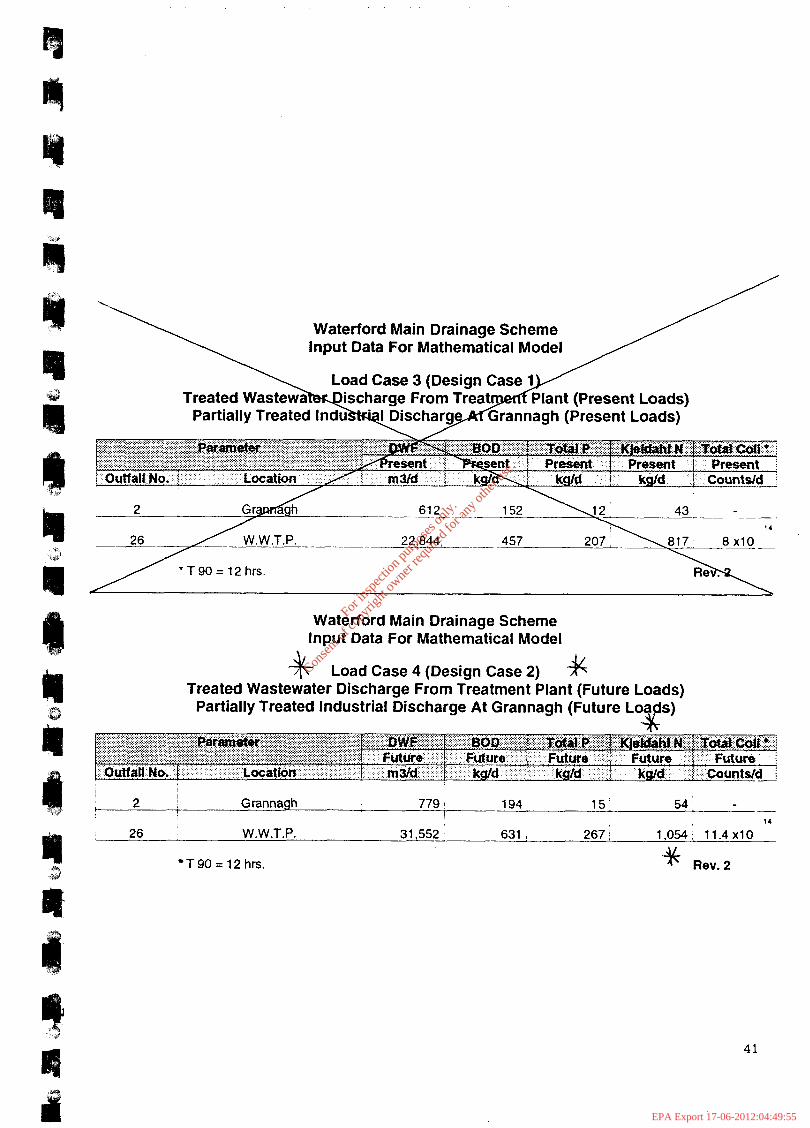
3 . The specific objective of this additional mathematical modelling project was to undertake simulations of two out of the previous eight effluent load cases, each involving four parameters as follows:
i# Load Case 4 Treated Wastewater Discharge from Treatment Plant (Future Loads) and Partially Treated Industrial Discharge at Grannagh (Future Loads) B.O.D., Total P, Kjeldahl N, and Total Coliforms (Design Case 2)
1
For
insp
ectio
n pur
pose
s only
.
Conse
nt of
copy
right
owne
r req
uired
for a
ny ot
her u
se.
EPA Export 17-06-2012:04:49:54
.il
7
r!
I
I ?% , ... L‘
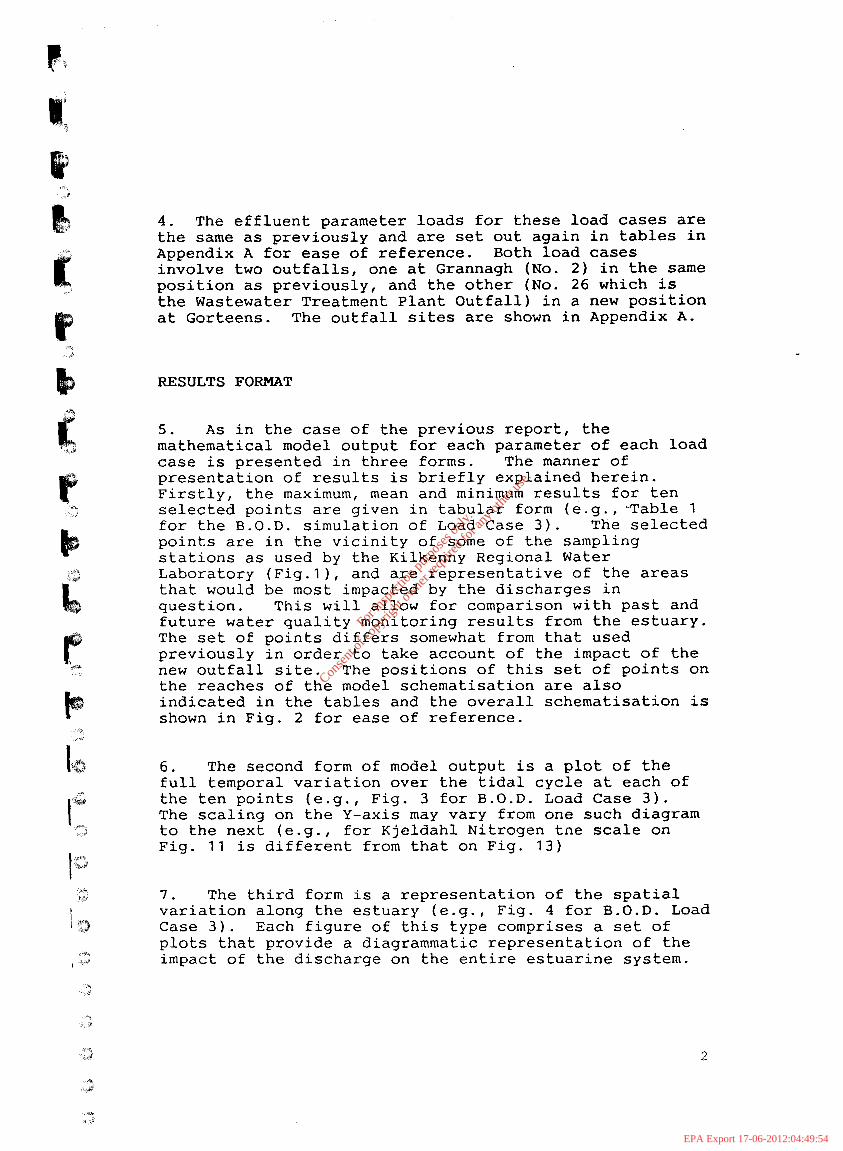
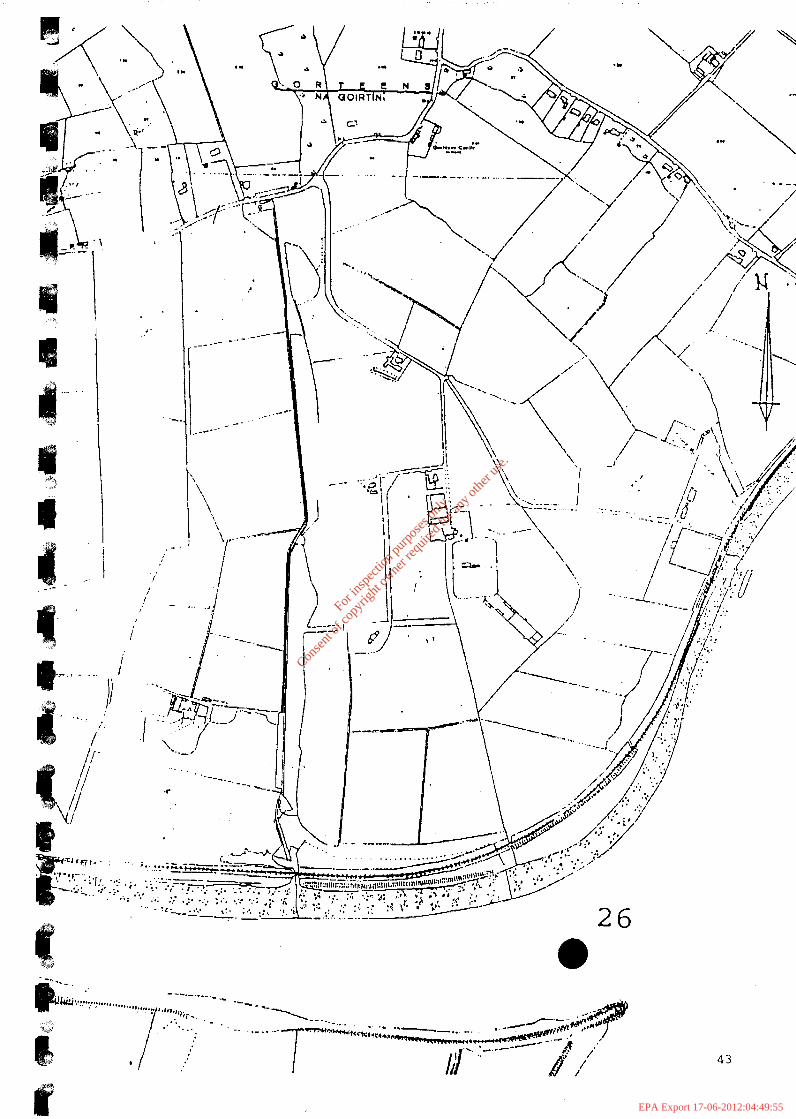
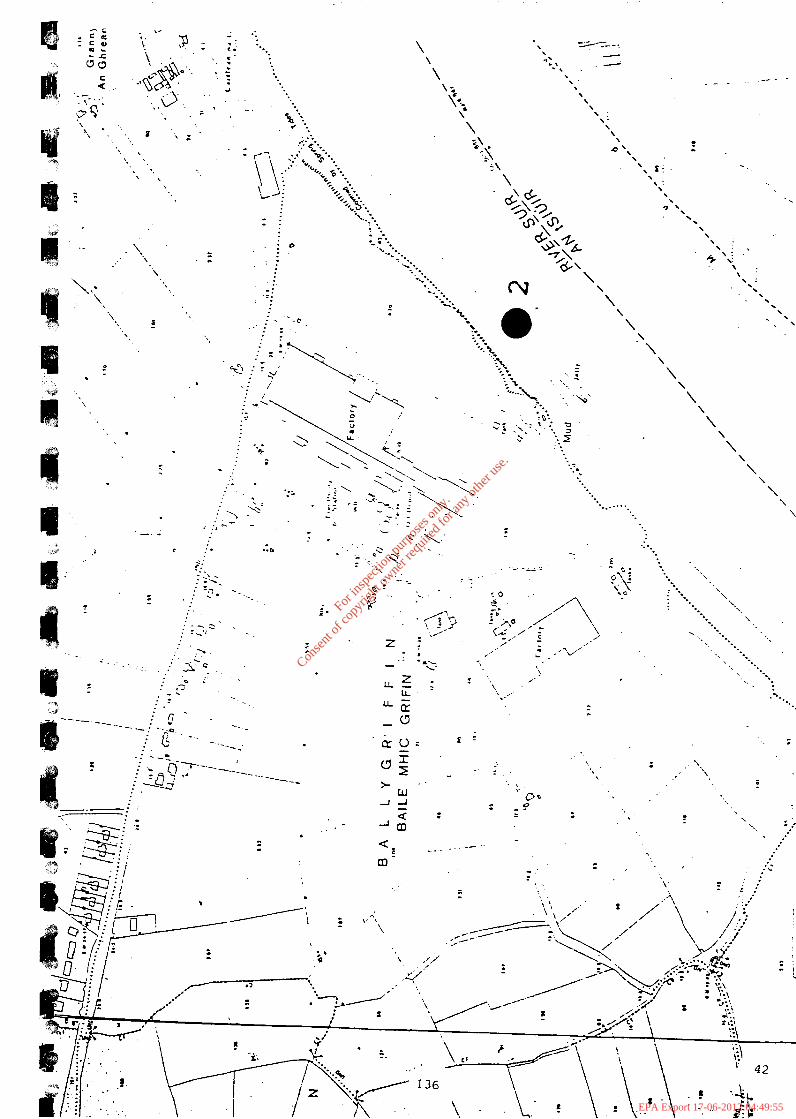
4 . The effluent parameter loads for these load cases are the same as previously and are set out again in tables in Appendix A for ease of reference. Both load cases involve two outfalls, one at Grannagh (No. 2 ) in the same position as previously, and the other (No. 26 which is the Wastewater Treatment Plant Outfall) in a new position at Gorteens. The outfall sites are shown in Appendix A.
RESULTS FORMAT
5 . A s in the case of the previous report, the mathematical model output for each parameter of each load case is presented in three forms. The manner of presentation of results is briefly explained herein. Firstly, the maximum, mean and minimum results for ten selected points are given in tabular form (e.g.;Table 1 for the B.O.D. simulation of Load Case 3). The selected points are in the vicinity of some of the sampling stations as used by the Kilkenny Regional Water Laboratory (Fig.11, and are representative of the areas that would be most impacted by the discharges in question. This will allow for comparison with past and future water quality monitoring results from the estuary. The set of points differs somewhat from that used previously in order to take account of the impact of the new outfall site. The positions of this set of points on the reaches of the model schematisation are also indicated in the tables and the overall schematisation is shown in Fig. 2 for ease of reference.
6. The second form of model output is a plot of the full temporal variation over the tidal cycle at each of the ten points (e.g., Fig. 3 for B.O.D. Load Case 3). The scaling on the Y-axis may vary from one such diagram to the next (e.g., for Kjeldahl Nitrogen tne scale on Fig. 1 1 is different from that on Fig. 13)
7. The third form is a representation of the spatial variation along the estuary (e.g., Fig. 4 for B.O.D. Load Case 3). Each figure of this type comprises a set of plots that provide a diagrammatic representation of the impact of the discharge on the entire estuarine system.
2
For
insp
ectio
n pur
pose
s only
.
Conse
nt of
copy
right
owne
r req
uired
for a
ny ot
her u
se.
EPA Export 17-06-2012:04:49:54
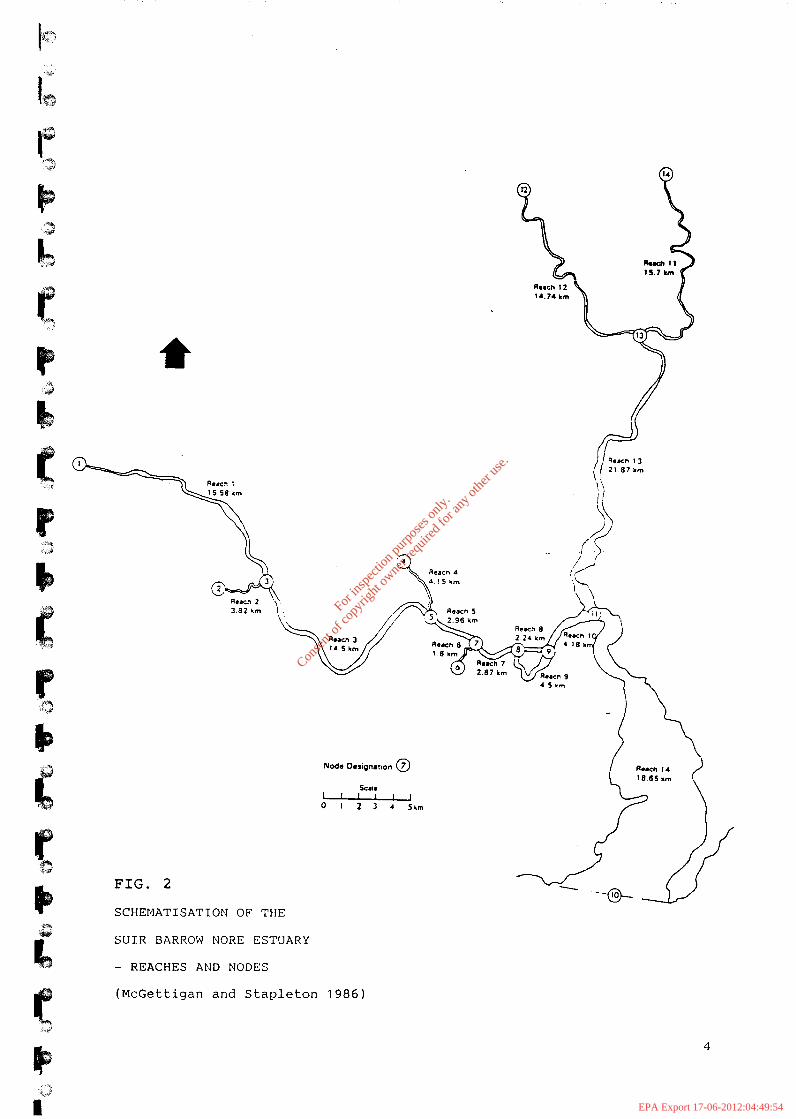
S C H E M A T I S A T I O N OF T H E
S U I R BARROW NORE E S T U A R Y
- REACHES AND N O D E S
( M c G e t t i g a n a n d S t a p l e t o n 1 9 8 6 )
4
For
insp
ectio
n pur
pose
s only
.
Conse
nt of
copy
right
owne
r req
uired
for a
ny ot
her u
se.
EPA Export 17-06-2012:04:49:54
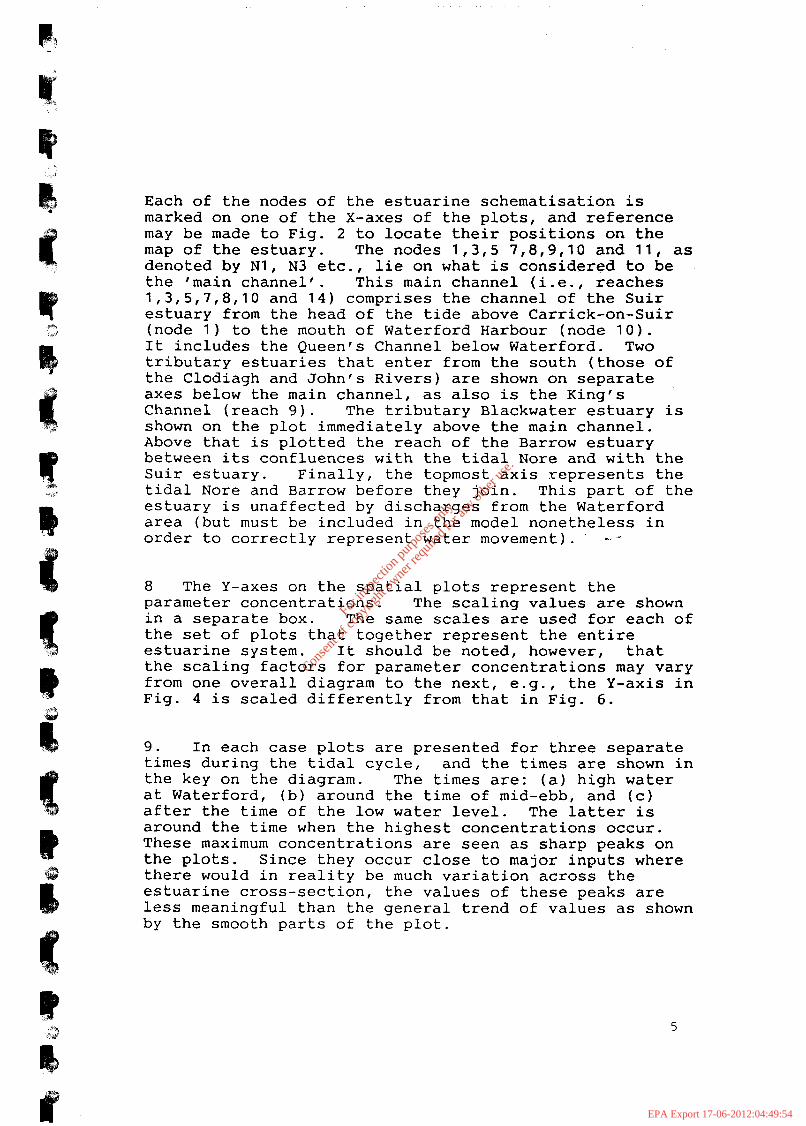
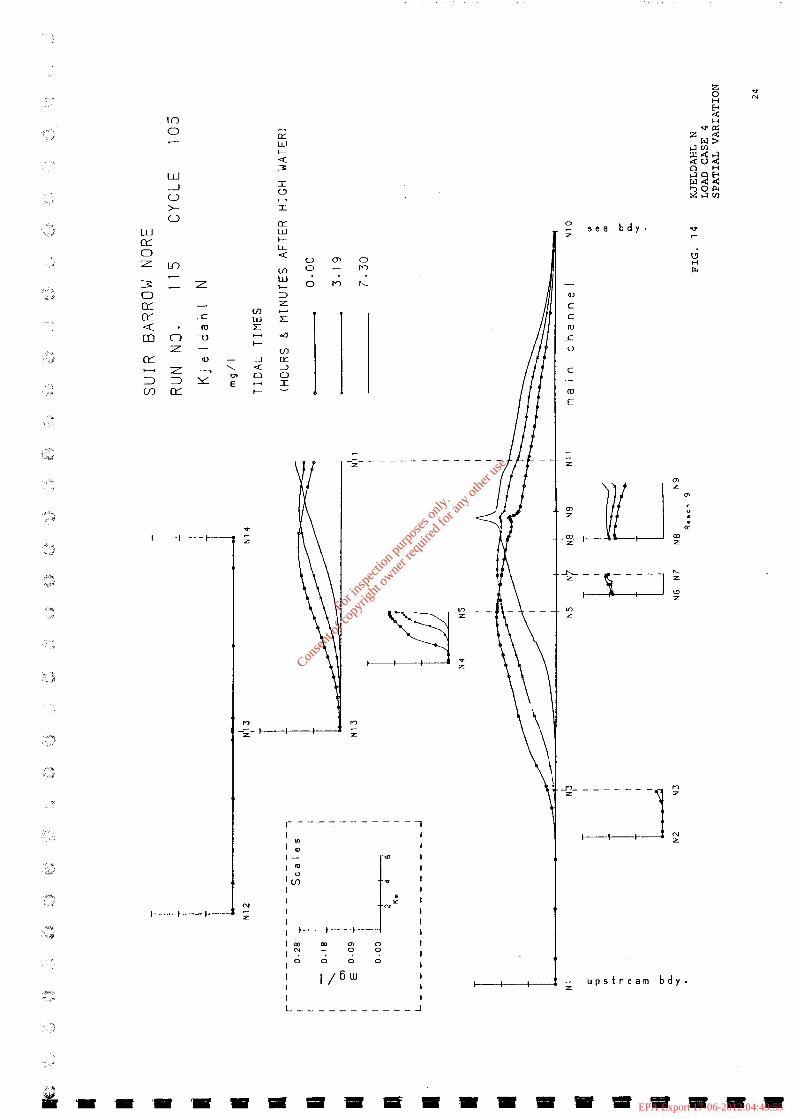
Each of the nodes of the estuarine schematisation is marked on one of the X-axes of the plots, and reference may be made to Fig. 2 to locate their positions on the map of the estuary. The nodes 1,3,5 7,8,9,10 and 1 1 , as denoted by N1, N3 etc., lie on what is considered to be the 'main channel'. This main channel (i.e., reaches 1 , 3 , 5 , 7 , 8 , 1 0 and 14) comprises the channel of the Suir estuary from the head of the tide above Carrick-on-Suir (node 1) to the mouth of Waterford Harbour (node 10). It includes the Queen's Channel below Waterford. Two tributary estuaries that enter from the south (those of the Clodiagh and John's Rivers) are shown on separate axes below the main channel, as also is the King's Channel (reach 9 ) . The tributary Blackwater estuary is shown on the plot immediately above the main channel. Above that is plotted the reach of the Barrow estuary between its confluences with the tidal Nore and with the Suir estuary. Finally, the topmost axis represents the tidal Nore and Barrow before they join. This part of the estuary is unaffected by discharges from the Waterford area (but must be included in the model nonetheless in order to correctly represent water movement). . & -
8 The Y-axes on the spatial plots represent the parameter concentrations. The scaling values are shown in a separate box. The same scales are used for each of the set of plots that together represent the entire estuarine system. It should be noted, however, that the scaling factors for parameter concentrations may vary from one overall diagram to the next, e.g., the Y-axis in Fig. 4 is scaled differently from that in Fig. 6.
9. In each case plots are presented for three separate times during the tidal cycle, and the times are shown in the key on the diagram. The times are: (a) high water at Waterford, (b) around the time of mid-ebb, and (c) after the time of the low water level. The latter is around the time when the highest concentrations occur. These maximum concentrations are seen as sharp peaks on the plots. Since they occur close to major inputs where there would in reality be much variation across the estuarine cross-section, the values of these peaks are less meaningful than the general trend of values as shown by the smooth parts of the plot.
5
For
insp
ectio
n pur
pose
s only
.
Conse
nt of
copy
right
owne
r req
uired
for a
ny ot
her u
se.
EPA Export 17-06-2012:04:49:54
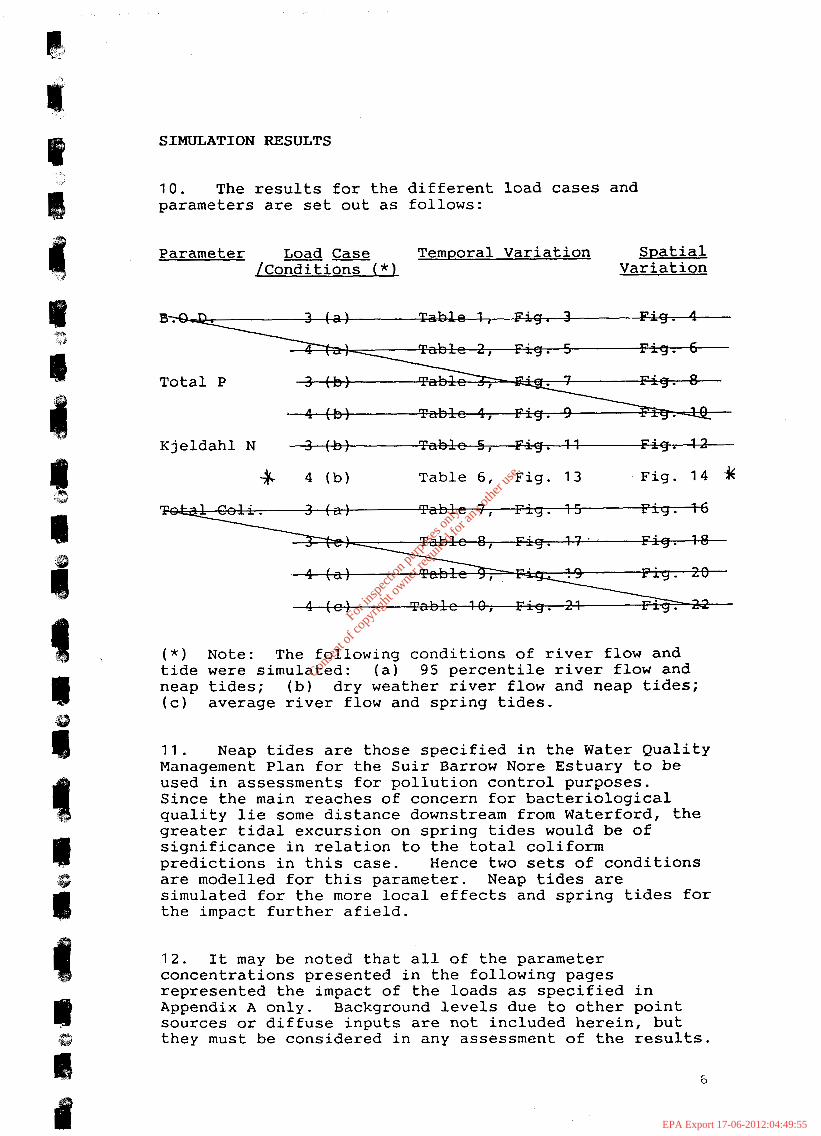
SIMULATION RESULTS
10. The results for the different load cases and parameters are set out as follows:
Parameter -- Load Case Temporal Variation Spatial lconditions ( * ) Variation
Total P
3 l L \ r n - k l - c n;" 1 1 F<* 1 3 Kjeldahl N J \ U ] J , L ' Y . I 1
$ 4 (b) Table 6, Fig. 13 Fig. 1 4 '%
( * ) Note: The following conditions of river flow and tide were simulated: (a) 95 percentile river flow and neap tides; (b) dry weather river flow and neap tides; (c) average river flow and spring tides.
1 1 . Neap tides are those specified in the Water Quality Management Plan for the Suir Barrow Nore Estuary to be used in assessments for pollution control purposes. Since the main reaches of concern for bacteriological quality lie some distance downstream from Waterford, the greater tidal excursion on spring tides would be of significance in relation to the total coliform predictions in this case. Hence two sets of conditions are modelled for this parameter. Neap tides are simulated for the more local effects and spring tides for the impact further afield.
1 2 . It may be noted that all of the parameter concentrations presented in the following pages represented the impact of the loads as specified in Appendix A only. Background levels due to other point sources or diffuse inputs are not included herein, but they must be considered in any assessment of the results.
6
For
insp
ectio
n pur
pose
s only
.
Conse
nt of
copy
right
owne
r req
uired
for a
ny ot
her u
se.
EPA Export 17-06-2012:04:49:55
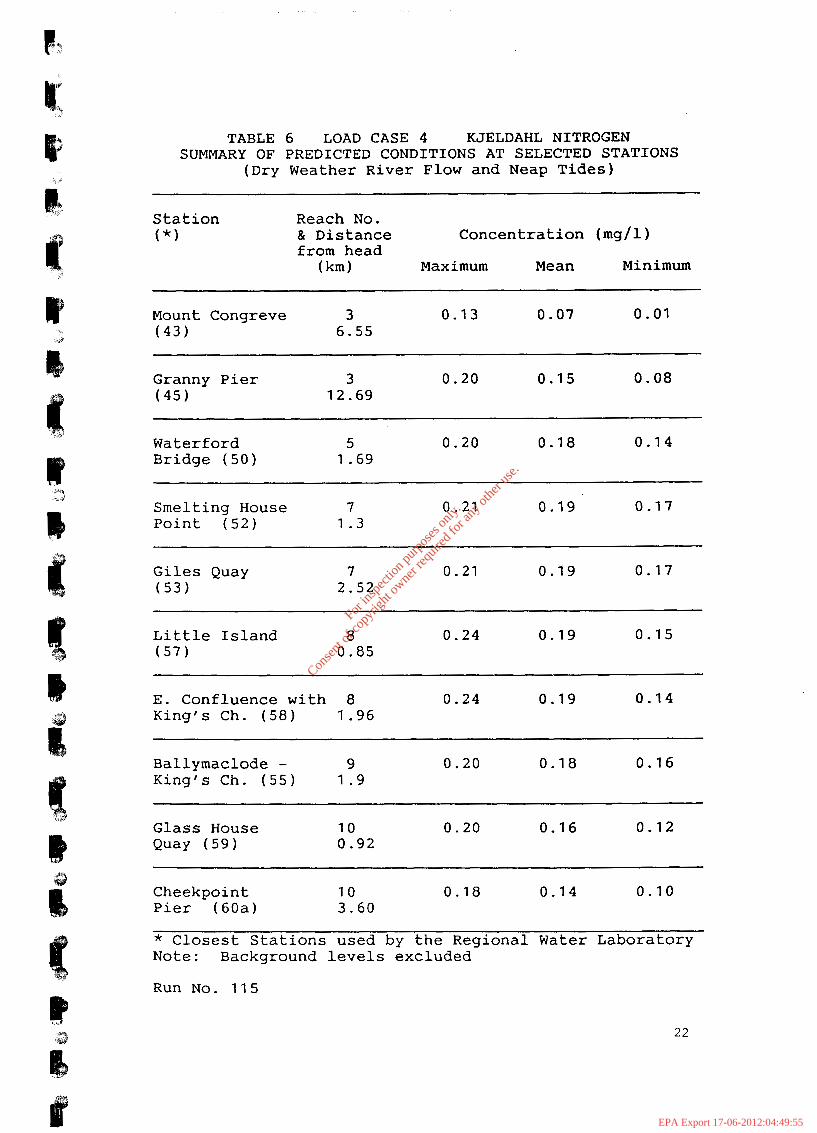
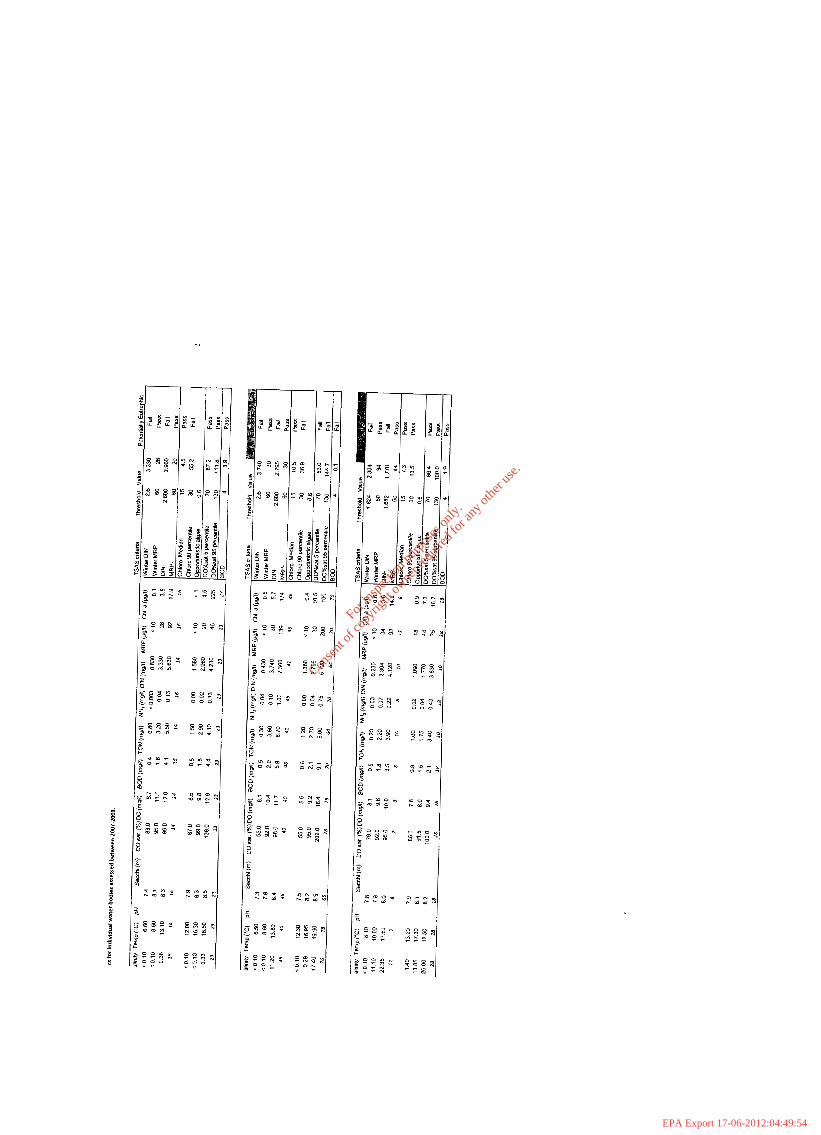
TABLE 6 LOAD CASE 4 KJELDAHL NITROGEN SUMMARY OF PREDICTED CONDITIONS AT SELECTED STATIONS
(Dry Weather River Flow and Neap Tides)
Station Reach No. ( * ) & Distance Concentration (rng/l)
from head (km) Maximum Mean Minimum
Mount Congreve 3 0.13 0.07 0.01 ( 4 3 ) 6.55
Granny Pier 3 0.20 0.15 0.08 ( 4 5 ) 12.69
Waterford 5 0.20 0.18 0 .14 Bridge ( 5 0 ) 1 .69
Smelting House 7 0 . 2 1 0 . 1 9 0 .17 Point ( 5 2 ) 1 . 3
Giles Quay 7 0.21 0.19 0.17 ( 5 3 ) 2 .52
Little Island 8 0 .24 0.19 0 .15 ( 5 7 ) 0 .85
E. Confluence with 8 0 .24 0.19 0 . 1 4 King's Ch. ( 5 8 ) 1 .96
Ballymaclode - 9 0.20 0.18 0.16 King's Ch. ( 5 5 ) 1 . 9
Glass House 1 0 0 .20 0.16 0.12 Quay ( 5 9 ) 0 .92
Cheekpoint 1 0 0 .18 0.14 0.10 Pier (60a) 3.60
* Closest Stations used by the Regional Water Laboratory Note: Background levels excluded
Run No. 1 1 5
22
For
insp
ectio
n pur
pose
s only
.
Conse
nt of
copy
right
owne
r req
uired
for a
ny ot
her u
se.
EPA Export 17-06-2012:04:49:55
---
.*it
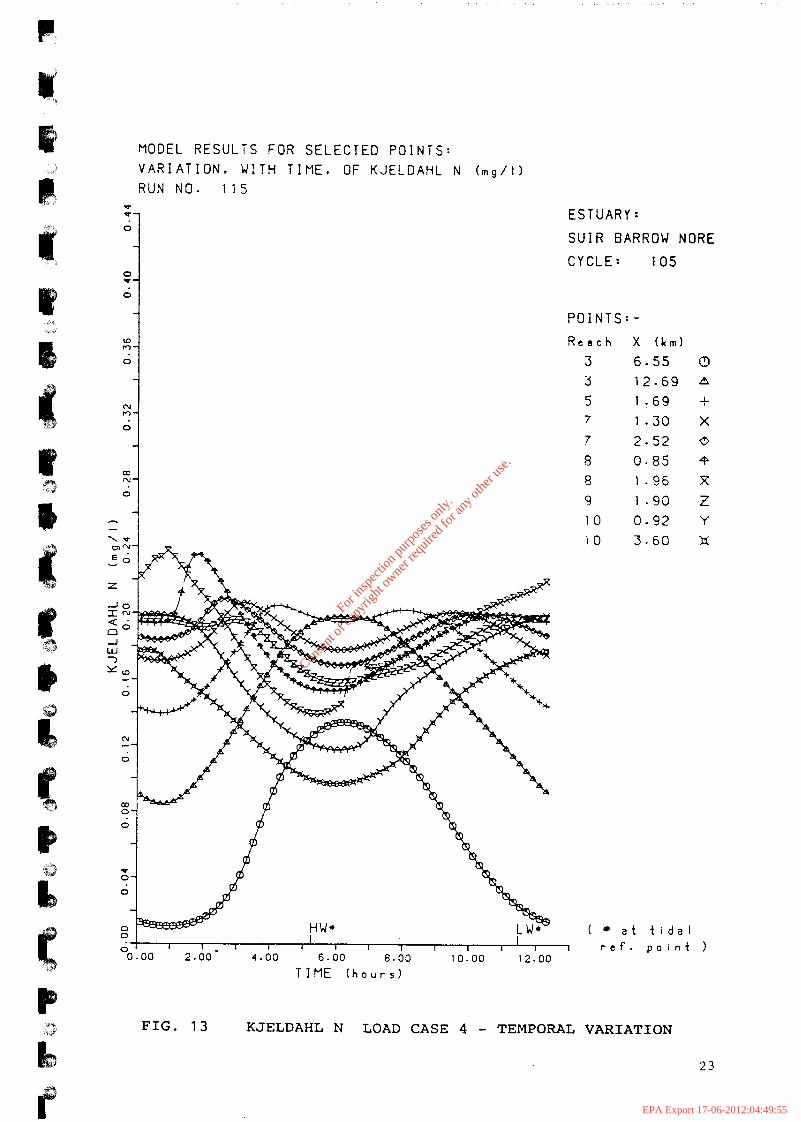
MODEL R E S U L T S F O R S E L E C T E D P O I N T S : V A R I A T I O N . W I T H T I M E . OF K J E L D A H L N ( m g / l )
R U N N O . 115
E S T U A R Y :
S U I R BARROW N O R E
C Y C L E : 105
P O I N T S : - R e a c h X ( k m )
3 6 .55 0 3 12 .69 A 5 1 . 6 9 -!-
1 .30 X 7
7 2 .52 0 8 0 . 8 5 9 s 1 . 9 6 X 9 1 - 9 0 z 10 0 . 9 2 Y i o 3 . 6 0 E
HW. ( a t t i d a l I I
I I I I I I 1 I I I I r e f . p o i n t 1 .. 0 0.00 2.00‘ 4.00 6.00 8.00 10.00 12.00
T I M E ( h o u r s )
FIG. 13 KJELDAHL N LOAD CASE 4 - TEMPORAL VARIATION
2 3
For
insp
ectio
n pur
pose
s only
.
Conse
nt of
copy
right
owne
r req
uired
for a
ny ot
her u
se.
EPA Export 17-06-2012:04:49:55
* * c
.e**
3
P)
z .-_ 1-
r - - - - - - - - - - - 1
cv z -
U) F: I I I I I I I I I I
I m m m o I I I 0 0 0
e 0
z r - s e a b d y .
s Lq
10 z
- u p s t r e a m b d y . z
For
insp
ectio
n pur
pose
s only
.
Conse
nt of
copy
right
owne
r req
uired
for a
ny ot
her u
se.
EPA Export 17-06-2012:04:49:55
6 . KJELDAHL NITROGEN
LOAD CASE SIMULATIONS
6 .1 The effluent loads of Kjeldahl nitrogen for five different load cases as determined by the consulting engineers are presented in Appendix A. The mathematical model was run to simulate the effects of each load case. A s was the case for total phosphorus, the tidal conditions simulated were those of a period when average tidal ranges were followed by neap tides.
6.2 Again also the parameter was treated as persistent, i.e., non-decaying. Consequently the results must be considered to be quite conservative, i.e., as Kjeldahl nitrogen predictions erring on the high side. Since the input load is treated as non-decaying, the results of these simulations may also be considered to give a reasonable representation of the impact on the total nitrosen distribution in the estuary resulting from the different load cases (i.e., excluding background influences from other sources).
6 . 3 Dry weather river flow conditions were again simulated, and since it was treated as a conservative parameter, it was necessary to simulate over a relatively long period before quasi steady state conditions were reached.
6.4 The mathematical model output for the Kjeldahl nitrogen load case simulations is presented again in the same three forms as were for the previous parameters: firstly, the maximum, mean and minimum results for ten selected points are given in tabular form; secondly the full variation over the tidal cycle at each of the ten points is plotted, and thirdly the spatial variation along the estuary is shown for three tidal times. (Paragraphs 4.7 to 4.10 may be referred to as before for notes on the diagram presenting the spatial variations).
66
For
insp
ectio
n pur
pose
s only
.
Conse
nt of
copy
right
owne
r req
uired
for a
ny ot
her u
se.
EPA Export 17-06-2012:04:49:55
-.b
3
Waterford Main Drainage Scheme Input Data For Mathematical Model
14
2 2 E L 457 81 7 8 x10 - 1 / *T90=12hrs. +
Waterford Main Drainage Scheme Input Data For Mathematical Model
Treated Wastewater Discharge From Treatment Plant (Future Loads) $i Load Case 4 (Design Case 2) -%
Partially Treated Industrial Discharge At Grannagh (Future
I I
I I 779 194, 151 54 I - 2 Grannagh
26 W. W.T.P. 31,552 631 1 267 1 1,054, 11.4~10-
I
I 1 4
T 90 = 12 hrs. * Rev.2
41
For
insp
ectio
n pur
pose
s only
.
Conse
nt of
copy
right
owne
r req
uired
for a
ny ot
her u
se.
EPA Export 17-06-2012:04:49:55
i
f I"
43
For
insp
ectio
n pur
pose
s only
.
Conse
nt of
copy
right
owne
r req
uired
for a
ny ot
her u
se.
EPA Export 17-06-2012:04:49:55
For
insp
ectio
n pur
pose
s only
.
Conse
nt of
copy
right
owne
r req
uired
for a
ny ot
her u
se.
EPA Export 17-06-2012:04:49:55