Embed Size (px)
Citation preview
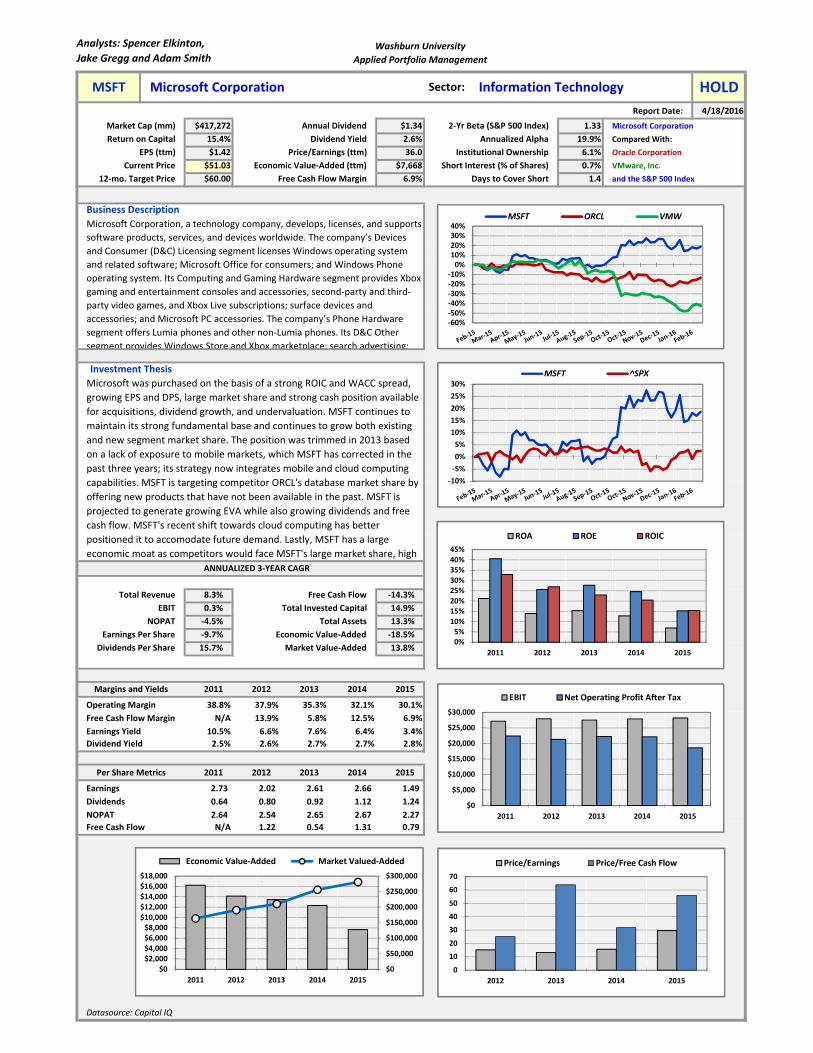
Analysts: Spencer Elkinton,
Jake Gregg and Adam SmithWashburn University
Applied Portfolio Management
Report Date: 4/18/2016
Market Cap (mm) $417,272 Annual Dividend $1.34 2‐Yr Beta (S&P 500 Index) 1.33 Microsoft Corporation
Return on Capital 15.4% Dividend Yield 2.6% Annualized Alpha 19.9% Compared With:
EPS (ttm) $1.42 Price/Earnings (ttm) 36.0 Institutional Ownership 6.1% Oracle Corporation
Current Price $51.03 Economic Value‐Added (ttm) $7,668 Short Interest (% of Shares) 0.7% VMware, Inc.
12‐mo. Target Price $60.00 Free Cash Flow Margin 6.9% Days to Cover Short 1.4 and the S&P 500 Index
Business Description
Total Revenue 8.3% Free Cash Flow ‐14.3%
EBIT 0.3% Total Invested Capital 14.9%
NOPAT ‐4.5% Total Assets 13.3%
Earnings Per Share ‐9.7% Economic Value‐Added ‐18.5%
Dividends Per Share 15.7% Market Value‐Added 13.8%
2011 2012 2013 2014 2015
38.8% 37.9% 35.3% 32.1% 30.1%
N/A 13.9% 5.8% 12.5% 6.9%
10.5% 6.6% 7.6% 6.4% 3.4%
2.5% 2.6% 2.7% 2.7% 2.8%
2011 2012 2013 2014 2015
2.73 2.02 2.61 2.66 1.49
0.64 0.80 0.92 1.12 1.24
2.64 2.54 2.65 2.67 2.27
N/A 1.22 0.54 1.31 0.79
Datasource: Capital IQ
NOPAT
Free Cash Flow
Earnings Yield
Dividend Yield
Per Share Metrics
Earnings
Dividends
Free Cash Flow Margin
Microsoft Corporation, a technology company, develops, licenses, and supports
software products, services, and devices worldwide. The company’s Devices
and Consumer (D&C) Licensing segment licenses Windows operating system
and related software; Microsoft Office for consumers; and Windows Phone
operating system. Its Computing and Gaming Hardware segment provides Xbox
gaming and entertainment consoles and accessories, second‐party and third‐
party video games, and Xbox Live subscriptions; surface devices and
accessories; and Microsoft PC accessories. The company’s Phone Hardware
segment offers Lumia phones and other non‐Lumia phones. Its D&C Other
segment provides Windows Store and Xbox marketplace; search advertising;
Investment Thesis
Microsoft was purchased on the basis of a strong ROIC and WACC spread,
growing EPS and DPS, large market share and strong cash position available
for acquisitions, dividend growth, and undervaluation. MSFT continues to
maintain its strong fundamental base and continues to grow both existing
and new segment market share. The position was trimmed in 2013 based
on a lack of exposure to mobile markets, which MSFT has corrected in the
past three years; its strategy now integrates mobile and cloud computing
capabilities. MSFT is targeting competitor ORCL's database market share by
offering new products that have not been available in the past. MSFT is
projected to generate growing EVA while also growing dividends and free
cash flow. MSFT's recent shift towards cloud computing has better
positioned it to accomodate future demand. Lastly, MSFT has a large
economic moat as competitors would face MSFT's large market share, high
ANNUALIZED 3‐YEAR CAGR
Margins and Yields
Operating Margin
MSFT Microsoft Corporation Sector: Information Technology HOLD
‐10%
‐5%
0%
5%
10%
15%
20%
25%
30%MSFT ^SPX
‐60%‐50%‐40%‐30%‐20%‐10%0%10%20%30%40%
MSFT ORCL VMW
0
10
20
30
40
50
60
70
2012 2013 2014 2015
Price/Earnings Price/Free Cash Flow
$0
$5,000
$10,000
$15,000
$20,000
$25,000
$30,000
2011 2012 2013 2014 2015
EBIT Net Operating Profit After Tax
$0
$50,000
$100,000
$150,000
$200,000
$250,000
$300,000
$0
$2,000
$4,000
$6,000
$8,000$10,000
$12,000
$14,000
$16,000
$18,000
2011 2012 2013 2014 2015
Economic Value‐Added Market Valued‐Added
0%5%10%
15%20%
25%30%
35%40%
45%
2011 2012 2013 2014 2015
ROA ROE ROIC
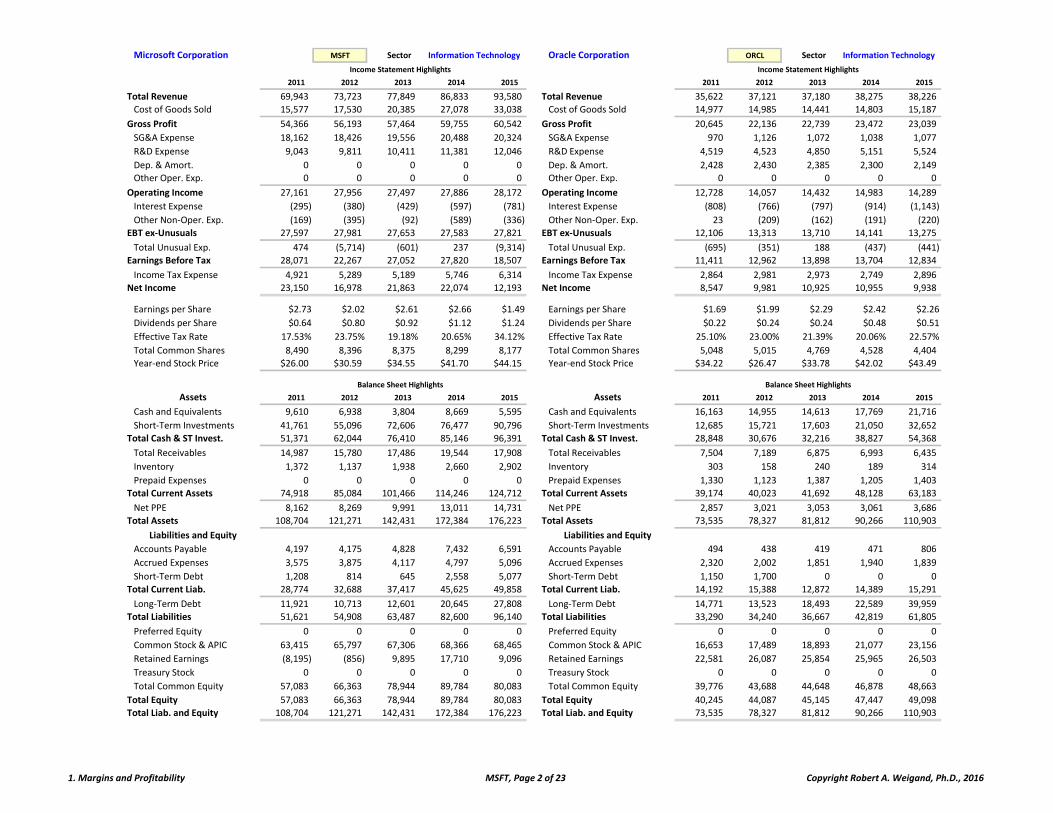
Microsoft Corporation MSFT Sector Information Technology Oracle Corporation ORCL Sector Information Technology
2011 2012 2013 2014 2015 2011 2012 2013 2014 2015
Total Revenue 69,943 73,723 77,849 86,833 93,580 Total Revenue 35,622 37,121 37,180 38,275 38,226
Cost of Goods Sold 15,577 17,530 20,385 27,078 33,038 Cost of Goods Sold 14,977 14,985 14,441 14,803 15,187
Gross Profit 54,366 56,193 57,464 59,755 60,542 Gross Profit 20,645 22,136 22,739 23,472 23,039
SG&A Expense 18,162 18,426 19,556 20,488 20,324 SG&A Expense 970 1,126 1,072 1,038 1,077
R&D Expense 9,043 9,811 10,411 11,381 12,046 R&D Expense 4,519 4,523 4,850 5,151 5,524
Dep. & Amort. 0 0 0 0 0 Dep. & Amort. 2,428 2,430 2,385 2,300 2,149
Other Oper. Exp. 0 0 0 0 0 Other Oper. Exp. 0 0 0 0 0
Operating Income 27,161 27,956 27,497 27,886 28,172 Operating Income 12,728 14,057 14,432 14,983 14,289
Interest Expense (295) (380) (429) (597) (781) Interest Expense (808) (766) (797) (914) (1,143)
Other Non‐Oper. Exp. (169) (395) (92) (589) (336) Other Non‐Oper. Exp. 23 (209) (162) (191) (220)
EBT ex‐Unusuals 27,597 27,981 27,653 27,583 27,821 EBT ex‐Unusuals 12,106 13,313 13,710 14,141 13,275
Total Unusual Exp. 474 (5,714) (601) 237 (9,314) Total Unusual Exp. (695) (351) 188 (437) (441)
Earnings Before Tax 28,071 22,267 27,052 27,820 18,507 Earnings Before Tax 11,411 12,962 13,898 13,704 12,834
Income Tax Expense 4,921 5,289 5,189 5,746 6,314 Income Tax Expense 2,864 2,981 2,973 2,749 2,896
Net Income 23,150 16,978 21,863 22,074 12,193 Net Income 8,547 9,981 10,925 10,955 9,938
Earnings per Share $2.73 $2.02 $2.61 $2.66 $1.49 Earnings per Share $1.69 $1.99 $2.29 $2.42 $2.26
Dividends per Share $0.64 $0.80 $0.92 $1.12 $1.24 Dividends per Share $0.22 $0.24 $0.24 $0.48 $0.51
Effective Tax Rate 17.53% 23.75% 19.18% 20.65% 34.12% Effective Tax Rate 25.10% 23.00% 21.39% 20.06% 22.57%
Total Common Shares 8,490 8,396 8,375 8,299 8,177 Total Common Shares 5,048 5,015 4,769 4,528 4,404
Year‐end Stock Price $26.00 $30.59 $34.55 $41.70 $44.15 Year‐end Stock Price $34.22 $26.47 $33.78 $42.02 $43.49996 997 998 999 1000 996 997 998 999 1000
Assets 2011 2012 2013 2014 2015 Assets 2011 2012 2013 2014 2015
Cash and Equivalents 9,610 6,938 3,804 8,669 5,595 Cash and Equivalents 16,163 14,955 14,613 17,769 21,716
Short‐Term Investments 41,761 55,096 72,606 76,477 90,796 Short‐Term Investments 12,685 15,721 17,603 21,050 32,652
Total Cash & ST Invest. 51,371 62,044 76,410 85,146 96,391 Total Cash & ST Invest. 28,848 30,676 32,216 38,827 54,368
Total Receivables 14,987 15,780 17,486 19,544 17,908 Total Receivables 7,504 7,189 6,875 6,993 6,435
Inventory 1,372 1,137 1,938 2,660 2,902 Inventory 303 158 240 189 314
Prepaid Expenses 0 0 0 0 0 Prepaid Expenses 1,330 1,123 1,387 1,205 1,403
Total Current Assets 74,918 85,084 101,466 114,246 124,712 Total Current Assets 39,174 40,023 41,692 48,128 63,183
Net PPE 8,162 8,269 9,991 13,011 14,731 Net PPE 2,857 3,021 3,053 3,061 3,686
Total Assets 108,704 121,271 142,431 172,384 176,223 Total Assets 73,535 78,327 81,812 90,266 110,903
Liabilities and Equity Liabilities and Equity
Accounts Payable 4,197 4,175 4,828 7,432 6,591 Accounts Payable 494 438 419 471 806
Accrued Expenses 3,575 3,875 4,117 4,797 5,096 Accrued Expenses 2,320 2,002 1,851 1,940 1,839
Short‐Term Debt 1,208 814 645 2,558 5,077 Short‐Term Debt 1,150 1,700 0 0 0
Total Current Liab. 28,774 32,688 37,417 45,625 49,858 Total Current Liab. 14,192 15,388 12,872 14,389 15,291
Long‐Term Debt 11,921 10,713 12,601 20,645 27,808 Long‐Term Debt 14,771 13,523 18,493 22,589 39,959
Total Liabilities 51,621 54,908 63,487 82,600 96,140 Total Liabilities 33,290 34,240 36,667 42,819 61,805
Preferred Equity 0 0 0 0 0 Preferred Equity 0 0 0 0 0
Common Stock & APIC 63,415 65,797 67,306 68,366 68,465 Common Stock & APIC 16,653 17,489 18,893 21,077 23,156
Retained Earnings (8,195) (856) 9,895 17,710 9,096 Retained Earnings 22,581 26,087 25,854 25,965 26,503
Treasury Stock 0 0 0 0 0 Treasury Stock 0 0 0 0 0
Total Common Equity 57,083 66,363 78,944 89,784 80,083 Total Common Equity 39,776 43,688 44,648 46,878 48,663
Total Equity 57,083 66,363 78,944 89,784 80,083 Total Equity 40,245 44,087 45,145 47,447 49,098
Total Liab. and Equity 108,704 121,271 142,431 172,384 176,223 Total Liab. and Equity 73,535 78,327 81,812 90,266 110,903
Income Statement Highlights
Balance Sheet Highlights
Income Statement Highlights
Balance Sheet Highlights
1. Margins and Profitability MSFT, Page 2 of 23 Copyright Robert A. Weigand, Ph.D., 2016
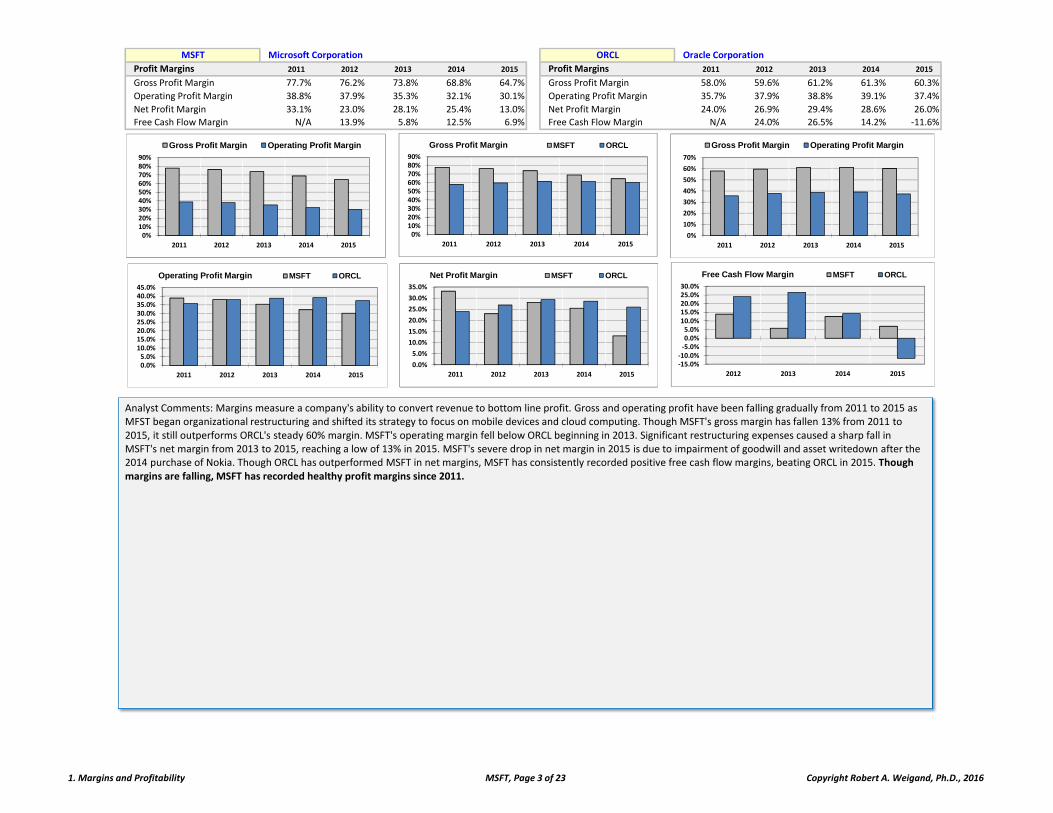
MSFT Microsoft Corporation ORCL Oracle Corporation
Profit Margins 2011 2012 2013 2014 2015 Profit Margins 2011 2012 2013 2014 2015
Gross Profit Margin 77.7% 76.2% 73.8% 68.8% 64.7% Gross Profit Margin 58.0% 59.6% 61.2% 61.3% 60.3%
Operating Profit Margin 38.8% 37.9% 35.3% 32.1% 30.1% Operating Profit Margin 35.7% 37.9% 38.8% 39.1% 37.4%
Net Profit Margin 33.1% 23.0% 28.1% 25.4% 13.0% Net Profit Margin 24.0% 26.9% 29.4% 28.6% 26.0%
Free Cash Flow Margin N/A 13.9% 5.8% 12.5% 6.9% Free Cash Flow Margin N/A 24.0% 26.5% 14.2% ‐11.6%
0%10%20%30%40%50%60%70%80%90%
2011 2012 2013 2014 2015
Gross Profit Margin Operating Profit Margin
0%
10%
20%
30%
40%
50%
60%
70%
2011 2012 2013 2014 2015
Gross Profit Margin Operating Profit Margin
0%10%20%30%40%50%60%70%80%90%
2011 2012 2013 2014 2015
Gross Profit Margin MSFT ORCL
0.0%5.0%10.0%15.0%20.0%25.0%30.0%35.0%40.0%45.0%
2011 2012 2013 2014 2015
Operating Profit Margin MSFT ORCL
0.0%
5.0%
10.0%
15.0%
20.0%
25.0%
30.0%
35.0%
2011 2012 2013 2014 2015
Net Profit Margin MSFT ORCL
Analyst Comments: Margins measure a company's ability to convert revenue to bottom line profit. Gross and operating profit have been falling gradually from 2011 to 2015 as MFST began organizational restructuring and shifted its strategy to focus on mobile devices and cloud computing. Though MSFT's gross margin has fallen 13% from 2011 to 2015, it still outperforms ORCL's steady 60% margin. MSFT's operating margin fell below ORCL beginning in 2013. Significant restructuring expenses caused a sharp fall in MSFT's net margin from 2013 to 2015, reaching a low of 13% in 2015. MSFT's severe drop in net margin in 2015 is due to impairment of goodwill and asset writedown after the 2014 purchase of Nokia. Though ORCL has outperformed MSFT in net margins, MSFT has consistently recorded positive free cash flow margins, beating ORCL in 2015. Though margins are falling, MSFT has recorded healthy profit margins since 2011.
‐15.0%‐10.0%‐5.0%0.0%5.0%10.0%15.0%20.0%25.0%30.0%
2012 2013 2014 2015
Free Cash Flow Margin MSFT ORCL
1. Margins and Profitability MSFT, Page 3 of 23 Copyright Robert A. Weigand, Ph.D., 2016
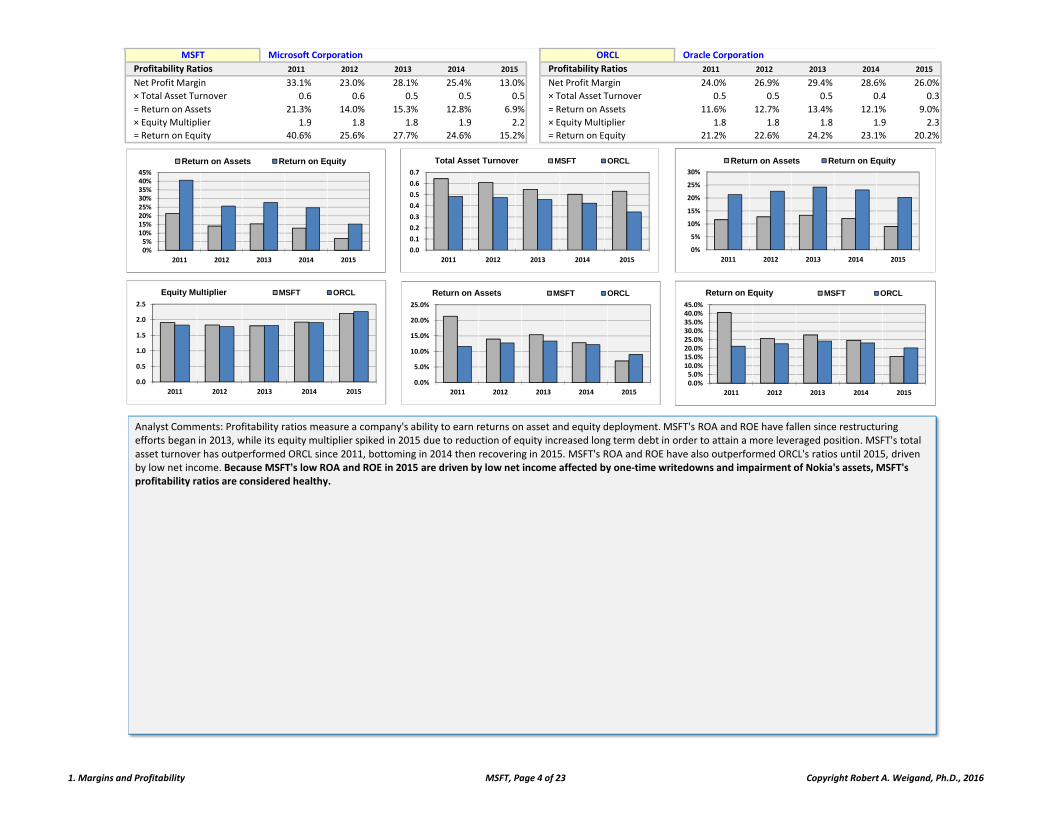
MSFT Microsoft Corporation ORCL Oracle Corporation
Profitability Ratios 2011 2012 2013 2014 2015 Profitability Ratios 2011 2012 2013 2014 2015
Net Profit Margin 33.1% 23.0% 28.1% 25.4% 13.0% Net Profit Margin 24.0% 26.9% 29.4% 28.6% 26.0%
× Total Asset Turnover 0.6 0.6 0.5 0.5 0.5 × Total Asset Turnover 0.5 0.5 0.5 0.4 0.3
= Return on Assets 21.3% 14.0% 15.3% 12.8% 6.9% = Return on Assets 11.6% 12.7% 13.4% 12.1% 9.0%
× Equity Multiplier 1.9 1.8 1.8 1.9 2.2 × Equity Multiplier 1.8 1.8 1.8 1.9 2.3
= Return on Equity 40.6% 25.6% 27.7% 24.6% 15.2% = Return on Equity 21.2% 22.6% 24.2% 23.1% 20.2%
0%5%
10%15%20%25%30%35%40%45%
2011 2012 2013 2014 2015
Return on Assets Return on Equity
0%
5%
10%
15%
20%
25%
30%
2011 2012 2013 2014 2015
Return on Assets Return on Equity
0.0
0.1
0.2
0.3
0.4
0.5
0.6
0.7
2011 2012 2013 2014 2015
Total Asset Turnover MSFT ORCL
0.0%
5.0%
10.0%
15.0%
20.0%
25.0%
2011 2012 2013 2014 2015
Return on Assets MSFT ORCL
0.0%5.0%10.0%15.0%20.0%25.0%30.0%35.0%40.0%45.0%
2011 2012 2013 2014 2015
Return on Equity MSFT ORCL
Analyst Comments: Profitability ratios measure a company's ability to earn returns on asset and equity deployment. MSFT's ROA and ROE have fallen since restructuring efforts began in 2013, while its equity multiplier spiked in 2015 due to reduction of equity increased long term debt in order to attain a more leveraged position. MSFT's total asset turnover has outperformed ORCL since 2011, bottoming in 2014 then recovering in 2015. MSFT's ROA and ROE have also outperformed ORCL's ratios until 2015, driven by low net income. Because MSFT's low ROA and ROE in 2015 are driven by low net income affected by one‐time writedowns and impairment of Nokia's assets, MSFT's profitability ratios are considered healthy.
0.0
0.5
1.0
1.5
2.0
2.5
2011 2012 2013 2014 2015
Equity Multiplier MSFT ORCL
1. Margins and Profitability MSFT, Page 4 of 23 Copyright Robert A. Weigand, Ph.D., 2016
MSFT Microsoft Corporation ORCL Oracle Corporation
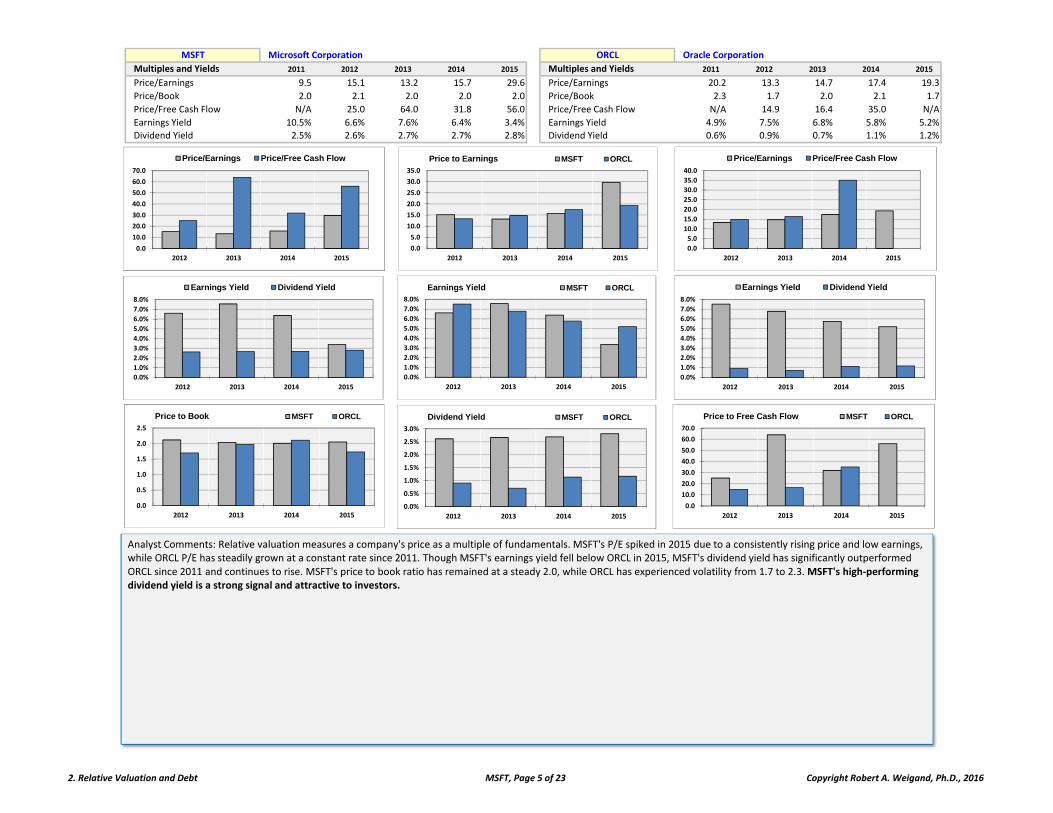
Multiples and Yields 2011 2012 2013 2014 2015 Multiples and Yields 2011 2012 2013 2014 2015
Price/Earnings 9.5 15.1 13.2 15.7 29.6 Price/Earnings 20.2 13.3 14.7 17.4 19.3
Price/Book 2.0 2.1 2.0 2.0 2.0 Price/Book 2.3 1.7 2.0 2.1 1.7
Price/Free Cash Flow N/A 25.0 64.0 31.8 56.0 Price/Free Cash Flow N/A 14.9 16.4 35.0 N/A
Earnings Yield 10.5% 6.6% 7.6% 6.4% 3.4% Earnings Yield 4.9% 7.5% 6.8% 5.8% 5.2%
Dividend Yield 2.5% 2.6% 2.7% 2.7% 2.8% Dividend Yield 0.6% 0.9% 0.7% 1.1% 1.2%
0.0
10.0
20.0
30.0
40.0
50.0
60.0
70.0
2012 2013 2014 2015
Price/Earnings Price/Free Cash Flow
0.0%
1.0%
2.0%
3.0%
4.0%
5.0%
6.0%
7.0%
8.0%
2012 2013 2014 2015
Earnings Yield Dividend Yield
0.0%
1.0%
2.0%
3.0%
4.0%
5.0%
6.0%
7.0%
8.0%
2012 2013 2014 2015
Earnings Yield MSFT ORCL
Analyst Comments: Relative valuation measures a company's price as a multiple of fundamentals. MSFT's P/E spiked in 2015 due to a consistently rising price and low earnings, while ORCL P/E has steadily grown at a constant rate since 2011. Though MSFT's earnings yield fell below ORCL in 2015, MSFT's dividend yield has significantly outperformed ORCL since 2011 and continues to rise. MSFT's price to book ratio has remained at a steady 2.0, while ORCL has experienced volatility from 1.7 to 2.3. MSFT's high‐performing dividend yield is a strong signal and attractive to investors.
0.0
5.0
10.0
15.0
20.0
25.0
30.0
35.0
40.0
2012 2013 2014 2015
Price/Earnings Price/Free Cash Flow
0.0
5.0
10.0
15.0
20.0
25.0
30.0
35.0
2012 2013 2014 2015
Price to Earnings MSFT ORCL
0.0%
1.0%
2.0%
3.0%
4.0%
5.0%
6.0%
7.0%
8.0%
2012 2013 2014 2015
Earnings Yield Dividend Yield
0.0
0.5
1.0
1.5
2.0
2.5
2012 2013 2014 2015
Price to Book MSFT ORCL
0.0
10.0
20.0
30.0
40.0
50.0
60.0
70.0
2012 2013 2014 2015
Price to Free Cash Flow MSFT ORCL
0.0%
0.5%
1.0%
1.5%
2.0%
2.5%
3.0%
2012 2013 2014 2015
Dividend Yield MSFT ORCL
2. Relative Valuation and Debt MSFT, Page 5 of 23 Copyright Robert A. Weigand, Ph.D., 2016
MSFT Microsoft Corporation ORCL Oracle Corporation
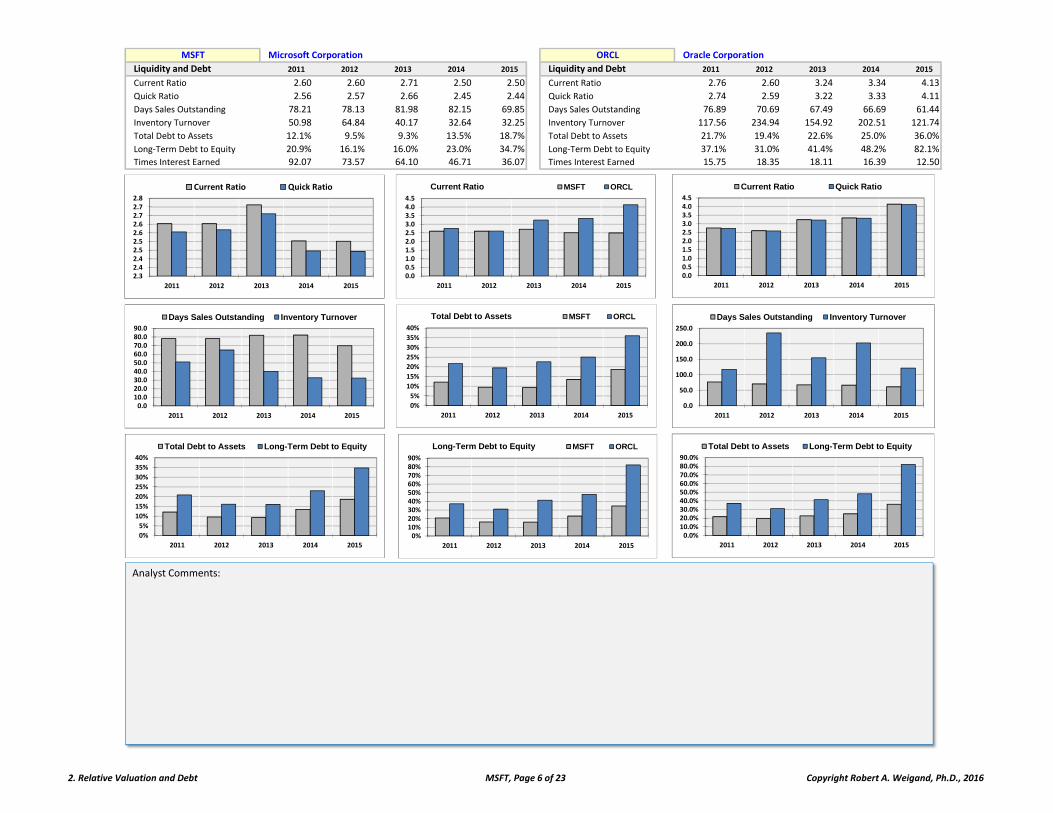
Liquidity and Debt 2011 2012 2013 2014 2015 Liquidity and Debt 2011 2012 2013 2014 2015
Current Ratio 2.60 2.60 2.71 2.50 2.50 Current Ratio 2.76 2.60 3.24 3.34 4.13
Quick Ratio 2.56 2.57 2.66 2.45 2.44 Quick Ratio 2.74 2.59 3.22 3.33 4.11
Days Sales Outstanding 78.21 78.13 81.98 82.15 69.85 Days Sales Outstanding 76.89 70.69 67.49 66.69 61.44
Inventory Turnover 50.98 64.84 40.17 32.64 32.25 Inventory Turnover 117.56 234.94 154.92 202.51 121.74
Total Debt to Assets 12.1% 9.5% 9.3% 13.5% 18.7% Total Debt to Assets 21.7% 19.4% 22.6% 25.0% 36.0%
Long‐Term Debt to Equity 20.9% 16.1% 16.0% 23.0% 34.7% Long‐Term Debt to Equity 37.1% 31.0% 41.4% 48.2% 82.1%
Times Interest Earned 92.07 73.57 64.10 46.71 36.07 Times Interest Earned 15.75 18.35 18.11 16.39 12.50
2.32.42.42.52.52.62.62.72.72.8
2011 2012 2013 2014 2015
Current Ratio Quick Ratio
0.00.51.01.52.02.53.03.54.04.5
2011 2012 2013 2014 2015
Current Ratio Quick Ratio
0.00.51.01.52.02.53.03.54.04.5
2011 2012 2013 2014 2015
Current Ratio MSFT ORCL
Analyst Comments:
0%
5%
10%
15%
20%
25%
30%
35%
40%
2011 2012 2013 2014 2015
Total Debt to Assets MSFT ORCL
0.010.020.030.040.050.060.070.080.090.0
2011 2012 2013 2014 2015
Days Sales Outstanding Inventory Turnover
0.0
50.0
100.0
150.0
200.0
250.0
2011 2012 2013 2014 2015
Days Sales Outstanding Inventory Turnover
0%
5%
10%
15%
20%
25%
30%
35%
40%
2011 2012 2013 2014 2015
Total Debt to Assets Long-Term Debt to Equity
0.0%10.0%20.0%30.0%40.0%50.0%60.0%70.0%80.0%90.0%
2011 2012 2013 2014 2015
Total Debt to Assets Long-Term Debt to Equity
0%10%20%30%40%50%60%70%80%90%
2011 2012 2013 2014 2015
Long-Term Debt to Equity MSFT ORCL
2. Relative Valuation and Debt MSFT, Page 6 of 23 Copyright Robert A. Weigand, Ph.D., 2016
MSFT Microsoft Corporation ORCL Oracle Corporation
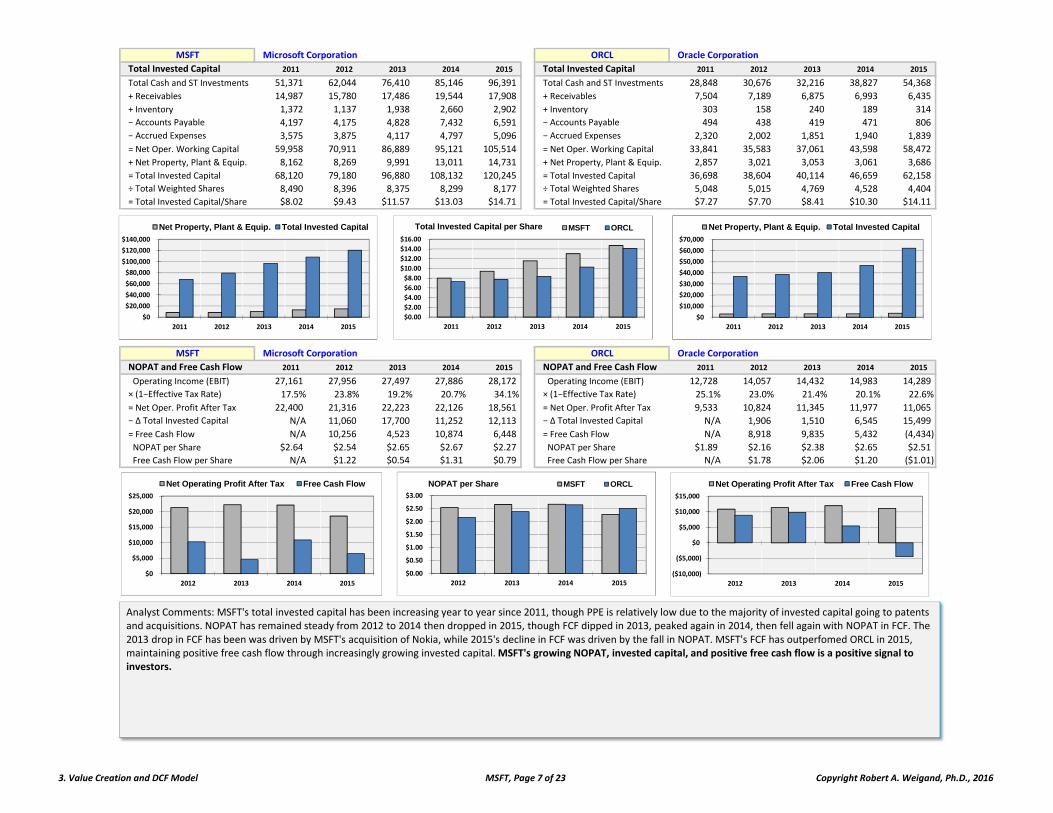
Total Invested Capital 2011 2012 2013 2014 2015 Total Invested Capital 2011 2012 2013 2014 2015
Total Cash and ST Investments 51,371 62,044 76,410 85,146 96,391 Total Cash and ST Investments 28,848 30,676 32,216 38,827 54,368
+ Receivables 14,987 15,780 17,486 19,544 17,908 + Receivables 7,504 7,189 6,875 6,993 6,435
+ Inventory 1,372 1,137 1,938 2,660 2,902 + Inventory 303 158 240 189 314
− Accounts Payable 4,197 4,175 4,828 7,432 6,591 − Accounts Payable 494 438 419 471 806
− Accrued Expenses 3,575 3,875 4,117 4,797 5,096 − Accrued Expenses 2,320 2,002 1,851 1,940 1,839
= Net Oper. Working Capital 59,958 70,911 86,889 95,121 105,514 = Net Oper. Working Capital 33,841 35,583 37,061 43,598 58,472
+ Net Property, Plant & Equip. 8,162 8,269 9,991 13,011 14,731 + Net Property, Plant & Equip. 2,857 3,021 3,053 3,061 3,686
= Total Invested Capital 68,120 79,180 96,880 108,132 120,245 = Total Invested Capital 36,698 38,604 40,114 46,659 62,158
÷ Total Weighted Shares 8,490 8,396 8,375 8,299 8,177 ÷ Total Weighted Shares 5,048 5,015 4,769 4,528 4,404
= Total Invested Capital/Share $8.02 $9.43 $11.57 $13.03 $14.71 = Total Invested Capital/Share $7.27 $7.70 $8.41 $10.30 $14.11
MSFT Microsoft Corporation ORCL Oracle Corporation
NOPAT and Free Cash Flow 2011 2012 2013 2014 2015 NOPAT and Free Cash Flow 2011 2012 2013 2014 2015
Operating Income (EBIT) 27,161 27,956 27,497 27,886 28,172 Operating Income (EBIT) 12,728 14,057 14,432 14,983 14,289
× (1−Effective Tax Rate) 17.5% 23.8% 19.2% 20.7% 34.1% × (1−Effective Tax Rate) 25.1% 23.0% 21.4% 20.1% 22.6%
= Net Oper. Profit After Tax 22,400 21,316 22,223 22,126 18,561 = Net Oper. Profit After Tax 9,533 10,824 11,345 11,977 11,065
− ∆ Total Invested Capital N/A 11,060 17,700 11,252 12,113 − ∆ Total Invested Capital N/A 1,906 1,510 6,545 15,499
= Free Cash Flow N/A 10,256 4,523 10,874 6,448 = Free Cash Flow N/A 8,918 9,835 5,432 (4,434)
NOPAT per Share $2.64 $2.54 $2.65 $2.67 $2.27 NOPAT per Share $1.89 $2.16 $2.38 $2.65 $2.51
Free Cash Flow per Share N/A $1.22 $0.54 $1.31 $0.79 Free Cash Flow per Share N/A $1.78 $2.06 $1.20 ($1.01)
$0
$20,000
$40,000
$60,000
$80,000
$100,000
$120,000
$140,000
2011 2012 2013 2014 2015
Net Property, Plant & Equip. Total Invested Capital
$0
$10,000
$20,000
$30,000
$40,000
$50,000
$60,000
$70,000
2011 2012 2013 2014 2015
Net Property, Plant & Equip. Total Invested Capital
$0.00
$2.00
$4.00
$6.00
$8.00
$10.00
$12.00
$14.00
$16.00
2011 2012 2013 2014 2015
Total Invested Capital per Share MSFT ORCL
$0
$5,000
$10,000
$15,000
$20,000
$25,000
2012 2013 2014 2015
Net Operating Profit After Tax Free Cash Flow
$0.00
$0.50
$1.00
$1.50
$2.00
$2.50
$3.00
2012 2013 2014 2015
NOPAT per Share MSFT ORCL
($10,000)
($5,000)
$0
$5,000
$10,000
$15,000
2012 2013 2014 2015
Net Operating Profit After Tax Free Cash Flow
Analyst Comments: MSFT's total invested capital has been increasing year to year since 2011, though PPE is relatively low due to the majority of invested capital going to patents and acquisitions. NOPAT has remained steady from 2012 to 2014 then dropped in 2015, though FCF dipped in 2013, peaked again in 2014, then fell again with NOPAT in FCF. The 2013 drop in FCF has been was driven by MSFT's acquisition of Nokia, while 2015's decline in FCF was driven by the fall in NOPAT. MSFT's FCF has outperfomed ORCL in 2015, maintaining positive free cash flow through increasingly growing invested capital. MSFT's growing NOPAT, invested capital, and positive free cash flow is a positive signal to investors.
3. Value Creation and DCF Model MSFT, Page 7 of 23 Copyright Robert A. Weigand, Ph.D., 2016
MSFT Microsoft Corporation ORCL Oracle Corporation
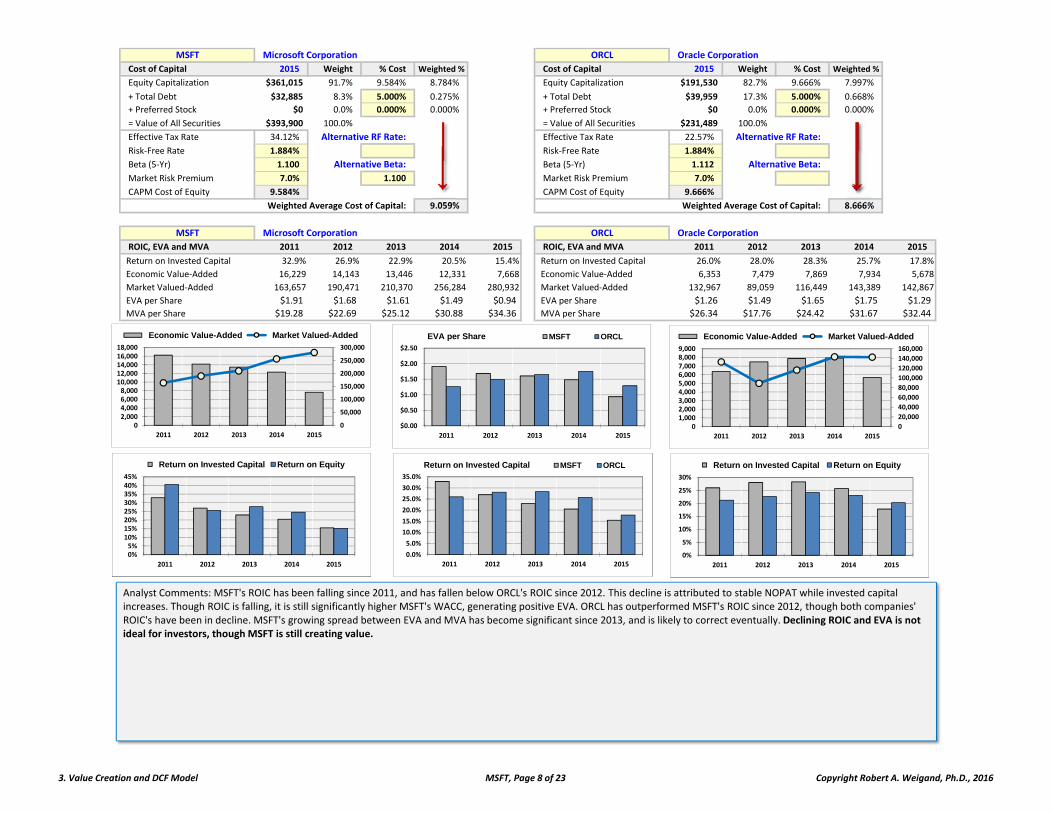
Cost of Capital 2015 Weight % Cost Weighted % Cost of Capital 2015 Weight % Cost Weighted %
Equity Capitalization $361,015 91.7% 9.584% 8.784% Equity Capitalization $191,530 82.7% 9.666% 7.997%
+ Total Debt $32,885 8.3% 5.000% 0.275% + Total Debt $39,959 17.3% 5.000% 0.668%
+ Preferred Stock $0 0.0% 0.000% 0.000% + Preferred Stock $0 0.0% 0.000% 0.000%
= Value of All Securities $393,900 100.0% = Value of All Securities $231,489 100.0%
Effective Tax Rate 34.12% Alternative RF Rate: Effective Tax Rate 22.57% Alternative RF Rate:
Risk‐Free Rate 1.884% 1.884% Risk‐Free Rate 1.884% 1.884%
Beta (5‐Yr) 1.100 Alternative Beta: 0.96745 Beta (5‐Yr) 1.112 Alternative Beta: 1.1117
Market Risk Premium 7.0% 1.100 Market Risk Premium 7.0%
CAPM Cost of Equity 9.584% CAPM Cost of Equity 9.666%
Weighted Average Cost of Capital: 9.059% Weighted Average Cost of Capital: 8.666%
9.059% 9.059% 9.059% 9.059% 9.059%
MSFT Microsoft Corporation ORCL Oracle Corporation
ROIC, EVA and MVA 2011 2012 2013 2014 2015 ROIC, EVA and MVA 2011 2012 2013 2014 2015
Return on Invested Capital 32.9% 26.9% 22.9% 20.5% 15.4% Return on Invested Capital 26.0% 28.0% 28.3% 25.7% 17.8%
Economic Value‐Added 16,229 14,143 13,446 12,331 7,668 Economic Value‐Added 6,353 7,479 7,869 7,934 5,678
Market Valued‐Added 163,657 190,471 210,370 256,284 280,932 Market Valued‐Added 132,967 89,059 116,449 143,389 142,867
EVA per Share $1.91 $1.68 $1.61 $1.49 $0.94 EVA per Share $1.26 $1.49 $1.65 $1.75 $1.29
MVA per Share $19.28 $22.69 $25.12 $30.88 $34.36 MVA per Share $26.34 $17.76 $24.42 $31.67 $32.44
$0.00
$0.50
$1.00
$1.50
$2.00
$2.50
2011 2012 2013 2014 2015
EVA per Share MSFT ORCL
0
50,000
100,000
150,000
200,000
250,000
300,000
02,0004,0006,0008,000
10,00012,00014,00016,00018,000
2011 2012 2013 2014 2015
Economic Value-Added Market Valued-Added
0
20,000
40,000
60,000
80,000
100,000
120,000
140,000
160,000
01,0002,0003,0004,0005,0006,0007,0008,0009,000
2011 2012 2013 2014 2015
Economic Value-Added Market Valued-Added
Analyst Comments: MSFT's ROIC has been falling since 2011, and has fallen below ORCL's ROIC since 2012. This decline is attributed to stable NOPAT while invested capital increases. Though ROIC is falling, it is still significantly higher MSFT's WACC, generating positive EVA. ORCL has outperformed MSFT's ROIC since 2012, though both companies' ROIC's have been in decline. MSFT's growing spread between EVA and MVA has become significant since 2013, and is likely to correct eventually. Declining ROIC and EVA is not ideal for investors, though MSFT is still creating value.
0.0%
5.0%
10.0%
15.0%
20.0%
25.0%
30.0%
35.0%
2011 2012 2013 2014 2015
Return on Invested Capital MSFT ORCL
0%5%
10%15%20%25%30%35%40%45%
2011 2012 2013 2014 2015
Return on Invested Capital Return on Equity
0%
5%
10%
15%
20%
25%
30%
2011 2012 2013 2014 2015
Return on Invested Capital Return on Equity
3. Value Creation and DCF Model MSFT, Page 8 of 23 Copyright Robert A. Weigand, Ph.D., 2016
Long‐Term Growth Rate: Long‐Term Growth Rate:
MSFT Microsoft Corporation 2.0% ORCL Oracle Corporation 2.0%
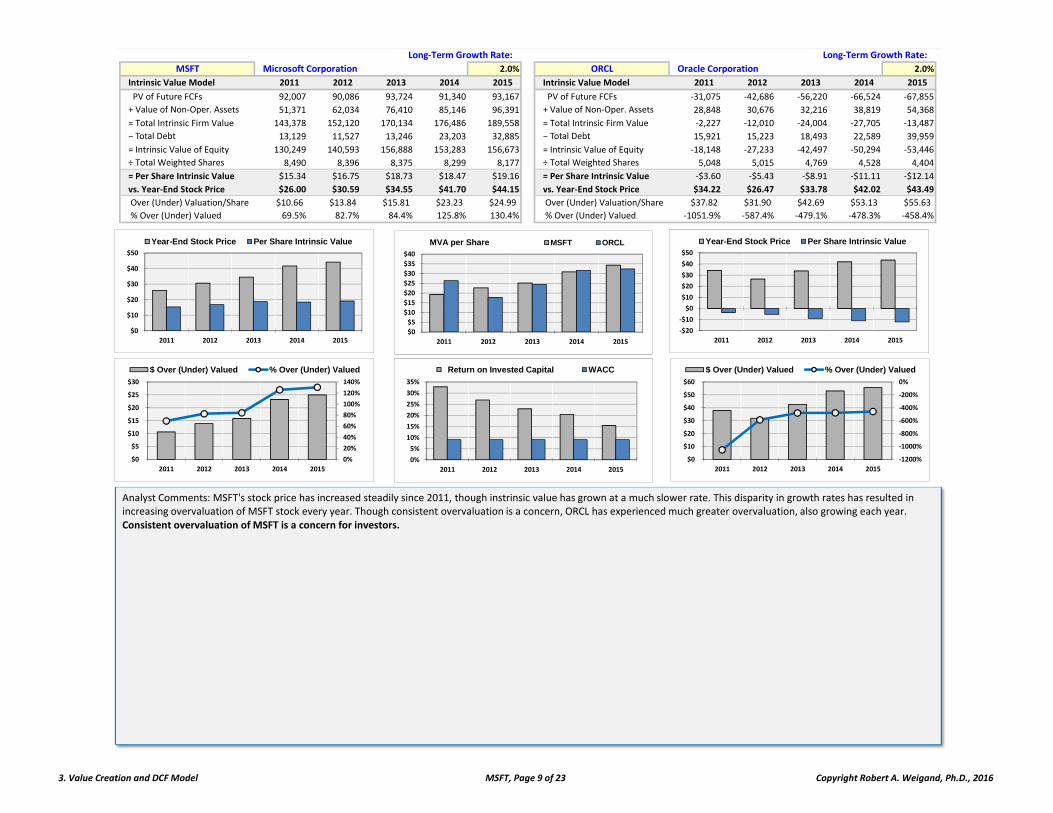
Intrinsic Value Model 2011 2012 2013 2014 2015 Intrinsic Value Model 2011 2012 2013 2014 2015
PV of Future FCFs 92,007 90,086 93,724 91,340 93,167 PV of Future FCFs ‐31,075 ‐42,686 ‐56,220 ‐66,524 ‐67,855
+ Value of Non‐Oper. Assets 51,371 62,034 76,410 85,146 96,391 + Value of Non‐Oper. Assets 28,848 30,676 32,216 38,819 54,368
= Total Intrinsic Firm Value 143,378 152,120 170,134 176,486 189,558 = Total Intrinsic Firm Value ‐2,227 ‐12,010 ‐24,004 ‐27,705 ‐13,487
− Total Debt 13,129 11,527 13,246 23,203 32,885 − Total Debt 15,921 15,223 18,493 22,589 39,959
= Intrinsic Value of Equity 130,249 140,593 156,888 153,283 156,673 = Intrinsic Value of Equity ‐18,148 ‐27,233 ‐42,497 ‐50,294 ‐53,446
÷ Total Weighted Shares 8,490 8,396 8,375 8,299 8,177 ÷ Total Weighted Shares 5,048 5,015 4,769 4,528 4,404
= Per Share Intrinsic Value $15.34 $16.75 $18.73 $18.47 $19.16 = Per Share Intrinsic Value ‐$3.60 ‐$5.43 ‐$8.91 ‐$11.11 ‐$12.14
vs. Year‐End Stock Price $26.00 $30.59 $34.55 $41.70 $44.15 vs. Year‐End Stock Price $34.22 $26.47 $33.78 $42.02 $43.49
Over (Under) Valuation/Share $10.66 $13.84 $15.81 $23.23 $24.99 Over (Under) Valuation/Share $37.82 $31.90 $42.69 $53.13 $55.63
% Over (Under) Valued 69.5% 82.7% 84.4% 125.8% 130.4% % Over (Under) Valued ‐1051.9% ‐587.4% ‐479.1% ‐478.3% ‐458.4%
$0
$10
$20
$30
$40
$50
2011 2012 2013 2014 2015
Year-End Stock Price Per Share Intrinsic Value
0%
20%
40%
60%
80%
100%
120%
140%
$0
$5
$10
$15
$20
$25
$30
2011 2012 2013 2014 2015
$ Over (Under) Valued % Over (Under) Valued
‐$20
‐$10
$0
$10
$20
$30
$40
$50
2011 2012 2013 2014 2015
Year-End Stock Price Per Share Intrinsic Value
‐1200%
‐1000%
‐800%
‐600%
‐400%
‐200%
0%
$0
$10
$20
$30
$40
$50
$60
2011 2012 2013 2014 2015
$ Over (Under) Valued % Over (Under) Valued
$0
$5
$10
$15
$20
$25
$30
$35
$40
2011 2012 2013 2014 2015
MVA per Share MSFT ORCL
Analyst Comments: MSFT's stock price has increased steadily since 2011, though instrinsic value has grown at a much slower rate. This disparity in growth rates has resulted in increasing overvaluation of MSFT stock every year. Though consistent overvaluation is a concern, ORCL has experienced much greater overvaluation, also growing each year. Consistent overvaluation of MSFT is a concern for investors.
0%
5%
10%
15%
20%
25%
30%
35%
2011 2012 2013 2014 2015
Return on Invested Capital WACC
3. Value Creation and DCF Model MSFT, Page 9 of 23 Copyright Robert A. Weigand, Ph.D., 2016
MSFT Microsoft Corporation ORCL Oracle Corporation
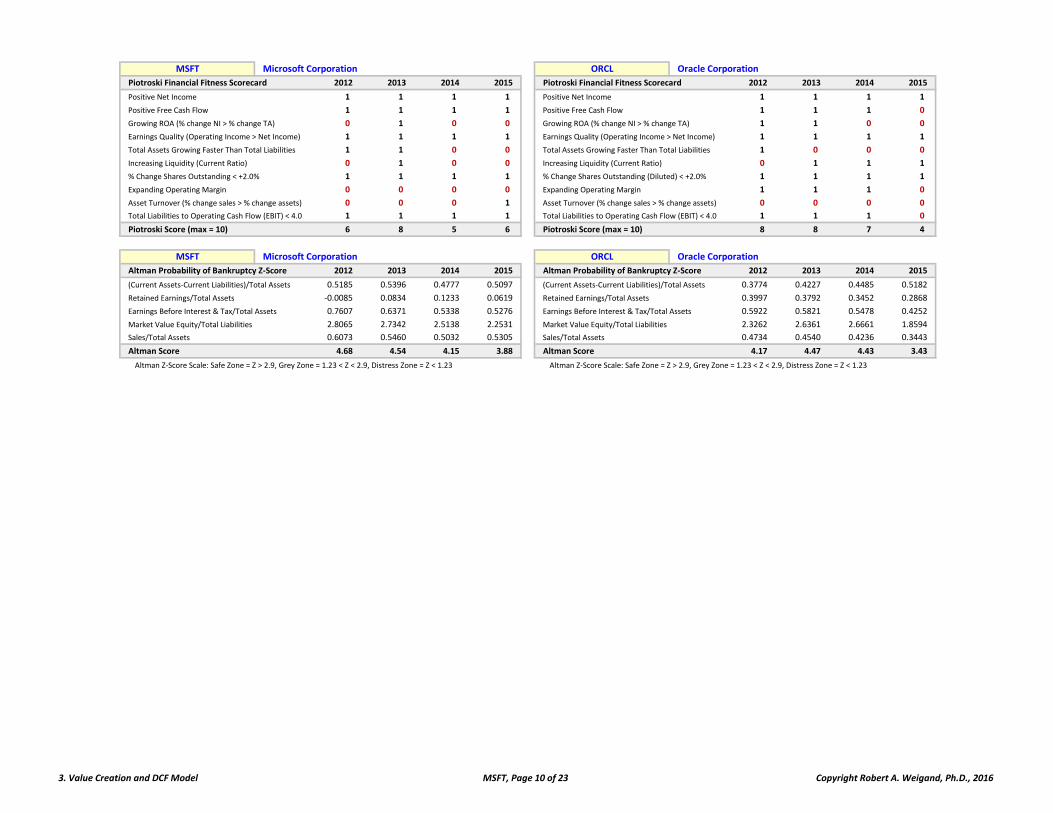
Piotroski Financial Fitness Scorecard 2012 2013 2014 2015 Piotroski Financial Fitness Scorecard 2012 2013 2014 2015
Positive Net Income 1 1 1 1 Positive Net Income 1 1 1 1
Positive Free Cash Flow 1 1 1 1 Positive Free Cash Flow 1 1 1 0
Growing ROA (% change NI > % change TA) 0 1 0 0 Growing ROA (% change NI > % change TA) 1 1 0 0
Earnings Quality (Operating Income > Net Income) 1 1 1 1 Earnings Quality (Operating Income > Net Income) 1 1 1 1
Total Assets Growing Faster Than Total Liabilities 1 1 0 0 Total Assets Growing Faster Than Total Liabilities 1 0 0 0
Increasing Liquidity (Current Ratio) 0 1 0 0 Increasing Liquidity (Current Ratio) 0 1 1 1
% Change Shares Outstanding < +2.0% 1 1 1 1 % Change Shares Outstanding (Diluted) < +2.0% 1 1 1 1
Expanding Operating Margin 0 0 0 0 Expanding Operating Margin 1 1 1 0
Asset Turnover (% change sales > % change assets) 0 0 0 1 Asset Turnover (% change sales > % change assets) 0 0 0 0
Total Liabilities to Operating Cash Flow (EBIT) < 4.0 1 1 1 1 Total Liabilities to Operating Cash Flow (EBIT) < 4.0 1 1 1 0
Piotroski Score (max = 10) 6 8 5 6 Piotroski Score (max = 10) 8 8 7 4
MSFT Microsoft Corporation ORCL Oracle Corporation
Altman Probability of Bankruptcy Z‐Score 2012 2013 2014 2015 Altman Probability of Bankruptcy Z‐Score 2012 2013 2014 2015
(Current Assets‐Current Liabilities)/Total Assets 0.5185 0.5396 0.4777 0.5097 ## (Current Assets‐Current Liabilities)/Total Assets 0.3774 0.4227 0.4485 0.5182
Retained Earnings/Total Assets ‐0.0085 0.0834 0.1233 0.0619 ## Retained Earnings/Total Assets 0.3997 0.3792 0.3452 0.2868
Earnings Before Interest & Tax/Total Assets 0.7607 0.6371 0.5338 0.5276 ## Earnings Before Interest & Tax/Total Assets 0.5922 0.5821 0.5478 0.4252
Market Value Equity/Total Liabilities 2.8065 2.7342 2.5138 2.2531 ## Market Value Equity/Total Liabilities 2.3262 2.6361 2.6661 1.8594
Sales/Total Assets 0.6073 0.5460 0.5032 0.5305 ## Sales/Total Assets 0.4734 0.4540 0.4236 0.3443
Altman Score 4.68 4.54 4.15 3.88 Altman Score 4.17 4.47 4.43 3.43
Altman Z‐Score Scale: Safe Zone = Z > 2.9, Grey Zone = 1.23 < Z < 2.9, Distress Zone = Z < 1.23 Altman Z‐Score Scale: Safe Zone = Z > 2.9, Grey Zone = 1.23 < Z < 2.9, Distress Zone = Z < 1.23
3. Value Creation and DCF Model MSFT, Page 10 of 23 Copyright Robert A. Weigand, Ph.D., 2016
30‐Jun‐11 30‐Jun‐12 30‐Jun‐13 30‐Jun‐14 30‐Jun‐15
Microsoft Corporation MSFT Information Technology Report Date:
Average
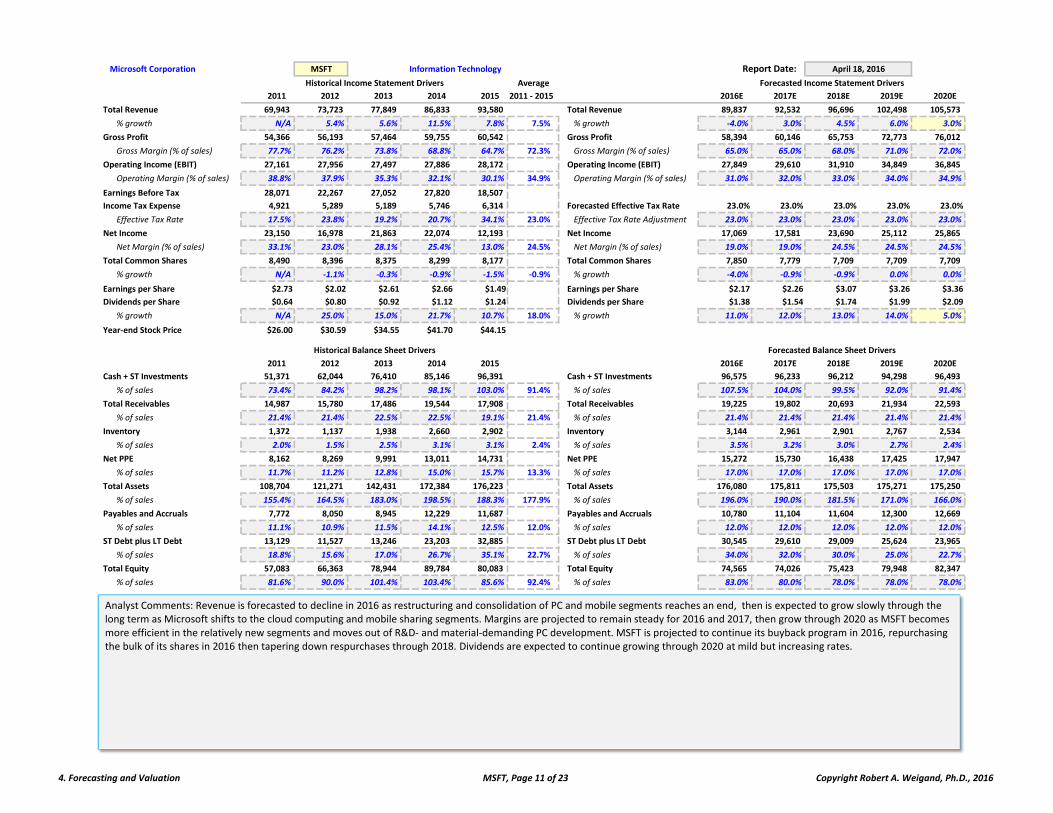
2011 2012 2013 2014 2015 2011 ‐ 2015 2016E 2017E 2018E 2019E 2020E
Total Revenue 69,943 73,723 77,849 86,833 93,580 Total Revenue 89,837 92,532 96,696 102,498 105,573
% growth N/A 5.4% 5.6% 11.5% 7.8% 7.5% % growth ‐4.0% 3.0% 4.5% 6.0% 3.0%
Gross Profit 54,366 56,193 57,464 59,755 60,542 Gross Profit 58,394 60,146 65,753 72,773 76,012
Gross Margin (% of sales) 77.7% 76.2% 73.8% 68.8% 64.7% 72.3% Gross Margin (% of sales) 65.0% 65.0% 68.0% 71.0% 72.0%
Operating Income (EBIT) 27,161 27,956 27,497 27,886 28,172 Operating Income (EBIT) 27,849 29,610 31,910 34,849 36,845
Operating Margin (% of sales) 38.8% 37.9% 35.3% 32.1% 30.1% 34.9% Operating Margin (% of sales) 31.0% 32.0% 33.0% 34.0% 34.9%
Earnings Before Tax 28,071 22,267 27,052 27,820 18,507
Income Tax Expense 4,921 5,289 5,189 5,746 6,314 Forecasted Effective Tax Rate 23.0% 23.0% 23.0% 23.0% 23.0%
Effective Tax Rate 17.5% 23.8% 19.2% 20.7% 34.1% 23.0% Effective Tax Rate Adjustment 23.0% 23.0% 23.0% 23.0% 23.0%
Net Income 23,150 16,978 21,863 22,074 12,193 Net Income 17,069 17,581 23,690 25,112 25,865
Net Margin (% of sales) 33.1% 23.0% 28.1% 25.4% 13.0% 24.5% Net Margin (% of sales) 19.0% 19.0% 24.5% 24.5% 24.5%
Total Common Shares 8,490 8,396 8,375 8,299 8,177 Total Common Shares 7,850 7,779 7,709 7,709 7,709
% growth N/A ‐1.1% ‐0.3% ‐0.9% ‐1.5% ‐0.9% % growth ‐4.0% ‐0.9% ‐0.9% 0.0% 0.0%
Earnings per Share $2.73 $2.02 $2.61 $2.66 $1.49 Earnings per Share $2.17 $2.26 $3.07 $3.26 $3.36
Dividends per Share $0.64 $0.80 $0.92 $1.12 $1.24 Dividends per Share $1.38 $1.54 $1.74 $1.99 $2.09
% growth N/A 25.0% 15.0% 21.7% 10.7% 18.0% % growth 11.0% 12.0% 13.0% 14.0% 5.0%
Year‐end Stock Price $26.00 $30.59 $34.55 $41.70 $44.15996 997 998 999 1000 996 997 998 999 1000
2011 2012 2013 2014 2015 2016E 2017E 2018E 2019E 2020E
Cash + ST Investments 51,371 62,044 76,410 85,146 96,391 Cash + ST Investments 96,575 96,233 96,212 94,298 96,493
% of sales 73.4% 84.2% 98.2% 98.1% 103.0% 91.4% % of sales 107.5% 104.0% 99.5% 92.0% 91.4%
Total Receivables 14,987 15,780 17,486 19,544 17,908 Total Receivables 19,225 19,802 20,693 21,934 22,593
% of sales 21.4% 21.4% 22.5% 22.5% 19.1% 21.4% % of sales 21.4% 21.4% 21.4% 21.4% 21.4%
Inventory 1,372 1,137 1,938 2,660 2,902 Inventory 3,144 2,961 2,901 2,767 2,534
% of sales 2.0% 1.5% 2.5% 3.1% 3.1% 2.4% % of sales 3.5% 3.2% 3.0% 2.7% 2.4%
Net PPE 8,162 8,269 9,991 13,011 14,731 Net PPE 15,272 15,730 16,438 17,425 17,947
% of sales 11.7% 11.2% 12.8% 15.0% 15.7% 13.3% % of sales 17.0% 17.0% 17.0% 17.0% 17.0%
Total Assets 108,704 121,271 142,431 172,384 176,223 Total Assets 176,080 175,811 175,503 175,271 175,250
% of sales 155.4% 164.5% 183.0% 198.5% 188.3% 177.9% % of sales 196.0% 190.0% 181.5% 171.0% 166.0%
Payables and Accruals 7,772 8,050 8,945 12,229 11,687 Payables and Accruals 10,780 11,104 11,604 12,300 12,669
% of sales 11.1% 10.9% 11.5% 14.1% 12.5% 12.0% % of sales 12.0% 12.0% 12.0% 12.0% 12.0%
ST Debt plus LT Debt 13,129 11,527 13,246 23,203 32,885 ST Debt plus LT Debt 30,545 29,610 29,009 25,624 23,965
% of sales 18.8% 15.6% 17.0% 26.7% 35.1% 22.7% % of sales 34.0% 32.0% 30.0% 25.0% 22.7%
Total Equity 57,083 66,363 78,944 89,784 80,083 Total Equity 74,565 74,026 75,423 79,948 82,347
% of sales 81.6% 90.0% 101.4% 103.4% 85.6% 92.4% % of sales 83.0% 80.0% 78.0% 78.0% 78.0%
April 18, 2016
Forecasted Income Statement Drivers
Forecasted Balance Sheet Drivers
Historical Income Statement Drivers
Historical Balance Sheet Drivers
Analyst Comments: Revenue is forecasted to decline in 2016 as restructuring and consolidation of PC and mobile segments reaches an end, then is expected to grow slowly through the long term as Microsoft shifts to the cloud computing and mobile sharing segments. Margins are projected to remain steady for 2016 and 2017, then grow through 2020 as MSFT becomes more efficient in the relatively new segments and moves out of R&D‐ and material‐demanding PC development. MSFT is projected to continue its buyback program in 2016, repurchasing the bulk of its shares in 2016 then tapering down respurchases through 2018. Dividends are expected to continue growing through 2020 at mild but increasing rates.
4. Forecasting and Valuation MSFT, Page 11 of 23 Copyright Robert A. Weigand, Ph.D., 2016
Microsoft Corporation Microsoft Corporation
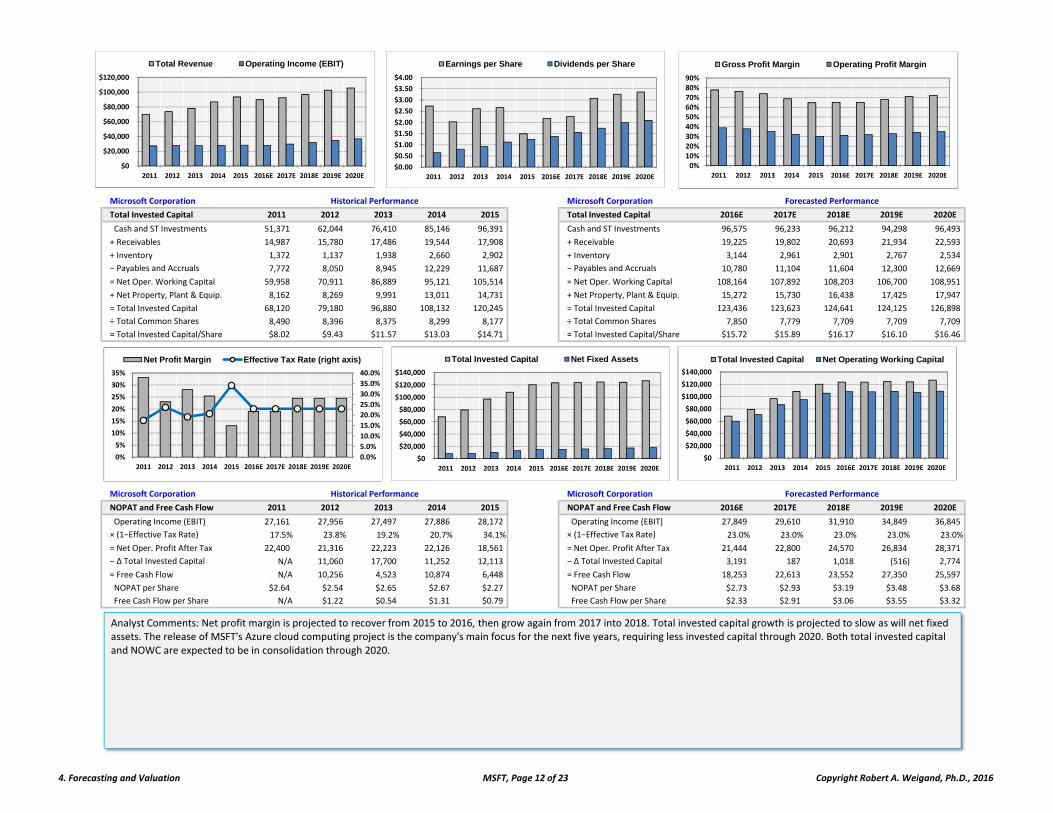
Total Invested Capital 2011 2012 2013 2014 2015 Total Invested Capital 2016E 2017E 2018E 2019E 2020E
Cash and ST Investments 51,371 62,044 76,410 85,146 96,391 Cash and ST Investments 96,575 96,233 96,212 94,298 96,493
+ Receivables 14,987 15,780 17,486 19,544 17,908 + Receivable 19,225 19,802 20,693 21,934 22,593
+ Inventory 1,372 1,137 1,938 2,660 2,902 + Inventory 3,144 2,961 2,901 2,767 2,534
− Payables and Accruals 7,772 8,050 8,945 12,229 11,687 − Payables and Accruals 10,780 11,104 11,604 12,300 12,669
= Net Oper. Working Capital 59,958 70,911 86,889 95,121 105,514 = Net Oper. Working Capital 108,164 107,892 108,203 106,700 108,951
+ Net Property, Plant & Equip. 8,162 8,269 9,991 13,011 14,731 + Net Property, Plant & Equip. 15,272 15,730 16,438 17,425 17,947
= Total Invested Capital 68,120 79,180 96,880 108,132 120,245 = Total Invested Capital 123,436 123,623 124,641 124,125 126,898
÷ Total Common Shares 8,490 8,396 8,375 8,299 8,177 ÷ Total Common Shares 7,850 7,779 7,709 7,709 7,709
= Total Invested Capital/Share $8.02 $9.43 $11.57 $13.03 $14.71 = Total Invested Capital/Share $15.72 $15.89 $16.17 $16.10 $16.46
Microsoft Corporation Microsoft Corporation
NOPAT and Free Cash Flow 2011 2012 2013 2014 2015 NOPAT and Free Cash Flow 2016E 2017E 2018E 2019E 2020E
Operating Income (EBIT) 27,161 27,956 27,497 27,886 28,172 Operating Income (EBIT) 27,849 29,610 31,910 34,849 36,845
× (1−Effective Tax Rate) 17.5% 23.8% 19.2% 20.7% 34.1% × (1−Effective Tax Rate) 23.0% 23.0% 23.0% 23.0% 23.0%
= Net Oper. Profit After Tax 22,400 21,316 22,223 22,126 18,561 = Net Oper. Profit After Tax 21,444 22,800 24,570 26,834 28,371
− ∆ Total Invested Capital N/A 11,060 17,700 11,252 12,113 − ∆ Total Invested Capital 3,191 187 1,018 (516) 2,774
= Free Cash Flow N/A 10,256 4,523 10,874 6,448 = Free Cash Flow 18,253 22,613 23,552 27,350 25,597
NOPAT per Share $2.64 $2.54 $2.65 $2.67 $2.27 NOPAT per Share $2.73 $2.93 $3.19 $3.48 $3.68
Free Cash Flow per Share N/A $1.22 $0.54 $1.31 $0.79 Free Cash Flow per Share $2.33 $2.91 $3.06 $3.55 $3.32
Historical Performance Forecasted Performance
Historical Performance Forecasted Performance
Analyst Comments: Net profit margin is projected to recover from 2015 to 2016, then grow again from 2017 into 2018. Total invested capital growth is projected to slow as will net fixed assets. The release of MSFT's Azure cloud computing project is the company's main focus for the next five years, requiring less invested capital through 2020. Both total invested capital and NOWC are expected to be in consolidation through 2020.
$0
$20,000
$40,000
$60,000
$80,000
$100,000
$120,000
$140,000
2011 2012 2013 2014 2015 2016E 2017E 2018E 2019E 2020E
Total Invested Capital Net Fixed Assets
$0
$20,000
$40,000
$60,000
$80,000
$100,000
$120,000
2011 2012 2013 2014 2015 2016E 2017E 2018E 2019E 2020E
Total Revenue Operating Income (EBIT)
$0.00
$0.50
$1.00
$1.50
$2.00
$2.50
$3.00
$3.50
$4.00
2011 2012 2013 2014 2015 2016E 2017E 2018E 2019E 2020E
Earnings per Share Dividends per Share
0%10%20%30%40%50%60%70%80%90%
2011 2012 2013 2014 2015 2016E 2017E 2018E 2019E 2020E
Gross Profit Margin Operating Profit Margin
0.0%
5.0%
10.0%
15.0%
20.0%
25.0%
30.0%
35.0%
40.0%
0%
5%
10%
15%
20%
25%
30%
35%
2011 2012 2013 2014 2015 2016E 2017E 2018E 2019E 2020E
Net Profit Margin Effective Tax Rate (right axis)
$0
$20,000
$40,000
$60,000
$80,000
$100,000
$120,000
$140,000
2011 2012 2013 2014 2015 2016E 2017E 2018E 2019E 2020E
Total Invested Capital Net Operating Working Capital
4. Forecasting and Valuation MSFT, Page 12 of 23 Copyright Robert A. Weigand, Ph.D., 2016
Microsoft Corporation
Cost of Capital 2015 Weight % Cost Weighted % Microsoft Corporation
Equity Capitalization $361,015 91.7% 9.584% 8.784%
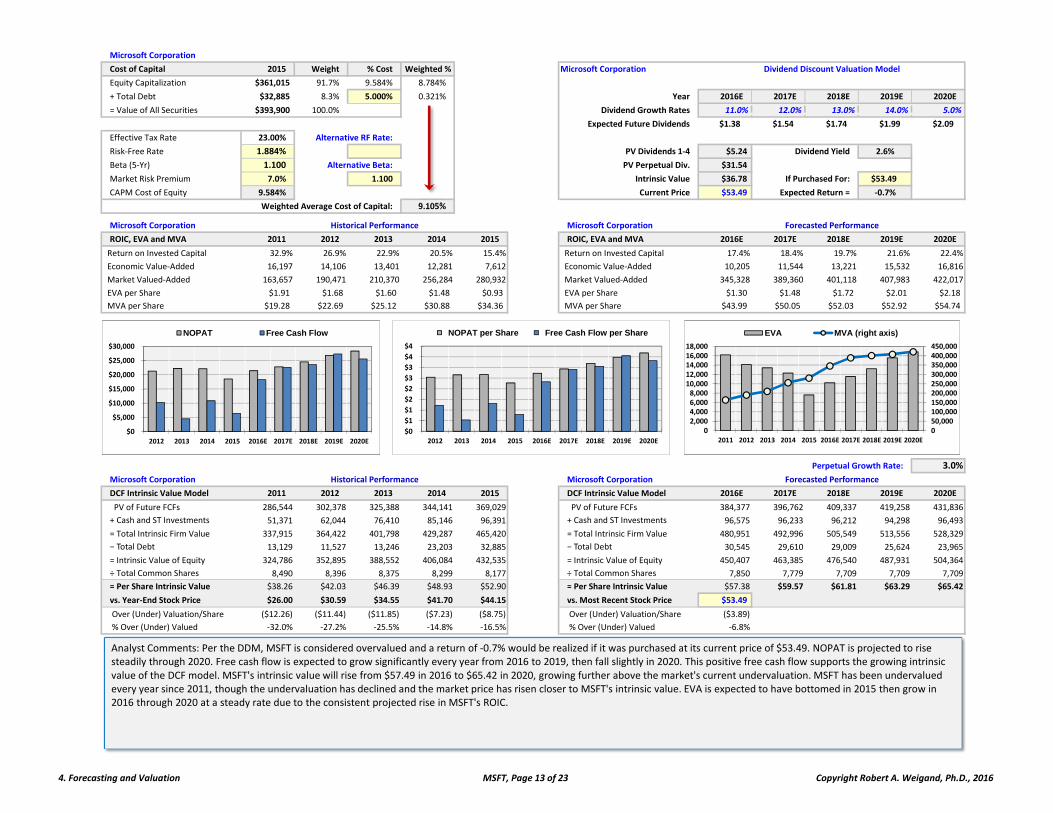
+ Total Debt $32,885 8.3% 5.000% 0.321% Year 2016E 2017E 2018E 2019E 2020E
= Value of All Securities $393,900 100.0% Dividend Growth Rates 11.0% 12.0% 13.0% 14.0% 5.0%
Expected Future Dividends $1.38 $1.54 $1.74 $1.99 $2.09
Effective Tax Rate 23.00% Alternative RF Rate:
Risk‐Free Rate 1.884% 1.884% PV Dividends 1‐4 $5.24 Dividend Yield 2.6%
Beta (5‐Yr) 1.100 Alternative Beta: 0.96745 PV Perpetual Div. $31.54
Market Risk Premium 7.0% 1.100 Intrinsic Value $36.78 If Purchased For: $53.49
CAPM Cost of Equity 9.584% Current Price $53.49 Expected Return = ‐0.7%
Weighted Average Cost of Capital: 9.105% ($53.49) $1.38 $1.54 $1.74 $47.47 $45.499.105% 9.105% 9.105% 9.105% 9.105% 9.105% 9.105% 9.105% 9.105% 9.105%
Microsoft Corporation Microsoft Corporation
ROIC, EVA and MVA 2011 2012 2013 2014 2015 ROIC, EVA and MVA 2016E 2017E 2018E 2019E 2020E
Return on Invested Capital 32.9% 26.9% 22.9% 20.5% 15.4% Return on Invested Capital 17.4% 18.4% 19.7% 21.6% 22.4%
Economic Value‐Added 16,197 14,106 13,401 12,281 7,612 Economic Value‐Added 10,205 11,544 13,221 15,532 16,816
Market Valued‐Added 163,657 190,471 210,370 256,284 280,932 Market Valued‐Added 345,328 389,360 401,118 407,983 422,017
EVA per Share $1.91 $1.68 $1.60 $1.48 $0.93 EVA per Share $1.30 $1.48 $1.72 $2.01 $2.18
MVA per Share $19.28 $22.69 $25.12 $30.88 $34.36 MVA per Share $43.99 $50.05 $52.03 $52.92 $54.74
Perpetual Growth Rate: 3.0%
Microsoft Corporation Microsoft Corporation
DCF Intrinsic Value Model 2011 2012 2013 2014 2015 DCF Intrinsic Value Model 2016E 2017E 2018E 2019E 2020E
PV of Future FCFs 286,544 302,378 325,388 344,141 369,029 PV of Future FCFs 384,377 396,762 409,337 419,258 431,836
+ Cash and ST Investments 51,371 62,044 76,410 85,146 96,391 + Cash and ST Investments 96,575 96,233 96,212 94,298 96,493
= Total Intrinsic Firm Value 337,915 364,422 401,798 429,287 465,420 = Total Intrinsic Firm Value 480,951 492,996 505,549 513,556 528,329
− Total Debt 13,129 11,527 13,246 23,203 32,885 − Total Debt 30,545 29,610 29,009 25,624 23,965
= Intrinsic Value of Equity 324,786 352,895 388,552 406,084 432,535 = Intrinsic Value of Equity 450,407 463,385 476,540 487,931 504,364
÷ Total Common Shares 8,490 8,396 8,375 8,299 8,177 ÷ Total Common Shares 7,850 7,779 7,709 7,709 7,709
= Per Share Intrinsic Value $38.26 $42.03 $46.39 $48.93 $52.90 = Per Share Intrinsic Value $57.38 $59.57 $61.81 $63.29 $65.42
vs. Year‐End Stock Price $26.00 $30.59 $34.55 $41.70 $44.15 vs. Most Recent Stock Price $53.49
Over (Under) Valuation/Share ($12.26) ($11.44) ($11.85) ($7.23) ($8.75) Over (Under) Valuation/Share ($3.89)
% Over (Under) Valued ‐32.0% ‐27.2% ‐25.5% ‐14.8% ‐16.5% % Over (Under) Valued ‐6.8%
Historical Performance Forecasted Performance
Dividend Discount Valuation Model
Historical Performance Forecasted Performance
050,000100,000150,000200,000250,000300,000350,000400,000450,000
02,0004,0006,0008,00010,00012,00014,00016,00018,000
2011 2012 2013 2014 2015 2016E 2017E 2018E 2019E 2020E
EVA MVA (right axis)
Analyst Comments: Per the DDM, MSFT is considered overvalued and a return of ‐0.7% would be realized if it was purchased at its current price of $53.49. NOPAT is projected to rise steadily through 2020. Free cash flow is expected to grow significantly every year from 2016 to 2019, then fall slightly in 2020. This positive free cash flow supports the growing intrinsic value of the DCF model. MSFT's intrinsic value will rise from $57.49 in 2016 to $65.42 in 2020, growing further above the market's current undervaluation. MSFT has been undervalued every year since 2011, though the undervaluation has declined and the market price has risen closer to MSFT's intrinsic value. EVA is expected to have bottomed in 2015 then grow in 2016 through 2020 at a steady rate due to the consistent projected rise in MSFT's ROIC.
$0
$5,000
$10,000
$15,000
$20,000
$25,000
$30,000
2012 2013 2014 2015 2016E 2017E 2018E 2019E 2020E
NOPAT Free Cash Flow
$0
$1
$1
$2
$2
$3
$3
$4
$4
2012 2013 2014 2015 2016E 2017E 2018E 2019E 2020E
NOPAT per Share Free Cash Flow per Share
4. Forecasting and Valuation MSFT, Page 13 of 23 Copyright Robert A. Weigand, Ph.D., 2016
Microsoft Corporation Microsoft Corporation
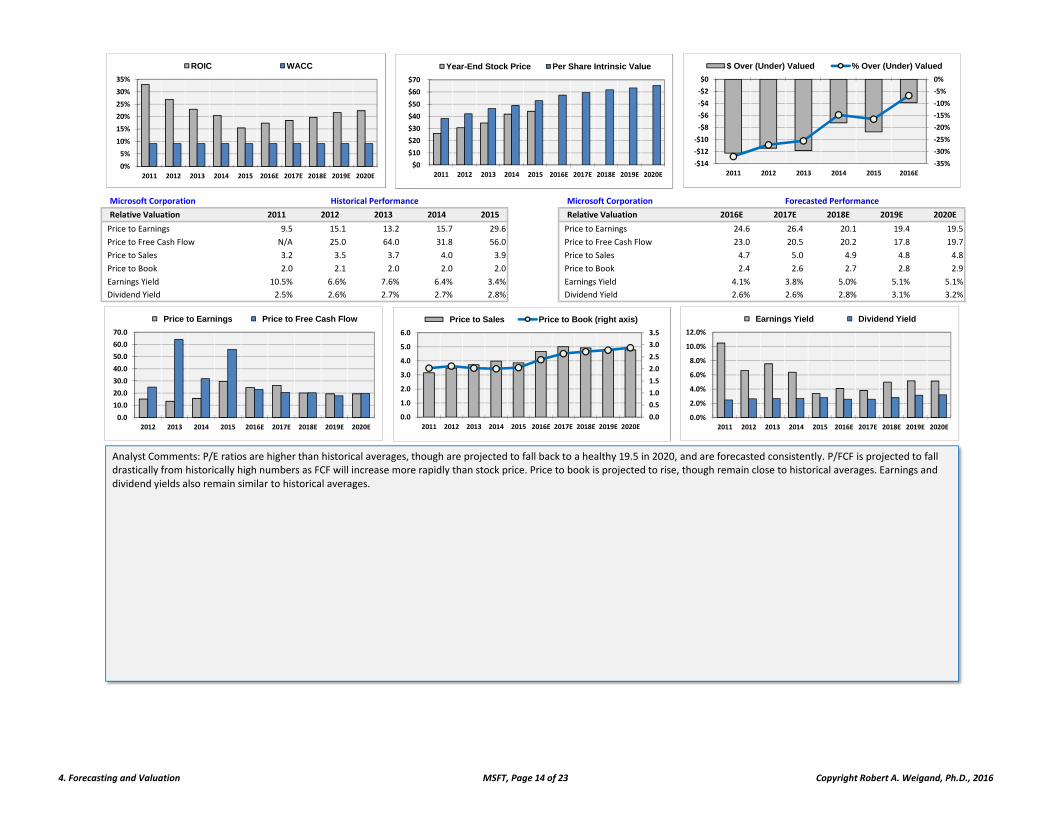
Relative Valuation 2011 2012 2013 2014 2015 Relative Valuation 2016E 2017E 2018E 2019E 2020E
Price to Earnings 9.5 15.1 13.2 15.7 29.6 Price to Earnings 24.6 26.4 20.1 19.4 19.5
Price to Free Cash Flow N/A 25.0 64.0 31.8 56.0 Price to Free Cash Flow 23.0 20.5 20.2 17.8 19.7
Price to Sales 3.2 3.5 3.7 4.0 3.9 Price to Sales 4.7 5.0 4.9 4.8 4.8
Price to Book 2.0 2.1 2.0 2.0 2.0 Price to Book 2.4 2.6 2.7 2.8 2.9
Earnings Yield 10.5% 6.6% 7.6% 6.4% 3.4% Earnings Yield 4.1% 3.8% 5.0% 5.1% 5.1%
Dividend Yield 2.5% 2.6% 2.7% 2.7% 2.8% Dividend Yield 2.6% 2.6% 2.8% 3.1% 3.2%
Historical Performance Forecasted Performance
Analyst Comments: P/E ratios are higher than historical averages, though are projected to fall back to a healthy 19.5 in 2020, and are forecasted consistently. P/FCF is projected to fall drastically from historically high numbers as FCF will increase more rapidly than stock price. Price to book is projected to rise, though remain close to historical averages. Earnings and dividend yields also remain similar to historical averages.
0%
5%
10%
15%
20%
25%
30%
35%
2011 2012 2013 2014 2015 2016E 2017E 2018E 2019E 2020E
ROIC WACC
$0
$10
$20
$30
$40
$50
$60
$70
2011 2012 2013 2014 2015 2016E 2017E 2018E 2019E 2020E
Year-End Stock Price Per Share Intrinsic Value
‐35%
‐30%
‐25%
‐20%
‐15%
‐10%
‐5%
0%
‐$14
‐$12
‐$10
‐$8
‐$6
‐$4
‐$2
$0
2011 2012 2013 2014 2015 2016E
$ Over (Under) Valued % Over (Under) Valued
0.0
10.0
20.0
30.0
40.0
50.0
60.0
70.0
2012 2013 2014 2015 2016E 2017E 2018E 2019E 2020E
Price to Earnings Price to Free Cash Flow
0.0%
2.0%
4.0%
6.0%
8.0%
10.0%
12.0%
2011 2012 2013 2014 2015 2016E 2017E 2018E 2019E 2020E
Earnings Yield Dividend Yield
0.0
0.5
1.0
1.5
2.0
2.5
3.0
3.5
0.0
1.0
2.0
3.0
4.0
5.0
6.0
2011 2012 2013 2014 2015 2016E 2017E 2018E 2019E 2020E
Price to Sales Price to Book (right axis)
4. Forecasting and Valuation MSFT, Page 14 of 23 Copyright Robert A. Weigand, Ph.D., 2016