Embed Size (px)
Citation preview
MULTICHANNEL HIGH-RESOLUTION ELECTROCARDIOGRAPH DEVELOPED IN MATLAB
S. Karas, E. Hebláková, V. Rosik, M. Tyšler
Institute of Measurement Science, Slovak Academy of Sciences, Bratislava
Abstract
High resolution measurement of ECG signals is necessary prerequisite for advanced diagnostic methods of various cardiovascular diseases. Diagnostic information contained in surface potential maps computed from multi-lead ECG signals is much more detailed than from standard 12-lead ECG or Frank VCG lead system. For measurement of required ECG signals with necessary quality we designed special multichannel electrocardiograph (ProCardio-8). The system is conceived as a virtual instrument with an external measuring unit controlled by a microprocessor and connected to host PC with running application software. The system can be configured according to various scenarios (standard and/or mapping leads or their combinations, different visualization options of signals during the measurement, etc.) with maximum sampling frequency of 2 kHz and with A/D resolution of 16 to 22 bits. Novelty of the approach presented in this paper is that MATLAB version 7, one of the most widely used high level programming tools, is applied for fast real-time transmission of large amount of data over the USB channel between the ECG acquisition unit and the host PC. Measuring software is based on a generic DLL calling interface with the USB-FIFO driver provided by the vendor of communication chip (FTDI Chip Ltd.). Developed application software that runs in the user’s PC can be deployed as a stand-alone application on any computer with Win/XP OS after compilation. Its Architecture is modular and consists of a several main modules. Some important aspects concerned with measuring system and each module will be discussed in detail in this paper. Special attention will be devoted to program for testing of electrode contacts and to the measuring module that controls the patient terminal and real time data acquisition, visualization and storage.
1 Introduction Creating, debugging and consecutive testing of real-time measuring software is very difficult
and time consuming process in many cases, especially in so sensitive field as medical sciences [1]. The classical approach is to develop an application source code in C++ language that certainly takes a large amount of programmer’s time and labour. One possible way how to simplify and accelerate this process is to use the MATLAB environment and its supporting background for communication with external hardware. This concept offers also the opportunity to utilize all digital signal processing and analysis functions included in MATLAB for processing of data stream during acquisition and for subsequent off-line processing and analysis of measured ECG signals.
2 ProCardio-8 high-resolution electrocardiograph Based on the previous experiences with multichannel measuring systems [2] we developed
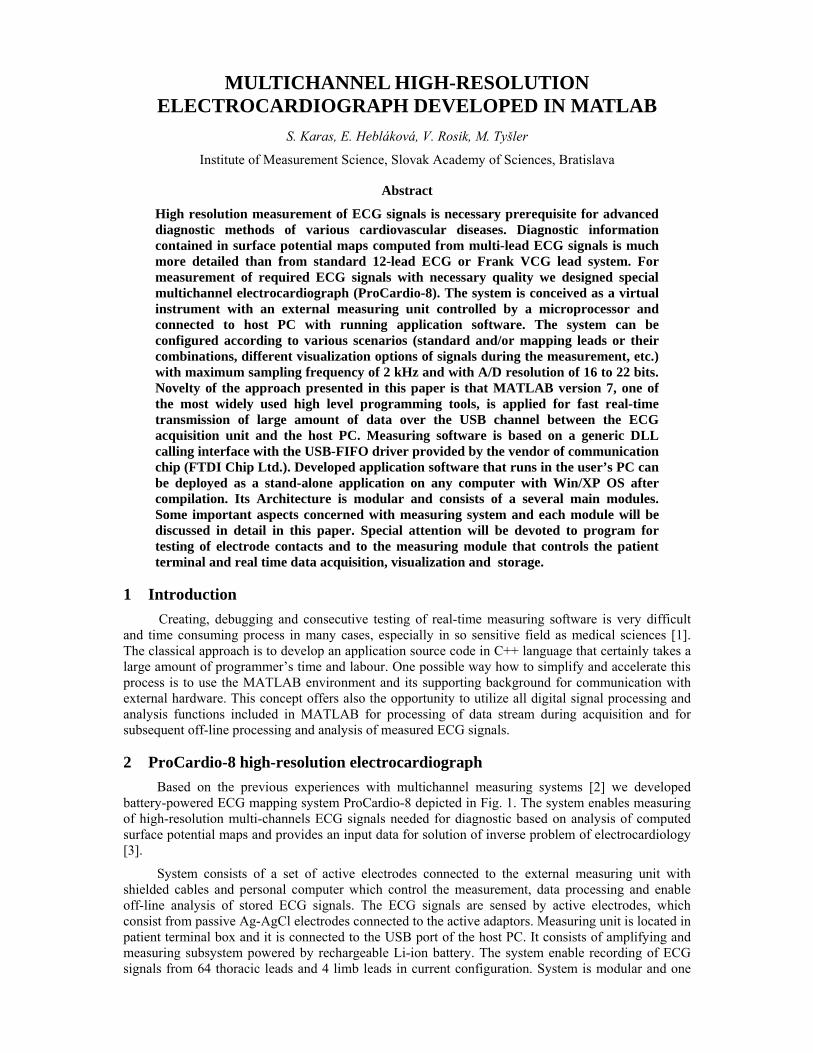
battery-powered ECG mapping system ProCardio-8 depicted in Fig. 1. The system enables measuring of high-resolution multi-channels ECG signals needed for diagnostic based on analysis of computed surface potential maps and provides an input data for solution of inverse problem of electrocardiology [3].
System consists of a set of active electrodes connected to the external measuring unit with shielded cables and personal computer which control the measurement, data processing and enable off-line analysis of stored ECG signals. The ECG signals are sensed by active electrodes, which consist from passive Ag-AgCl electrodes connected to the active adaptors. Measuring unit is located in patient terminal box and it is connected to the USB port of the host PC. It consists of amplifying and measuring subsystem powered by rechargeable Li-ion battery. The system enable recording of ECG signals from 64 thoracic leads and 4 limb leads in current configuration. System is modular and one
standard input module includes 16 analog channels connected to two robust 24-pins Centronix connectors. Each analog channel enables us to measure one ECG signal. One 4-channels input module is used to record signals from R, L, F leads. To minimize the common mode signal, an active neutralization of the patient using a DRL (driven right leg) electrode is employed and all signals are measured and stored to hard-disk of host PC relatively to a CMS (common mode sense) electrode that should be placed the way that the overall noise is minimized [4]. Each channel is equipped with DC-coupled ECG amplifier and 22-bit σ-∆ /D converter (Analog Devices AD7716). Sampling frequency can be set between 125 and 2000 Hz/channel.
Figure 1: Multichannel high-resolution electrocardiograph ProCardio-8.
The data acquisition system is controlled by a MB96F348 Fujitsu microprocessor which scans data from sampled analog channels and sends it via serial channel to connected host PC. Selection of measured channels and subsequent formatting of digitalized data with set length of word is controlled by the connected host PC. For control of measuring unit and its communication with the connected PC, four serial UART channels and DMA controller are used. Connection of measuring system with the host PC is realized with USB FIFO chip (FT245R from FTDI Chip Ltd.) and provides bidirectional transfer of data with speed up to 1 MB/s.
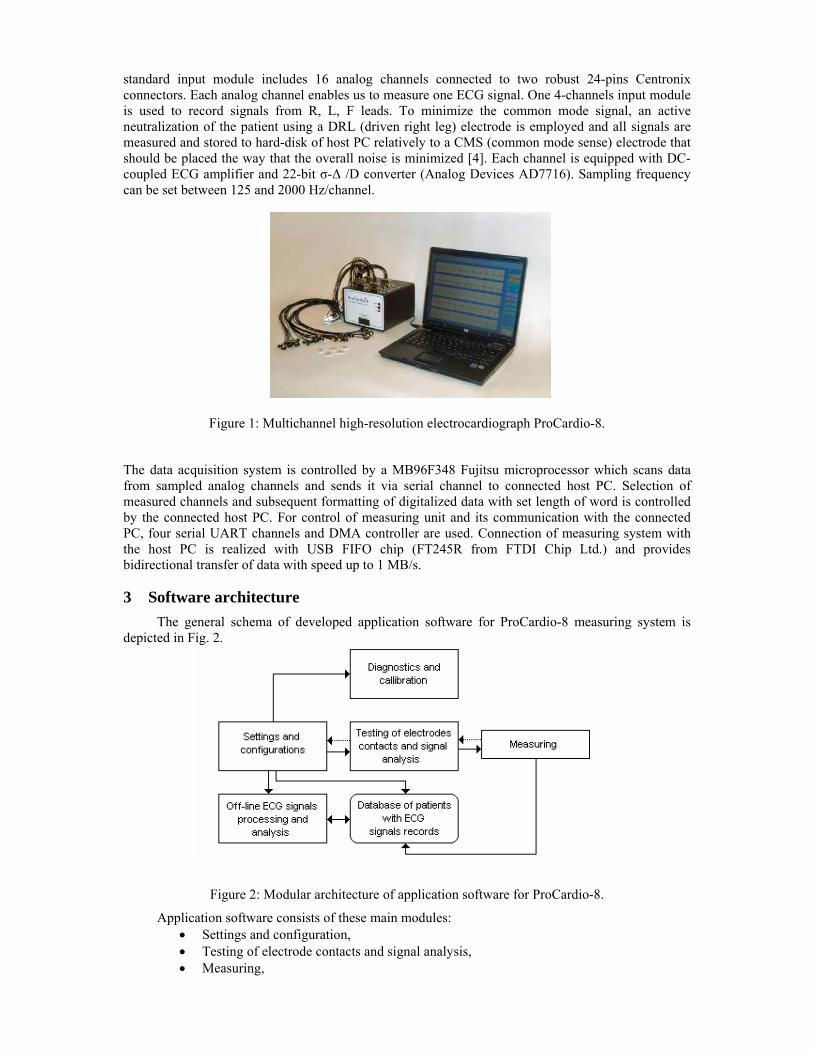
3 Software architecture The general schema of developed application software for ProCardio-8 measuring system is
depicted in Fig. 2.
Figure 2: Modular architecture of application software for ProCardio-8.
Application software consists of these main modules: • Settings and configuration, • Testing of electrode contacts and signal analysis, • Measuring,

• Database of patients with ECG signals records, • Off-line ECG signals processing and analysis.
The settings and configurations module enables to user set parameters of system which are divided to following subcategories: Data acquisition, ECG monitoring, EGC visualization, ECG processing, Mapping, etc. Parameters define setting of various aspects of system from color setting of graphical objects to configuration of measurement and subsequent off-line analysis of measured ECG signals. Parameters of each user are stored separately and loaded after logging in.
The testing of electrodes contacts and signal analysis is module working before each measurement of ECG signals from particular patient. Module is used to measurement and signalization of polarization voltages from each electrode-skin interface during loading of electrodes on patient thorax. Together with such a control of electrode contacts the ECG signal from each channel is analyzed behind the scene. Information obtained by this way is used in subsequent configuration of measuring module before starting the measurement.
The measuring module consists of functions which dynamically create the graphical user interface, low-level function for communication with USB FIFO Chip, functions for configurations of measuring unit, functions for acquirement of data stream out of measuring unit, etc. This module programs microprocessor of the measuring unit according to parameters obtained from parametric file set by the user, transfer data stream from the USB FIFO Chip to buffer of the USB port of the connected host PC, format raw data to samples of ECG signals, visualize of measuring data (signals, or computed leads) on PC screen, store the data to hard-drive etc.
The database of patients includes patient-specific folders containing patient cards, measured and processed signals.
The diagnostic and callibration module is designed to immediately test the functionality of each external command of microprocessor. The measuring unit is configured and controlled by using these external commands. This option is very useful especially in the case when the system doesn’t run properly. There is also a possibility to start measurement for particular measuring module (each module consists of 16 channels with exemption of the first module) and measured data are stored and immediately analyzed. From analysis of these data the measuring system can be calibrated.
The off-line ECG signals processing and analysis module enable the user to work with stored ECG signals of each patient directly after mesurement. Typical tasks realized in this module are: preprocessing (filtrations, baselines wandering corrections), visualization, searching for the QRS complexes, computation of surface potential maps from measured ECG signals, etc. This module is still under development.
3.1 Concept of measuring task in ProCardio-8 During setting the system to configuration requested by the user, global system configuration
variables are updated and could be saved for next sessions. System configuration files are loaded immediately after the start of ProCardio-8 application as .mat files. These files are divided into four groups:
• Parameters for measurement, • Parameters of visualization, • Parameters of processing, • System parameters.
Group of measurement parameters contains the information concerning the electrode contacts testing function and subsequent measurement function. Use of these parametric files is in the system configuration before every testing loop. After successful test results (in case when the test duration has been sufficiently long for analysis of acquired signals and no errors occurred), the testing loop is stopped by the user. Testing module is terminated and measuring module is opened with configuration obtained from system configuration files and from data samples acquired during signal analysis. The sequence of calling the test of electrode contacts, signal analysis module and the measuring module with passing the parameters between them and starting particular functions with configurations according to the user request is called measuring task and it is depicted in Fig. 3.
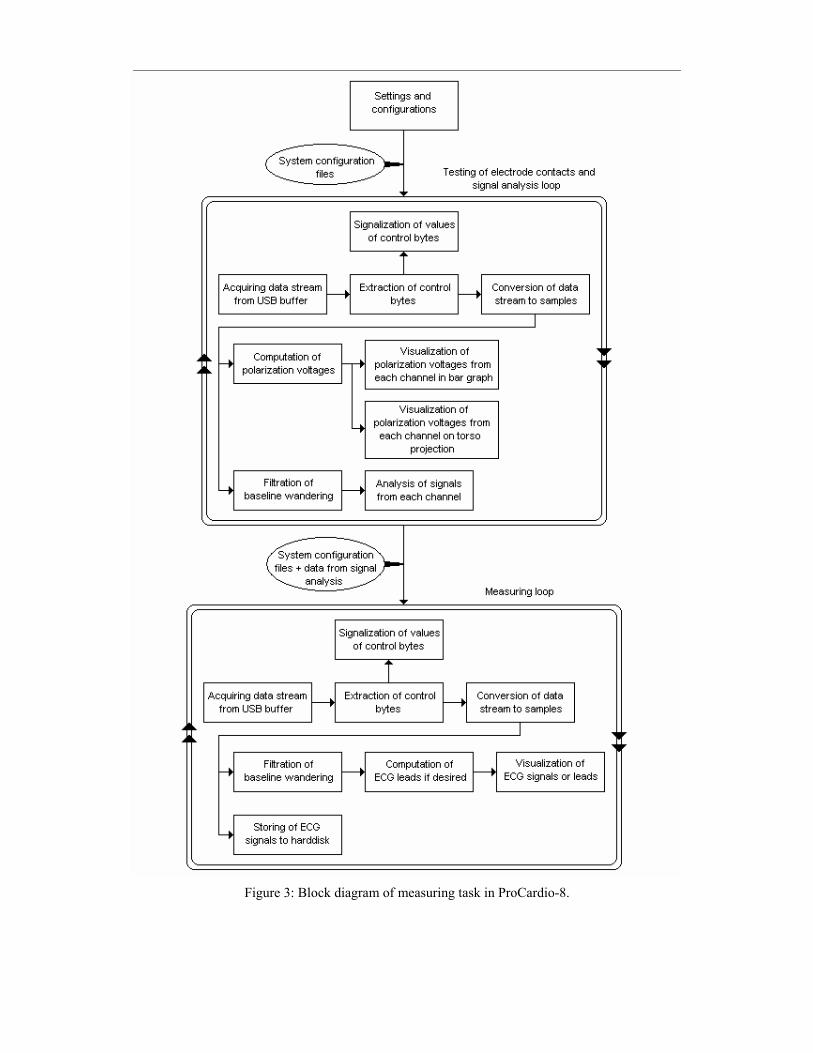
Figure 3: Block diagram of measuring task in ProCardio-8.
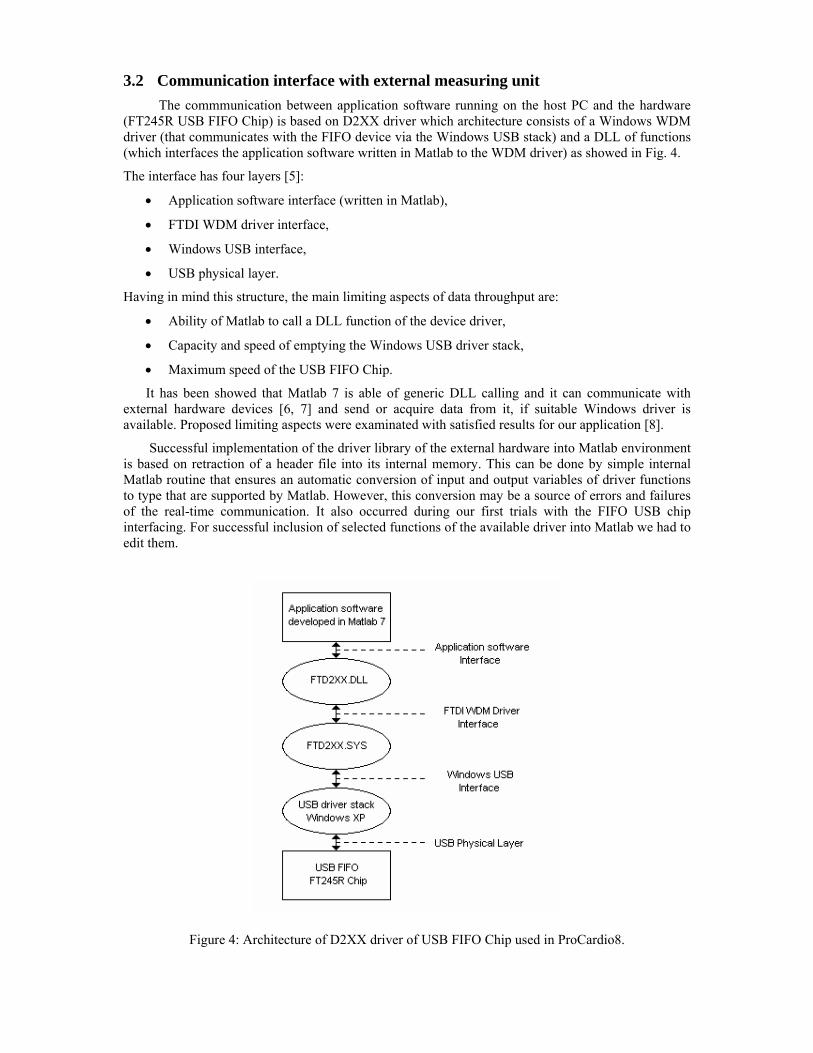
3.2 Communication interface with external measuring unit The commmunication between application software running on the host PC and the hardware
(FT245R USB FIFO Chip) is based on D2XX driver which architecture consists of a Windows WDM driver (that communicates with the FIFO device via the Windows USB stack) and a DLL of functions (which interfaces the application software written in Matlab to the WDM driver) as showed in Fig. 4.
The interface has four layers [5]:
• Application software interface (written in Matlab),
• FTDI WDM driver interface,
• Windows USB interface,
• USB physical layer.
Having in mind this structure, the main limiting aspects of data throughput are:
• Ability of Matlab to call a DLL function of the device driver,
• Capacity and speed of emptying the Windows USB driver stack,
• Maximum speed of the USB FIFO Chip.
It has been showed that Matlab 7 is able of generic DLL calling and it can communicate with external hardware devices [6, 7] and send or acquire data from it, if suitable Windows driver is available. Proposed limiting aspects were examinated with satisfied results for our application [8].
Successful implementation of the driver library of the external hardware into Matlab environment is based on retraction of a header file into its internal memory. This can be done by simple internal Matlab routine that ensures an automatic conversion of input and output variables of driver functions to type that are supported by Matlab. However, this conversion may be a source of errors and failures of the real-time communication. It also occurred during our first trials with the FIFO USB chip interfacing. For successful inclusion of selected functions of the available driver into Matlab we had to edit them.
Figure 4: Architecture of D2XX driver of USB FIFO Chip used in ProCardio8.
3.3 Electrode contacts testing module The ECG signals measured from human thorax have the amplitude typically from 0.5 to 5 mV
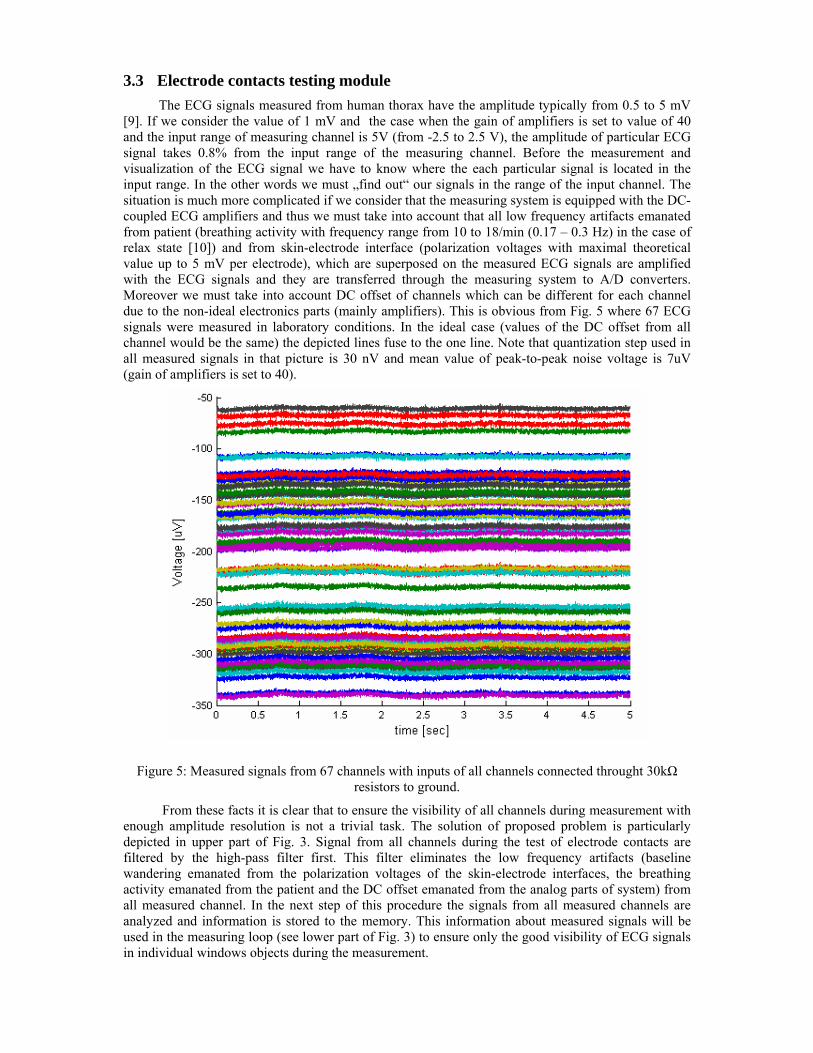
[9]. If we consider the value of 1 mV and the case when the gain of amplifiers is set to value of 40 and the input range of measuring channel is 5V (from -2.5 to 2.5 V), the amplitude of particular ECG signal takes 0.8% from the input range of the measuring channel. Before the measurement and visualization of the ECG signal we have to know where the each particular signal is located in the input range. In the other words we must „find out“ our signals in the range of the input channel. The situation is much more complicated if we consider that the measuring system is equipped with the DC-coupled ECG amplifiers and thus we must take into account that all low frequency artifacts emanated from patient (breathing activity with frequency range from 10 to 18/min (0.17 – 0.3 Hz) in the case of relax state [10]) and from skin-electrode interface (polarization voltages with maximal theoretical value up to 5 mV per electrode), which are superposed on the measured ECG signals are amplified with the ECG signals and they are transferred through the measuring system to A/D converters. Moreover we must take into account DC offset of channels which can be different for each channel due to the non-ideal electronics parts (mainly amplifiers). This is obvious from Fig. 5 where 67 ECG signals were measured in laboratory conditions. In the ideal case (values of the DC offset from all channel would be the same) the depicted lines fuse to the one line. Note that quantization step used in all measured signals in that picture is 30 nV and mean value of peak-to-peak noise voltage is 7uV (gain of amplifiers is set to 40).
Figure 5: Measured signals from 67 channels with inputs of all channels connected throught 30kΩ resistors to ground.
From these facts it is clear that to ensure the visibility of all channels during measurement with enough amplitude resolution is not a trivial task. The solution of proposed problem is particularly depicted in upper part of Fig. 3. Signal from all channels during the test of electrode contacts are filtered by the high-pass filter first. This filter eliminates the low frequency artifacts (baseline wandering emanated from the polarization voltages of the skin-electrode interfaces, the breathing activity emanated from the patient and the DC offset emanated from the analog parts of system) from all measured channel. In the next step of this procedure the signals from all measured channels are analyzed and information is stored to the memory. This information about measured signals will be used in the measuring loop (see lower part of Fig. 3) to ensure only the good visibility of ECG signals in individual windows objects during the measurement.
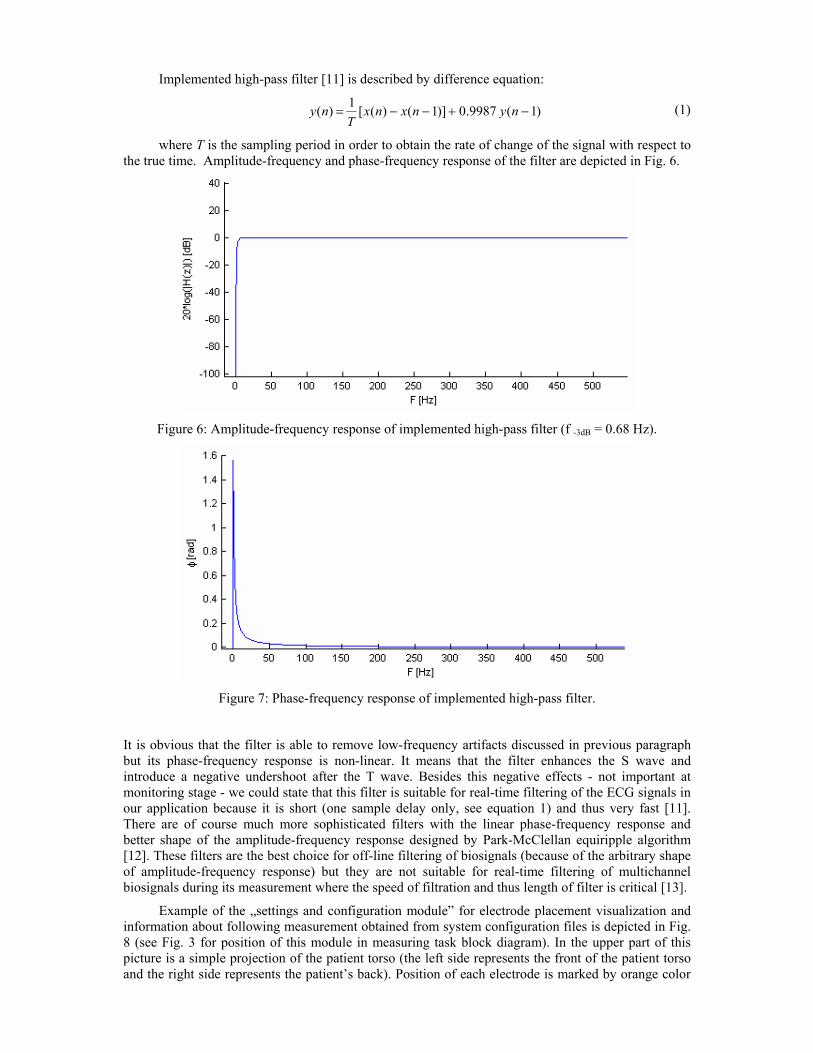
Implemented high-pass filter [11] is described by difference equation:
)1(9987.0)]1()([1)( −+−−= nynxnxT
ny (1)
where T is the sampling period in order to obtain the rate of change of the signal with respect to the true time. Amplitude-frequency and phase-frequency response of the filter are depicted in Fig. 6.
Figure 6: Amplitude-frequency response of implemented high-pass filter (f -3dB = 0.68 Hz).
Figure 7: Phase-frequency response of implemented high-pass filter.
It is obvious that the filter is able to remove low-frequency artifacts discussed in previous paragraph but its phase-frequency response is non-linear. It means that the filter enhances the S wave and introduce a negative undershoot after the T wave. Besides this negative effects - not important at monitoring stage - we could state that this filter is suitable for real-time filtering of the ECG signals in our application because it is short (one sample delay only, see equation 1) and thus very fast [11]. There are of course much more sophisticated filters with the linear phase-frequency response and better shape of the amplitude-frequency response designed by Park-McClellan equiripple algorithm [12]. These filters are the best choice for off-line filtering of biosignals (because of the arbitrary shape of amplitude-frequency response) but they are not suitable for real-time filtering of multichannel biosignals during its measurement where the speed of filtration and thus length of filter is critical [13].
Example of the „settings and configuration module” for electrode placement visualization and information about following measurement obtained from system configuration files is depicted in Fig. 8 (see Fig. 3 for position of this module in measuring task block diagram). In the upper part of this picture is a simple projection of the patient torso (the left side represents the front of the patient torso and the right side represents the patient’s back). Position of each electrode is marked by orange color
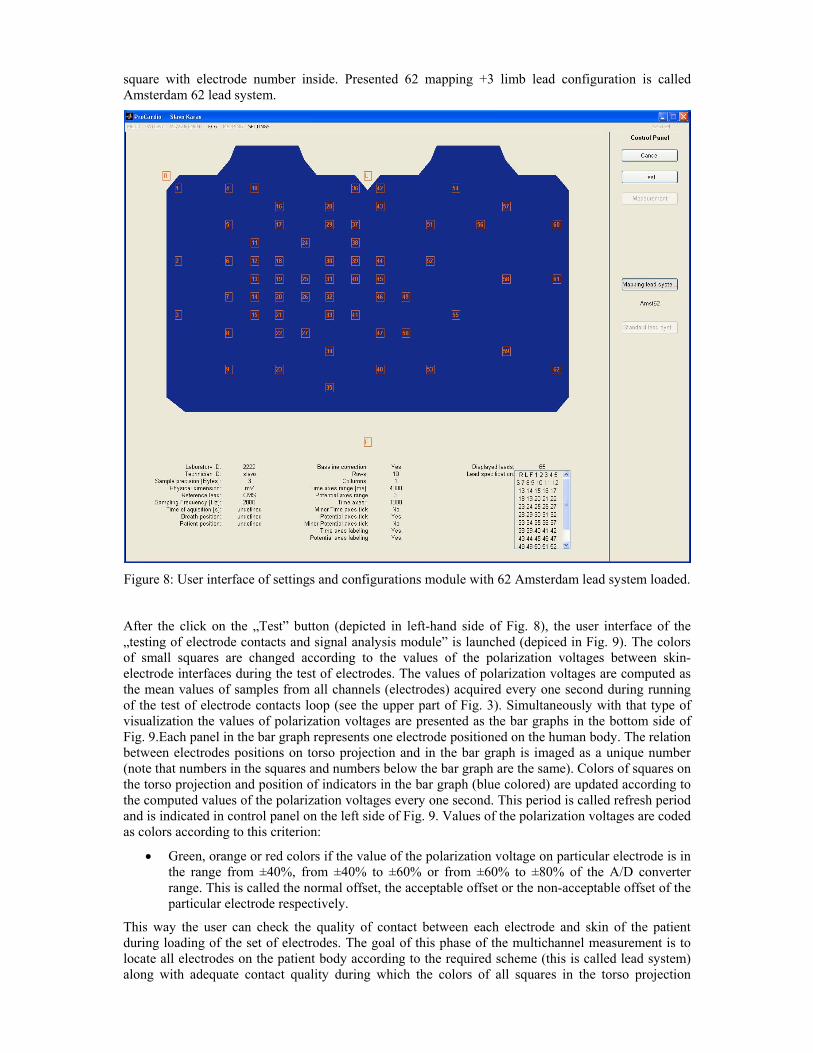
square with electrode number inside. Presented 62 mapping +3 limb lead configuration is called Amsterdam 62 lead system.
Figure 8: User interface of settings and configurations module with 62 Amsterdam lead system loaded.
After the click on the „Test” button (depicted in left-hand side of Fig. 8), the user interface of the „testing of electrode contacts and signal analysis module” is launched (depiced in Fig. 9). The colors of small squares are changed according to the values of the polarization voltages between skin-electrode interfaces during the test of electrodes. The values of polarization voltages are computed as the mean values of samples from all channels (electrodes) acquired every one second during running of the test of electrode contacts loop (see the upper part of Fig. 3). Simultaneously with that type of visualization the values of polarization voltages are presented as the bar graphs in the bottom side of Fig. 9.Each panel in the bar graph represents one electrode positioned on the human body. The relation between electrodes positions on torso projection and in the bar graph is imaged as a unique number (note that numbers in the squares and numbers below the bar graph are the same). Colors of squares on the torso projection and position of indicators in the bar graph (blue colored) are updated according to the computed values of the polarization voltages every one second. This period is called refresh period and is indicated in control panel on the left side of Fig. 9. Values of the polarization voltages are coded as colors according to this criterion:
• Green, orange or red colors if the value of the polarization voltage on particular electrode is in the range from ±40%, from ±40% to ±60% or from ±60% to ±80% of the A/D converter range. This is called the normal offset, the acceptable offset or the non-acceptable offset of the particular electrode respectively.
This way the user can check the quality of contact between each electrode and skin of the patient during loading of the set of electrodes. The goal of this phase of the multichannel measurement is to locate all electrodes on the patient body according to the required scheme (this is called lead system) along with adequate contact quality during which the colors of all squares in the torso projection
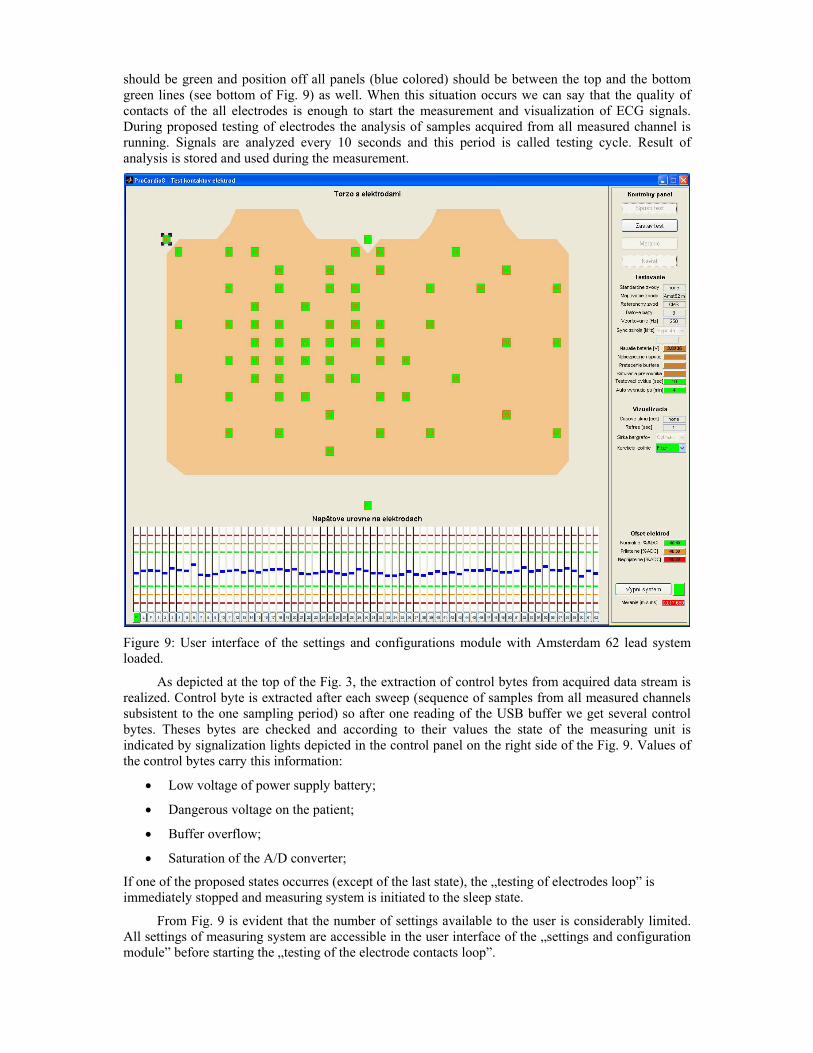
should be green and position off all panels (blue colored) should be between the top and the bottom green lines (see bottom of Fig. 9) as well. When this situation occurs we can say that the quality of contacts of the all electrodes is enough to start the measurement and visualization of ECG signals. During proposed testing of electrodes the analysis of samples acquired from all measured channel is running. Signals are analyzed every 10 seconds and this period is called testing cycle. Result of analysis is stored and used during the measurement.
Figure 9: User interface of the settings and configurations module with Amsterdam 62 lead system loaded.
As depicted at the top of the Fig. 3, the extraction of control bytes from acquired data stream is realized. Control byte is extracted after each sweep (sequence of samples from all measured channels subsistent to the one sampling period) so after one reading of the USB buffer we get several control bytes. Theses bytes are checked and according to their values the state of the measuring unit is indicated by signalization lights depicted in the control panel on the right side of the Fig. 9. Values of the control bytes carry this information:
• Low voltage of power supply battery;
• Dangerous voltage on the patient;
• Buffer overflow;
• Saturation of the A/D converter;
If one of the proposed states occurres (except of the last state), the „testing of electrodes loop” is immediately stopped and measuring system is initiated to the sleep state.
From Fig. 9 is evident that the number of settings available to the user is considerably limited. All settings of measuring system are accessible in the user interface of the „settings and configuration module” before starting the „testing of the electrode contacts loop”.
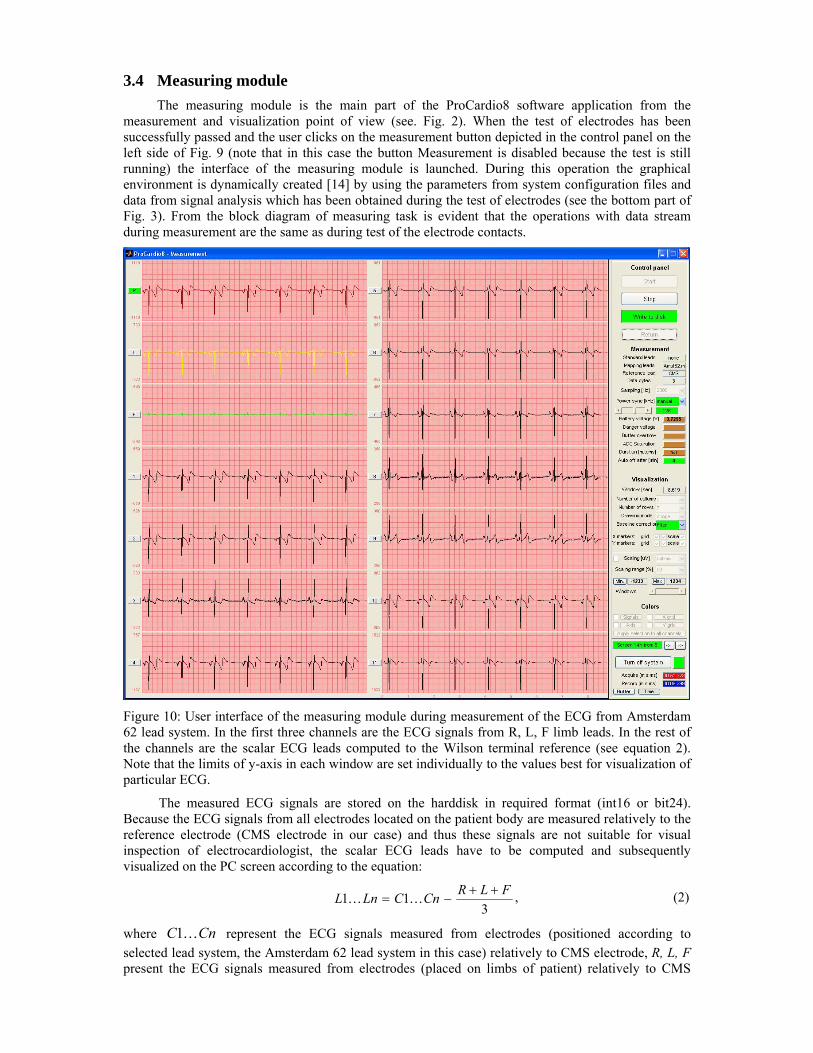
3.4 Measuring module The measuring module is the main part of the ProCardio8 software application from the
measurement and visualization point of view (see. Fig. 2). When the test of electrodes has been successfully passed and the user clicks on the measurement button depicted in the control panel on the left side of Fig. 9 (note that in this case the button Measurement is disabled because the test is still running) the interface of the measuring module is launched. During this operation the graphical environment is dynamically created [14] by using the parameters from system configuration files and data from signal analysis which has been obtained during the test of electrodes (see the bottom part of Fig. 3). From the block diagram of measuring task is evident that the operations with data stream during measurement are the same as during test of the electrode contacts.
Figure 10: User interface of the measuring module during measurement of the ECG from Amsterdam 62 lead system. In the first three channels are the ECG signals from R, L, F limb leads. In the rest of the channels are the scalar ECG leads computed to the Wilson terminal reference (see equation 2). Note that the limits of y-axis in each window are set individually to the values best for visualization of particular ECG.
The measured ECG signals are stored on the harddisk in required format (int16 or bit24). Because the ECG signals from all electrodes located on the patient body are measured relatively to the reference electrode (CMS electrode in our case) and thus these signals are not suitable for visual inspection of electrocardiologist, the scalar ECG leads have to be computed and subsequently visualized on the PC screen according to the equation:
3
11 FLRCnCLnL ++−= KK , (2)
where CnC K1 represent the ECG signals measured from electrodes (positioned according to selected lead system, the Amsterdam 62 lead system in this case) relatively to CMS electrode, R, L, F present the ECG signals measured from electrodes (placed on limbs of patient) relatively to CMS
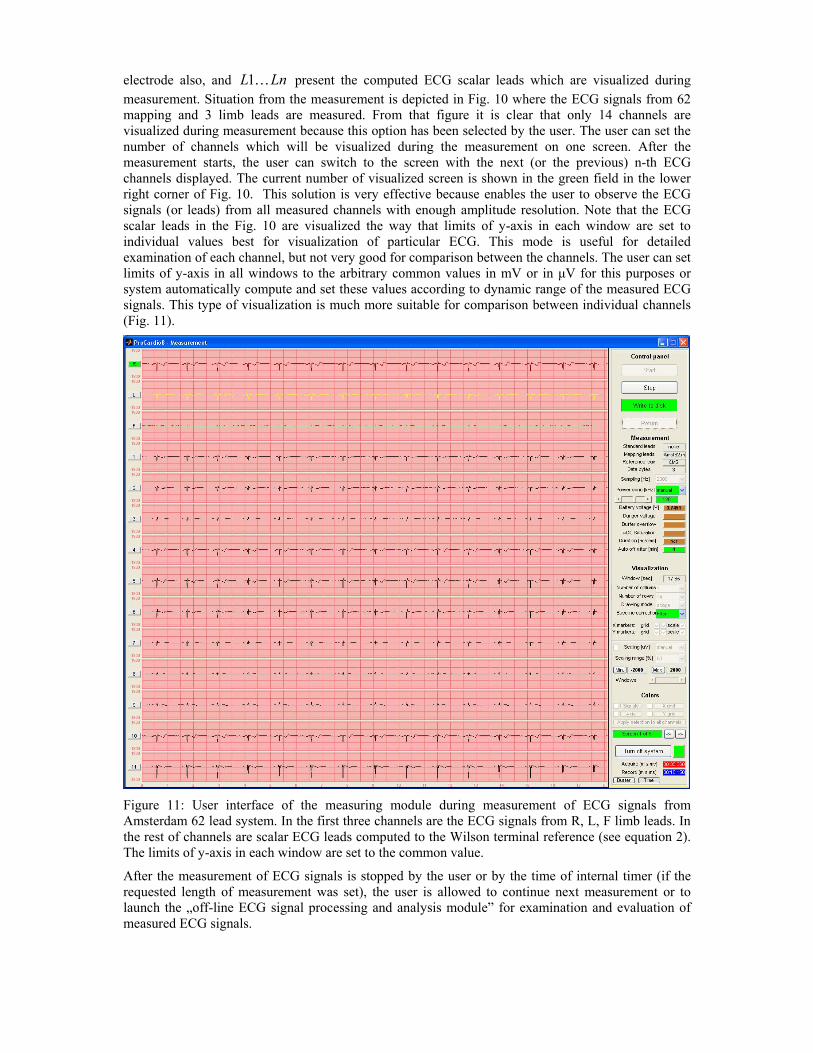
electrode also, and LnL K1 present the computed ECG scalar leads which are visualized during measurement. Situation from the measurement is depicted in Fig. 10 where the ECG signals from 62 mapping and 3 limb leads are measured. From that figure it is clear that only 14 channels are visualized during measurement because this option has been selected by the user. The user can set the number of channels which will be visualized during the measurement on one screen. After the measurement starts, the user can switch to the screen with the next (or the previous) n-th ECG channels displayed. The current number of visualized screen is shown in the green field in the lower right corner of Fig. 10. This solution is very effective because enables the user to observe the ECG signals (or leads) from all measured channels with enough amplitude resolution. Note that the ECG scalar leads in the Fig. 10 are visualized the way that limits of y-axis in each window are set to individual values best for visualization of particular ECG. This mode is useful for detailed examination of each channel, but not very good for comparison between the channels. The user can set limits of y-axis in all windows to the arbitrary common values in mV or in µV for this purposes or system automatically compute and set these values according to dynamic range of the measured ECG signals. This type of visualization is much more suitable for comparison between individual channels (Fig. 11).
Figure 11: User interface of the measuring module during measurement of ECG signals from Amsterdam 62 lead system. In the first three channels are the ECG signals from R, L, F limb leads. In the rest of channels are scalar ECG leads computed to the Wilson terminal reference (see equation 2). The limits of y-axis in each window are set to the common value.
After the measurement of ECG signals is stopped by the user or by the time of internal timer (if the requested length of measurement was set), the user is allowed to continue next measurement or to launch the „off-line ECG signal processing and analysis module” for examination and evaluation of measured ECG signals.
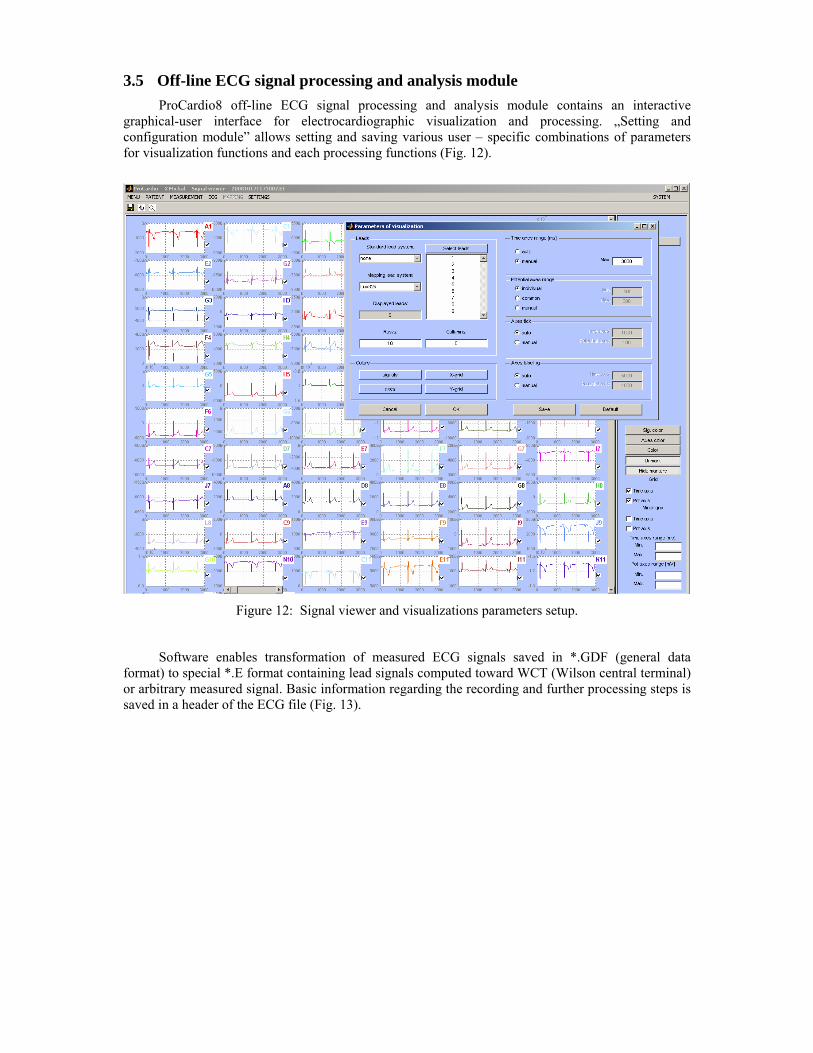
3.5 Off-line ECG signal processing and analysis module ProCardio8 off-line ECG signal processing and analysis module contains an interactive
graphical-user interface for electrocardiographic visualization and processing. „Setting and configuration module” allows setting and saving various user – specific combinations of parameters for visualization functions and each processing functions (Fig. 12).
Figure 12: Signal viewer and visualizations parameters setup.
Software enables transformation of measured ECG signals saved in *.GDF (general data format) to special *.E format containing lead signals computed toward WCT (Wilson central terminal) or arbitrary measured signal. Basic information regarding the recording and further processing steps is saved in a header of the ECG file (Fig. 13).
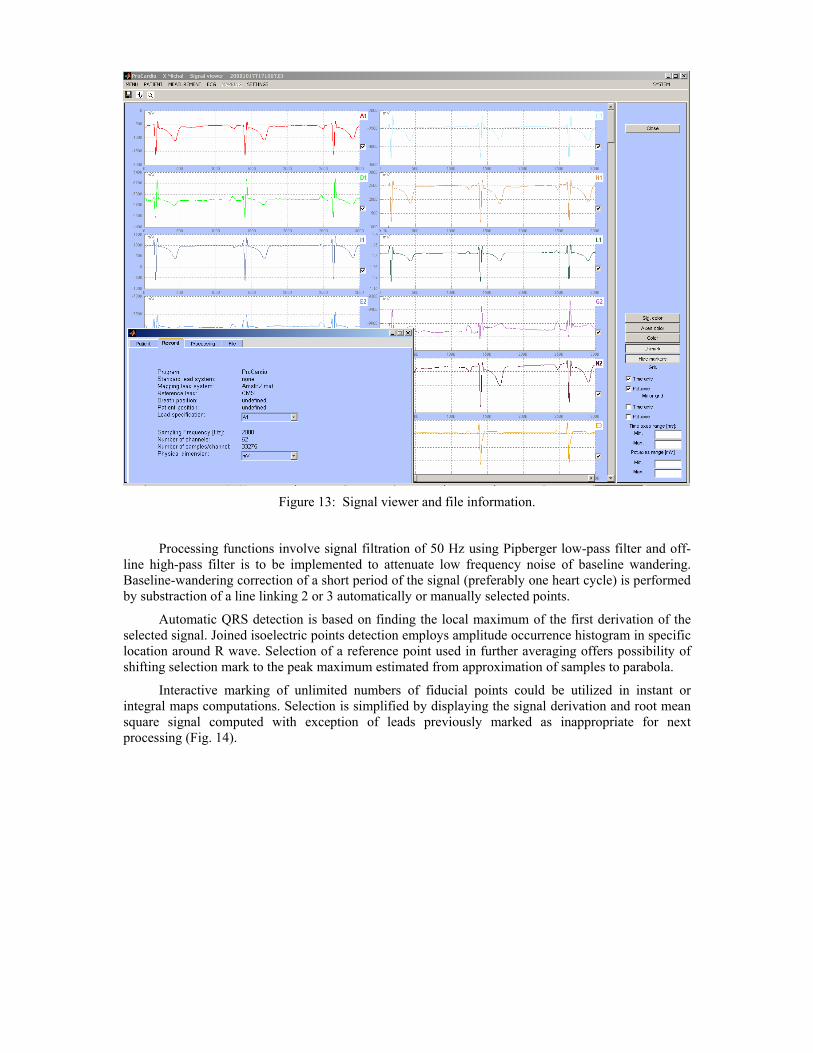
Figure 13: Signal viewer and file information.
Processing functions involve signal filtration of 50 Hz using Pipberger low-pass filter and off-line high-pass filter is to be implemented to attenuate low frequency noise of baseline wandering. Baseline-wandering correction of a short period of the signal (preferably one heart cycle) is performed by substraction of a line linking 2 or 3 automatically or manually selected points.
Automatic QRS detection is based on finding the local maximum of the first derivation of the selected signal. Joined isoelectric points detection employs amplitude occurrence histogram in specific location around R wave. Selection of a reference point used in further averaging offers possibility of shifting selection mark to the peak maximum estimated from approximation of samples to parabola.
Interactive marking of unlimited numbers of fiducial points could be utilized in instant or integral maps computations. Selection is simplified by displaying the signal derivation and root mean square signal computed with exception of leads previously marked as inappropriate for next processing (Fig. 14).
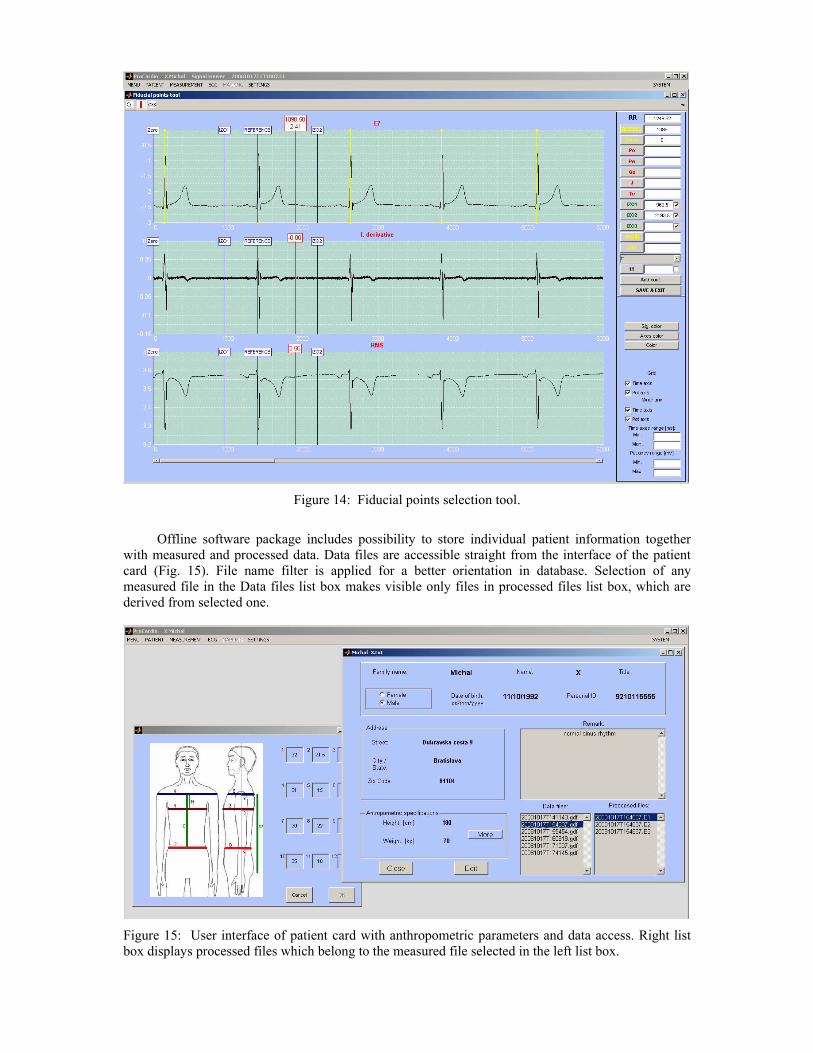
Figure 14: Fiducial points selection tool.
Offline software package includes possibility to store individual patient information together
with measured and processed data. Data files are accessible straight from the interface of the patient card (Fig. 15). File name filter is applied for a better orientation in database. Selection of any measured file in the Data files list box makes visible only files in processed files list box, which are derived from selected one.
Figure 15: User interface of patient card with anthropometric parameters and data access. Right list box displays processed files which belong to the measured file selected in the left list box.
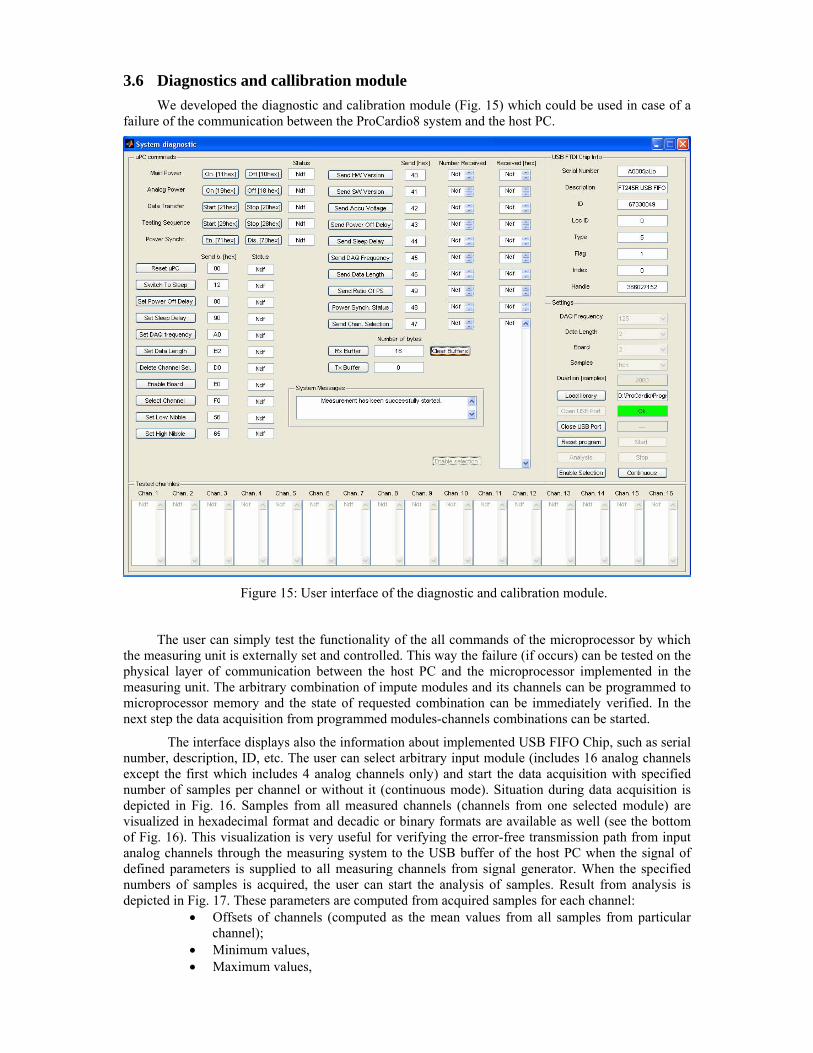
3.6 Diagnostics and callibration module We developed the diagnostic and calibration module (Fig. 15) which could be used in case of a
failure of the communication between the ProCardio8 system and the host PC.
Figure 15: User interface of the diagnostic and calibration module.
The user can simply test the functionality of the all commands of the microprocessor by which the measuring unit is externally set and controlled. This way the failure (if occurs) can be tested on the physical layer of communication between the host PC and the microprocessor implemented in the measuring unit. The arbitrary combination of impute modules and its channels can be programmed to microprocessor memory and the state of requested combination can be immediately verified. In the next step the data acquisition from programmed modules-channels combinations can be started.
The interface displays also the information about implemented USB FIFO Chip, such as serial number, description, ID, etc. The user can select arbitrary input module (includes 16 analog channels except the first which includes 4 analog channels only) and start the data acquisition with specified number of samples per channel or without it (continuous mode). Situation during data acquisition is depicted in Fig. 16. Samples from all measured channels (channels from one selected module) are visualized in hexadecimal format and decadic or binary formats are available as well (see the bottom of Fig. 16). This visualization is very useful for verifying the error-free transmission path from input analog channels through the measuring system to the USB buffer of the host PC when the signal of defined parameters is supplied to all measuring channels from signal generator. When the specified numbers of samples is acquired, the user can start the analysis of samples. Result from analysis is depicted in Fig. 17. These parameters are computed from acquired samples for each channel:
• Offsets of channels (computed as the mean values from all samples from particular channel);
• Minimum values, • Maximum values,
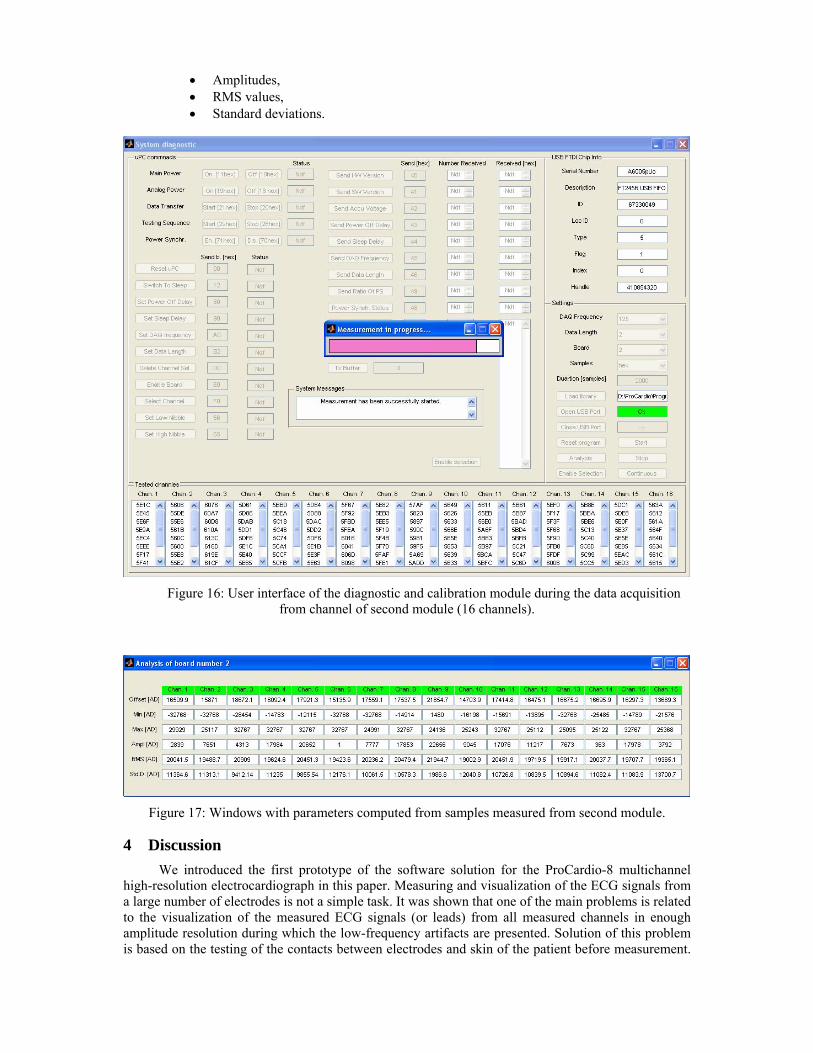
• Amplitudes, • RMS values, • Standard deviations.
Figure 16: User interface of the diagnostic and calibration module during the data acquisition from channel of second module (16 channels).
Figure 17: Windows with parameters computed from samples measured from second module.
4 Discussion We introduced the first prototype of the software solution for the ProCardio-8 multichannel
high-resolution electrocardiograph in this paper. Measuring and visualization of the ECG signals from a large number of electrodes is not a simple task. It was shown that one of the main problems is related to the visualization of the measured ECG signals (or leads) from all measured channels in enough amplitude resolution during which the low-frequency artifacts are presented. Solution of this problem is based on the testing of the contacts between electrodes and skin of the patient before measurement.

We can state that the visibility of the ECG signals (or leads) in separate windows (see Fig. 10 and Fig. 11) during the measurement will be guaranteed when these assumption are valid:
• Conditions during the testing of the electrode contacts and measurement are the same (including the patient and environment condition),
• Rate of change of the low-frequency artifacts will be small enough (it means that the frequency by which the baselines positions of measured ECG signals are modulated are lower than cutoff frequency of high-pass filter depicted in Fig. 6 and Fig. 7). This modulation of baseline position is called the baseline wandering,
• Measured signals have quasi-stationary character (ECG signals are cyclo-stationary signals [11]),
• Test of the electrode contacts runs sufficiently long so the transients decayed.
Of course, the situation when the 50 Hz interference or signals originated from muscular activity are present in the ECG signals is not discussed yet. In the first case, the notch filter has to be inserted to the preprocessing operations during the test of the electrodes and also during the measurement of the ECG signals (see the Fig. 3). In the second case the patient must be in rest state because the interference originated from muscular activity overlap the ECG signals (in frequency domain) [9] and thus it is very hard to eliminate it without affecting the ECG signals.
5 Conclusions Next development of the software will be devoted mainly to „off-line ECG signal processing
and analysis module”. The signal pre-processing routine, computation of surface potential maps and various sub-modules for analysis will be implemented.
The proposed software could be compiled with the main application files (.exe file and .ctf archive file) and could be deployed and run on any computer with WIN XP OS intalled [14]. In the next step, after successful testing, the measuring system with the application software is going to be supplied to The National Institute of Cardiovascular Diseases in Slovak Republic where it will be used for research in non-invasive ectrocardiology.
Acknowledgements The work described in the paper was supported in part by ESF project ESF 2004/4-016, ESF project Meditech 28040001, APVV Grant number 28020011 and VEGA Grant number 28030007.
References
[1] Bronzino, D. Joseph. Biomedical Engineering Handbook: Section VI Biomedical Signal Analysis. CRC Press. 1995.
[2] Rosík V., Tyšler M., Jurko S., Rášo R., Turzová M. Cardio 7 – Portable System for High Resolution ECG Mapping. Studies in Health Technology and Informatics. 9041-46.
[3] Tyšler M., Turzová M., Švehlíková J., Hebláková E. Noninvasive identification of ischemic lession in the heart. Advances in Electrical and Electronic Engineering. Vol. 4. 2005. 124 – 127.
[4] Winter, B. B., Webster, G. J.: Driven – Right Leg Circuit Design. IEEE Transaction On Biomedical Engineering. Vol. Bme-30, No. 1, January 1983.
[5] Future Technology Devices International Ltd. D2XX Programmer’s Guide. 2005. [6] Hanselman D., Littlefield B. Mastering Matlab 7. Prentice Hall. 2005. [7] The Mathworks Company Inc. Interfacing to external devices from Matlab – webminar. Avaliable
on: http://www.mathworks.com/company/events/webinars/index.html?BB=1 [8] Karas S, Rosík V, Tyšler M. Matlab – based software for multichannel biosignal measurement.
Lékař a technika. Číslo 2. Ročník 36. Praha. 2006. [9] Rozman Jiří a kolektiv. Elektronické přístroje v lékářství. 2006. Academia. Praha. [10] Kamil Javorka a kolektiv. Lekárska Fyziológia – Učebnica pre lekárske fakulty. Kapitola 6:

Fyziológia dýchacieho systému. Osveta. Martin. 2006. [11] Rangaraj M. Rangayyan: Biomedical Signal Analysis – A Case Study Approach. Chapter 3: Filtering for Removing Artifacts. IEEE Press. 2002. [12] Vich R., Smekal Z. Číslicové filtry. Academia. Praha. 2000. [13] Karas S. Filtration of the EEG signals. Diploma thesis. Faculty of Electrical Engineering. University of Žilina. Žilina. 2005. [14] Smith T. Scott. Matlab Advanced GUI development. Dog Ear Publishing. 2006
Slavomir Karas Department of Biomeasurements Institute of Measurement Science Slovak Academy of Sciences Dubravská cesta 9 841 04 Bratislava Slovak Republic E-mail: [email protected] http://www.um.sav.sk/en/department-05/ Eva Hebláková Department of Biomeasurements Institute of Measurement Science Slovak Academy of Sciences Dubravská cesta 9 841 04 Bratislava Slovak Republic E-mail: [email protected] http://www.um.sav.sk/en/department-05/ Vladimír Rosík Department of Biomeasurements Institute of Measurement Science Slovak Academy of Sciences Dubravská cesta 9 841 04 Bratislava Slovak Republic http://www.um.sav.sk/en/department-05/ Milan Tyšler Department of Biomeasurements Institute of Measurement Science Slovak Academy of Sciences Dubravská cesta 9 841 04 Bratislava Slovak Republic E-mail: [email protected] http://www.um.sav.sk/en/department-05/