Embed Size (px)
DESCRIPTION
MULTIFACTORIAL DISEASES. MG L-10 July 7 th 2014. Estimates of Heritability of Some Disorders. Disorder Frequency (%) Heritability Schizophrenia 185 Asthma 4 80 Cleft Lip = Cleft palate 0.1 76 - PowerPoint PPT Presentation
Citation preview
MULTIFACTORIAL DISEASES
MG L-10
July 7th 2014
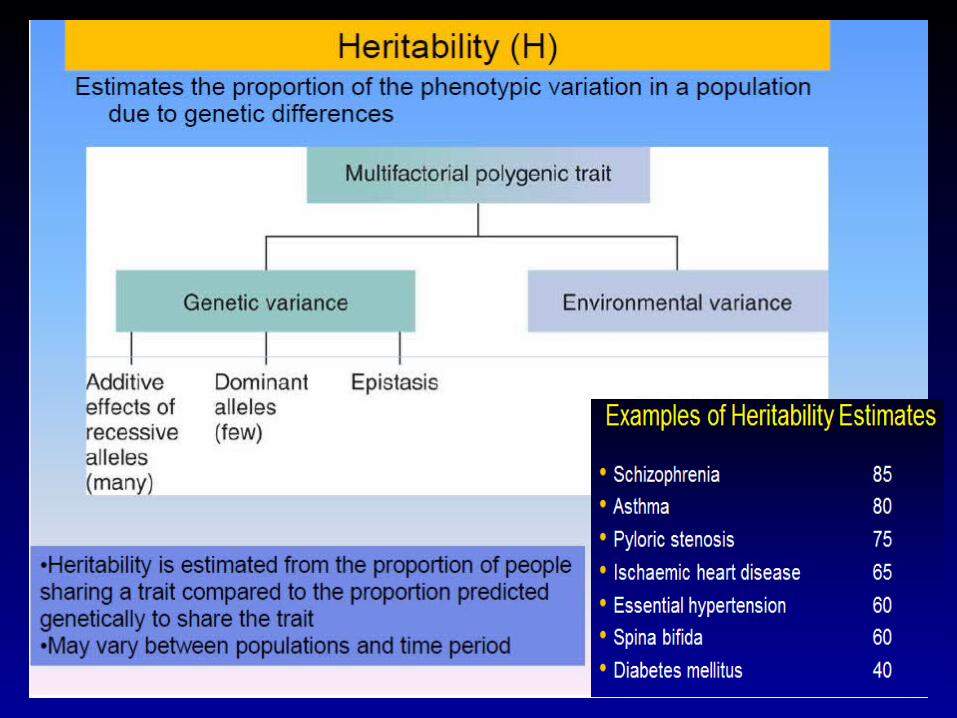
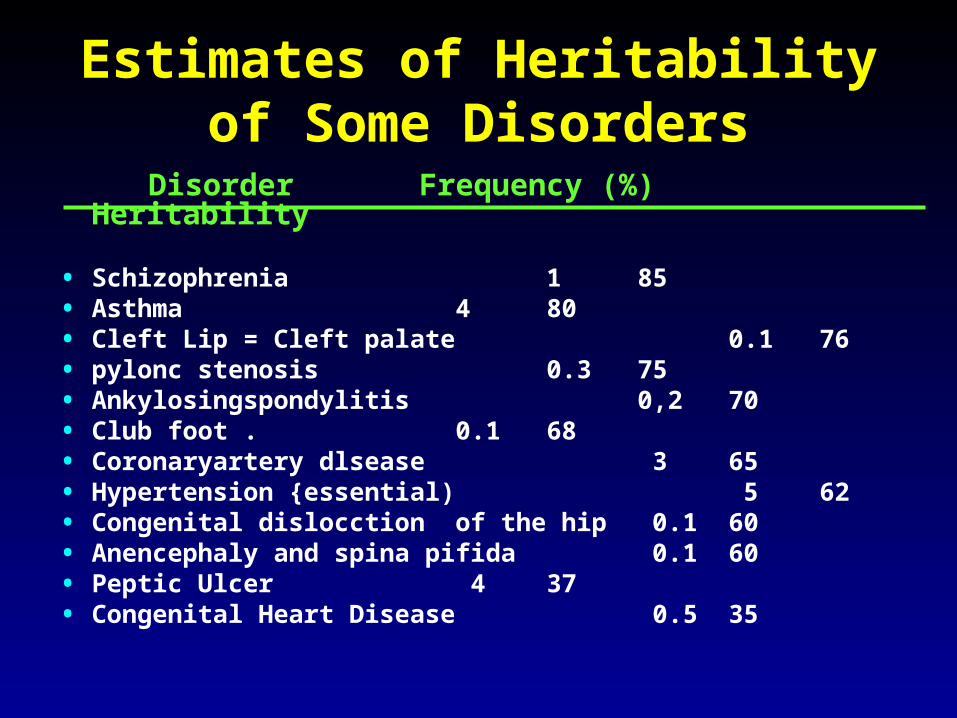
Estimates of Heritability of Some Disorders
Disorder Frequency (%) Heritability
• Schizophrenia 1 85• Asthma 4 80 • Cleft Lip = Cleft palate 0.1 76• pylonc stenosis 0.3 75• Ankylosingspondylitis 0,2 70• Club foot . 0.1 68• Coronaryartery dlsease 3 65• Hypertension {essential) 5 62 • Congenital dislocction of the hip 0.1 60 • Anencephaly and spina pifida 0.1 60• Peptic Ulcer 4 37• Congenital Heart Disease 0.5 35
Concordance
• Concordance - the percentage of pairs in which both twins express the trait
• Used to determine heritability
• Has limitations, assumes both type of twins share similar environments
• MZ twins often share more similar environments
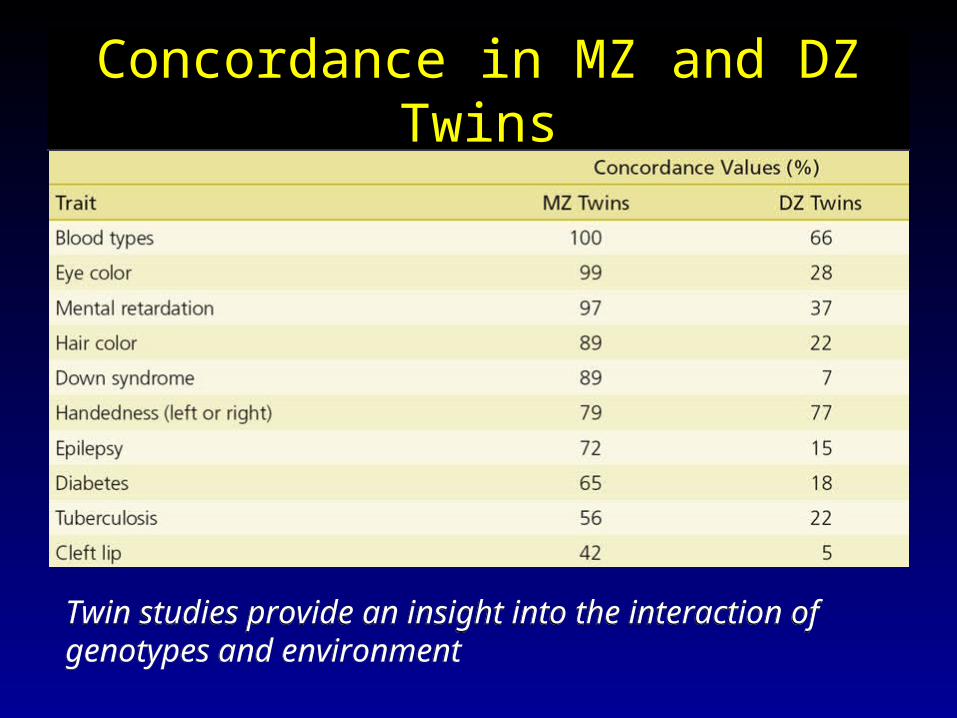
Concordance in MZ and DZ Twins
Concordance in MZ and DZ Twins
Twin studies provide an insight into the interaction of genotypes and environmentTwin studies provide an insight into the interaction of genotypes and environment
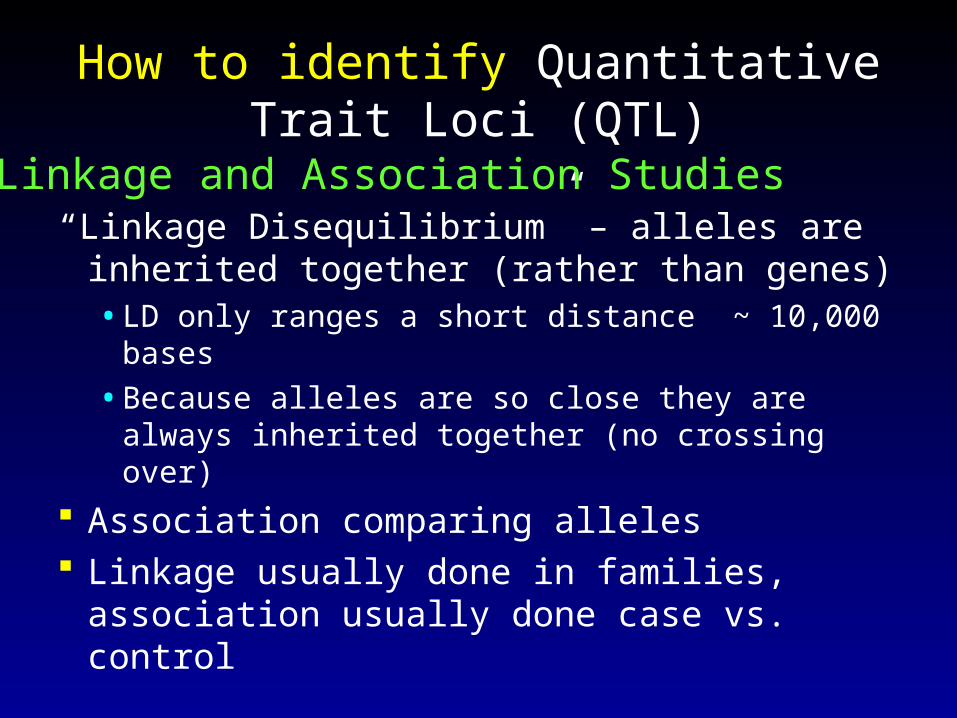
How to identify Quantitative Trait Loci (QTL)
“Linkage Disequilibrium” – alleles are inherited together (rather than genes)• LD only ranges a short distance ~ 10,000
bases
• Because alleles are so close they are always inherited together (no crossing over)
Association comparing alleles Linkage usually done in families,
association usually done case vs. control
Linkage and Association Studies
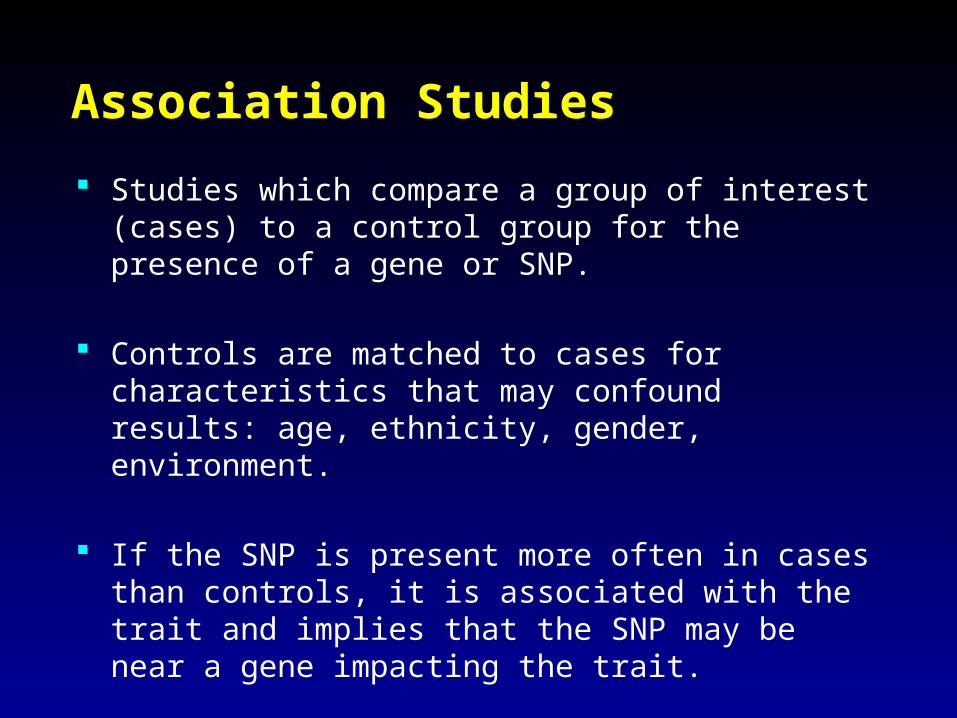
Association Studies
Studies which compare a group of interest (cases) to a control group for the presence of a gene or SNP.
Controls are matched to cases for characteristics that may confound results: age, ethnicity, gender, environment.
If the SNP is present more often in cases than controls, it is associated with the trait and implies that the SNP may be near a gene impacting the trait.
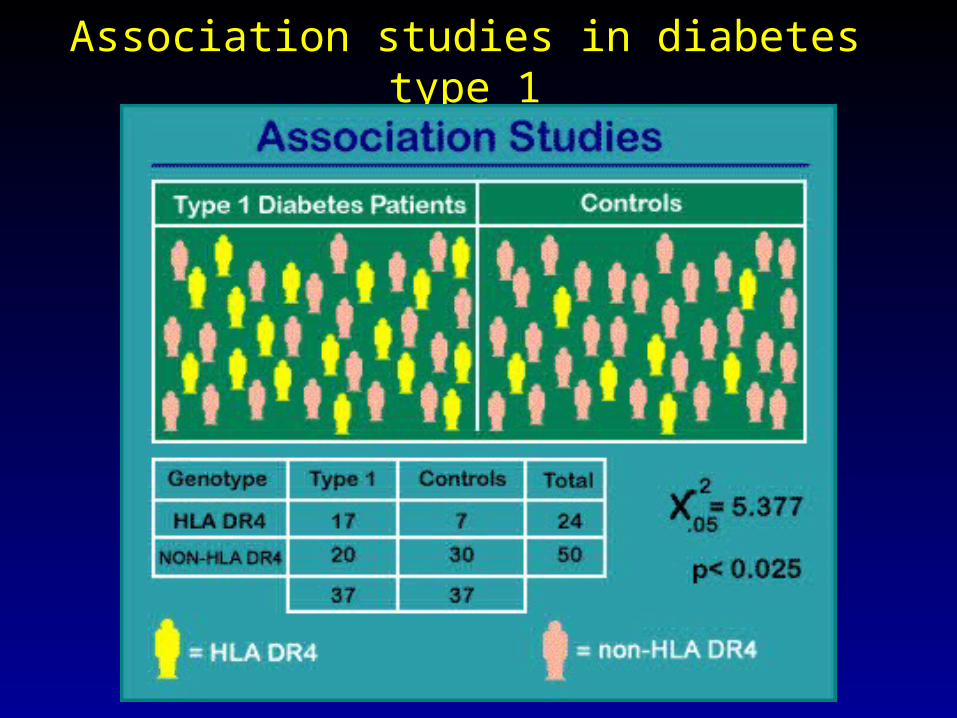
Association studies in diabetes type 1
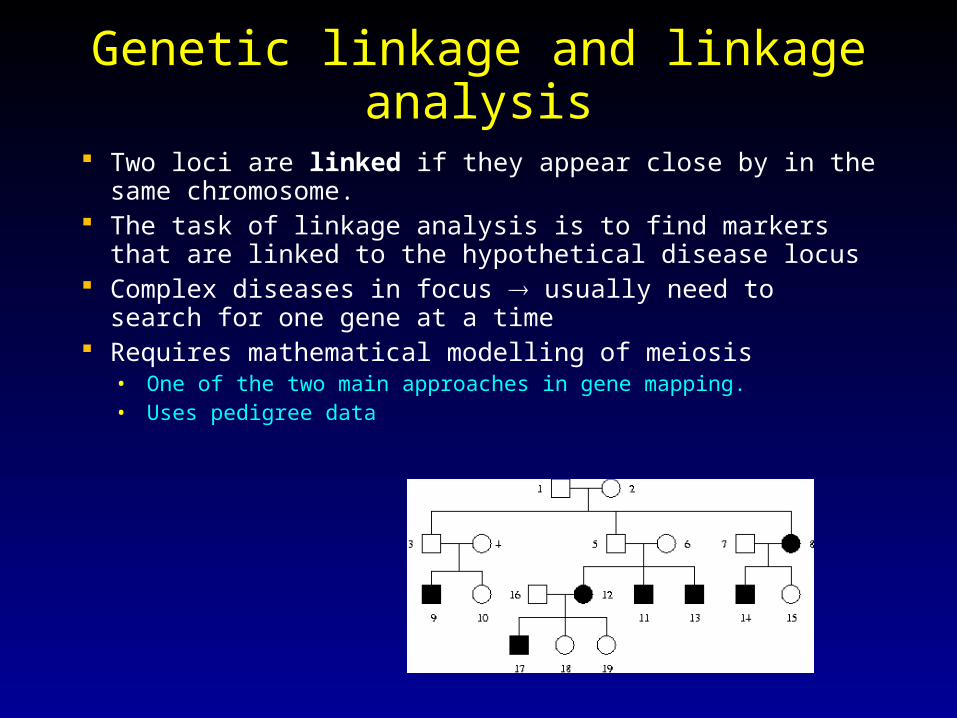
Genetic linkage and linkage analysis
Two loci are linked if they appear close by in the same chromosome.
The task of linkage analysis is to find markers that are linked to the hypothetical disease locus
Complex diseases in focus usually need to search for one gene at a time
Requires mathematical modelling of meiosis• One of the two main approaches in gene mapping.• Uses pedigree data
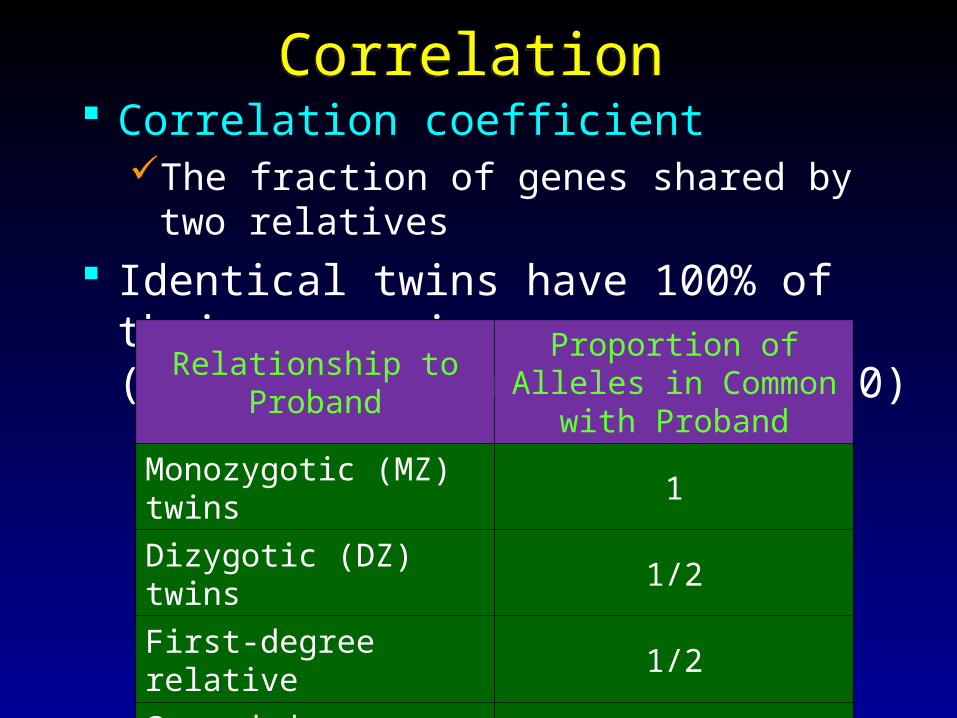
CorrelationCorrelation Correlation coefficient
The fraction of genes shared by two relatives
Identical twins have 100% of their genes in common (correlation coefficient = 1.0)
Relationship to ProbandProportion of Alleles in Common with Proband
Monozygotic (MZ) twins 1
Dizygotic (DZ) twins 1/2
First-degree relative 1/2
Second-degree relative 1/4
Third-degree relative 1/8
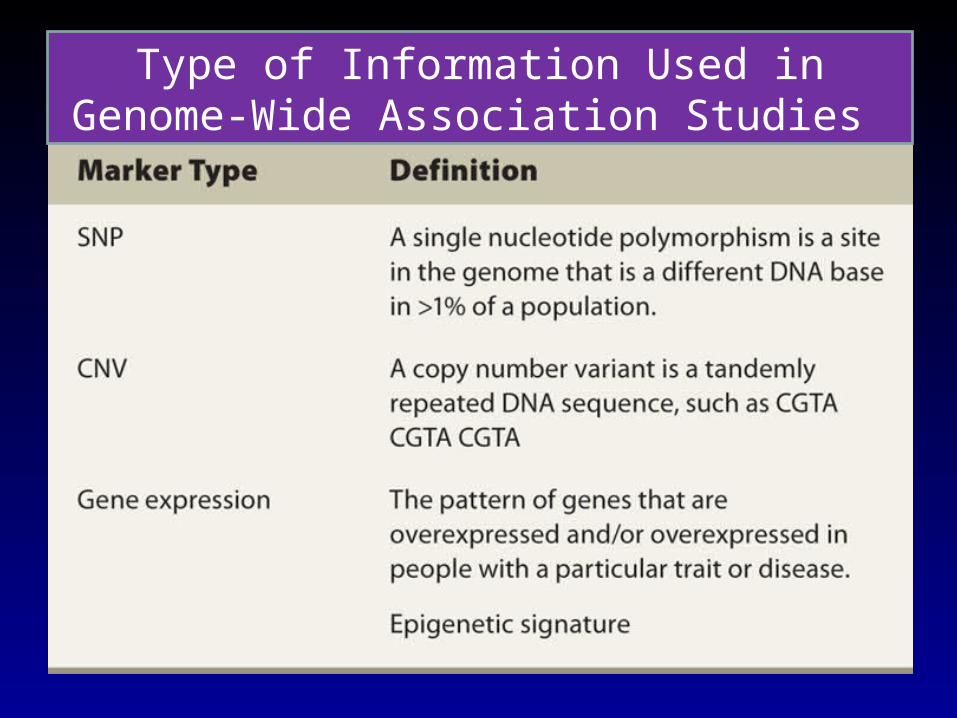
Type of Information Used in Genome-Wide Association Studies
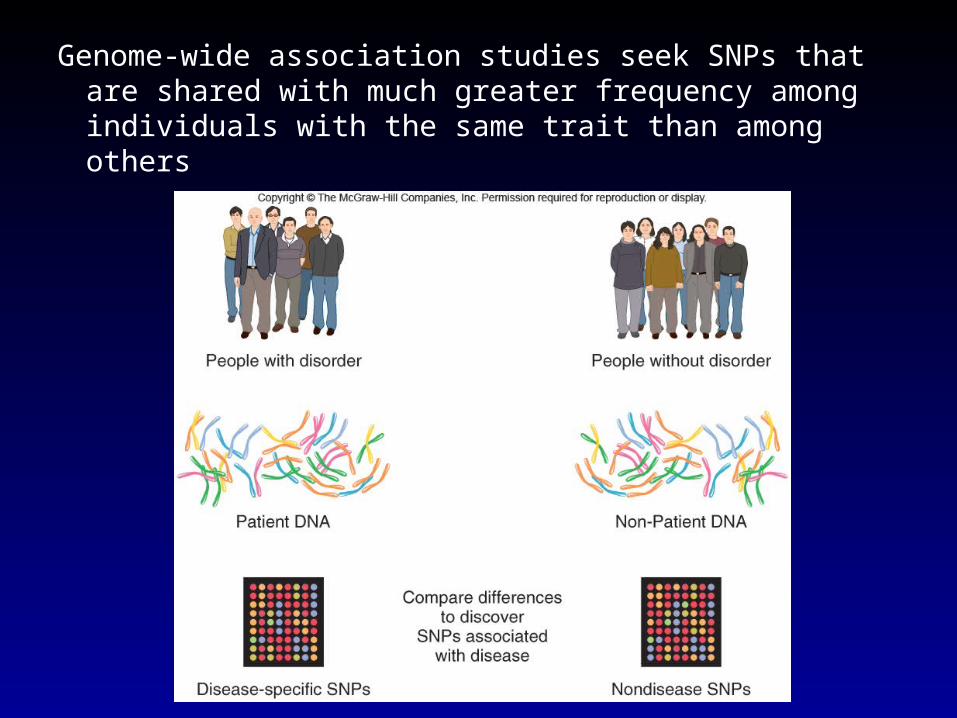
Genome-wide association studies seek SNPs that are shared with much greater frequency among individuals with the same trait than among others
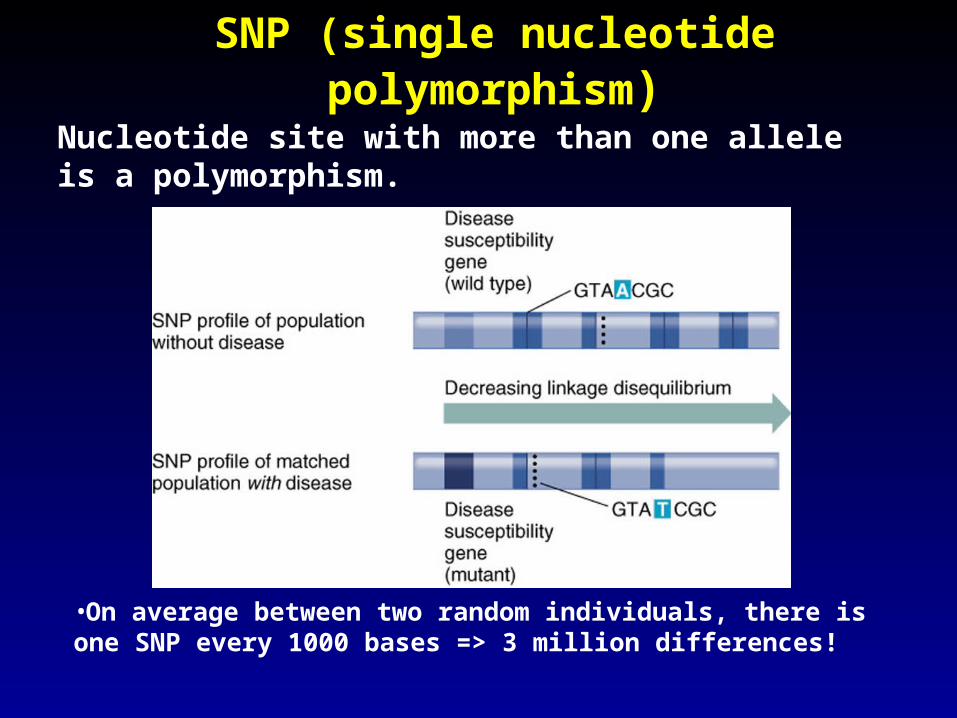
SNP (single nucleotide polymorphism)
•On average between two random individuals, there is one SNP every 1000 bases => 3 million differences!
Nucleotide site with more than one allele is a polymorphism.
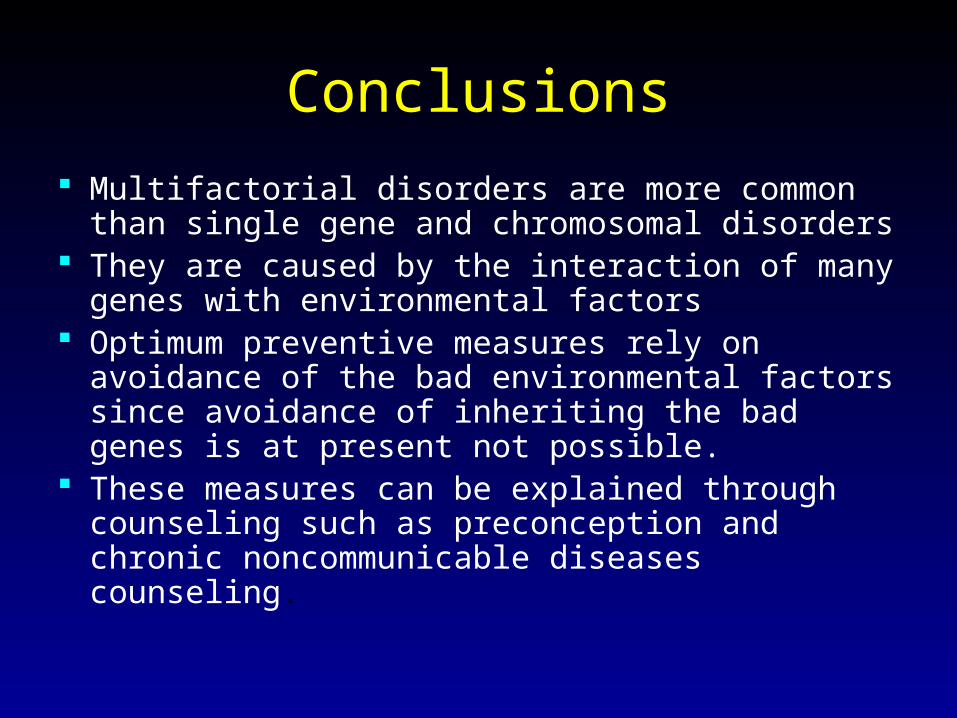
Conclusions
Multifactorial disorders are more common than single gene and chromosomal disorders
They are caused by the interaction of many genes with environmental factors
Optimum preventive measures rely on avoidance of the bad environmental factors since avoidance of inheriting the bad genes is at present not possible.
These measures can be explained through counseling such as preconception and chronic noncommunicable diseases counseling.
台大農藝系 遺傳學 601 20000
Chapter 22 slide 15
Population Genetics
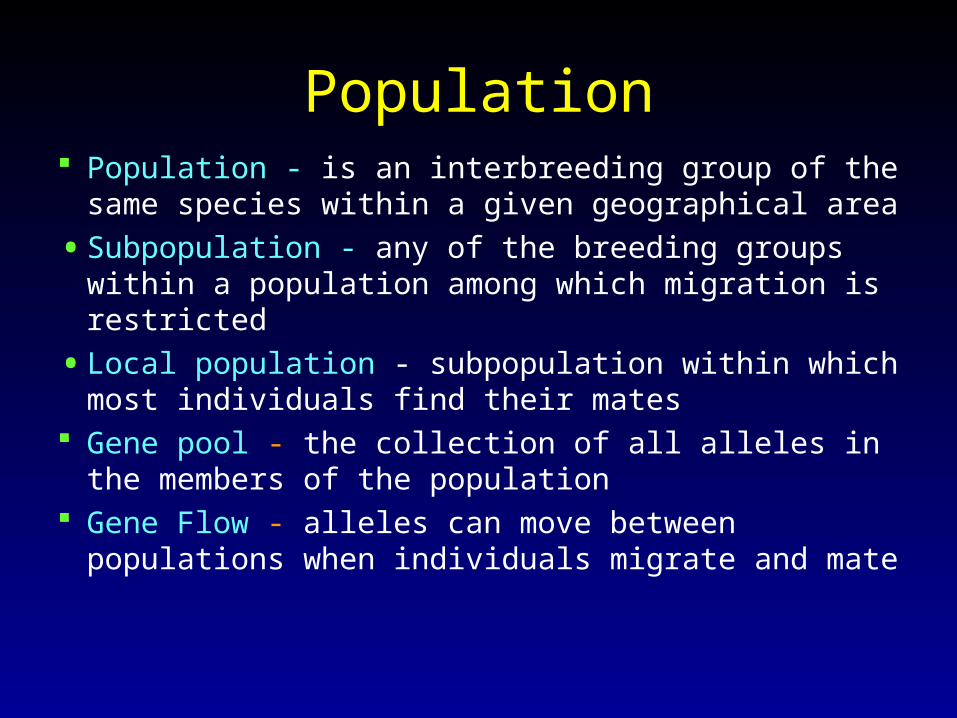
Population Population - is an interbreeding group of the same
species within a given geographical area
• Subpopulation - any of the breeding groups within a population among which migration is restricted
• Local population - subpopulation within which most individuals find their mates
Gene pool - the collection of all alleles in the members of the population
Gene Flow - alleles can move between populations when individuals migrate and mate
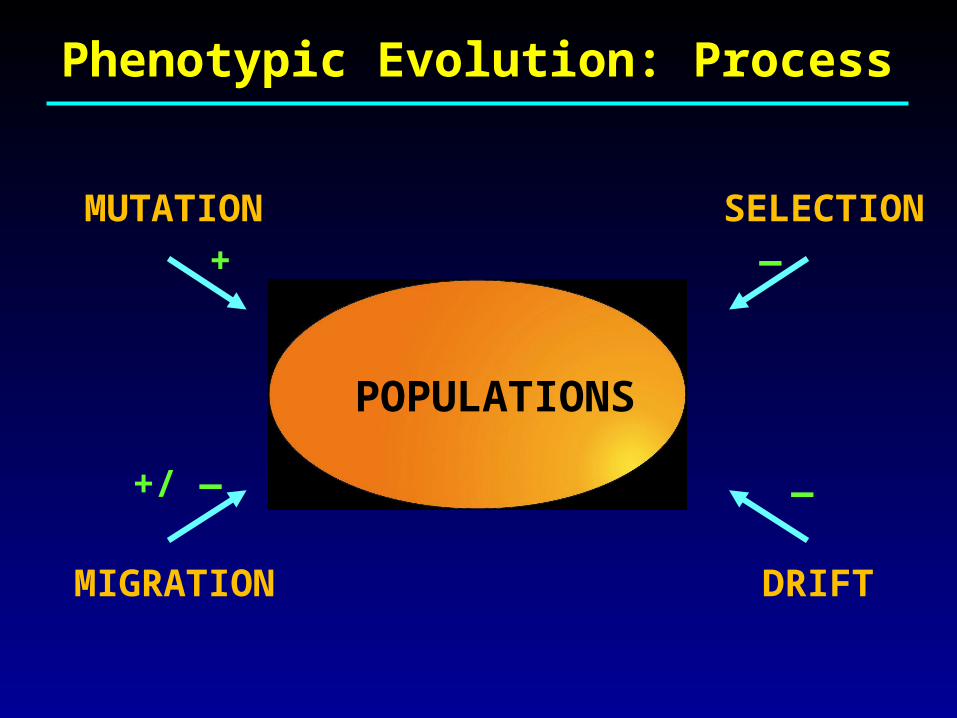
MUTATION SELECTION
DRIFTMIGRATION
POPULATIONS
Phenotypic Evolution: Process
+
+/ —
—
—
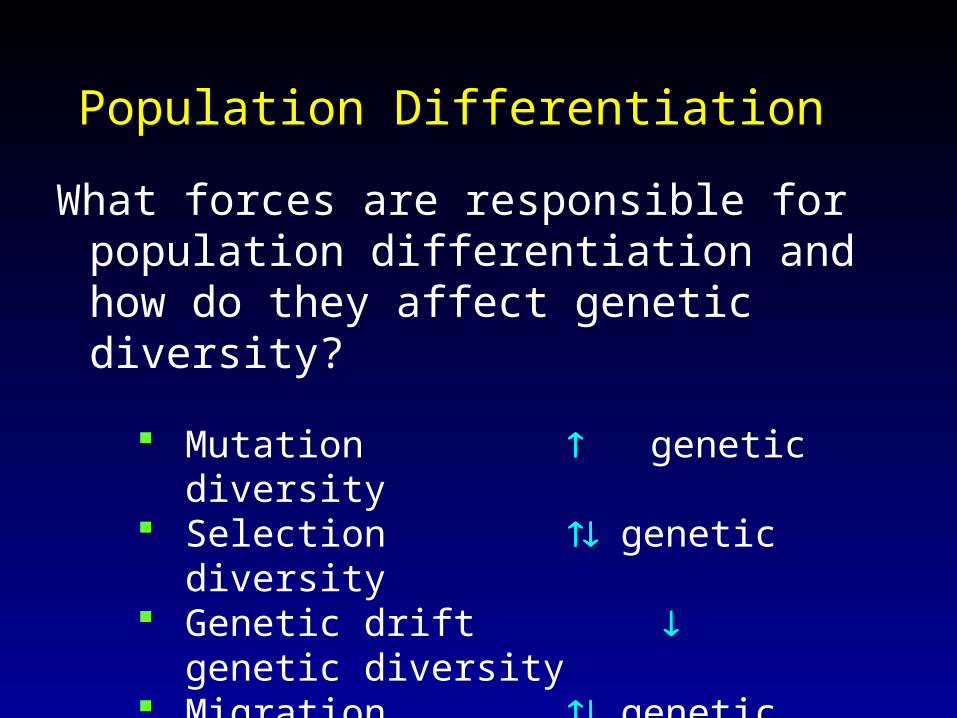
What forces are responsible for population differentiation and how do they affect genetic diversity?
Mutation genetic diversity Selection genetic diversity Genetic drift genetic diversity Migration genetic diversity Non-random mating genetic diversity
Population Differentiation
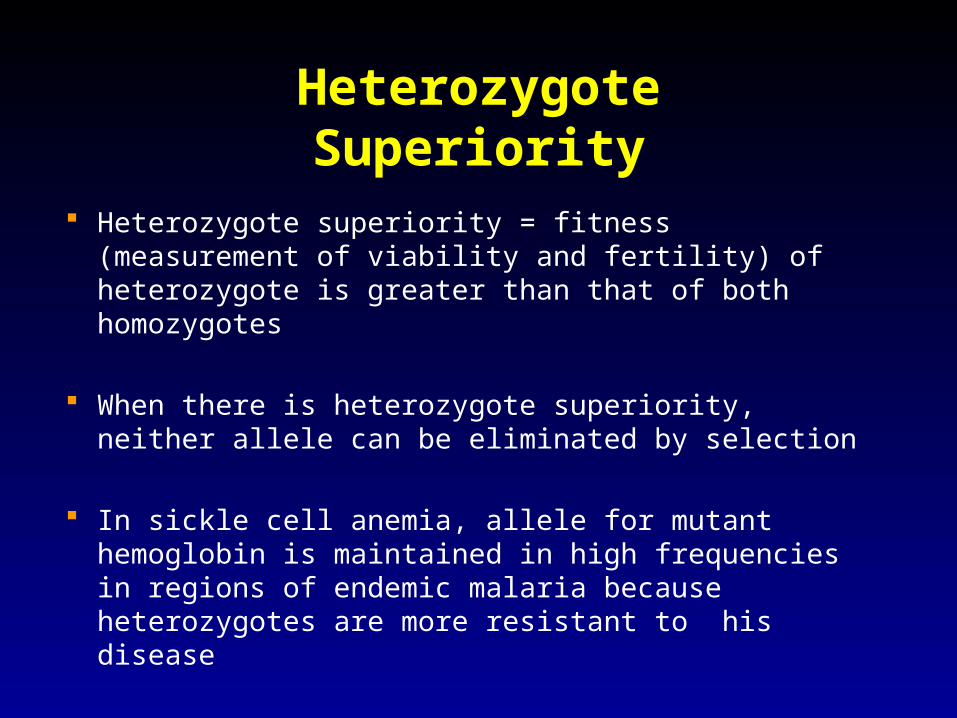
Heterozygote Superiority
Heterozygote superiority = fitness (measurement of viability and fertility) of heterozygote is greater than that of both homozygotes
When there is heterozygote superiority, neither allele can be eliminated by selection
In sickle cell anemia, allele for mutant hemoglobin is maintained in high frequencies in regions of endemic malaria because heterozygotes are more resistant to his disease
20
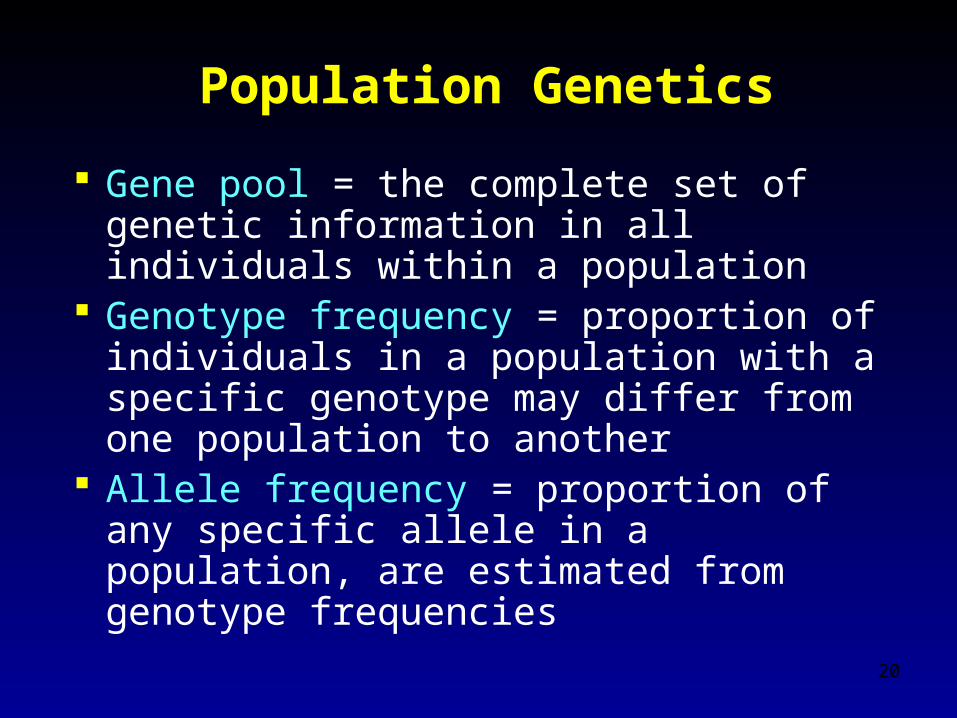
Population Genetics
Gene pool = the complete set of genetic information in all individuals within a population
Genotype frequency = proportion of individuals in a population with a specific genotype may differ from one population to another
Allele frequency = proportion of any specific allele in a population, are estimated from genotype frequencies
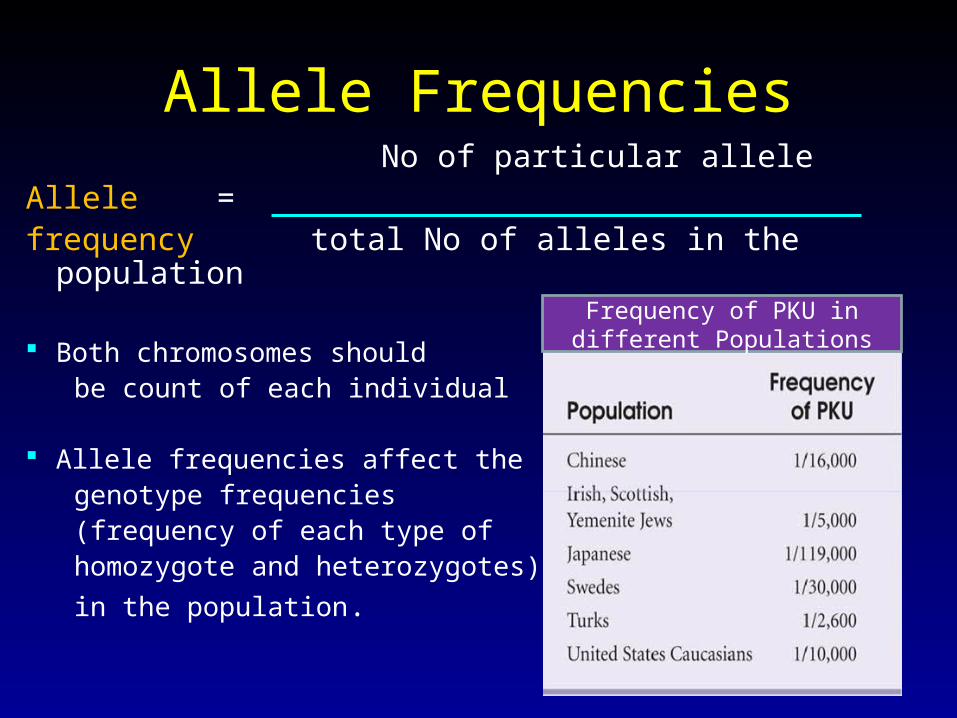
Allele Frequencies No of particular allele
Allele = frequency total No of alleles in the population
Both chromosomes should be count of each individual
Allele frequencies affect the genotype frequencies (frequency of each type of homozygote and heterozygotes)
in the population.
Frequency of PKU in different Populations
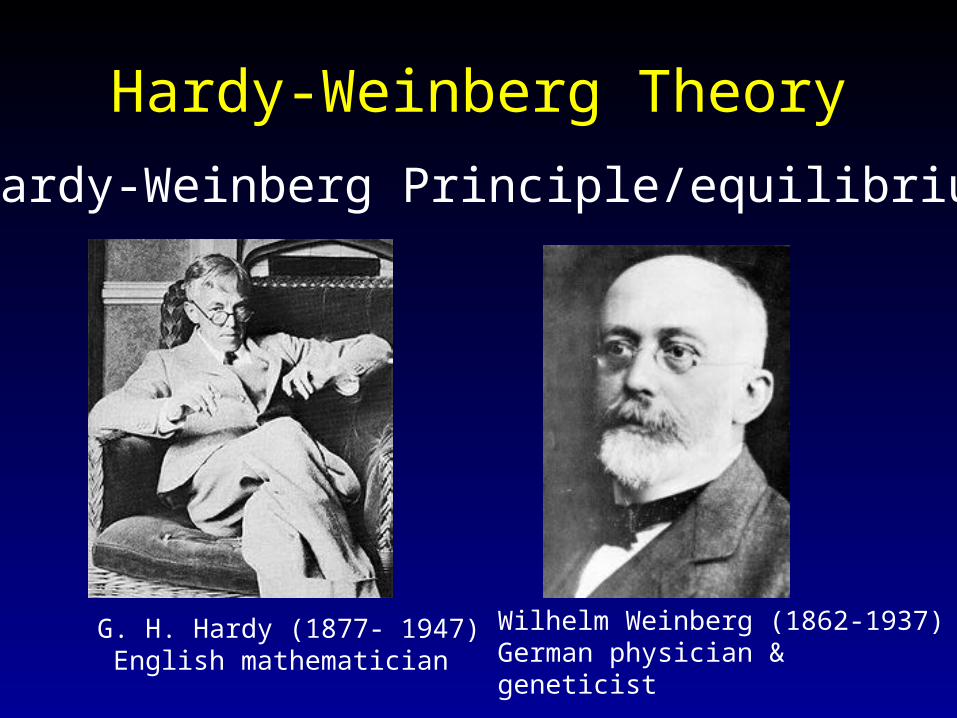
Hardy-Weinberg Theory
Hardy-Weinberg Principle/equilibrium
Wilhelm Weinberg (1862-1937) German physician & geneticist
G. H. Hardy (1877- 1947) English mathematician
Hardy-Weinberg Principle Depends Upon the Following
Assumptions
1. There is no selection
2. There is no mutation
3. There is no migration
4. There are no chance events
5. 5. Individuals choose their mates at random
Using the Hardy-Weinberg Law
in Human Genetics
The Hardy-Weinberg Law can be used to Estimate frequencies of autosomal dominant
and recessive alleles in a population Detect when allele frequencies are shifting in
a population (evolutionary change) Measure the frequency of heterozygous
carriers of deleterious recessive alleles in a population
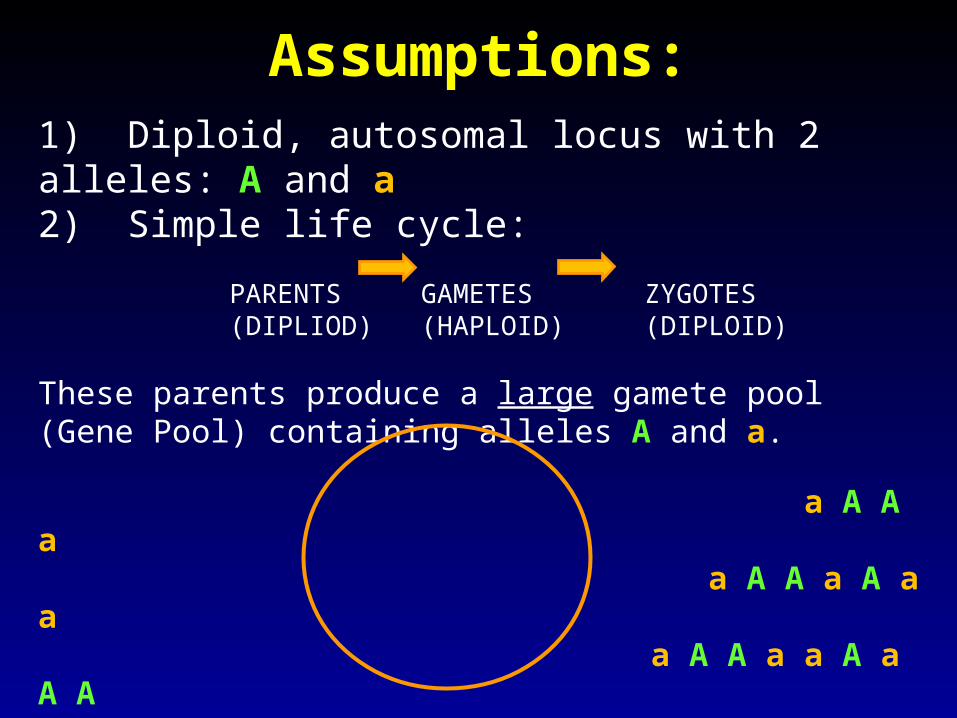
1) Diploid, autosomal locus with 2 alleles: A and a2) Simple life cycle:
PARENTS GAMETES ZYGOTES(DIPLIOD) (HAPLOID) (DIPLOID)
These parents produce a large gamete pool (Gene Pool) containing alleles A and a.
a A A a a A A a A a a a A A a a A a A A a a A A a a a a A a a A A A a A
Assumptions:
26
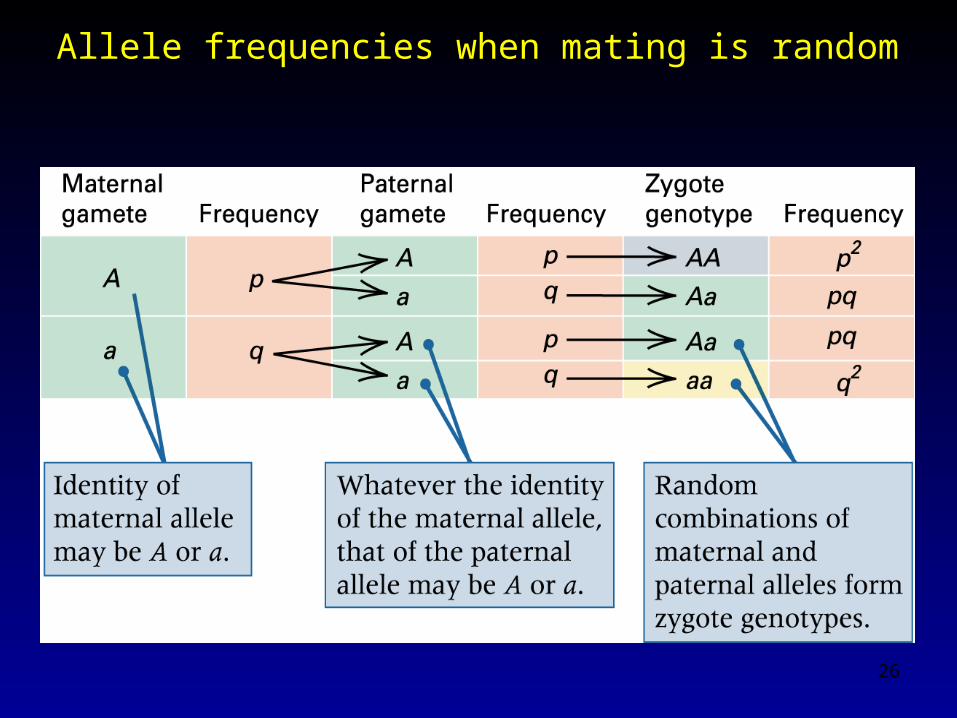
Allele frequencies when mating is random
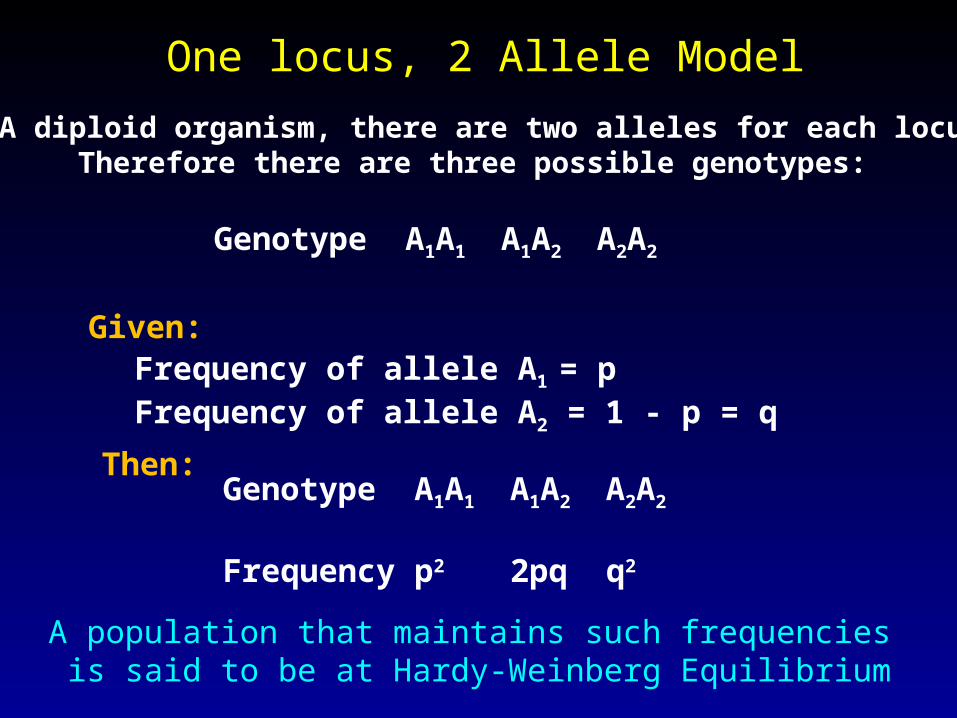
One locus, 2 Allele Model
Genotype A1A1 A1A2 A2A2
Frequency of allele A1 = pFrequency of allele A2 = 1 - p = q
In A diploid organism, there are two alleles for each locus.Therefore there are three possible genotypes:
Given:
Then:Genotype A1A1 A1A2 A2A2
Frequencyp2 2pq q2
A population that maintains such frequencies is said to be at Hardy-Weinberg Equilibrium
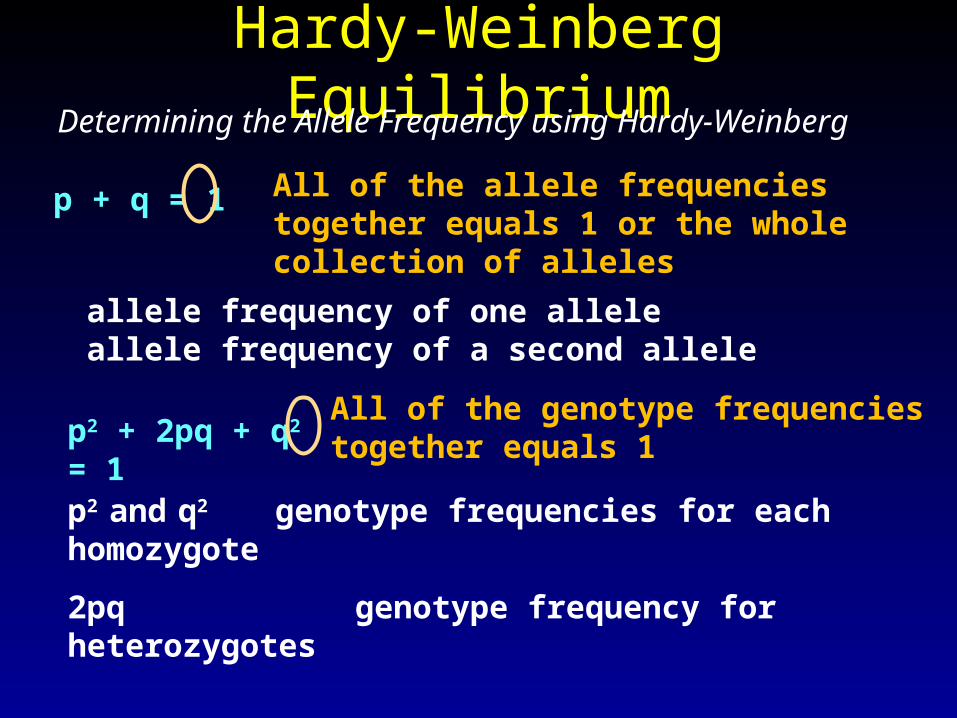
Hardy-Weinberg Equilibrium
p + q = 1
p allele frequency of one alleleq allele frequency of a second allele
p2 + 2pq + q2 = 1
p2 and q2 genotype frequencies for each homozygote
2pq genotype frequency for heterozygotes
All of the allele frequencies together equals 1 or the whole collection of alleles
All of the genotype frequencies together equals 1
Determining the Allele Frequency using Hardy-Weinberg
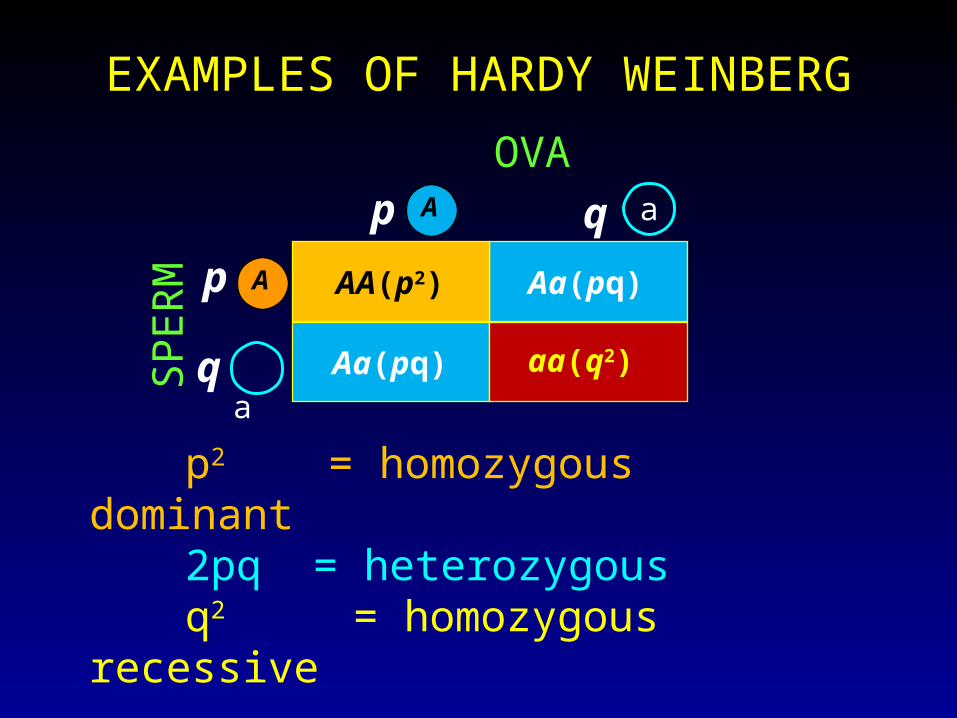
EXAMPLES OF HARDY WEINBERG
AA(p2) Aa(pq)
Aa(pq)
Ap q
Ap
q
p2 = homozygous dominant2pq = heterozygousq2 = homozygous recessive
aa(q2)
a
a
OVAS
PE
RM
THE HARDY WEINBERG PRINCIPLE
Step 1
• Calculating the gene frequencies from the genotype frequencies
• Easily done for codominant alleles (each genotype has a different phenotype)
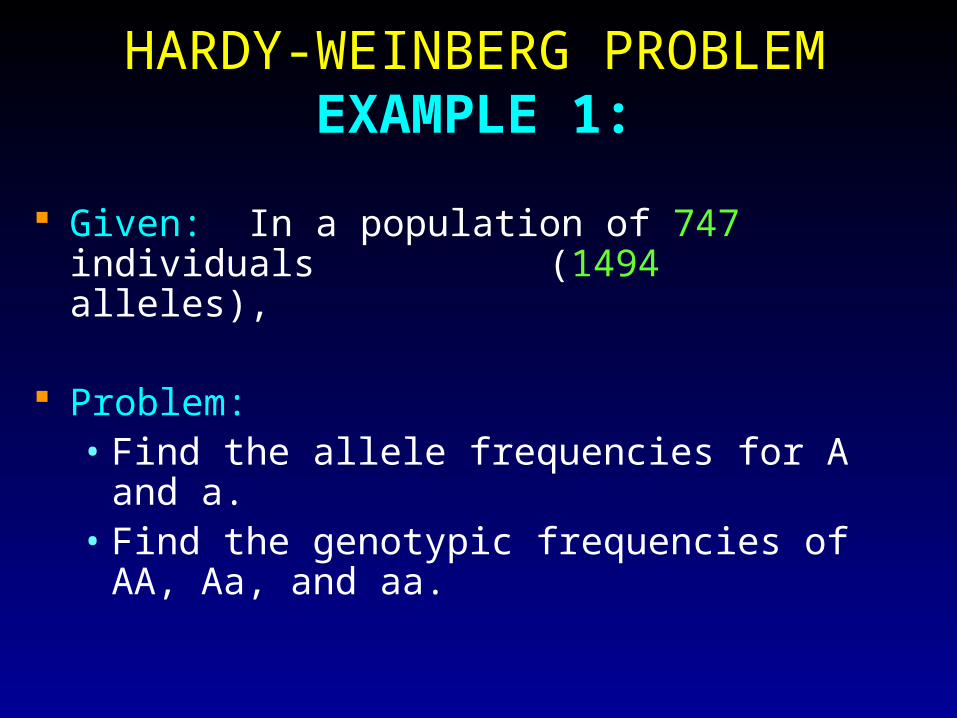
HARDY-WEINBERG PROBLEMEXAMPLE 1:
Given: In a population of 747 individuals (1494 alleles),
Problem: • Find the allele frequencies for A and a.• Find the genotypic frequencies of AA,
Aa, and aa.
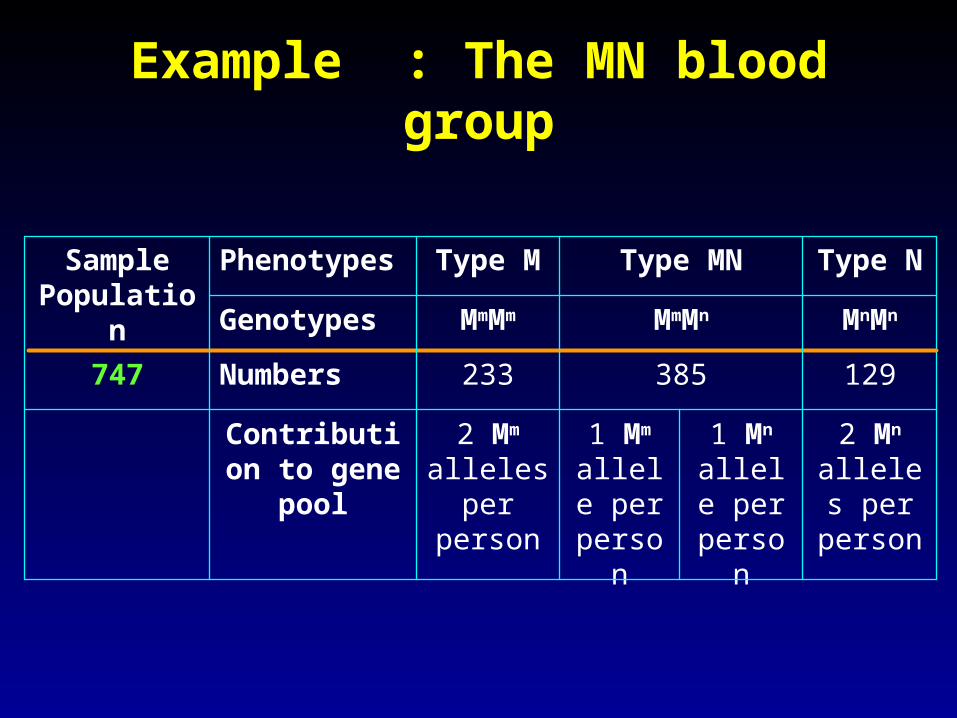
Example : The MN blood group
2 Mn alleles
per person
1 Mn allele per
person
1 Mm allele per
person
2 Mm alleles
per person
Contribution to gene pool
129385233Numbers747
MnMnMmMnMmMmGenotypes
Type NType MNType MPhenotypesSamplePopulation
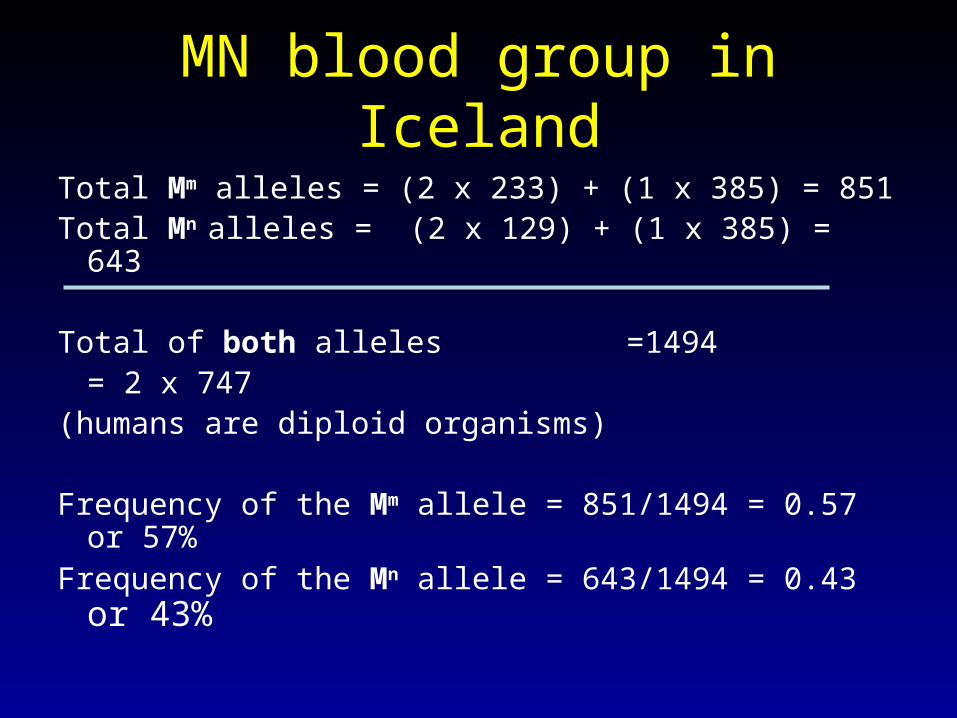
MN blood group in Iceland
Total Mm alleles = (2 x 233) + (1 x 385) = 851Total Mn alleles = (2 x 129) + (1 x 385) = 643
Total of both alleles =1494= 2 x 747
(humans are diploid organisms)
Frequency of the Mm allele = 851/1494 = 0.57 or 57%
Frequency of the Mn allele = 643/1494 = 0.43 or 43%
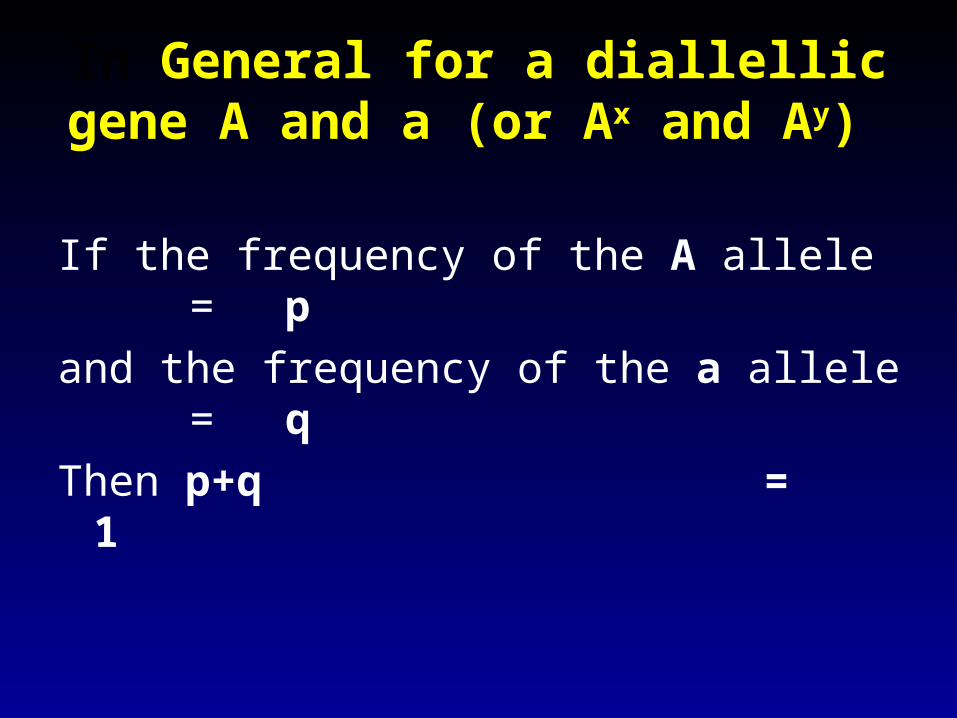
In General for a diallellic gene A and a (or Ax and Ay)
If the frequency of the A allele = p
and the frequency of the a allele = q
Then p+q = 1
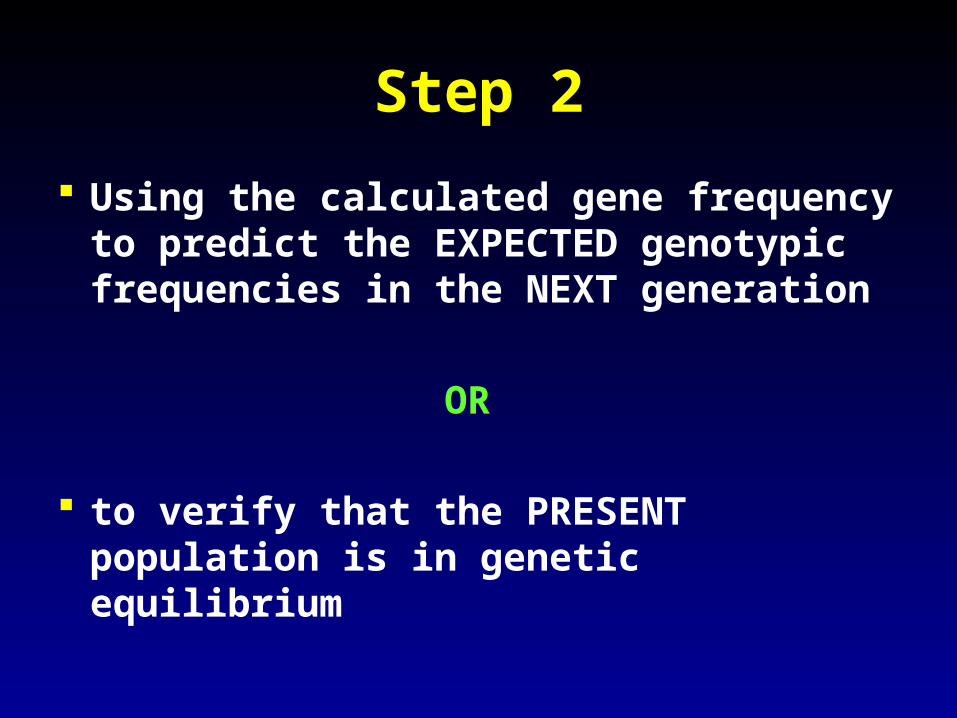
Step 2
Using the calculated gene frequency to predict the EXPECTED genotypic frequencies in the NEXT generation
OR
to verify that the PRESENT population is in genetic equilibrium
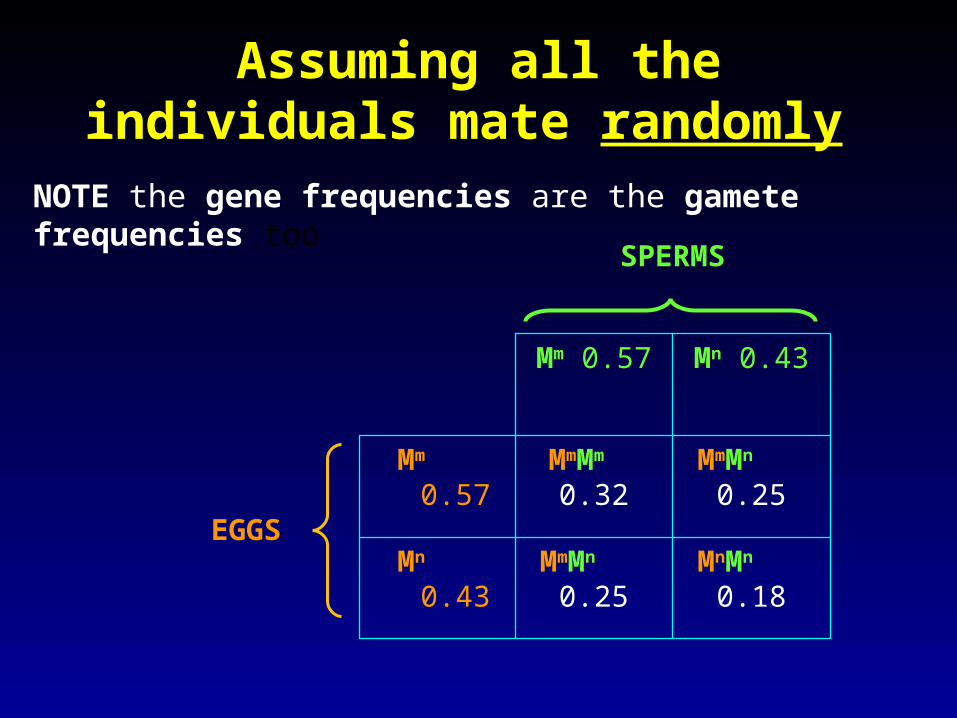
MnMn 0.18
MmMn 0.25
MmMn 0.25
MmMm 0.32
Mn 0.43
Mm 0.57
Mn 0.43Mm 0.57
Assuming all the individuals mate randomly
SPERMS
EGGS
NOTE the gene frequencies are the gamete frequencies too
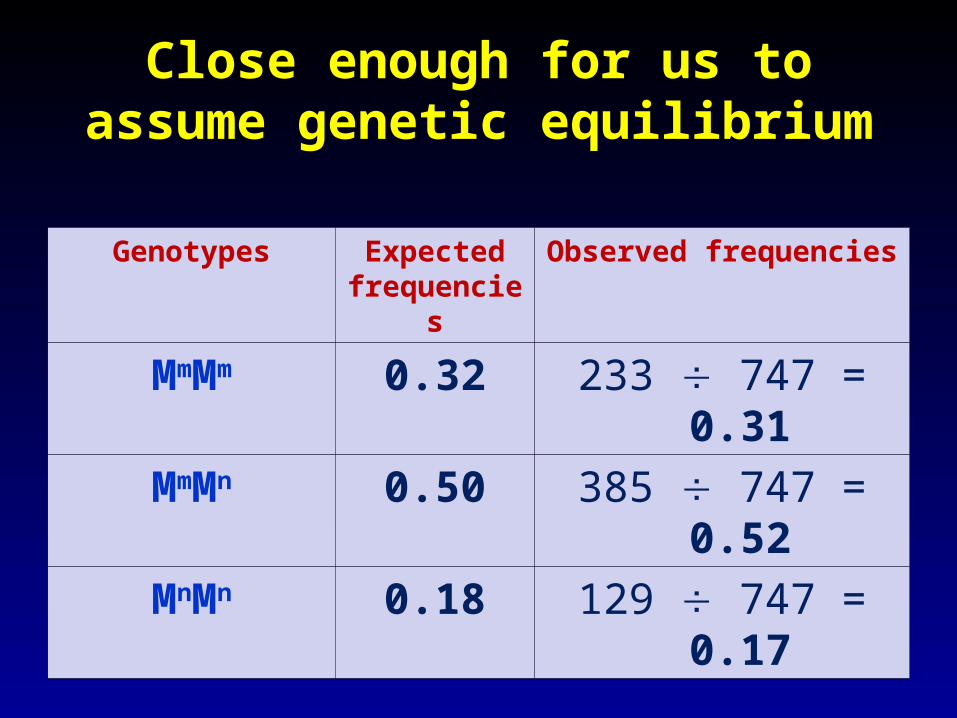
Close enough for us to assume genetic equilibrium
Genotypes Expected frequencies
Observed frequencies
MmMm 0.32 233 747 = 0.31
MmMn 0.50 385 747 = 0.52
MnMn 0.18 129 747 = 0.17
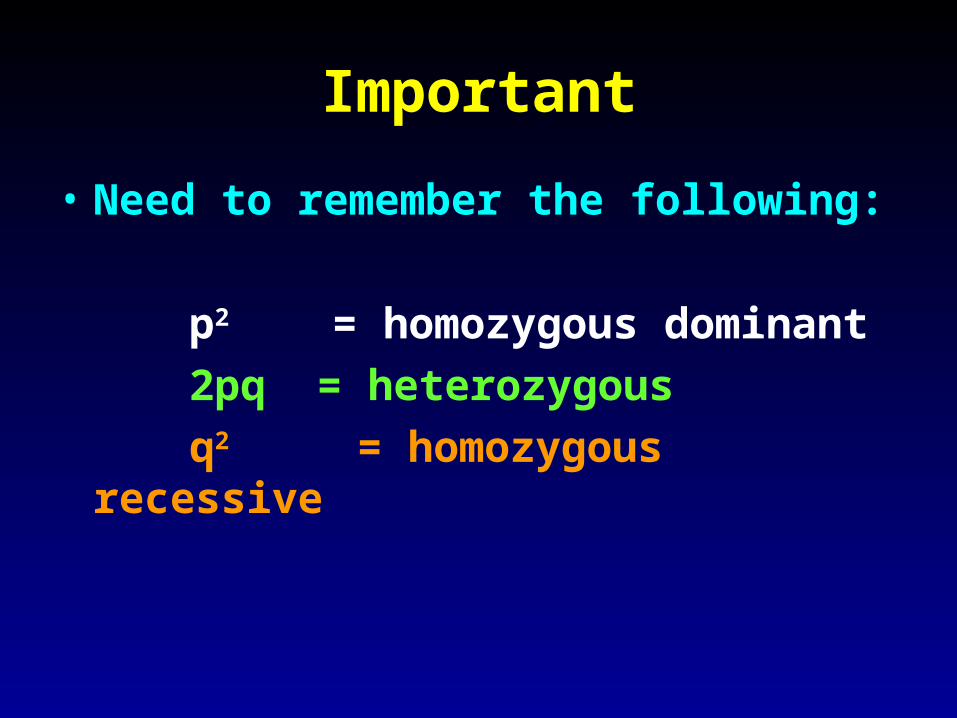
• Need to remember the following:
p2 = homozygous dominant2pq = heterozygousq2 = homozygous
recessive
Important
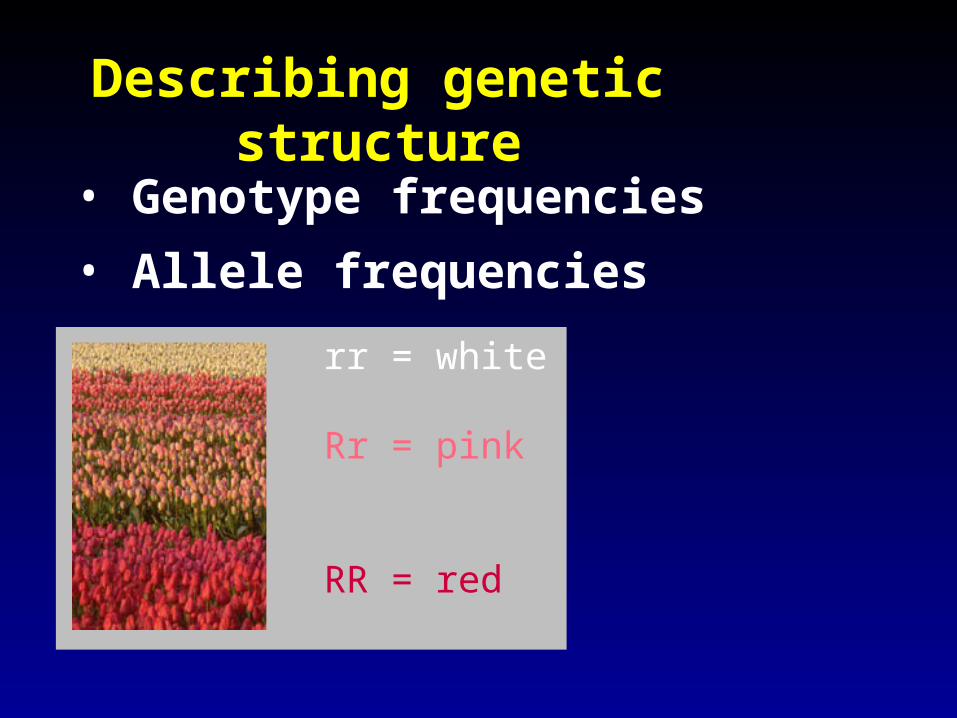
Describing genetic structure
• Genotype frequencies
• Allele frequencies
rr = white
Rr = pink
RR = red
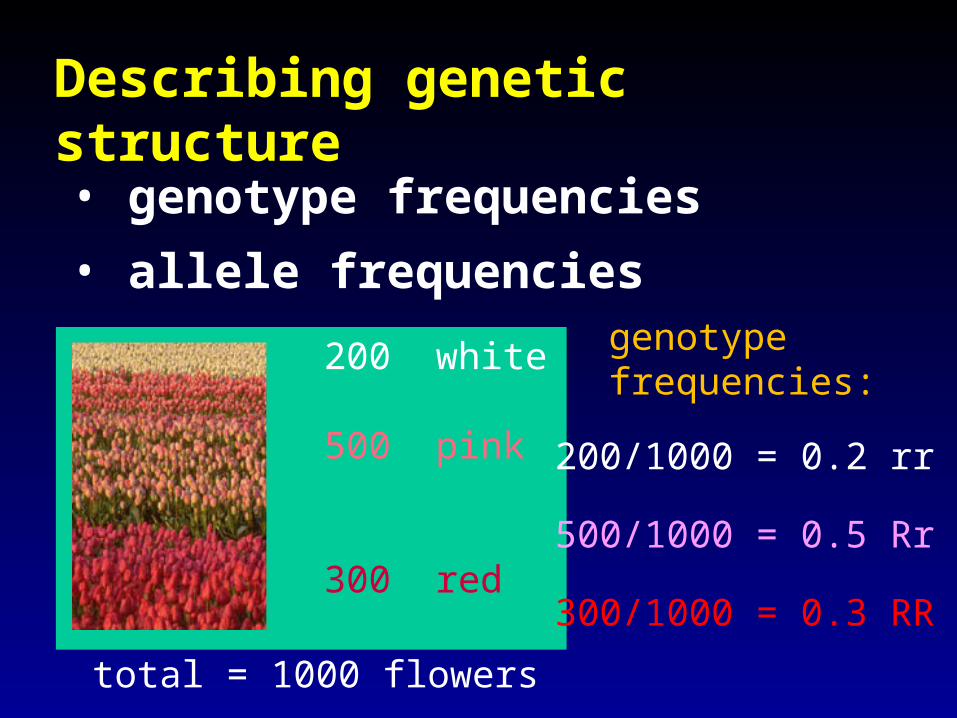
200 white
500 pink
300 red
• genotype frequencies
• allele frequencies
200/1000 = 0.2 rr
500/1000 = 0.5 Rr
300/1000 = 0.3 RR
total = 1000 flowers
genotypefrequencies:
Describing genetic structure

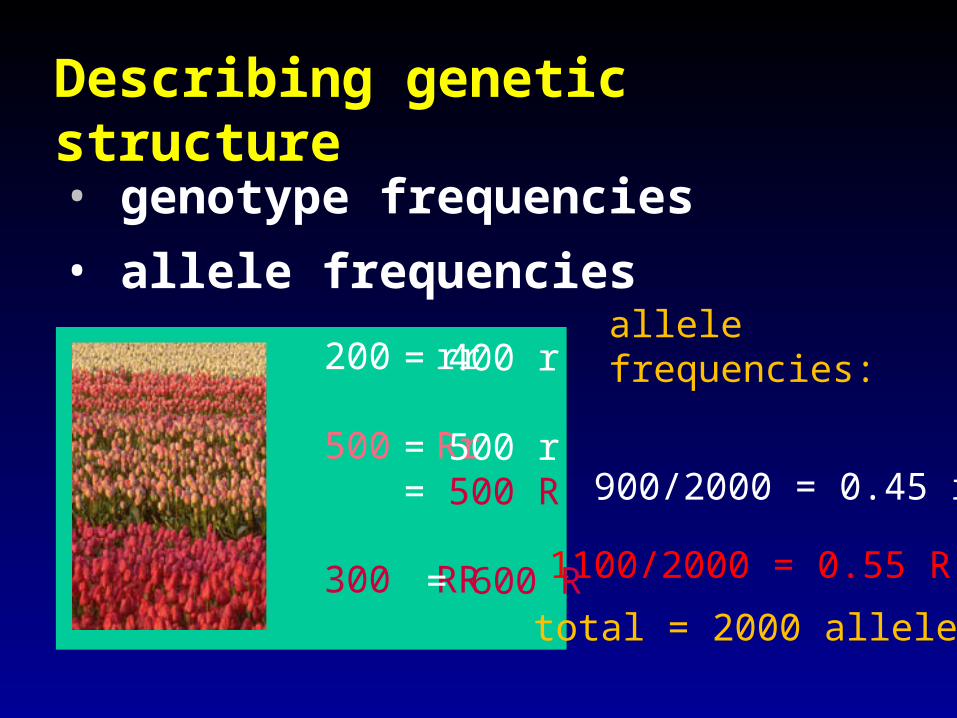
200 rr
500 Rr
300 RR
• genotype frequencies
• allele frequencies
900/2000 = 0.45 r
1100/2000 = 0.55 R
total = 2000 alleles
allelefrequencies:= 400 r
= 500 r= 500 R
= 600 R
Describing genetic structure

Keep In Mind
• The frequency of recessive alleles in a population cannot be measured directly
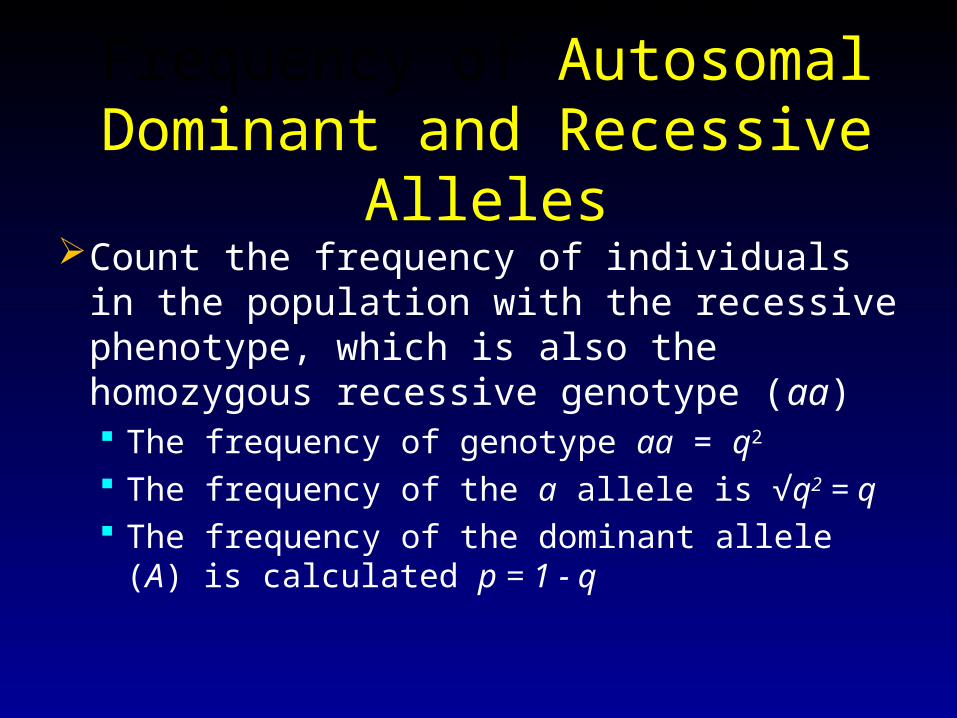
Calculating the Frequency of Autosomal Dominant and
Recessive Alleles
Count the frequency of individuals in the population with the recessive phenotype, which is also the homozygous recessive genotype (aa) The frequency of genotype aa = q2
The frequency of the a allele is √q2 = q The frequency of the dominant allele (A) is
calculated p = 1 - q
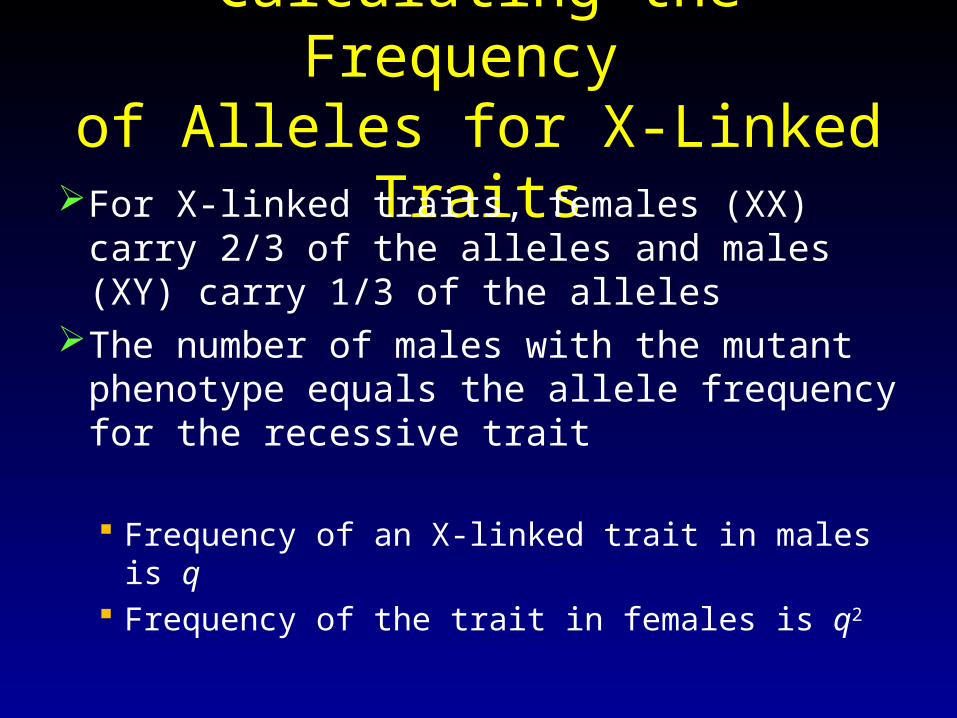
Calculating the Frequency of Alleles for X-Linked TraitsFor X-linked traits, females (XX) carry 2/3
of the alleles and males (XY) carry 1/3 of the alleles
The number of males with the mutant phenotype equals the allele frequency for the recessive trait
Frequency of an X-linked trait in males is q Frequency of the trait in females is q2
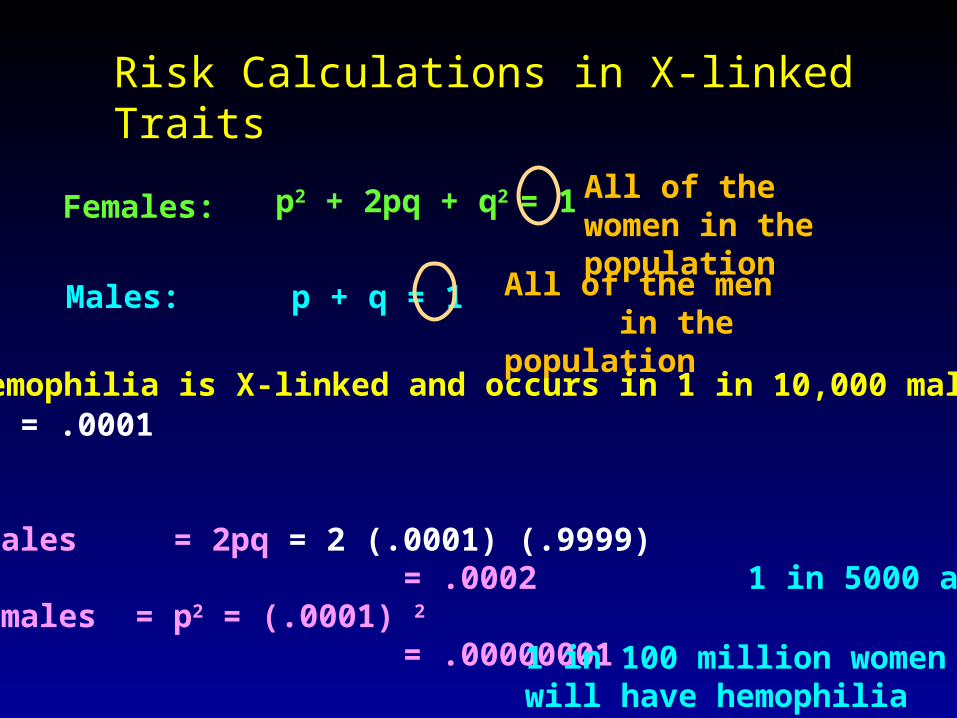
Females: p2 + 2pq + q2 = 1
Males: p + q = 1
All of the women in the population
All of the men in the population
Hemophilia is X-linked and occurs in 1 in 10,000 malesp= 1/10,000 = .0001q= .9999
Carrier females = 2pq = 2 (.0001) (.9999) = .0002 1 in 5000 are carriersAffected females = p2 = (.0001) 2
= .00000001 1 in 100 million womenwill have hemophilia
Risk Calculations in X-linked Traits
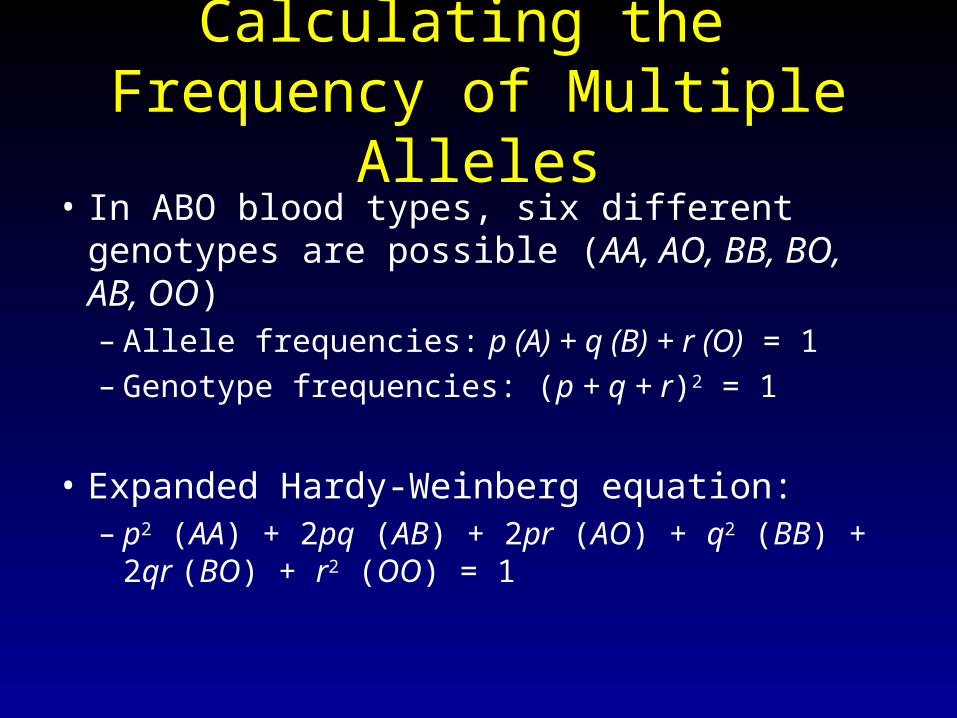
Calculating the Frequency of Multiple
Alleles• In ABO blood types, six different genotypes
are possible (AA, AO, BB, BO, AB, OO)– Allele frequencies: p (A) + q (B) + r (O) = 1– Genotype frequencies: (p + q + r)2 = 1
• Expanded Hardy-Weinberg equation:– p2 (AA) + 2pq (AB) + 2pr (AO) + q2 (BB) + 2qr
(BO) + r2 (OO) = 1
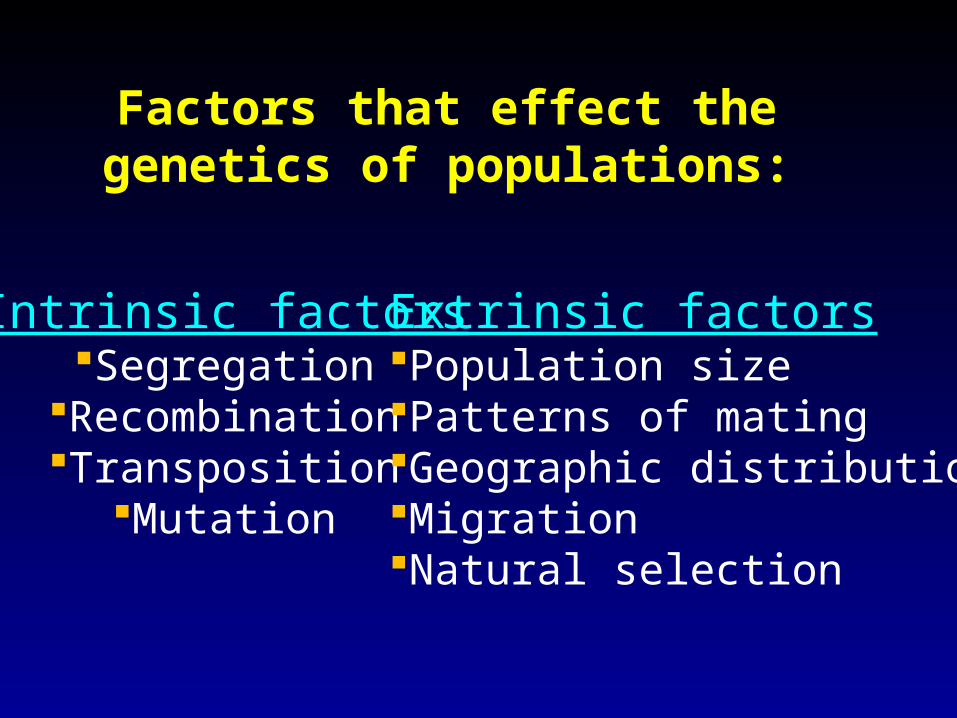
Intrinsic factorsSegregation
RecombinationTransposition
Mutation
Extrinsic factorsPopulation sizePatterns of matingGeographic distributionMigrationNatural selection
Factors that effect the genetics of populations:
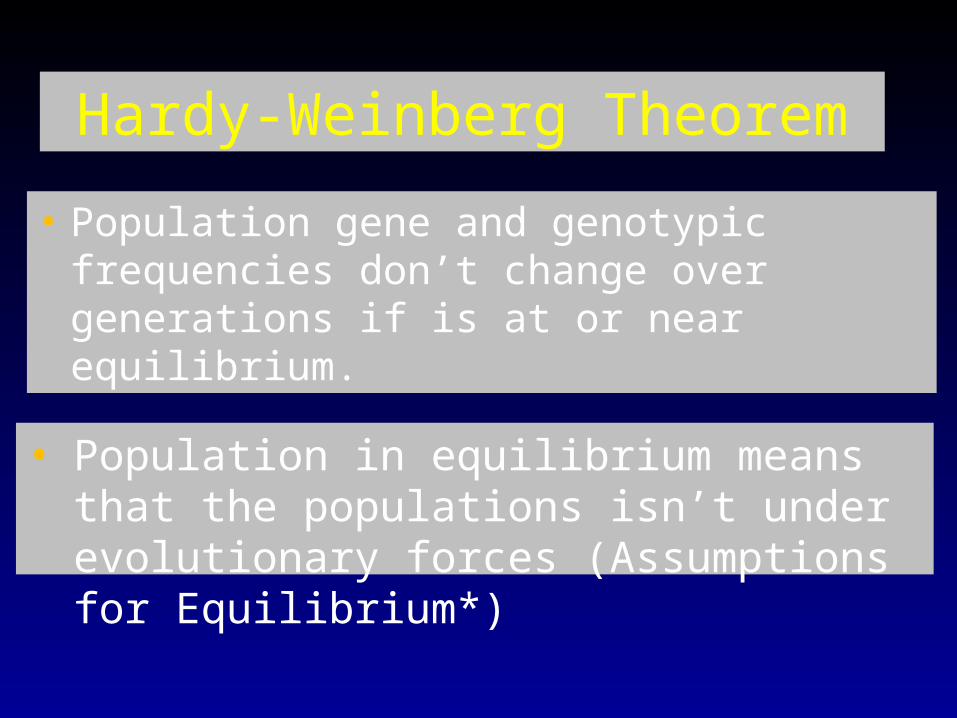
Hardy-Weinberg Theorem
• Population gene and genotypic frequencies don’t change over generations if is at or near equilibrium.
• Population in equilibrium means that the populations isn’t under evolutionary forces (Assumptions for Equilibrium*)