Embed Size (px)
Citation preview
Helsinki University of Technology, Laboratory of Paper Technology
Reports, Series A19
Espoo 2004
MULTILAYERING OF FINE PAPER WITH 3-LAYER HEADBOX
AND ROLL AND BLADE GAP FORMER
Ari Puurtinen
Dissertation for the degree of Doctor of Science in Technology to be presented with due
permission of the Department of Forest Products Technology, for public examination and
debate in Council Room at Helsinki University of Technology (Espoo, Finland) on the 14th of
May 2004 at 12 noon.
Helsinki University of Technology
Department of Forest Products Technology
Laboratory of Paper Technology
Teknillinen korkeakoulu
Puunjalostustekniikan osasto
Paperitekniikan laboratorio
2
PREFACE
This dissertation is based on research carried out at Metso Paper between 1998 and2003. Experimental studies were conducted at the Metso Paper Technology Centerand VTT Processes in Jyväskylä. All work was completed under the guidance ofMetso Academy and funded by Metso Paper. The main goal of the research was toelucidate the behavior of fibers and fillers in the paper thickness direction whenlayering with a 3-layer headbox and a roll and blade gap former.
I would like to express my thanks to Professor Hannu Paulapuro of the Laboratory ofPaper Technology at HUT for his guidance of my work.
For my supervisors at Metso Paper, Pekka Pakarinen and Dr. Johan Grön (also oneof my cowriters), I owe a debt of gratitude for their inspiration, comments, andcritique.
Thanks are also due my former bosses, Lauri Verkasalo (M-Real) and HannuKorhonen (Metso Paper), who made it possible for me to carry out my research workand encouraged me to forge on.
I would like to express special thanks to my cowriters, Terhi Saari (VTT Processes)and Antti Oksanen (VTT Processes), for their attention to my work and for manyinnovative discussions.
I would also like to thank the pilot paper machine and laboratory personnel atRautpohja and the laboratory personnel at VTT Processes for their numerous specialarrangements to accommodate my experimental and analysis work.
I also want to convey my appreciation to various Metso Academy students and otherkey people within the Metso Academy for many fruitful discussions related to theacademic questions of my dissertation. Special thanks go to Dr. Kari Räisänen forhis guidance and encouragement.
Finally, I would like to express my deepest gratitude to my wife Eija and my sonTuomas for their patience and support of my work.
Jyväskylä, May 2004
Ari Puurtinen
3
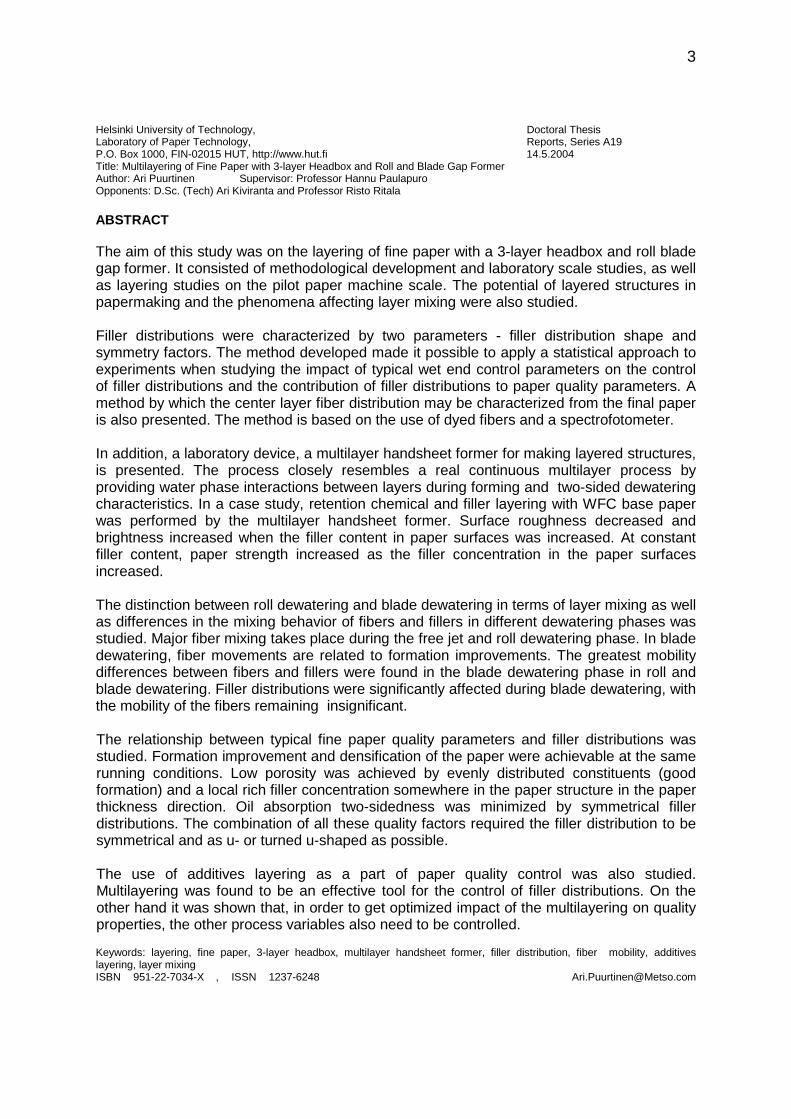
Helsinki University of Technology, Doctoral ThesisLaboratory of Paper Technology, Reports, Series A19P.O. Box 1000, FIN-02015 HUT, http://www.hut.fi 14.5.2004Title: Multilayering of Fine Paper with 3-layer Headbox and Roll and Blade Gap FormerAuthor: Ari Puurtinen Supervisor: Professor Hannu PaulapuroOpponents: D.Sc. (Tech) Ari Kiviranta and Professor Risto Ritala
ABSTRACT
The aim of this study was on the layering of fine paper with a 3-layer headbox and roll bladegap former. It consisted of methodological development and laboratory scale studies, as wellas layering studies on the pilot paper machine scale. The potential of layered structures inpapermaking and the phenomena affecting layer mixing were also studied.
Filler distributions were characterized by two parameters - filler distribution shape andsymmetry factors. The method developed made it possible to apply a statistical approach toexperiments when studying the impact of typical wet end control parameters on the controlof filler distributions and the contribution of filler distributions to paper quality parameters. Amethod by which the center layer fiber distribution may be characterized from the final paperis also presented. The method is based on the use of dyed fibers and a spectrofotometer.
In addition, a laboratory device, a multilayer handsheet former for making layered structures,is presented. The process closely resembles a real continuous multilayer process byproviding water phase interactions between layers during forming and two-sided dewateringcharacteristics. In a case study, retention chemical and filler layering with WFC base paperwas performed by the multilayer handsheet former. Surface roughness decreased andbrightness increased when the filler content in paper surfaces was increased. At constantfiller content, paper strength increased as the filler concentration in the paper surfacesincreased.
The distinction between roll dewatering and blade dewatering in terms of layer mixing as wellas differences in the mixing behavior of fibers and fillers in different dewatering phases wasstudied. Major fiber mixing takes place during the free jet and roll dewatering phase. In bladedewatering, fiber movements are related to formation improvements. The greatest mobilitydifferences between fibers and fillers were found in the blade dewatering phase in roll andblade dewatering. Filler distributions were significantly affected during blade dewatering, withthe mobility of the fibers remaining insignificant.
The relationship between typical fine paper quality parameters and filler distributions wasstudied. Formation improvement and densification of the paper were achievable at the samerunning conditions. Low porosity was achieved by evenly distributed constituents (goodformation) and a local rich filler concentration somewhere in the paper structure in the paperthickness direction. Oil absorption two-sidedness was minimized by symmetrical fillerdistributions. The combination of all these quality factors required the filler distribution to besymmetrical and as u- or turned u-shaped as possible.
The use of additives layering as a part of paper quality control was also studied.Multilayering was found to be an effective tool for the control of filler distributions. On theother hand it was shown that, in order to get optimized impact of the multilayering on qualityproperties, the other process variables also need to be controlled.
Keywords: layering, fine paper, 3-layer headbox, multilayer handsheet former, filler distribution, fiber mobility, additiveslayering, layer mixingISBN 951-22-7034-X , ISSN 1237-6248 [email protected]
4
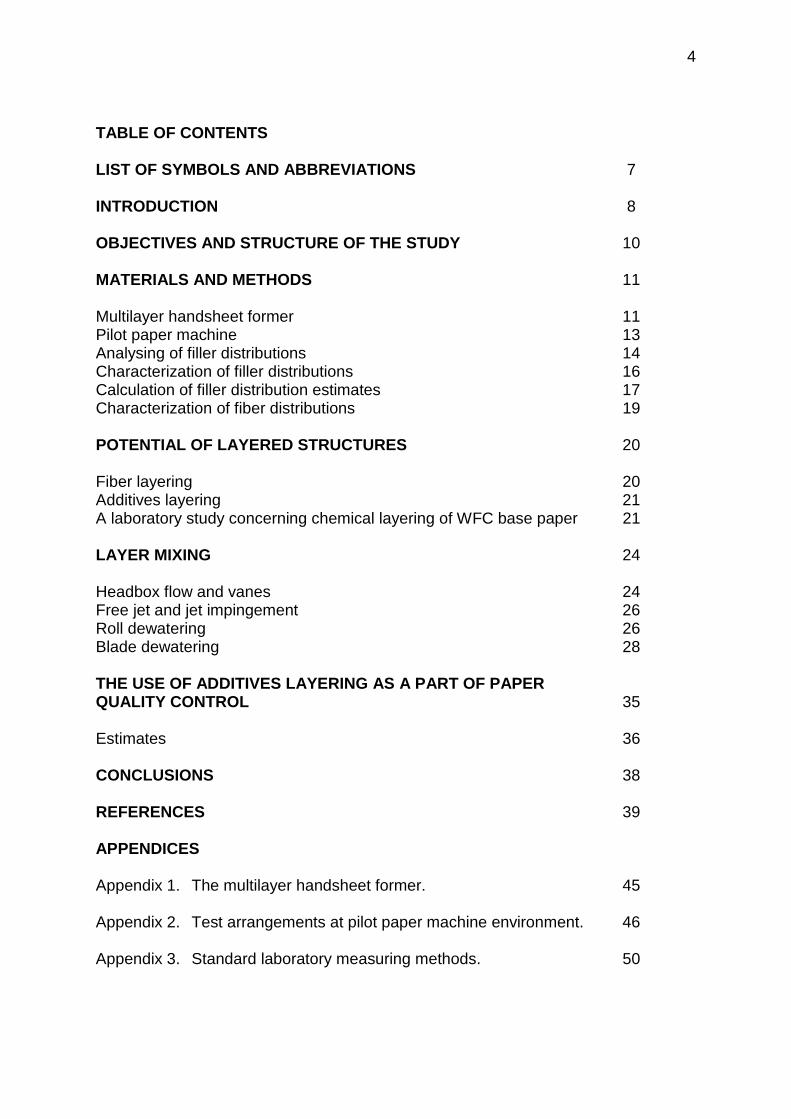
TABLE OF CONTENTS
LIST OF SYMBOLS AND ABBREVIATIONS 7
INTRODUCTION 8
OBJECTIVES AND STRUCTURE OF THE STUDY 10
MATERIALS AND METHODS 11
Multilayer handsheet former 11Pilot paper machine 13Analysing of filler distributions 14Characterization of filler distributions 16Calculation of filler distribution estimates 17Characterization of fiber distributions 19
POTENTIAL OF LAYERED STRUCTURES 20
Fiber layering 20Additives layering 21A laboratory study concerning chemical layering of WFC base paper 21
LAYER MIXING 24
Headbox flow and vanes 24Free jet and jet impingement 26Roll dewatering 26Blade dewatering 28
THE USE OF ADDITIVES LAYERING AS A PART OF PAPERQUALITY CONTROL 35
Estimates 36
CONCLUSIONS 38
REFERENCES 39
APPENDICES
Appendix 1. The multilayer handsheet former. 45
Appendix 2. Test arrangements at pilot paper machine environment. 46
Appendix 3. Standard laboratory measuring methods. 50
5
Appendix 4. Regression coefficients for filler distribution shape and 51symmetry factors, Fue and Fsyme . Relates to thepublications III and V.
Appendix 5. The headbox and former parameters related to the 53publications III, IV and V.
Appendix 6. Estimated vs. measured, porosity, formation index and oil 55absorption two-sidedness. Relates to the publication IV:Controlling filler distributions for improved fine paperproperties.
PUBLICATIONS:
I Puurtinen, A., Saari, T., Oksanen, A., Multilayer Handsheet Former. Paperi ja Puu-Paper and Timber, 85(2): 92-95 (2003).
II Puurtinen, A., Saari, T., Grön, J., A laboratory study on the chemical layering ofWFC base paper. 15th PTS CHT Symposium: Chemische Technologie derPapierherstellung, München, Germany, 37/1…37/11 (2002).
Puurtinen, A., Saari, T., Grön, J., A laboratory study on the chemical layering of WFCbase paper. Professional Papermaking, published by Wochenblatt fürPapierfabrikation, 1(1): 22-25 (2003).
III Puurtinen, A., Wet end control of filler distributions using additive layeringprinciples. Paper Technology, 44(4): 33-40 (2003).
IV Puurtinen, A., Controlling filler distribution for improved fine paper properties.Accepted (13.6.2003) for publication in Appita Journal.
V Puurtinen, A., Oksanen, A., Control of fiber mobility and filler distribution in wet endlayering. NPPRJ, 18(2): 217-225 (2003).

6
LIST OF SYMBOLS AND ABBREVIATIONS
The following symbols and abbreviations are used in this summary:
Fsym Symmetry factorFu Shape factorFts Top side filler contentFbs Bottom side filler contentFcl Center filler contentFsyme Estimate for the symmetry factorFue Estimate for the shape factorFtse Estimate for the top side filler contentFbse Estimate for the bottom side filler contentFcle Estimate for the center filler contentPsym Retention chemical dosing symmetry factorPu Retention chemical dosing shape factorVane length Layering vane lengthQ Headbox flow rateFRvac Forming roll vacuumLBvac12 Combined vacuum of the suction boxes 1 and 2 in
the LB-loading unitBW Basis weightCIE CIE-color coordinate systemL* Lightnessb* Yellow / blue axisCTMP Chemi thermomechanical pulpSC SC paperWFC Woodfree coated paperMFP Metered film pressMSP Metered size pressHSWO Heat set web offsetCS Coherent structureMD Machine directionCD Cross directionIMH Mixing intensity at a specific location in the free jetN Crowding factorFFT Fast fourier transformRMS Root mean squareTS Top sideBS Bottom sidePoroe Estimate for the porosityFormae Estimate for the formation indexOilabe Estimate for the oil absorption two-sidedness
7
INTRODUCTION
The multilayering of paper has been commonly practiced in the manufacture ofpaperboard and tissue grades and it has also been attempted with printing andwriting paper grades. In conventional paper manufacturing, the raw materials aremixed. However, the objective of multilayering is to produce better paper from thesame raw materials, or the same grade of paper from lower quality raw materials. Itis thus motivated by the need to control factors affecting the cost and quality of thepaper.
Layered paper structures can be created in many ways. Separately formed sheetscan be bonded at suitable stages of the process and additional layers can be formedon top of an existing sheet of paper. These methods are common in the manufactureof paperboard where the goal is to produce layers with distinct fiber structures. Thecoating of paper can also be loosely interpreted as a multilayering process.Multilayering can also be accomplished using a so-called multilayer headbox wherelayers are joined after passing through layering vanes either inside or outside theheadbox. The main motivation for using a multilayer headbox is the simplicity andcost-effectiveness of the process compared to the equipment and systems neededfor separate sheet formation.
A number of experiments have been conducted to study and observe the potential ofmultilayering in creating layered paper samples. Less attention has been paid to theextent to which the layers tend to mix together during the continuous papermanufacturing process.
One of the main goals of this work was to clarify the process parameters affectinglayer mixing during roll and blade gap forming with a 3-layer headbox. Attention waspaid to the impact of different dewatering phases on layer mixing and the mixing ofvarious raw materials.
Gap forming produces layered paper structures by itself. The ZD filler distributioncan be adjusted by changing the forming conditions. The impact of changes in theforming conditions on the filler distribution also depends on the paper stock used. Inthe manufacture of SC paper, for example, TMP-based stock produces a deep U-shaped filler distribution, whereas GW-based stock yields a smoother distribution.
This study examined the filler distribution of fine paper and factors affecting fibermigration in the paper sheet’s center layer. The results were examined from theperspective of control factors (machine parameters) and dewatering duringformation. The goal was to find the most significant factors affecting center layer fibermigration and the formation of the filler distribution. A secondary goal was also toestimate what factors will produce selective fiber layering (layer purity) and thedesired filler distribution simultaneously.
The study examined the dependence of some key fine paper quality factors on thefiller distribution. The examination was based on empirical models created to depictthe dependence of filler distributions and the quality variables examined on thecontrol parameters.

8
Laboratory scale sheet molds are fairly widely used tools in the study ofpapermaking. This type of research includes raw material studies to determine thepotential of stock components, or the partial or complete simulation of manufacturingprocesses. One of this study’s goals was to introduce a laboratory sheet mold thatcould be used to partially simulate multilayer headbox layering and to investigate thepaper technology potential of multilayering using purely layered paper samples. Themultilayer sheet mold approach was also used to develop the methods used todetermine the purity of the layers.
9
OBJECTIVES AND STRUCTURE OF THE STUDY
The main objective of this work was to study the process parameters affecting layermixing during roll and blade gap forming with a 3-layer headbox and to review thesignificance of layered structures on fine paper properties. One objective was also todistinguish various wet end mechanisms affecting the filler distributions and fibermobility in the paper thickness direction during the paper making process. The workwas based on laboratory and pilot paper machine studies. The main emphasis wason the study of the role of the filler distributions.
The main objective was divided into the following sub-objectives:
1. To review the current knowledge of:• the importance of layered structures• various layering techniques• process variables controlling filler distributions and fiber mobility• the methods used to evaluate filler distributions and fiber mobility
2. To introduce and test a laboratory device for making layered paper structures.
3. To develop a method to characterize filler distribution, and to evaluate the role ofdifferent wet end processes in controlling it.
4. To evaluate the significance of filler distribution on some fine paper qualityproperties.
5. To develop methods to determine fiber mobility in the paper thickness directionand to evaluate the role of different process variables in controlling it.
6. To distinguish different process variables controlling filler distribution and fibermobility in the paper thickness direction.
PublicationI Multilayer Handsheet Former 1,2II A laboratory study on the chemical layering of WFC base
paper1,4
III Wet end control of filler distributions using additiveslayering principles
1,3,6
IV Controlling filler distribution for improved fine paperproperties
1,3,4
V Control of fiber mobility and filler distribution in wet endlayering
1,5,6
10
MATERIALS AND METHODS
Multilayer handsheet former
Laboratory handsheet forming is a widely used method to produce paper sheetsunder controlled circumstances. The basic research into the potential of fibers andfurnishes with respect to paper quality issues is often based upon laboratoryhandsheet studies. Some of these methods may also be helpful in producing layeredsheet structures [1-9].
A common way to create a layered sheet is to filter new layers through alreadyformed layers [10-14]. Another possibility is to produce layered sheet structures bybonding wet, single layered sheets together under pressurized conditions [15,16].One task in the laboratory sheet forming field is to some extent to imitate thecontinuous forming processes [1,2,4]. Two common features of the above-mentionedlaboratory formers are that basically they can be used to produce layered structures,but that the dewatering is single-sided. Only a few laboratory scale methods arecapable of two-sided water removal [17-19].
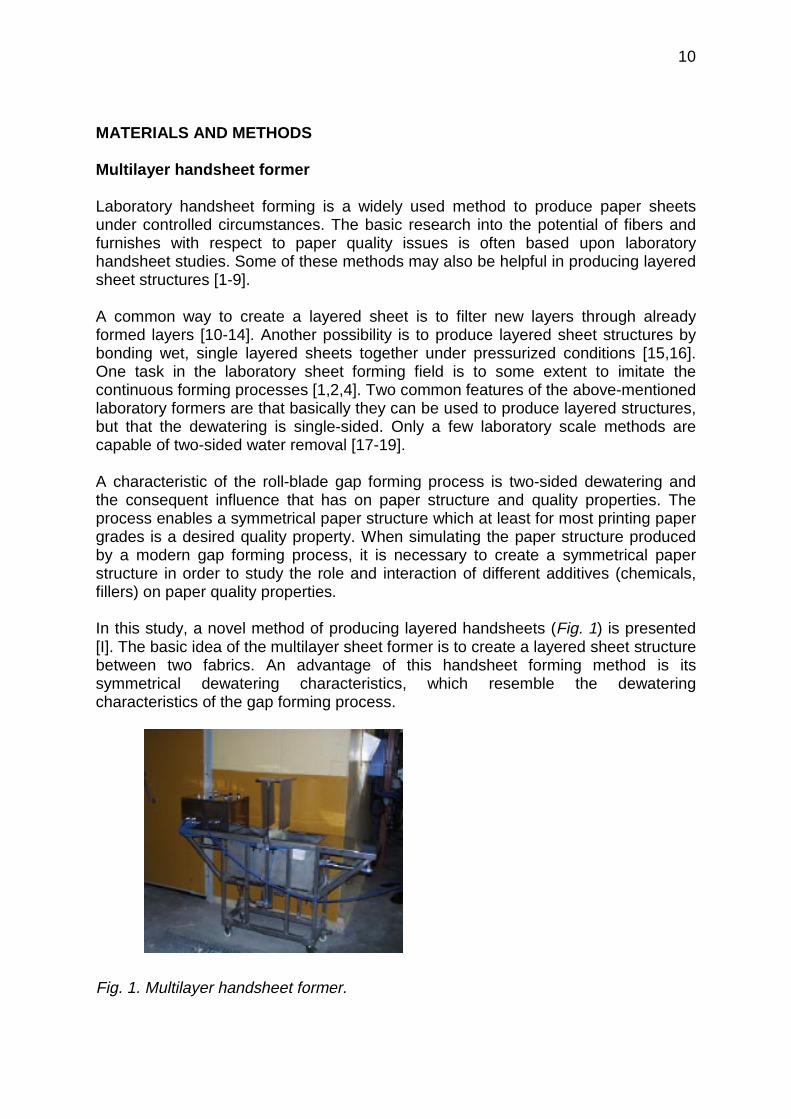
A characteristic of the roll-blade gap forming process is two-sided dewatering andthe consequent influence that has on paper structure and quality properties. Theprocess enables a symmetrical paper structure which at least for most printing papergrades is a desired quality property. When simulating the paper structure producedby a modern gap forming process, it is necessary to create a symmetrical paperstructure in order to study the role and interaction of different additives (chemicals,fillers) on paper quality properties.
In this study, a novel method of producing layered handsheets (Fig. 1) is presented[I]. The basic idea of the multilayer sheet former is to create a layered sheet structurebetween two fabrics. An advantage of this handsheet forming method is itssymmetrical dewatering characteristics, which resemble the dewateringcharacteristics of the gap forming process.
Fig. 1. Multilayer handsheet former.
11
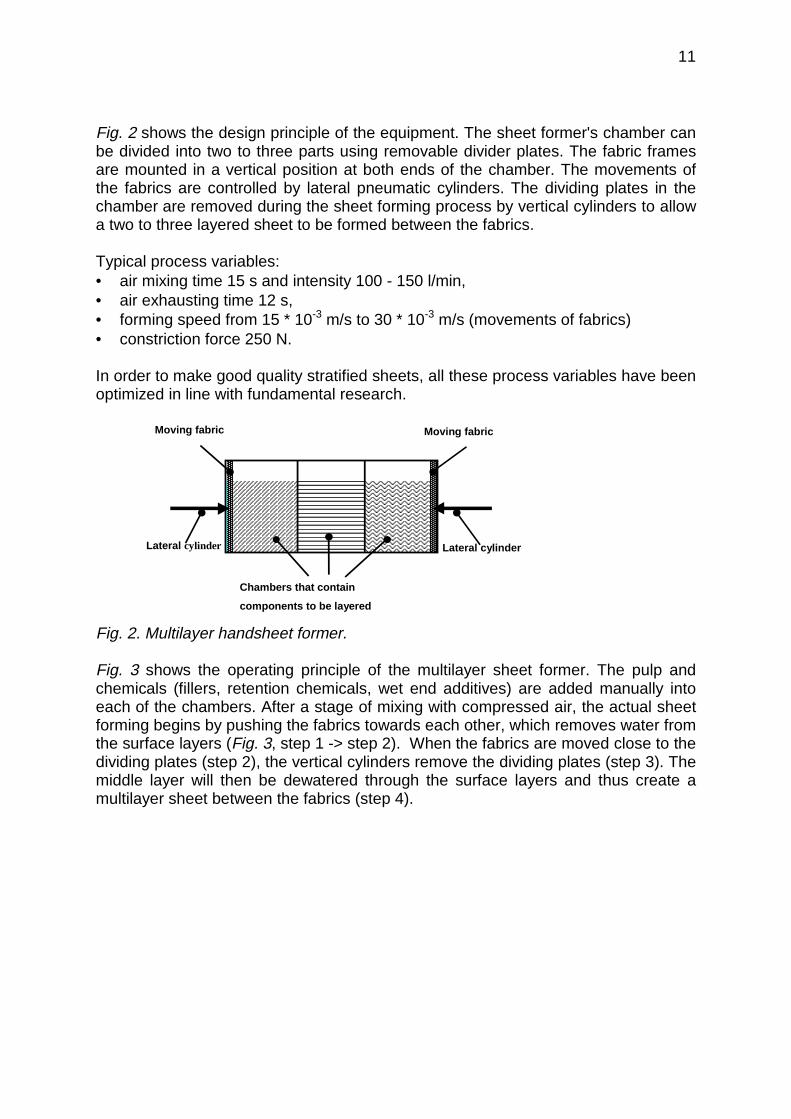
Fig. 2 shows the design principle of the equipment. The sheet former's chamber canbe divided into two to three parts using removable divider plates. The fabric framesare mounted in a vertical position at both ends of the chamber. The movements ofthe fabrics are controlled by lateral pneumatic cylinders. The dividing plates in thechamber are removed during the sheet forming process by vertical cylinders to allowa two to three layered sheet to be formed between the fabrics.
Typical process variables:• air mixing time 15 s and intensity 100 - 150 l/min,• air exhausting time 12 s,• forming speed from 15 * 10-3 m/s to 30 * 10-3 m/s (movements of fabrics)• constriction force 250 N.
In order to make good quality stratified sheets, all these process variables have beenoptimized in line with fundamental research.
Moving fabric
Lateral cylinder
Chambers that contain
components to be layered
Moving fabric
Lateral cylinder
Fig. 2. Multilayer handsheet former.
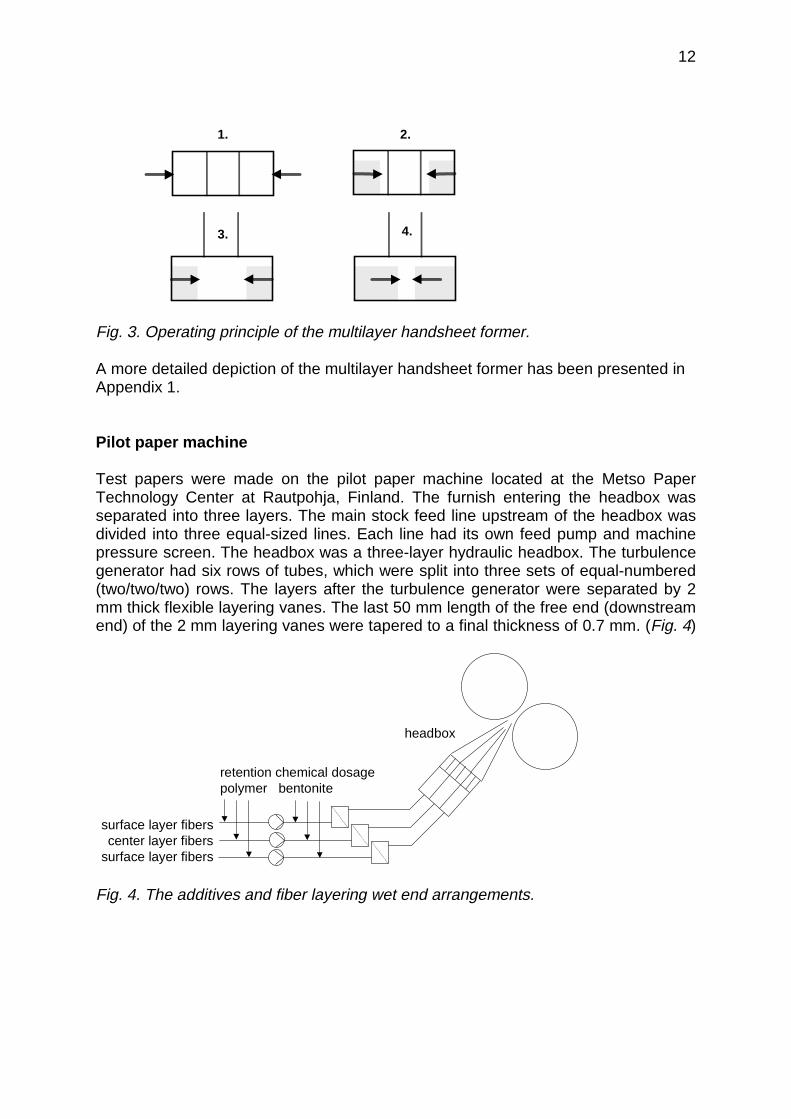
Fig. 3 shows the operating principle of the multilayer sheet former. The pulp andchemicals (fillers, retention chemicals, wet end additives) are added manually intoeach of the chambers. After a stage of mixing with compressed air, the actual sheetforming begins by pushing the fabrics towards each other, which removes water fromthe surface layers (Fig. 3, step 1 -> step 2). When the fabrics are moved close to thedividing plates (step 2), the vertical cylinders remove the dividing plates (step 3). Themiddle layer will then be dewatered through the surface layers and thus create amultilayer sheet between the fabrics (step 4).
12
���������������������������������������
���������������������������������������
������������������������������������������
������������
������������
���������
���������������������������������������
���������
������������
������������
���������
������������������������������������������
���������
������������
������������
1. 2.
3. 4.
���������
���������
���������
������������
������������
Fig. 3. Operating principle of the multilayer handsheet former.
A more detailed depiction of the multilayer handsheet former has been presented inAppendix 1.
Pilot paper machine
Test papers were made on the pilot paper machine located at the Metso PaperTechnology Center at Rautpohja, Finland. The furnish entering the headbox wasseparated into three layers. The main stock feed line upstream of the headbox wasdivided into three equal-sized lines. Each line had its own feed pump and machinepressure screen. The headbox was a three-layer hydraulic headbox. The turbulencegenerator had six rows of tubes, which were split into three sets of equal-numbered(two/two/two) rows. The layers after the turbulence generator were separated by 2mm thick flexible layering vanes. The last 50 mm length of the free end (downstreamend) of the 2 mm layering vanes were tapered to a final thickness of 0.7 mm. (Fig. 4)
retention chemical dosagepolymer bentonite
surface layer fiberscenter layer fibers
surface layer fibers
headbox
Fig. 4. The additives and fiber layering wet end arrangements.
13
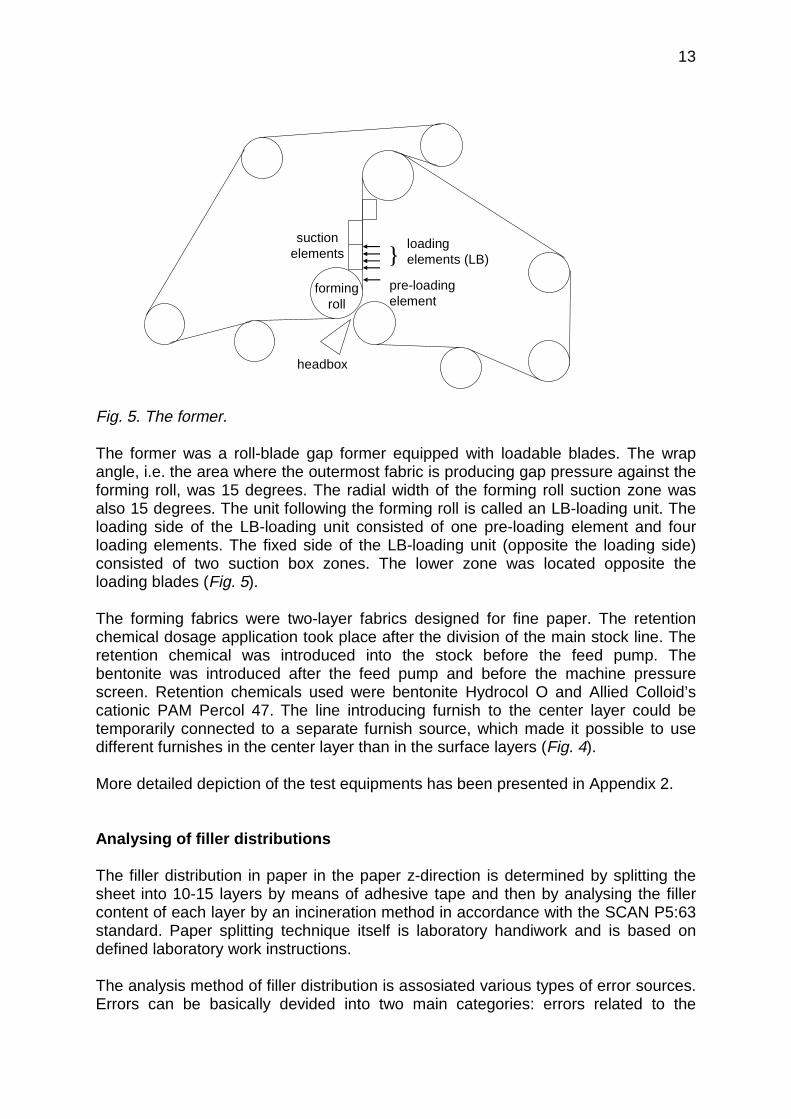
suctionelements
loadingelements (LB)
pre-loadingelement
formingroll
}
headbox
Fig. 5. The former.
The former was a roll-blade gap former equipped with loadable blades. The wrapangle, i.e. the area where the outermost fabric is producing gap pressure against theforming roll, was 15 degrees. The radial width of the forming roll suction zone wasalso 15 degrees. The unit following the forming roll is called an LB-loading unit. Theloading side of the LB-loading unit consisted of one pre-loading element and fourloading elements. The fixed side of the LB-loading unit (opposite the loading side)consisted of two suction box zones. The lower zone was located opposite theloading blades (Fig. 5).
The forming fabrics were two-layer fabrics designed for fine paper. The retentionchemical dosage application took place after the division of the main stock line. Theretention chemical was introduced into the stock before the feed pump. Thebentonite was introduced after the feed pump and before the machine pressurescreen. Retention chemicals used were bentonite Hydrocol O and Allied Colloid’scationic PAM Percol 47. The line introducing furnish to the center layer could betemporarily connected to a separate furnish source, which made it possible to usedifferent furnishes in the center layer than in the surface layers (Fig. 4).
More detailed depiction of the test equipments has been presented in Appendix 2.
Analysing of filler distributions
The filler distribution in paper in the paper z-direction is determined by splitting thesheet into 10-15 layers by means of adhesive tape and then by analysing the fillercontent of each layer by an incineration method in accordance with the SCAN P5:63standard. Paper splitting technique itself is laboratory handiwork and is based ondefined laboratory work instructions.
The analysis method of filler distribution is assosiated various types of error sources.Errors can be basically devided into two main categories: errors related to the
14
analysis technique including the splitting technique itself and further sampletreatment such as sample weighting and ashing, and errors related to the paper'sstructural issues such as homogeneity of the paper structure and material properties.
In planar directions (MD and CD) the paper homogeneity is mainly related to thepaper making process stability. In the paper z-direction the overall paper processstability but also paper z-directional internal structure is affecting the papersplittability in the paper z-direction. Studies related to the mechanisms andmeasurements of the layered orientation structure of paper sheet, Erkkilä [20] foundthat the splittability of the paper sheet was not dependent on the direction thesplitting has been conducted.
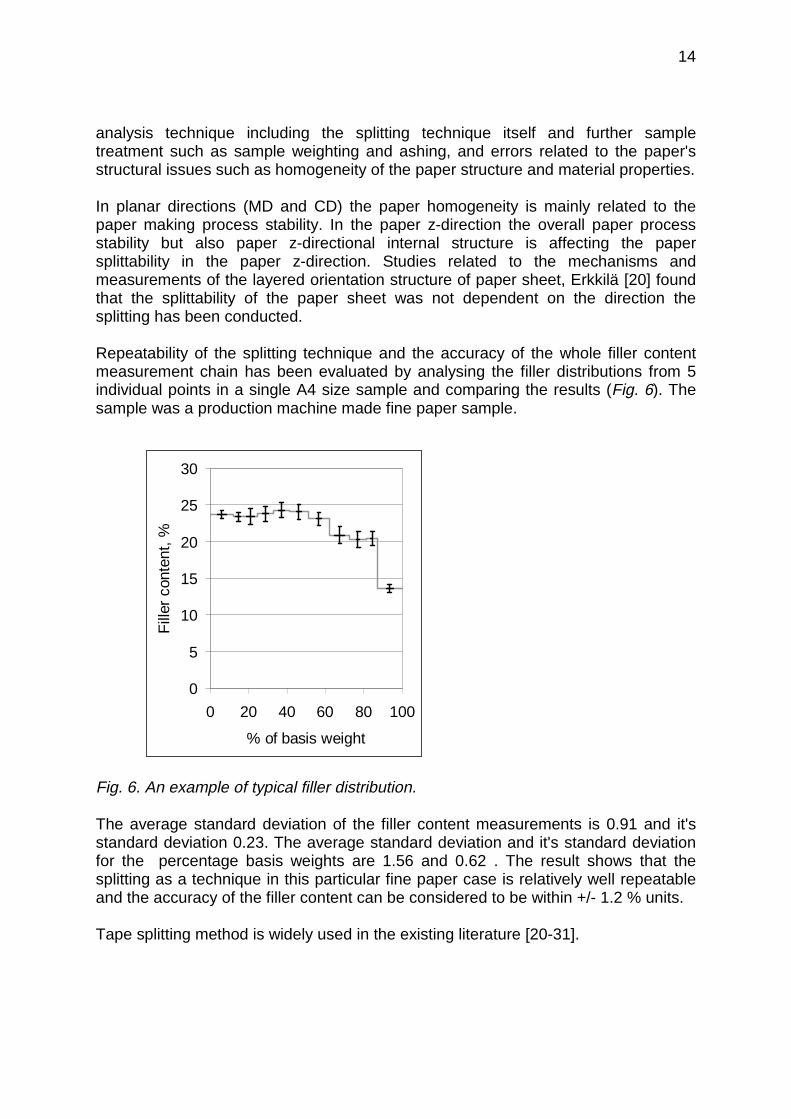
Repeatability of the splitting technique and the accuracy of the whole filler contentmeasurement chain has been evaluated by analysing the filler distributions from 5individual points in a single A4 size sample and comparing the results (Fig. 6). Thesample was a production machine made fine paper sample.
0
5
10
15
20
25
30
0 20 40 60 80 100
% of basis weight
Fill
erco
nten
t,%
Fig. 6. An example of typical filler distribution.
The average standard deviation of the filler content measurements is 0.91 and it'sstandard deviation 0.23. The average standard deviation and it's standard deviationfor the percentage basis weights are 1.56 and 0.62 . The result shows that thesplitting as a technique in this particular fine paper case is relatively well repeatableand the accuracy of the filler content can be considered to be within +/- 1.2 % units.
Tape splitting method is widely used in the existing literature [20-31].
15
Characterization of filler distributions
To be able to apply a statistical approach to the analysis work, the filler distributionsneeded to be converted into a more appropriate form. In this study thecharacterization of the filler distribution was defined based upon two characteristics,the symmetry factor, Fsym and the shape factor, Fu. The mathematical definition ofthe filler symmetry factor is as follows:
Fsym = Fts/Fbs-1, when Fts/Fbs>=1, (1)
Fsym = -(Fbs/Fts-1), when Fts/Fbs<1, (2)
where Fts is the top side filler content and Fbs is the bottom side filler content. Theshape factor of the filler content, Fu is defined,
Fu = (Fts+Fbs)/(2*Fcl)-1, when (Fts+Fbs)/(2*Fcl)>=1, (3)
Fu = -(2*Fcl/(Fts+Fbs)-1), when (Fts+Fbs)/(2*Fcl)<1, (4)
where Fcl is the center layer filler content.
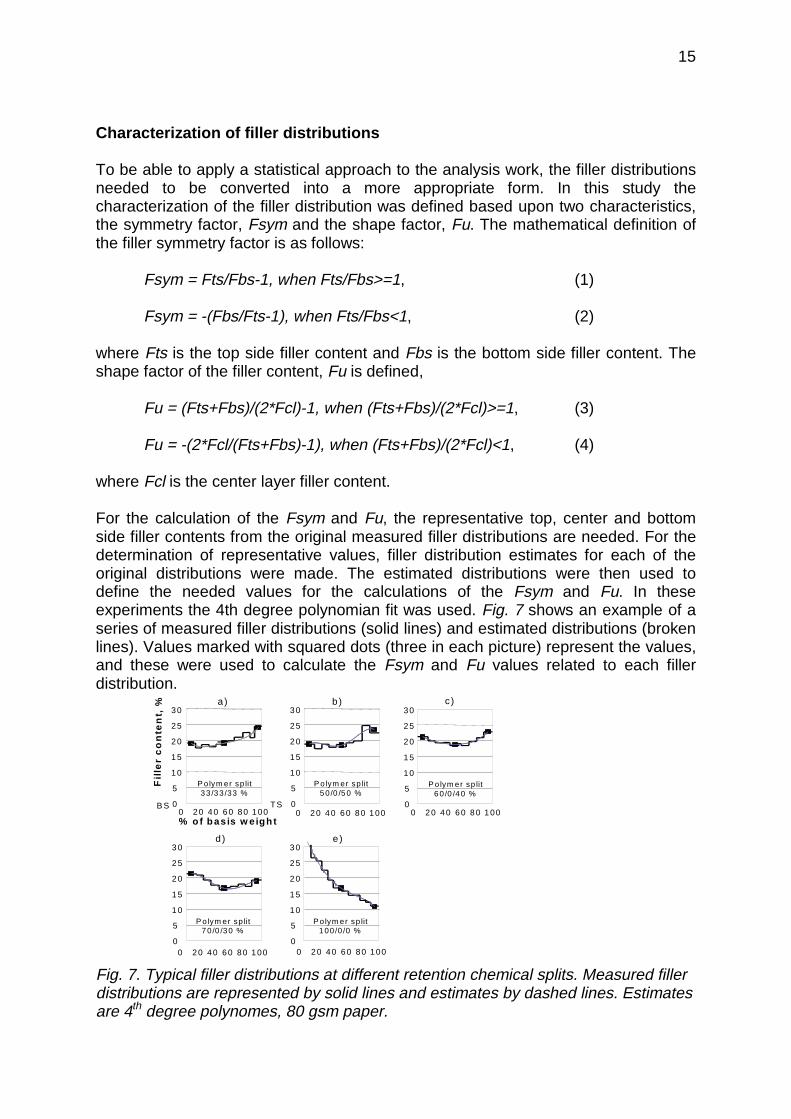
For the calculation of the Fsym and Fu, the representative top, center and bottomside filler contents from the original measured filler distributions are needed. For thedetermination of representative values, filler distribution estimates for each of theoriginal distributions were made. The estimated distributions were then used todefine the needed values for the calculations of the Fsym and Fu. In theseexperiments the 4th degree polynomian fit was used. Fig. 7 shows an example of aseries of measured filler distributions (solid lines) and estimated distributions (brokenlines). Values marked with squared dots (three in each picture) represent the values,and these were used to calculate the Fsym and Fu values related to each fillerdistribution.
0
5
10
15
20
25
30
P olym er sp lit70 /0 /30 %
0 20 40 60 80 100
0
5
10
15
20
25
30
P olym er sp lit33 /33/33 %
% o f b as is w e igh t
Fill
er
co
nte
nt,
%
B S T S0 20 40 60 80 100
0
5
10
15
20
25
30
P olym er sp lit100/0 /0 %
0 20 40 60 80 100
0
5
10
15
20
25
30
P olym er sp lit50 /0 /50 %
0 20 40 60 80 1000
5
10
15
20
25
30
P olym er sp lit60 /0 /40 %
0 20 40 60 80 100
a)
e )d )
b ) c)
Fig. 7. Typical filler distributions at different retention chemical splits. Measured fillerdistributions are represented by solid lines and estimates by dashed lines. Estimatesare 4th degree polynomes, 80 gsm paper.
16
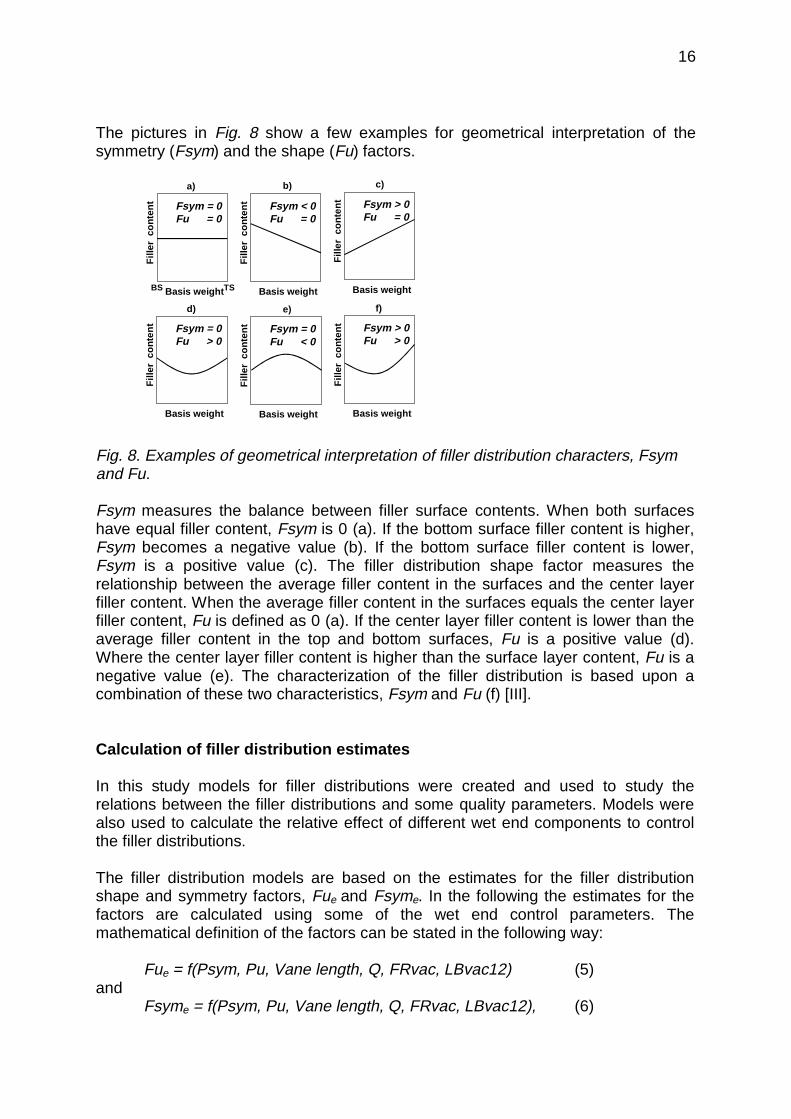
The pictures in Fig. 8 show a few examples for geometrical interpretation of thesymmetry (Fsym) and the shape (Fu) factors.
Basis weight
Fill
erco
nten
t Fsym = 0Fu = 0
Basis weight
Fill
erco
nten
t Fsym < 0Fu = 0
Basis weight
Fill
erco
nten
t Fsym > 0Fu = 0
Basis weight
Fill
erco
nten
t Fsym = 0Fu > 0
Basis weight
Fill
erco
nten
t Fsym = 0Fu < 0
Basis weight
Fill
erco
nten
t Fsym > 0Fu > 0
BS TS
a) c)b)
d) e) f)
Fig. 8. Examples of geometrical interpretation of filler distribution characters, Fsymand Fu.
Fsym measures the balance between filler surface contents. When both surfaceshave equal filler content, Fsym is 0 (a). If the bottom surface filler content is higher,Fsym becomes a negative value (b). If the bottom surface filler content is lower,Fsym is a positive value (c). The filler distribution shape factor measures therelationship between the average filler content in the surfaces and the center layerfiller content. When the average filler content in the surfaces equals the center layerfiller content, Fu is defined as 0 (a). If the center layer filler content is lower than theaverage filler content in the top and bottom surfaces, Fu is a positive value (d).Where the center layer filler content is higher than the surface layer content, Fu is anegative value (e). The characterization of the filler distribution is based upon acombination of these two characteristics, Fsym and Fu (f) [III].
Calculation of filler distribution estimates
In this study models for filler distributions were created and used to study therelations between the filler distributions and some quality parameters. Models werealso used to calculate the relative effect of different wet end components to controlthe filler distributions.
The filler distribution models are based on the estimates for the filler distributionshape and symmetry factors, Fue and Fsyme. In the following the estimates for thefactors are calculated using some of the wet end control parameters. Themathematical definition of the factors can be stated in the following way:
Fue = f(Psym, Pu, Vane length, Q, FRvac, LBvac12) (5)and
Fsyme = f(Psym, Pu, Vane length, Q, FRvac, LBvac12), (6)
17
where Psym = retention chemical dosing symmetry factor,Pu = retention chemical dosing shape factor,Vane length = layering vane length,Q = headbox flow rate,FRvac = forming roll vacuum,LBvac12 = combined vacuum of the suction boxes 1 and 2 in the LB-loading unit.
A regression analysis method was used to calculate the coefficients for the factorspresented in Equations 5 and 6. The regression analysis design chosen was basedupon the principles of one of the response surface methods, which in this case wasCentral Composite Surface Design. The main reason for using the chosen designwas that it allowed the use of individual factors at five levels, i.e., center points, cubepoints and star points. The commercially available computer program that wasselected allowed various experimental designs to be used. In the analysis, thestatistical significance level p was set to be less than or equal to 0.05 [32].
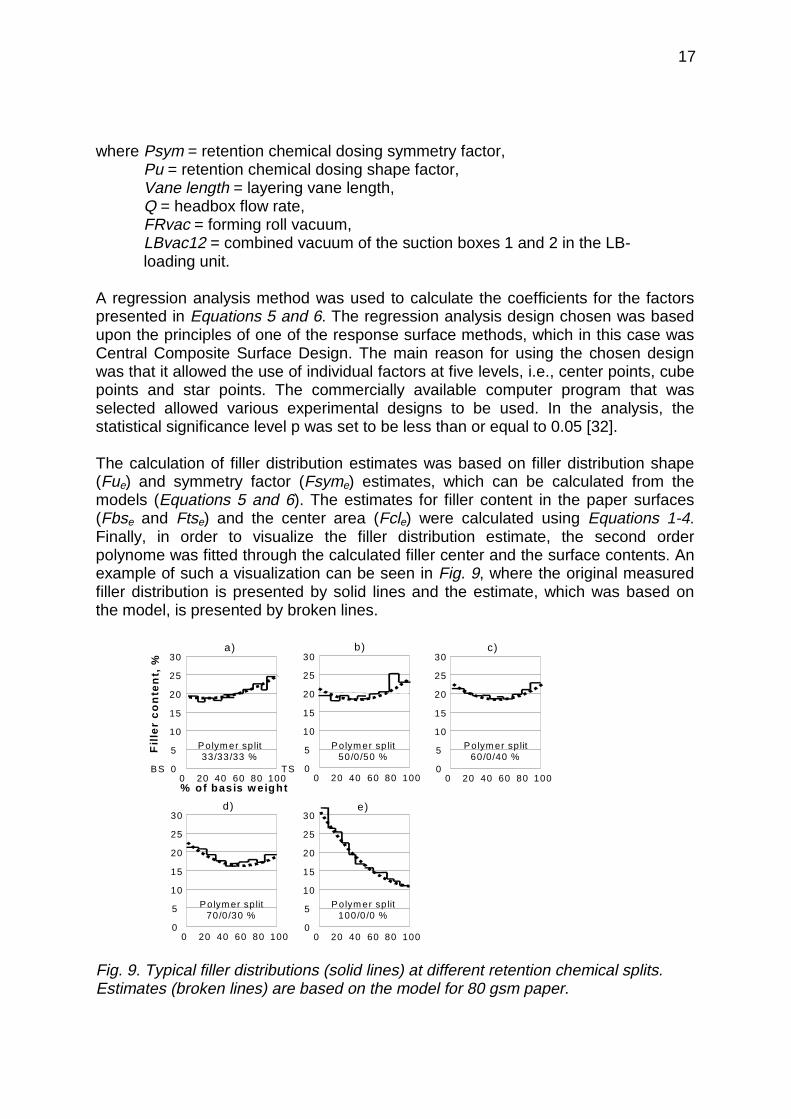
The calculation of filler distribution estimates was based on filler distribution shape(Fue) and symmetry factor (Fsyme) estimates, which can be calculated from themodels (Equations 5 and 6). The estimates for filler content in the paper surfaces(Fbse and Ftse) and the center area (Fcle) were calculated using Equations 1-4.Finally, in order to visualize the filler distribution estimate, the second orderpolynome was fitted through the calculated filler center and the surface contents. Anexample of such a visualization can be seen in Fig. 9, where the original measuredfiller distribution is presented by solid lines and the estimate, which was based onthe model, is presented by broken lines.
0
5
10
15
20
25
30
0 20 40 60 80 100
Polym er split50/0/50 %
0
5
10
15
20
25
30
0 20 40 60 80 100
Polym er split60/0/40 %
0
5
10
15
20
25
30
0 20 40 60 80 100
Polym er split70/0/30 %
0
5
10
15
20
25
30
0 20 40 60 80 100
Polym er split100/0/0 %
0
5
10
15
20
25
30
0 20 40 60 80 100
Polym er split33/33/33 %
Fill
er
co
nte
nt,
%
% o f bas is w eigh t
BS TS
a)
e)d)
c)b)
Fig. 9. Typical filler distributions (solid lines) at different retention chemical splits.Estimates (broken lines) are based on the model for 80 gsm paper.
18
Characterization of fiber distributions
Lloyd et al. [33] used dyed (blue) fibers in the center layer for the identification ofmixing during three-layer stratified forming. A method defined as surface ply variation(SPV) was also introduced. SPV was measured by scanning samples with a photoscanner and then by analyzing these images. SPV was used to calculate thevariation of the blue content of the surface within the 0.3-30 mm wave length range.
In studies performed by the author [V], parts of the center layer’s long fiber fractionswere dyed with a blue color in order to identify their position on the final sheet . Thefibers were colored using a method developed by VTT Processes. In this method,the final dyed pulp mixture contains dyed fibers but the surrounding water remainsdye-free. The portion of dyed fibers in the center layer pulp mix was approximately25 %. The undyed pulp fraction in the center and surface layers consisted of 70 %hardwood and 30 % softwood.
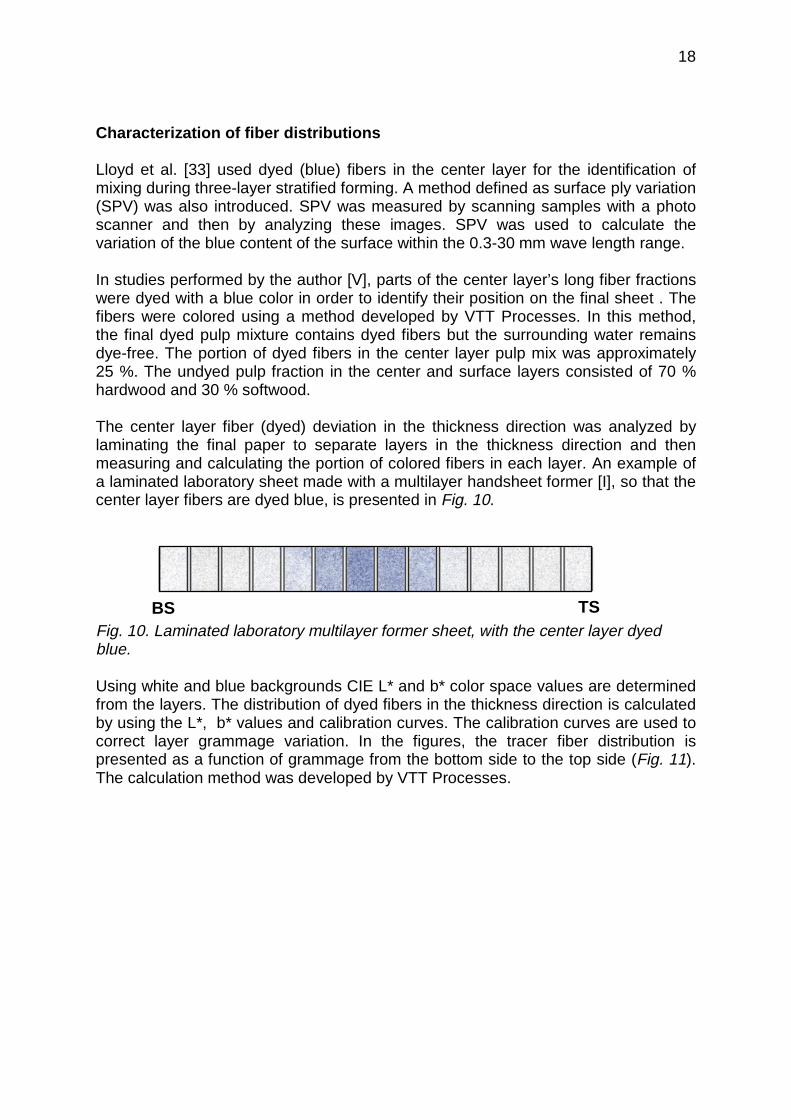
The center layer fiber (dyed) deviation in the thickness direction was analyzed bylaminating the final paper to separate layers in the thickness direction and thenmeasuring and calculating the portion of colored fibers in each layer. An example ofa laminated laboratory sheet made with a multilayer handsheet former [I], so that thecenter layer fibers are dyed blue, is presented in Fig. 10.
BS TSFig. 10. Laminated laboratory multilayer former sheet, with the center layer dyedblue.
Using white and blue backgrounds CIE L* and b* color space values are determinedfrom the layers. The distribution of dyed fibers in the thickness direction is calculatedby using the L*, b* values and calibration curves. The calibration curves are used tocorrect layer grammage variation. In the figures, the tracer fiber distribution ispresented as a function of grammage from the bottom side to the top side (Fig. 11).The calculation method was developed by VTT Processes.
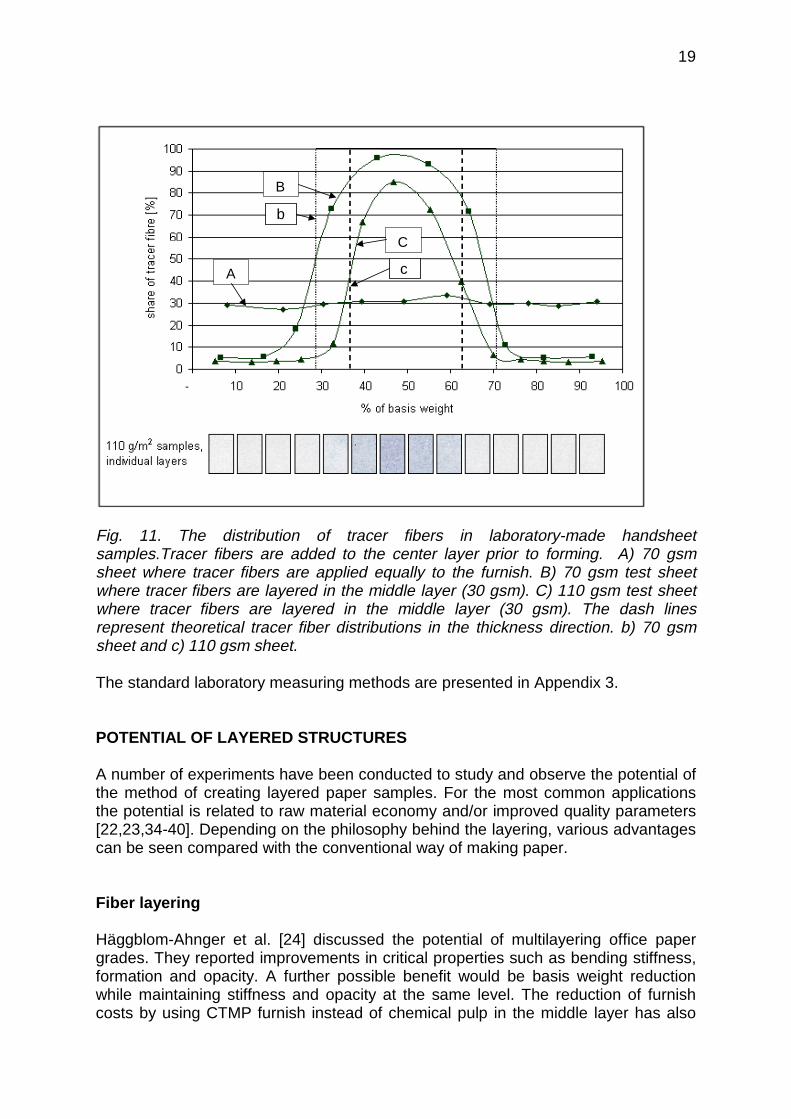
19
Fig. 11. The distribution of tracer fibers in laboratory-made handsheetsamples.Tracer fibers are added to the center layer prior to forming. A) 70 gsmsheet where tracer fibers are applied equally to the furnish. B) 70 gsm test sheetwhere tracer fibers are layered in the middle layer (30 gsm). C) 110 gsm test sheetwhere tracer fibers are layered in the middle layer (30 gsm). The dash linesrepresent theoretical tracer fiber distributions in the thickness direction. b) 70 gsmsheet and c) 110 gsm sheet.
The standard laboratory measuring methods are presented in Appendix 3.
POTENTIAL OF LAYERED STRUCTURES
A number of experiments have been conducted to study and observe the potential ofthe method of creating layered paper samples. For the most common applicationsthe potential is related to raw material economy and/or improved quality parameters[22,23,34-40]. Depending on the philosophy behind the layering, various advantagescan be seen compared with the conventional way of making paper.
Fiber layering
Häggblom-Ahnger et al. [24] discussed the potential of multilayering office papergrades. They reported improvements in critical properties such as bending stiffness,formation and opacity. A further possible benefit would be basis weight reductionwhile maintaining stiffness and opacity at the same level. The reduction of furnishcosts by using CTMP furnish instead of chemical pulp in the middle layer has also
B
C
A
b
c
20
been discussed. One possibility is to put recycled furnish in the middle layer whileretaining high quality virgin pulp on the surfaces. In studies concerning the optimumlocation of softwood sulfate pulp in three-ply office paper Häggblom-Ahnger [41]found that bending stiffness, formation and smoothness were improved by locatingthe softwood in the middle ply instead of in the outer layers. The optimum stiffnessand surface properties could be achieved by using softwood and eucalyptus sulfatepulps in the middle layer and applying birch sulfate to the outer layers.
Häggblom-Ahnger [42] also discussed the fractionation of softwood sulfate pulp inthree-ply copy paper. The layering of the fine fractions in the outer plies improvedbending stiffness. On the other hand, by locating the fine fractions of softwoodsulfate in the middle layer, Scott Bond was clearly improved.
Additives layering
Kinnunen et al. [25] discussed the role of different forming concepts and additiveslayering principles to control filler and fines distribution in SC paper grades. Theyreported that it was possible to improve optical properties by increasing surface fillercontent. With multilayering it seemed to be possible to achieve a small brightnessincrease without opacity loss. Odell [26] also discussed the advantages ofmultilayering. He reported significant improvements in the gloss and dot gain fromthe pilot printing of the multilayered SC papers when the surface filler content wasincreased by layering retention chemicals into the paper surfaces.
Harwood [22] mentioned the possible advantages to be gained by layering additivessuch as starch, filler, size and retention aids selectively, rather than dispersing themacross all the paper. In three ply layering, the addition of starch to the center layer(rather than to all plies) increased tensile and bond strength.
Häggblom-Ahnger et al. [24] reported experiments with consistency layering. Theynoticed that consistency layering had a significant impact on formation.
A laboratory study concerning chemical layering of WFC base paper
The experiments performed by the author et al. [II] studied different possibilities tocreate desired surface properties by layering certain components in a WFC basepaper. The study was executed on a multilayer laboratory handsheet former [I]. Oneof the main tasks was to reduce the openness of the paper surface throughconcentrating fillers on the paper surfaces. The grammage of the sheets was 80 gsmwith rosette-shape PCC filler (median particle size of 1.5 µm) contents of 22%, 26%and 36%. The chemical pulp used was a 65 / 35 % mixture of hardwood kraft pulpbeaten to SR° 24 and softwood kraft pulp beaten to SR° 20.
The study was based on previous findings that showed that increased filler content inpaper surfaces has several beneficial effects on either metered film press (MFP) ormetered size press processes (MSP). Forrström et al. [43] showed that the coat
21
weight formed on woodfree base paper in filmpress precoating depended mainly onthe coating color film on the application roll and the base paper surface porosity. Lowbase paper surface porosity and/or high filler content on the surface of the sheetdecreased coating color penetration into the base paper structure and the coatingcolor stayed better on the surface. Grön et al. [44] studied LWC base on a meteredfilm press (MFP) process. The main findings were that, when coating color istransferred to a base paper, a paper with high filler content demanded lesspremetered film to achieve the desired coated paper properties. In particular, basepaper with the highest filler content (20 %) also exhibited a denser paper surface andkept the color more effectively on the paper surface. It was shown by Ahlroos et al.[45] that increasing the base paper filler content levels had a positive effect onsurface roughness, print gloss and print mottle in HSWO Printing. It was also foundthat coat weight uniformity was improved by pre-calendering as well as by higherfiller amounts in the base paper. Studies with WFC base paper and a metered sizepress (MSP) by Dickson et al [27] showed that improved coating coverage can beobtained through the use of more filler in the surface of the base paper, higher levelsof kaolin clay in the coating formula, lower nip load, and softer size press rolls.
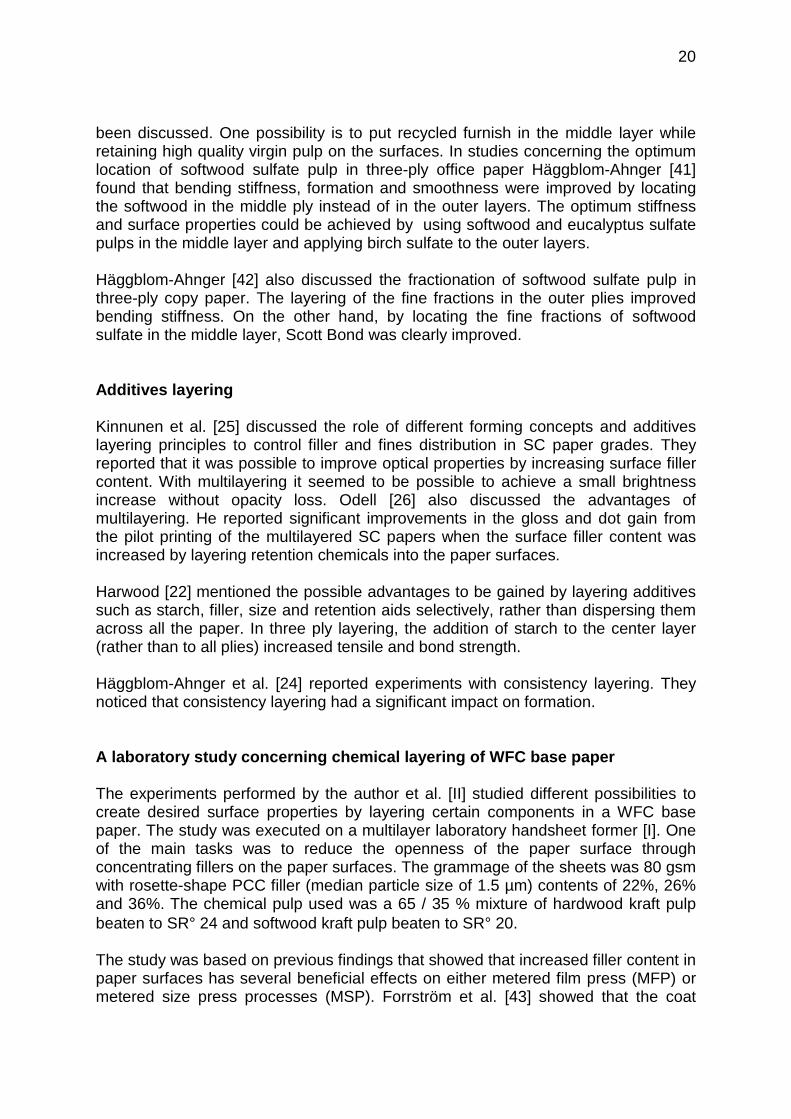
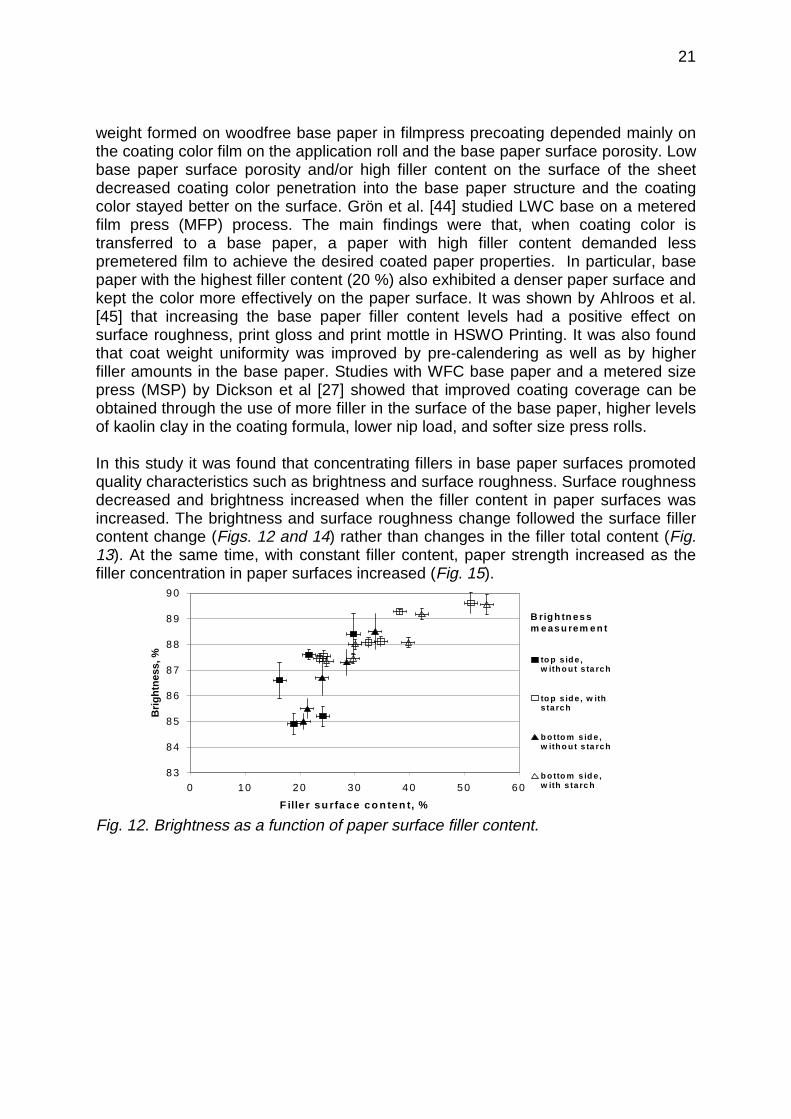
In this study it was found that concentrating fillers in base paper surfaces promotedquality characteristics such as brightness and surface roughness. Surface roughnessdecreased and brightness increased when the filler content in paper surfaces wasincreased. The brightness and surface roughness change followed the surface fillercontent change (Figs. 12 and 14) rather than changes in the filler total content (Fig.13). At the same time, with constant filler content, paper strength increased as thefiller concentration in paper surfaces increased (Fig. 15).
83
84
85
86
87
88
89
90
0 10 20 30 40 50 60
F ille r su rfac e co n ten t, %
Brig
htne
ss,% to p s id e ,
w ith o u t s ta rch
to p s id e , w iths ta rch
b o tto m s id e ,w ith o u t s ta rch
b o tto m s id e ,w ith s ta rc h
B rig h tn es sm e as u rem e n t
Fig. 12. Brightness as a function of paper surface filler content.
22
83
84
85
86
87
88
89
90
0 .0 10 .0 20 .0 30 .0 40 .0 50 .0 60 .0
F ille r co n ten t, %
Brig
htne
ss,%
to p s id e ,w ith o u t s ta rch
to p s id e , w iths ta rch
b o tto m s id e ,w ith o u t s ta rch
b o tto m s id e ,w ith s ta rc h
B rig h tn es sm e as u rem e n t
Fig. 13. Brightness as a function of filler total content.
0
20 0
40 0
60 0
80 0
10 00
12 00
14 00
0 10 20 30 40 50 60
F ille r su rfac e co n ten t, %
Ben
dtse
nro
ughn
ess,
ml/m
in
(unc
alen
dere
d)
to p s id e ,w ith o u t s ta rch
to p s id e , w iths ta rch
b o tto m s id e ,w ith o u t s ta rch
b o tto m s id e ,w ith s ta rc h
R o u g h n e ssm e as u rem e n t
Fig. 14. Surface roughness (Bendtsen) of uncalendered paper as a function of papersurface filler content.
2 5 .0
3 0 .0
3 5 .0
4 0 .0
0 10 20 30 40F ille r, %
Ten
sile
stre
ngth
,Nm
/g
F ille r su rfaceco n ten t, w iths ta rch
F ille r to ta lco n ten t, w iths ta rch
F ille r con te n t in pa pe r 2 0 %
L aye red pap ers tru c tu re
E ve n (no n laye red )p ap er s truc tu re
F ille r to ta lco n te n t F ille r su rfa ce
co n te n t
Fig. 15. Tensile strength as a function of paper surface filler content and filler totalcontent.
23
Smoother base paper also showed smoother paper surface properties after coating.It was also shown that the dusting tendency of fillers in laboratory calendering couldbe significantly decreased by using starch. Layering offers an opportunity to intensifythe use of starch by using layering techniques and targeting the starch at the papersurfaces.
LAYER MIXING
Layering with a multilayer headbox is based on the idea of separating the layers fromeach other as long as possible. The consolidation of the different layers takes placeafter the separating vanes, inside or outside the headbox. After consolidation duringsheet formation, the different layers tend to mix together. Mixing of layers does occurin the free jet and continues in the various dewatering phases in the forming section.
Mixing can be different in different dewatering phases. In roll-blade gap formingduring the roll dewatering phase, the water volumes are significantly bigger than inthe blade dewatering phase. Thus it is concluded that the mixing is also different.Furthermore, the raw materials to be layered may behave differently during differentdewatering phases. The behavior of fibers may be different than the behavior offillers. The behavior of the fillers is also related to the retention level [28] and theretention mechanisms. Lindström [46,47] categorizes the retention mechanisms inthe following way: charge neutralization, patch model of flocculation, heteroflocculation, bridging flocculation (adsorption flocculation, sensitization flocculation,complex flocculation), network flocculation and volume restriction flocculation.Depending on the dewatering phase, the retention mechanisms of fillers may varyfrom that of fibers and thus give space for independent movements of fillers. Thegoal may still be to control the layerability of both fibers and fillers.
Headbox flow and vanes
In the first stage of layer consolidation just after the vanes, mixing is governed by thehydrodynamic state of the flows to be consolidated and phenomena related to thevanes themselves.
Baker et al. [48] studied the impact of three dimensional headbox flows on tissuelayer purity. They observed the existence of both spanwise and streamwisestructures within the wake of headbox dividers. They stated that three dimensionalflows can have a significant effect on layer purity and that the potential mechanismsresponsible for such flows include the formation of swirling flows at the diffuser tubebank, three dimensional wakes formed at divider tips and instability of the free jetsurface. They also found that the use of extended flexible slice lips can improve layerpurity, though the mechanisms for these improvements were not identified.
Jetsu et al. [49] discussed the inherited nature and the formation of coherentstructures (CS) of suspension flow when using vanes. The CS is geometrically threedimensional and can be separated into MD and CD components (which aredominant) with distinctive characteristics of their own. The amplitude and wave
24
length of the CS was found to be related to the dimensions of the vane. Byincreasing the effective thickness of the vane, it was possible to increase theamplitude and wave length of the CS .
Lloyd et al. [33] studied layer mixing during three-layer stratified forming. Theyconcluded that a combination of vane tip vortices and channel turbulence is thoughtto cause significant mixing of the different layers during stratified forming. Shortervanes led to mixing at floc level, while longer vanes produced mixing at the fiberlevel. Longer vanes in a contracting nozzle meant higher flow velocities, both at thevane tips and in the flow channels. This was thought to produce more intense andsmaller scale turbulence, which tended to mix the layers more at the fiber level thanat the floc level. Very long vanes caused complete turbulent mixing of the differentlayers and very poor sheet formation. The other study done by Lloyd et al. [50]concerned the effect of vane shape on layer mixing. They used stepped vanes withvarious configurations. The aim of the steps was to break down the boundary layersformed upstream along the vanes, and thus reduce downstream vortex generation.They noticed that the turbulence introduced by the steps increased the layer mixing.
Lepomäki et al. [51] suggested that it is important to keep the amplitude of coherentstructures in a headbox low enough for stochastic turbulence to break and obscurethem. The amplitude and frequency of coherent structures are always a function of aspecific dimension of the element generating them. For this reason, all disturbances,such as steps, have to be minimized after fluidization.
Li et al. [29] recommended a vane sheet with a tip thickness of 0.5 mm for 2-layerand 3-layer stratification applications. For a very thin divider sheet, it is anticipatedthat that there will be some concerns about cross machine uniformity problems andthe sheet life.
Söderberg et al. [52] studied the influence of the contraction ratio on headbox flow,using dyed fibers in different layers. As a side result [53] they found that the optimumcontraction giving the lowest layer mixing was somewhere between the low and highcontraction cases.
Andersson [30,31] presented layering results achieved with a layering headbox using“air-wedge” technology. Rigid layer separator vanes terminating outside the sliceopening made it possible to run different individual jet velocities in different layers. Itwas found that the optimum layer purity was achieved with a jet velocity profile suchthat the highest velocity of the jet was on the forming roll side.
Parsheh [54] studied mixing in a liquid jet out of a stratified headbox by using amodel. He found that the relative difference of the vane length and the contractionlength was one of the most important factors. Moreover, a vane shorter than thecontraction results in the lowest mixing.
25
Free jet and jet impingement
The second critical stage in layer mixing is the free jet. Li et al. [29,55] studied themixing characteristics of a water jet as a function of the distance from a stratified 2and 3-layer headbox nozzle. They put salt water into the middle layer and measuredthe fluid conductivity profile in the z-direction. A mixing intensity at a specific locationin the free jet, IMH, was introduced. IMH increased with distance from the slice, andwas inversely affected by slice opening and headbox flow rate. It was found that ashorter divider sheet stickout tended to provide a lower degree of mixing. However, alonger divider sheet stickout may be preferable for the situation with a shorter free jetlength.
The role of the impingement of the jet between fabrics in roll-blade forming,particularly from the layer mixing point of view, has not been discussed widely.However, it is known to be a critical part of the paper forming process.
Roll dewatering
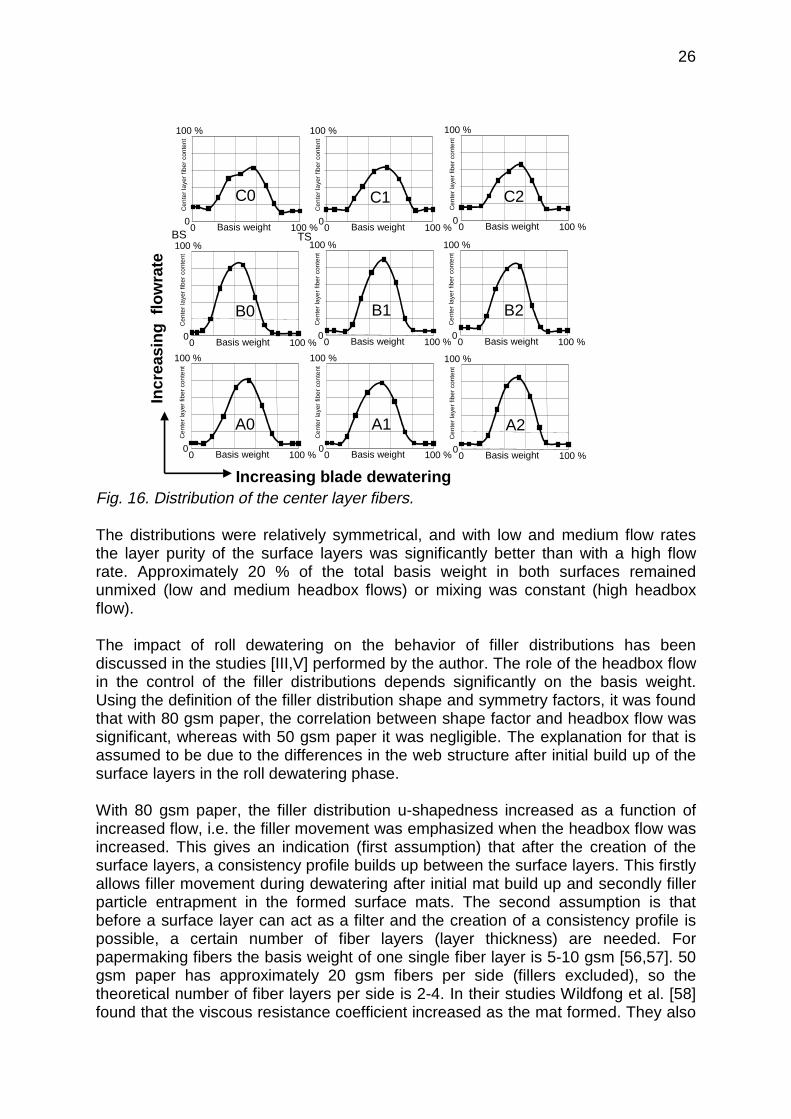
Studies done by the author [V] with 3-layer headbox using dyed fibers showed thatlayer mixing increased when the headbox flow was increased (Fig. 16). In the graphthe vertical axis shows the headbox flow increase, i.e. in all points labeled A,headbox flow was low. B denotes medium headbox flow and C high headbox flow.The horizontal axis shows the forming section dewatering intensity. In the firstcolumn from the left (denoted by 0) the dewatering of the LB-loading unit wasminimized. Only minimum vacuums in the LB-loading unit vacuum boxes were usedand only a pre-loading blade was used. Moving from the first to the second column(denoted by 1) and further to the third column (denoted by 2), the relative share ofLB-loading unit dewatering (blade dewatering) increased at a given headbox flow.
A change in blade dewatering intensity did not have an effect on fiber mixing. Bladedewatering intensity was changed from zero blade force and minimum vacuums inthe LB-loading area to maximum blade force and maximum vacuums. On the otherhand Li showed that the mixing intensity at a specific location in the free jet, IMH, wasinversely affected by the slice opening and headbox flow rate [29]. So it wasconcluded that fiber mixing due to increased headbox flow took place at the rolldewatering phase.
26
A0 A1 A2
B1 B2B0
C10
100 %
0 100 %Basis weight
Cen
ter
laye
rfib
erco
nten
t
C0 C2
Increasing blade dewatering
Incr
easi
ngflo
wra
te
BS TS0
100 %
0 100 %Basis weight
Cen
ter
laye
rfib
erco
nten
t
0
100 %
0 100 %Basis weight
Cen
ter
laye
rfib
erco
nten
t
0
100 %
0 100 %Basis weight
Cen
ter
laye
rfib
erco
nten
t
0
100 %
0 100 %Basis weight
Cen
ter
laye
rfib
erco
nten
t
0
100 %
0 100 %Basis weight
Cen
ter
laye
rfib
erco
nten
t
0
100 %
0 100 %Basis weight
Cen
ter
laye
rfib
erco
nten
t
0
100 %
0 100 %Basis weight
Cen
ter
laye
rfib
erco
nten
t
0
100 %
0 100 %Basis weightC
ente
rla
yer
fiber
cont
ent
Fig. 16. Distribution of the center layer fibers.
The distributions were relatively symmetrical, and with low and medium flow ratesthe layer purity of the surface layers was significantly better than with a high flowrate. Approximately 20 % of the total basis weight in both surfaces remainedunmixed (low and medium headbox flows) or mixing was constant (high headboxflow).
The impact of roll dewatering on the behavior of filler distributions has beendiscussed in the studies [III,V] performed by the author. The role of the headbox flowin the control of the filler distributions depends significantly on the basis weight.Using the definition of the filler distribution shape and symmetry factors, it was foundthat with 80 gsm paper, the correlation between shape factor and headbox flow wassignificant, whereas with 50 gsm paper it was negligible. The explanation for that isassumed to be due to the differences in the web structure after initial build up of thesurface layers in the roll dewatering phase.
With 80 gsm paper, the filler distribution u-shapedness increased as a function ofincreased flow, i.e. the filler movement was emphasized when the headbox flow wasincreased. This gives an indication (first assumption) that after the creation of thesurface layers, a consistency profile builds up between the surface layers. This firstlyallows filler movement during dewatering after initial mat build up and secondly fillerparticle entrapment in the formed surface mats. The second assumption is thatbefore a surface layer can act as a filter and the creation of a consistency profile ispossible, a certain number of fiber layers (layer thickness) are needed. Forpapermaking fibers the basis weight of one single fiber layer is 5-10 gsm [56,57]. 50gsm paper has approximately 20 gsm fibers per side (fillers excluded), so thetheoretical number of fiber layers per side is 2-4. In their studies Wildfong et al. [58]found that the viscous resistance coefficient increased as the mat formed. They also
27
found that at lower basis weights the increased fines level did not have a significantimpact on the resistance values, presumably due to the low initial retention presentduring early mat deposition. An increase in the viscous resistance coefficient withfine paper furnish as well as with newsprint furnish could be seen after 20 gsm ofmaterial had been deposited.
Based on the second assumption and Wildfong's findings, it is concluded that afterinitial mat formation with 50 gsm paper, no excess material for consistencydifference creation between layers remained. Thus a not measurable amount of freefiller movement took place after initial mat formation and the impact of headbox flowon the filler distribution shape factor remained insignificant. This is probably also thereason why the effect of the former parameters on the 50 gsm paper shape factorremained insignificant.
Blade dewatering
Fiber mobility is related to layer mixing, the main part of which takes place in theheadbox, jet and forming roll. Fiber mobility during the blade dewatering phase isgenerally related to formation improvement. Filler distribution shapes are alsoconnected to layer mixing, particularly when filler loading into various layes has beenboosted with retention chemical layering. On the other hand fillers may still havemobility when fibers have already settled into their final positions in the paperstructure. Mobility differences between fibers and fillers may be at their greatestparticularly in the blade dewatering phase in roll and blade dewatering.
Zhao et al. [59] studied the effect of consistency on pressure pulses in blade gapformers. They stated that to improve formation, relative movement must take placeamong the fibers so that the fibers move from the flocs to the zones between theflocs. Thus, the fiber displacement distance should be of the order of a floc diameterif formation is to be affected in a significant way.
Nordström et al. [60] showed that the effect on formation of a change from roll to roll-blade dewatering was found to be determined by a balance between improving andimpairing mechanisms. This balance was influenced by jet quality and blade forceand was different in different wave length ranges. Higher blade forces led to adeterioration in both the small-scale and large-scale formation. Norman [61] statedthat the effects of dewatering pulses on paper properties are positive as well asnegative. The main positive effect is the improvement of large scale formation. Theeffect of the blade pulses is larger the poorer the formation level after initial rolldewatering.
Kerekes et al. [62] presented two aspects of a fiber suspension which determine thedegree to which it may lead to good formation - uniformity and mobility. A uniformsuspension tends to produce good formation. Mobility, meaning the ease with whichfibers can move relative to one another, also affects formation. A crowding factor, N,defined as the number of fibers in a spherical volume of diameter equal to the lengthof the fiber, has been used to characterize flocculation of fibers in a watersuspension. The mobility of fibers and their uniformity of distribution were shown to
28
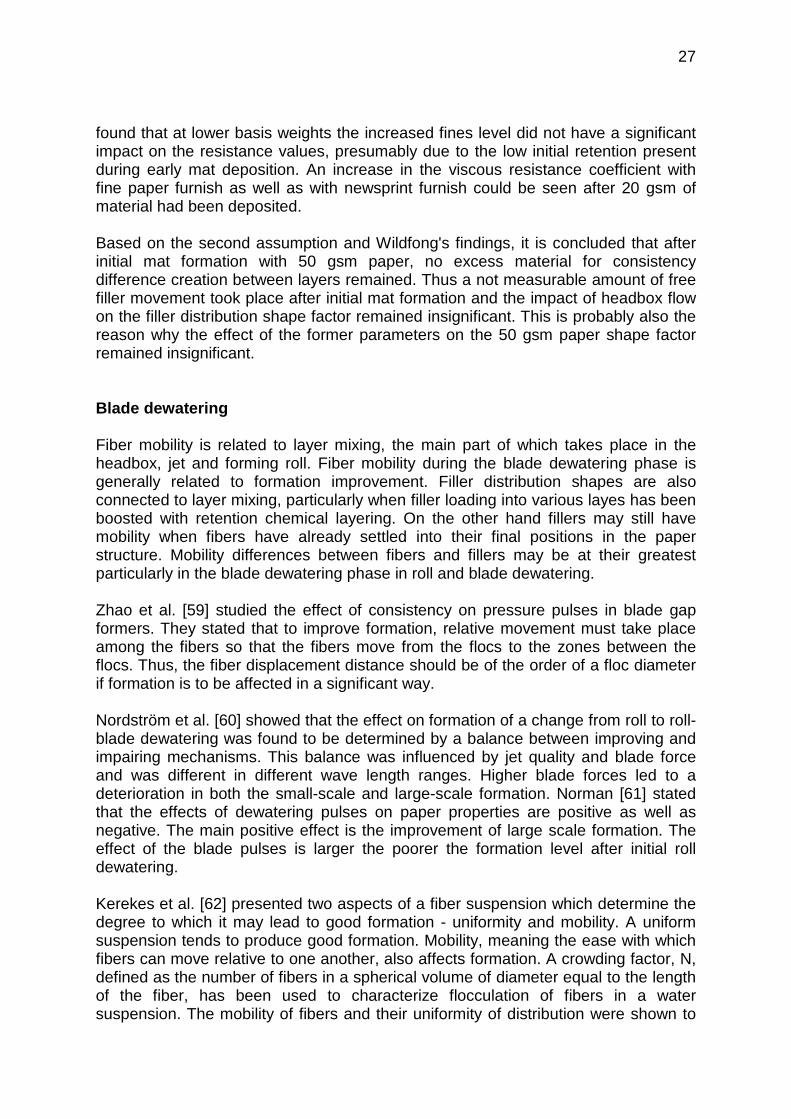
change dramatically over the range 1<=N<=130. At N~=1, fiber mobility was high. AsN>1, the suspension tended to become non-uniform for fibers with a high-aspectratio (length/diameter) and uniform for low-aspect ratios. In the range 60<=N<=130,fiber mobility decreased significantly. Kerekes et al. [63] stated that both fiber lengthand coarseness also affected fiber mobility. It was postulated that, like uniformity,mobility is a key factor in formation, since it determines the extent to whichsuspension uniformity can be altered during drainage on the paper machine. In layermixing studies performed by the author [V] it was found out that layer mixingincreased when the headbox flow was increased (Fig. 17). On the other hand it wasalso found that surface uniformity two-sidedness started to gradually worsen whenthe headbox flow was increased and that the top surface became more uniform. Onthe bottom side, surface unevenness increased and, at the highest flow rate, clearlyobservable faults (crushing) could be seen. The flow level, which caused visibleunevenness in the paper, was chosen consciously and was here considered to be"high" headbox flow. Figs. 17 and 18 show the scanned pictures of the paper bottomand top side surfaces. Dyed fibers in the paper center layer were used. The crushingoriginated most probably in the roll dewatering (gap) area. In the C0 case, thefollowing dewatering treatment (after the roll dewatering phase) was very gentle,particularly on the bottom side (Fig. 17). The reason for crushing is assumed to bethe too fast densification of the fiber mat after a certain threshold headbox flowduring the initial dewatering phase. This led to uncontrollable suspension flows in thepaper surface plane directions, resulting in visible fiber clumps.
Bottom side
A0 A1 A2
B1 B2B0
C1C0 C2
Increasing blade dewatering
Incr
ea
sin
gflo
wra
te
Fig. 17. Scanned bottom side surfaces at various trial points. Dyed fibers usedin the center layer.
29
Top side
A0 A1 A2
B1 B2B0
C1C0 C2
Increasing blade dewatering
Incr
ea
sin
gflo
wra
te
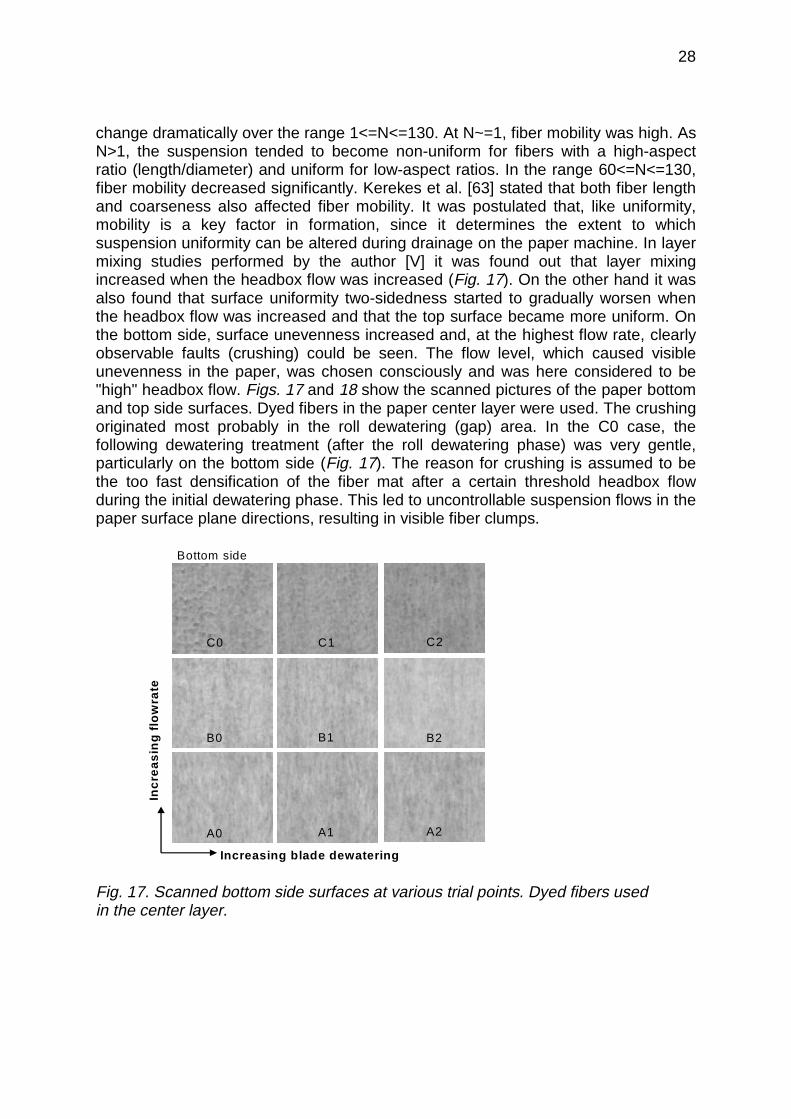
Fig. 18. Scanned top side surfaces at various trial points. Dyed fibers used inthe center layer.
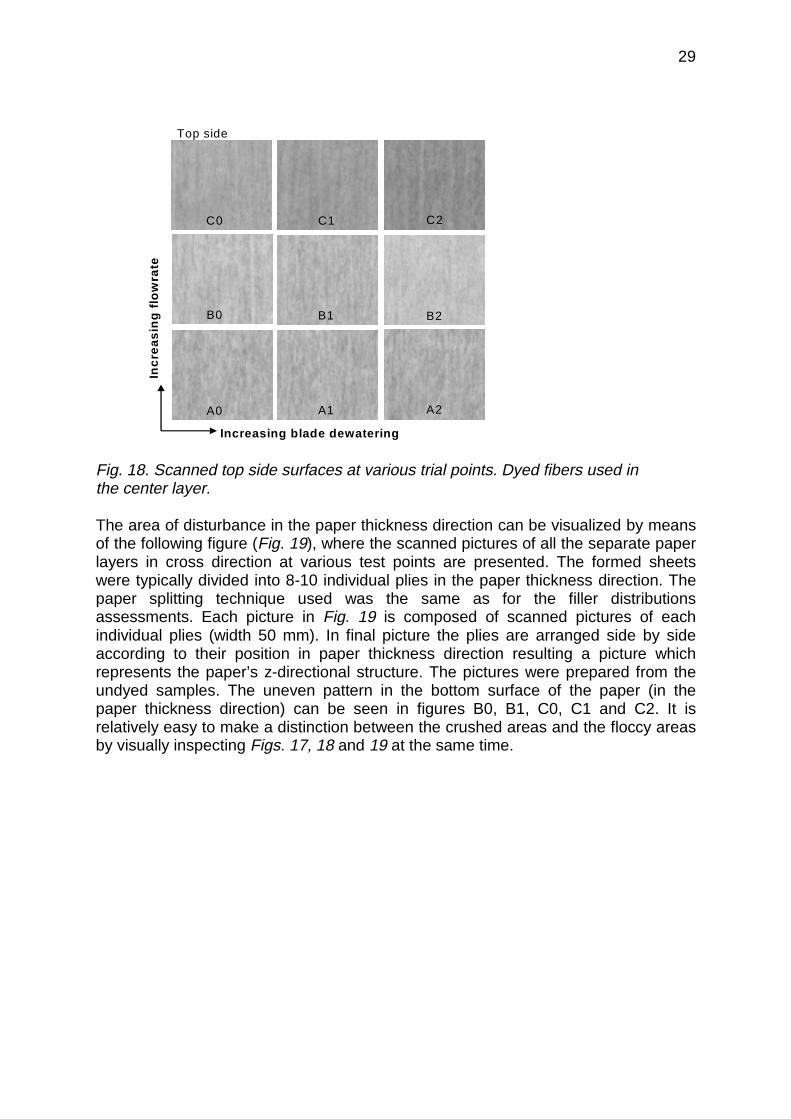
The area of disturbance in the paper thickness direction can be visualized by meansof the following figure (Fig. 19), where the scanned pictures of all the separate paperlayers in cross direction at various test points are presented. The formed sheetswere typically divided into 8-10 individual plies in the paper thickness direction. Thepaper splitting technique used was the same as for the filler distributionsassessments. Each picture in Fig. 19 is composed of scanned pictures of eachindividual plies (width 50 mm). In final picture the plies are arranged side by sideaccording to their position in paper thickness direction resulting a picture whichrepresents the paper’s z-directional structure. The pictures were prepared from theundyed samples. The uneven pattern in the bottom surface of the paper (in thepaper thickness direction) can be seen in figures B0, B1, C0, C1 and C2. It isrelatively easy to make a distinction between the crushed areas and the floccy areasby visually inspecting Figs. 17, 18 and 19 at the same time.
30
Increasing blade dewatering
Inc
rea
sin
gfl
ow
rate
A0 A1 A2
BS
TS
C1
B1B0
C2C0
B2
“crushed”
“flocky”
“sm oothening”
“sm oothening”
Fig. 19. Scanned layers at various trial points. In each picture (A0, A1, ..),representing a single trial point, pictures of each individual ply have been orderedaccording to their positions in the paper’s thickness direction. Each picture typicallyconsists of 8-10 individual plies.
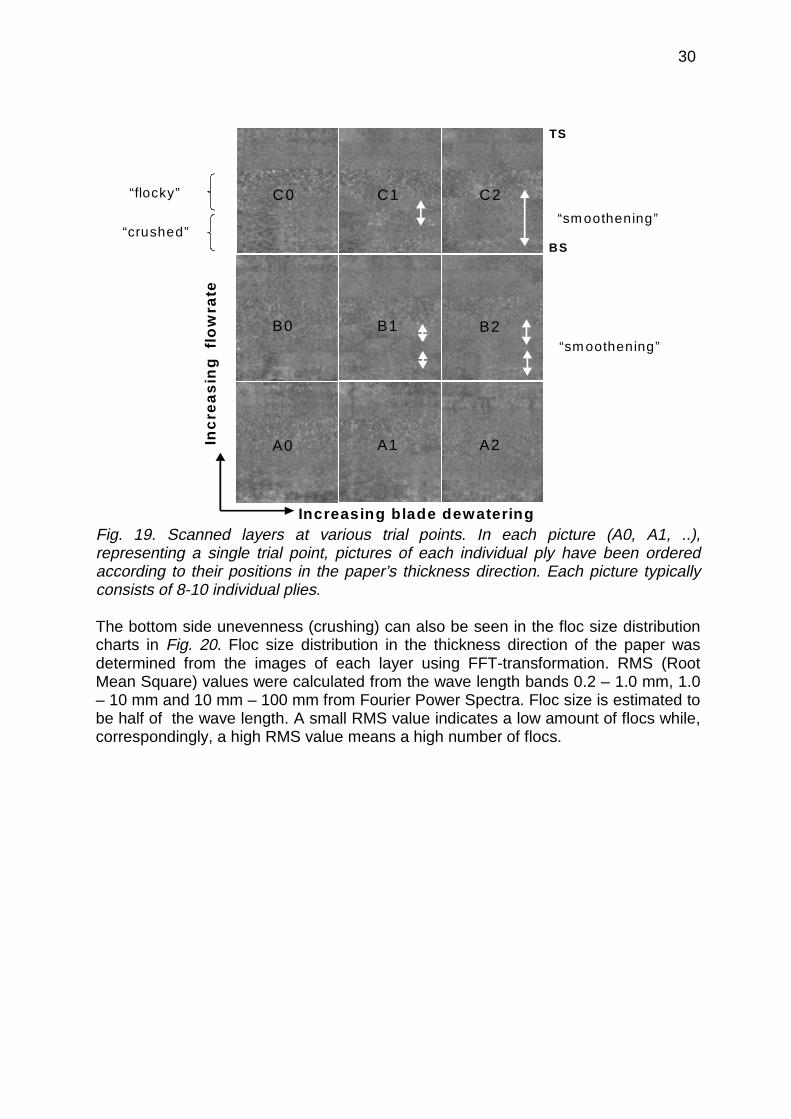
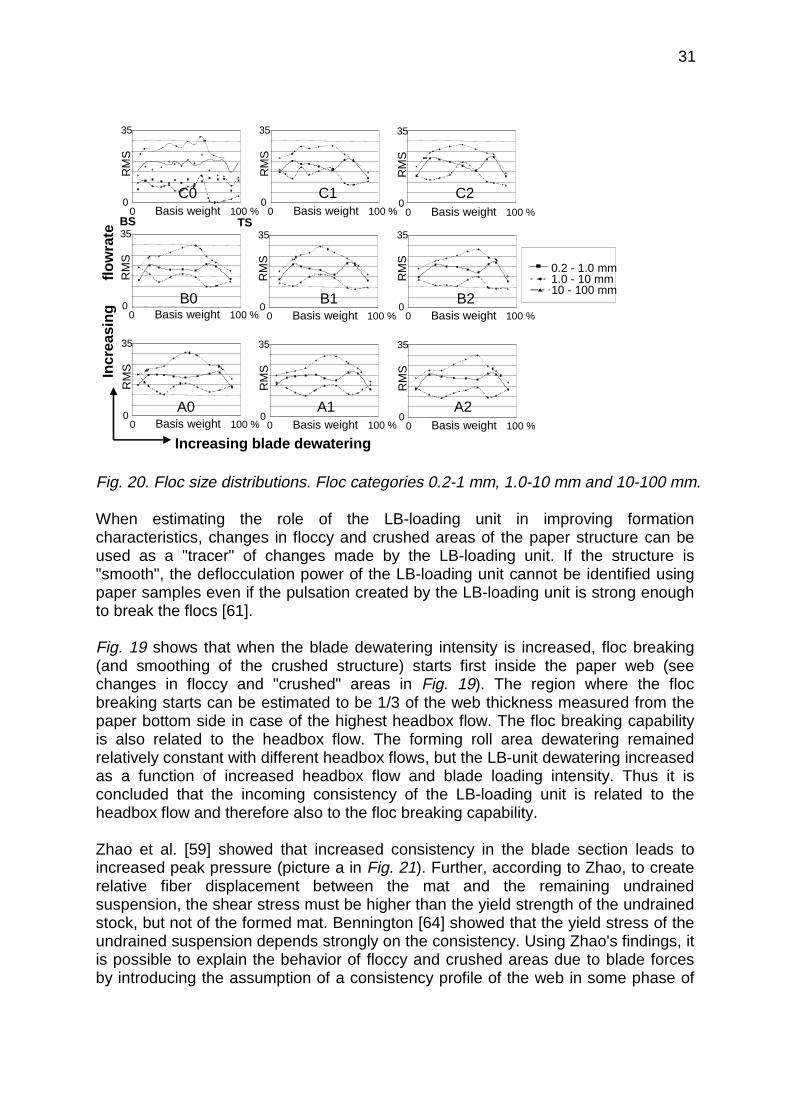
The bottom side unevenness (crushing) can also be seen in the floc size distributioncharts in Fig. 20. Floc size distribution in the thickness direction of the paper wasdetermined from the images of each layer using FFT-transformation. RMS (RootMean Square) values were calculated from the wave length bands 0.2 – 1.0 mm, 1.0– 10 mm and 10 mm – 100 mm from Fourier Power Spectra. Floc size is estimated tobe half of the wave length. A small RMS value indicates a low amount of flocs while,correspondingly, a high RMS value means a high number of flocs.
31
0.2 - 1.0 mm1.0 - 10 mm10 - 100 mm
BS TS
Increasing blade dewatering
Incr
easi
ngflo
wra
te
A0 A1 A2
B0 B1 B2
C0 C1 C20
35
0 100 %Basis weight
RM
S
0
35
0 100 %Basis weight
RM
S
0
35
0 100 %Basis weight
RM
S
0
35
0 100 %Basis weight
RM
S
0
35
0 100 %Basis weight
RM
S
0
35
0 100 %Basis weight
RM
S0
35
0 100 %Basis weight
RM
S
0
35
0 100 %Basis weight
RM
S
0
35
0 100 %Basis weight
RM
S
Fig. 20. Floc size distributions. Floc categories 0.2-1 mm, 1.0-10 mm and 10-100 mm.
When estimating the role of the LB-loading unit in improving formationcharacteristics, changes in floccy and crushed areas of the paper structure can beused as a "tracer" of changes made by the LB-loading unit. If the structure is"smooth", the deflocculation power of the LB-loading unit cannot be identified usingpaper samples even if the pulsation created by the LB-loading unit is strong enoughto break the flocs [61].
Fig. 19 shows that when the blade dewatering intensity is increased, floc breaking(and smoothing of the crushed structure) starts first inside the paper web (seechanges in floccy and "crushed" areas in Fig. 19). The region where the flocbreaking starts can be estimated to be 1/3 of the web thickness measured from thepaper bottom side in case of the highest headbox flow. The floc breaking capabilityis also related to the headbox flow. The forming roll area dewatering remainedrelatively constant with different headbox flows, but the LB-unit dewatering increasedas a function of increased headbox flow and blade loading intensity. Thus it isconcluded that the incoming consistency of the LB-loading unit is related to theheadbox flow and therefore also to the floc breaking capability.
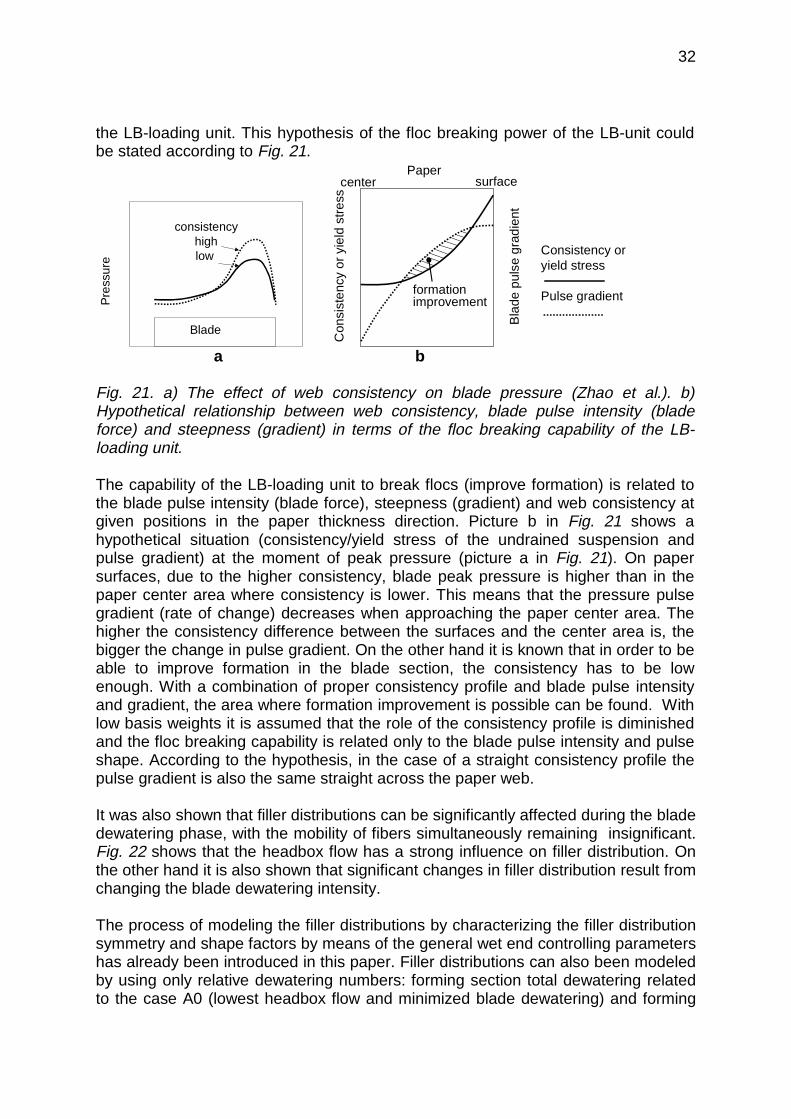
Zhao et al. [59] showed that increased consistency in the blade section leads toincreased peak pressure (picture a in Fig. 21). Further, according to Zhao, to createrelative fiber displacement between the mat and the remaining undrainedsuspension, the shear stress must be higher than the yield strength of the undrainedstock, but not of the formed mat. Bennington [64] showed that the yield stress of theundrained suspension depends strongly on the consistency. Using Zhao's findings, itis possible to explain the behavior of floccy and crushed areas due to blade forcesby introducing the assumption of a consistency profile of the web in some phase of
32
the LB-loading unit. This hypothesis of the floc breaking power of the LB-unit couldbe stated according to Fig. 21.
Pre
ssur
e
Blade
consistencyhighlow
Bla
depu
lse
grad
ient
Con
sist
ency
oryi
eld
stre
ss
Papersurfacecenter
Consistency oryield stress
Pulse gradientformationimprovement
a b
Fig. 21. a) The effect of web consistency on blade pressure (Zhao et al.). b)Hypothetical relationship between web consistency, blade pulse intensity (bladeforce) and steepness (gradient) in terms of the floc breaking capability of the LB-loading unit.
The capability of the LB-loading unit to break flocs (improve formation) is related tothe blade pulse intensity (blade force), steepness (gradient) and web consistency atgiven positions in the paper thickness direction. Picture b in Fig. 21 shows ahypothetical situation (consistency/yield stress of the undrained suspension andpulse gradient) at the moment of peak pressure (picture a in Fig. 21). On papersurfaces, due to the higher consistency, blade peak pressure is higher than in thepaper center area where consistency is lower. This means that the pressure pulsegradient (rate of change) decreases when approaching the paper center area. Thehigher the consistency difference between the surfaces and the center area is, thebigger the change in pulse gradient. On the other hand it is known that in order to beable to improve formation in the blade section, the consistency has to be lowenough. With a combination of proper consistency profile and blade pulse intensityand gradient, the area where formation improvement is possible can be found. Withlow basis weights it is assumed that the role of the consistency profile is diminishedand the floc breaking capability is related only to the blade pulse intensity and pulseshape. According to the hypothesis, in the case of a straight consistency profile thepulse gradient is also the same straight across the paper web.
It was also shown that filler distributions can be significantly affected during the bladedewatering phase, with the mobility of fibers simultaneously remaining insignificant.Fig. 22 shows that the headbox flow has a strong influence on filler distribution. Onthe other hand it is also shown that significant changes in filler distribution result fromchanging the blade dewatering intensity.
The process of modeling the filler distributions by characterizing the filler distributionsymmetry and shape factors by means of the general wet end controlling parametershas already been introduced in this paper. Filler distributions can also been modeledby using only relative dewatering numbers: forming section total dewatering relatedto the case A0 (lowest headbox flow and minimized blade dewatering) and forming
33
area dewatering two-sidedness value (TS/BS). The mathematical definition for theestimates of the characters, Fue and Fsyme, can be stated in the following way:
Fue = f(total former dewatering, dewatering two-sidedness (TS/BS)) (7)and
Fsyme = f(total former dewatering, dewatering two-sidedness (TS/BS)). (8)
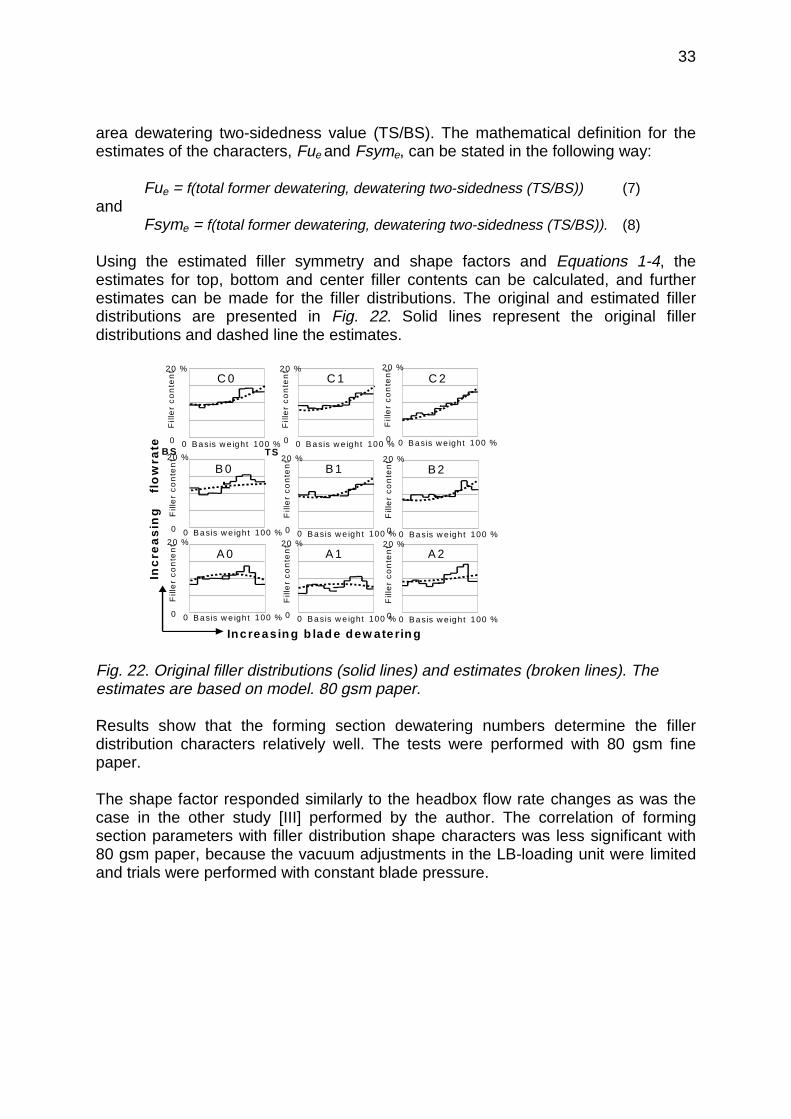
Using the estimated filler symmetry and shape factors and Equations 1-4, theestimates for top, bottom and center filler contents can be calculated, and furtherestimates can be made for the filler distributions. The original and estimated fillerdistributions are presented in Fig. 22. Solid lines represent the original fillerdistributions and dashed line the estimates.
A 0 A 1 A 2
B 1 B 2B 0
C 1
0
20 %
0 100 %B asis w e ight
Fill
er
co
nte
nt
C 0 C 2
Inc reas in g b lad e dew ate rin g
Inc
rea
sin
gfl
ow
rate B S TS
0
20 %
0 100 %B asis w e ight
Fill
er
co
nte
nt
0
20 %
0 100 %B asis w e ight
Fill
er
co
nte
nt
0
20 %
0 100 %B asis w e ight
Fill
er
co
nte
nt
0
20 %
0 100 %B asis w e ight
Fill
er
co
nte
nt
0
20 %
0 100 %B asis w e ight
Fill
er
co
nte
nt
0
20 %
0 100 %B asis w e ight
Fill
er
co
nte
nt
0
20 %
0 100 %B asis w e ight
Fill
er
co
nte
nt
0
20 %
0 100 %B asis w e ight
Fill
er
co
nte
nt
Fig. 22. Original filler distributions (solid lines) and estimates (broken lines). Theestimates are based on model. 80 gsm paper.
Results show that the forming section dewatering numbers determine the fillerdistribution characters relatively well. The tests were performed with 80 gsm finepaper.
The shape factor responded similarly to the headbox flow rate changes as was thecase in the other study [III] performed by the author. The correlation of formingsection parameters with filler distribution shape characters was less significant with80 gsm paper, because the vacuum adjustments in the LB-loading unit were limitedand trials were performed with constant blade pressure.
34
THE USE OF ADDITIVES LAYERING AS A PART OF PAPER QUALITYCONTROL
Paper quality requirements depend greatly upon the end users' needs.Requirements for coated base papers can differ significantly from those for copypapers. Base paper quality parameters such as porosity and surface roughness areimportant factors affecting the quality of coated paper. The correlation between thesmoothness of base paper and the smoothness of coated paper is clear. Base paperproperties should also be symmetrical in order to avoid the need for asymmetricaltreatment of the base paper [65-67]. High base paper surface filler contentdecreases coating color penetration into the base paper structure and the coatingcolor stays better on the surface [43-45]. For copy paper grades the ideal fillerdistribution needs to be symmetrical and the surface filler content lower than theaverage filler content to reduce dusting [24,26].
It has been shown that dewatering conditions during drainage are responsible for themovement of fines and fillers in the thickness direction of a sheet [III, 24-26,65], whilelater process phases, such as pressing, no longer have a significant effect on fillerdistributions [68]. The role of different forming concepts on the control of fines andfiller distributions can vary. Fourdriniers show low fines and filler content on the wireside. Hybrid formers reduce top side fines and filler content which results in a moresymmetrical distribution in which the filler is concentrated in the center of the sheet.Gap former results show that the fines and filler distributions are symmetrical andmore or less U-shaped [25].
Even if the importance of the z-directional distribution of fillers and fines on paperquality has been noted, less attention has been paid to how to control thedistributions. In many cases multilayering has been considered for its potential toimprove some paper quality properties. Less attention has been paid to the role anduse of the multilayering process as a tool in the control of critical quality parameters.This is important, particularly in those cases when other process variables are alsopresent.
In the study performed by the author on fine paper [IV], one of the main goals was tofind out whether there is any relationship between filler distributions and other paperquality parameters. The study was done by using a 3-layer headbox and roll andblade gap former. Wet end additives layering principles were used to control the fillerdistribution together with the normal headbox and former running parameters. Themodels were created and used to study the relations between the filler distributionsand the chosen quality parameters. The parameters were extracted from the pilotpaper machine trial results using a statistical approach. The quality parameterschosen in this case were formation, porosity and oil absorption two-sidedness. Themain focus of the study was on 50 and 80 gsm woodfree papers.
35
Estimates
The calculation of filler distribution estimates was based on Equations 5 and 6. Thenext step was to calculate the estimates for the porosity (Poroe), formation index(Formae), and oil absorption two-sidedness (Oilabe). The mathematical definition forthe factors can be expressed in the following way:
Poroe = f(Psym, Pu, Q, FRvac, LBvac1, LBvac2), (9)
Formae = f(Psym, Pu, Q, FRvac, LBvac1, LBvac2), (10)and
Oilabe = f(Psym, Pu, Q, FRvac, LBvac1, LBvac2), (11)
where Psym = retention chemical dosing symmetry factor,Pu = retention chemical dosing shape factor,Q = headbox flow rate,FRvac = forming roll vacuum,LBvac1 = vacuum level of the lower suction box in the LB-loading unit,LBvac2 = vacuum level of the upper suction box in the LB-loading unit.
A regression analysis method (Central Composite Surface Design [32]) was used forthe calculation of the coefficients for the factors presented in equations (9), (10) and(11). In Appendix 6 has been shown the estimated vs. measured, porosity, formationindex and oil absorption two-sidedness for both 50 and 80 gsm papers.
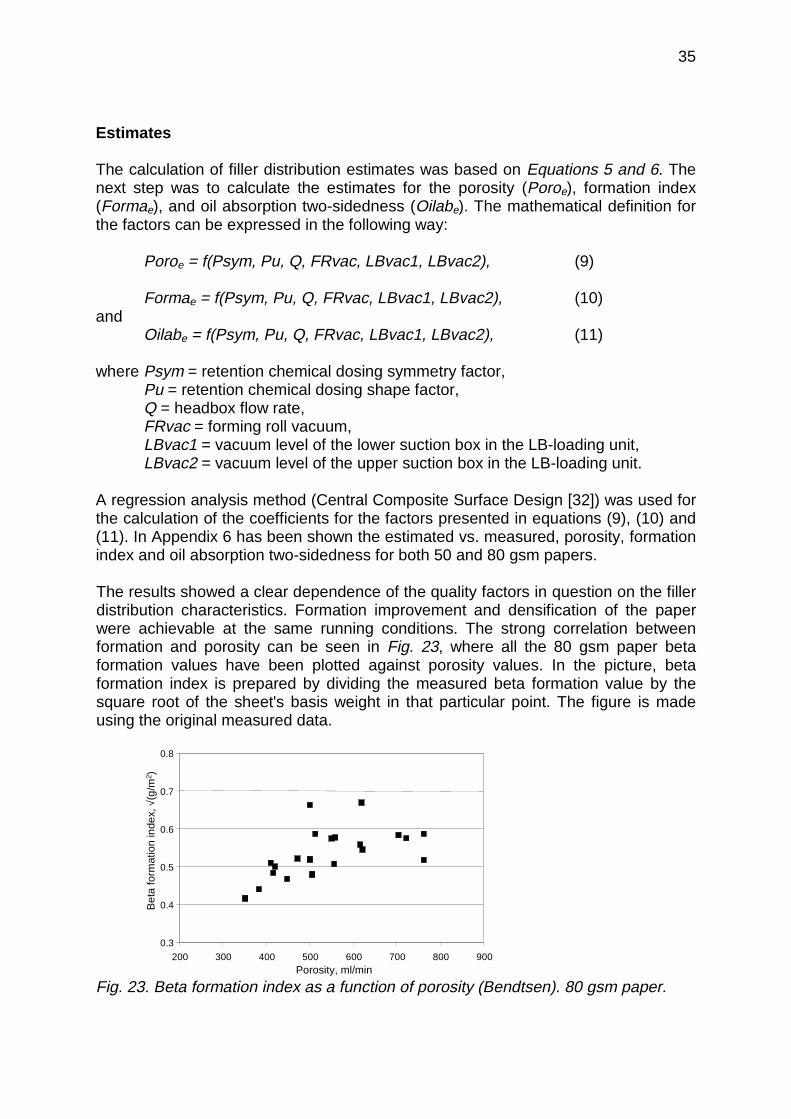
The results showed a clear dependence of the quality factors in question on the fillerdistribution characteristics. Formation improvement and densification of the paperwere achievable at the same running conditions. The strong correlation betweenformation and porosity can be seen in Fig. 23, where all the 80 gsm paper betaformation values have been plotted against porosity values. In the picture, betaformation index is prepared by dividing the measured beta formation value by thesquare root of the sheet's basis weight in that particular point. The figure is madeusing the original measured data.
0.3
0.4
0.5
0.6
0.7
0.8
200 300 400 500 600 700 800 900Porosity, ml/min
Bet
afo
rmat
ion
inde
x,√ (
g/m
2 )
Fig. 23. Beta formation index as a function of porosity (Bendtsen). 80 gsm paper.
36
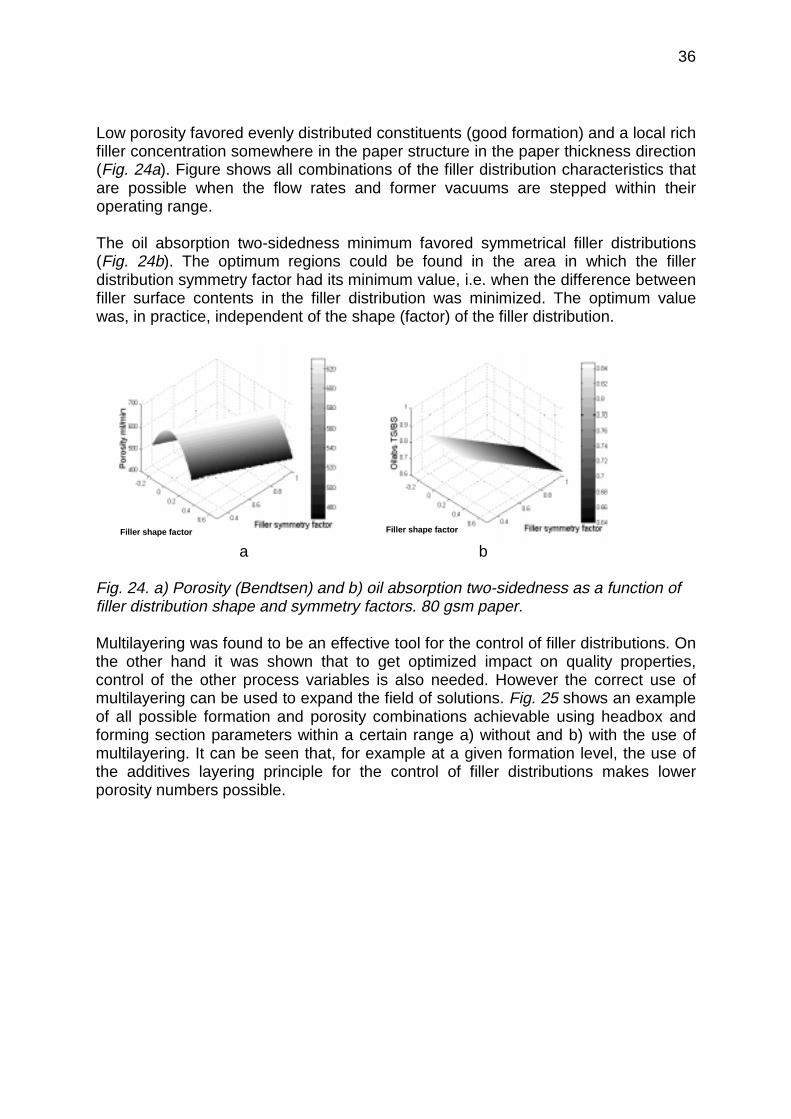
Low porosity favored evenly distributed constituents (good formation) and a local richfiller concentration somewhere in the paper structure in the paper thickness direction(Fig. 24a). Figure shows all combinations of the filler distribution characteristics thatare possible when the flow rates and former vacuums are stepped within theiroperating range.
The oil absorption two-sidedness minimum favored symmetrical filler distributions(Fig. 24b). The optimum regions could be found in the area in which the fillerdistribution symmetry factor had its minimum value, i.e. when the difference betweenfiller surface contents in the filler distribution was minimized. The optimum valuewas, in practice, independent of the shape (factor) of the filler distribution.
Filler shape factor Filler shape factor
a b
Fig. 24. a) Porosity (Bendtsen) and b) oil absorption two-sidedness as a function offiller distribution shape and symmetry factors. 80 gsm paper.
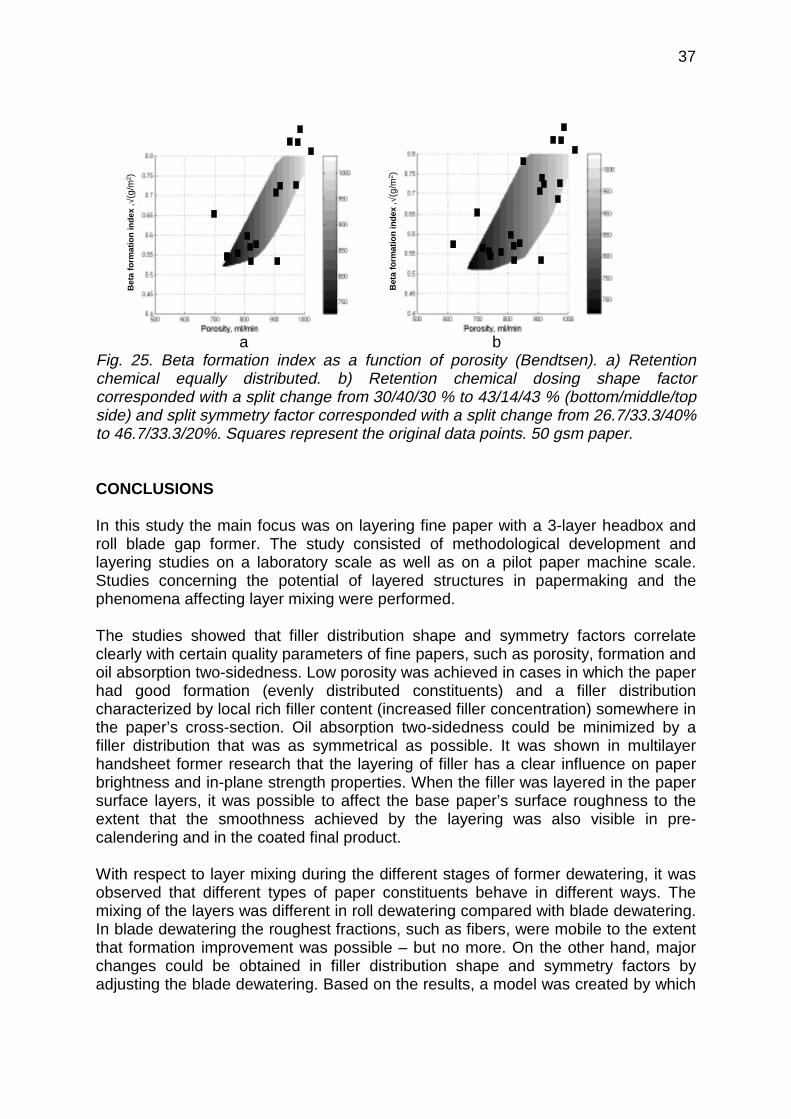
Multilayering was found to be an effective tool for the control of filler distributions. Onthe other hand it was shown that to get optimized impact on quality properties,control of the other process variables is also needed. However the correct use ofmultilayering can be used to expand the field of solutions. Fig. 25 shows an exampleof all possible formation and porosity combinations achievable using headbox andforming section parameters within a certain range a) without and b) with the use ofmultilayering. It can be seen that, for example at a given formation level, the use ofthe additives layering principle for the control of filler distributions makes lowerporosity numbers possible.
37
Bet
afo
rmat
ion
inde
x, √
(g/m
2 )
Bet
afo
rmat
ion
inde
x, √
(g/m
2 )
a bFig. 25. Beta formation index as a function of porosity (Bendtsen). a) Retentionchemical equally distributed. b) Retention chemical dosing shape factorcorresponded with a split change from 30/40/30 % to 43/14/43 % (bottom/middle/topside) and split symmetry factor corresponded with a split change from 26.7/33.3/40%to 46.7/33.3/20%. Squares represent the original data points. 50 gsm paper.
CONCLUSIONS
In this study the main focus was on layering fine paper with a 3-layer headbox androll blade gap former. The study consisted of methodological development andlayering studies on a laboratory scale as well as on a pilot paper machine scale.Studies concerning the potential of layered structures in papermaking and thephenomena affecting layer mixing were performed.
The studies showed that filler distribution shape and symmetry factors correlateclearly with certain quality parameters of fine papers, such as porosity, formation andoil absorption two-sidedness. Low porosity was achieved in cases in which the paperhad good formation (evenly distributed constituents) and a filler distributioncharacterized by local rich filler content (increased filler concentration) somewhere inthe paper’s cross-section. Oil absorption two-sidedness could be minimized by afiller distribution that was as symmetrical as possible. It was shown in multilayerhandsheet former research that the layering of filler has a clear influence on paperbrightness and in-plane strength properties. When the filler was layered in the papersurface layers, it was possible to affect the base paper’s surface roughness to theextent that the smoothness achieved by the layering was also visible in pre-calendering and in the coated final product.
With respect to layer mixing during the different stages of former dewatering, it wasobserved that different types of paper constituents behave in different ways. Themixing of the layers was different in roll dewatering compared with blade dewatering.In blade dewatering the roughest fractions, such as fibers, were mobile to the extentthat formation improvement was possible – but no more. On the other hand, majorchanges could be obtained in filler distribution shape and symmetry factors byadjusting the blade dewatering. Based on the results, a model was created by which
38
it was possible to explain the observations made during the study concerning thefactors affecting formation improvement in the LB-loading unit of the gap former.
In summary it can be said that, given the layering technology in use it will beessential to acquire more accurate control over the behavior of all the factorsaffecting layering before it is possible to take a number of quality factors into accountin order to achieve an overall quality optimum. This is true regardless of whether thequestion concerns a filler-layered product or a product in which the goal is to layerthe fibers. However, there is much evidence to show that, with careful optimization, itwill be possible to achieve the layering objectives without neglecting other importantquality factors.
REFERENCES
1. Helmer, R.J.N., Covey, G.H., Raverty, W.D., Vanderhoek, N., Preliminarydevelopment of a laboratory former for oriented sheets. Appita J., 53(6): 465-470(2000).
2. Moller, K. , Jonsson, L. , Ek, R., A new handsheet former simulating fourdrinierforming. Svensk Papperstidning, 82(9): 267-271 (1979).
3. Trepanier, R.J., Dynamic Forming: Parameters for making oriented sheets in thelaboratory. Pulp Pap. Can. 90(4): 45-48 (1989).
4. Wildfong, V. J., Genco, J. M., Shands, J. A., Bousfield, D. W., Filtrationmechanics of sheet forming. Part 1: Apparatus for determination of constant-pressure filtration resistance. Beloit , University of Maine. J. Pulp Pap. Sci., 26(7):250-254 (2000).
5. Bergström, J.I., Peel, J.D., Fundamentals of Structured Webforming. 18thEUCEPA Conference London, 120-130 (1979).
6. Htun, M., Fellers, C., The invariant mechanical properties of oriented handsheets.Tappi, 65(4): 113-117 (1982).
7. Stöckmann, V. E., Performance of stratified sheets. TAPPI, 57(10): 108-110(1974).
8. Erickson, L. D., Physical properties of stratified sheets. TAPPI, 60(10): 113-115(1977).
9. von Herzen, L., Täyte- ja muut lisäaineet hienopaperin monikerrosrainauksessa.Diplomityö, Teknillinen korkeakoulu, Puunjalostustekniikan osasto, 118p. (1996).
10.Stöckman, V.,E., Effect of bonding intensityprofile variations on performance ofpaper. Annual Meeting Preprint, TAPPI, Atlanta, Ga., 39-45 (1974).
39
11.Nanko, H., Mukoyoshi, S. , Ohsawa, J., Multi-layered handsheet making withlaboratory sheet machine. Jpn Tappi, 41(3): 49-54 (1987).
12.Moore, G.K., Multiply web structure and performance. Multi-ply forming forum,Atlanta, GA, USA,13-21 (1998).
13.Sauret, G., Trinh, H.J., Lefebvre, G., Versuche zur Herstellung mehrlagigerIndustriekartons im Laboratorium. Das Papier, 23(1): 8-12 (1969).
14.Bristow, J.A., Pauler, N., Multilayer structures in printing papers. Paper I-3.Eucepa, Manufacturing Processes and Control in the Paper and PrintingIndustries, 1-26 (1982).
15.Hamelink, J., The Effect of Fiber Distribution upon Stiffness of Paperboard.Tappi, 46(10): (1963).
16.Ranger, A. E., Flexural stiffness of multi-ply boxboard. Paper Technology, 8(1):51-57 (1967).
17.Sivén, S., Manner, H., Twin wire retention tester. 2000 Tappi PapermakersConference, Vancouver, BC, Canada, 767-773 (2000).
18.Sivén, S., Manner, H., High speed retention tester. PAPTAC 86th Annual Meeting,A37-A41 (2000).
19.Hammock, C., Garnier, G., Laboratory twin former, part 1: Design andperformance. Tappi J., 83(10): 13 p. (2000).
20.Erkkilä, A-L., Mechanisms and measurements of the layered orientation structureof paper sheets. Thesis for the Degree of Licentiate of Philosophy. Department ofphysics, University of Jyväskylä, Finland, Laboratory report 2/1995, 65 p. (1995).
21.Erkkilä, A-L., Pakarinen, P., Odell, M., The Effect of Forming Mechanisms onLayered Fiber Structure in Roll and Blade Gap Forming. TAPPI 99 - preparing forthe next millennium, Atlanta, GA, USA, 2, p. 389-400 (1999).
22.Harwood, J., W., Stratification of Paper Grades. Tappi Journal, 73(5): 115-122(1990).
23.Häggblom-Ahnger, U., Layering of office paper. Paperi ja Puu- Paper andTimber, 80(7): 508-513 (1998).
24.Häggblom-Ahnger, U., Pakarinen, P., Odell, M., Eklund, D., Conventional andstratified forming of office paper grades. Tappi Journal, 81(5): 149-158 (1998).
25.Kinnunen, J., Lloyd, M.D., Nygren-Konttinen, A., A new world of papermaking -layered SC-paper. Paperi ja Puu- Paper and Timber, 80(3): 1-5 (1998).
26.Odell, M., Paper Structure Engineering. Appita Journal, 3(5): 371-377 (2000).
40
27.Dickson, R., Forsström, U., Grön, J., Coating coverage of meter size press pre-coated paper. TAPPI Coating & Graphic Arts Conference, May 1-3, Washington,DC, USA, 167-184 (2000).
28.Tanaka, H., Luner, P., Côté, W., How retention aids change the distribution offiller in paper. Tappi 65(4): 95-99 (1982).
29.Li, A.C., Rogers, T.D., Shands, J.A., Mixing intensity analysis of a 2-layerstratified headbox jet. Tappi Journal, 83(12): 16 (2000).
30.Andersson, I., Simultaneous forming of multi-layer products with the KMW airwedge technology. Papex ´82 International - Papermaking in the Eighties, PITAHarrogate, Yorkshire, 86-97 (1982).
31.Andersson, I., Multilayering on a roll former. SPCI World Pulp and Paper Week -New Available Techniques, SPCI Stockholm, 157-163 (1984).
32.Montgomery, D., C., Design and Analysis of Experiments. Fourth Edition, JohnWiley and Sons, 704p. (1996).
33.Lloyd, M.D., Norman, B., Layer mixing during three-layer stratified forming: therole of vane length and mix-wire speed difference. Tappi Journal 81(11): 194-202(1998).
34.Attwood, B. W., Multi-ply web-forming - past, present, and future. TAPPI, 63(8):78-82 (1980).
35.Koran, Z., Multi-ply forming – improves properties and cuts costs. PaperTechnology, 32(9): 38-42 (1991).
36.Bergström, J.I., Stratified web formation, current and potential applications. Norskskogindustri, 31:(5), 133-137, 1977.
37.Cumming, R.M., Reducing market pulp consumption or its costs 1 – By improvedmachinery and control. Paper, 189(6): 346-376 (1978).
38.Ewald, J.L., Forming layered products allows best use of different furnishes, Pulp& Paper, 137-140 (1981).
39.Collins, N.J., Colley, J., Layered Paper Structures- the Influence of FurnishGeometry on Physical Properties. Appita, 33(2): 119- 123 (1979).
40.Odell, M., Multilayering, method or madness. XI Valmet Paper Technology Days,53-61 (1998).
41.Häggblom-Ahnger, U. Optimum location of softwood sulfate pulp in three-plyoffice paper. Tappi Journal, 82(6): 181-187 (1998).
41
42.Häggblom-Ahnger, U. Fractionation of softwood sulfate pulp in three-ply copypaper. 2nd ECO PAPER TECH Conference, Helsinki, 195-206 (1998).
43.Forsström, U., Dickson, R.J., Grön, J., Strichdeckung und Struktur von holzfreienPapieren, die in der Filmpresse vorgestrichen wurden. Wochenblatt fürPapierfabrikation, 128(14/15): 985-992 (2000).
44.Grön, J., Ahlroos, J., Influence of base paper filler content and pre-calendering onmetered film press coating- Part I: A coating study. TAPPI Coating/PapermakersConference, May 4-6, New Orleans, LA, USA, 899-914 (1998).
45.Ahlroos, J., Alexandersson, M., Grön, J., Influence of base paper filler contentand pre-calendering on metered film press coating- Part II: Paper and printquality. TAPPI Coating/Papermakers Conference, May 4-6, New Orleans, LA,USA, 915-925 (1998).
46.Lindström, T., Some fundamental chemical aspects on paper forming. 9thFundamental Research Symposium 'Fundamentals of Papermaking, September17-22, Cambridge, UK, 309-412 (1989).
47.Lindström, T., Retention aids - their mechanism of action and interactions. Wetend chemistry conference and COST workshop, May 28-29, Gatwick, UK,40(1997).
48.Baker, J.K., Beuther, P.D., Farrington (Jnr), T.E., Impact of three dimensionalheadbox flows on tissue layer purity. AIChE Symposium Series, Advances inPulp and Papermaking, 132-142 (1995).
49.Jetsu, P., Kellomäki, M., Karema, H., Salmela, J., Lappalainen, T., Piirto, M.,Coherent structures of suspension flow and their inheritance in paper. 12th
Fundamental Recearch Symposium, Oxford, September, 18 (2001).
50.Lloyd, M.D., Norman, B., Use of stepped vanes to alter headbox turbulencelevels during stratified forming of woodfree paper. Appita Journal 52(2): 98-104(1999).
51.Lepomäki, H., Huovila, J., Karema, H., Control of paper properties throughheadbox fluid dynamics, ZELLCHEMIN Annual Meeting 2001, T44-T47 (2001).
52.Söderberg, D., A comparison between the flow from a paper machine headboxand a low Reynolds number water jet. Tappi Engineering Conference, Anaheim,1155-1172 (1999).
53.Norman, B., Söderberg, D., Overview of forming literature 1990-2000. STFIReport, PUB 3, 116 p (2001).
42
54.Parsheh, M., Aspects of boundary layers, turbulence and mixing in a planecontraction with elastic vanes, envisaging potential application to papermanufacturing. Licentiate Thesis. Technical reports from Royal Institute ofTechnology Department of Mechanics FaxenLaboratoriet, Sweden (1999).
55.Li, A.C., Neill, E.B., Rogers, T.D., Fundamental studies of mixing in a stratifiedheadbox jet. Paptac, 86th annual meeting, Montreal, A53-A56 (2000).
56.Niskanen, K., Kajanto, I., Pakarinen, P., Paper structure. Papermaking Scienceand Technology 16. Paper Physics, edited by Gullichsen, J., Paulapuro, H.,Niskanen, K., chapter 1, 14-53, [Helsinki, Finland: Fapet Oy, 324p. (1998)]
57.Retulainen, E., Niskanen, K., Nilsen, N., Fibers and bonds. Papermaking Scienceand Technology 16. Paper Physics, edited by Gullichsen, J., Paulapuro, H.,Niskanen, K., chapter 2, 54-87, [Helsinki, Finland: Fapet Oy, 324p. (1998)]
58.Wildfong, V.J., Genco, J.M., Shands, J.A., Bousfield, D.W., Filtration Mechanicsof Sheet Forming. Part II: Influence of Fine Material and Compression. Journal ofPulp and Paper Science, 26(8): 280-283 (2000).
59.Zhao, R. H., Kerekes, R. J., The effect of consistency on pressure pulses in bladegap formers, Pap. Puu, 78(1-2): 36-38 (1996).
60.Nordström, B., Norman, B., Effects of Headbox Jet Quality and Blade PulseForce on Formation, Retention, and Mechanical Properties During Roll-BladeForming with Curved Blades. Nordic Pulp & Paper Research Journal, 1, 33-40(1995).
61.Norman, B., Hydrodynamic developments in twin-wire forming – an overview.Paperi ja Puu – Paper and Timber 78(6-7): 376-381 (1996).
62.Kerekes, R.J., Schell, C.J., Characterization of Fibre Flocculation Regimes by aCrowding Factor. J. Pulp Paper Science, 18(1): 32-38 (1992).
63.Kerekes, R.J., Schell, C.J., Effects of fiber length and coarseness on pulpflocculation. Tappi Journal 78(2): 133-139 (1995).
64.Bennington, C. P. J., Kerekes, R. J., Grace, J. R., The yield stress of fibresuspensions. Can. J. Chem. Eng. 68, 748-757 (1990).
65.Lehtinen, E. , Introduction to pigment coating of paper. Papermaking Science andTechnology 11. Pigment Coating and Surface Sizing of Paper, edited byGullichsen, J., Paulapuro, H., Lehtinen, E., chapter 1, p. 14-27, [Helsinki, Finland:Fapet Oy, 2000, 810p.]
66.Hietanen, S. , Woodfree base paper. Papermaking Science and Technology 11.Pigment Coating and Surface Sizing of Paper, edited by Gullichsen, J.,Paulapuro, H., Lehtinen, E., chapter 3, p. 46-59, [Helsinki, Finland: Fapet Oy,2000, 810p.]

43
67.Grön, J., Rautiainen, P., Coating solutions for woodcontaining and woodfreepaper grades. Coating conference, Toronto, Canada, 457-467 (1999).
68.Szikla, Z. and Paulapuro, H., Z-directional distribution of fines and filler material inthe paper web under wet pressing conditions. Paperi ja Puu- Paper and Timber,68(9): 654-664 (1986).
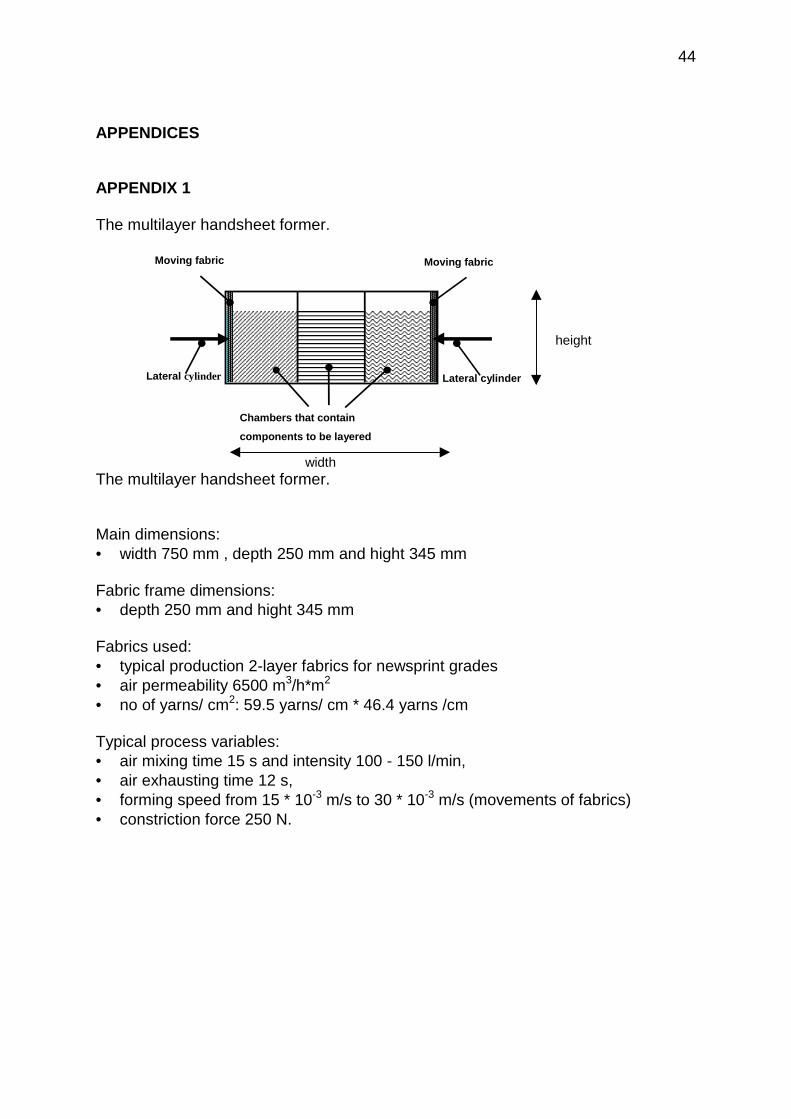
44
APPENDICES
APPENDIX 1
The multilayer handsheet former.
Moving fabric
Lateral cylinder
Chambers that contain
components to be layered
Moving fabric
Lateral cylinder
widthThe multilayer handsheet former.
Main dimensions:• width 750 mm , depth 250 mm and hight 345 mm
Fabric frame dimensions:• depth 250 mm and hight 345 mm
Fabrics used:• typical production 2-layer fabrics for newsprint grades• air permeability 6500 m3/h*m2
• no of yarns/ cm2: 59.5 yarns/ cm * 46.4 yarns /cm
Typical process variables:• air mixing time 15 s and intensity 100 - 150 l/min,• air exhausting time 12 s,• forming speed from 15 * 10-3 m/s to 30 * 10-3 m/s (movements of fabrics)• constriction force 250 N.
height
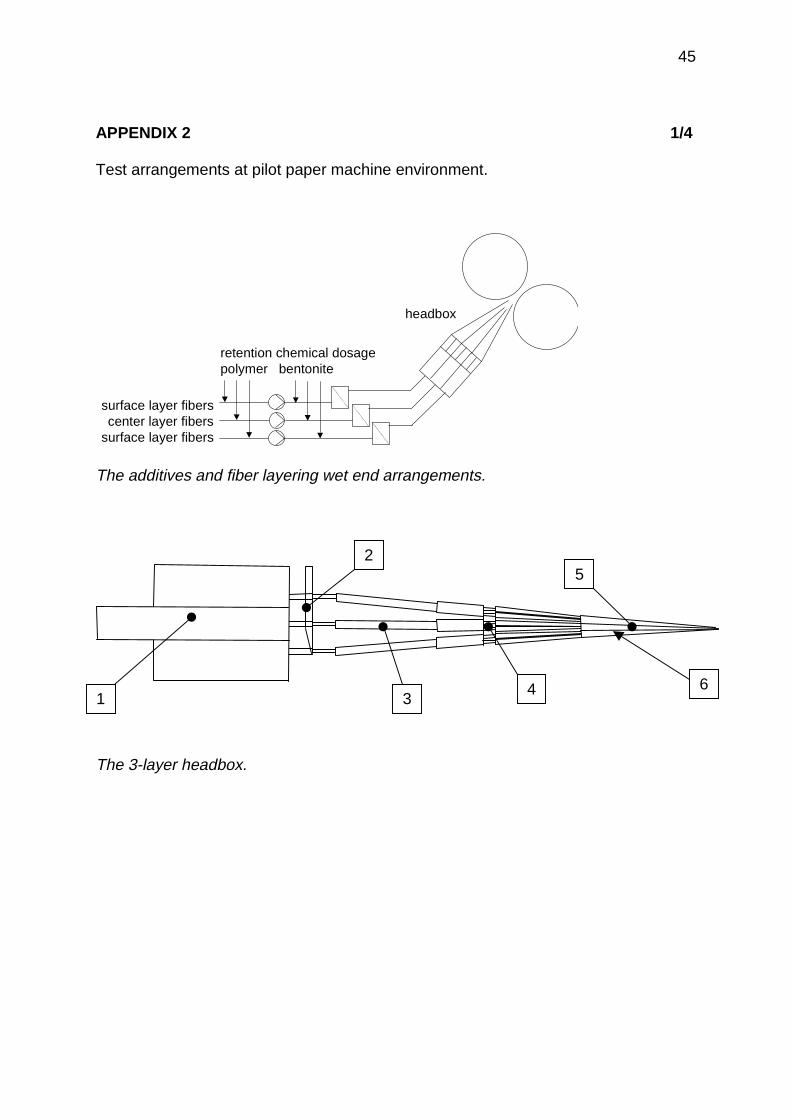
45
APPENDIX 2 1/4
Test arrangements at pilot paper machine environment.
retention chemical dosagepolymer bentonite
surface layer fiberscenter layer fibers
surface layer fibers
headbox
The additives and fiber layering wet end arrangements.
The 3-layer headbox.
6
5
43
2
1
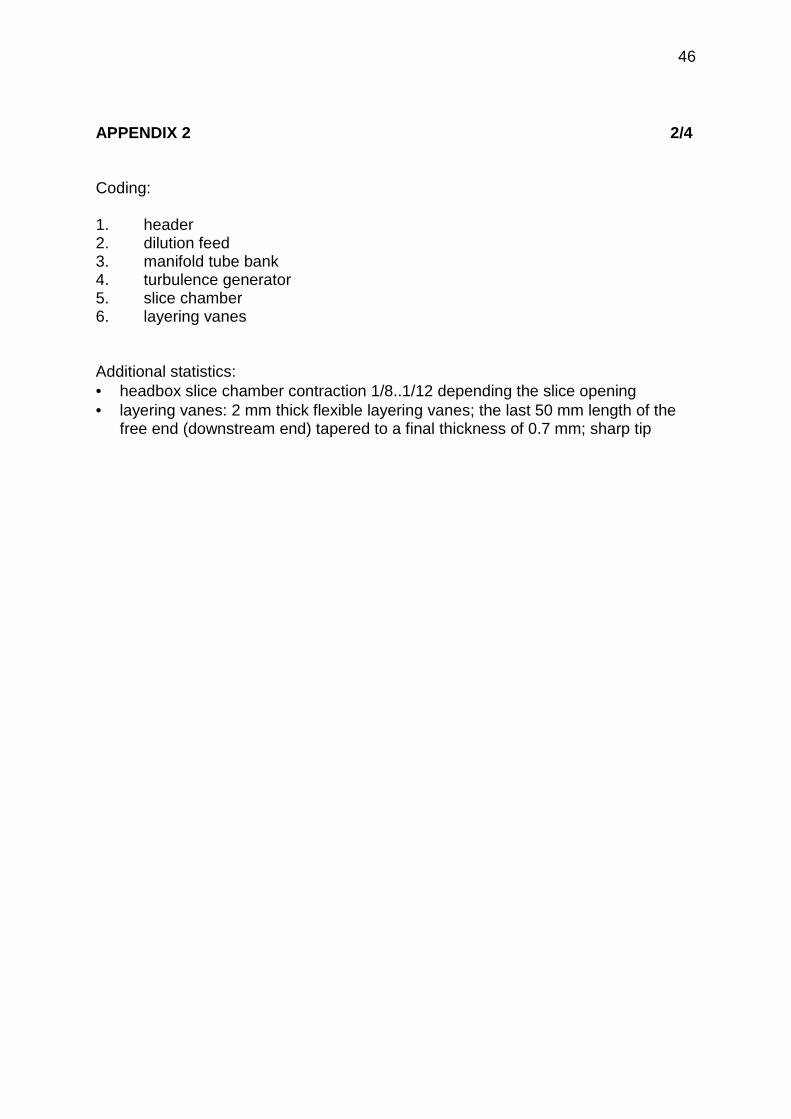
46
APPENDIX 2 2/4
Coding:
1. header2. dilution feed3. manifold tube bank4. turbulence generator5. slice chamber6. layering vanes
Additional statistics:• headbox slice chamber contraction 1/8..1/12 depending the slice opening• layering vanes: 2 mm thick flexible layering vanes; the last 50 mm length of the
free end (downstream end) tapered to a final thickness of 0.7 mm; sharp tip
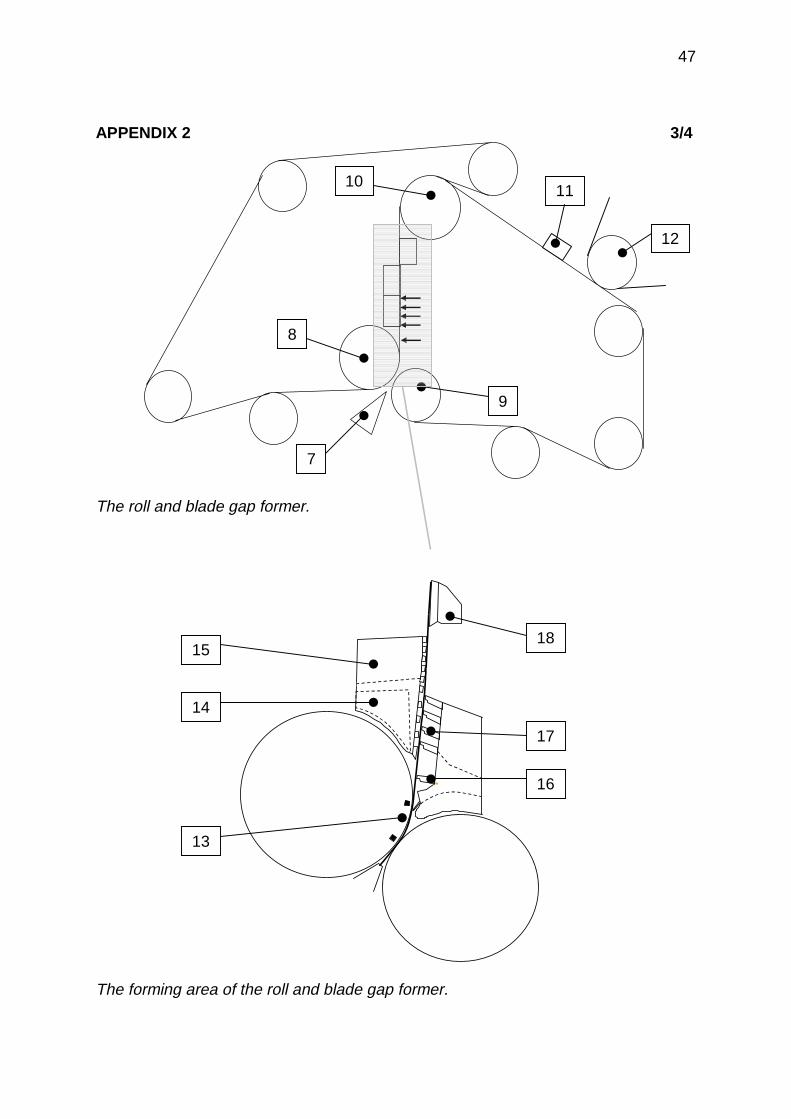
47
APPENDIX 2 3/4
The roll and blade gap former.
The forming area of the roll and blade gap former.
8
1011
7
9
12
16
13
18
17
14
15

48
APPENDIX 2 4/4
Coding:
7. headbox8. forming roll9. breast roll10. 1st suction roll11. high vacuum suction box12. pick-up roll13. forming roll vacuum zone14. LB shoe 1 suction element15. LB shoe 2 suction element16. LB pre-loading element17. LB loading elements18. suction box
Additional statistics:
• wrap angle (the area where the outermost fabric is producing gap pressureagainst the forming roll) 15 º
• the radial width of the forming roll suction zone 15 º• forming roll diameter 1600 mm• fabrics: typical 2-layer fine paper fabrics; air permeability 5500..6500 m3/h*m2
• fabric tensions 8 kN/m

49
APPENDIX 3
Table 1. Standard laboratory measuring methods.
Filler content Incineration method according to the SCAN P5:63
Furnish drainability (SR° value) Shopper-Riegler device calibrated according to theSCAN-C 19:65
Beta formation Ambertec beta formation tester
Oil absorption Cobb-Unger oil absorption measuring methodaccording to the SCAN-P 37:77
Bendtsen Porosity Bendtsen measuring device calibrated according toSCAN-P 21:67
50
APPENDIX 4 1/2
Regression coefficients for filler distribution shape and symmetry factors, Fue andFsyme . Relates to the publication III: Wet end control of filler distributions usingadditives layering principles.
50 gsm paper
Fsyme = k11*Psym+k12*Q+k13*Q*Q+k14*LBvac12+k10, where
k10=26.88k11=0.30k12=-0.26k13=0.00064k14=0.020
Fue = k21*Pu+k20, where
k20=0.19k21=0.030
80 gsm paper
Fsyme = k11*Pu+k12*Psym+k13*FRvac+k10, where
k10=0.030k11=-0.060k12=0.28k13=-0.033
Fue = k21*Vane length(rel)+k22*Pu+k23*Q+k24*FRvac+k25*Pu*Q+k20, where
k20=-6.46k21=0.0043k22=0.63k23=0.031k24=-0.022k25=-0.0029
51
APPENDIX 4 2/2
Regression coefficients for filler distribution shape and symmetry factors, Fue andFsyme . Relates to the publication V: Control of fiber mobility and filler distribution inwet end layering.
Fsyme = k11* Total former dewatering+k12* Dewatering two-sidedness (TS/BS)+k13* Total former dewatering * Dewatering two-sidedness (TS/BS) + k10, where
k10=-2.81k11=2.28k12=1.86k13=-1.41
Fue = k21 * Total former dewatering + k20, where
k20=-1.41k21=1.44
52
APPENDIX 5 1/2
The headbox and former parameters related to the publication III: Wet end
control of filler distributions using additives layering principles.
Table 2. Headbox and former parameters. Publication III.
50 gsm paper 80 gsm paper
min max min max
Polymer dose symmetry, Psym -9 0 -9 0
Polymer dose shape, Pu 0 4,5 0 4,5
Layer vane length relative
to HBX nozzle, mm
-49 +26 -49 +46
Head box flow rate, l/s*m 190 230 190 210
Forming roll vacuum, kPa -2 0 -20 -5
LB-shoe vacuums 1&2
(combined), kPa
-25 -10 -10 0
The headbox and former parameters related to the publication IV: Controlling
filler distributions for improved fine paper properties.
Table 3. Headbox and former parameters. Publication IV.
50 gsm paper 80 gsm paper
min max min max
Polymer dose symmetry, Psym -9 0 -9 0
Polymer dose shape, Pu 0 4,5 0 4,5
Head box flow rate, l/s*m 190 230 190 210
Forming roll vacuum, kPa -2 0 -20 -5
LB-shoe 1 vacuum, kPa -10 -5 -5 0
LB-shoe 2 vacuum, kPa -15 -5 -5 0
53
APPENDIX 5 2/2
The headbox and former parameters related to the publication V: Control of
fiber mobility and filler distribution in wet end layering (V).
Table 4. Headbox and former parameters. Publication V.
Headbox flow rate, l/s*m 150,170,200
Forming roll vacuum, kPa -20, -10
Loading blade load pressure, kPa 0, 10, 20
LB-shoe 1 vacuum (Lb-blades), kPa -12, -5
LB-shoe 2 vacuum (next to Lb-shoe 1), kPa -20, -5
Dyed fibers in center layer not in use, in use
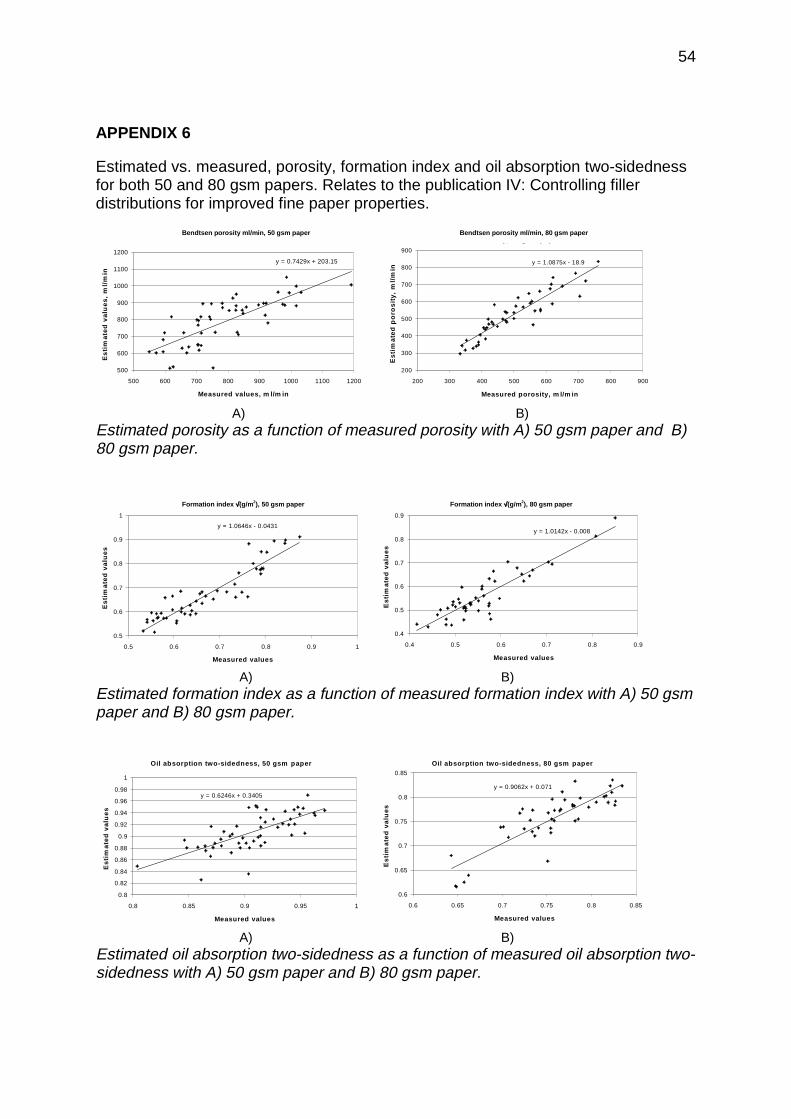
54
APPENDIX 6
Estimated vs. measured, porosity, formation index and oil absorption two-sidednessfor both 50 and 80 gsm papers. Relates to the publication IV: Controlling fillerdistributions for improved fine paper properties.
Porosity, 50 gsm paper
y = 0.7429x + 203.15
500
600
700
800
900
1000
1100
1200
500 600 700 800 900 1000 1100 1200
Measured values, m l/m in
Est
ima
ted
valu
es,
ml/
min
Porosity, 80 gsm paper
y = 1.0875x - 18.9
200
300
400
500
600
700
800
900
200 300 400 500 600 700 800 900
Measured porosity, m l/m inE
stim
ate
dp
oro
sity
,m
l/m
in
A) B)Estimated porosity as a function of measured porosity with A) 50 gsm paper and B)80 gsm paper.
Form ation index, 50 gsm paper
y = 1.0646x - 0.0431
0.5
0.6
0.7
0.8
0.9
1
0.5 0.6 0.7 0.8 0.9 1
Measured values
Est
ima
ted
valu
es
Form ation index, 80 gsm paper
y = 1.0142x - 0.008
0.4
0.5
0.6
0.7
0.8
0.9
0.4 0.5 0.6 0.7 0.8 0.9
Measured values
Est
ima
ted
valu
es
A) B)Estimated formation index as a function of measured formation index with A) 50 gsmpaper and B) 80 gsm paper.
Oil absorption two-sidedness, 50 gsm paper
y = 0.6246x + 0.3405
0.8
0.82
0.84
0.86
0.88
0.9
0.92
0.94
0.96
0.98
1
0.8 0.85 0.9 0.95 1
Measured values
Est
ima
ted
valu
es
Oil absorption two-sidedness, 80 gsm paper
y = 0.9062x + 0.071
0.6
0.65
0.7
0.75
0.8
0.85
0.6 0.65 0.7 0.75 0.8 0.85
Measured values
Est
ima
ted
valu
es
A) B)Estimated oil absorption two-sidedness as a function of measured oil absorption two-sidedness with A) 50 gsm paper and B) 80 gsm paper.
Bendtsen porosity ml/min, 50 gsm paper Bendtsen porosity ml/min, 80 gsm paper
Formation index √√√√(g/m2), 50 gsm paper Formation index √√√√(g/m2), 80 gsm paper