Embed Size (px)
Citation preview
Information Sciences 178 (2008) 3333–3346
Contents lists available at ScienceDirect
Information Sciences
journal homepage: www.elsevier .com/locate / ins
Multiple-vector user profiles in support of knowledge sharing
Joris Vertommen a,*, Frizo Janssens b, Bart De Moor b, Joost R. Duflou a
a Centre for Industrial Management, Katholieke Universiteit Leuven, Celestijnenlaan 300A bus 2422, 3001 Heverlee, Belgiumb Department of Electrical Engineering, Katholieke Universiteit Leuven, Belgium
a r t i c l e i n f o a b s t r a c t
Article history:Received 10 July 2007Received in revised form 16 April 2008Accepted 2 May 2008
Keywords:Knowledge managementUser profilingText miningTacit knowledgeCommunities of practice
0020-0255/$ - see front matter � 2008 Elsevier Incdoi:10.1016/j.ins.2008.05.001
* Corresponding author. Tel.: +32 16 32 27 60; faE-mail addresses: [email protected]
Moor), [email protected] (J.R. Duflou)
This paper describes an algorithm to automatically construct expertise profiles for com-pany employees, based on documents authored and read by them. A profile consists of aseries of high dimensional vectors, each describing an expertise domain, and provides ahierarchy between these vectors, enabling a structured view on an employee’s expertise.The algorithm is novel in providing this layered view, as well as in its high degree of auto-mation and its generic approach ensuring applicability in an industrial setting.
The profiles provide support for several knowledge management functionalities that aredifficult or impossible to achieve using existing methods. This paper in particular presentsthe initialization of communities of practice, bringing together both experts and novices ona specific topic. An algorithm to automatically discover relationships between employeesbased on their profiles is described. These relationships can be used to initiate communitiesof practice. The algorithms are validated by means of a realistic dataset.
� 2008 Elsevier Inc. All rights reserved.
1. Introduction
Over the last few decades, the industrial world has witnessed a growing awareness of the importance of knowledge.Knowledge has been recognized as a dominant economic factor for innovation oriented enterprises. This is not at all surpris-ing: the value of a company is only partly represented by its tangible assets, such as buildings, equipment and capital. Theadded value of a product is primarily determined by the knowledge and experience of the people that design and produce it.This knowledge is often tacitly ungraspable, residing in people’s heads, but it can also be made explicit, for instance by writ-ing it down in product manuals [17].
Many companies have taken on the challenge to manage this knowledge in the most effective way [5,12,15], often makinguse of supporting technologies, here referred to as knowledge management systems (KMS). A large variety of this type ofsystems is commercially available on the market today. The nature of company activities determines for a large part thesteps that can be taken towards a knowledge management solution. The research in this paper focuses on companies thatoperate in a fast-paced, innovation dependant environment.
A typical problem that arises when knowledge is not properly managed is the inaccessibility of this knowledge to othersand, as a result, the phenomenon of reinventing the wheel. Time studies indicate that, throughout a design process, designersspend on average 19% of their time – with peaks to 36% in early conceptual design phases – on information gathering activ-ities [6,28]. An efficient KMS, that allows advanced searching in a company’s existing knowledge base, could seriously reducethese percentages.
The unavailability of knowledge takes on dramatic proportions when product designers have to start from scratch, igno-rant of research or development work that has been performed earlier by co-workers in the same company. Very often,
. All rights reserved.
x: +32 16 32 29 86..be (J. Vertommen), [email protected] (F. Janssens), [email protected] (B. De.
3334 J. Vertommen et al. / Information Sciences 178 (2008) 3333–3346
especially in large enterprises, employees have no idea what other project groups or divisions are working on, let alone theexact details of the techniques or products they design. A survey by KPMG reports 63% of companies complaining about thisreinventing of the wheel, as opposed to 45% of those that have implemented some kind of KMS [13].
Enabling an easier exchange of information and knowledge between (groups of) people is an effective way of supportingthe management of corporate knowledge [12]. A fairly recent concept that is geared towards the exchange of tacit knowl-edge, is the Community of Practice [31]. These CoPs can surpass project or even company boundaries and have the exchangeof knowledge between experts and newcomers, focusing on a specific domain, as primary goal.
The main contribution of this paper is the development of a user profiling method that enables the inclusion of tacitknowledge in a knowledge management system, thereby making this knowledge searchable as well as supporting function-alities such as the CoPs mentioned above.
The developed user profiling method employs multiple vectors to represent multiple expertise domains, and is based on ahierarchical clustering approach. The profiles can be constructed automatically from documents that have been authored orread by the user. It is novel with regard to existing approaches due to:
� the use of multiple vectors in a knowledge management context;� the layered, hierarchical view it provides on user expertise;� the high degree of automation that is achieved;� the generic approach of the algorithm, ensuring applicability in realistic industrial settings.
These are key aspects to enable the desired knowledge management functionalities, and are not provided by currentlyavailable methods.
Secondly, an algorithm is developed to detect potential CoPs, their members and a description of their topic. This is thefirst algorithm employing quantitative techniques to provide such functionality.
Lastly, the approach that is taken to decide on the number of profile vectors or CoPs is generally applicable to any clus-tering task involving text documents, thereby solving a common problem in information retrieval tasks.
Section 2 further elaborates on how user profiles can contribute to knowledge management. Section 3 describes the con-struction of multiple-vector profiles and provides a comparison between the single and multiple-vector approaches. In Sec-tion 4, an algorithm is developed to initiate CoPs, and empirical evidence is given on the performance of this algorithm whenapplied to the multiple-vector user profiles.
2. Related work
2.1. User modeling and knowledge management
User modeling is a research domain that mainly focuses on human–computer interaction and the assessment of user pref-erences, user behavior and other user characteristics. The ability to quantify these user characteristics enhances applicationssuch as automated information retrieval [9]. Quite some literature can be found on the incorporation of user models in var-ious knowledge management applications (e.g. [1,18,20,21]), mostly concentrating on information filtering tasks. Similartechniques as adopted in these information retrieval applications can be used to create expertise profiles, thereby incorpo-rating tacit knowledge into a knowledge management system.
The goal of a CoP is to bring together experts and novices into a network, providing them with the opportunity to discussand learn from each other. Typically, each CoP is organized around a specific theme, and this theme is the subject of discus-sion. One of the major difficulties when organizing a CoP is efficiently identifying experts and novices that could potentiallybenefit from such a network. Especially in large companies, where the knowledge management problem is very pronounced,a multitude of employees are trying to solve similar problems.
The initiation of CoPs can be supported by user profiles. If these profiles correctly represent the knowledge and interests of theindividual employee, a mutual comparison of profiles allows exposing groups of employees with similar expertise or interests.
In a KMS that runs on a corporate intranet, the users, being the employees, are fairly fixed. Their profiles can be built andtuned over multiple sessions, and as such, their profiles can grow and evolve over time. Knowledge is often made explicit inthe form of documents, and these provide the knowledge base on which the KMS runs. Each time a new document is created(e.g. product specification, research report or funding proposal), it is entered into the system and added to the knowledgebase. At insertion of the document into the KMS, the creator is assumed to be known. The document resides in the systemand is accessible to users of the system with proper access rights. When a document is read, edited or printed by a KMS user,this can be logged. In this way, the system can monitor who reads and writes what. These documents can be used to create aprofile capturing user expertise and interests.
2.2. Document representation
The most common way to represent documents in an automated text mining system is the Vector Space Model [2]. In thismodel, each document is transformed to a vector with the entire vocabulary of the document corpus as dimensions. The
J. Vertommen et al. / Information Sciences 178 (2008) 3333–3346 3335
document vector contains a weight for each of these dimensions. A weight of 0 indicates that a word from the vocabulary isnot present. There exists a large number of weighting schemes to assign weights to all other dimensions, the most popularincluding TF-IDF ([25,26]), BM25 ([23,24]) and Log-entropy [8]. Generally speaking, these schemes find a balance betweenthe local and global frequency of a specific word. The underlying reasoning is that words that occur frequently in a limitednumber of documents have the most discriminative power, and thus are assigned a higher weight in the vertices represent-ing these documents.
Because of the large size of the vocabulary used in a typical data set, techniques are applied to reduce the dimensionalityof the vector space. These include stop word removal and stemming [19]. Stemming enhances the automatic interpretationof document content and provides better results in query-based systems. Dimensionality reduction through singular valuedecomposition [27] is often performed because of the computational complexity of algorithms that use the vector space asinput, as well as for the qualitative improvement of these algorithms [7,14,29].
2.3. Document based user profiles
The documents residing in the KMS reflect the expertise of their authors and can be used to build expertise profiles.Although the documents themselves by definition do not contain tacit knowledge, they do point to those who have ‘‘pro-cessed” the content.
The standard approach to user profiling with text documents is to create a single weighted keyword vector, e.g. by makinga normalized linear combination of the document vectors that are associated with the involved documents. This produces anew vector in the same vector space as the document vectors.
Although a straight forward procedure, the use of one vector to represent all expertise is limiting. Stems from multipleexpertise domains ‘‘compete” for importance in the vector, and it is possible that one domain suppresses the other or thathybrid, non-transparent profiles emerge.
A solution to this problem can be found in multiple-vector profiles, with one vector for each knowledge domain. This ap-proach has not been taken in the context of knowledge management before. However, there are few related methods to befound in literature that can be used to construct multiple-vector profiles. These are in the first place geared towards IR taskssuch as document filtering. [32] distinguishes between a long-term and a short-term profile. [3] and [33] respectively use asingle-pass, non-hierarchical algorithm and a growing cell structure (GCS) based algorithm to incrementally construct theindividual profile vectors. The number of vectors in both systems is determined by use of a threshold value during the clas-sification task, which defines whether or not a new vector needs to be constructed. [34] presents an approach that is basedon a predefined set of expertise topics.
3. An algorithm to construct multiple-vector user profiles
An important challenge in multiple-vector profiling is the automatic detection of expertise domains, as well as the clas-sification of document vectors into these domains. Such automation is especially important in knowledge management sys-tems, where it is undesirable that a user should spend time on profile construction, thereby reducing the time benefit that aKMS offers in the first place.
Prior to conducting the research described in this paper, a few prerequisites for an adequate expertise profiling algorithmwere put forward:
(a) Knowledge management should result in saving time, hence the profiling algorithm should avoid demanding toomuch effort from the profiled end-user or system administrators.
(b) The profiling algorithm should be applicable on typical company data, without requiring too much pre-processing.(c) A good user profile should represent user expertise at different levels, e.g. company-wide, in a division, or in a small
team.
Of course, these prerequisites have a significant impact on the techniques that can be applied in the profiling algorithm.Prerequisite (a) implies a high level of automation, resulting in a bias towards unsupervised methods. Prerequisite (b) ex-cludes methods that require a lot of training because companies do not have labeled training sets readily available. Lastly,prerequisite (c) demands a hierarchical, or at least layered, approach.
No existing approach meets all of the three prerequisites listed above, especially the possibility to provide a layered viewof user expertise (prerequisite (c)). For this reason a new algorithm was developed. It is based on hierarchical clustering, usesno explicit thresholds and is geared towards knowledge management functionalities. It is also fully automated. A detaileddescription of the profiling algorithm is given in the next sections.
3.1. Multiple-vector profile construction
A general overview of the profiling algorithm is offered in Fig. 1. The algorithm starts from a collection of documents relatedto a user. This collection is incrementally clustered into 1–20 clusters. At each of these levels, the classification of documents is
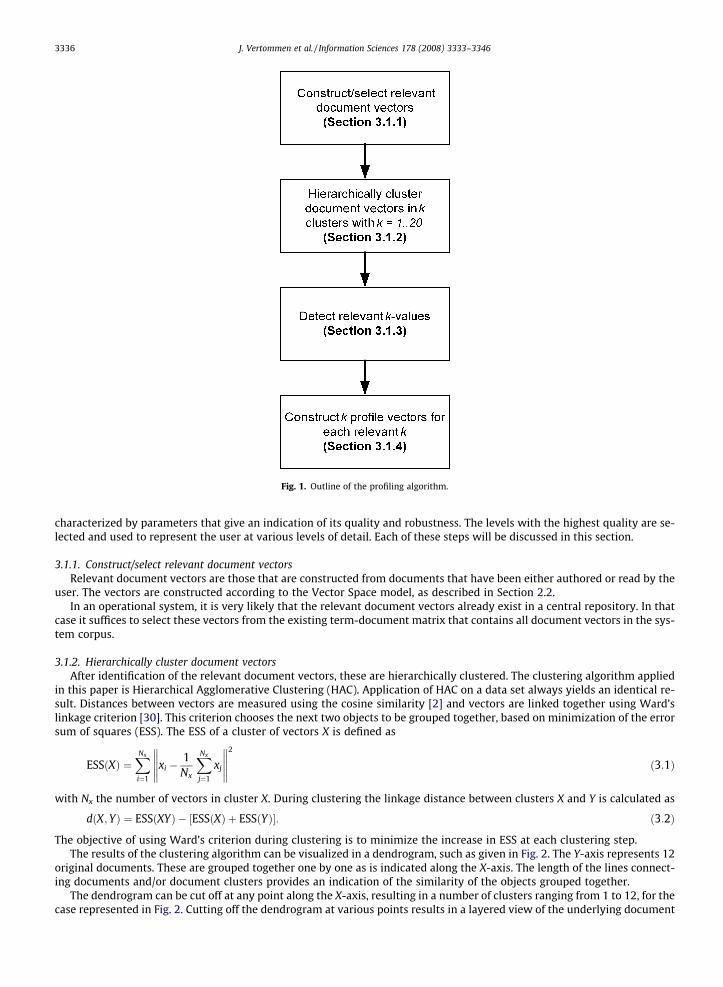
Fig. 1. Outline of the profiling algorithm.
3336 J. Vertommen et al. / Information Sciences 178 (2008) 3333–3346
characterized by parameters that give an indication of its quality and robustness. The levels with the highest quality are se-lected and used to represent the user at various levels of detail. Each of these steps will be discussed in this section.
3.1.1. Construct/select relevant document vectorsRelevant document vectors are those that are constructed from documents that have been either authored or read by the
user. The vectors are constructed according to the Vector Space model, as described in Section 2.2.In an operational system, it is very likely that the relevant document vectors already exist in a central repository. In that
case it suffices to select these vectors from the existing term-document matrix that contains all document vectors in the sys-tem corpus.
3.1.2. Hierarchically cluster document vectorsAfter identification of the relevant document vectors, these are hierarchically clustered. The clustering algorithm applied
in this paper is Hierarchical Agglomerative Clustering (HAC). Application of HAC on a data set always yields an identical re-sult. Distances between vectors are measured using the cosine similarity [2] and vectors are linked together using Ward’slinkage criterion [30]. This criterion chooses the next two objects to be grouped together, based on minimization of the errorsum of squares (ESS). The ESS of a cluster of vectors X is defined as
ESSðXÞ ¼XNx
i¼1
xi �1
Nx
XNx
j¼1
xj
����������
2
ð3:1Þ
with Nx the number of vectors in cluster X. During clustering the linkage distance between clusters X and Y is calculated as
dðX;YÞ ¼ ESSðXYÞ � ½ESSðXÞ þ ESSðYÞ�: ð3:2Þ
The objective of using Ward’s criterion during clustering is to minimize the increase in ESS at each clustering step.The results of the clustering algorithm can be visualized in a dendrogram, such as given in Fig. 2. The Y-axis represents 12
original documents. These are grouped together one by one as is indicated along the X-axis. The length of the lines connect-ing documents and/or document clusters provides an indication of the similarity of the objects grouped together.
The dendrogram can be cut off at any point along the X-axis, resulting in a number of clusters ranging from 1 to 12, for thecase represented in Fig. 2. Cutting off the dendrogram at various points results in a layered view of the underlying document
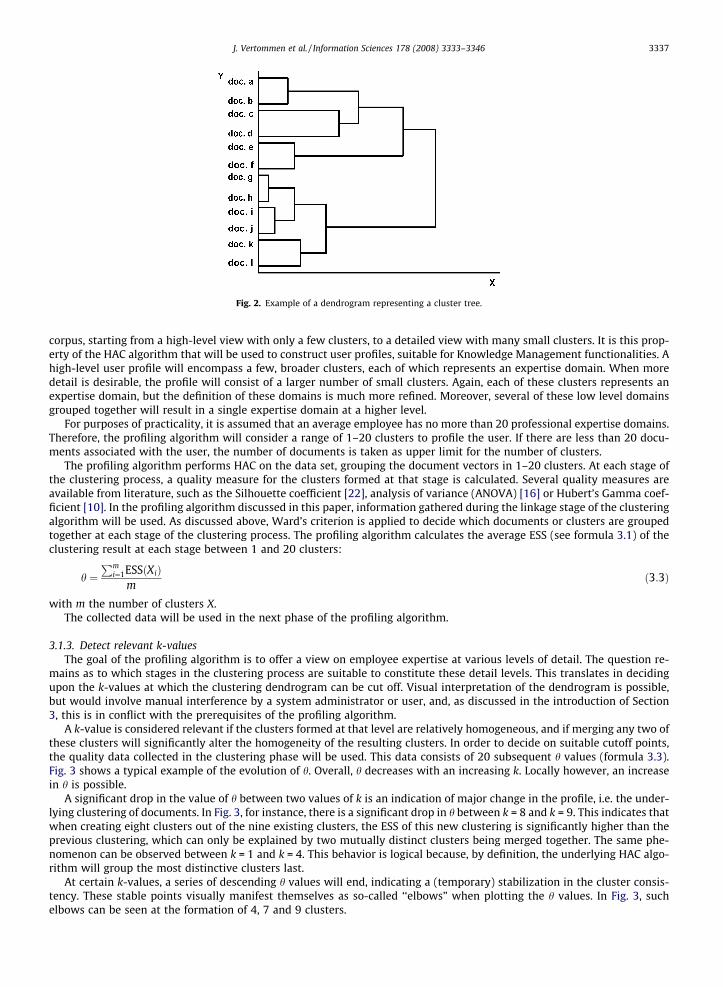
Fig. 2. Example of a dendrogram representing a cluster tree.
J. Vertommen et al. / Information Sciences 178 (2008) 3333–3346 3337
corpus, starting from a high-level view with only a few clusters, to a detailed view with many small clusters. It is this prop-erty of the HAC algorithm that will be used to construct user profiles, suitable for Knowledge Management functionalities. Ahigh-level user profile will encompass a few, broader clusters, each of which represents an expertise domain. When moredetail is desirable, the profile will consist of a larger number of small clusters. Again, each of these clusters represents anexpertise domain, but the definition of these domains is much more refined. Moreover, several of these low level domainsgrouped together will result in a single expertise domain at a higher level.
For purposes of practicality, it is assumed that an average employee has no more than 20 professional expertise domains.Therefore, the profiling algorithm will consider a range of 1–20 clusters to profile the user. If there are less than 20 docu-ments associated with the user, the number of documents is taken as upper limit for the number of clusters.
The profiling algorithm performs HAC on the data set, grouping the document vectors in 1–20 clusters. At each stage ofthe clustering process, a quality measure for the clusters formed at that stage is calculated. Several quality measures areavailable from literature, such as the Silhouette coefficient [22], analysis of variance (ANOVA) [16] or Hubert’s Gamma coef-ficient [10]. In the profiling algorithm discussed in this paper, information gathered during the linkage stage of the clusteringalgorithm will be used. As discussed above, Ward’s criterion is applied to decide which documents or clusters are groupedtogether at each stage of the clustering process. The profiling algorithm calculates the average ESS (see formula 3.1) of theclustering result at each stage between 1 and 20 clusters:
h ¼Pm
i¼1ESSðXiÞm
ð3:3Þ
with m the number of clusters X.The collected data will be used in the next phase of the profiling algorithm.
3.1.3. Detect relevant k-valuesThe goal of the profiling algorithm is to offer a view on employee expertise at various levels of detail. The question re-
mains as to which stages in the clustering process are suitable to constitute these detail levels. This translates in decidingupon the k-values at which the clustering dendrogram can be cut off. Visual interpretation of the dendrogram is possible,but would involve manual interference by a system administrator or user, and, as discussed in the introduction of Section3, this is in conflict with the prerequisites of the profiling algorithm.
A k-value is considered relevant if the clusters formed at that level are relatively homogeneous, and if merging any two ofthese clusters will significantly alter the homogeneity of the resulting clusters. In order to decide on suitable cutoff points,the quality data collected in the clustering phase will be used. This data consists of 20 subsequent h values (formula 3.3).Fig. 3 shows a typical example of the evolution of h. Overall, h decreases with an increasing k. Locally however, an increasein h is possible.
A significant drop in the value of h between two values of k is an indication of major change in the profile, i.e. the under-lying clustering of documents. In Fig. 3, for instance, there is a significant drop in h between k = 8 and k = 9. This indicates thatwhen creating eight clusters out of the nine existing clusters, the ESS of this new clustering is significantly higher than theprevious clustering, which can only be explained by two mutually distinct clusters being merged together. The same phe-nomenon can be observed between k = 1 and k = 4. This behavior is logical because, by definition, the underlying HAC algo-rithm will group the most distinctive clusters last.
At certain k-values, a series of descending h values will end, indicating a (temporary) stabilization in the cluster consis-tency. These stable points visually manifest themselves as so-called ‘‘elbows” when plotting the h values. In Fig. 3, suchelbows can be seen at the formation of 4, 7 and 9 clusters.
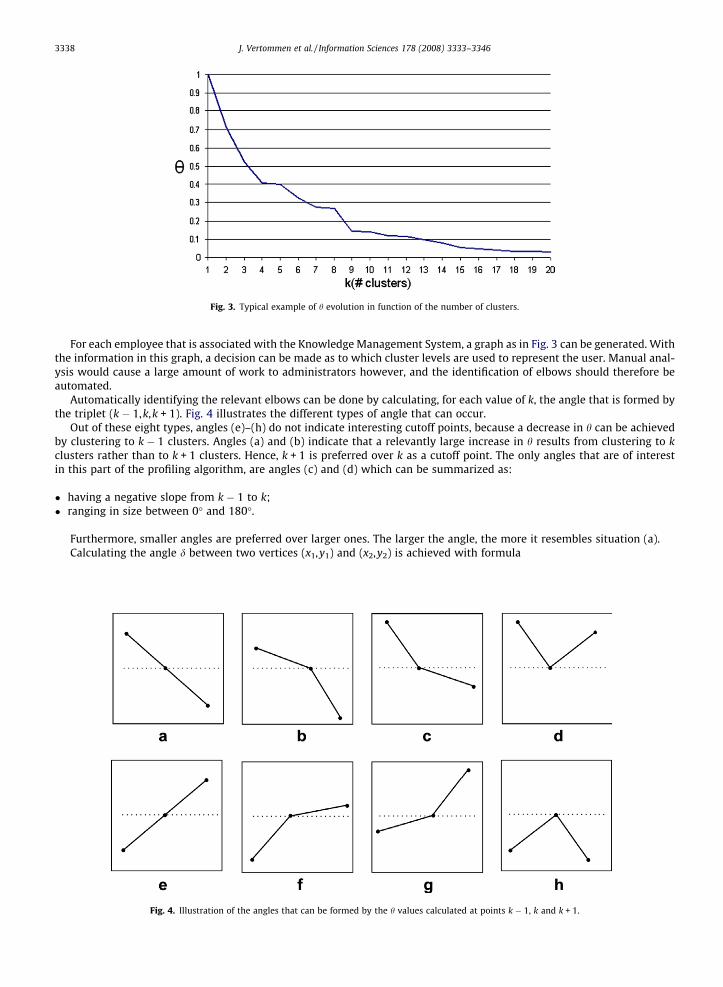
Fig. 3. Typical example of h evolution in function of the number of clusters.
3338 J. Vertommen et al. / Information Sciences 178 (2008) 3333–3346
For each employee that is associated with the Knowledge Management System, a graph as in Fig. 3 can be generated. Withthe information in this graph, a decision can be made as to which cluster levels are used to represent the user. Manual anal-ysis would cause a large amount of work to administrators however, and the identification of elbows should therefore beautomated.
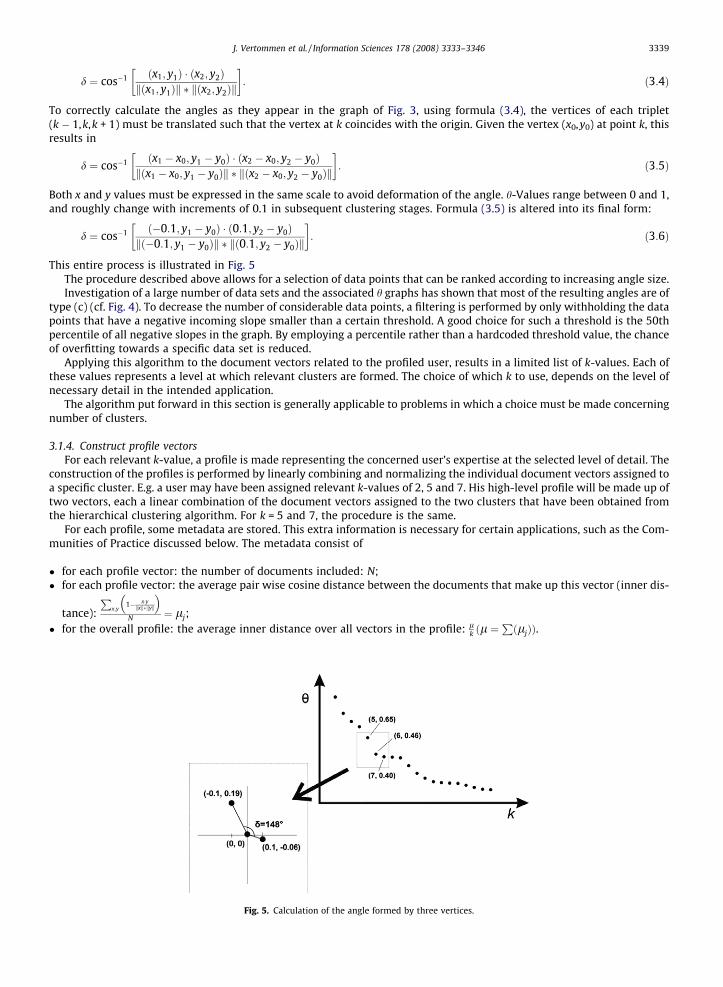
Automatically identifying the relevant elbows can be done by calculating, for each value of k, the angle that is formed bythe triplet (k � 1,k,k + 1). Fig. 4 illustrates the different types of angle that can occur.
Out of these eight types, angles (e)–(h) do not indicate interesting cutoff points, because a decrease in h can be achievedby clustering to k � 1 clusters. Angles (a) and (b) indicate that a relevantly large increase in h results from clustering to kclusters rather than to k + 1 clusters. Hence, k + 1 is preferred over k as a cutoff point. The only angles that are of interestin this part of the profiling algorithm, are angles (c) and (d) which can be summarized as:
� having a negative slope from k � 1 to k;� ranging in size between 0� and 180�.
Furthermore, smaller angles are preferred over larger ones. The larger the angle, the more it resembles situation (a).Calculating the angle d between two vertices (x1,y1) and (x2,y2) is achieved with formula
Fig. 4. Illustration of the angles that can be formed by the h values calculated at points k � 1, k and k + 1.
J. Vertommen et al. / Information Sciences 178 (2008) 3333–3346 3339
d ¼ cos�1 ðx1; y1Þ � ðx2; y2Þkðx1; y1Þk � kðx2; y2Þk
� �: ð3:4Þ
To correctly calculate the angles as they appear in the graph of Fig. 3, using formula (3.4), the vertices of each triplet(k � 1,k,k + 1) must be translated such that the vertex at k coincides with the origin. Given the vertex (x0,y0) at point k, thisresults in
d ¼ cos�1 ðx1 � x0; y1 � y0Þ � ðx2 � x0; y2 � y0Þkðx1 � x0; y1 � y0Þk � kðx2 � x0; y2 � y0Þk
� �: ð3:5Þ
Both x and y values must be expressed in the same scale to avoid deformation of the angle. h-Values range between 0 and 1,and roughly change with increments of 0.1 in subsequent clustering stages. Formula (3.5) is altered into its final form:
d ¼ cos�1 ð�0:1; y1 � y0Þ � ð0:1; y2 � y0Þkð�0:1; y1 � y0Þk � kð0:1; y2 � y0Þk
� �: ð3:6Þ
This entire process is illustrated in Fig. 5The procedure described above allows for a selection of data points that can be ranked according to increasing angle size.Investigation of a large number of data sets and the associated h graphs has shown that most of the resulting angles are of
type (c) (cf. Fig. 4). To decrease the number of considerable data points, a filtering is performed by only withholding the datapoints that have a negative incoming slope smaller than a certain threshold. A good choice for such a threshold is the 50thpercentile of all negative slopes in the graph. By employing a percentile rather than a hardcoded threshold value, the chanceof overfitting towards a specific data set is reduced.
Applying this algorithm to the document vectors related to the profiled user, results in a limited list of k-values. Each ofthese values represents a level at which relevant clusters are formed. The choice of which k to use, depends on the level ofnecessary detail in the intended application.
The algorithm put forward in this section is generally applicable to problems in which a choice must be made concerningnumber of clusters.
3.1.4. Construct profile vectorsFor each relevant k-value, a profile is made representing the concerned user’s expertise at the selected level of detail. The
construction of the profiles is performed by linearly combining and normalizing the individual document vectors assigned toa specific cluster. E.g. a user may have been assigned relevant k-values of 2, 5 and 7. His high-level profile will be made up oftwo vectors, each a linear combination of the document vectors assigned to the two clusters that have been obtained fromthe hierarchical clustering algorithm. For k = 5 and 7, the procedure is the same.
For each profile, some metadata are stored. This extra information is necessary for certain applications, such as the Com-munities of Practice discussed below. The metadata consist of
� for each profile vector: the number of documents included: N;� for each profile vector: the average pair wise cosine distance between the documents that make up this vector (inner dis-
tance):
Px;y
1� x�ykxk�kyk
� �N ¼ lj;
� for the overall profile: the average inner distance over all vectors in the profile: lk ðl ¼
PðljÞÞ.
Fig. 5. Calculation of the angle formed by three vertices.
3340 J. Vertommen et al. / Information Sciences 178 (2008) 3333–3346
These are used to have some idea of the density of each profile, which is useful when comparing profiles of differentindividuals.
3.2. Comparison of single and multiple-vector profiles
The use of multiple vectors to profile user expertise is an intuitively better strategy than the application of single vectors.A theoretical proof is delivered by considering an individual with several expertise domains, one of which is represented
by a number of documents that is significantly lower than the number of those attributed to the other domains. In the singlevector approach, all documents are combined into one vector with weights that equal the average of the weights associatedwith each term in the individual documents. Terms that describe the smaller expertise domain occur in fewer documentsand therefore have a smaller weight in the computed vector, because a larger number of documents will have a weightof 0 for these terms. In contrast, the multiple-vector approach separates documents from different domains and combinesthem in a separate vector. This allows specialized terms from the smaller expertise domain to surface.
Finally, a proof by example of the usefulness of multiple-vector user profiles versus their single-vector counterpart is gi-ven below.
The employed data set consists of 19 academic researchers linked to papers that were authored by them. Some of thesewere written jointly, others were not. Most of the researchers are junior researchers, but three of them are senior researchersactive in several domains. The data set spans a total of five research domains.
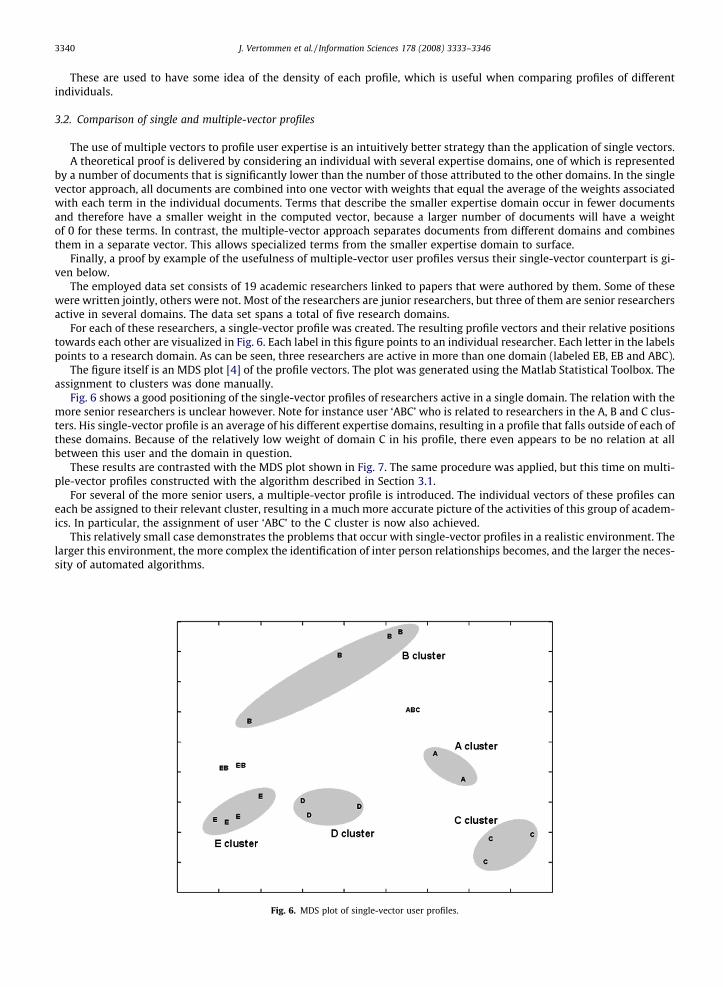
For each of these researchers, a single-vector profile was created. The resulting profile vectors and their relative positionstowards each other are visualized in Fig. 6. Each label in this figure points to an individual researcher. Each letter in the labelspoints to a research domain. As can be seen, three researchers are active in more than one domain (labeled EB, EB and ABC).
The figure itself is an MDS plot [4] of the profile vectors. The plot was generated using the Matlab Statistical Toolbox. Theassignment to clusters was done manually.
Fig. 6 shows a good positioning of the single-vector profiles of researchers active in a single domain. The relation with themore senior researchers is unclear however. Note for instance user ‘ABC’ who is related to researchers in the A, B and C clus-ters. His single-vector profile is an average of his different expertise domains, resulting in a profile that falls outside of each ofthese domains. Because of the relatively low weight of domain C in his profile, there even appears to be no relation at allbetween this user and the domain in question.
These results are contrasted with the MDS plot shown in Fig. 7. The same procedure was applied, but this time on multi-ple-vector profiles constructed with the algorithm described in Section 3.1.
For several of the more senior users, a multiple-vector profile is introduced. The individual vectors of these profiles caneach be assigned to their relevant cluster, resulting in a much more accurate picture of the activities of this group of academ-ics. In particular, the assignment of user ‘ABC’ to the C cluster is now also achieved.
This relatively small case demonstrates the problems that occur with single-vector profiles in a realistic environment. Thelarger this environment, the more complex the identification of inter person relationships becomes, and the larger the neces-sity of automated algorithms.
Fig. 6. MDS plot of single-vector user profiles.
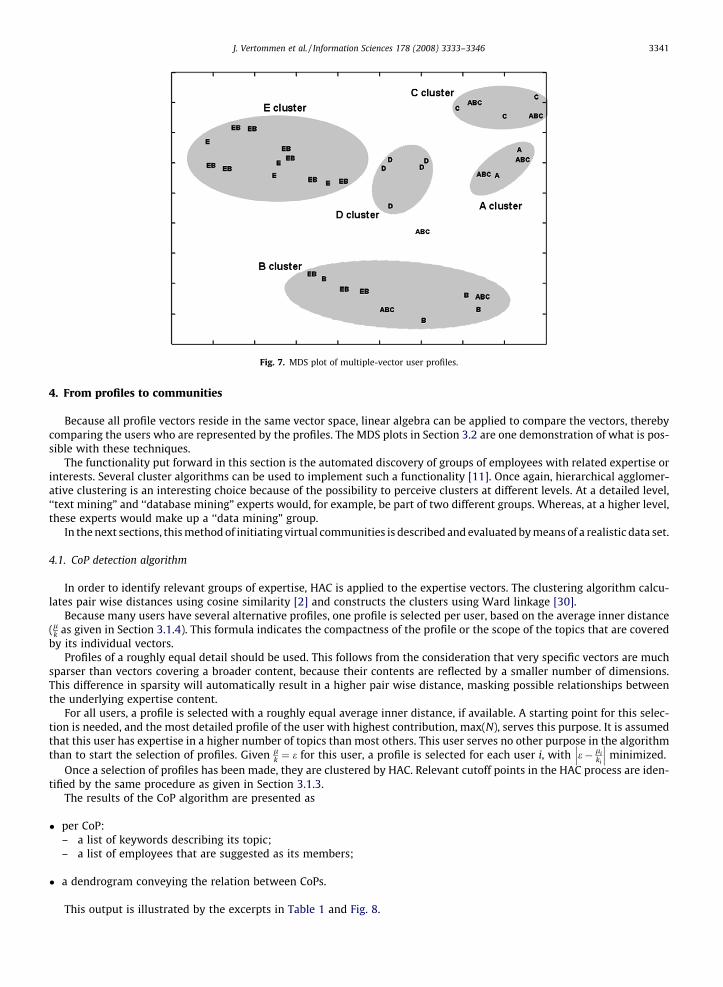
Fig. 7. MDS plot of multiple-vector user profiles.
J. Vertommen et al. / Information Sciences 178 (2008) 3333–3346 3341
4. From profiles to communities
Because all profile vectors reside in the same vector space, linear algebra can be applied to compare the vectors, therebycomparing the users who are represented by the profiles. The MDS plots in Section 3.2 are one demonstration of what is pos-sible with these techniques.
The functionality put forward in this section is the automated discovery of groups of employees with related expertise orinterests. Several cluster algorithms can be used to implement such a functionality [11]. Once again, hierarchical agglomer-ative clustering is an interesting choice because of the possibility to perceive clusters at different levels. At a detailed level,‘‘text mining” and ‘‘database mining” experts would, for example, be part of two different groups. Whereas, at a higher level,these experts would make up a ‘‘data mining” group.
In the next sections, this method of initiating virtual communities is described and evaluated by means of a realistic data set.
4.1. CoP detection algorithm
In order to identify relevant groups of expertise, HAC is applied to the expertise vectors. The clustering algorithm calcu-lates pair wise distances using cosine similarity [2] and constructs the clusters using Ward linkage [30].
Because many users have several alternative profiles, one profile is selected per user, based on the average inner distance(lk as given in Section 3.1.4). This formula indicates the compactness of the profile or the scope of the topics that are coveredby its individual vectors.
Profiles of a roughly equal detail should be used. This follows from the consideration that very specific vectors are muchsparser than vectors covering a broader content, because their contents are reflected by a smaller number of dimensions.This difference in sparsity will automatically result in a higher pair wise distance, masking possible relationships betweenthe underlying expertise content.
For all users, a profile is selected with a roughly equal average inner distance, if available. A starting point for this selec-tion is needed, and the most detailed profile of the user with highest contribution, max(N), serves this purpose. It is assumedthat this user has expertise in a higher number of topics than most others. This user serves no other purpose in the algorithmthan to start the selection of profiles. Given l
k ¼ e for this user, a profile is selected for each user i, with e� liki
��� ��� minimized.Once a selection of profiles has been made, they are clustered by HAC. Relevant cutoff points in the HAC process are iden-
tified by the same procedure as given in Section 3.1.3.The results of the CoP algorithm are presented as
� per CoP:– a list of keywords describing its topic;– a list of employees that are suggested as its members;
� a dendrogram conveying the relation between CoPs.
This output is illustrated by the excerpts in Table 1 and Fig. 8.
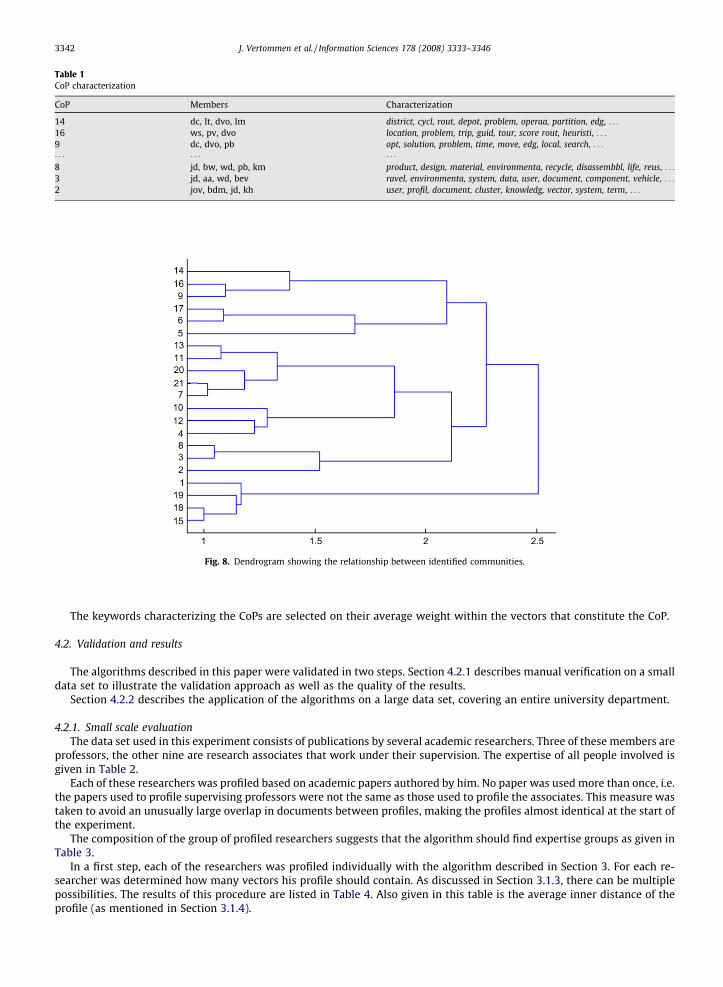
Table 1CoP characterization
CoP Members Characterization
14 dc, lt, dvo, lm district, cycl, rout, depot, problem, operaa, partition, edg, . . .
16 ws, pv, dvo location, problem, trip, guid, tour, score rout, heuristi, . . .
9 dc, dvo, pb opt, solution, problem, time, move, edg, local, search, . . .
� � � � � � � � �8 jd, bw, wd, pb, km product, design, material, environmenta, recycle, disassembbl, life, reus, . . .
3 jd, aa, wd, bev ravel, environmenta, system, data, user, document, component, vehicle, . . .
2 jov, bdm, jd, kh user, profil, document, cluster, knowledg, vector, system, term, . . .
Fig. 8. Dendrogram showing the relationship between identified communities.
3342 J. Vertommen et al. / Information Sciences 178 (2008) 3333–3346
The keywords characterizing the CoPs are selected on their average weight within the vectors that constitute the CoP.
4.2. Validation and results
The algorithms described in this paper were validated in two steps. Section 4.2.1 describes manual verification on a smalldata set to illustrate the validation approach as well as the quality of the results.
Section 4.2.2 describes the application of the algorithms on a large data set, covering an entire university department.
4.2.1. Small scale evaluationThe data set used in this experiment consists of publications by several academic researchers. Three of these members are
professors, the other nine are research associates that work under their supervision. The expertise of all people involved isgiven in Table 2.
Each of these researchers was profiled based on academic papers authored by him. No paper was used more than once, i.e.the papers used to profile supervising professors were not the same as those used to profile the associates. This measure wastaken to avoid an unusually large overlap in documents between profiles, making the profiles almost identical at the start ofthe experiment.
The composition of the group of profiled researchers suggests that the algorithm should find expertise groups as given inTable 3.
In a first step, each of the researchers was profiled individually with the algorithm described in Section 3. For each re-searcher was determined how many vectors his profile should contain. As discussed in Section 3.1.3, there can be multiplepossibilities. The results of this procedure are listed in Table 4. Also given in this table is the average inner distance of theprofile (as mentioned in Section 3.1.4).
Table 2Expertise overview of the researchers involved in the validation experiment
User Research topic(s) # documents
A Selective laser sintering (SLS) 7B Electrical discharge machining (EDM) 6C Coordinate measuring machines (CMM) 6D Supervisor of A, B and C 15E Lifecycle engineering 5F Sheet metal bending 4G Laser cutting 1H Supervisor of E, F and G 13I Operations research 5J Operations research 6K Operations research 3L Supervisor of I, J and K 10
Also given is the number of documents that contribute to their profiles.
Table 3Topics and members of the expected communities
Topic Users Topic Users
SLS A, D Sheet metal bending F, HEDM B, D Laser cutting G, HCMM C, D Operations research I, J, K, LLifecycle engineering E, H
Table 4Profile specifications per individual user
User # vectors Average inner distance
A 1 0.189B 1 0.467C 2 0.083D 3 0.114
5 0.049E 1 0.493F 1 0.564G 1 0H 2 0.170
4 0.074I 2 0.392J 2 0.086K 1 0.286L 3 0.088
J. Vertommen et al. / Information Sciences 178 (2008) 3333–3346 3343
Manual verification of the suggested profiles for users D, H and L confirms that the choice of profiles makes sense. User D,for instance, has a detailed profile with one vector for each of the following subjects:
� Diëlectrics for EDM.� Wire coatings for wire EDM.� CMM.� Error analysis.� SLS.
His high-level profile consists of three vectors, one combining the two vectors on EDM related research listed above, andthe other combining the topics on CMM and error analysis. As can be expected however, the profiles are not always optimal.It would have made more sense, for instance, if user H had a 3-vector profile instead of a 2-vector profile. The four-vectorprofile that is assigned to this user has a logical structure however.
Based on the average inner distance of the largest contributor’s profile, the profiles for the other users are selected. Oncean appropriate set of user profiles is selected, these are clustered following the algorithm described in Section 4.1. For thisdata set, these were identified as 2, 4, 7 and 9.
3344 J. Vertommen et al. / Information Sciences 178 (2008) 3333–3346
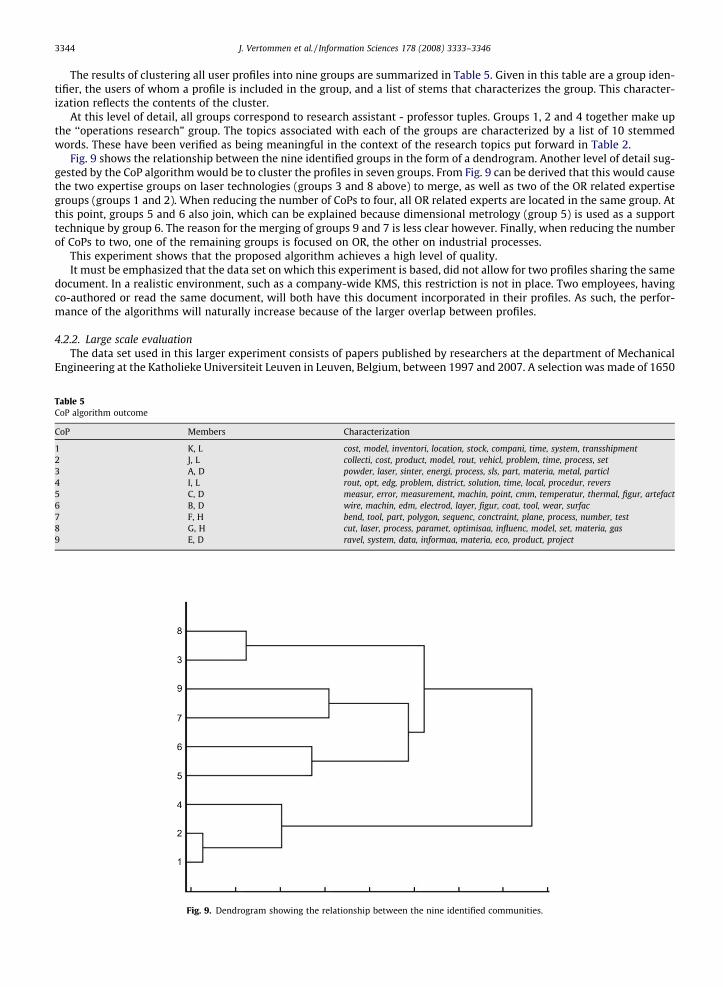
The results of clustering all user profiles into nine groups are summarized in Table 5. Given in this table are a group iden-tifier, the users of whom a profile is included in the group, and a list of stems that characterizes the group. This character-ization reflects the contents of the cluster.
At this level of detail, all groups correspond to research assistant - professor tuples. Groups 1, 2 and 4 together make upthe ‘‘operations research” group. The topics associated with each of the groups are characterized by a list of 10 stemmedwords. These have been verified as being meaningful in the context of the research topics put forward in Table 2.
Fig. 9 shows the relationship between the nine identified groups in the form of a dendrogram. Another level of detail sug-gested by the CoP algorithm would be to cluster the profiles in seven groups. From Fig. 9 can be derived that this would causethe two expertise groups on laser technologies (groups 3 and 8 above) to merge, as well as two of the OR related expertisegroups (groups 1 and 2). When reducing the number of CoPs to four, all OR related experts are located in the same group. Atthis point, groups 5 and 6 also join, which can be explained because dimensional metrology (group 5) is used as a supporttechnique by group 6. The reason for the merging of groups 9 and 7 is less clear however. Finally, when reducing the numberof CoPs to two, one of the remaining groups is focused on OR, the other on industrial processes.
This experiment shows that the proposed algorithm achieves a high level of quality.It must be emphasized that the data set on which this experiment is based, did not allow for two profiles sharing the same
document. In a realistic environment, such as a company-wide KMS, this restriction is not in place. Two employees, havingco-authored or read the same document, will both have this document incorporated in their profiles. As such, the perfor-mance of the algorithms will naturally increase because of the larger overlap between profiles.
4.2.2. Large scale evaluationThe data set used in this larger experiment consists of papers published by researchers at the department of Mechanical
Engineering at the Katholieke Universiteit Leuven in Leuven, Belgium, between 1997 and 2007. A selection was made of 1650
Table 5CoP algorithm outcome
CoP Members Characterization
1 K, L cost, model, inventori, location, stock, compani, time, system, transshipment2 J, L collecti, cost, product, model, rout, vehicl, problem, time, process, set3 A, D powder, laser, sinter, energi, process, sls, part, materia, metal, particl4 I, L rout, opt, edg, problem, district, solution, time, local, procedur, revers5 C, D measur, error, measurement, machin, point, cmm, temperatur, thermal, figur, artefact6 B, D wire, machin, edm, electrod, layer, figur, coat, tool, wear, surfac7 F, H bend, tool, part, polygon, sequenc, conctraint, plane, process, number, test8 G, H cut, laser, process, paramet, optimisaa, influenc, model, set, materia, gas9 E, D ravel, system, data, informaa, materia, eco, product, project
Fig. 9. Dendrogram showing the relationship between the nine identified communities.
J. Vertommen et al. / Information Sciences 178 (2008) 3333–3346 3345
papers, in English, on which 822 researchers contributed. Many of these were one time contributors, a total of 484 research-ers having co-authored more than one paper.
All authors in the data set were profiled using the profiling algorithm described in Section 3. Of these profiled authors, 609were assigned a profile with only one vector by the algorithm. The 213 others, having achieved a higher seniority duringtheir career, were assigned alternative profiles at an extra 1–3 detail levels.
The CoP detection algorithm and, indirectly, the quality of the user profiles, was validated on several subsets of this dataset. These subsets varied in size, as well as in the number of expertise topics covered by the included researchers.
Senior staff members were shown the results of the algorithm and were asked in an interview to validate
� the suggested CoPs,� the appointment of profile vectors to the CoPs,� the relation between the CoPs.
Overall, the results of the algorithms were well received. Most CoP topics corresponded to main research lines. By usingmultiple-vector profiles, users were assigned to different CoPs when appropriate, a result which would not be achieved ifsingle-vector profiles were employed. The members of the constructed CoPs were mostly active in the same research groupsor projects, but relationships across these borders were also detected and verified.
However, some drawbacks of the CoP algorithm could be observed as well:
� in isolated cases, incorrect relationships between users were suggested. On closer inspection, these CoPs were representedby vectors with a high weight given to rather general terms. This indicates that the chosen weighting scheme to representthe profile vectors was not always optimal;
� a ranking system should be developed to indicate key members in CoPs. During testing it was not always clear how mucha specific person contributed to a CoP; is he a focused specialist, rather than a generalist?
� visualization of the CoPs should be improved to make validation easier.
These issues will be the topic of further research.
5. Conclusions
Effective knowledge management provides a company with the means to reduce product development times and theassociated costs. Knowledge management systems are IT solutions that implement a variation of KM functionalities. Mostpresently available KMS’s are focused on the handling of explicit knowledge, but rarely include tacit knowledge.
This paper reports on a new method to construct user profiles that reflect tacit knowledge and are suitable for integrationin knowledge management functionalities. The profiles are based on documents read and written by the profiled employees,and consist of multiple vectors, one per expertise domain. They are constructed using text mining and categorization tech-niques and provide a layered view on the expertise of the profiled employee. The profiling procedure is fully automated andunsupervised, which makes the algorithm suitable to run in large companies.
The multiple-vector approach is contrasted with the standard single-vector approach and its usefulness is discussed boththeoretically and by example.
Furthermore, a method to quantitatively support the initiation of communities of practice is developed in this paper. CoPsare groups of people with a shared interest, both experts and newcomers. They engage in discussion on the topic of the CoP,thus enabling knowledge sharing. To discover potential CoPs, a clustering algorithm is applied to the user profiles to discoversimilarities between the underlying employees.
The proposed methods are validated on realistic data, which confirms the applicability of the techniques that are applied.Correct, meaningful relationships between employees are discovered and labeled, thus creating a basis on which to formCoPs.
By using multiple-vector profiles, employees can be assigned to several CoPs, according to their expertise. This would notbe possible with single-vector profiles.
A further contribution of the described research is that the approach that is taken to decide on the number of profile vec-tors or CoPs, is generally applicable to any clustering task involving text documents.
Acknowledgement
This research was supported by the Instituut voor de Aanmoediging van Innovatie door Wetenschap en Technologie inVlaanderen (IWT); O&O/McKnow-E.
References
[1] M. Alvarado, M. Romero-Salcedo, L. Sheremetov, A corporative memory based on the user profiles, Expert Systems with Applications 26 (2004) 87–94.[2] R. Baeza-Yates, R. Ribeiro-Neto, Modern Information Retrieval, Addison-Wesley, 1999, ISBN 020139829X.
3346 J. Vertommen et al. / Information Sciences 178 (2008) 3333–3346
[3] U. Çetintemel, M.J. Franklin, C.L. Giles, Self-adaptive user profiles for large-scale data delivery, in: Proceedings of the 16th International Conference onData Engineering, San Diego, 2000, pp. 622–642.
[4] C. Chen, W. Härdle, A. Unwin (Eds.), Handbook of Data Visualization, Springer, 2008, ISBN 9783540330363.[5] R.S. Chen, C.H. Hsiang, A study on the critical success factors for corporations embarking on knowledge community-based E-learning, Information
Sciences 177 (2007) 570–586.[6] A. Court, S. Culley, C.A. McMahon, The information requirements of engineering designers, in: Proceedings of ICED 1993, The Hague, 1993, pp. 1708–
1716.[7] S. Deerwester, S.T. Dumais, T.K. Landauer, G.W. Furnas, R.A. Harshman, Indexing by latent semantic analysis, Journal of the Society for Information
Science 41 (1990) 391–407.[8] S.T. Dumais, Improving the retrieval of information from external sources, Behavior Research Methods, Instruments and Computers 23 (1991) 229–
236.[9] P.W. Foltz, S.T. Dumais, Personalized information delivery: an analysis of information filtering methods, Communications of the ACM 35 (1992) 51–60.
[10] M. Halkidi, Y. Batistakis, M. Vazirgiannis, Cluster validity methods: part I, ACM SIGMOD Record 31 (2002) 40–45.[11] A.K. Jain, M.N. Murty, P.J. Flynn, Data clustering: a review, ACM Computing Surveys 31 (1999) 264–323.[12] W.R. King, P.V. Marks Jr., Motivating knowledge sharing through a knowledge management system, Omega 36 (2008) 131–146.[13] KPMG 2000, Knowledge Management Research Report, 2000.[14] T. Korenius, J. Laurikkala, M. Juhola, On principal component analysis, cosine and euclidean measures in information retrieval, Information Sciences
177 (2007) 4893–4905.[15] L.F. Lai, A knowledge engineering approach to knowledge management, Information Sciences 177 (2007) 4072–4094.[16] H.R. Lindman, Analysis of Variance in Complex Experimental Designs, W.H. Freeman & Co., 1974, ISBN 0716707748.[17] Nonaka, H. Takeuchi, The Knowledge Creating Company, Oxford Press, 1995, ISBN 0195092694.[18] S. Pierre, C. Kacan, W. Probst, An agent-based approach for integrating user profile into a knowledge management process, Knowledge-Based Systems
13 (2000) 307–314.[19] M.F. Porter, An algorithm for suffix stripping, Program 14 (1980) 130–137.[20] L. Razmerita, A. Angehm, A. Maedche, Ontology-based user modeling for knowledge management systems, in: Proceedings of the 9th International
Conference on User Modeling, Johnstown, USA, 2003, pp. 213–217.[21] C. Roda, A. Angehm, T. Nabeth, L. Razmerita, Using conversational agents to support the adoptation of knowledge sharing practices, Interacting with
Computers 15 (2003) 57–89.[22] P.J. Rousseeuw, Silhouettes: a graphical aid to the interpretation and validation of cluster analysis, Journal of Computational Applications in
Mathematics 20 (1987) 53–65.[23] S.E. Robertson, S. Walker, M.M. Hancock-Beaulieu, Large test collection experiments on an operational, interactive system: okapi at TREC, Information
Processing and Management 31 (1995) 345–360.[24] S.E. Robertson, S. Walker, M.M. Hancock-Beaulieu, Experimentation as a way of life: okapi at TREC, Information Processing and Management 36 (2000)
95–108.[25] G. Salton, C. Buckley, Term-weighting approaches in automatic retrieval, Information Processing and Management 24 (1988) 513–523.[26] K. Spärck Jones, A statistical interpretation of term specificity and its application in retrieval, Journal of Documentation 28 (1972) 11–21.[27] L.N. Trefethen, D. Bau, Numerical Linear Algebra, Society for Industrial and Applied Mathematics (SIAM), 1997, ISBN 0898714877.[28] D. Ullman, T. Dietterich, L. Stauffer, A model of the mechanical design process based on empirical data, Artificial Intelligence in Engineering Design and
Manufacturing 2 (1988) 33–52.[29] J.C. Valle-Lisboa, E. Mizraji, The uncovering of hidden structures by latent semantic analysis, Information Sciences 177 (2007) 4122–4147.[30] J.H. Ward, Hierarchical grouping to optimize an objective function, American Statistical Association Journal 58 (1963) 236–244.[31] E. Wenger, Communities of Practice: Learning, Meaning and Identity, Cambridge University Press, 1999, ISBN 0521663636.[32] D. H Widyantoro, T.R. Ioerger, J. Yen, Learning user interest dynamics with a three-descriptor representation source, Journal of the American Society for
Information Science and Technology 52 (2001) 212–225.[33] L. Wu, L. Liu, J. Li, Z. Li, Modeling user multiple interests by an improved GCS approach, Expert Systems with Applications 29 (2005) 757–767.[34] K.W. Yang, S. Y Huh, Automatic expert identification using a text categorization technique in knowledge management systems, Expert Systems with
Applications 34 (2008) 1445–1455.