Embed Size (px)
Citation preview
Marine Pollution Bulletin 58 (2009) 64–71
Contents lists available at ScienceDirect
Marine Pollution Bulletin
journal homepage: www.elsevier .com/locate /marpolbul
Multivariate discriminant analysis distinguishes metal- from non metal-relatedbiomarker responses in the clam Chamaelea gallina
Manuel J. Rodríguez-Ortega a,*, Antonio Rodríguez-Ariza b, José Luis Gómez-Ariza c,Andrés Muñoz-Serrano d, Juan López-Barea a
a Departamento de Bioquímica y Biología Molecular, Universidad de Córdoba, Edificio ‘‘Severo Ochoa”, 1ª planta, Campus de Rabanales, Universidad de Córdoba, 14071 Córdoba, Spainb Unidad de Investigación, Hospital Reina Sofía, Córdoba, Spainc Departamento de Química y Ciencias de los Materiales, Universidad de Huelva, Huelva, Spaind Departamento de Genética, Universidad de Córdoba, Spain
a r t i c l e i n f o
Keywords:Bivalve molluscsMetalsBiomarkersOxidative stressSeasonalityMultivariate discriminant analysis
0025-326X/$ - see front matter � 2008 Elsevier Ltd.doi:10.1016/j.marpolbul.2008.09.006
* Corresponding author. Tel.: +34 957 218317; fax:E-mail address: [email protected] (M.J. Rodríguez
a b s t r a c t
Molecular biomarkers are among the most sensitive and earliest responses to pollutants. However, lack ofdetailed knowledge on variability of responses and their possible seasonal variation limit their use. Inaddition, the seasonality of biological processes modulates the response of organisms to pollutant stress-ors. Using multivariate statistics, we have studied the influence of environmental and biological factorson the response of a battery of molecular biomarkers in the clam Chamaelea gallina collected along theSouth-Spanish littoral. Multivariate discriminant analysis clearly distinguished biomarker responsebetween clean and polluted areas, using heavy metals as indicator of pollution. Such differences disap-peared when the dataset was normalised for metal content, thus indicating that pollution was the mainsignificant cause of the changes observed between clean and polluted sites. In conclusion, this workshows that, when applying a complete biomarker panel, multivariate statistical tools can be used to dis-cern pollutant- from non pollutant-related responses.
� 2008 Elsevier Ltd. All rights reserved.
1. Introduction
Anthropogenic activities have increased contaminant levels inthe marine environment. Nevertheless, risk assessment cannot besolely based on chemical analysis of environmental samples sinceit does not inform us about deleterious effects of contaminants tobiota (Livingstone, 1993; Sarkar et al., 2006). Bivalve molluscs arewidely used as marine pollution sentinels due to their sessile nat-ure, filter-feeding habits, and pollutant bioconcentration (López-Barea and Pueyo, 1998; Vlahogianni et al., 2007). In most aquaticsystems, it is difficult to establish causal or correlative relation-ships between environmental contaminants and organism health,primarily because of the multitude of environmental or ecologicalfactors that influence or modulate the response of organisms toparticular stressors (Valavanidis et al., 2006). Molecular biomark-ers are among the most sensitive and earliest responses to pollu-tants, but the lack of detailed knowledge about variability ofresponses and their possible seasonal variations limit their use(Ringwood et al., 1999).
An important aspect of the physiology of aquatic organisms,especially in bivalve molluscs, is seasonality (Sheehan and Power,
All rights reserved.
+34 957 218592.-Ortega).
1999; Niyogi et al., 2001b). Thus, cyclic variations of environmentalfactors, such as light, temperature, dissolved O2, nutrient availabil-ity, pollutant input, and seasonality of biological processes, canalter the responses of bioindicators (Vasseur and Cossu-Leguille,2003). We have previously shown that pollution and oxidativestress biomarkers in the bivalve mollusc C. gallina can fluctuate sig-nificantly throughout the year, depending on factors such as nutri-ent availability, reproductive status or growth (Rodríguez-Ortegaet al., 2002). This must be adequately considered for the correctinterpretation of the results derived from combining pollutantsand biomarkers, as variations in the response of a biomarker couldbe not only related to the presence of pollutants (Pain et al., 2007).Variations in the annual physiological cycle, or even among organ-isms sampled during the same season, influences due to the sam-pling area — e.g. genetic differences among populations —, or otherenvironmental factors not related to pollution, can affect bio-marker responses (Burger et al., 2007; Bocchetti et al., 2008).Therefore, a suitable statistical analysis capable of eliminatingthose interfering factors is required. The study of the complex rela-tionships between environmental and biological factors alteringbioindicator responses must rely on multivariate methods to iden-tify natural and toxic-induced response patterns. These methods,combined with univariate analysis, reflect more accurately themultiple interactions between living beings and their environment(Landis et al., 1994).
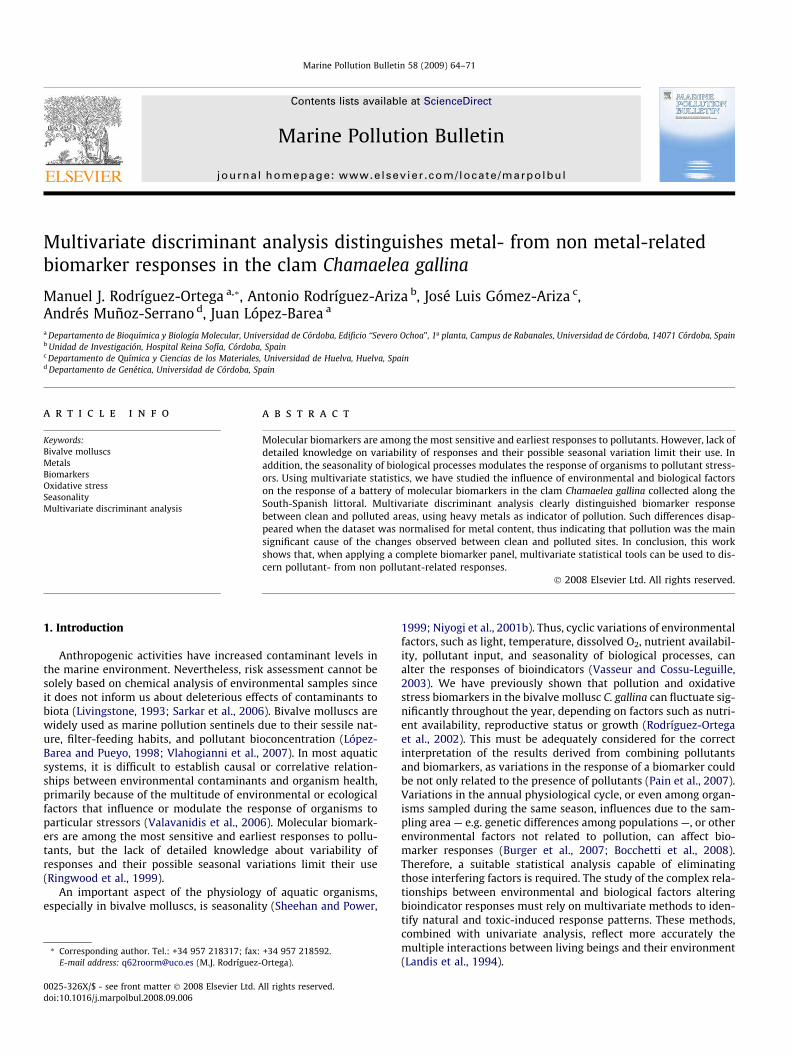
Fig. 1. Map of the Southern coast of Spain showing the sampling sites of the clam C. gallina along the South-Atlantic and Mediterranean littorals. Clams were taken frommoderately (1), highly (2, 3, 4 and 5) and low polluted sites (6 and 7). Sites 6 and 7 were considered as reference areas.
M.J. Rodríguez-Ortega et al. / Marine Pollution Bulletin 58 (2009) 64–71 65
The present study was aimed at elucidating the influence ofenvironmental and biological factors on the response of a batteryof molecular biomarkers in the clam C. gallina. The metal contentand a battery of biomarkers, including antioxidant defences andoxidative damage, were analysed in the molluscs sampled at sevensites of the South-Spanish littoral. The application of multivariatestatistical analyses allowed the distinction of metal-related andnon-metal-related responses of the battery of biomarkers mea-sured in C. gallina. Clams were sampled from five South-Atlanticlittoral sites of the Southern coast of Spain (zones 1 to 5) with dif-ferent levels of metals and organic contaminants using as a refer-ence two clean Mediterranean sites (zones 6 and 7) (Fig. 1). Sites1 to 5 receive pollutants from several sources, including metalscarried from the Iberian Pyrite Belt by the Odiel and Tinto Rivers,and pollutants from industrial and farming activities located inthe Huelva Estuary. In addition, the Guadalquivir River carries ur-ban, agricultural and industrial contaminants to its Estuary. Finally,the collapse in 1998 of a tailings dam in Azalcóllar Pyrite mine re-leased into the Guadiamar stream 2 � 106 m3 of mud and 4 � 106
m3 of acidic water with high metal content (Grimalt et al., 1999;López-Pamo et al., 1999). In contrast, the Mediterranean littoralat Almería receives fewer metals and industrial contaminants.
2. Materials and methods
2.1. Animals and sampling areas
Chamaelea gallina samples were collected throughout 1999 atthe sites shown in Fig. 1. Samples from sites 1, 2, 3 and 4 were ta-ken in March, June, September and November. Samples from site 5were collected in March, April, June, July, September, October,November and December. Samples from areas 6 and 7 were takenin March and September. The bivalves were maintained at 4 �C and
sent to the laboratory, then the shells were discarded and 30–40whole clams per sample (0.6–0.8 g/animal) were pooled, frozenat �80 �C, ground in a mortar with N2, and kept at �80 �C untilanalysed.
2.2. Pollutant content
Nine inorganic pollutants (As, Cd, Cr, Cu, Fe, Mn, Ni, Pb and Zn)were analysed in clam tissues as previously described (Rodríguez-Ortega et al., 2002).
2.3. Preparation of subcellular fractions
Both cytosolic and microsomal fractions for biochemical deter-minations were prepared from pooled ground animals as previ-ously described (Rodríguez-Ortega et al., 2002), and stored at�80 �C until analysed.
2.4. Biochemical determinations
The biomarkers measured in this work were assayed as previ-ously described (Rodríguez-Ortega et al., 2002). Eleven enzymaticactivities were assayed spectrophotometrically: glucose-6-phos-phate dehydrogenase (G6PDH), 6-phosphogluconate dehydroge-nase (6PGDH), isocitrate dehydrogenase (IDH), glutathionereductase (GR), cytosolic and microsomal glutathione transferases(GST and mGST, respectively), catalase (CAT), superoxide dismu-tase (SOD), glutathione peroxidase (GPX), and glyoxalases I and II(Glx-I and Glx-II, respectively). Malondialdehyde levels (MDA), aproduct of lipid peroxidation, were assayed fluorimetrically inhomogenates. Reduced glutathione (GSH) was assayed by high-performance liquid chromatography coupled to electrochemicaldetection. Protein concentration was assayed by the bicinchoninicacid method (Smith et al., 1985).
66 M.J. Rodríguez-Ortega et al. / Marine Pollution Bulletin 58 (2009) 64–71
2.5. Statistical analysis
Data were processed and analysed using the SAS software (SASInstitute Inc., Cary, NC, USA). For each biomarker and metal con-centration measurement, three independent extracts per samplewere made and three replicates per extract were measured. Allvariables were log-transformed in order to normalise the dataand minimise the impact of outliers. Relationships among the thir-teen biomarkers were determined by Pearson correlation. To studythe dependence of each biomarker on the nine measured inorganicpollutants, a multiple regression analysis was performed, accord-ing to the following model:
Yi ¼ aþ b1X1i þ b2X2i þ b3X þ 3iþ b4X4i þ b5X5i þ b6X6i þ b7X7i
þ b8X8i þ b9X9i
being
Yi: the i�nth value of the biomarker.a: the Y-axis intercept.b1, b2, ... , b9: the regression coefficients to the 1st, 2nd, ..., 9thpollutant.X1i, X2i, . . . , X9i: the i�nth value of the 1st, 2nd, ..., 9th pollutant.
Statistical significance of the multiple regression and correla-tion analyses is shown as: *P < 0.05; **P < 0.01; ***P < 0.001. Discrim-inant analyses were carried out in order to study thediscrimination power of the battery of biomarkers on the samplingsites and on the seasons. The discriminating factor was a new var-iable constructed as a linear combination of the thirteen biomark-ers. Seasons were defined as follows: March and April weregrouped into ‘‘spring”; June and July, in ‘‘summer”; Septemberand October were classed into ‘‘autumn”; November and Decemberwere grouped into ‘‘winter”. The categories (seasons or samplingsites) were represented in the two first discriminant axes, withconfidence limits at 95%. To analyse the influence of the differentenvironmental factors, the dataset was corrected for sampling siteor season, and/or adjusted for pollutant content, according to thefollowing models:
(a) Correction for site of sampling or for seasons:
xij ¼ li þ Sj þ eij
beingXij: the i�nth value of the biomarker in the j�nth site
(j = 1,. . .,7) or season (j = spring, summer, autumn andwinter);li: the mean of the population;Sj: the effect of the j�nth site or season;eij: the residual of the effect of the j�nth site or season in thei�nth value of the biomarker.(b) Adjustment for pollutant content:
Xi ¼ aþ bYj þ eij
being
a: the intercept;Xi: the i�nth value of the biomarker;b: the slope;Yi: the i�nth value of the pollutant;eij: the residual of the effect of the j�nth pollutant in thei�nth value of the biomarker.(c) Correction for site of sampling or season and adjustment ofpollutant content:
Xij ¼ li þ Sj þ bYij þ eij
being
Xij: the i�nth value of the biomarker in the j�nth site (j = 1,. . . ,7) or season (j = spring, summer, autumn and winter);li: the mean of the population;Sj: the effect of the j�nth site or season;b: the slope in the j�nth site or season;Yij: the i�nth value of the pollutant in the j�nth site orseason;eij the residual of the effect of de j�nth site or season in thei�nth value of the biomarker.
In all the corrected and/or adjusted models, the discriminantanalyses were carried out with the residual values, that is, eij. Theywere performed with the DISCRIM procedure of the SAS package,and the STEPDISC procedure to test the good discrimination ofthe biomarkers and the residuals.
3. Results
The application of the battery of biomarkers to C. gallinashowed increased antioxidant defences in animals chronically ex-posed to contaminants released by the Huelva and Guadalquivirestuaries (Rodríguez-Ortega et al., 2002). As a result, clams frompolluted sites were even better protected from oxidative stressthan reference animals. The inverse relationship between bio-markers of defence against oxidative stress and oxidative damagewas explored by determining the Pearson correlation coefficientof log-transformed data (Table 1). It is notable that the mostrecurrent significant correlations were found between the bio-markers responsible for maintaining a reduced intracellular sta-tus (G6PDH, 6PGDH, IDH, GR, GSH). There was also a positivecorrelation between most of the activities that detoxify reactiveoxygen species (Glx-I, Glx-II, CAT, GPX and SOD). On the otherhand, it is remarkable the negative correlation between MDA con-tent and enzymatic activities such as G6PDH, 6PGDH, Glx-I andGlx-II. GST was the only biochemical parameter that did not showany significant correlation with any other biomarker.
The relationship of biomarkers to tissue pollutant levels wasanalysed using regression analysis. As shown in Table 2, a highnumber of significant regression coefficients were observed. Somemetals such as Cd, Cr, Fe, Pb and Zn showed inhibitory effects onsome of the biomarkers analysed. On the other hand, as contentwas related to higher (G6PDH, Glx-I, Glx-II) and lower (IDH, GST,GPX) enzymatic activities.
To obtain the model that provides the best discrimination usingthe measured biomarkers on the sampling areas and seasonality,the canonical discriminant analysis (DA) was applied. The discrim-inant potency of the battery of biomarkers assayed on the four sea-sons is shown in Fig. 2. The DA efficiently discriminated among thefour seasons. The first canonical axis explained 63.56% of varianceand clearly discriminated winter from the other seasons, while thesecond axis explained 25.82% of the variance and efficiently sepa-rated autumn from spring and summer. Table 3 shows the discrim-inant power of each biomarker on seasonality. IDH, 6PGDH, Glx-IIand mGST were the variables exhibiting the highest discriminantpower. On the contrary, G6PDH, GST and GSH were useless to dis-criminate among seasons.
Fig. 3 shows the discriminant potency of the battery of biomark-ers on the seven sampling sites. The first and second canonical axesexplained 53.42% and 25.86% of variance, respectively, efficientlydiscriminating the more polluted sites (2, 3, 4, and 5) from the les-ser polluted site 1 and from the reference sites (6 and 7). Table 4shows the power of each biomarker to discriminate among thesampling sites. In this case, MDA, mGST, GSH, Glx-I and IDH were
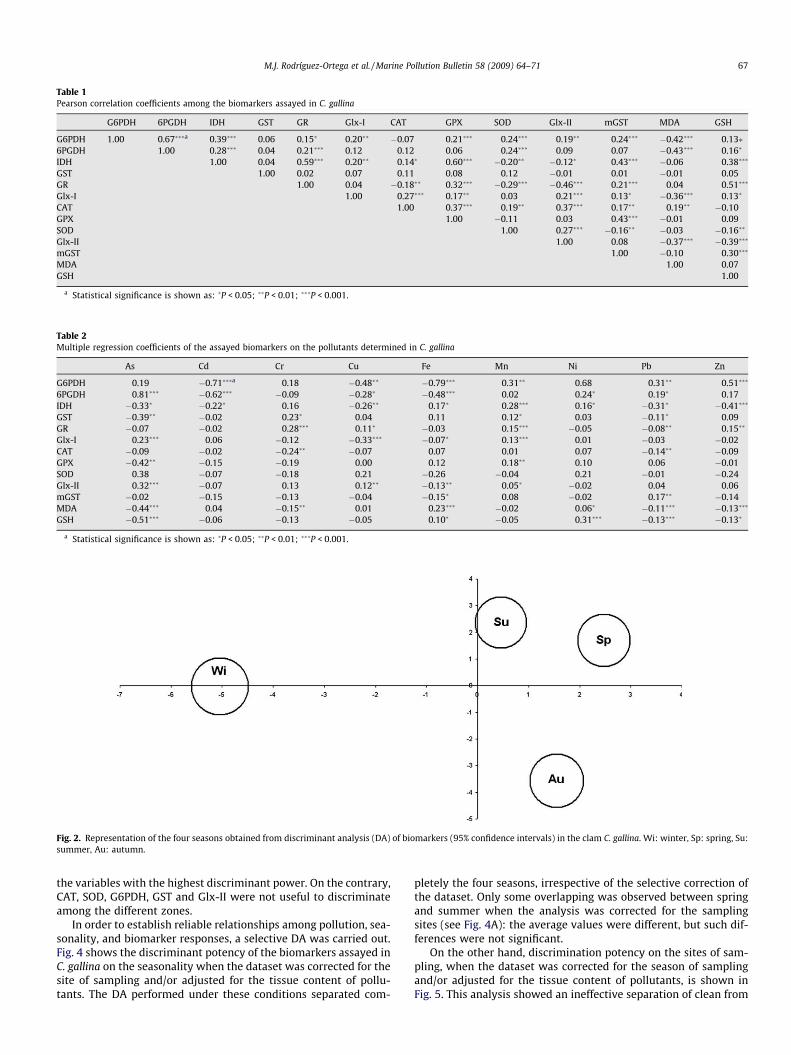
Fig. 2. Representation of the four seasons obtained from discriminant analysis (DA) of biomarkers (95% confidence intervals) in the clam C. gallina. Wi: winter, Sp: spring, Su:summer, Au: autumn.
Table 2Multiple regression coefficients of the assayed biomarkers on the pollutants determined in C. gallina
As Cd Cr Cu Fe Mn Ni Pb Zn
G6PDH 0.19 �0.71���a 0.18 �0.48�� �0.79��� 0.31�� 0.68 0.31�� 0.51���
6PGDH 0.81��� �0.62��� �0.09 �0.28� �0.48��� 0.02 0.24� 0.19� 0.17IDH �0.33� �0.22� 0.16 �0.26�� 0.17� 0.28��� 0.16� �0.31� �0.41���
GST �0.39�� �0.02 0.23� 0.04 0.11 0.12� 0.03 �0.11� 0.09GR �0.07 �0.02 0.28��� 0.11� �0.03 0.15��� �0.05 �0.08�� 0.15��
Glx-I 0.23��� 0.06 �0.12 �0.33��� �0.07� 0.13��� 0.01 �0.03 �0.02CAT �0.09 �0.02 �0.24�� �0.07 0.07 0.01 0.07 �0.14�� �0.09GPX �0.42�� �0.15 �0.19 0.00 0.12 0.18�� 0.10 0.06 �0.01SOD 0.38 �0.07 �0.18 0.21 �0.26 �0.04 0.21 �0.01 �0.24Glx-II 0.32��� �0.07 0.13 0.12�� �0.13�� 0.05� �0.02 0.04 0.06mGST �0.02 �0.15 �0.13 �0.04 �0.15� 0.08 �0.02 0.17�� �0.14MDA �0.44��� 0.04 �0.15�� 0.01 0.23��� �0.02 0.06� �0.11��� �0.13���
GSH �0.51��� �0.06 �0.13 �0.05 0.10� �0.05 0.31��� �0.13��� �0.13�
a Statistical significance is shown as: �P < 0.05; ��P < 0.01; ���P < 0.001.
Table 1Pearson correlation coefficients among the biomarkers assayed in C. gallina
G6PDH 6PGDH IDH GST GR Glx-I CAT GPX SOD Glx-II mGST MDA GSH
G6PDH 1.00 0.67���a 0.39��� 0.06 0.15� 0.20�� �0.07 0.21��� 0.24��� 0.19�� 0.24��� �0.42��� 0.13�6PGDH 1.00 0.28��� 0.04 0.21��� 0.12 0.12 0.06 0.24��� 0.09 0.07 �0.43��� 0.16�
IDH 1.00 0.04 0.59��� 0.20�� 0.14� 0.60��� �0.20�� �0.12� 0.43��� �0.06 0.38���
GST 1.00 0.02 0.07 0.11 0.08 0.12 �0.01 0.01 �0.01 0.05GR 1.00 0.04 �0.18�� 0.32��� �0.29��� �0.46��� 0.21��� 0.04 0.51���
Glx-I 1.00 0.27��� 0.17�� 0.03 0.21��� 0.13� �0.36��� 0.13�
CAT 1.00 0.37��� 0.19�� 0.37��� 0.17�� 0.19�� �0.10GPX 1.00 �0.11 0.03 0.43��� �0.01 0.09SOD 1.00 0.27��� �0.16�� �0.03 �0.16��
Glx-II 1.00 0.08 �0.37��� �0.39���
mGST 1.00 �0.10 0.30���
MDA 1.00 0.07GSH 1.00
a Statistical significance is shown as: �P < 0.05; ��P < 0.01; ���P < 0.001.
M.J. Rodríguez-Ortega et al. / Marine Pollution Bulletin 58 (2009) 64–71 67
the variables with the highest discriminant power. On the contrary,CAT, SOD, G6PDH, GST and Glx-II were not useful to discriminateamong the different zones.
In order to establish reliable relationships among pollution, sea-sonality, and biomarker responses, a selective DA was carried out.Fig. 4 shows the discriminant potency of the biomarkers assayed inC. gallina on the seasonality when the dataset was corrected for thesite of sampling and/or adjusted for the tissue content of pollu-tants. The DA performed under these conditions separated com-
pletely the four seasons, irrespective of the selective correction ofthe dataset. Only some overlapping was observed between springand summer when the analysis was corrected for the samplingsites (see Fig. 4A): the average values were different, but such dif-ferences were not significant.
On the other hand, discrimination potency on the sites of sam-pling, when the dataset was corrected for the season of samplingand/or adjusted for the tissue content of pollutants, is shown inFig. 5. This analysis showed an ineffective separation of clean from
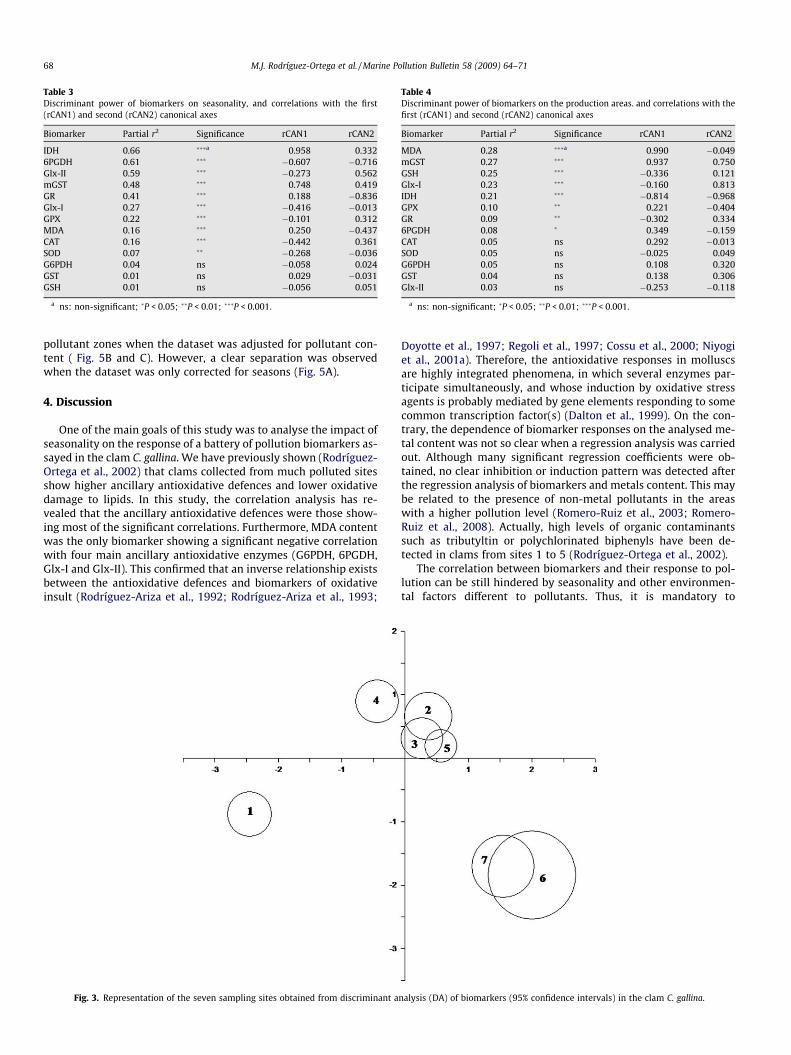
Table 3Discriminant power of biomarkers on seasonality, and correlations with the first(rCAN1) and second (rCAN2) canonical axes
Biomarker Partial r2 Significance rCAN1 rCAN2
IDH 0.66 ���a 0.958 0.3326PGDH 0.61 ��� �0.607 �0.716Glx-II 0.59 ��� �0.273 0.562mGST 0.48 ��� 0.748 0.419GR 0.41 ��� 0.188 �0.836Glx-I 0.27 ��� �0.416 �0.013GPX 0.22 ��� �0.101 0.312MDA 0.16 ��� 0.250 �0.437CAT 0.16 ��� �0.442 0.361SOD 0.07 �� �0.268 �0.036G6PDH 0.04 ns �0.058 0.024GST 0.01 ns 0.029 �0.031GSH 0.01 ns �0.056 0.051
a ns: non-significant; �P < 0.05; ��P < 0.01; ���P < 0.001.
Table 4Discriminant power of biomarkers on the production areas. and correlations with thefirst (rCAN1) and second (rCAN2) canonical axes
Biomarker Partial r2 Significance rCAN1 rCAN2
MDA 0.28 ���a 0.990 �0.049mGST 0.27 ��� 0.937 0.750GSH 0.25 ��� �0.336 0.121Glx-I 0.23 ��� �0.160 0.813IDH 0.21 ��� �0.814 �0.968GPX 0.10 �� 0.221 �0.404GR 0.09 �� �0.302 0.3346PGDH 0.08 � 0.349 �0.159CAT 0.05 ns 0.292 �0.013SOD 0.05 ns �0.025 0.049G6PDH 0.05 ns 0.108 0.320GST 0.04 ns 0.138 0.306Glx-II 0.03 ns �0.253 �0.118
a ns: non-significant; �P < 0.05; ��P < 0.01; ���P < 0.001.
68 M.J. Rodríguez-Ortega et al. / Marine Pollution Bulletin 58 (2009) 64–71
pollutant zones when the dataset was adjusted for pollutant con-tent ( Fig. 5B and C). However, a clear separation was observedwhen the dataset was only corrected for seasons (Fig. 5A).
4. Discussion
One of the main goals of this study was to analyse the impact ofseasonality on the response of a battery of pollution biomarkers as-sayed in the clam C. gallina. We have previously shown (Rodríguez-Ortega et al., 2002) that clams collected from much polluted sitesshow higher ancillary antioxidative defences and lower oxidativedamage to lipids. In this study, the correlation analysis has re-vealed that the ancillary antioxidative defences were those show-ing most of the significant correlations. Furthermore, MDA contentwas the only biomarker showing a significant negative correlationwith four main ancillary antioxidative enzymes (G6PDH, 6PGDH,Glx-I and Glx-II). This confirmed that an inverse relationship existsbetween the antioxidative defences and biomarkers of oxidativeinsult (Rodríguez-Ariza et al., 1992; Rodríguez-Ariza et al., 1993;
Fig. 3. Representation of the seven sampling sites obtained from discriminant a
Doyotte et al., 1997; Regoli et al., 1997; Cossu et al., 2000; Niyogiet al., 2001a). Therefore, the antioxidative responses in molluscsare highly integrated phenomena, in which several enzymes par-ticipate simultaneously, and whose induction by oxidative stressagents is probably mediated by gene elements responding to somecommon transcription factor(s) (Dalton et al., 1999). On the con-trary, the dependence of biomarker responses on the analysed me-tal content was not so clear when a regression analysis was carriedout. Although many significant regression coefficients were ob-tained, no clear inhibition or induction pattern was detected afterthe regression analysis of biomarkers and metals content. This maybe related to the presence of non-metal pollutants in the areaswith a higher pollution level (Romero-Ruiz et al., 2003; Romero-Ruiz et al., 2008). Actually, high levels of organic contaminantssuch as tributyltin or polychlorinated biphenyls have been de-tected in clams from sites 1 to 5 (Rodríguez-Ortega et al., 2002).
The correlation between biomarkers and their response to pol-lution can be still hindered by seasonality and other environmen-tal factors different to pollutants. Thus, it is mandatory to
nalysis (DA) of biomarkers (95% confidence intervals) in the clam C. gallina.
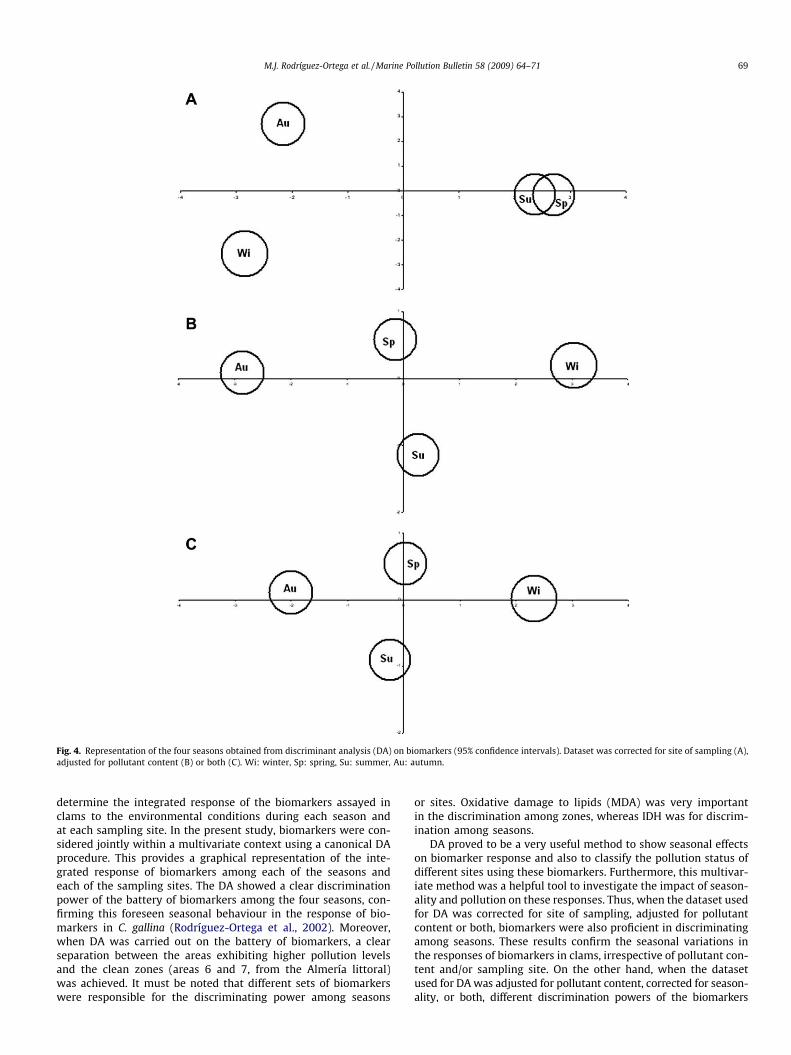
Fig. 4. Representation of the four seasons obtained from discriminant analysis (DA) on biomarkers (95% confidence intervals). Dataset was corrected for site of sampling (A),adjusted for pollutant content (B) or both (C). Wi: winter, Sp: spring, Su: summer, Au: autumn.
M.J. Rodríguez-Ortega et al. / Marine Pollution Bulletin 58 (2009) 64–71 69
determine the integrated response of the biomarkers assayed inclams to the environmental conditions during each season andat each sampling site. In the present study, biomarkers were con-sidered jointly within a multivariate context using a canonical DAprocedure. This provides a graphical representation of the inte-grated response of biomarkers among each of the seasons andeach of the sampling sites. The DA showed a clear discriminationpower of the battery of biomarkers among the four seasons, con-firming this foreseen seasonal behaviour in the response of bio-markers in C. gallina (Rodríguez-Ortega et al., 2002). Moreover,when DA was carried out on the battery of biomarkers, a clearseparation between the areas exhibiting higher pollution levelsand the clean zones (areas 6 and 7, from the Almería littoral)was achieved. It must be noted that different sets of biomarkerswere responsible for the discriminating power among seasons
or sites. Oxidative damage to lipids (MDA) was very importantin the discrimination among zones, whereas IDH was for discrim-ination among seasons.
DA proved to be a very useful method to show seasonal effectson biomarker response and also to classify the pollution status ofdifferent sites using these biomarkers. Furthermore, this multivar-iate method was a helpful tool to investigate the impact of season-ality and pollution on these responses. Thus, when the dataset usedfor DA was corrected for site of sampling, adjusted for pollutantcontent or both, biomarkers were also proficient in discriminatingamong seasons. These results confirm the seasonal variations inthe responses of biomarkers in clams, irrespective of pollutant con-tent and/or sampling site. On the other hand, when the datasetused for DA was adjusted for pollutant content, corrected for season-ality, or both, different discrimination powers of the biomarkers
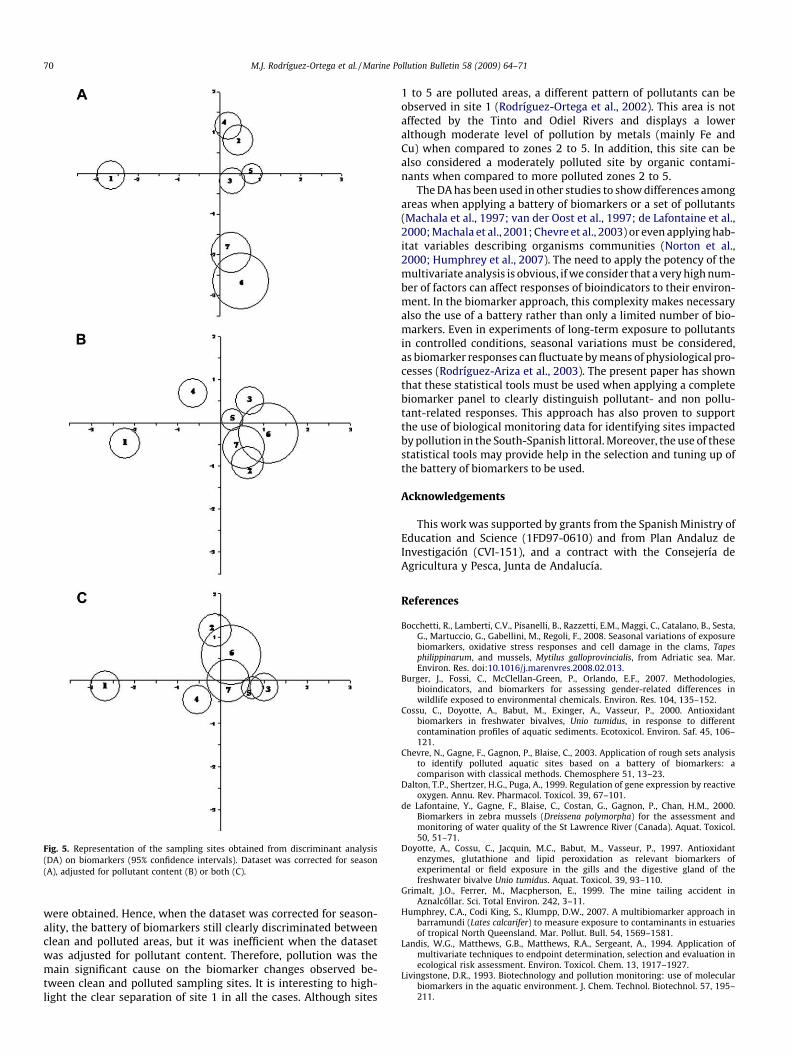
Fig. 5. Representation of the sampling sites obtained from discriminant analysis(DA) on biomarkers (95% confidence intervals). Dataset was corrected for season(A), adjusted for pollutant content (B) or both (C).
70 M.J. Rodríguez-Ortega et al. / Marine Pollution Bulletin 58 (2009) 64–71
were obtained. Hence, when the dataset was corrected for season-ality, the battery of biomarkers still clearly discriminated betweenclean and polluted areas, but it was inefficient when the datasetwas adjusted for pollutant content. Therefore, pollution was themain significant cause on the biomarker changes observed be-tween clean and polluted sampling sites. It is interesting to high-light the clear separation of site 1 in all the cases. Although sites
1 to 5 are polluted areas, a different pattern of pollutants can beobserved in site 1 (Rodríguez-Ortega et al., 2002). This area is notaffected by the Tinto and Odiel Rivers and displays a loweralthough moderate level of pollution by metals (mainly Fe andCu) when compared to zones 2 to 5. In addition, this site can bealso considered a moderately polluted site by organic contami-nants when compared to more polluted zones 2 to 5.
The DA has been used in other studies to show differences amongareas when applying a battery of biomarkers or a set of pollutants(Machala et al., 1997; van der Oost et al., 1997; de Lafontaine et al.,2000; Machala et al., 2001; Chevre et al., 2003) or even applying hab-itat variables describing organisms communities (Norton et al.,2000; Humphrey et al., 2007). The need to apply the potency of themultivariate analysis is obvious, if we consider that a very high num-ber of factors can affect responses of bioindicators to their environ-ment. In the biomarker approach, this complexity makes necessaryalso the use of a battery rather than only a limited number of bio-markers. Even in experiments of long-term exposure to pollutantsin controlled conditions, seasonal variations must be considered,as biomarker responses can fluctuate by means of physiological pro-cesses (Rodríguez-Ariza et al., 2003). The present paper has shownthat these statistical tools must be used when applying a completebiomarker panel to clearly distinguish pollutant- and non pollu-tant-related responses. This approach has also proven to supportthe use of biological monitoring data for identifying sites impactedby pollution in the South-Spanish littoral. Moreover, the use of thesestatistical tools may provide help in the selection and tuning up ofthe battery of biomarkers to be used.
Acknowledgements
This work was supported by grants from the Spanish Ministry ofEducation and Science (1FD97-0610) and from Plan Andaluz deInvestigación (CVI-151), and a contract with the Consejería deAgricultura y Pesca, Junta de Andalucía.
References
Bocchetti, R., Lamberti, C.V., Pisanelli, B., Razzetti, E.M., Maggi, C., Catalano, B., Sesta,G., Martuccio, G., Gabellini, M., Regoli, F., 2008. Seasonal variations of exposurebiomarkers, oxidative stress responses and cell damage in the clams, Tapesphilippinarum, and mussels, Mytilus galloprovincialis, from Adriatic sea. Mar.Environ. Res. doi:10.1016/j.marenvres.2008.02.013.
Burger, J., Fossi, C., McClellan-Green, P., Orlando, E.F., 2007. Methodologies,bioindicators, and biomarkers for assessing gender-related differences inwildlife exposed to environmental chemicals. Environ. Res. 104, 135–152.
Cossu, C., Doyotte, A., Babut, M., Exinger, A., Vasseur, P., 2000. Antioxidantbiomarkers in freshwater bivalves, Unio tumidus, in response to differentcontamination profiles of aquatic sediments. Ecotoxicol. Environ. Saf. 45, 106–121.
Chevre, N., Gagne, F., Gagnon, P., Blaise, C., 2003. Application of rough sets analysisto identify polluted aquatic sites based on a battery of biomarkers: acomparison with classical methods. Chemosphere 51, 13–23.
Dalton, T.P., Shertzer, H.G., Puga, A., 1999. Regulation of gene expression by reactiveoxygen. Annu. Rev. Pharmacol. Toxicol. 39, 67–101.
de Lafontaine, Y., Gagne, F., Blaise, C., Costan, G., Gagnon, P., Chan, H.M., 2000.Biomarkers in zebra mussels (Dreissena polymorpha) for the assessment andmonitoring of water quality of the St Lawrence River (Canada). Aquat. Toxicol.50, 51–71.
Doyotte, A., Cossu, C., Jacquin, M.C., Babut, M., Vasseur, P., 1997. Antioxidantenzymes, glutathione and lipid peroxidation as relevant biomarkers ofexperimental or field exposure in the gills and the digestive gland of thefreshwater bivalve Unio tumidus. Aquat. Toxicol. 39, 93–110.
Grimalt, J.O., Ferrer, M., Macpherson, E., 1999. The mine tailing accident inAznalcóllar. Sci. Total Environ. 242, 3–11.
Humphrey, C.A., Codi King, S., Klumpp, D.W., 2007. A multibiomarker approach inbarramundi (Lates calcarifer) to measure exposure to contaminants in estuariesof tropical North Queensland. Mar. Pollut. Bull. 54, 1569–1581.
Landis, W.G., Matthews, G.B., Matthews, R.A., Sergeant, A., 1994. Application ofmultivariate techniques to endpoint determination, selection and evaluation inecological risk assessment. Environ. Toxicol. Chem. 13, 1917–1927.
Livingstone, D.R., 1993. Biotechnology and pollution monitoring: use of molecularbiomarkers in the aquatic environment. J. Chem. Technol. Biotechnol. 57, 195–211.
M.J. Rodríguez-Ortega et al. / Marine Pollution Bulletin 58 (2009) 64–71 71
López-Barea, J., Pueyo, C., 1998. Mutagen content and metabolic activation ofpromutagens by molluscs as biomarkers of marine pollution. Mutat. Res. 399,3–15.
López-Pamo, E., Barettino, D., Antón-Pacheco, C., Ortiz, G., Arranz, J.C., Gumiel, J.C.,Martínez-Pledel, B., Aparicio, M., Montouto, O., 1999. The extent of theAznalcóllar pyritic sludge spill and its effects on soils. Sci. Total Environ. 242,57–88.
Machala, M., Dusek, L., Hilscherova, K., Kubinova, R., Jurajda, P., Neca, J., Ulrich, R.,Gelnar, M., Studnickova, Z., Holoubek, I., 2001. Determination and multivariatestatistical analysis of biochemical responses to environmental contaminants inferal freshwater fish Leuciscus cephalus. L. Environ. Toxicol. Chem. 20, 1141–1148.
Machala, M., Petrivalsky, M., Nezveda, K., Ulrich, R., Dusek, L., Piacka, V., Svobodova,Z., 1997. Responses of carp hepatopancreatic 7-ethoxyresorufin-O-deethylaseand glutathione-dependent enzymes to organic pollutants -a field study.Environ. Mol. Mutagen. 16, 1410–1416.
Niyogi, S., Biswas, S., Sarker, S., Datta, A.G., 2001a. Antioxidant enzymes inbrackishwater oyster, Saccostrea cucullata as potential biomarkers ofpolyaromatic hydrocarbon pollution in Hooghly Estuary (India): seasonalityand its consequences. Sci. Total Environ. 281, 237–246.
Niyogi, S., Biswas, S., Sarker, S., Datta, A.G., 2001b. Seasonal variation of antioxidantand biotransformation enzymes in barnacle, Balanus balanoides, and theirrelation with polyaromatic hydrocarbons. Mar. Environ. Res. 52, 13–26.
Norton, S.B., Cormier, S.M., Smith, M., Jones, C., 2000. Can biological assessmentsdiscriminate among types of stress? A case study from the eastern corn beltplains ecoregion. Environ. Toxicol. Chem. 19, 1113–1119.
Pain, S., Devin, S., Parant, M., 2007. Biomarker versus environmental factors:seasonal variations and modelling multixenobiotic defence (MXD) transportactivity in transplanted zebra mussels. Sci. Total Environ. 373, 103–112.
Regoli, F., Principato, G., Bertoli, E., Nigro, M., Orlando, E., 1997. Biochemicalcharacterization of the antioxidant system in the scallop Adamussium colbecki, asentinel organism for monitoring the Antarctic environment. Polar Biology 17,251–258.
Ringwood, A.H., Hameedi, M.J., Lee, R.F., Brower, M., Peters, E.C., Scott, G.I., Luoma,S.N., Di Giulio, R.T., 1999. Bivalve Biomarker Workshop: Overview anddiscussion group summaries. Biomarkers 4, 391–399.
Rodríguez-Ariza, A., Abril, N., Navas, J.I., Dorado, G., López-Barea, J., Pueyo, C., 1992.Metal, mutagenicity, and biochemical studies on bivalve molluscs from Spanishcoasts. Environ. Mol. Mutagen. 19, 112–124.
Rodríguez-Ariza, A., Peinado, J., Pueyo, C., López-Barea, J., 1993. Biochemicalindicators of oxidative stress in fish from polluted littoral areas. Can. J. Fish.Aquat. Sci. 50, 2568–2573.
Rodríguez-Ariza, A., Rodríguez-Ortega, M.J., Marenco, J.L., Amezcua, O., Alhama, J.,López-Barea, J., 2003. Uptake and clearance of PCB congeners in Chamaeleagallina: response of oxidative stress biomarkers. Comp. Biochem. Physiol. CToxicol. Pharmacol. 134, 57–67.
Rodríguez-Ortega, M.J., Alhama, J., Funes, V., Romero-Ruiz, A., Rodríguez-Ariza, A.,López-Barea, J., 2002. Biochemical biomarkers of pollution in the clamChamaelea gallina from south-Spanish littoral. Environ. Toxicol. Chem. 21,542–549.
Romero-Ruiz, A., Alhama, J., Blasco, J., Gómez-Ariza, J.L., López-Barea, J., 2008.New metallothionein assay in Scrobicularia plana: He ating effect andcorrelation with other biomarkers. Environ. Pollut doi:10.1016/j.envpol.2008.02.022.
Romero-Ruiz, A., Amezcua, O., Rodríguez-Ortega, M.J., Muñoz, J.L., Alhama, J.,Rodríguez-Ariza, A., Gómez-Ariza, J.L., López-Barea, J., 2003. Oxidative stressbiomarkers in bivalves transplanted to the Guadalquivir estuary afterAznalcollar spill. Environ. Toxicol. Chem. 22, 92–100.
Sarkar, A., Ray, D., Shrivastava, A.N., Sarker, S., 2006. Molecular Biomarkers: theirsignificance and application in marine pollution monitoring. Ecotoxicology 15,333–340.
Sheehan, D., Power, A., 1999. Effects of seasonality on xenobiotic and antioxidantdefence mechanisms of bivalve molluscs. Comp. Biochem. Physiol. C Pharmacol.Toxicol. Endocrinol. 123, 193–199.
Smith, P.K., Krohn, R.I., Hermanson, G.T., Mallia, A.K., Gartner, F.H., Provenzano,M.D., Fujimoto, E.K., Goeke, N.M., Olson, B.J., Klenk, D.C., 1985. Measurement ofprotein using bicinchoninic acid. Anal. Biochem. 150, 76–85.
Valavanidis, A., Vlahogianni, T., Dassenakis, M., Scoullos, M., 2006.Molecular biomarkers of oxidative stress in aquatic organisms inrelation to toxic environmental pollutants. Ecotoxicol. Environ. Saf.64, 178–189.
van der Oost, R., Vindimian, E., van den Brink, P.J., Satumalay, K., Heida, H.,Vermeulen, N.P.E., 1997. Biomonitoring aquatic pollution with feral eel(Anguilla anguilla). III. Statistical analyses of relationships betweencontaminant exposure and biomarkers. Aquat. Toxicol. 39, 45–75.
Vasseur, P., Cossu-Leguille, C., 2003. Biomarkers and community indices ascomplementary tools for environmental safety. Environ. Int. 28,711–717.
Vlahogianni, T., Dassenakis, M., Scoullos, M.J., Valavanidis, A., 2007. Integrated useof biomarkers (superoxide dismutase, catalase and lipid peroxidation) inmussels Mytilus galloprovincialis for assessing heavy metals’ pollution incoastal areas from the Saronikos Gulf of Greece. Mar. Pollut. Bull. 54, 1361–1371.


![[PPT]Clam Dissection · Web viewDissection of the Clam Venus mercenaria * copyright cmassengale * * * * * * copyright cmassengale Resource * * * * * * * * * * * * * * * * * * * * *](https://img.pdfslide.net/doc/110x75/5aa6232f7f8b9a7c1a8e5555/pptclam-dissection-viewdissection-of-the-clam-venus-mercenaria-copyright-cmassengale.jpg)