Embed Size (px)
Citation preview
MPRAMunich Personal RePEc Archive
Capital Structure of Internet Companies:Case Study
Anton Miglo and Shuting Liang and Zhenting Lee
University of Bridgeport
2014
Online at http://mpra.ub.uni-muenchen.de/56330/MPRA Paper No. 56330, posted 6. June 2014 09:17 UTC
1
Capital Structure of Internet Companies: Case Study*
Zhenting Lee**, Shuting Liang**, Anton Miglo**
2014
ABSTRACT
We analyze the financing decisions and capital structure of internet companies and
relate observed findings to the common capital structure theories. Large internet
companies usually have low debt and small internet companies have high debt. We
find that the trade-off theory of capital structure, pecking order theory, market timing
theory and other theories cannot individually explain a firm’s capital structure.
However, they can compliment each other in describing some patterns of observed
behavior. We also suggest a number of recommendations for capital structure theory
and practice.
*For helpful suggestions and comments we are thankful to Sajal Dutta, Julian Dove,
Benjamin Dilq, Jianfeng Lin, Sabilla Rafique and Milos Suljagic.
**University of Bridgeport. 126 Park Ave, Bridgeport, CT 06604.
Key words: capital structure, internet companies, financing strategy, sources of
financing
2
Capital Structure of Internet Companies: Case Study
ABSTRACT
We analyze the financing decisions and capital structure of internet companies and
relate observed findings to the common capital structure theories. Large internet
companies usually have low debt and small internet companies have high debt. We
find that the trade-off theory of capital structure, pecking order theory, market timing
theory and other theories cannot individually explain a firm’s capital structure.
However, they can compliment each other in describing some patterns of observed
behavior. We also suggest a number of recommendations for capital structure theory
and practice.
1. Introduction
The modern theory of capital structure began with the famous proposition of
Modigliani and Miller (1958) that described the conditions of capital structure
irrelevance. Since then, many theories of capital structure have been developed
including trade off theory, pecking order theory, agency cost theory, life cycle theory
and flexibility theory. After so many innovations, capital structure remains one of the
most controversial and debatable issue in corporate finance.
The key issues are as follows. First, an immense gap exists between theories
and practice. Graham and Harvey (2001) found that less than 50% of theoretical ideas
find some support among managers. Second, there are big differences in the
researchers’ opinion. For example, Chirinko and Singha (2000), Leary and Roberts
(2010) and Frank and Goyal (2003) claim that trade-off theory drives capital structure
decisions while Shyam-Sunder and Myers (1999) and Lemmon and Zender (2008)
claim that pecking-order theory drives capital structure. Third, there is difference
among opinions about the direction that future work on capital structure should take.
For instance, Harris and Raviv (1991) argue that asymmetric information theories of
capital structure are not promising. However, the stream of research related to
3
asymmetric information has not stopped since then.1 Furthermore, the financial crisis
during 2008 and 2009 showed that corporate managers appeared to lack an
understanding of the role of asymmetric information. The market for
mortgage-backed securities, which many believe was at the core of financial crisis,
involved asymmetric information between investors and issuers. Various scandals,
such as the one involving Bernie Madoff, illustrate the depth of asymmetric
information problems between firms’ insiders and investors.
The present paper attempts to analyze issues described above. We look at
current practices of internet companies and compare them to existing theories. We
analyze the current practice of 71 companies including 29 large companies and 42
small companies.2 The size of the companies is from 40 million to 223.48 billion.
With the help of spreadsheet analysis we first find an optimal capital structure for a
given company. Spreadsheet analysis is mostly based on the trade-off between tax
advantages of debt and increasing risk from debt financing. This analysis implies that
large companies in the Internet industry are underleveraged. For example, for
Google Inc., the optimal debt ratio is 16.2% and the current debt ratio is just 8.8%.
We also find that most small companies in the Internet industry are overleveraged.
For example, the optimal debt ratio for Ediets.Com Inc is 0%, but the current debt
ratio is as high as 59.54%.
We then describe other factors that have not been taken into consideration in
the spreadsheet analysis, which affect managers’ decisions on company’s capital
structure. We find that no single theory of capital structure can explain the observed
patterns of capital structure in internet industry. The trade-off theory of capital
structure is unable to accurately explain why only a small fraction of firms that are
increasingly profitable utilize debt as a source of financing. Spreadsheet analysis
shows that firm’s current capital structures are distant from their optimal. Also we
find that the pecking order theory’s prioritization of sources of financing is only
maintained in certain situations. For example, we see that younger firms and other
1See, for example, Klein (2002) and Miglo (2010, 2011).
2See Appendix 1.
4
firms who undergo high-growth periods with net losses do not utilize debt before
equity financing. Most companies issued equity through an initial public offering
before utilizing debt which opposes what is expected from the pecking order theory.
The market timing theory pays tribute to some actions taken by nearly every firm
in our sample. For example, nearly all companies issue equity through public
offerings at opportune times, most notably during the “tech craze” or “dot.com
bubble” of the late 1990s. We also see firms undergo public offerings when the market
has recovered from the tech crash of 2000 or at other times when management feels
their stock is overvalued. We see companies make stock repurchases at windows of
opportunities where they believe their stock is undervalued. However, from a broader
point of view, the market timing theory is limited in explaining firm’s capital structure
besides IPO decision.
Flexibility is largely unexplored area of capital structure that can explain many
patterns of capital structure for internet industries. Both equity and debt holders do
place value on flexibility, especially in the recent years of turmoil in capital markets.
Internet companies seem to put an especial emphasis on flexibility when managing
their capital structures given the innovative nature of their industry.
There is a “home bias” in capital structure for most companies in our sample.
Internet companies can use international financing more efficiently. Some reasons for
that include the availability of lower interest rates, flexible regulation for dynamic
companies, no capitalization restrictions, reducing interest rate risk by using flexible
interest rates in markets which have low correlation between each other, using modern
financing arrangements like international project financing or non-recourse debt to
mitigate agency problems.
Small internet companies should have less debt. Using a lot of debt by small
companies is inconsistent with almost any existing theory of capital structure.
Credit rating concerns are unexplored area of capital structure theory. The capital
structure management of large internet companies is strongly consistent with the view
that managers are deeply concerned about ratings.
With regard to existing theories our analysis revealed that any single theory has
5
major problems in explaining capital structure management of internet companies. It
suggests that a unified approach should be developed in near future. Also we disagree
with Harris and Raviv (1991) that asymmetric information theories are less promising.
We find that asymmetric information is important in explaining many patterns of
capital structure behavior of internet companies but managers do not have a practical
tool to use it more efficiently. At the same time given that the gap between theory and
practice is very large, we agree with Harris and Raviv (1991) in that the door is still
widely open for new theory of capital structure which can be helpful to make a bridge
between theory and practice of capital structure.
The rest of this paper is organized as follows. Section 2 describes internet
industry. Section 3 presents a review of capital structure theories. Section 4 describes
in details the analytical method used in the paper and the spreadsheet used to analyze
firm’s capital structure. Section 5 provides detailed examples of some firms capital
structure analysis. Section 6 presents the results of firm’s capital structure analysis and
the conclusion is drawn in Section 7.
2. The internet industry
The internet started out as an American military project in the 1950-60s and has
evolved into a modern mainstream phenomenon. It is used by common businesses
for marketing and sales, for searching and sharing of files (including
documents, audio and video files) by businesses and households, and it is even
used to facilitate online communities with forums and “blogging” with
popular websites such as Facebook, Twitter and Youtube. The Internet has
revolutionized the computer and communications world like nothing before. The
Internet is at once a world-wide broadcasting capability, a mechanism for information
dissemination, and a medium for collaboration and interaction between individuals
and their computers without regard for geographic location. The Internet represents
one of the most successful examples of the benefits of sustained investment and
commitment to research and development of information infrastructure. Beginning
with the early research in packet switching, the government, industry and academia
6
have been partners in evolving and deploying this exciting new technology.
In the technology industry, one kind of the companies is pretty famous which is
called information provider companies. It may sound unfamiliar for most people.
However, most people are familiar with Internet search engine companies like
worldwide Google, Yahoo, Baidu and so on. Many people probably depend on these
internet search engine companies when they use internet to search. These internet
search engine companies are also called information provider companies which
provide different information to various customers. For instance, the famous search
engine company Google can provide a tool to help customers to acquire wanted
information. However, different information providers can provide different types of
information. Like Youku, a video sharing website, can provide all types of videos
information. With the development of the industry, new information provider
companies like Facebook and LinkedIn can help people to establish connection and
share information with others. In the information provider industry, companies
provide information in different ways, but the basic concept is to provide the needed
information to customers.
In the Internet industry, the leader companies and the laggards have the big
difference in Market Cap, long term debt to equity, P/E, net profit margin and other
aspects. For instance, the leader companies, Google, Yahoo and Baidu, have the
market cap of $272.1B, $321.9B and $380.4B. On the contrary, some small
companies like, VRX Worldwide, Inc, Armada Data Corp, Alphinat Inc. have
relatively small market cap of $1.0 M, $1.8M and $1.9M. P/E is also very different
among different companies. For instance, Facebook that held its initial public offering
(IPO) on May 18, 2012, has a P/E of 1805.33. Google has its P/E ratio of 25.62. Most
of the big companies have high net profit margin. For instance, Google has the net
profit margin of 20%, and Yahoo has the similar net profit margin of 20.23%.
Compared to Google and Yahoo, Baidu has the highest net profit margin of 44.12%.
Small companies have the various net profit margin some companies have relatively
high net profit margin. Atrinsic, Inc. has a market cap of $0.13M and has a net profit
margin of -36.7%. eMedia Networks also has a relatively small market cap of $0.4M.
7
However, it has a quite different net profit margin of 11.59 compared with Atrinsic,
Inc -36.7%.
3. Capital structure theories
This section describes capital structure theories. We also discuss some
challenges faced by each theory that provides a basic for further discussions about
existing practices in capital structure theory and management.3
3.1. Trade-off theory
In contrast to dividends, interest paid on debt reduces the firm’s taxable income.
Debt also increases the probability of bankruptcy. Trade-off theory suggests that
capital structure reflects a trade-off between the tax benefits of debt and the expected
costs of bankruptcy (Kraus and Litzenberger, 1973). Miglo (2010) suggests a model
where optimal debt level is given by the following:
(1)
Here R stands for maximal earnings, T is corporate tax rate and k measures
bankruptcy costs.
If k is higher in (1), the equilibrium level of D should be lower. As the
expected bankruptcy costs increase, the advantages of using equity also increase. This
result has several interpretations. Large firms should have more debt because they are
more diversified and have lower default risk. Tangible assets suffer a smaller loss of
value when firms go into distress. Hence, firms with more tangible assets should have
higher leverage compared to those that have more intangible assets, such as research
firms. Growth firms tend to lose more of their value than non-growth firms when they
go into distress. Thus, theory predicts a negative relationship between leverage and
growth.
When T increases in Equation 1, debt should also increase because higher
taxes lead to a greater tax advantage of using debt. Hence, firms with higher tax rates
3For a more detailed review of capital structure theory see, for instance, Miglo (2010).
8
should have higher debt ratios compared to firms with lower tax rates. Inversely, firms
that have substantial non-debt tax shields such as depreciation should be less likely to
use debt than firms that do not have these tax shields. If tax rates increase over time,
debt ratios should also increase. Debt ratios in countries where debt has a much larger
tax benefit should be higher than debt ratios in countries whose debt has a lower tax
benefit.
As suggested in (1), if R increases, D should also increase. Thus, more
profitable firms should have more debt. Expected bankruptcy costs are lower and
interest tax shields are more valuable for profitable firms.
Although trade-off theory predicts that the marginal tax benefit of debt should be
equal to the marginal expected bankruptcy cost, the empirical evidence is mixed.
Some researchers argue that the former is greater than the latter because direct
bankruptcy costs are small and the level of debt is below optimal (Graham, 2000).
Others find that indirect bankruptcy costs can total as much as 25 percent to 30
percent of assets value and are thus comparable with tax benefits of debt (Molina,
2005; Almeida and Philippon, 2007). Additionally, including personal taxation in the
basic model can reduce the tax advantage of debt (Green and Hollifield, 2003; Gordon
and Lee, 2007) because tax rates on the return from equity such as dividends or
capital gain are often reduced.
Trade-off theory of capital structure is a foundation of spreadsheet analysis
described in Section 4. The spreadsheet analysis takes into account taxes and also
increasing risk from debt financing.
3.2. Other theories of capital structure
3.2.1. Pecking-order theory.
The key element of pecking-order theory is asymmetric information between
firm’s insiders and outsiders. Information asymmetries exist in almost every facet of
corporate finance and complicate managers’ ability to maximize firm values.
Managers of good quality firms face the challenge of directly convincing investors
about the true quality of their firm especially if this concerns future performance. As a
9
result, investors try to incorporate indirect evidence in their valuation of firm
performance by analyzing information-revealing actions including capital structure
choice.
Myers and Majluf (1984) set forth pecking order theory. Equity is dominated by
internal funds in pecking order theory. Low-quality firms use equity as much as
internal funds but high-quality firms prefer internal funds because shares issued by the
company can only be sold with discount (i.e. below their true value) because of
imperfect information problems. Similarly debt dominates equity. Debt suffers from
miss valuation less than equity. The same holds if the firm has available
assets-in-place. Hence a “pecking order” emerges: internal funds, debt, and equity
(Myers and Majluf, 1984).
Good-quality firms tend to use internal funds for financing as much as possible.
Because low-quality firms do not have as much profits and retained earnings as
high-quality firms, they use external sources, usually debt, more frequently. This helps
to explain the described above puzzle about the negative correlation between debt and
profitability.
Also pecking order theory predicts that a higher extent of asymmetric information
reduces the incentive to issue equity.
3.2.2 Signaling
In the pecking order model, good quality firms have to use internal funds to
avoid adverse selection problems and losing value. These firms cannot signal their
quality by changing their capital structure. In signaling theory capital structure serves
as a signal of private information (Ross, 1977). If a separating equilibrium exists,
high-quality firms issue debt and low-quality firms issue equity. The empirical
prediction is that firm value (or profitability) and the debt-to-equity ratio is positively
related. The evidence, however, is ambiguous. Most empirical studies report a
negative relationship between leverage and profitability as discussed earlier. In a
similar spirit, some studies document the superior absolute performance of
equity-issuing firms before and immediately after the issue (Jain and Kini, 1994;
Loughran and Ritter, 1997). Several studies examine long-term firm performance
10
following capital structure changes. Shah (1994) reports that business risk falls after
leverage-increasing exchange offers but rises after leverage-decreasing exchange
offers. Jain and Kini (1994), Mikkelson, Partch, and Shah (1997), and Loughran and
Ritter (1997) document the long-run operating underperformance of equity issuing
firms compared to non-issuing firms.
3.2.3. Agency cost-based theories of capital structure
Agency costs arise because managers do not necessarily act in the best interests
of shareholders who also may not act in the best interests of creditors. Including
agency costs in the basic model can help to explain some problems of trade-off theory
discussed above such as debt conservatism.
If an investment yields large returns, equity holders capture most of the gains. If,
however, the investment fails, debt holders bear the consequences. As a result, equity
holders may benefit from investing in highly risky projects, even if the projects are
value decreasing. Jensen and Meckling (1976) call this the “asset substitution effect.”
Debt holders can correctly anticipate equity holders’ future behavior. This leads to a
decrease in the value of debt and reduces the incentive to issue debt. Myers (1977)
observes that when firms are likely to go bankrupt in the near future, equity holders
may have no incentive to contribute new capital to invest in value-increasing projects.
Equity holders bear the entire cost of the investment, but the returns from the
investment may be captured mainly by the debt holders (“debt overhang”).
On the other hand, some agency theories favor higher debt. For example, Jensen
(1986) argues that debt improves the discipline of an entrenched manager (so called
“debt and discipline” theory).
3.2.4. Flexibility theory of capital structure and life cycle theory of capital structure.
Firms in the development stage have little favorable track record (i.e., credit
ratings) of borrowing (Diamond, 1991) and are most likely to be turned down for
credit when they need it the most. Thus, firms in the development stage that have little
financial flexibility will abstain from issuing risky debt and will instead issue equity.
Firms in the maturity stage begin generating positive earnings and have more
financial flexibility than developing firms. Accordingly, these firms rely more on debt
11
financing to fund their investments as they face less financing constraints and as they
expect to repay their debt with growing future earnings.
Flexibility theory finds some support in empirical studies (Byoun, 2008) and
managers’ surveys (Graham and Harvey, 2001). This theory helps to explain why
small and risky firms issue equity and why these firms do not follow pecking-order
theory. Gamba and Triantis (2008) develop a theoretical model that analyzes optimal
capital structure policy for a firm that values flexibility in the presence of personal
taxes and transaction costs. The importance of financial flexibility as compared to
major theories of capital structure remains an open question. More work that
compares flexibility theory with other theories is expected. Also it was noted that
many young firms especially venture firms do not issue common equity but rather
convertible preferred equity which resembles debt more than equity.
Life cycle theory of capital structure argues that besides financial flexibility
there are other factors which can explain financing patterns of firms in different stages
of their development (Damodaran, 2003). Start-up firms do not have much profit, so
the tax advantage of debt is not as important as for a mature firm. The start-up firms
do not require incentives for managers since there is no large separation between
ownership and management like in the case of big public corporations. This leads to
the idea that mature firms value debt more compared to start-up firms. To what extent
the life cycle theory represents a separate theory of capital structure rather than a
combination of arguments from other theories remains an open question.
4. Method of research.
The choice of case study approach is motivated by the following. First, there are a
number of researchers calling for more case studies in capital structure management
(Graham and Harvey, 2001). Second, case study is an effective way of research in areas
which include several layers of analysis and different approaches and theories. Section
3 suggests that capital structure management represents such an area. There is a lot of
competing theories of capital structure. Furthermore one of our main objectives is to
find firms’ optimal capital structure policies (as opposite to existing policies). Some of
12
the theories are better formalized and make it more simple for managers to use in real
life situations (such as trade-off theory) while others are far from that (such as
asymmetric information). The case study is simply the best research strategy because
the problem under study is to reach understanding in a complex context (Singleton,
Straits, and Straits (1993), Mertens (1998)). Campbell (1989) advocates a case study
design for investigating real-life events, including organizational and managerial
processes. Third, available sample for capital structure management analysis of large
companies is small so our sample covers a good fraction of firms.
We analyze companies’ capital structure using the following questions (see Miglo
(2010) for more details).
1. What is the firm’s current debt/equity ratio?
2. Is the firm’s debt/equity ratio low or high compared with other firms at the same
industry or related industries?
3. Is the firm’s current debt/equity ratio explained by the firm’s financial policy or
by the current market conditions?
4. What is the firm’s optimal capital structure according to WACC (weighted
average cost of capital) approach?
5. If current debt/equity ratio different from optimal, then what factors, which are
not taken into consideration in the spreadsheet analysis may explain this difference?
When working on above questions we use spreadsheet analysis along with capital
structure theories. These theories are Pecking-Order Theory, Trade-Off Theory,
Agency Cost, Flexibility and some others described in previous chapter.
Questions 1, 2 and 4 deal with financial calculations. By doing so, we can find out
the company’s Debt/Equity Ratio and its WACC. WACC is the expected return on all
of a company’s securities. It is calculated by multiplying the cost of each capital
component by its proportional weight and then summing:
WACC= (E/V)rE+ (D/V)rD(1-TC)
Here D and E are the market value of the firm’s debt and equity, V=D+E is the
firm’s total market value, rD and rE are the cost of debt and equity, and TC is the
marginal corporate tax rate. We take tax into consideration, since interest paid on a
13
firm’s borrowing can be deducted from taxable income, which is the so called tax
benefit.
To get the optimal capital structure, we change D/(D+E) ratio from 0% to 100%
as hypotheses, and calculate several financial parameters for different ratios. Then
we find one that has minimal WACC and respectively maximal market value for the
firm.
More specifically, we first calculate β:
β=[1+(1- TC)D/E] β04
Then, we calculate rE and rD by the following equations:
rE=Current Short Term Government Rate + β×Risk Premium
rD=Risk-Free Interest + Default Premium5
Then, we calculate the WACC based on the equation above, list all the WACC for
different D/(D+E) ratios, and finally find the minimum WACC from the list which
corresponds to the optimal capital structure.
With regard to question 3, we usually look at the firm’s debt/equity ratio over the
last few years. We find for example, that the Oracle’s D/E ratio was growing from
2005 to 2008. With a further study, we believe a part of the reason for the growing
D/E ratio is Oracle’s financial policy, when the company aggressively purchased
several competitors during that period and accumulated a large amount of debt.
As to question 5, we find that the optimal debt/equity ratio (based on spreadsheet
analysis) of eBay’s is significantly higher than its current ratio. We suggest that this
happened because high bankruptcy cost of the industry and the needs for flexibility
for future financing are not taken into consideration in the WACC approach. We hold
the view that eBay invested so much money, time and effort to develop specific
products, that the consequence can be very serious if it fails due to a large amount of
debt. The primary reason is the company’s large proportion of intellectual property
which cannot be quickly converted to cash in a financial distress situation. Moreover,
4 This is Ito formula. β0 refers to the “unlevered” beta of the company. 5 Default premium depends on the company’s credit rating that ranges from AAA to D. It depends in
turn on such parameters as interest coverage ratio.
14
the e-commerce industry is still in its growth stage, the future financing requirements
of the industry are unknown, therefore issuing stocks to finance today’s capital needs
leaves firms with more flexibility for future financing than borrowing money.
We also find that the agency cost for Microsoft is relatively low, and we explain
this phenomenon by pointing out that the biggest shareholder of Microsoft – Bill
Gates – has been deeply involved in company’s management. When there are fewer
conflicts between managers and shareholders, there would be less agency cost.
We use an excel file that is divided into following parts6: Inputs, Operating lease
information, Debt, Tax rate, and Calculations. Inputs part has three components,
financial information, market information, and general market data. Financial
information includes earnings before interest, taxes and depreciation (EBITDA) and
depreciation and amortization. Market information includes number of shares
outstanding, market price per share, Beta of the company. Current long-term
government bond rate, short-term interest rate, risk premium, and country default
spread are in the general market data.
Operating lease expenses are really financial expenses, and should be treated as
such. Accounting standards allow them to be treated as operating expenses. In this
part, we convert commitments to make operating leases into debt and adjust the
operating income accordingly, by adding back the imputed interest expense on this
debt.
In the debt part, we find each company’s book value and market value of debt.
In each kind of value, we find companies’ bank medium-term debt, bank long-term
debt, bonds, unsecured debentures and notes, senior debt securities, senior
medium-term notes, subordinated medium-term notes, and other notes. Then, based
on firms’ income statement, we find their earnings before tax and provision for taxes
in the recent three years. Then we calculate their average tax rate in three years.
The calculation part includes the following parts:
1. Input data;
6 For more details, see Appendix 2-6.
15
2. Interest coverage ratios, rating of debt, default spreads, interest rates and
probabilities of default.
3. Current situation;
4. Capital structure and cost of capital calculation;
5. Main results.
We find most data about the company (earnings, expenditures, depreciation etc.)
from yahoo finance and edumarketinsight website (educational version of Standard
and Poors data base) for which we had passwords provided together with textbooks
(usually it was “Principles of corporate finance” by Brealey and Myers). Default
spreads, risk premiums and other information for point 2 could be found on
bondsonline website or on Federal Reserve website. Points 3-5 represent calculations.
We calculate D/(D+E) ratio, Beta of the firm, cost of equity, cost of debt,
WACC, market value of firm, and market price/share.
5. Examples of company capital structure analysis
We divide all companies into two groups, the large companies and the small
companies. The large companies are market cap larger than 1 billion dollars (for
example Google and Yahoo), and the small companies are market cap smaller than 1
billion dollars (for example Move and Look Smart). This section presents the analysis
of these companies. The following tables show calculation results.
5.1. Google
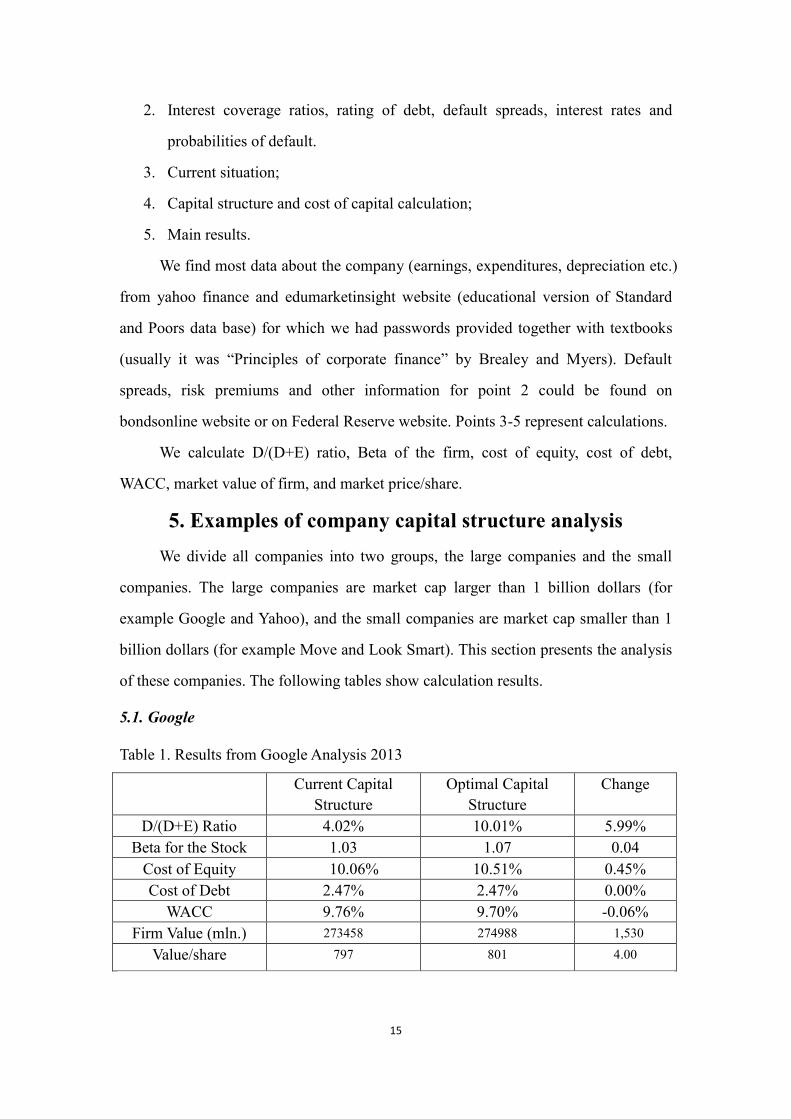
Table 1. Results from Google Analysis 2013
Current Capital
Structure
Optimal Capital
Structure
Change
D/(D+E) Ratio 4.02% 10.01% 5.99%
Beta for the Stock 1.03 1.07 0.04
Cost of Equity 10.06% 10.51% 0.45%
Cost of Debt 2.47% 2.47% 0.00%
WACC 9.76% 9.70% -0.06%
Firm Value (mln.) 273458 274988 1,530
Value/share 797 801 4.00
16
Google is a success story. Google’s mission is to organize the world’s information and
make it universally accessible and useful for generations to come. Google has a vision
of expanding their resources while keeping its edge in the market. The acquisitions of
related newborns and continuous launches of diverse and unique products indicate its
push for growth and profitability while utilizing all the available resources possible.
Google started its journey back in 1995 with having a garage office and ended up
announcing Initial Public Offering of 19,605,052 shares of Class A common stock that
took place on Wall Street on August 18, 2004 which was highly awaited decision for
public and as a result, the company’s liquidity increased. On December 31, 2004,
Google had $2,132.3 million of cash, cash equivalents and marketable securities,
compared to $334.7 million and $146.3 million at the year-ends of 2003 and 2002
respectively. Since this time Google has mainly held on to these additional cash flows
holding over $3.5 billion in cash and cash equivalents in 2005 and 2006 to the date
when Google shares jumped to an all-time high above $1,000 after the search engine
giant reported a surge in mobile and video advertising that helped drive quarterly
revenue up 23 percent in 2013.
Capital structure
Google uses more equity financing rather than debt financing as it evolved from
introductory to growing stage over the years. Google changed its debt/assets ratio
from 4.7% to 8.4% during 2010 and 2012 and now back to the 4.02% in 2013.
Google’s cash flow and profit are so strong that they can finance the business with
retained earnings.
Trade off theory states that the capital structure is the result of a trade-off
between the tax advantage of debt and higher risk and bankruptcy costs resulting from
debt financing. Spreadsheet analysis suggests that Google’s optimal debt ratio is
10.01%, however, its current debt ratio is 4.02%.
The pecking order theory implies that the company should use internal funds before
using debt and equity and should use external debt before external equity. Google uses
internal funds and equity but not debt which means Google considered going for IPO
before debt which contradicts the pecking order theory. Second, this theory implies
17
negative correlation between debt and profitability which is true as Google is making
profit although not using a lot of debt. At the time of IPO, Google had enough profits to
keep its operation running but still, rather taking more debt, Google decided to gather
funds through equity. The reasons for Google to go public were these in accordance
with “Letter from the Founders,” published in 2010. It follows from that document that
Google could restructure to get back below 500 shareholders (meaning, essentially,
find a way to buy back shares from our employees) or it could continue to be a private
company but at the same time live with having to report its financial results like any
public company or it could go public. The latter will help to create a market for firm
shares including shares belonging to employees.
On one hand, the agency cost theory favors low debt implying low bankruptcy
cost and high level of confidence for investors. This is consistent with Google’s
policies. On the other hand, the agency cost theory states higher debt is good for a
company because it can stimulate manager to perform better. This part is not
consistent with Google case. In Google’s case, the conflict between shareholders and
managers has low importance as the company is very profitable. In the long term the
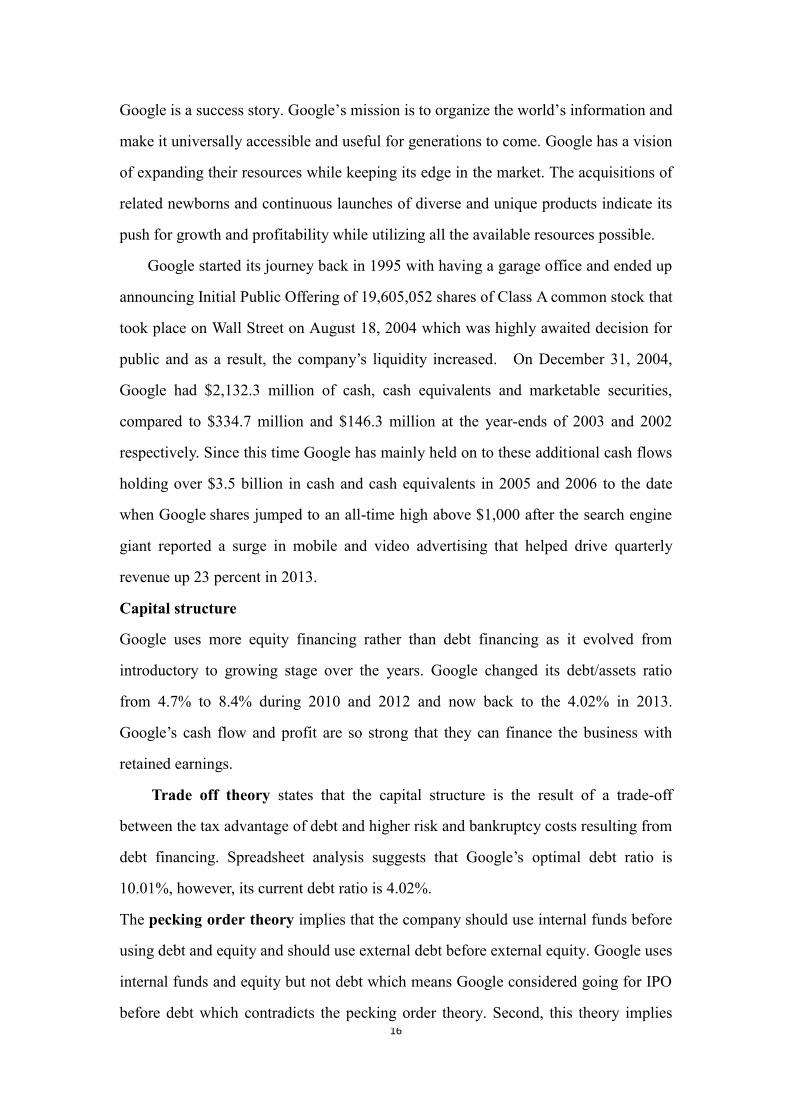
things may change. An important indicator of potential conflict between shareholders
and managers is the fraction of shares owned by managers. In Google case it is 4%
(see Table 2) that is much smaller than for example in Microsoft case. At the same the
total number of shareholders is quite large. We believe that Google use partial
ownership in terms of involvement of employees in shareholdings as a tool to
motivate personnel to perform efficiently instead of external pressure by creditors.
Although by issuing shares Google might be sharing ownership with different groups
of people, but it is avoiding the risk to let go company’s control in few hands. The
conflict between creditors and shareholders is not likely to happen because Google
has less concern for creditors issue as it has less debt. According to the Google policy,
the board of directors has an obligation to Monitor and Manage Potential Conflicts of
Interest. The Board will also ensure that there is no abuse of corporate assets or
unlawful related party transactions. One of the reasons why Google wanted to go
public rather than using debt could be to have fewer conflicts between company and
18
outsiders.
Table 2. Information about Google.
Equity GOOG
Market Cap (Mln.) 285,019
# of Institution Owners 2,800
# of Fund Owners 4,574
% Owned by Institutions 72.63
% Owned by Funds 38.47
% Owned by Insiders 0.04
As the flexibility theory and life cycle theory propose it is not beneficial for
new firms to use debt financing, they rely more on equity to make their operations
smooth at early stage of their existence so they are considered more flexible. Google
expansion and growth business approach requires a lot of funds. Google historically
pays cash for acquisition and expansion (except YouTube deal). The initial public
offering in August of 2004 raised $1,161.1M to help the company growth. The
performance of Google while using equity as core source of financing became better
since 2004. In 2004 Google has 170, 601 shares valued at $34M and in 2005, Google
acquired nine companies and all of the assets of another six other companies for a
total amount of $130.5M of cash. Google continued with the acquisition of YouTube
in 2008, AdMob in 2010, Zagat in 2011, Motorola Mobility in 2012 and Waze in
2013.
According to life cycle theory for growing and mature firms it is more likely to
have higher leverage ratio which would result in low flexibility. It is opposite in
Google’s case as it does not use a lot of debt. The Debt/equity ratio for Google in
2004 was higher than in 2013.
The signaling theory states that from the investors’ perspective, the market
reaction on issuance of debt is neutral and of equity is negative. In Google’s case,
the issuance of shares at different stages made it successful and profitable so it’s a
different outcome of the signaling theory.
http://www.linkedin.com/today/post/article/20130913153717-7298-when-google-went-public
19
5.2. Yahoo! Inc.
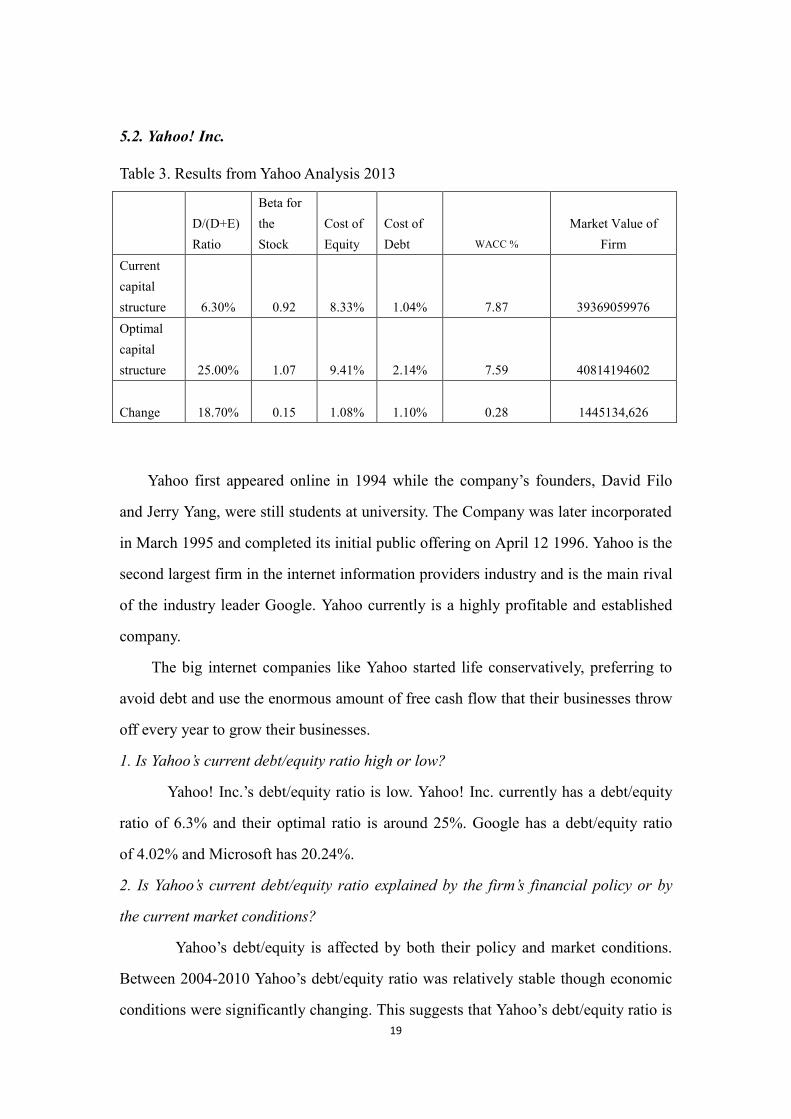
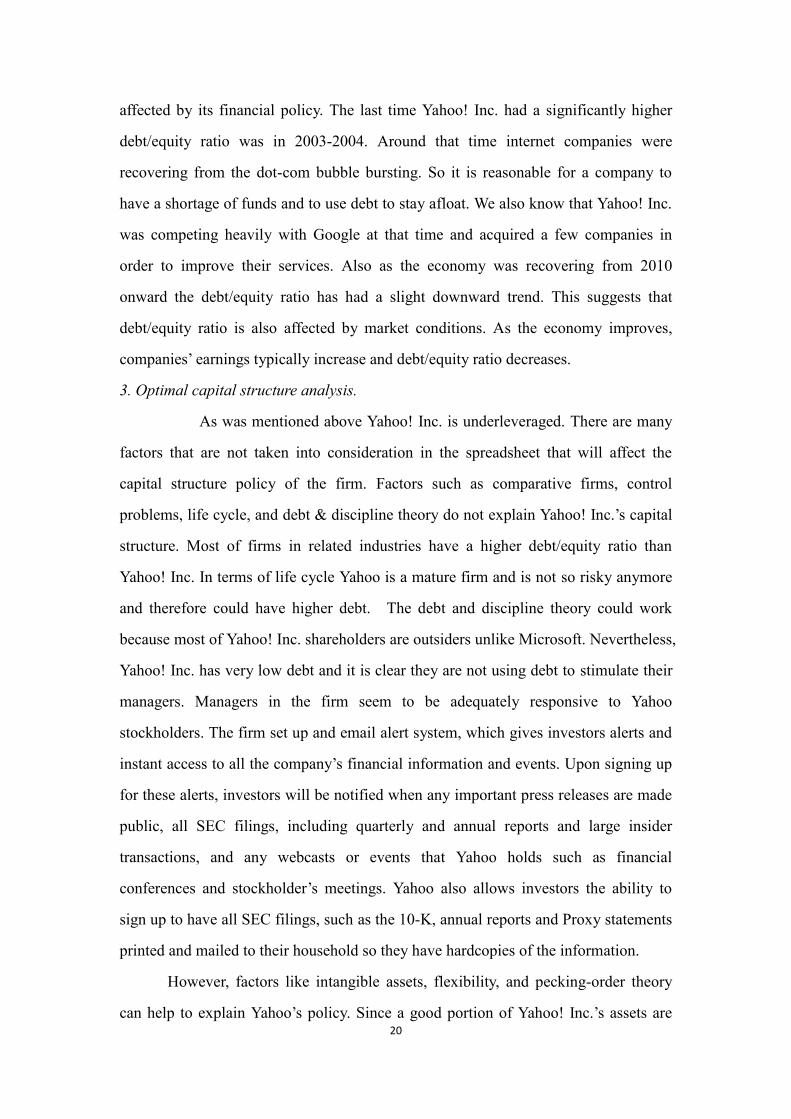
Table 3. Results from Yahoo Analysis 2013
D/(D+E)
Ratio
Beta for
the
Stock
Cost of
Equity
Cost of
Debt WACC %
Market Value of
Firm
Current
capital
structure 6.30% 0.92 8.33% 1.04% 7.87 39369059976
Optimal
capital
structure 25.00% 1.07 9.41% 2.14% 7.59 40814194602
Change 18.70% 0.15 1.08% 1.10% 0.28
1445134,626
Yahoo first appeared online in 1994 while the company’s founders, David Filo
and Jerry Yang, were still students at university. The Company was later incorporated
in March 1995 and completed its initial public offering on April 12 1996. Yahoo is the
second largest firm in the internet information providers industry and is the main rival
of the industry leader Google. Yahoo currently is a highly profitable and established
company.
The big internet companies like Yahoo started life conservatively, preferring to
avoid debt and use the enormous amount of free cash flow that their businesses throw
off every year to grow their businesses.
1. Is Yahoo’s current debt/equity ratio high or low?
Yahoo! Inc.’s debt/equity ratio is low. Yahoo! Inc. currently has a debt/equity
ratio of 6.3% and their optimal ratio is around 25%. Google has a debt/equity ratio
of 4.02% and Microsoft has 20.24%.
2. Is Yahoo’s current debt/equity ratio explained by the firm’s financial policy or by
the current market conditions?
Yahoo’s debt/equity is affected by both their policy and market conditions.
Between 2004-2010 Yahoo’s debt/equity ratio was relatively stable though economic
conditions were significantly changing. This suggests that Yahoo’s debt/equity ratio is
20
affected by its financial policy. The last time Yahoo! Inc. had a significantly higher
debt/equity ratio was in 2003-2004. Around that time internet companies were
recovering from the dot-com bubble bursting. So it is reasonable for a company to
have a shortage of funds and to use debt to stay afloat. We also know that Yahoo! Inc.
was competing heavily with Google at that time and acquired a few companies in
order to improve their services. Also as the economy was recovering from 2010
onward the debt/equity ratio has had a slight downward trend. This suggests that
debt/equity ratio is also affected by market conditions. As the economy improves,
companies’ earnings typically increase and debt/equity ratio decreases.
3. Optimal capital structure analysis.
As was mentioned above Yahoo! Inc. is underleveraged. There are many
factors that are not taken into consideration in the spreadsheet that will affect the
capital structure policy of the firm. Factors such as comparative firms, control
problems, life cycle, and debt & discipline theory do not explain Yahoo! Inc.’s capital
structure. Most of firms in related industries have a higher debt/equity ratio than
Yahoo! Inc. In terms of life cycle Yahoo is a mature firm and is not so risky anymore
and therefore could have higher debt. The debt and discipline theory could work
because most of Yahoo! Inc. shareholders are outsiders unlike Microsoft. Nevertheless,
Yahoo! Inc. has very low debt and it is clear they are not using debt to stimulate their
managers. Managers in the firm seem to be adequately responsive to Yahoo
stockholders. The firm set up and email alert system, which gives investors alerts and
instant access to all the company’s financial information and events. Upon signing up
for these alerts, investors will be notified when any important press releases are made
public, all SEC filings, including quarterly and annual reports and large insider
transactions, and any webcasts or events that Yahoo holds such as financial
conferences and stockholder’s meetings. Yahoo also allows investors the ability to
sign up to have all SEC filings, such as the 10-K, annual reports and Proxy statements
printed and mailed to their household so they have hardcopies of the information.
However, factors like intangible assets, flexibility, and pecking-order theory
can help to explain Yahoo’s policy. Since a good portion of Yahoo! Inc.’s assets are
21
intangible it has a higher risk and higher bankruptcy costs. The company should not
have as much debt as other companies with more tangible assets. This could be one
reason that explains Yahoo! Inc.’s lower than optimal debt/equity ratio. Also Yahoo
has made good investments in the past, which was only possible because of the
flexibility the company had. Yahoo! Inc. has bought and resold several companies.
One of the most recent and successful investment projects was the investment in
Alababa Group.
The pecking-order theory could explain why it does not have much debt.
According to the pecking-order theory managers prefer to use internal funds to
finance investments if possible over debt and equity. Therefore if the company had
enough internal funds to support its investments it never had much need for debt.
Yahoo has other deductions to reduce the tax bite. The main one being
depreciation of $481M. This might be another reason as to why Yahoo! Inc. has
decided to not take so much debt. The depreciation definitely helps to soften the effect
of taxes. Following the trade-off theory Yahoo! Inc. might believe that their tax shield
is sufficient and their risk of bankruptcy is too costly and outweighs the use of more
debt.
How easy is it for bondholders to observe what equity investors are doing? Are the
assets tangible or intangible? If not, what are the costs in terms of monitoring
stockholders or in terms of bond covenants?
It is relatively easy for bondholders to observe what equity investors are doing
because the information is easily found in the 10-K and the other quarterly reports.
The firm has both tangible and intangible assets. According to the company’s balance
sheet, goodwill and intangible assets account for $5,132,210,000 of their total
$14,905,795,000 worth of assets so there is a fairly even breakdown of intangible and
tangible assets. Throughout 2012, Yahoo continued to purchase more intangible assets,
such as intellectual property rights and developed technology, which saw amortization
expenses for the company rise 7% compared to the year before.
How well can this firm forecast its future investment opportunities and needs?
How much does it value flexibility?
22
The firm values flexibility very much. As recently as the end of the third quarter
of 2013, Yahoo generated free cash flow of $249 million and returned an
additional $1.7 billion to shareholders through buybacks. Their balance sheet had $3.2
billion in cash and securities, which made them well positioned with ample liquidity
to fund future investments for growth. Yahoo has more than $4.5 billion dollars of
long-term investments alone according to their balance sheet for the end of quarter
three. With more than $3.2 billion in cash and securities, they have a lot of financial
flexibility should any good opportunities arise for them to make smart investments
regarding their future.
4. Recommendations regarding firm’s capital structure.
The main recommendation we can make regarding the firm’s capital structure
would be to add more debt. Following the idea that debt does indeed add discipline to
a company and to the company’s managers, Yahoo has room to add more debt and still
be able to deal with it comfortably, while it gives them incentive to work harder,
invest smarter and grow more rapidly in the future. Looking at Yahoo’s total debt of
roughly $121,000,000 and comparing that to companies in the same industry, such as
Microsoft and Google, who have debts of $16 billion and $7 billion dollars
respectively, Yahoo’s debt is far less than both of them. From seeing the rapid growth
of Google into one of the largest companies in the world, with a stock price of over
$1,000, Yahoo may want to look into a larger debt as that may be one of the reasons
why Google is growing at such a rapid pace and why their stock prices have
skyrocketed in recent times.
Of course there would be negative results that come from raising the debt as
well (especially if debt is raised by too much), such as higher risk of bankruptcy
(higher bankruptcy costs), less flexibility. In addition, too much debt could lead to
problems like debt overhang. All considered we still believe the benefits outweigh the
risks and Yahoo! Inc. needs to use more debt as part of the capital structure.
5.3. Look Smart.
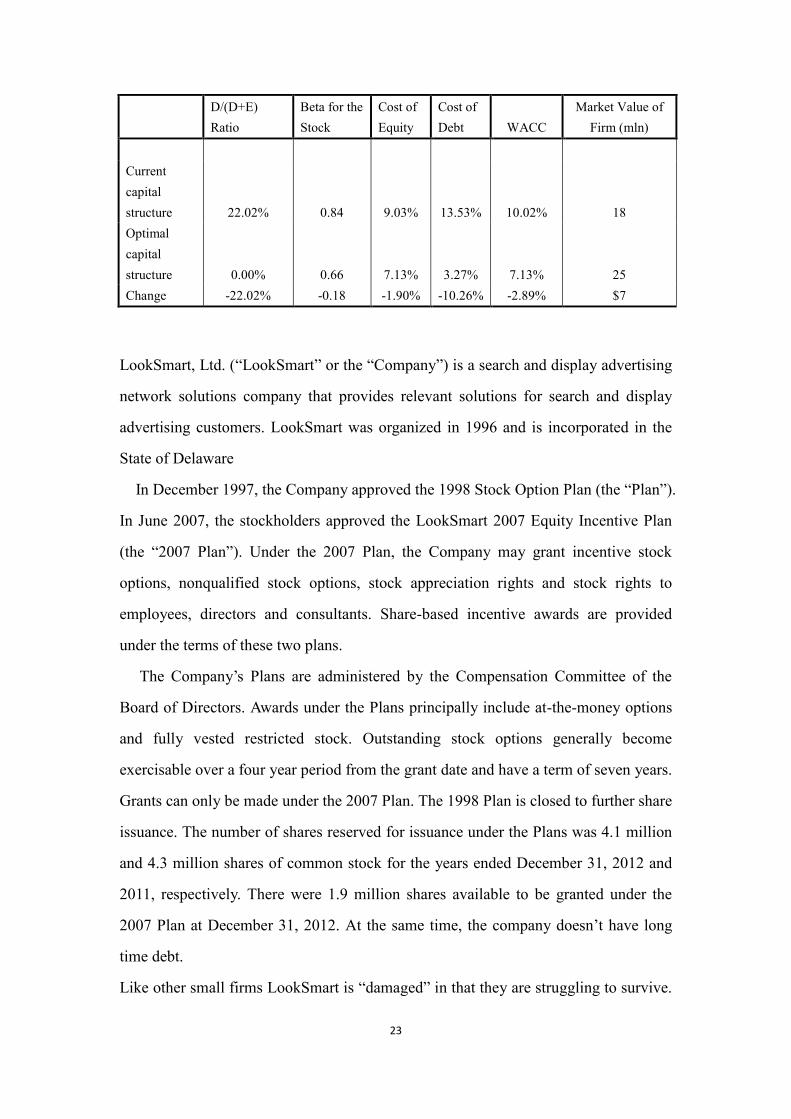
Table 4. Results for LookSmart.
23
D/(D+E)
Ratio
Beta for the
Stock
Cost of
Equity
Cost of
Debt WACC
Market Value of
Firm (mln)
Current
capital
structure 22.02% 0.84 9.03% 13.53% 10.02% 18
Optimal
capital
structure 0.00% 0.66 7.13% 3.27% 7.13% 25
Change -22.02% -0.18 -1.90% -10.26% -2.89% $7
LookSmart, Ltd. (“LookSmart” or the “Company”) is a search and display advertising
network solutions company that provides relevant solutions for search and display
advertising customers. LookSmart was organized in 1996 and is incorporated in the
State of Delaware
In December 1997, the Company approved the 1998 Stock Option Plan (the “Plan”).
In June 2007, the stockholders approved the LookSmart 2007 Equity Incentive Plan
(the “2007 Plan”). Under the 2007 Plan, the Company may grant incentive stock
options, nonqualified stock options, stock appreciation rights and stock rights to
employees, directors and consultants. Share-based incentive awards are provided
under the terms of these two plans.
The Company’s Plans are administered by the Compensation Committee of the
Board of Directors. Awards under the Plans principally include at-the-money options
and fully vested restricted stock. Outstanding stock options generally become
exercisable over a four year period from the grant date and have a term of seven years.
Grants can only be made under the 2007 Plan. The 1998 Plan is closed to further share
issuance. The number of shares reserved for issuance under the Plans was 4.1 million
and 4.3 million shares of common stock for the years ended December 31, 2012 and
2011, respectively. There were 1.9 million shares available to be granted under the
2007 Plan at December 31, 2012. At the same time, the company doesn’t have long
time debt.
Like other small firms LookSmart is “damaged” in that they are struggling to survive.
24
LookSmart is plagued with cutbacks, legal actions and loss of their consumer base
which lower revenues and increase expenses. This company is very high in risk and
has very little support from potential investors and creditors. These companies have
little access to loans and have exhausted their equity opportunities and must survive
through private placements which are low in cost and custom-designed for the
company.
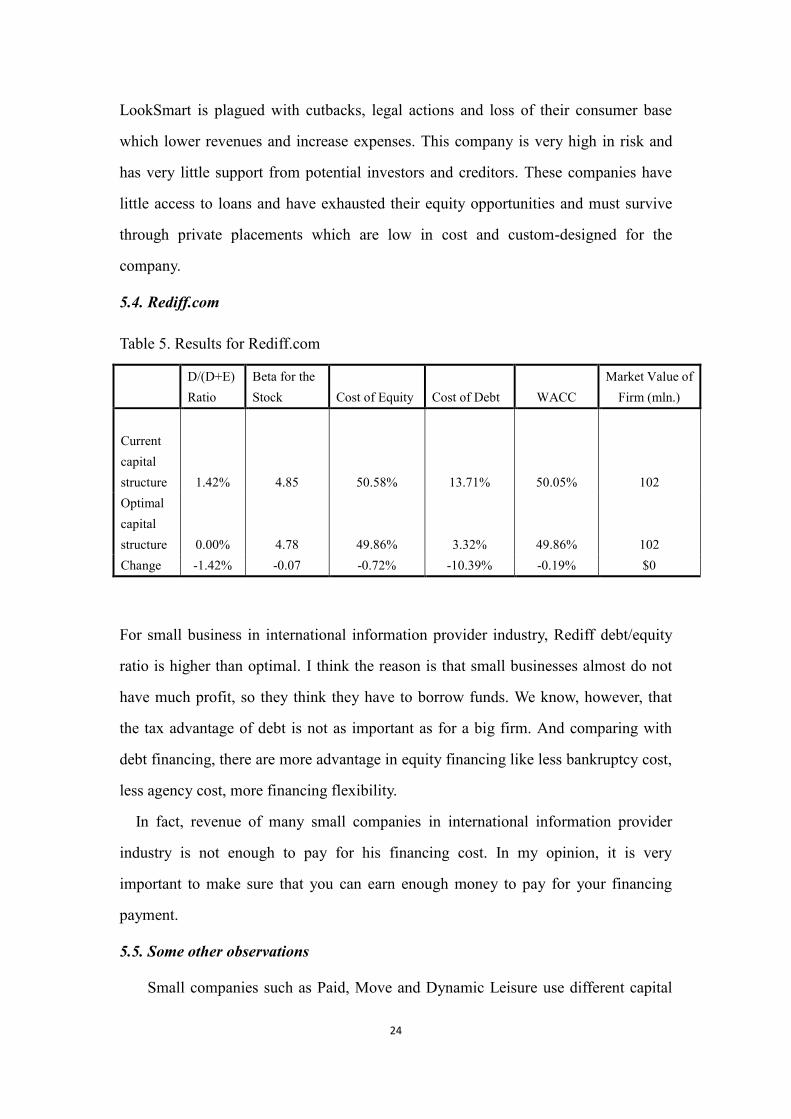
5.4. Rediff.com
Table 5. Results for Rediff.com
D/(D+E)
Ratio
Beta for the
Stock Cost of Equity Cost of Debt WACC
Market Value of
Firm (mln.)
Current
capital
structure 1.42% 4.85 50.58% 13.71% 50.05% 102
Optimal
capital
structure 0.00% 4.78 49.86% 3.32% 49.86% 102
Change -1.42% -0.07 -0.72% -10.39% -0.19% $0
For small business in international information provider industry, Rediff debt/equity
ratio is higher than optimal. I think the reason is that small businesses almost do not
have much profit, so they think they have to borrow funds. We know, however, that
the tax advantage of debt is not as important as for a big firm. And comparing with
debt financing, there are more advantage in equity financing like less bankruptcy cost,
less agency cost, more financing flexibility.
In fact, revenue of many small companies in international information provider
industry is not enough to pay for his financing cost. In my opinion, it is very
important to make sure that you can earn enough money to pay for your financing
payment.
5.5. Some other observations
Small companies such as Paid, Move and Dynamic Leisure use different capital
25
structures. Paid, Inc. engaged in multiple long-term convertible notes to help fund the
development and launch of a new service which will provide them enough revenue so
they need not outsource for future financing. Move uses long-term debt for long-term
capital leases and Dynamic Leisure Corp. was bought out by another company which
took out a long-term loan shortly after to fund a growth-through-acquisition strategy.
All three companies struggle to earn profits or have none at all which makes risky
companies that do not benefit by the trade-off associated with debt financing.
Creditors are in the business to make money from lending theirs and are not interested
in making risky or faulty investments. Debt-financing opportunities for Paid, Move
and Dynamic are limited and costly and may hinder their future operations through
putting strains on cash flows and restricting investments.
We observe that many of these small companies in their infancy stages are
undergoing rapid growth and with it, large losses as all funds are being tunneled into
investments and development. These companies bankruptcy costs outweigh tax
benefits for potential loans the debt will be associated with high interest rates and
restrictive covenants to protect the creditors. Secondly, a small number of the firms
are “damaged” in that they are struggling to survive. Some of these companies such as
LookSmart are plagued with cutbacks, legal actions and loss of their consumer base
which lower revenues and increase expenses. Aptimus and others suffered during the
tech crash of early 2000 which diminished the value high expectations for some of the
firms. These companies are very high in risk and have very little support from
potential investors and creditors. These companies have little access to loans and have
exhausted their equity opportunities and must survive through private placements
which are low in cost and custom-designed for the company.
7. Summary of Analysis and Recommendations
1. Our analysis shows that most large companies in the Internet industry are
underleveraged. Low debt ratio is hurting the companies’ profitability. In recent
years some companies began to realize that using tax shields can be beneficial.
However, they use other ideas than debt tax shield. Google, for instance, has been
26
paying taxes in countries with lower tax rates for last 4 years. We think that one of the
reasons why managers do not use debt tax shield is that they think that the capital cost
of using internal funds is lower than issue debt. Based on this view, managers will
overuse the internal funds. For those companies, our recommendation will be issue
more debt to increase the companies’ profitability. There are also some natural
reasons for not using debt. These may include agency cost of debt and loss of
flexibility. However, many companies are underleveraged even taking other factors
into consideration.
2. Most small companies in the Internet industry are overleveraged. So they should
have less debt. For some small companies, the cost of issuing new equity is naturally
very high (asymmetric information problems). However, many companies
underestimate long-term problems of carrying too much debt mostly flexibility loss.
Also we think it is a good idea to use preferred stocks.
3. Third, internet companies can use international financing more efficiently.
International debt has advantages not just for governments but for corporations and
individuals as well. Corporations can raise international debt in different currencies.
The currency differential doesn’t just diversify risk, it helps to shop for lower interest
rates in a limitless international market. Rates in international markets are normally
lower than domestic sources of capital. This is largely because there are many major
firms and banks involved in these transactions, creating an inherent stability in the
market. In addition, given the fact that there are many currencies involved in many
transactions, the overall risk is lower to the lending institution, since any fluctuations
in the currencies and the local markets are balanced out by the others. Also
international market have greater flexibility. International capital markets like
euro-currency are under no capitalization restrictions. This means there are no
required reserves for all institutions to maintain to cushion their risk. As a result, these
markets can lend 100 percent of their deposits, which is possible given the lack of risk
in comparison to purely domestic institutions. Given the fact that international trade
continues to grow, international markets continue to appear as a good bet to hedge
against the possibility of local currency appreciation or market recessions. Finally,
27
access to global capital markets can allow a firm to reduce its cost of capital.
Companies seek a lower cost of capital through mergers and acquisitions, foreign
direct investment, and other global activities. A competitive cost of capital depends on
firm-specific characteristics that attract international portfolio investors and the
liberalization of markets where companies have the freedom to source capital in liquid
markets.
4. Using one theory cannot explain all capital structure strategies of Internet
industry companies. We should use multiple theories to explain the capital structure in
this industry. We find that the optimal capital structure determined by the trade-off
theory (spreadsheet analysis) usually differs from the actual financing mix we observe
in the industry. The pecking order theory can explain why small firms with no large
cash reserves prefer debt to equity and why well-established and financially healthy
firms do not use external financing. It fails to explain, however, why most companies
(especially young and/or growing companies with large expansionary expenditures)
prefer large equity issues to bond issues or even other types of debt. Signaling theory
of capital structure cannot explain why most internet firms do not use debt as a signal
of firm quality. The market timing hypothesis provides good explanations for timing
of firms IPOs. For example, nearly all companies issue equity through public
offerings at opportune times, most notably during the “tech craze” or “dot.com
bubble” of the late 1990s. We also see firms undergo public offerings when the market
has recovered from the tech crash of 2000 or at other times when management feels
their stock is overvalued. We see companies make stock repurchases at windows of
opportunities where they believe their stock is undervalued. We feel however, that
from a broader point of view, the market timing theory is limited in explaining firm’s
capital structure besides IPO decision.
5. Flexibility is underexplored area. Both equity and debt holders do place value on
flexibility, especially in the recent years of turmoil in capital markets. Managers
surveys show that managers value flexibility when choosing their capital structures.
We think new quantitative approaches in valuing flexibility should be developed.
Managers are also concerned about credit ratings, as observed anecdotally in the press
28
and through survey results. Future capital structure research would benefit from
including credit ratings as part of the capital structure framework, to obtain a more
comprehensive depiction of capital structure behavior.
6. Theories of capital structure should take into account that it’s been a shift from
shareholders value maximization strategy to stakeholders value optimization. We
think that internet companies demonstrate shift from shareholders value maximization
strategy to stakeholders value optimization. One of the dramatic changes created by
the expanding global economy is the increase in the rate of change within industries.
As more industries are experiencing greater levels of change, we will find the use of
Equity-centered governance will prove less effective in the near future. We feel that
this aspect of behavior is undeveloped especially in North America versus Europe for
example. The first duty of managers is to ensure the long-term survival of the
organization within its competitive environment. In a world devoted to quick fixes,
and short-term thinking edited by sound bites, it is difficult to take time to think
through serious challenges. As environments become more competitive, those who
make the time to reach appropriate decisions will be the ones left standing.
7. We feel that the Traditional Theories have a lot of room for improvement. The
pecking order theory cannot explain why many firms in internet industry do not prefer
debt over equity. We feel that recent papers about dynamic pecking order theory are
promising where managers may sometime find attractive to issue equity (see, for
example, Miglo (2008)). Next, one needs to develop Dynamic versions of Trade-Off
Theory of Capital structure. Constructing models that recognize the role of time
requires specifying a number of aspects that are typically ignored in a single-period
model. Of particular importance are the roles of expectations and adjustment costs.
In the future, financial economists need to continue developing dynamic versions of
each theory or to develop new models that incorporate both trade-off and pecking
order ideas. More research may be required to create new models that can compete
with trade-off and pecking order theories.
8. Finally, a popular line of inquiry based on surveys of managers about their capital
structure decisions seems to be promising. For example, Graham and Harvey (2001)
29
report a large gap between theory and practice.
9. In terms of debate about future development of capital structure theory, we disagree
with Harris and Raviv (1991) opinion that asymmetric information theories are less
promising. We feel that existing asymmetric information theories are not sufficient
and this is the reason why these theories have less support than the trade-off theory
among managers and students. We find that asymmetric information is important in
explaining many patterns of capital structure behavior of internet companies but
managers do not have a practical tool to use it more efficiently. At the same time
given that the gap between theory and practice is very large, we agree with Harris and
Raviv (1991) in that the door is still widely open for new theory of capital structure
which can be helpful to make a bridge between managers and students which can be
helpful to the future students to know more clear about capital structure.
8. Conclusions
We analyze the financing decisions and capital structure of internet companies and
relate observed findings to the common capital structure theories. Large internet
companies usually have low debt and small internet companies have high debt. We
find that the trade-off theory of capital structure, pecking order theory, market timing
theory and other theories cannot individually determine a firm’s capital structure and
their use of sources of financing accurately but can compliment each other to help
explain observed behavior. We also suggest a number of recommendations for capital
structure theory and practice.
REFERENCES
Almeida, Heitor, and Thomas Philippon, 2007, The Risk-adjusted Cost of
Financial Distress, Journal of Finance 62(6), 2557-2586.
Altinkilic, Oya and Robert Hansen, (2000), Are There Economies of Scale in
Underwriting Fees? Evidence of Rising External Financing Costs. Review of
Financial Studies 13(1), 191-218.
Antweiler, Werner, and Murray Z. Frank, (2006), Do U.S. Stock Markets
Typically Overreact to Corporate News Stories? Working Paper, University of British
Columbia and University of Minnesota.
30
Baker Kent H., Gary E. Powell, and E. Theodore Veit, (2003), Why
Companies Use Open-Market Repurchases: A Managerial Perspective, Quarterly
Review of Economics and Finance 43(3), 483-504.
Baskin, J. (1989). An empirical investigation of the pecking order hypothesis.
City University of New York.
Bertus, Mark, John S. Jahera Jr., and Keven Yost, (2008), Capital Structure,
Corporate Governance, and the Effect of Sarbanes-Oxley, Corporate Ownership and
Control. Forthcoming.
Bharath, Sreedhar, Paolo Pasquariello, and Guojun Wu, (2008), Does
Asymmetric Information Drive Capital Structure Decisions? Review of Financial
Studies 22(8), 3211-3243.
Brealey, R. A, Stewart C. & Myers F. A. (2006). Principles of Corporate
Finance (8th
Ed.) NY: McGraw-Hill/Irwin
B.S Program details (2010). Retrieved October 21, 2010 from
http://www.bridgeport.edu/academics/undergraduate/businessadminbs/default.aspx
Byoun, Soku, (2008), Financial Flexibility and Capital Structure Decision,
working paper. Available at SSRN: http://ssrn.com/abstract=1108850
Campbell, D. E. & Kelly, J. S. Social Choice and Economic Theory.
Retrieved September 18, 2010 from http://www.jstor.org/pss/2117871
Chang, Xin, and Sudipto Dasgupta, (2007), Target Behavior and Financing:
How Conclusive Is the Evidence, Journal of Finance 64(4), 1767-1796.
Chirinko, Robert, and Anuja Singha, (2000), Testing Static Trade-off Against
Pecking Order Models of Capital Structure: A Critical Comment, Journal of Financial
Economics 58(3), 417-425.
Choe, Hyuk, Ronald Masulis, and Vicram Nanda, (1993), Common Stock
Offerings across the Business Cycle, Journal of Empirical Finance 1(1), 1-29.
Damodaran, Aswath. Corporate Finance: Theory and Practice (Wiley Series in
Finance), 2003.
Diamond, Douglas W, (1991), Monitoring and Reputation: The Choice
between Bank Loans and Directly Placed Debt, Journal of Political Economy 99(2),
689-721.
D’Mello, Ranjan, and Stephen P. Ferris, (2000), The Information Effects of
Analyst Activity at the Announcement of New Equity Issues, Financial Management
29(1), 78-95.
Eckbo, B. Espen, (1986), Valuation Effects of Corporate Debt Offerings,
Journal of Financial Economics 15(1), 119-151.
Financesholar.com. Modigliani & Miller (M&M Propositions I&II) – Capital
Structure of Corporations. Retrieved October 4, 2010, from
http://www.financescholar.com/30odigliani-miller-propositions.html
Fama, Eugene, and Kennett R. French, (2002), Testing Trade-off and Pecking
Order Predictions about Dividends and Debt, Review of Financial Studies 15(1), 1-33.
Frank, M. Z. & Goyal, V. K. (2003). Testing the pecking order theory of
Capital Structure. Journal of Financial Economics 67(2), 217-248
Gamba, Andrea and Triantis, Alexander J., (2008), The Value of Financial
31
Flexibility, Journal of Finance, Forthcoming.
Gordon, Roger, and Young Lee, (2007), Interest Rates, Taxes and Corporate
Financial Policies, National Tax Journal 60(1), 65-84.
Graham, John R., (2000), How Big Are the Tax Benefits of Debt? Journal
of Finance 55(5), 1901-1941.
Graham, J. R. & Harvey, C. R. (2001). The theory and practice of corporate
finance: Evidence from the field. Journal of Financial Economics 60 (2-3), 187-243.
Green, Richard, and Burton Hollifield, (2003), The Personal-tax Advantages
of Equity, Journal of Financial Economics 67(2), 175-216.
Gulflink. Survey and sample description (n.d). Retrieved November 8, 2010
from
http://www.gulflink.osd.mil/library/randrep/pesticides_survey/mr1018.12.chap2.html
Hackbarth, Dirk, (2008), Managerial Traits and Capital Structure Decisions,
Journal of Financial and Quantitative Analysis 43(4), 843-881.
Harris, M. & Raviv, A. (1991). The Theory of Capital Structure. The
Journal of Finance. 46 (1) 297-355
Investopedia, Weighted Average cost of capital. Retrieved October 11, 2010
from http://www.investopedia.com/terms/w/wacc.asp
Jain, Bharat, and Omesh Kini, (1994), The Post-Issue Operating Performance
of IPO Firms, Journal of Finance 49(5), 1699-1726.
Jensen, Michael C., (1986), Agency Costs of Free Cash Flow, Corporate
Finance, and Takeovers, American Economic Review 76(2), 323-329.
Jensen, Michael C., and William H. Meckling, (1976), Theory of the Firm:
Managerial Behavior, Agency Costs and Ownership Structure, Journal of Financial
Economics 3(4), 305-360.
Kamath, Ravindra, (1997), Long-term Financing Decisions: Views and
Practices of Financial Managers of NYSE Firms, Financial Review 32(2), 331-356.
Kayhan, Ayla, and Sheridan Titman, (2007), Firms’ Histories and Their
Capital Structures, Journal of Financial Economics 83(1), 1-32.
Klein, Linda Schmid, O’Brien, Thomas J. and Peters, Stephen R (2002),
Debt vs. Equity and Asymmetric Information: A Review. The Financial Review 37(3),
317-350.
Kraus, Alan, and Robert H. Litzenberger, (1973), A State-preference Model
of Optimal Financial Leverage, Journal of Finance 28(4), 911-922.
Leary, Mark T., and Michael R. Roberts, (2010), The Pecking Order, Debt
Capacity, and Information Asymmetry, Journal of Financial Economics 95(6),
332-355.
Leland, Hayne E., and David H. Pyle, (1977), Information Asymmetries,
Financial Structure, and Financial Intermediation, Journal of Finance 32(2), 371-378.
Lemmon, Michael L., and Jaime F. Zender, (2008), Debt Capacity and Tests
of Capital Structure Theories, Working Paper, University of Utah and University of
Colorado.
Loughran, Tim, and Jay R. Ritter, (1997), The Operating Performance of
Firms Conducting Seasoned Equity Offerings, Journal of Finance 52(5), 1823-1850.
32
Malmendier, Ulrike, Geoffrey A. Tate, and Jun Yan, (2005), Corporate
Financial Policies with Overconfident Managers, Working Paper, Stanford University
and University of Pennsylvania.
Masulis, Ronald W., (1980), The Effects of Capital Structure Change on
Security Prices: A Study of Exchange Offers, Journal of Financial Economics 8(2),
139-177.
Masulis, Ronald, and Ashok Korwar, (1986), Seasoned Equity Offerings:
An Empirical Investigation, Journal of Financial Economics 15(1), 91-118.
Mello, A. S. & Parsons, J. E. (1992). Measuring the Agency cost of debt.
Journal of Finance 47 (5), 1887-904.
Miglo, A. (2011). Trade-off, pecking order, signaling and market timing
models. Ch. 10 In Capital Structure and Corporate Financing Decisions, Ed. Baker K.,
and G. Martin. Wiley.
Miglo, A. (2010). Capital structure theory: where do we stand after crisis?
University of Bridgeport working paper.
Mikkelson, Wayne H., M. Megan Partch, and Kshitij Shah, (1997),
Ownership and Operating Performance of Companies that Go Public, Journal of
Financial Economics 44(2), 281-307.
Modigliani, Franco, and Merton H. Miller, (1958), The Cost of Capital,
Corporate Finance and the Theory of Investment, American Economic Review 48(3),
261-297.
Molina, Carlos A., (2005), Are Firms Underleveraged? An Examination of
the Effect of Leverage on Default Probabilities, Journal of Finance 60(3), 1427-1459.
Myers, Stewart C., (1977), Determinants of Corporate Borrowing, Journal
of Financial Economics 5(2), 147-175.
Myers, Stewart C., and Nicolas S. Majluf, (1984), Corporate Financing and
Investment Decisions When Firms Have Information That Investors Do Not Have,
Journal of Financial Economics 13(2), 187-221.
Parrino, Robert, and Michael S. Weisbach, (1999), Measuring Investment
Distortions Arising from Stockholder-bondholder Conflicts, Journal of Financial
Economics 53(1), 3-42.
Rajan, Raghuram, and Luigi Zingales, (1995), What Do We Know about
Capital Structure: Some Evidence from International Data, Journal of Finance 50(5),
1421-1460.
Ross, Stephen A., (1977), The Determination of Financial Structure: The
Incentive Signaling Approach, Bell Journal of Economics 8(1), 23-40.
Sarbanes-Oxley Act, (2004), Available at
http://www.gpo.gov/fdsys/pkg/PLAW-107publ204/pdf/PLAW-107publ204.pdf.
Shah, Kshitij, (1994), The Nature of Information Conveyed by Pure Capital
Structure Changes, Journal of Financial Economics 36(2), 89-126.
Shyam-Sunder, Lakshmi, and Stewart C. Myers, (1999), Testing Static
Tradeoff against Pecking Order Models of Capital Structure, Journal of Financial
Economics 51(2), 219-244.
33
Stiglitz, J. E. (1967). A re-examination of the Modigliani-Miller Theorem.
Yale University.
Titman, Sheridan, and Roberto Wessels, (1988), The Determinants of Capital
Structure Choice, Journal of Finance 43(3), 1-21.
Wright, Stephen H., (2004), Measures of Stock Market Value and Returns
for the US Nonfinancial Corporate Sector, 1900-2002, Review of Income and Wealth
50(4), 561-584.
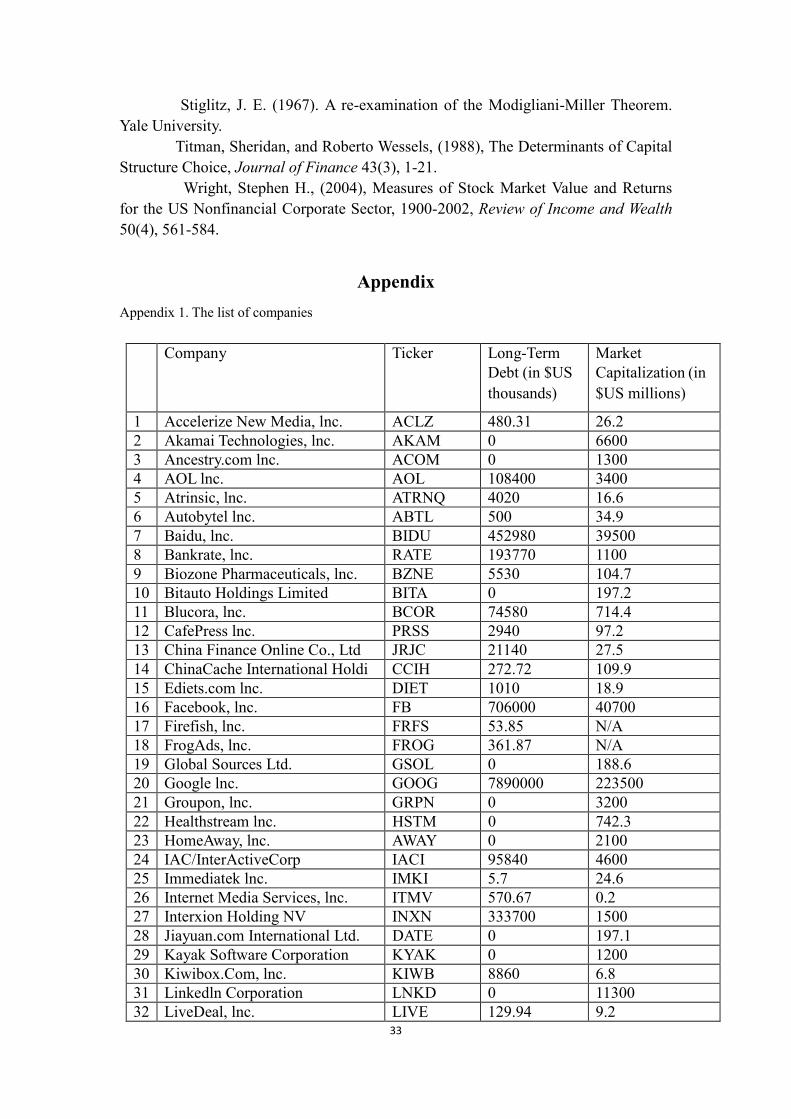
Appendix
Appendix 1. The list of companies
Company Ticker Long-Term
Debt (in $US
thousands)
Market
Capitalization (in
$US millions)
1 Accelerize New Media, lnc. ACLZ 480.31 26.2
2 Akamai Technologies, lnc. AKAM 0 6600
3 Ancestry.com lnc. ACOM 0 1300
4 AOL lnc. AOL 108400 3400
5 Atrinsic, lnc. ATRNQ 4020 16.6
6 Autobytel lnc. ABTL 500 34.9
7 Baidu, lnc. BIDU 452980 39500
8 Bankrate, lnc. RATE 193770 1100
9 Biozone Pharmaceuticals, lnc. BZNE 5530 104.7
10 Bitauto Holdings Limited BITA 0 197.2
11 Blucora, lnc. BCOR 74580 714.4
12 CafePress lnc. PRSS 2940 97.2
13 China Finance Online Co., Ltd JRJC 21140 27.5
14 ChinaCache International Holdi CCIH 272.72 109.9
15 Ediets.com lnc. DIET 1010 18.9
16 Facebook, lnc. FB 706000 40700
17 Firefish, lnc. FRFS 53.85 N/A
18 FrogAds, lnc. FROG 361.87 N/A
19 Global Sources Ltd. GSOL 0 188.6
20 Google lnc. GOOG 7890000 223500
21 Groupon, lnc. GRPN 0 3200
22 Healthstream lnc. HSTM 0 742.3
23 HomeAway, lnc. AWAY 0 2100
24 IAC/InterActiveCorp IACI 95840 4600
25 Immediatek lnc. IMKI 5.7 24.6
26 Internet Media Services, lnc. ITMV 570.67 0.2
27 Interxion Holding NV INXN 333700 1500
28 Jiayuan.com International Ltd. DATE 0 197.1
29 Kayak Software Corporation KYAK 0 1200
30 Kiwibox.Com, lnc. KIWB 8860 6.8
31 Linkedln Corporation LNKD 0 11300
32 LiveDeal, lnc. LIVE 129.94 9.2
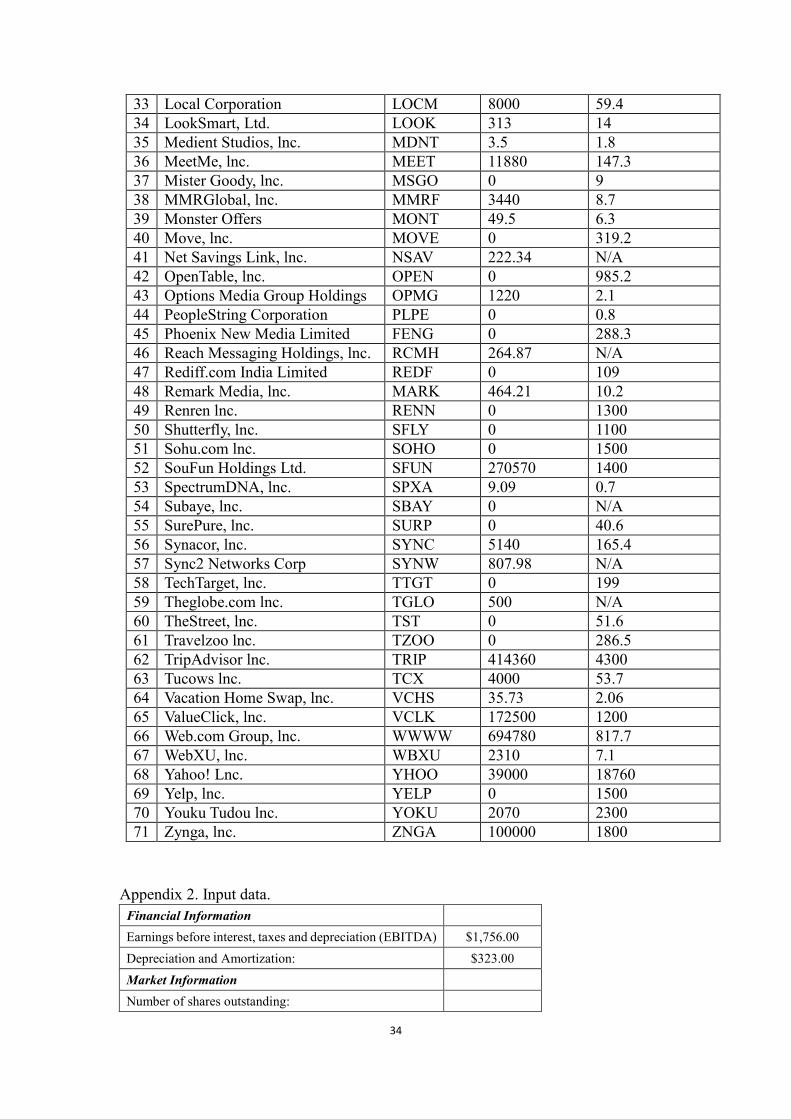
34
33 Local Corporation LOCM 8000 59.4
34 LookSmart, Ltd. LOOK 313 14
35 Medient Studios, lnc. MDNT 3.5 1.8
36 MeetMe, lnc. MEET 11880 147.3
37 Mister Goody, lnc. MSGO 0 9
38 MMRGlobal, lnc. MMRF 3440 8.7
39 Monster Offers MONT 49.5 6.3
40 Move, lnc. MOVE 0 319.2
41 Net Savings Link, lnc. NSAV 222.34 N/A
42 OpenTable, lnc. OPEN 0 985.2
43 Options Media Group Holdings OPMG 1220 2.1
44 PeopleString Corporation PLPE 0 0.8
45 Phoenix New Media Limited FENG 0 288.3
46 Reach Messaging Holdings, lnc. RCMH 264.87 N/A
47 Rediff.com India Limited REDF 0 109
48 Remark Media, lnc. MARK 464.21 10.2
49 Renren lnc. RENN 0 1300
50 Shutterfly, lnc. SFLY 0 1100
51 Sohu.com lnc. SOHO 0 1500
52 SouFun Holdings Ltd. SFUN 270570 1400
53 SpectrumDNA, lnc. SPXA 9.09 0.7
54 Subaye, lnc. SBAY 0 N/A
55 SurePure, lnc. SURP 0 40.6
56 Synacor, lnc. SYNC 5140 165.4
57 Sync2 Networks Corp SYNW 807.98 N/A
58 TechTarget, lnc. TTGT 0 199
59 Theglobe.com lnc. TGLO 500 N/A
60 TheStreet, lnc. TST 0 51.6
61 Travelzoo lnc. TZOO 0 286.5
62 TripAdvisor lnc. TRIP 414360 4300
63 Tucows lnc. TCX 4000 53.7
64 Vacation Home Swap, lnc. VCHS 35.73 2.06
65 ValueClick, lnc. VCLK 172500 1200
66 Web.com Group, lnc. WWWW 694780 817.7
67 WebXU, lnc. WBXU 2310 7.1
68 Yahoo! Lnc. YHOO 39000 18760
69 Yelp, lnc. YELP 0 1500
70 Youku Tudou lnc. YOKU 2070 2300
71 Zynga, lnc. ZNGA 100000 1800
Appendix 2. Input data.
Financial Information
Earnings before interest, taxes and depreciation (EBITDA) $1,756.00
Depreciation and Amortization: $323.00
Market Information
Number of shares outstanding:
35
1,080,000,000
Market price per share: $0.0000263400
Beta of the stock: 1.70
Book value of debt: $1,432.00
The market value of debt: $1,432.00
Do you have any operating leases? Yes
General Market Data
Current long-term (LT) government bond rate: 2.78%
Short-term interest rate 1.80%
Risk premium (for use in the CAPM) 11.90%
Country default spread (for cost of debt) 0.00%
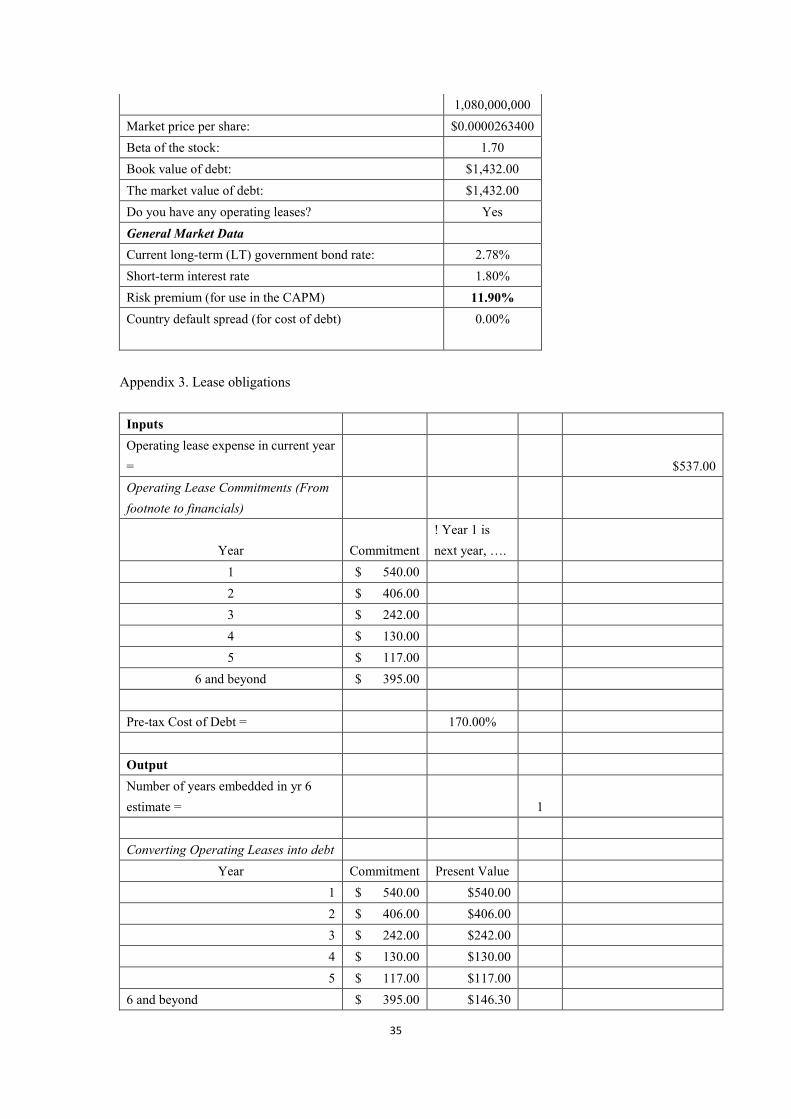
Appendix 3. Lease obligations
Inputs
Operating lease expense in current year
= $537.00
Operating Lease Commitments (From
footnote to financials)
Year Commitment
! Year 1 is
next year, ….
1 $ 540.00
2 $ 406.00
3 $ 242.00
4 $ 130.00
5 $ 117.00
6 and beyond $ 395.00
Pre-tax Cost of Debt = 170.00%
Output
Number of years embedded in yr 6
estimate = 1
Converting Operating Leases into debt
Year Commitment Present Value
1 $ 540.00 $540.00
2 $ 406.00 $406.00
3 $ 242.00 $242.00
4 $ 130.00 $130.00
5 $ 117.00 $117.00
6 and beyond $ 395.00 $146.30
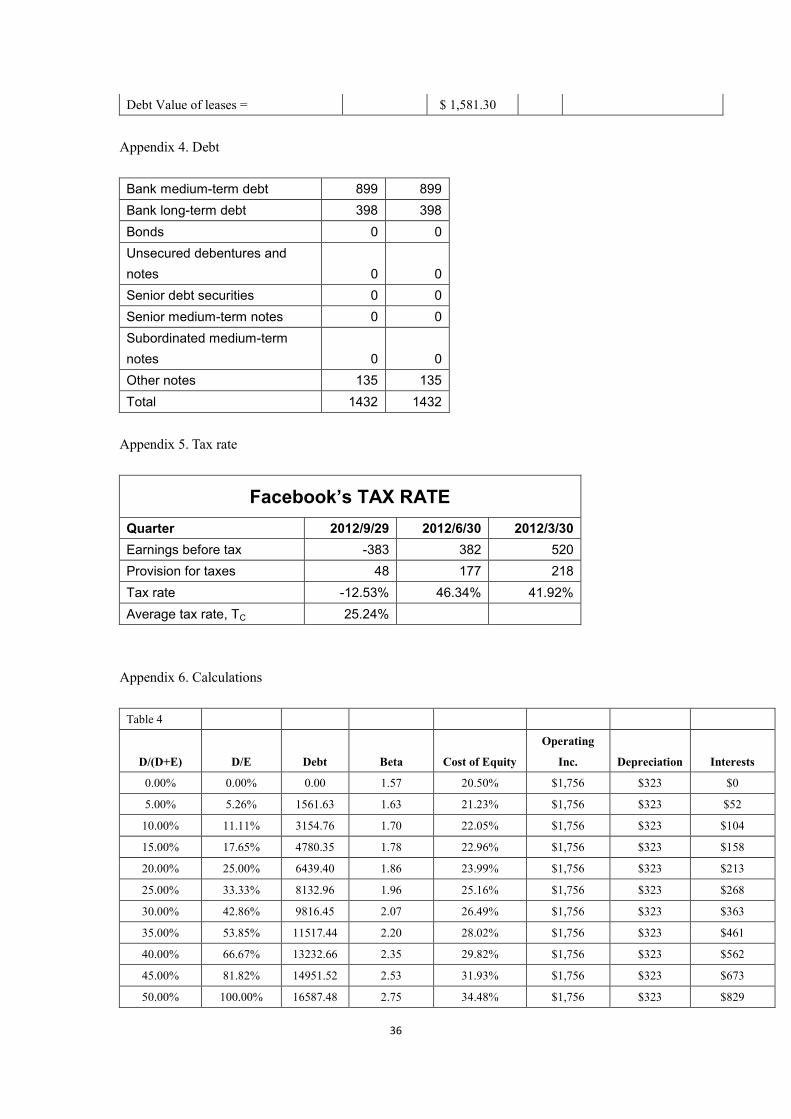
36
Debt Value of leases = $ 1,581.30
Appendix 4. Debt
Bank medium-term debt 899 899
Bank long-term debt 398 398
Bonds 0 0
Unsecured debentures and
notes 0 0
Senior debt securities 0 0
Senior medium-term notes 0 0
Subordinated medium-term
notes 0 0
Other notes 135 135
Total 1432 1432
Appendix 5. Tax rate
Facebook’s TAX RATE
Quarter 2012/9/29 2012/6/30 2012/3/30
Earnings before tax -383 382 520
Provision for taxes 48 177 218
Tax rate -12.53% 46.34% 41.92%
Average tax rate, TC 25.24%
Appendix 6. Calculations
Table 4
D/(D+E) D/E Debt Beta Cost of Equity
Operating
Inc. Depreciation Interests
0.00% 0.00% 0.00 1.57 20.50% $1,756 $323 $0
5.00% 5.26% 1561.63 1.63 21.23% $1,756 $323 $52
10.00% 11.11% 3154.76 1.70 22.05% $1,756 $323 $104
15.00% 17.65% 4780.35 1.78 22.96% $1,756 $323 $158
20.00% 25.00% 6439.40 1.86 23.99% $1,756 $323 $213
25.00% 33.33% 8132.96 1.96 25.16% $1,756 $323 $268
30.00% 42.86% 9816.45 2.07 26.49% $1,756 $323 $363
35.00% 53.85% 11517.44 2.20 28.02% $1,756 $323 $461
40.00% 66.67% 13232.66 2.35 29.82% $1,756 $323 $562
45.00% 81.82% 14951.52 2.53 31.93% $1,756 $323 $673
50.00% 100.00% 16587.48 2.75 34.48% $1,756 $323 $829
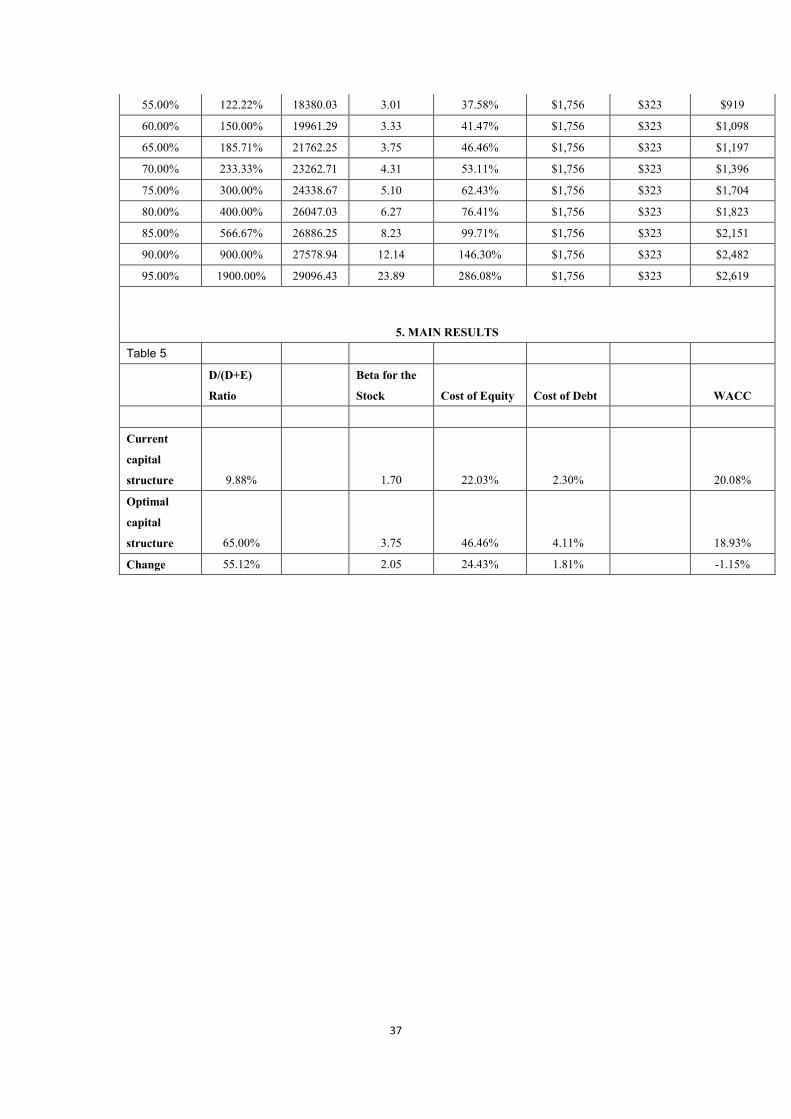
37
55.00% 122.22% 18380.03 3.01 37.58% $1,756 $323 $919
60.00% 150.00% 19961.29 3.33 41.47% $1,756 $323 $1,098
65.00% 185.71% 21762.25 3.75 46.46% $1,756 $323 $1,197
70.00% 233.33% 23262.71 4.31 53.11% $1,756 $323 $1,396
75.00% 300.00% 24338.67 5.10 62.43% $1,756 $323 $1,704
80.00% 400.00% 26047.03 6.27 76.41% $1,756 $323 $1,823
85.00% 566.67% 26886.25 8.23 99.71% $1,756 $323 $2,151
90.00% 900.00% 27578.94 12.14 146.30% $1,756 $323 $2,482
95.00% 1900.00% 29096.43 23.89 286.08% $1,756 $323 $2,619
5. MAIN RESULTS
Table 5
D/(D+E)
Ratio
Beta for the
Stock Cost of Equity Cost of Debt WACC
Current
capital
structure 9.88% 1.70 22.03% 2.30% 20.08%
Optimal
capital
structure 65.00% 3.75 46.46% 4.11% 18.93%
Change 55.12% 2.05 24.43% 1.81% -1.15%