Embed Size (px)
Citation preview
MURDOCH RESEARCH REPOSITORY
This is the author’s final version of the work, as accepted for publication following peer review but without the publisher’s layout or pagination.
The definitive version is available at http://dx.doi.org/10.1016/j.carbon.2013.06.025
Golsheikh, M.A., Huang, N.M., Lim, H.N., Zakaria, R. and Yin, C-Y (2013) One-step electrodeposition synthesis of silver-
nanoparticle-decorated graphene on indium-tin-oxide for enzymeless hydrogen peroxide detection. Carbon, 62 . pp. 405-
412.
http://researchrepository.murdoch.edu.au/15900/
Copyright: © 2013 Elsevier Ltd.
It is posted here for your personal use. No further distribution is permitted.
Accepted Manuscript
One-step electrodeposition synthesis of silver-nanoparticle-decorated graphene
on indium-tin-oxide for enzymeless hydrogen peroxide detection
A. Moradi Golsheikh, N.M. Huang, H.N. Lim, Rozalina Zakaria, Chun-Yang
Yin
PII: S0008-6223(13)00534-4
DOI: http://dx.doi.org/10.1016/j.carbon.2013.06.025
Reference: CARBON 8128
To appear in: Carbon
Received Date: 5 March 2013
Accepted Date: 12 June 2013
Please cite this article as: Moradi Golsheikh, A., Huang, N.M., Lim, H.N., Zakaria, R., Yin, C-Y., One-step
electrodeposition synthesis of silver-nanoparticle-decorated graphene on indium-tin-oxide for enzymeless hydrogen
peroxide detection, Carbon (2013), doi: http://dx.doi.org/10.1016/j.carbon.2013.06.025
This is a PDF file of an unedited manuscript that has been accepted for publication. As a service to our customers
we are providing this early version of the manuscript. The manuscript will undergo copyediting, typesetting, and
review of the resulting proof before it is published in its final form. Please note that during the production process
errors may be discovered which could affect the content, and all legal disclaimers that apply to the journal pertain.
1
One-step electrodeposition synthesis of silver-nanoparticle-decorated graphene on indium-
tin-oxide for enzymeless hydrogen peroxide detection
A. Moradi Golsheikh1*
, N.M. Huang1*
, H.N. Lim2, Rozalina Zakaria
3, Chun-Yang Yin
4
1Low Dimensional Materials Research Centre (LDMRC), Physics Department, Faculty of
Science, University of Malaya, 50603 Kuala Lumpur, Malaysia
2Department of Chemistry, Faculty of Science, University Putra Malaysia, 43400 UPM Serdang,
Selangor Darul Ehsan, Malaysia
3Photonics Research Centre, Physics Department, Faculty of Science, University of Malaya,
50603 Kuala Lumpur, Malaysia
4Chemical and Analytical Sciences, Murdoch University, Murdoch, 6150 WA, Australia
*Corresponding author: [email protected], [email protected] Tel: +6012-
2091008 Fax: +603-7967 4146
Abstract
Silver-nanoparticles-decorated reduced graphene oxide (rGO) was electrodeposited on
indium tin oxide (ITO) by a cyclic voltammetry method. The results of X-ray diffraction,
Fourier-transform infrared transmission spectroscopy and Raman spectroscopy confirmed the
simultaneous formation of cubic phase silver nanoparticles and reduction of GO through the
electrodeposition process. Field emission scanning electron microscope images showed a
uniform distribution of nanometer-sized silver nanoparticles with a narrow size distribution on
the RGO sheets, which could only be achieved using silver ammonia complex instead of silver
nitrate as precursor. The composite deposited on ITO exhibited notable electrocatalytic activity
2
for the reduction of H2O2, leading to an enzymeless electrochemical sensor with a fast
amperometric response time less than 2 s. The corresponding calibration curve of the current
response showed a linear detection range of 0.1 mM to 100 mM (R2
= 0.9992) while the limit of
detection was estimated to be 5 µM.
1. Introduction
Graphene, a one-atom-thick planar sheet of sp2-bonded carbon atoms, has attracted
tremendous attention due to its unique electrical, mechanical, thermal, and optical properties [1-
4]. These unique properties hold great promise for potential applications in many advanced
technologies such as nanoelectronics, sensors, capacitors and composites [5-8]. At present,
graphene sheets have been prepared by a variety of techniques, including micromechanical
exfoliation of graphite, chemical vapour deposition, electrochemical reduction of graphene
oxide, epitaxial growth and thermal or chemical reduction of graphite oxide [1; 9-13]. Among
these methods, electrochemical reduction of graphene oxide has the distinctions of being a
simple, fast and environmentally-friendly approach.
Graphene’s favorable characteristics such as high electrical conductivity, large surface-
to-volume ratio and excellent chemical tolerance make it an attractive matrix for composites. In
view of this, metal nanoparticle-decorated graphene composites have thus been the focus of
research for scientists in recent years due to their multifunctional abilities. Among them, silver-
nanoparticle (AgNP)-decorated graphene composites consistently remain a frequently researched
composite since they are effective for various applications such as surface-enhanced Raman
scattering (SERS) substrate, glucose sensors and hydrogen peroxide sensors [14-16].
Immobilization of AgNPs on graphene can be accomplished using a myriad of methods
including photochemical strategies, rapid thermal treatment, microwaves, etc. [17-21] which is
3
desirable as this indicates versatility. Several types of nanoparticles have been electrodeposited
on graphene [22; 23], but to the best of our knowledge, there are no published articles on silver
nanoparticles. As such, we report herein, an easy, fast, one-step, cost-effective and
environmentally-friendly synthesis of AgNP-decorated graphene nanosheets on ITO coated glass
slides using a cyclic voltammetry (CV) method that does not involve a chemical reducing agent.
2. Experimental
2.1. Materials
Graphite flakes were purchased from Ashbury Inc. (NJ,USA). Sulphuric acid (H2SO4,
98%), potassium permanganate (KMnO4, 99.9%), hydrogen peroxide (H2O2, 30%), hydrochloric
acid (HCl, 37%) and sodium hydroxide (NaOH, 99.99%) were purchased from Merck. Silver
nitrate (AgNO3, 99.7%) was purchased from Systerm, Malaysia. Ammonia solution (NH3, 25%)
was obtained from Sigma-Aldrich. Distilled water was used throughout the sample preparation.
2.2 Fabrication of AgNPs-rGO/ITO
GO was prepared by a simplified Hummers’ method [24]. The electrodeposition of
AgNPs-rGO was conducted in a three-electrode electrochemical cell. Silver–ammonia
[Ag(NH3)2OH] solution was prepared by adding ammonia (1 wt%) to silver nitrate solution (50
mM) until complete absence of precipitates was observed. The concentration of the obtained
Ag(NH3)2OH was approximately 40 mM. The freshly prepared Ag(NH3)2OH solution was mixed
with an aqueous solution of GO (1.0 mg/mL) at GO-to-Ag(NH3)2OH volume ratios of 12, 6, and
3 (the samples were labelled as AgNPs-rGO-1, AgNPs-rGO-2 and AgNPs-rGO-3, respectively)
and stirred for 2 min to ensure homogeneity. Cyclic voltammetry was performed in the solutions
4
on a potentiostat/galvanostat (Versastat 3 Applied Research Princeton, USA) using a three-
electrode system: an ITO (with active area of 0.25 cm2) as the working electrode, a platinum foil
as the counter electrode and a saturated calomel electrode (SCE) as the reference electrode. The
scan was performed between –1.5 and 0 V at a rate of 25 mV s − 1
while the loading amount of
deposits was controlled by five potential cycles. After deposition, the working electrode was
washed with double-distilled water. For comparison, AgNPs-rGO-4 was prepared in the same
conditions as AgNPs-rGO-1 using AgNO3 solution (0.04 M) instead of Ag(NH3)2OH solution
(0.04 M).
2.3. Characterization
The crystal phase, morphology and microstructure of the samples were characterized by
X-ray powder diffraction (XRD; Philips X’pert system using Cu Kα radiation), field emission
scanning electron microscope (FESEM; FEI Nova NanoSEM 400 operated at 10.0 kV), a Fourier
transform infrared spectrometer (FTIR; Perkin Elmer System 2000 series spectrophotometer,
USA), and a Raman spectrometer (Renishaw inVia Raman microscope using laser excitation at λ
= 514 nm).
3. Results and Discussion
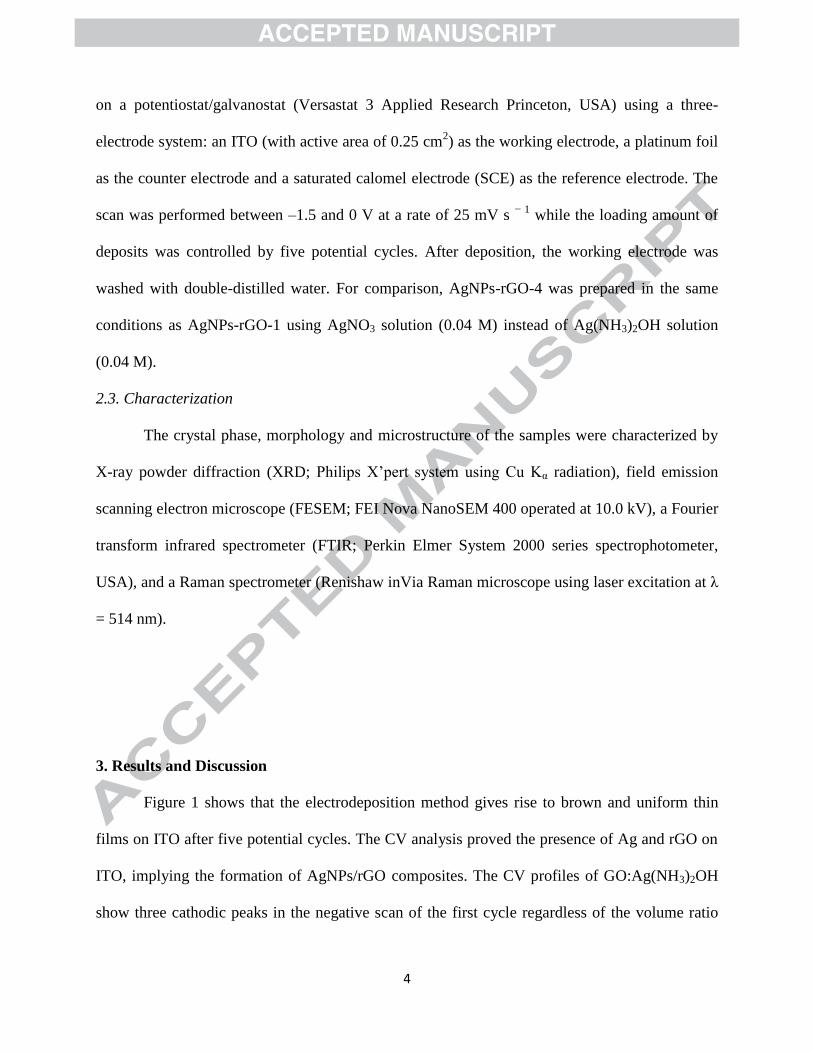
Figure 1 shows that the electrodeposition method gives rise to brown and uniform thin
films on ITO after five potential cycles. The CV analysis proved the presence of Ag and rGO on
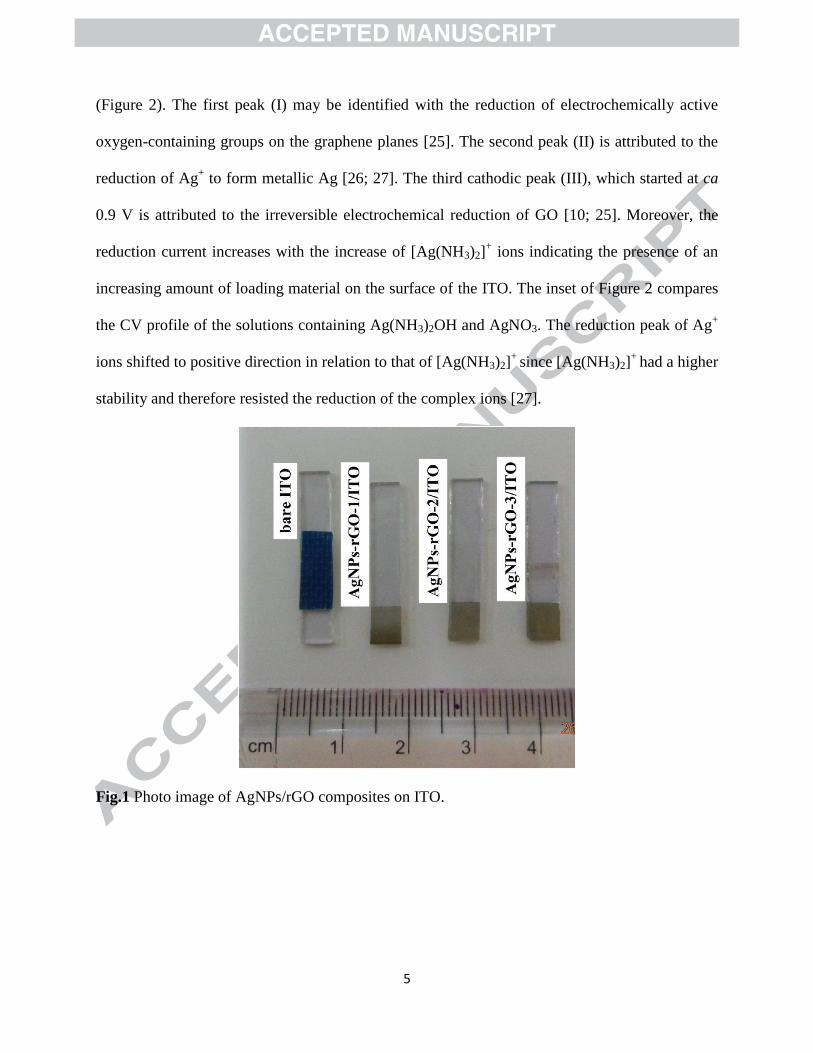
ITO, implying the formation of AgNPs/rGO composites. The CV profiles of GO:Ag(NH3)2OH
show three cathodic peaks in the negative scan of the first cycle regardless of the volume ratio
5
(Figure 2). The first peak (I) may be identified with the reduction of electrochemically active
oxygen-containing groups on the graphene planes [25]. The second peak (II) is attributed to the
reduction of Ag+ to form metallic Ag [26; 27]. The third cathodic peak (III), which started at ca
0.9 V is attributed to the irreversible electrochemical reduction of GO [10; 25]. Moreover, the
reduction current increases with the increase of [Ag(NH3)2]+ ions indicating the presence of an
increasing amount of loading material on the surface of the ITO. The inset of Figure 2 compares
the CV profile of the solutions containing Ag(NH3)2OH and AgNO3. The reduction peak of Ag+
ions shifted to positive direction in relation to that of [Ag(NH3)2]+
since [Ag(NH3)2]+
had a higher
stability and therefore resisted the reduction of the complex ions [27].
Fig.1 Photo image of AgNPs/rGO composites on ITO.
6
Fig.2 The first cycle of the CV profile of ITO in the solution of GO (1.0 mg/mL) and
Ag(NH3)2OH (0.04 M) with different volume ratios of 12, 6, and 3 (a–c), respectively, and in the
solution of GO (1.0 mg/mL) and AgNO3 (0.04 M) with a volume ratio of 12 (d). The inset
highlights the CV profile of the solutions containing Ag(NH3)2OH (a) and AgNO3 (d).
Figure 3 shows the XRD patterns of pristine GO (a), ITO (b), AgNPs-rGO deposited on
ITO with different volume ratios of GO (1.0 mg/mL) to Ag(NH3)2OH (0.04 M) (c–e) (AgNPs-
rGO-1, AgNPs-rGO-2, and AgNPs-rGO-3, respectively). Pristine GO has a sharp peak at 10.8o
which is assigned to the (002) inter-planar spacing of 0.82 nm [28]. All the electrodeposited
AgNPs-rGO exhibit some peaks associated with ITO. AgNPs-rGO-1 exhibits a relatively
marginal peak at 38.1o. As the amount of Ag(NH3)2OH increases, new peaks appeared at 44.3
o,
64.4o, and 77.4
o. The peaks at 38.1
o, 44.3
o, 64.4
o, and 77.4
o can be indexed to the cubic phase of
Ag (PDF card no: 00-001-1167). The increased intensity of the peaks is in agreement with the
enhanced signals of the CV profiles. Meanwhile, the (002) peak of GO disappeared after the

7
electrodeposition process. This is attributed to the growth of AgNPs on the surface of graphene
nanosheets which prevents the restacking of graphene nanosheets [28; 29].
Fig.3 XRD patterns of pristine GO (a), ITO (b), and AgNPs-rGO deposited on ITO with
different volume ratios of GO (1.0 mg/mL) to Ag(NH3)2OH (0.04 M) of 12, 6, and 3,
respectively (c–e).
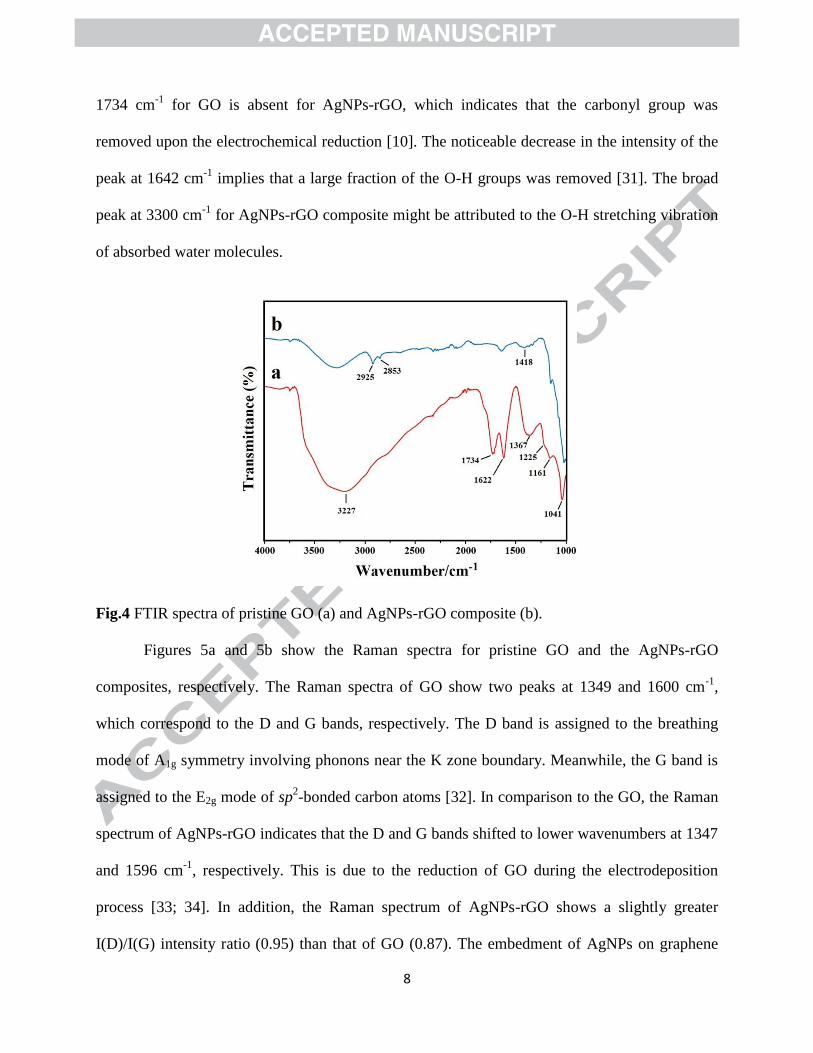
Figures 4a and 4b show the FTIR spectra of pristine GO and AgNPs-rGO composite,
respectively. For GO, the broad peak centred at 3227 cm-1
is attributed to the O-H stretching
vibrations while the peaks at 1734, 1622, 1367, and 1225 are assigned to C=O stretching, sp2-
hybridized C=C group and O-H bending, C-OH stretching and C-O-C stretching, respectively
[30]. In addition, the peaks at 1161 and 1041 cm-1
can be attributed to C-O vibration of epoxy or
alkoxy groups [31]. For the AgNPs-rGO composite, the peaks at 1642, 1418, 2853, and 2925 cm-
1 are assigned to the sp
2-hybridized C=C group and O-H bending, O-H deformation, as well as
symmetric and asymmetric stretching vibration of CH2 groups, respectively [30]. The peak at
8
1734 cm-1
for GO is absent for AgNPs-rGO, which indicates that the carbonyl group was
removed upon the electrochemical reduction [10]. The noticeable decrease in the intensity of the
peak at 1642 cm-1
implies that a large fraction of the O-H groups was removed [31]. The broad
peak at 3300 cm-1
for AgNPs-rGO composite might be attributed to the O-H stretching vibration
of absorbed water molecules.
Fig.4 FTIR spectra of pristine GO (a) and AgNPs-rGO composite (b).
Figures 5a and 5b show the Raman spectra for pristine GO and the AgNPs-rGO
composites, respectively. The Raman spectra of GO show two peaks at 1349 and 1600 cm-1
,
which correspond to the D and G bands, respectively. The D band is assigned to the breathing
mode of A1g symmetry involving phonons near the K zone boundary. Meanwhile, the G band is
assigned to the E2g mode of sp2-bonded carbon atoms [32]. In comparison to the GO, the Raman
spectrum of AgNPs-rGO indicates that the D and G bands shifted to lower wavenumbers at 1347
and 1596 cm-1
, respectively. This is due to the reduction of GO during the electrodeposition
process [33; 34]. In addition, the Raman spectrum of AgNPs-rGO shows a slightly greater
I(D)/I(G) intensity ratio (0.95) than that of GO (0.87). The embedment of AgNPs on graphene
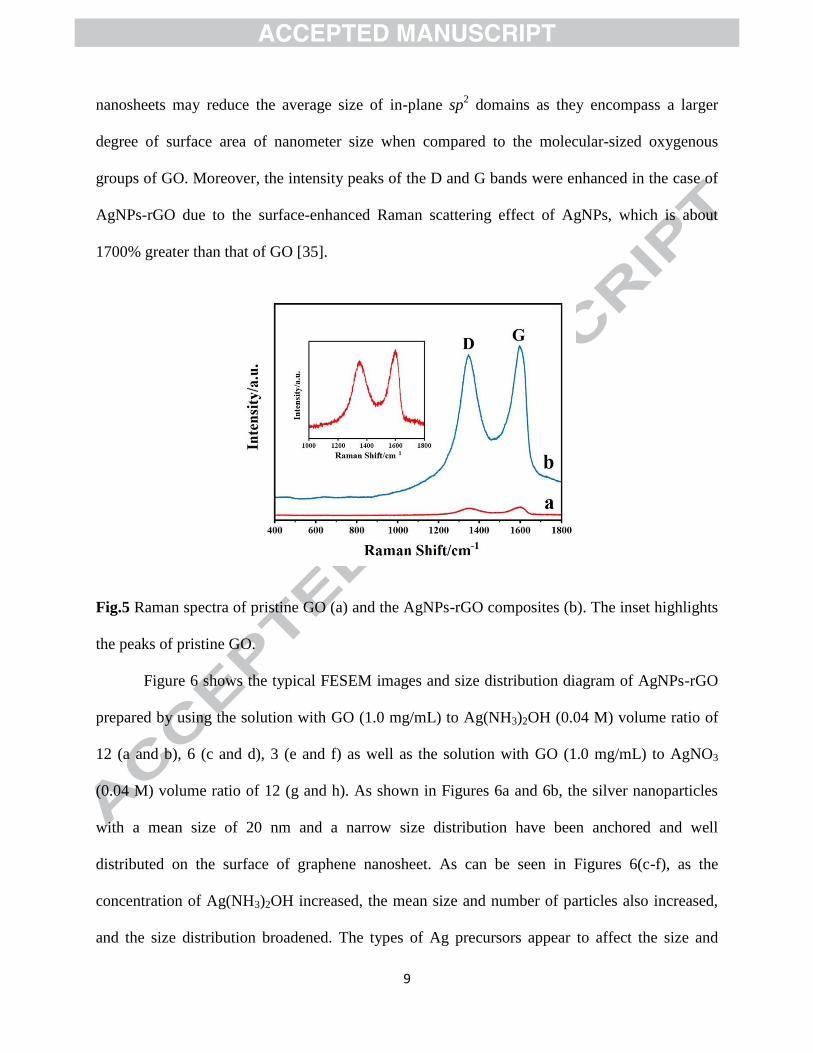
9
nanosheets may reduce the average size of in-plane sp2 domains as they encompass a larger
degree of surface area of nanometer size when compared to the molecular-sized oxygenous
groups of GO. Moreover, the intensity peaks of the D and G bands were enhanced in the case of
AgNPs-rGO due to the surface-enhanced Raman scattering effect of AgNPs, which is about
1700% greater than that of GO [35].
Fig.5 Raman spectra of pristine GO (a) and the AgNPs-rGO composites (b). The inset highlights
the peaks of pristine GO.
Figure 6 shows the typical FESEM images and size distribution diagram of AgNPs-rGO
prepared by using the solution with GO (1.0 mg/mL) to Ag(NH3)2OH (0.04 M) volume ratio of
12 (a and b), 6 (c and d), 3 (e and f) as well as the solution with GO (1.0 mg/mL) to AgNO3
(0.04 M) volume ratio of 12 (g and h). As shown in Figures 6a and 6b, the silver nanoparticles
with a mean size of 20 nm and a narrow size distribution have been anchored and well
distributed on the surface of graphene nanosheet. As can be seen in Figures 6(c-f), as the
concentration of Ag(NH3)2OH increased, the mean size and number of particles also increased,
and the size distribution broadened. The types of Ag precursors appear to affect the size and
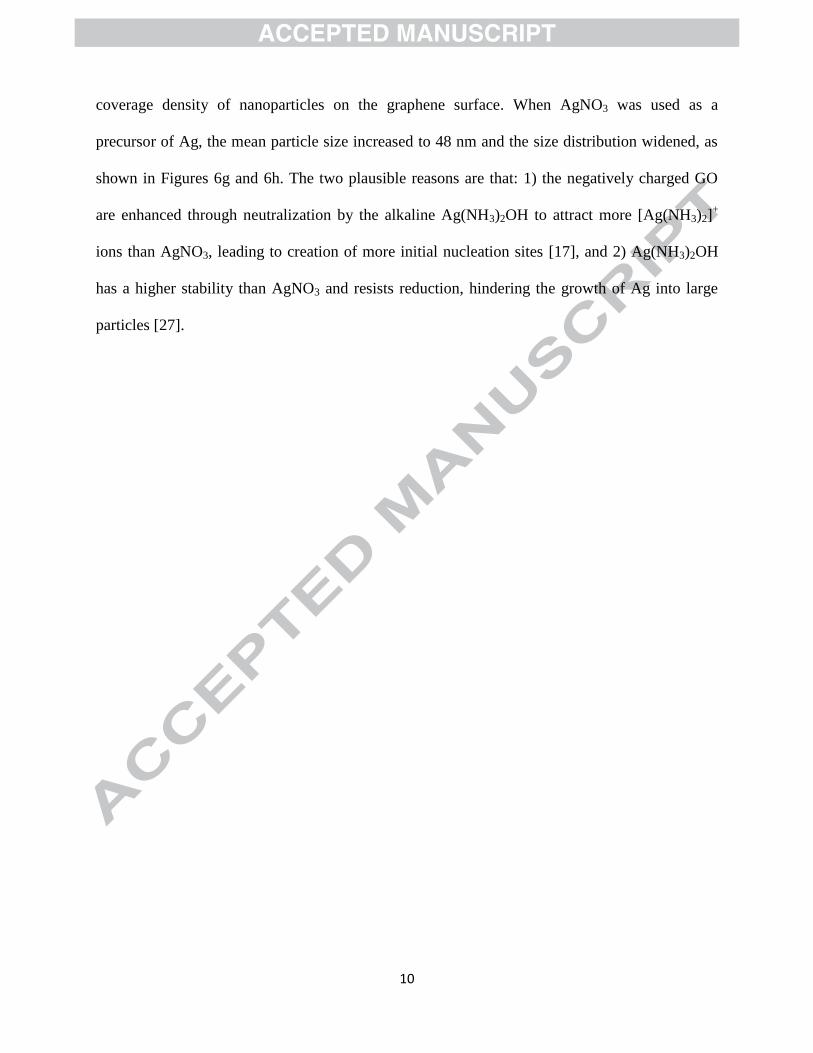
10
coverage density of nanoparticles on the graphene surface. When AgNO3 was used as a
precursor of Ag, the mean particle size increased to 48 nm and the size distribution widened, as
shown in Figures 6g and 6h. The two plausible reasons are that: 1) the negatively charged GO
are enhanced through neutralization by the alkaline Ag(NH3)2OH to attract more [Ag(NH3)2]+
ions than AgNO3, leading to creation of more initial nucleation sites [17], and 2) Ag(NH3)2OH
has a higher stability than AgNO3 and resists reduction, hindering the growth of Ag into large
particles [27].
11
12
Fig.6 FESEM images and size distribution diagram of AgNPs-rGO prepared by using the
solution with GO (1.0 mg/mL) to Ag(NH3)2OH (0.04 M) volume ratios of 12 (a and b), 6 (c and
d), and 3 (e and f) and using the solution with a GO (1.0 mg/mL) to AgNO3 (0.04 M) volume
ratio of 12 (g and h).
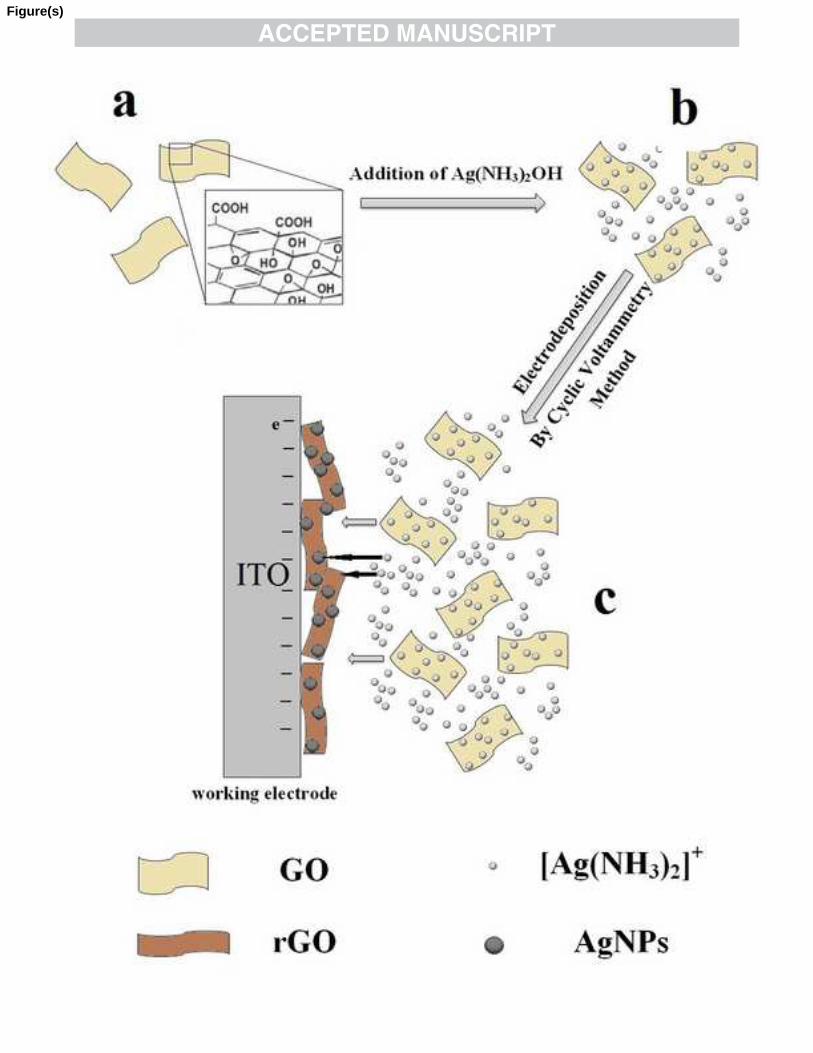
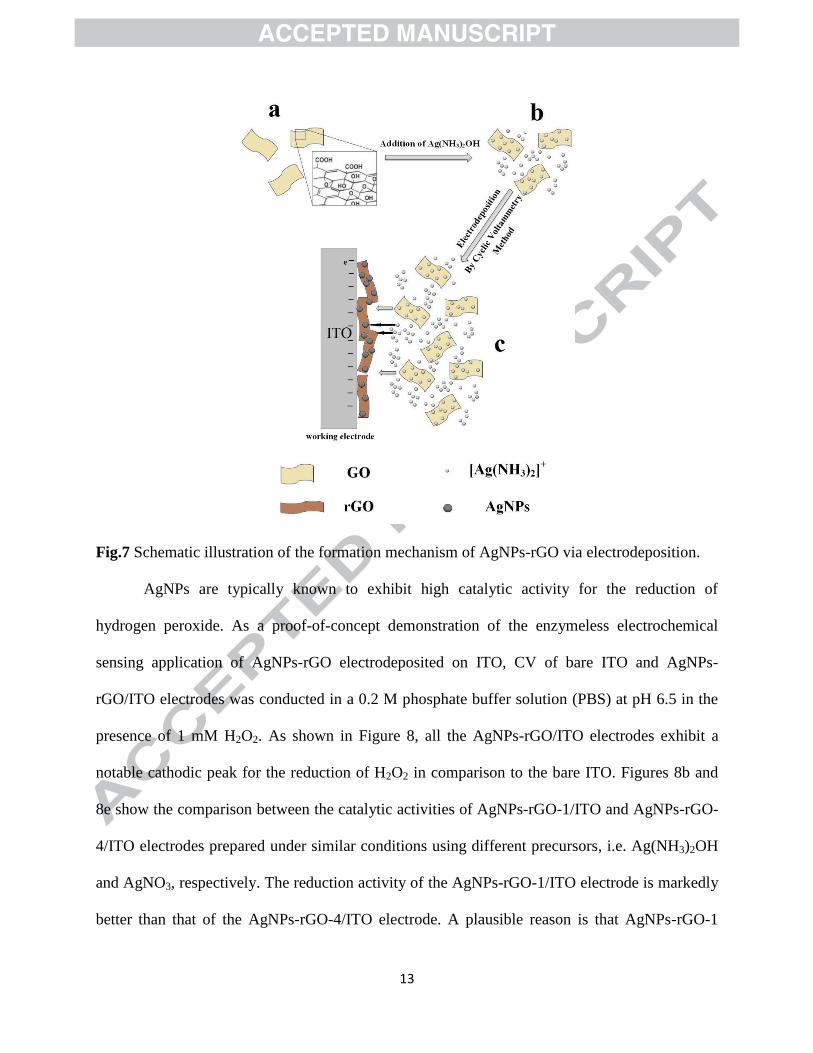
The formation mechanism of AgNPs-rGO via electrodeposition is shown in Figure 7.
Dispersed GO sheets in water are negatively-charged due to the ionization of carboxyl and
hydroxyl groups on the surface of GO [36] (Figure 7a). This causes the positively-charged
[Ag(NH3)2]+ ions to be adsorbed on the negatively-charged GO sheets by electrostatic attraction
(Figure 7b). The GO nanosheets with the adsorbed [Ag(NH3)2]+ ions are deposited on the surface
of ITO and reduced to graphene nanosheets and AgNPs by applying a negative potential.
Simultaneously, the [Ag(NH3)2]+ ions in the aqueous solution are deposited and reduced on the
formed AgNPs or on the surface of graphene nanosheets, which lead to the growth of the initially
formed AgNPs or nucleation of new AgNPs. This explains the reason behind the increased
density of AgNPs on the graphene sheets when the concentration of [Ag(NH3)2]+ ions multiplied.
13
Fig.7 Schematic illustration of the formation mechanism of AgNPs-rGO via electrodeposition.
AgNPs are typically known to exhibit high catalytic activity for the reduction of
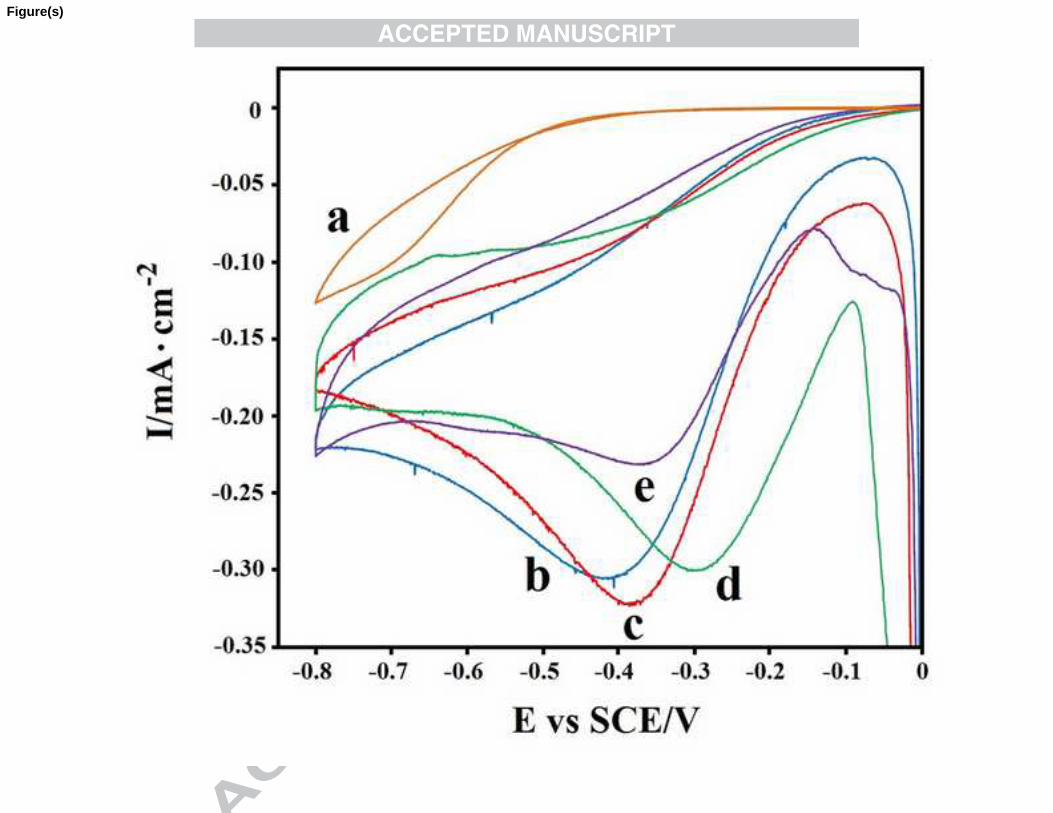
hydrogen peroxide. As a proof-of-concept demonstration of the enzymeless electrochemical
sensing application of AgNPs-rGO electrodeposited on ITO, CV of bare ITO and AgNPs-
rGO/ITO electrodes was conducted in a 0.2 M phosphate buffer solution (PBS) at pH 6.5 in the
presence of 1 mM H2O2. As shown in Figure 8, all the AgNPs-rGO/ITO electrodes exhibit a
notable cathodic peak for the reduction of H2O2 in comparison to the bare ITO. Figures 8b and
8e show the comparison between the catalytic activities of AgNPs-rGO-1/ITO and AgNPs-rGO-
4/ITO electrodes prepared under similar conditions using different precursors, i.e. Ag(NH3)2OH
and AgNO3, respectively. The reduction activity of the AgNPs-rGO-1/ITO electrode is markedly
better than that of the AgNPs-rGO-4/ITO electrode. A plausible reason is that AgNPs-rGO-1
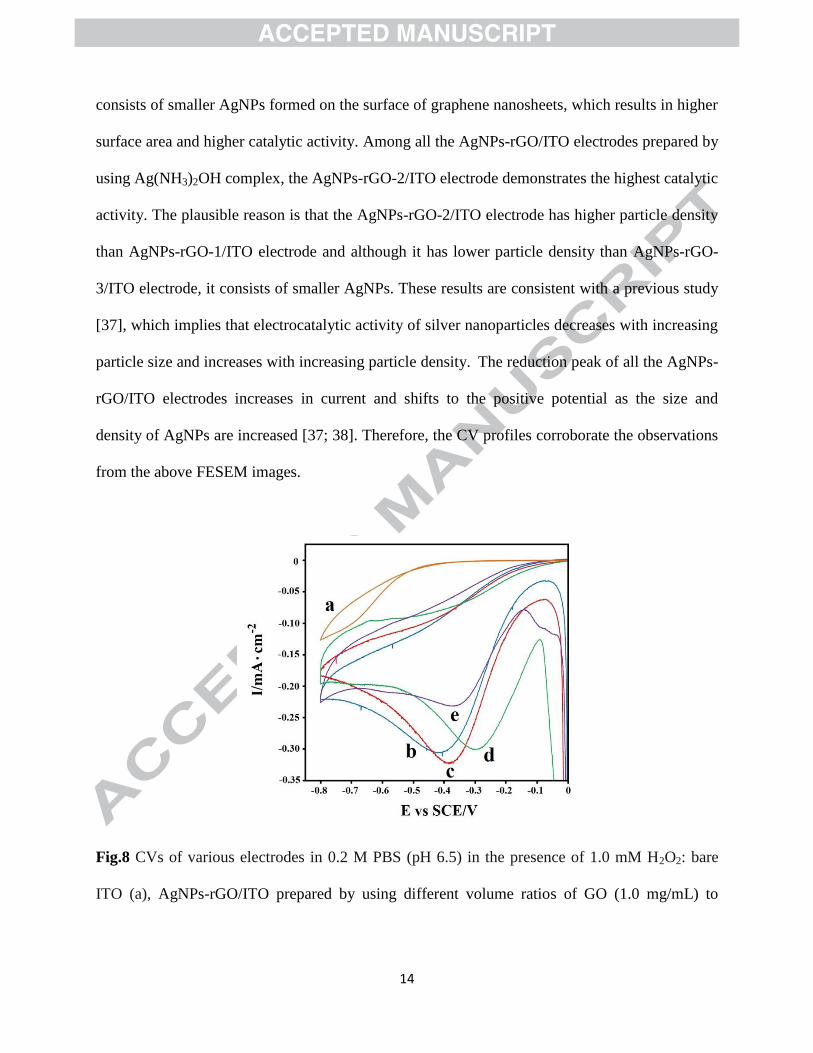
14
consists of smaller AgNPs formed on the surface of graphene nanosheets, which results in higher
surface area and higher catalytic activity. Among all the AgNPs-rGO/ITO electrodes prepared by
using Ag(NH3)2OH complex, the AgNPs-rGO-2/ITO electrode demonstrates the highest catalytic
activity. The plausible reason is that the AgNPs-rGO-2/ITO electrode has higher particle density
than AgNPs-rGO-1/ITO electrode and although it has lower particle density than AgNPs-rGO-
3/ITO electrode, it consists of smaller AgNPs. These results are consistent with a previous study
[37], which implies that electrocatalytic activity of silver nanoparticles decreases with increasing
particle size and increases with increasing particle density. The reduction peak of all the AgNPs-
rGO/ITO electrodes increases in current and shifts to the positive potential as the size and
density of AgNPs are increased [37; 38]. Therefore, the CV profiles corroborate the observations
from the above FESEM images.
Fig.8 CVs of various electrodes in 0.2 M PBS (pH 6.5) in the presence of 1.0 mM H2O2: bare
ITO (a), AgNPs-rGO/ITO prepared by using different volume ratios of GO (1.0 mg/mL) to
15
Ag(NH3)2OH (0.04 M) of 12, 6, and 3, respectively (b–d), and AgNPs-rGO/ITO prepared by
using the solution with GO (1.0 mg/mL) to AgNO3 (0.04 M) volume ratio of 12 (e).
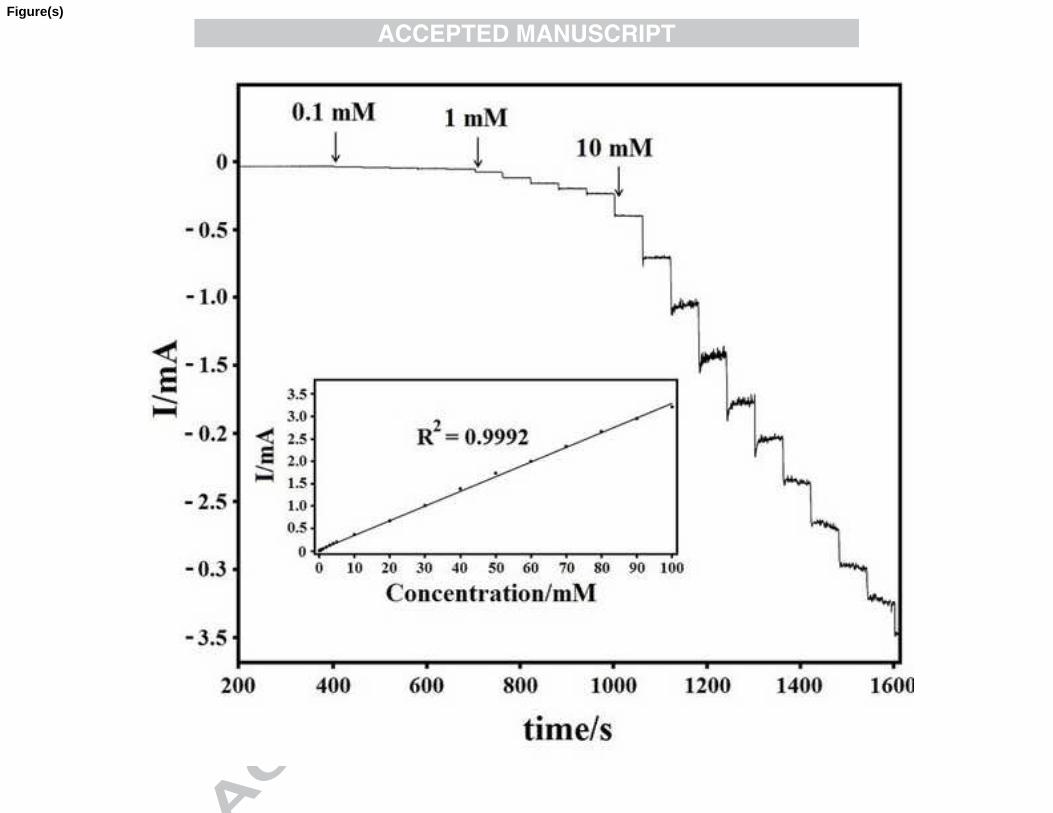
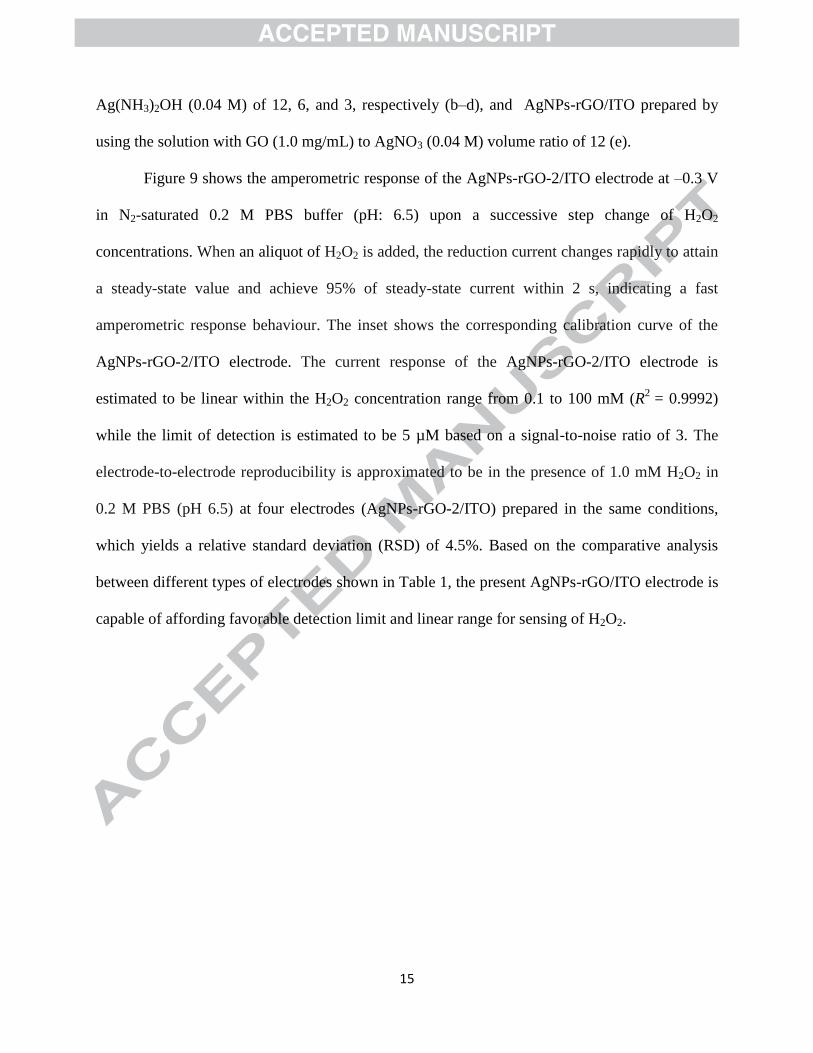
Figure 9 shows the amperometric response of the AgNPs-rGO-2/ITO electrode at –0.3 V
in N2-saturated 0.2 M PBS buffer (pH: 6.5) upon a successive step change of H2O2
concentrations. When an aliquot of H2O2 is added, the reduction current changes rapidly to attain
a steady-state value and achieve 95% of steady-state current within 2 s, indicating a fast
amperometric response behaviour. The inset shows the corresponding calibration curve of the
AgNPs-rGO-2/ITO electrode. The current response of the AgNPs-rGO-2/ITO electrode is
estimated to be linear within the H2O2 concentration range from 0.1 to 100 mM (R2
= 0.9992)
while the limit of detection is estimated to be 5 µM based on a signal-to-noise ratio of 3. The
electrode-to-electrode reproducibility is approximated to be in the presence of 1.0 mM H2O2 in
0.2 M PBS (pH 6.5) at four electrodes (AgNPs-rGO-2/ITO) prepared in the same conditions,
which yields a relative standard deviation (RSD) of 4.5%. Based on the comparative analysis
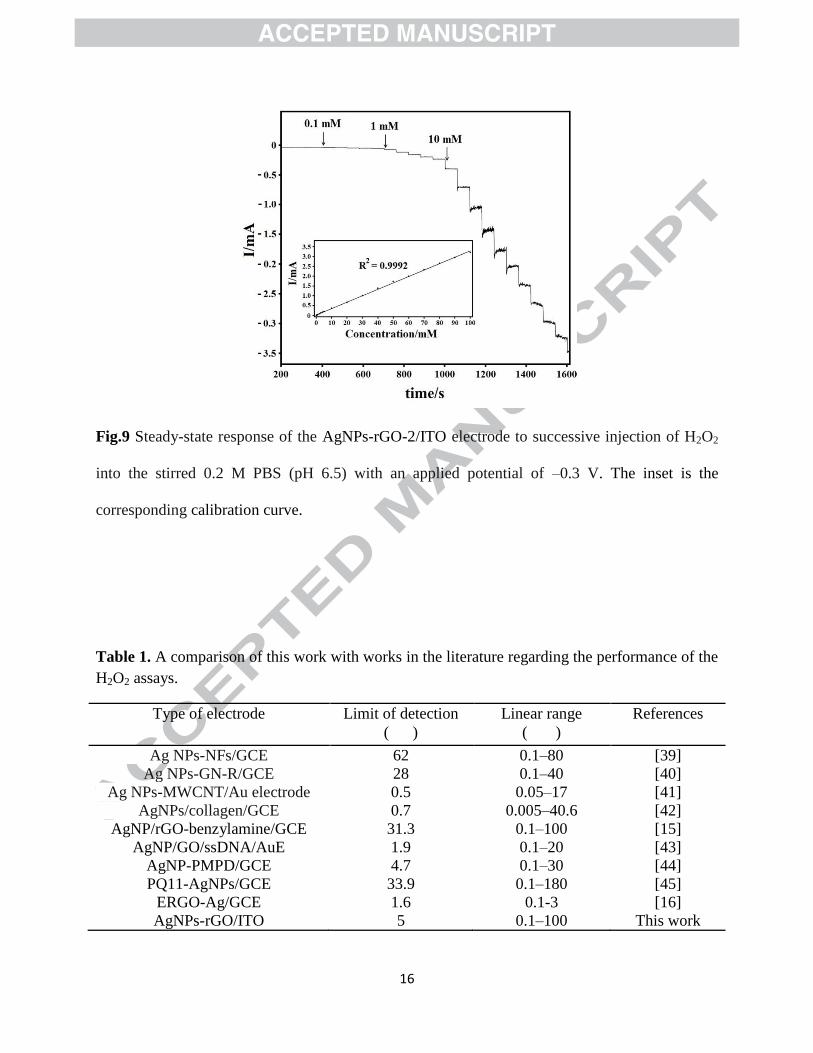
between different types of electrodes shown in Table 1, the present AgNPs-rGO/ITO electrode is
capable of affording favorable detection limit and linear range for sensing of H2O2.
16
Fig.9 Steady-state response of the AgNPs-rGO-2/ITO electrode to successive injection of H2O2
into the stirred 0.2 M PBS (pH 6.5) with an applied potential of –0.3 V. The inset is the
corresponding calibration curve.
Table 1. A comparison of this work with works in the literature regarding the performance of the
H2O2 assays.
Type of electrode Limit of detection
( )
Linear range
( )
References
Ag NPs-NFs/GCE 62 0.1–80 [39]
Ag NPs-GN-R/GCE 28 0.1–40 [40]
Ag NPs-MWCNT/Au electrode 0.5 0.05–17 [41]
AgNPs/collagen/GCE 0.7 0.005–40.6 [42]
AgNP/rGO-benzylamine/GCE 31.3 0.1–100 [15]
AgNP/GO/ssDNA/AuE 1.9 0.1–20 [43]
AgNP-PMPD/GCE 4.7 0.1–30 [44]
PQ11-AgNPs/GCE 33.9 0.1–180 [45]
ERGO-Ag/GCE 1.6 0.1-3 [16]
AgNPs-rGO/ITO 5 0.1–100 This work
17
4. Conclusion
Silver-nanoparticle (AgNP)-decorated reduced graphene oxide (rGO) was successfully
electrodeposited on ITO coated glass slides by a CV method without using any reducing agent. It
was established that the silver ammonia complex was the key component to achieving well-
distributed AgNPs with small and narrow size distribution decorated on reduced graphene sheets.
Our method essentially provides an easy, one-step, environmentally-friendly and cost-effective
fabrication of AgNPs-rGO/ITO electrodes as an enzymeless electrochemical sensor of hydrogen
peroxide.
Acknowledgements
This work was supported by Exploratory Research Grant Scheme (ER016–2011A) and High
Impact Research Grant from the Ministry of Higher Education of Malaysia
(UM.S/P/HIR/MOHE/21). A. Moradi Golsheikh would like to thank University of Malaya for
PPP grant (PV039-2011A)
References
[1] Novoselov KS, Geim AK, Morozov SV, Jiang D, Zhang Y, Dubonos SV, et al. Electric
Field Effect in Atomically Thin Carbon Films. Science 2004;306(5696):666-9.
[2] Lee C, Wei X, Kysar JW, Hone J. Measurement of the Elastic Properties and Intrinsic
Strength of Monolayer Graphene. Science 2008;321(5887):385-8.
[3] Balandin AA, Ghosh S, Bao W, Calizo I, Teweldebrhan D, Miao F, et al. Superior
Thermal Conductivity of Single-Layer Graphene. Nano Lett 2008;8(3):902-7.
18
[4] Bae S, Kim H, Lee Y, Xu X, Park J-S, Zheng Y, et al. Roll-to-roll production of 30-inch
graphene films for transparent electrodes. Nat Nano 2010;5(8):574-8.
[5] Gilje S, Han S, Wang M, Wang KL, Kaner RB. A Chemical Route to Graphene for
Device Applications. Nano Lett 2007;7(11):3394-8.
[6] Zhou M, Zhai Y, Dong S. Electrochemical Sensing and Biosensing Platform Based on
Chemically Reduced Graphene Oxide. Anal Chem 2009;81(14):5603-13.
[7] Liu C, Yu Z, Neff D, Zhamu A, Jang BZ. Graphene-Based Supercapacitor with an
Ultrahigh Energy Density. Nano Lett 2010;10(12):4863-8.
[8] Huang X, Qi X, Boey F, Zhang H. Graphene-based composites. Chem Soc Rev
2012;41(2):666-86.
[9] Guermoune A, Chari T, Popescu F, Sabri SS, Guillemette J, Skulason HS, et al. Chemical
vapor deposition synthesis of graphene on copper with methanol, ethanol, and propanol
precursors. Carbon 2011;49(13):4204-10.
[10] Guo H-L, Wang X-F, Qian Q-Y, Wang F-B, Xia X-H. A Green Approach to the
Synthesis of Graphene Nanosheets. ACS Nano 2009;3(9):2653-9.
[11] Berger C, Song Z, Li X, Wu X, Brown N, Naud C, et al. Electronic Confinement and
Coherence in Patterned Epitaxial Graphene. Science 2006;312(5777):1191-6.
[12] Schniepp HC, Li J-L, McAllister MJ, Sai H, Herrera-Alonso M, Adamson DH, et al.
Functionalized Single Graphene Sheets Derived from Splitting Graphite Oxide. J Phys Chem B
2006;110(17):8535-9.
[13] Stankovich S, Dikin DA, Piner RD, Kohlhaas KA, Kleinhammes A, Jia Y, et al.
Synthesis of graphene-based nanosheets via chemical reduction of exfoliated graphite oxide.
Carbon 2007;45(7):1558-65.
19
[14] Zhang Y, Liu S, Wang L, Qin X, Tian J, Lu W, et al. One-pot green synthesis of Ag
nanoparticles-graphene composites and their applications in SERS, H2O2, and glucose sensing.
RSC Adv 2012;2(2):538-45.
[15] Liu S, Tian J, Wang L, Sun X. A method for the production of reduced graphene oxide
using benzylamine as a reducing and stabilizing agent and its subsequent decoration with Ag
nanoparticles for enzymeless hydrogen peroxide detection. Carbon 2011;49(10):3158-64.
[16] Zhao B, Liu Z, Fu W, Yang H. Construction of 3D electrochemically reduced graphene
oxide–silver nanocomposite film and application as nonenzymatic hydrogen peroxide sensor.
Electrochem Commun 2013;27(0):1-4.
[17] Zhang Y, Yuan X, Wang Y, Chen Y. One-pot photochemical synthesis of graphene
composites uniformly deposited with silver nanoparticles and their high catalytic activity
towards the reduction of 2-nitroaniline. J Mater Chem 2012;22(15):7245-51.
[18] Zainy M, Huang NM, Vijay Kumar S, Lim HN, Chia CH, Harrison I. Simple and
scalable preparation of reduced graphene oxide–silver nanocomposites via rapid thermal
treatment. Mater Lett 2012;89(0):180-3.
[19] Liu S, Tian J, Wang L, Sun X. Microwave-assisted rapid synthesis of Ag
nanoparticles/graphene nanosheet composites and their application for hydrogen peroxide
detection. J Nanopart Res 2011;13(10):4539-48. English.
[20] Qin X, Luo Y, Lu W, Chang G, Asiri AM, Al-Youbi AO, et al. One-step synthesis of Ag
nanoparticles-decorated reduced graphene oxide and their application for H2O2 detection.
Electrochim Acta 2012;79(0):46-51.
20
[21] Chook SW, Chia CH, Zakaria S, Ayob MK, Chee KL, Huang NM, et al. Antibacterial
performance of Ag nanoparticles and AgGO nanocomposites prepared via rapid microwave-
assisted synthesis method. Nanoscale res lett 2012;7(1):541.
[22] Liu C, Wang K, Luo S, Tang Y, Chen L. Direct Electrodeposition of Graphene Enabling
the One-Step Synthesis of Graphene–Metal Nanocomposite Films. Small 2011;7(9):1203-6.
[23] Liu S, Wang J, Zeng J, Ou J, Li Z, Liu X, et al. “Green” electrochemical synthesis of
Pt/graphene sheet nanocomposite film and its electrocatalytic property. J Power Sources
2010;195(15):4628-33.
[24] Huang NM, Lim HN, Chia CH, Yarmo MA, Muhamad MR. Simple room-temperature
preparation of high-yield large-area graphene oxide. Int J Nanomed 2011;6:3443-8.
[25] Chen L, Tang Y, Wang K, Liu C, Luo S. Direct electrodeposition of reduced graphene
oxide on glassy carbon electrode and its electrochemical application. Electrochem Commun
2011;13(2):133-7.
[26] Sharma DK, Ott A, O’Mullane AP, Bhargava SK. The facile formation of silver dendritic
structures in the absence of surfactants and their electrochemical and SERS properties. Colloid
Surface A 2011;386(1–3):98-106.
[27] Kaniyankandy S, Nuwad J, Thinaharan C, Dey GK, Pillai CGS. Electrodeposition of
silver nanodendrites. Nanotechnology 2007;18(12):125610.
[28] Xie G, Cheng J, Li Y, Xi P, Chen F, Liu H, et al. Fluorescent graphene oxide composites
synthesis and its biocompatibility study. J Mater Chem 2012;22(18):9308-14.
[29] Teo PS, Lim HN, Huang NM, Chia CH, Harrison I. Room temperature in situ chemical
synthesis of Fe3O4/graphene. Ceram Int 2012;38(8):6411-6.
21
[30] Cheng C, Nie S, Li S, Peng H, Yang H, Ma L, et al. Biopolymer functionalized reduced
graphene oxide with enhanced biocompatibility via mussel inspired coatings/anchors. J Mater
Chem B 2013;1:265-75
[31] Pham VH, Cuong TV, Hur SH, Oh E, Kim EJ, Shin EW, et al. Chemical
functionalization of graphene sheets by solvothermal reduction of a graphene oxide suspension
in N-methyl-2-pyrrolidone. J Mater Chem 2011;21(10):3371-7.
[32] Ferrari AC, Robertson J. Interpretation of Raman spectra of disordered and amorphous
carbon. Phys Rev B 2000;61(20):14095-107.
[33] Lambert TN, Chavez CA, Hernandez-Sanchez B, Lu P, Bell NS, Ambrosini A, et al.
Synthesis and Characterization of Titania−Graphene Nanocomposites. J Phys Chem C
2009;113(46):19812-23.
[34] Liu X, Pan L, Zhao Q, Lv T, Zhu G, Chen T, et al. UV-assisted photocatalytic synthesis
of ZnO–reduced graphene oxide composites with enhanced photocatalytic activity in reduction
of Cr(VI). Chem Eng J 2012;183(0):238-43.
[35] Xu Z, Gao H, Guoxin H. Solution-based synthesis and characterization of a silver
nanoparticle–graphene hybrid film. Carbon 2011;49(14):4731-8.
[36] Li D, Muller MB, Gilje S, Kaner RB, Wallace GG. Processable aqueous dispersions of
graphene nanosheets. Nat Nano 2008;3(2):101-5.
[37] Yu A, Wang Q, Yong J, Mahon PJ, Malherbe F, Wang F, et al. Silver nanoparticle–
carbon nanotube hybrid films: Preparation and electrochemical sensing. Electrochim Acta
2012;74(0):111-6.
22
[38] Campbell FW, Belding SR, Baron R, Xiao L, Compton RG. Hydrogen Peroxide
Electroreduction at a Silver-Nanoparticle Array: Investigating Nanoparticle Size and Coverage
Effects. J Phys Chem C 2009;113(21):9053-62.
[39] Tian J, Liu S, Sun X. Supramolecular Microfibrils of o-Phenylenediamine Dimers:
Oxidation-Induced Morphology Change and the Spontaneous Formation of Ag Nanoparticle
Decorated Nanofibers. Langmuir 2010;26(19):15112-6.
[40] Liu S, Tian J, Wang L, Li H, Zhang Y, Sun X. Stable Aqueous Dispersion of Graphene
Nanosheets: Noncovalent Functionalization by a Polymeric Reducing Agent and Their
Subsequent Decoration with Ag Nanoparticles for Enzymeless Hydrogen Peroxide Detection.
Macromolecules 2010;43(23):10078-83.
[41] Zhao W, Wang H, Qin X, Wang X, Zhao Z, Miao Z, et al. A novel nonenzymatic
hydrogen peroxide sensor based on multi-wall carbon nanotube/silver nanoparticle nanohybrids
modified gold electrode. Talanta 2009;80(2):1029-33.
[42] Song Y, Cui K, Wang L, Chen S. The electrodeposition of Ag nanoparticles on a type I
collagen-modified glassy carbon electrode and their applications as a hydrogen peroxide sensor.
Nanotechnology 2009;20(10):105501.
[43] Lu W, Chang G, Luo Y, Liao F, Sun X. Method for effective immobilization of Ag
nanoparticles/graphene oxide composites on single-stranded DNA modified gold electrode for
enzymeless H2O2 detection. J Mater Sci 2011;46(15):5260-6. English.
[44] Tian J, Li H, Lu W, Luo Y, Wang L, Sun X. Preparation of Ag nanoparticle-decorated
poly(m-phenylenediamine) microparticles and their application for hydrogen peroxide detection.
Analyst 2011;136(9):1806-9.
23
[45] Lu W, Liao F, Luo Y, Chang G, Sun X. Hydrothermal synthesis of well-stable silver
nanoparticles and their application for enzymeless hydrogen peroxide detection. Electrochim
Acta 2011;56(5):2295-8.
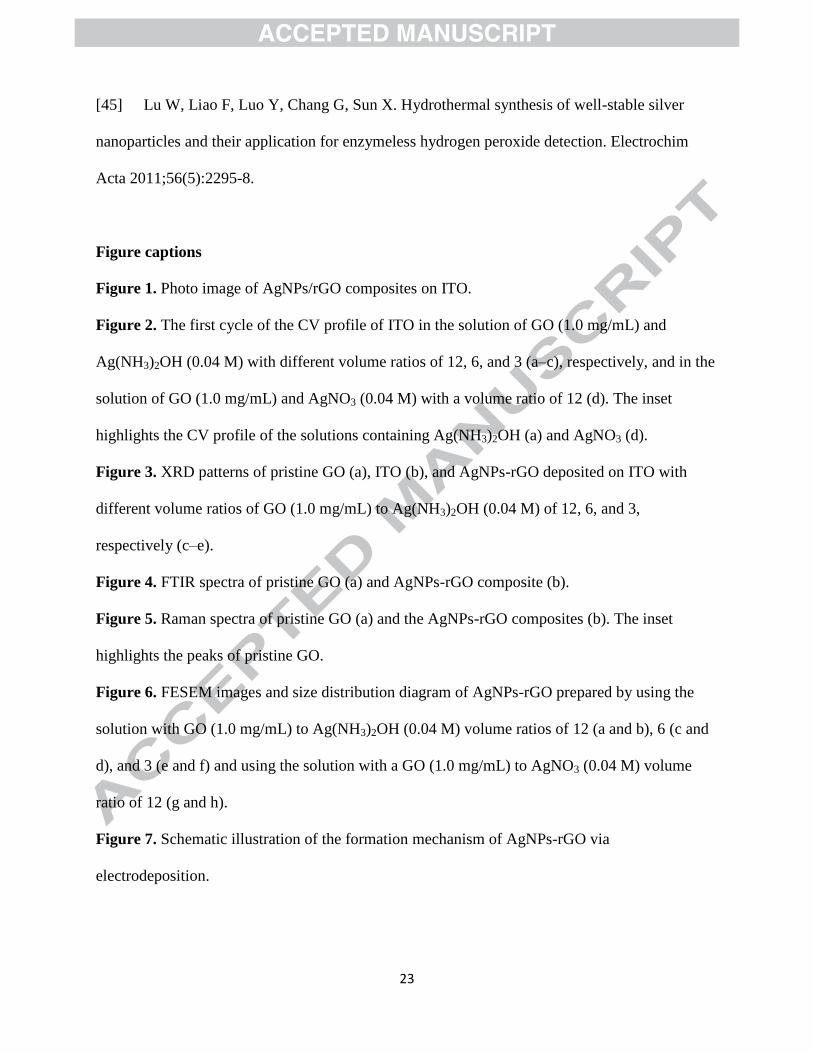
Figure captions
Figure 1. Photo image of AgNPs/rGO composites on ITO.
Figure 2. The first cycle of the CV profile of ITO in the solution of GO (1.0 mg/mL) and
Ag(NH3)2OH (0.04 M) with different volume ratios of 12, 6, and 3 (a–c), respectively, and in the
solution of GO (1.0 mg/mL) and AgNO3 (0.04 M) with a volume ratio of 12 (d). The inset
highlights the CV profile of the solutions containing Ag(NH3)2OH (a) and AgNO3 (d).
Figure 3. XRD patterns of pristine GO (a), ITO (b), and AgNPs-rGO deposited on ITO with
different volume ratios of GO (1.0 mg/mL) to Ag(NH3)2OH (0.04 M) of 12, 6, and 3,
respectively (c–e).
Figure 4. FTIR spectra of pristine GO (a) and AgNPs-rGO composite (b).
Figure 5. Raman spectra of pristine GO (a) and the AgNPs-rGO composites (b). The inset
highlights the peaks of pristine GO.
Figure 6. FESEM images and size distribution diagram of AgNPs-rGO prepared by using the
solution with GO (1.0 mg/mL) to Ag(NH3)2OH (0.04 M) volume ratios of 12 (a and b), 6 (c and
d), and 3 (e and f) and using the solution with a GO (1.0 mg/mL) to AgNO3 (0.04 M) volume
ratio of 12 (g and h).
Figure 7. Schematic illustration of the formation mechanism of AgNPs-rGO via
electrodeposition.
24
Figure 8. CVs of various electrodes in 0.2 M PBS (pH 6.5) in the presence of 1.0 mM H2O2:
bare ITO (a), AgNPs-rGO/ITO prepared by using different volume ratios of GO (1.0 mg/mL) to
Ag(NH3)2OH (0.04 M) of 12, 6, and 3, respectively (b–d), and AgNPs-rGO/ITO prepared by
using the solution with GO (1.0 mg/mL) to AgNO3 (0.04 M) volume ratio of 12 (e).
Figure 9. Steady-state response of the AgNPs-rGO-2/ITO electrode to successive injection of
H2O2 into the stirred 0.2 M PBS (pH 6.5) with an applied potential of –0.3 V. The inset is the
corresponding calibration curve.
Table 1. A comparison of this work with works in the literature regarding the performance of the
H2O2 assays.
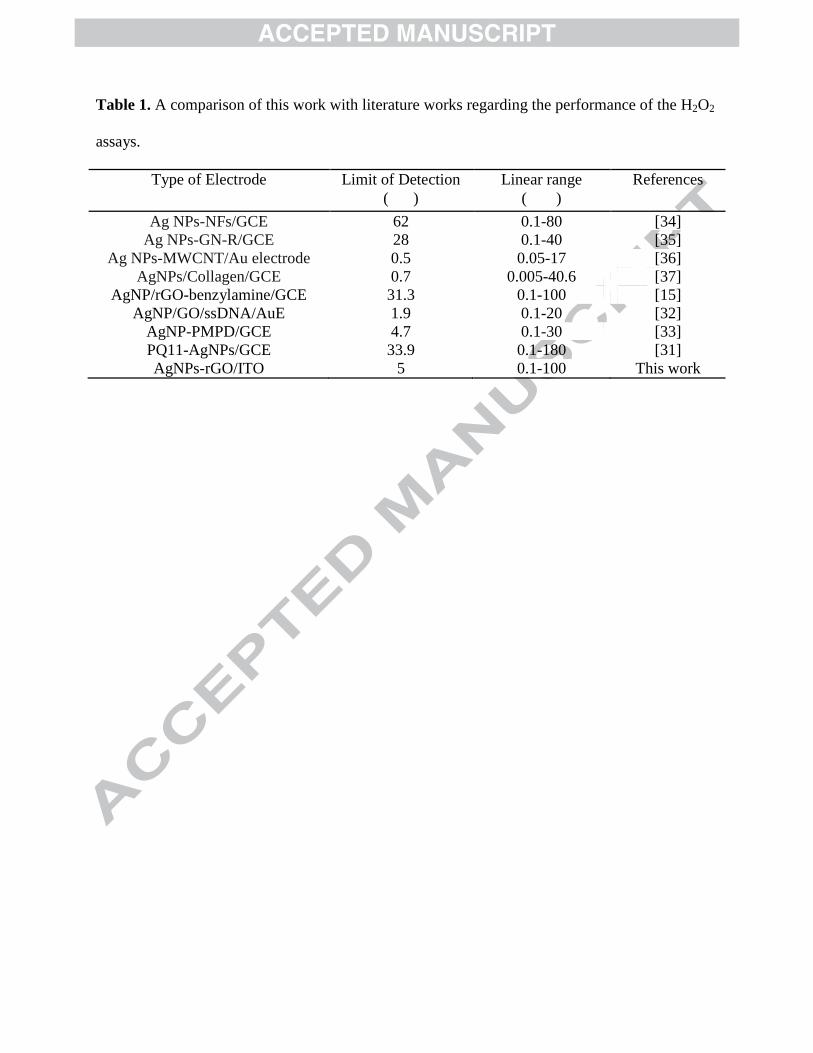
Table 1. A comparison of this work with literature works regarding the performance of the H2O2
assays.
Type of Electrode Limit of Detection
( )
Linear range
( )
References
Ag NPs-NFs/GCE 62 0.1-80 [34]
Ag NPs-GN-R/GCE 28 0.1-40 [35]
Ag NPs-MWCNT/Au electrode 0.5 0.05-17 [36]
AgNPs/Collagen/GCE 0.7 0.005-40.6 [37]
AgNP/rGO-benzylamine/GCE 31.3 0.1-100 [15]
AgNP/GO/ssDNA/AuE 1.9 0.1-20 [32]
AgNP-PMPD/GCE 4.7 0.1-30 [33]
PQ11-AgNPs/GCE 33.9 0.1-180 [31]
AgNPs-rGO/ITO 5 0.1-100 This work
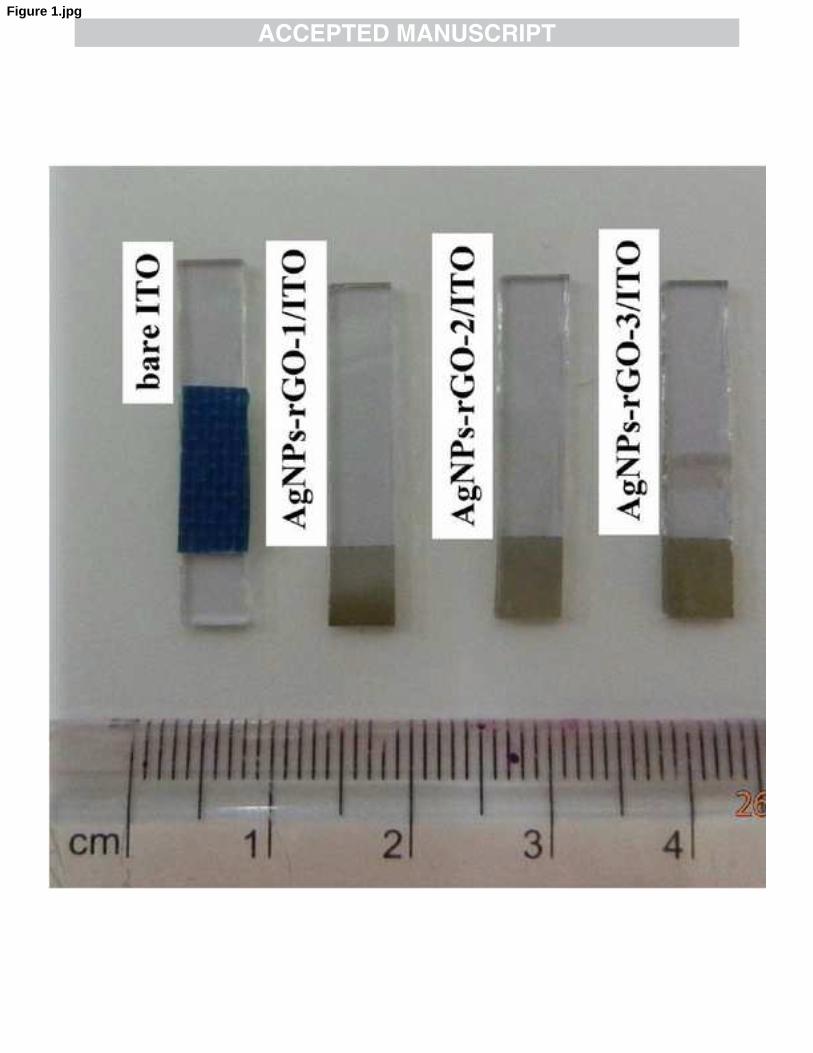
Figure 1.jpg
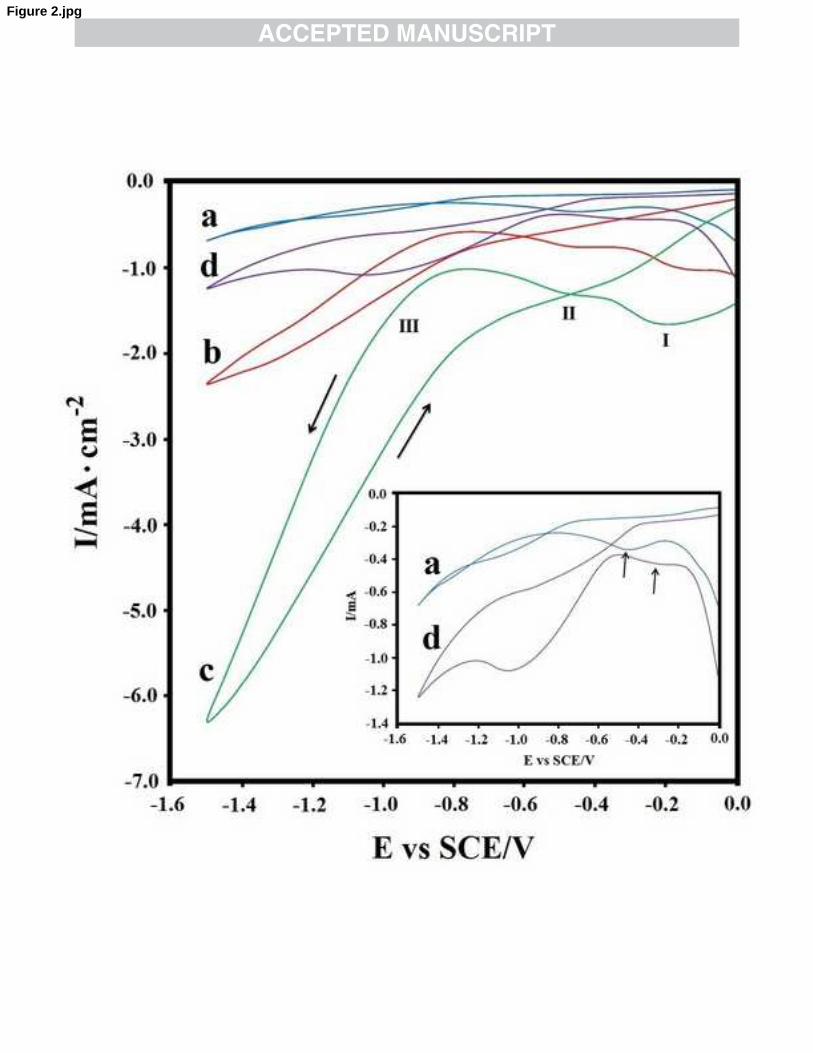
Figure 2.jpg
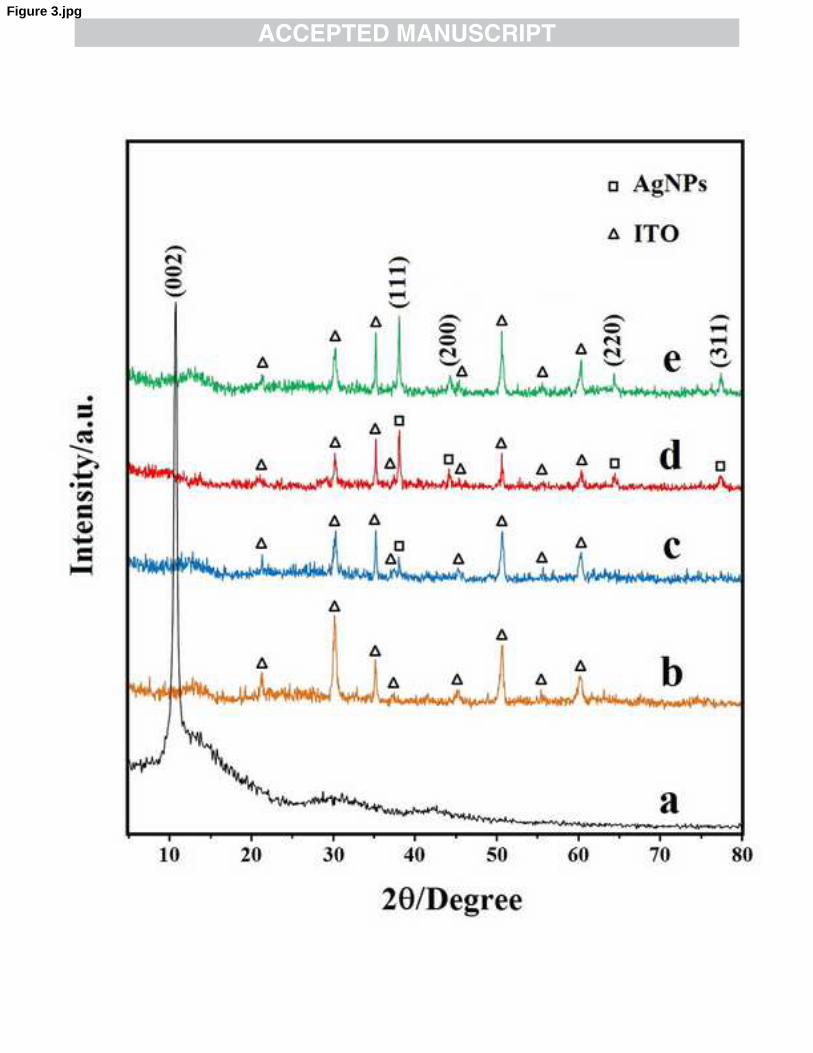
Figure 3.jpg
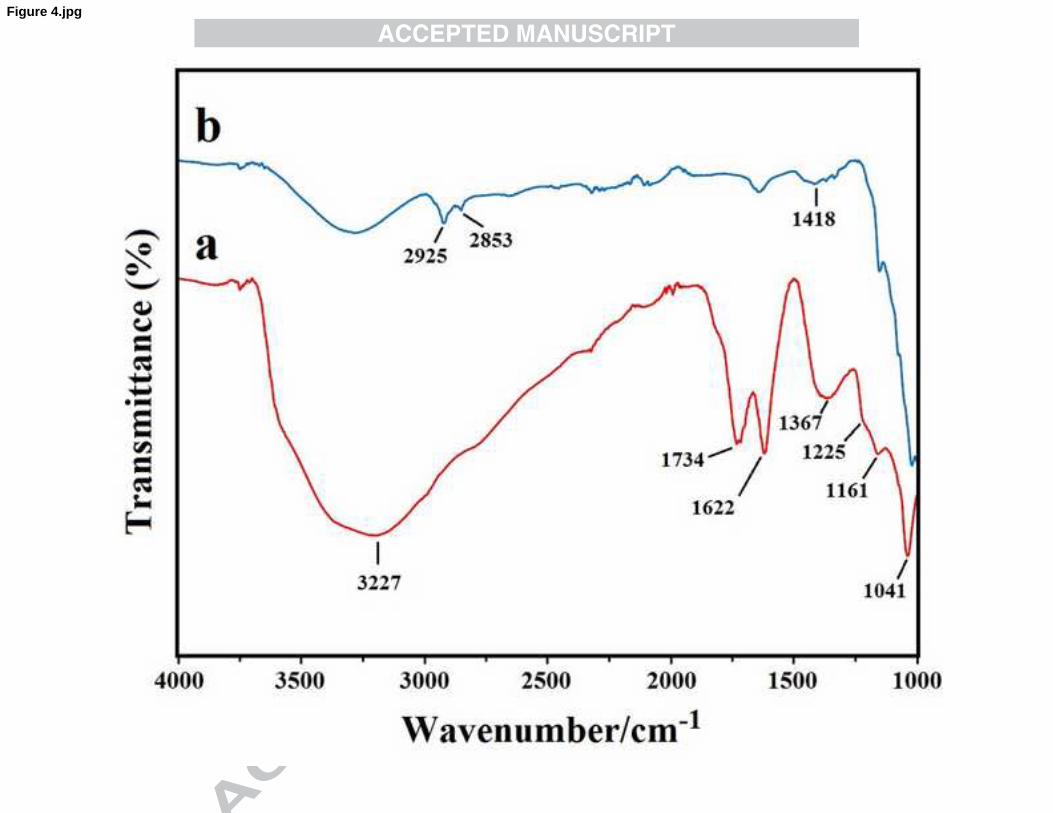
Figure 4.jpg
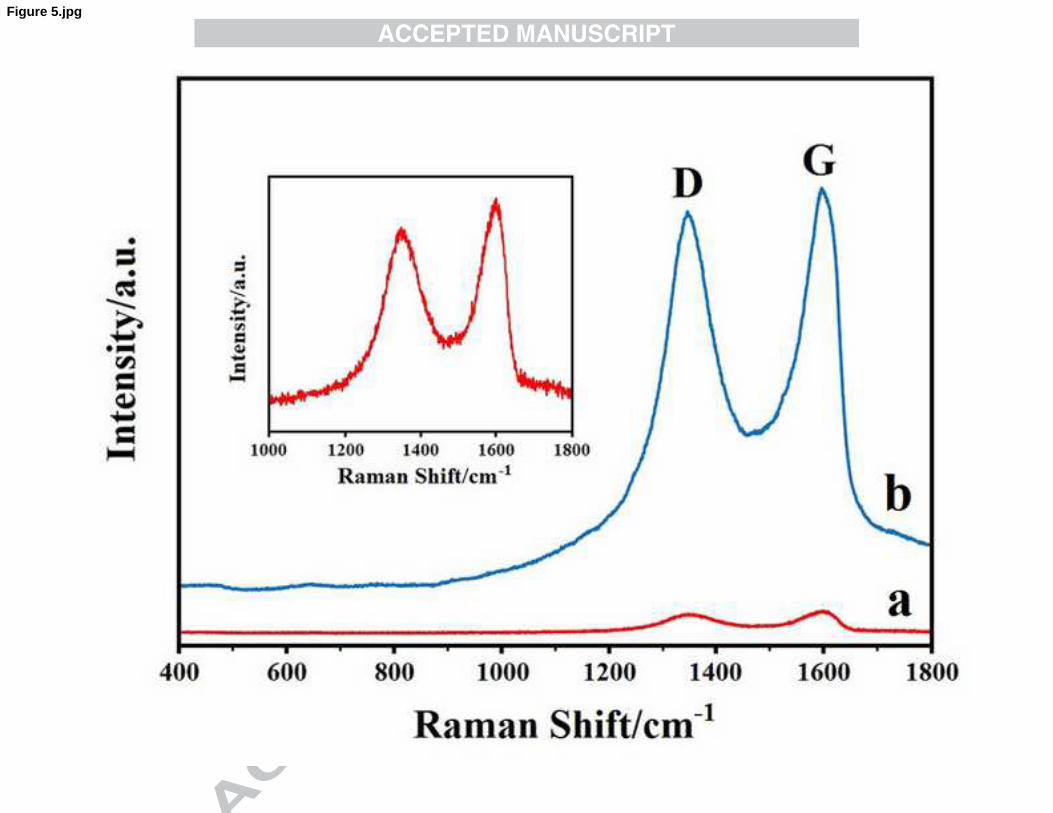
Figure 5.jpg
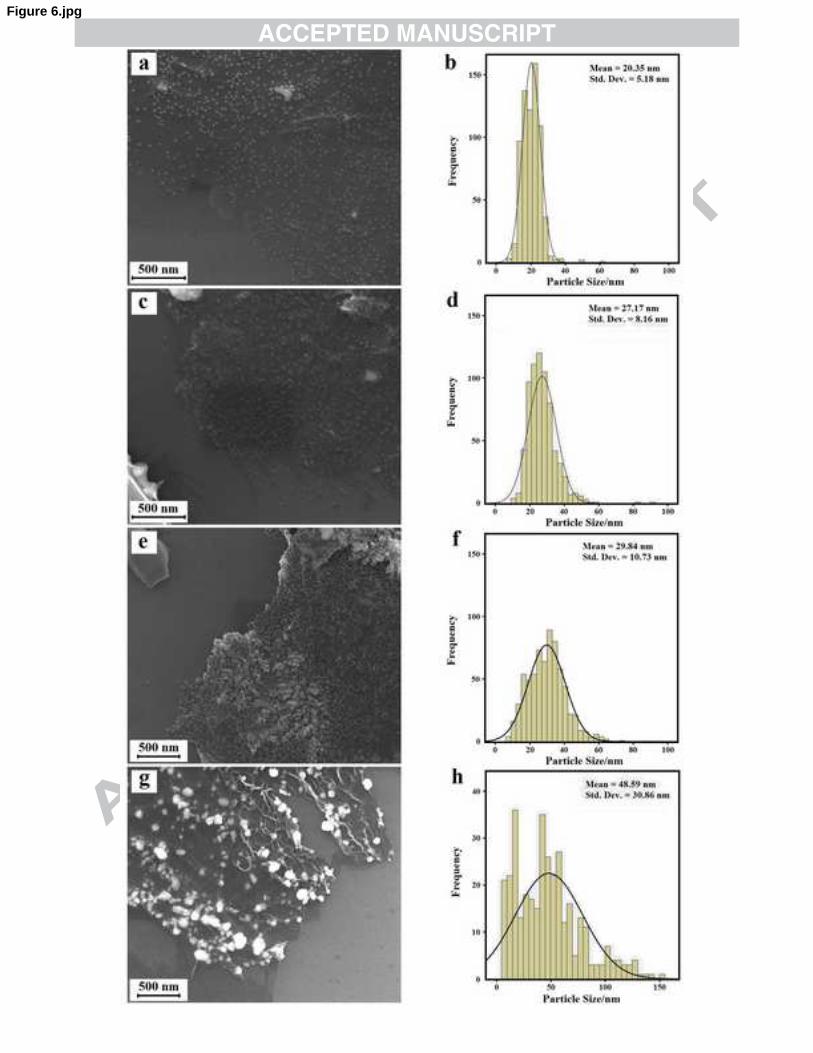
Figure 6.jpg