Embed Size (px)
Citation preview
Musgrave PWA Polda
2016 Groundwater level and salinity status report
Department of Environment, Water and Natural Resources
GPO Box 1047, Adelaide SA 5001
Telephone National (08) 8463 6946
International +61 8 8463 6946
Fax National (08) 8463 6999
International +61 8 8463 6999
Website www.environment.sa.gov.au
Disclaimer
The Department of Environment, Water and Natural Resources and its employees do not warrant or make any representation
regarding the use, or results of the use, of the information contained herein as regards to its correctness, accuracy, reliability,
currency or otherwise. The Department of Environment, Water and Natural Resources and its employees expressly disclaims all
liability or responsibility to any person using the information or advice. Information contained in this document is correct at the
time of writing.
This work is licensed under the Creative Commons Attribution 4.0 International License.
To view a copy of this license, visit http://creativecommons.org/licenses/by/4.0/
© Crown in right of the State of South Australia, through the Department of Environment, Water and Natural Resources 2017
ISBN 978-1-925510-83-6
Preferred way to cite this publication
DEWNR (2017). Musgrave PWA Polda 2016 Groundwater level and salinity status report, Government of South Australia, Department
of Environment, Water and Natural Resources, Adelaide.
Download this document at www.waterconnect.sa.gov.au
2016 Musgrave PWA Polda groundwater status report 1
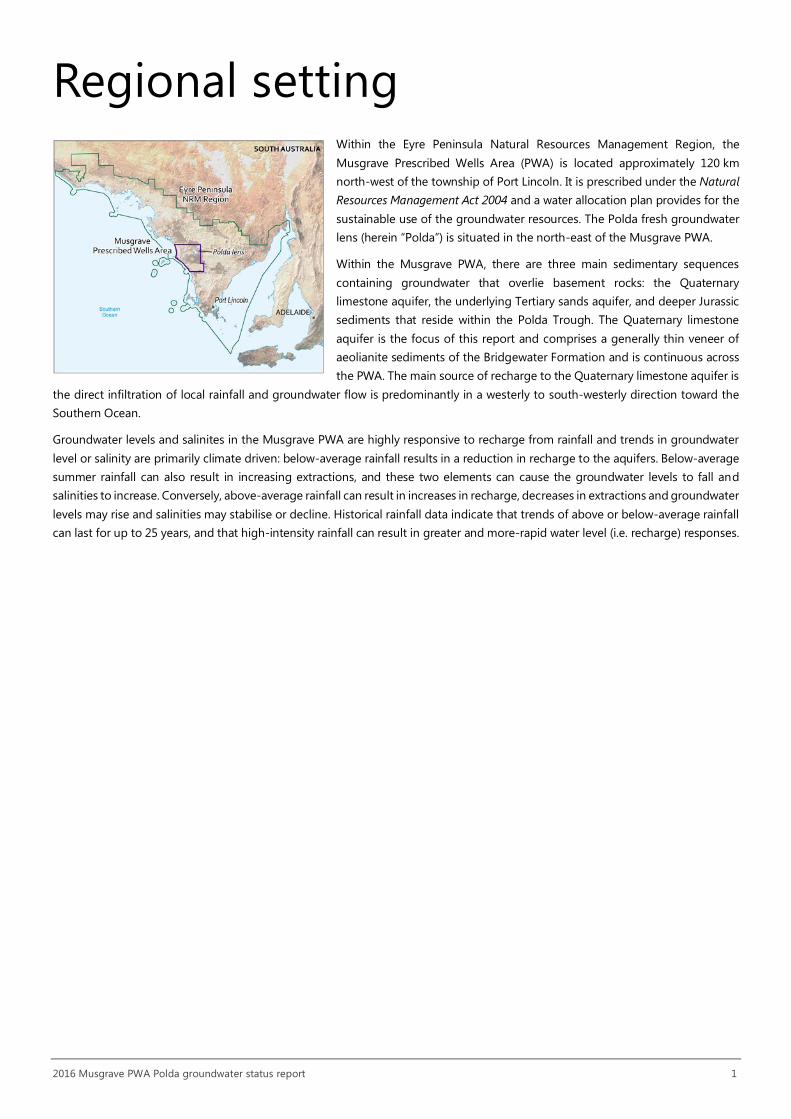
Regional setting Within the Eyre Peninsula Natural Resources Management Region, the
Musgrave Prescribed Wells Area (PWA) is located approximately 120 km
north-west of the township of Port Lincoln. It is prescribed under the Natural
Resources Management Act 2004 and a water allocation plan provides for the
sustainable use of the groundwater resources. The Polda fresh groundwater
lens (herein “Polda”) is situated in the north-east of the Musgrave PWA.
Within the Musgrave PWA, there are three main sedimentary sequences
containing groundwater that overlie basement rocks: the Quaternary
limestone aquifer, the underlying Tertiary sands aquifer, and deeper Jurassic
sediments that reside within the Polda Trough. The Quaternary limestone
aquifer is the focus of this report and comprises a generally thin veneer of
aeolianite sediments of the Bridgewater Formation and is continuous across
the PWA. The main source of recharge to the Quaternary limestone aquifer is
the direct infiltration of local rainfall and groundwater flow is predominantly in a westerly to south-westerly direction toward the
Southern Ocean.
Groundwater levels and salinites in the Musgrave PWA are highly responsive to recharge from rainfall and trends in groundwater
level or salinity are primarily climate driven: below-average rainfall results in a reduction in recharge to the aquifers. Below-average
summer rainfall can also result in increasing extractions, and these two elements can cause the groundwater levels to fall and
salinities to increase. Conversely, above-average rainfall can result in increases in recharge, decreases in extractions and groundwater
levels may rise and salinities may stabilise or decline. Historical rainfall data indicate that trends of above or below-average rainfall
can last for up to 25 years, and that high-intensity rainfall can result in greater and more-rapid water level (i.e. recharge) responses.
2016 Musgrave PWA Polda groundwater status report 2
2016 Status Polda, in the Musgrave PWA, has been assigned a green status for 2016:
2016 Status
Positive trends have been observed over the past five years
The 2016 status for Polda is based on:
most monitoring wells (97%) show a five-year trend of rising or stable groundwater levels
most monitoring wells (87%) show a five-year trend of decreasing or stable salinity.
Rainfall
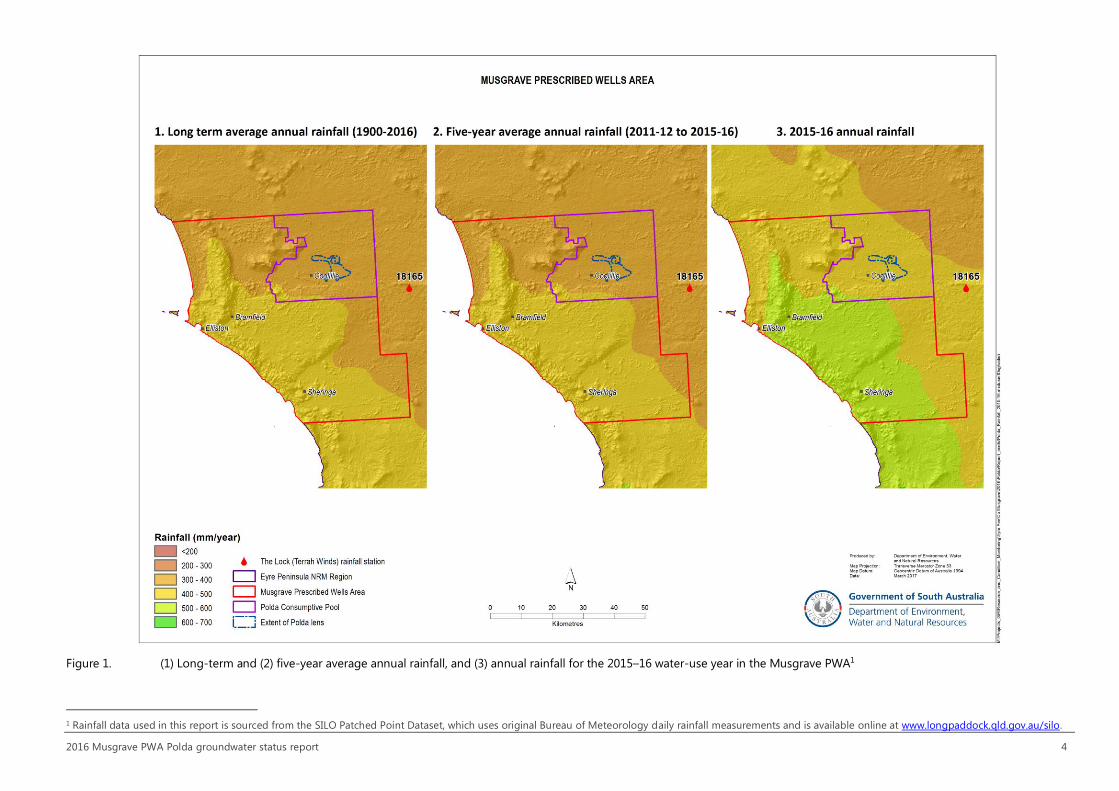
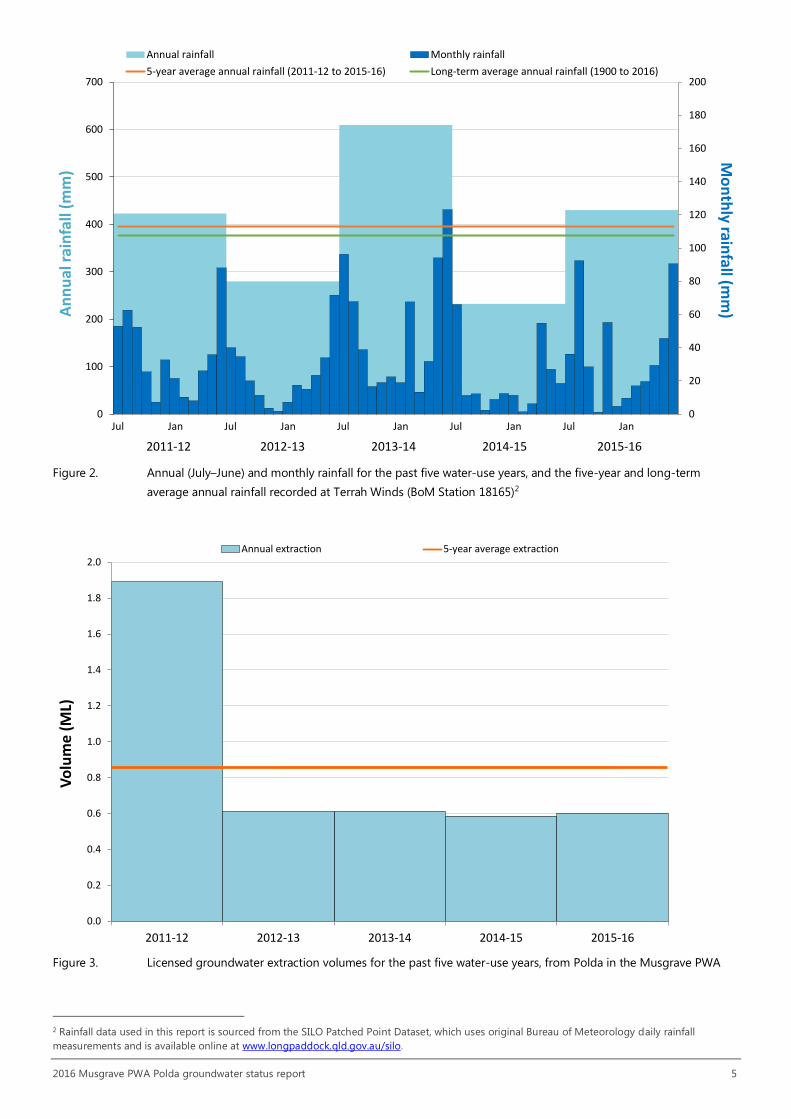
The Lock (Terrah Winds) rainfall station (BoM Station 18165), which is located to the south-east of Polda, recorded 430 mm of
rainfall in 2015–16 water-use year. This is 14% greater than the long-term annual average rainfall of 376 mm (1900–2016) and 9%
greater than the five-year average of 395 mm (Figs 1 and 2). In the 2015–16 water use year, the months of October and December
recorded rainfall markedly lower than their respective long-term monthly average, while August, November and June recorded
rainfall considerably above their long-term monthly average (Fig. 2). There appears to be a trend of increasing rainfall in the west
and south-western parts of the PWA when comparing 2015–16 rainfall with five-year and long-term average annual rainfall (Fig. 1).
Water use
Within Polda, licensed extractions occur from the fresh groundwater lens within the Quaternary limestone aquifer. In 2015–16,
metered licensed extractions from Polda totalled 600 kL, which is consistent with the extraction volumes recorded over the past
four water-use years and 30% less than the five-year average extraction of 859 kL (Fig. 3).
Groundwater levels
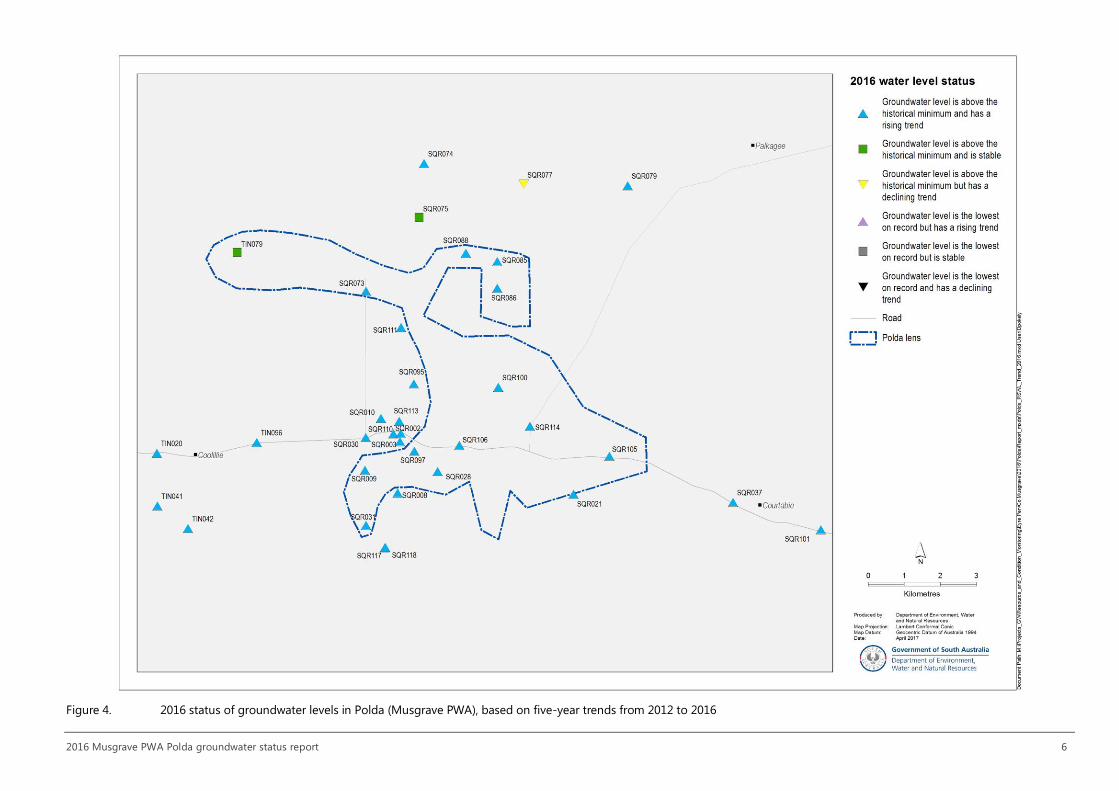
In the five years to 2016, 34 monitoring wells (97%) within Polda monitoring network show a trend of rising or stable groundwater
levels. Rates of rise in groundwater levels range between 0.01 and 0.11 m/y with a median of 0.07 m/y. Only one well shows a
declining trend of 0.01 m/y, and is located west of the township of Palkagee (Fig. 4).
Groundwater salinity
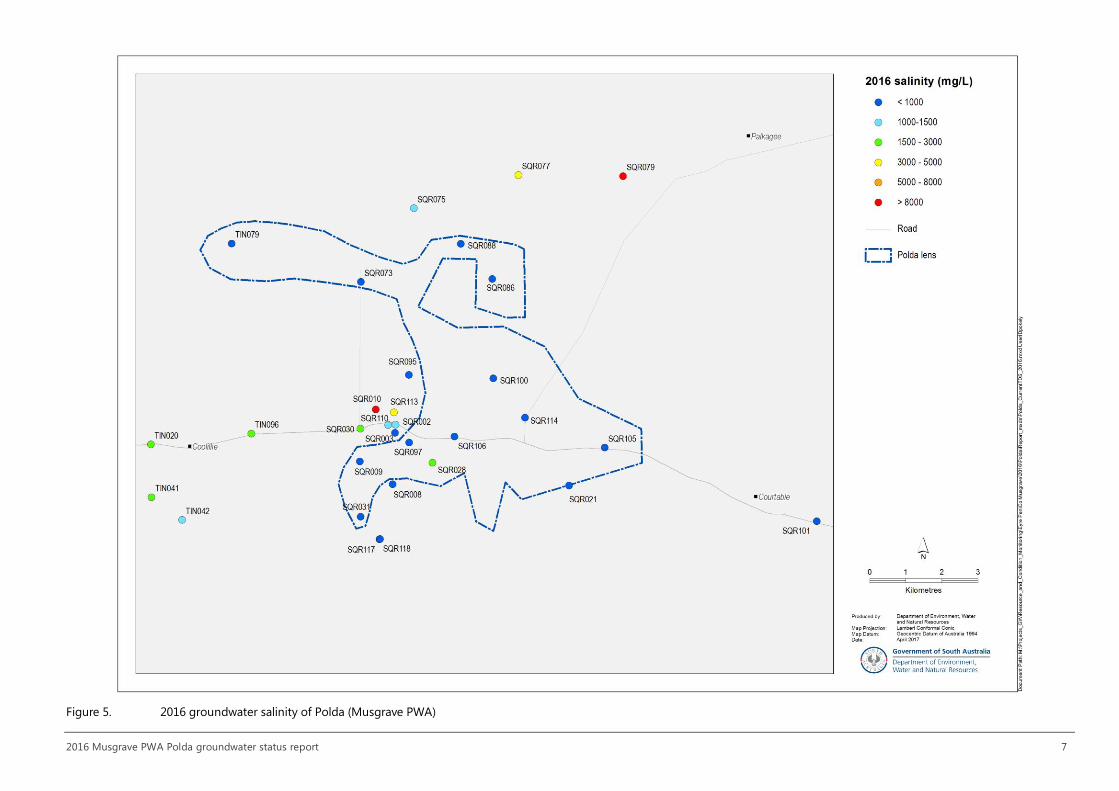
In 2016, monitoring wells within Polda network show salinities ranging between 400 and 13,600 mg/L, 27 of which (87%) measure
less than 3000 mg/L, with a median of 854 mg/L. The remaining four wells show salinities greater than 3000 mg/L and are located
west and north of Polda (Fig. 5).
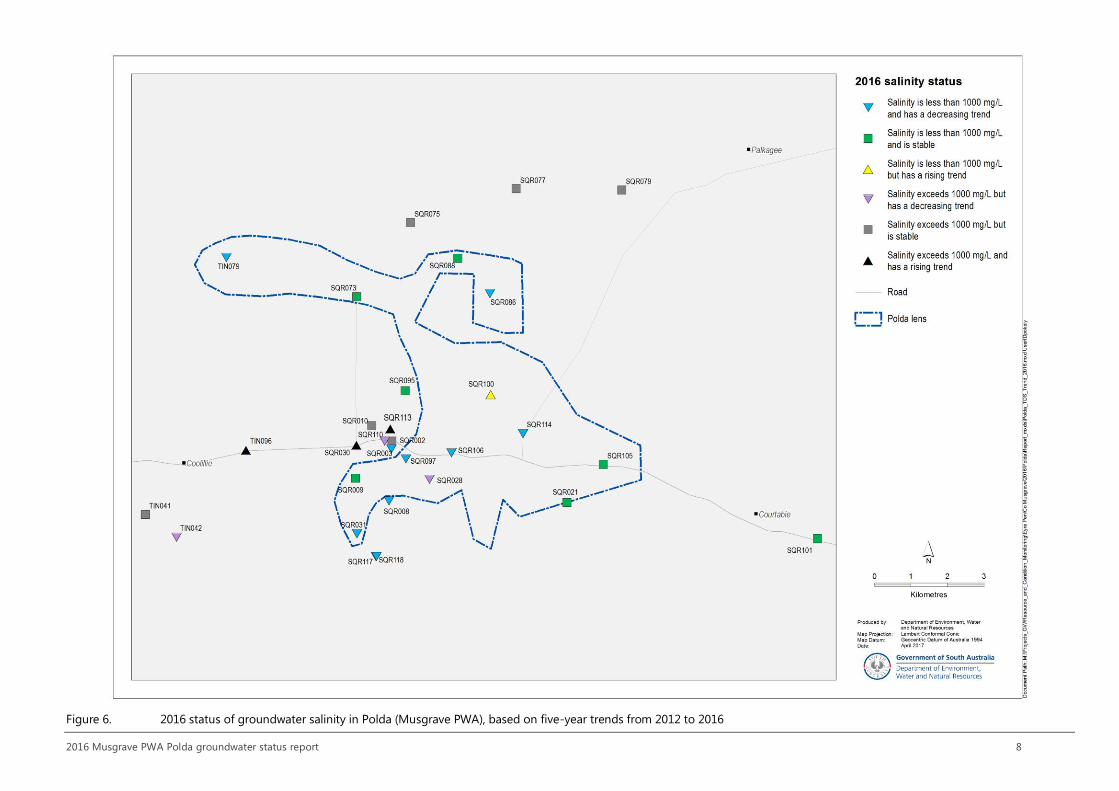
In the five years to 2016, 26 of 30 wells (87%), show a trend of decreasing or stable salinity (Fig. 6). Rates of decrease in salinity
range from 16 to 357 mg/L/y with a median of 27 mg/L/y. The remaining four wells (13%) show a rising trend at rates ranging from
36 to 120 mg/L/y and these wells are located generally west of Polda in an area of naturally high groundwater salinity.
2016 Musgrave PWA Polda groundwater status report 3
More information To determine the status of Polda for 2016, the trends in groundwater levels and salinities over the past five years (2012 to 2016,
inclusive) were analysed. This is a new approach, in contrast to the year-to-year assessments that have been used in past
Groundwater level and salinity status reports. Please visit the Frequently Asked Questions on the Water Resource Assessments page
on WaterConnect for more detail on the current method of evaluating the status of groundwater resources.
To view descriptions for all status symbols, please visit the Water Resource Assessments page on WaterConnect.
To view the Musgrave Prescribed Wells Area Groundwater Level and Salinity Status Report 2011, which includes background
information on hydrogeology, rainfall and relevant groundwater-dependent ecosystems, please visit the Water Resource
Assessments page on WaterConnect.
To view or download groundwater level and salinity data from monitoring wells within the Musgrave PWA, please visit Groundwater
Data on WaterConnect.
For further details about the Musgrave PWA, please see the Water Allocation Plan for the Southern Basins and the Musgrave
Prescribed Wells Areas on the Eyre Peninsula Natural Resources website.
2016 Musgrave PWA Polda groundwater status report 4
Figure 1. (1) Long-term and (2) five-year average annual rainfall, and (3) annual rainfall for the 2015–16 water-use year in the Musgrave PWA1
1 Rainfall data used in this report is sourced from the SILO Patched Point Dataset, which uses original Bureau of Meteorology daily rainfall measurements and is available online at www.longpaddock.qld.gov.au/silo.
2016 Musgrave PWA Polda groundwater status report 5
Figure 2. Annual (July–June) and monthly rainfall for the past five water-use years, and the five-year and long-term
average annual rainfall recorded at Terrah Winds (BoM Station 18165)2
Figure 3. Licensed groundwater extraction volumes for the past five water-use years, from Polda in the Musgrave PWA
2 Rainfall data used in this report is sourced from the SILO Patched Point Dataset, which uses original Bureau of Meteorology daily rainfall
measurements and is available online at www.longpaddock.qld.gov.au/silo.
0
20
40
60
80
100
120
140
160
180
200
0
100
200
300
400
500
600
700
2011-12 2012-13 2013-14 2014-15 2015-16
Mo
nth
ly rainfall (m
m)A
nn
ual
rai
nfa
ll (m
m)
Jul Jan Jul Jan Jul Jan Jul Jan Jul Jan
Annual rainfall Monthly rainfall
5-year average annual rainfall (2011-12 to 2015-16) Long-term average annual rainfall (1900 to 2016)
0.0
0.2
0.4
0.6
0.8
1.0
1.2
1.4
1.6
1.8
2.0
2011-12 2012-13 2013-14 2014-15 2015-16
Vo
lum
e (
ML)
Annual extraction 5-year average extraction
2016 Musgrave PWA Polda groundwater status report 6
Figure 4. 2016 status of groundwater levels in Polda (Musgrave PWA), based on five-year trends from 2012 to 2016
2016 Musgrave PWA Polda groundwater status report 7
Figure 5. 2016 groundwater salinity of Polda (Musgrave PWA)
2016 Musgrave PWA Polda groundwater status report 8
Figure 6. 2016 status of groundwater salinity in Polda (Musgrave PWA), based on five-year trends from 2012 to 2016

Front Cover © Graham Green, Principal Hydrogeologist, DEWNR
2017 © Department of Environment, Water and Natural Resources Published 2017 | FIS 94502www.environment.sa.gov.au