Embed Size (px)
Citation preview

Produced with the kind Support of
Myocardial Perfusion Imaging (Revised Edition)
A Technologist’s Guide
Produced with the kind Support of
Publications · Brochures

Ryder, Helen (Dublin)
Testanera, Giorgio (Rozzano, Milan)
Veloso Jerónimo, Vanessa (Almada)
Vidovič, Borut (Munich)
Contributors
Abreu, Carla (London)
Acampa, Wanda (Naples)
Assante, Roberta (Naples)
Ballinger, James (London)
Fragoso Costa, Pedro (Oldenburg)
Figueredo, Sergio (Lisbon)
Geão, Ana (Lisbon)
Ghilardi, Adriana (Bergamo)
Holbrook, Scott (Gray)
Koziorowski, Jacek (Linköping)
Lezaic, Luka (Ljubljana)
Mann, April (South Hadley)
Medolago, Giuseppe (Bergamo)
Pereira, Edgar (Almada)
Santos, Andrea (Alverca do Ribatejo)
Vara, Anil (Brighton)
Zampella, Emilia (Naples)
Editors
EAN
M
3
Foreword 4
Introduction 5Borut Vidovič
Chapter 1 State of the Art in Myocardial Imaging 6Wanda Acampa, Emilia Zampella and Roberta Assante
Chapter 2 Clinical Indications 16Luka Lezaic
Chapter 3 Patient Preparation and Stress Protocols 23Giuseppe Medolago and Adriana Ghilardi
Chapter 4 Multidisciplinary Approach and Advanced Practice 35Anil Vara
Chapter 5 Advances in Radiopharmaceuticals for Myocardial Perfusion Imaging 42James R. Ballinger and Jacek Koziorowski
Chapter 6 SPECT and SPECT/CT Protocols and New Imaging Equipment 54Andrea Santos and Edgar Lemos Pereira
Chapter 7 PET/CT Protocols and Imaging Equipment (*) 62April Mann and Scott Holbrook
Chapter 8 Image Processing and Software 77Sérgio Figueiredo and Pedro Fragoso Costa
Chapter 9 Artefacts and Pitfalls in Myocardial Imaging (SPECT, SPECT/CT and PET/CT) 109Ana Geão and Carla Abreu
Imprint 126
(*) Articles were written with the kind support of and in cooperation with:
Contents
Prin
ted
in a
ccor
danc
e w
ith th
e Au
stria
n Ec
o-La
bel f
or p
rinte
d m
atte
rs.
4
The EANM Technologist Committee was created more than 20 years ago. From the outset it worked not only to improve the pro-fessional expertise of nuclear medicine tech-nologists (NMTs) in Europe but also to assist in raising the quality of Nuclear Medicine clinical practice. Over the past two decades, it has developed continuously to become an important group within the EANM.
With the above-mentioned goals of the Committee in mind, in early 2004 the idea of providing a series of books on imaging for technologists was conceived. By September 2004, thanks to the hard work of the EANM Technologist Sub-committee on Education, it was possible to publish the first Technolo-gist’s Guide, dedicated to myocardial perfu-sion scintigraphy. The success of this first guide led the Technologist Committee to propose a new book every year, starting a series of guides that is still ongoing.
The technological advancements in Nuclear Med-icine and Molecular Imaging of the past decade have necessitated an upgrading of this pioneer-ing series, and the EANM Technologist Commit-tee accordingly decided to expand it to encom-pass recent developments in scanner technology, radiopharmaceuticals and stress tests.
Myocardial perfusion imaging (MPI) has a leading role in cardiological diagnostic pro-tocols due to its great efficiency in detecting ventricular perfusion defects with an almost non-invasive procedure. MPI is, however, a challenging methodology for technologists, who may cover various roles in the proce-
dural workflow and need to cooperate with different professionals including nurses, phy-sicians, cardiologists and radiopharmacists.
The current book is specifically aimed at radiographers and technologists working or intending to work in a Nuclear Medicine department performing MPI; it will also have value for other healthcare professionals working or willing to work in this challenging environment. As you will see, some chapters from the previous edition of the guide have been revised and updated by the authors while new chapters and new contributors have been added to extend and further im-prove the quality of the book.
I would like to thank all those who have contributed to the realisation of this project, whether as authors or reviewers, without whom the book would not have been pos-sible. I also wish to thank SNMMITS (Society of Nuclear Medicine and Molecular Imaging Technologist Section) and EANM Cardiovas-cular Committee for their help and high-quality contributions.
Special thanks are due to Helen Ryder, Vanessa Veloso Jerónimo and Borut Vidovič for their in-credible enthusiasm and competence in deal-ing with the editorial duties and organisation-al work. Finally, I remain extremely grateful to the EANM Board, the EANM Executive Office, the Technologist Committee and all the other EANM committees involved in the project.
Giorgio Testanera Chair, EANM Technologist Committee
Foreword
EAN
M
5
IntroductionBorut Vidovič
Cardiovascular diseases are the leading cause of morbidity and mortality in the developed world, and their frequency is also increasing in less developed countries [1]. Reliable and rapid diagnosis is important to reduce the number of deaths and allow introduction of appropriate therapy at a very early stage of the disease.
Given that the last EANM Technologist’s Guide entitled Myocardial Perfusion Imaging was released way back in 2004, it is certainly time for this new book. During the interven-ing period, Nuclear Medicine Cardiology has made great progress, with the development of new radiopharmaceuticals for myocardial perfusion imaging and the introduction of new imaging equipment with new post-processing programs.
This book provides the reader with informa-tion on the current state of the art in myo-cardial imaging in Nuclear Medicine. It opens by introducing all the myocardial imaging methods, including those beyond Nuclear Medicine. The common clinical indications for myocardial perfusion scintigraphy are then discussed, followed by guidance on patient preparation and the different types of stress protocol and presentation of the main advantages and disadvantages of the multidisciplinary approach and advanced practice. Advances in radiopharmaceuticals for myocardial perfusion imaging are then introduced. The following three chapters are more technically oriented, enabling the reader to learn about the different SPECT, SPECT/CT, D-SPECT and PET/CT protocols
and the imaging equipment, with image processing and software. The final chapter elucidates the causes and effects of potential artefacts and pitfalls in myocardial perfusion imaging.
I would like to thank all the authors who have taken the time to write the chapters and all of my fellow editors who have helped to create this book. I hope all professionals who work in the area of Nuclear Medicine Cardiology or are interested in this topic will enjoy reading and using the book.
Reference 1. http://epp.eurostat.ec.europa.eu/cache/ITY_OFFPUB/
KS-30-08-357/EN/KS-30-08-357-EN.PDF, accessed July 2014
6
IntroductionThe prevalence of coronary artery disease (CAD) is rising, and non-invasive myocardial imaging is increasingly being used to:
• Detect obstructive CAD and define the number, location and significance of coro-nary stenoses
• Guide medical therapy and monitor the treatment effect after revascularisation procedures
• Risk stratify patients and provide prognos-tic information
• Assess myocardial viability
Nuclear myocardial perfusion imaging pro-cedures, such as myocardial perfusion single-photon emission computed tomography (MPS) and positron emission tomography (PET), have emerged not only as diagnostic techniques but also as robust prognostic tools able to provide data about myocardial perfusion, ventricular function and viability by means of a single test.
Several other imaging modalities are avail-able for evaluation of the presence and se-verity of CAD, including echocardiography, cardiac computed tomography and cardiac magnetic resonance imaging (CMR). The most appropriate imaging modality should be chosen according to the clinical question, patient characteristics, strengths, limitations, risks, costs and availability.
Myocardial perfusion single-photon emission computed tomography Myocardial perfusion imaging is the stress imaging procedure that is most widely used in the management of patients with coro-nary artery disease (CAD) [1]. Gated MPS pro-vides important information on the extent and severity of myocardial perfusion abnor-malities, including myocardial ischaemia, left ventricular (LV) cavity size and function, and mechanical dyssynchrony. Moreover, it can deliver miscellaneous prognostic imag-ing data regarding, for example, transient ischaemic dilation (TID), lung uptake, right ventricular uptake, post-stress left ventricu-lar ejection fraction (LVEF) and sphericity in-dex. One of the reasons for use of MPS in the management of patients with suspected or known CAD is that it can be performed in any patient, even in those with a poor “acoustic window”, implanted metal objects, cardiac dysrhythmias or renal dysfunction. With the introduction of pharmacological stressor agents, MPS can now be safely performed in most patients who would not be candidates for exercise stress, thereby adding flexibil-ity in testing strategy and affording greater availability of the test to virtually all patients. The concern of radiation exposure, although a real one, has been proactively addressed through scientific innovation and appropri-ate changes in MPS guidelines. The introduc-tion of new-generation gamma cameras, which allow acquisition of high-quality im-ages using smaller doses of radiotracers, has
Chapter 1State of the Art in Myocardial Imaging
Wanda Acampa, Emilia Zampella and Roberta Assante
EAN
M
7
Chapter 1 State of the Art in Myocardial Imaging
the potential to decrease patient radiation exposure. Low-dose protocols have been shown to yield high-quality images while limiting radiation exposure to as little as 1–2 mSv [2]. The last three decades have also wit-nessed changes in radionuclide use (less du-al-isotope imaging) and imaging sequences (more stress/rest imaging with the option of stress only) and improvements in processing software that incorporate iterative recon-struction techniques.
New-generation cardiac scanners: cadmium-zinc-telluride detectorsIn new-generation dedicated cardiac ultra-fast-acquisition scanners, eight detectors surrounding the patient simultaneously im-age the heart. These new designs vary in respect of the number and type of scanning or stationary detectors and whether NaI, CsI or cadmium-zinc-telluride (CZT) solid-state detectors are used. They all have in common the potential for a five- to tenfold increase in count sensitivity at no loss of, or even a gain in, resolution, resulting in the potential for ac-quisition of a scan within 2 min or less if the patient is injected with a standard dose.
The introduction of modern dedicated gam-ma cameras allows some limitations of Anger SPECT, such as the lengthy acquisition time and radiation exposure, to be overcome. Traditional Anger SPECT uses collimators to direct photons towards a scintillation crystal, and a photomultiplier tube converts and am-
plifies the light signal into an electrical signal. This requires a large number of photons to be incident at the detectors. Novel semicon-ductor CZT SPECT uses detectors that direct-ly convert photon energy into an electrical signal, eliminating the photomultiplier tube and resulting in better energy resolution and a much more compact detector. This new geometric design and the new detector ma-terial, combined with novel reconstruction algorithms, have led to improved diagnostic performance of CZT SPECT, with reduction of acquisition times and radiation dose (4.2 mSv vs 11.8 mSv) [3] without any significant sac-rifice in accuracy. Low-dose protocols have been shown to yield high-quality images and several studies have not only revealed a good concordance with results provided by a conventional Anger camera but also dem-onstrated that the physical characteristics of CZT cameras, such as their enhanced count sensitivity, have the potential to improve on and therefore modify the results from Anger SPECT.
SPECT/CT camerasHybrid systems combining SPECT and com-puted tomography (CT) acquisition are available. SPECT/CT devices can perform CT acquisitions for attenuation correction of SPECT data and to estimate the coronary calcium score. For clinical applications, these devices permit 3D fusion display of SPECT and CT images, thereby allowing accurate assignment of a stenotic coronary vessel to
8
the corresponding stress-induced myocar-dial perfusion defect [4]. SPECT/CT increases the diagnostic accuracy of SPECT imaging in patients with suspected and known CAD and myocardial perfusion defects at SPECT imaging. Moreover, in patients with normal perfusion at SPECT and suspected three-vessel disease, SPECT/CT can provide useful information on risk stratification [4].
Diagnostic and prognostic value of MPSIn clinical practice, MPS is used to establish a diagnosis of CAD and to provide accurate risk stratification. Diagnostic accuracy of the method is influenced by several variables, such as pre-test likelihood of disease. Accu-racy in the identification of CAD has been demonstrated to be highest in patients with intermediate pre-test CAD likelihood. Similar-ly, when performed for the purpose of prog-nostic evaluation in patients with suspected or known CAD, MPS offers the greatest ben-efit in those at intermediate risk [5]. On the basis of MPS, a large majority of intermedi-ate-risk patients may be shifted to lower-risk cohorts (when the test result is negative) or higher-risk cohorts (in the setting of a mod-erately to severely abnormal perfusion scan). Published reports note that, on average, 53% of patients have normal or low-risk myocar-dial perfusion imaging results. Accordingly, it is expected that approximately half of inter-mediate-risk patients will be at low risk after testing, with an expected annual mortality of approximately 0.6% [6].
The prognostic power of MPS has been extensively evaluated, and several studies have demonstrated that it adds incremen-tal prognostic value to the information ob-tained from patient clinical variables, stress test and angiographic findings. SPECT has a high negative predictive value and pa-tients with normal MPS have an excellent prognosis, with an annual cardiac event rate <1% [7]. In these patients, in the absence of new symptoms and clinical conditions such as diabetes and known CAD, MPS may not need to be repeated for 3–5 years. Moreover, in patients with abnormal MPS, the severity and extent of perfusion may provide further prognostic information, considering that the annual event rate increases in accordance with both the severity and the extent of fixed or reversible perfusion defects [8]. One of the benefits of the wealth of evidence on prog-nostic evaluation by means of MPS is that the data can be easily integrated into risk-based patient management algorithms. A review of evidence suggests that high-risk findings are obtained on MPS in patients whose ex-pected rate of major adverse cardiac events is 3%–5% or more and patients with moder-ately to severely abnormal perfusion abnor-malities or a summed stress score greater than 8. Patients with a high-risk post-stress LVEF lower than 45% are at an elevated risk of major adverse cardiac events.
Risk stratification is widely used in the prog-nostic assessment of patients with a variety of clinical disorders, on the unquestioned
Chapter 1 State of the Art in Myocardial Imaging
EAN
M
9
assumption that the intensity of treatment should be proportionate to the risk of an ad-verse event. A recent review evaluated the comparative ability of stress MPS risk mark-ers using various iterative and risk classifica-tion approaches [9]. Other studies [10,11] have compared analytical approaches to assess the added value of MPS variables in estimating CAD outcomes in asymptomatic diabetic patients. At multivariable analysis, post-stress LVEF and stress MPS ischaemia were independent predictors of CAD death or myocardial infarction (MI) [11]. Moreover, the addition of MPS results to a prediction model based on traditional risk factors and ECG stress test data significantly improved the classification of risk. In particular, the addition of MPS data to pre-test CAD like-lihood was important in estimating risk of CAD death or MI and effective in reclassify-ing a sizeable proportion (55%) of patients, yielding a significant net improvement com-pared with traditional approaches to prog-nostication [11]. More recent data showed that also different functional parameters obtained by MPS, such as TID, help to iden-tify patients with higher mortality [12,13]. In particular, among patients with diabetes, when only subjects with post-stress LVEF >45% and no ischaemia were considered, TID was a strong predictor of cardiac events at long-term follow-up, with an event rate of 0.21% per year in those without TID and 4.9% per year in those with TID [13]. Interest-ingly, it emerged that the beneficial effect of revascularisation on hazard ratio is more evident in patients with TID, particularly in
those with reduced post-stress LVEF and se-vere ischaemia [14].
The estimation of prognosis with an accu-rate and reproducible modality, such as MPS, allows a more precise linkage with efforts to reduce patient risk and therapeutic risk. In fact, a nuclear-based focus for decision-making concentrates on the physiological significance of the disease state and its rela-tionship to event risk. In the long-term prog-nostic evaluation of patients with suspected or known CAD, serial stress MPS makes an important contribution to clinical decision-making. This is important in such patients when comparing a repeat study with a pre-vious one: the interpreting physician should pay close attention to whether a new perfu-sion defect has developed or whether the extent of pre-existing ischaemia has sub-stantially increased or decreased. Published reports have clearly shown that quantitative assessment of perfusion abnormality on MPS has a minimal intrinsic variability [15]. Soft-ware and scan reproducibility is extremely high because of the high degrees of automa-tion of the algorithms. Different studies have provided quantitative criteria for ascertain-ing by means of MPS whether a meaningful change has occurred in an individual patient and these criteria should help guide clinical management decisions [15,16]. In the COUR-AGE nuclear sub-study, a change of ≥5% was used as the criterion for a significant serial change in ischaemic total perfusion defect in an individual patient [17].
10
Cardiac PET/CTPET/CT systems were initially dedicated to oncology imaging. The increasing evidence of their clinical usefulness in cardiology is contributing in advancing the clinical role of PET/CT in cardiovascular imaging. Sev-eral technical advantages account for the improved image quality and diagnostic abil-ity of PET compared with SPECT, including the high spatial resolution of reconstructed images (heart–background ratio), the high sensitivity in the identification of small con-centrations of radiotracers, and above all the high temporal resolution, which allows dynamic sequences to be obtained in order to describe tracer kinetics and perform ab-solute measurements of myocardial blood flow (MBF). This last-mentioned feature also results in improved detection of multivessel CAD. Moreover, the appropriate attenua-tion correction obtained with simultaneous acquisition PET/CT technology decreases false-positives, increasing specificity, and provides a potential opportunity to delin-eate the anatomical extent and physiologi-cal severity of coronary atherosclerosis in a single setting. At the moment, cardiac PET/CT using perfusion tracers represents the gold standard for quantifying myocar-dial absolute perfusion (ml/min/g), at both rest and stress acquisition, and coronary flow reserve, defined as the ratio between MBF at peak stress and MBF at rest. Several PET myocardial perfusion tracers are available for clinical use, such as rubidium-82 (82Rb) and nitrogen-13 (13N) ammonia. The short physi-cal half-life of PET perfusion tracers allows a
reduction in the time required to complete rest and stress studies compared with MPS studies. Dynamic acquisitions are performed to obtain perfusion data while static perfu-sion images, as well as ECG-gated images, are acquired for the evaluation of LV func-tion and wall motion. Modern PET systems are able to perform “list mode” acquisition, where spatial data for every coincident pair of photons are recorded sequentially with very high temporal resolution along with the associated electrocardiographic phase, providing maximal flexibility for the offline reconstruction of summed, gated or dynam-ic images. Through list-mode acquisitions, multiple images are reconstructed from a single acquisition. With this approach, image acquisition starts with the bolus injection of the radiopharmaceutical and continues for 6–7 min after 82Rb injection and 10–20 min after 13N-ammonia injection. Stress testing is most commonly performed with pharmaco-logical agents.
Diagnostic and prognostic value of PETThe average weighted sensitivity for detec-tion of at least one coronary artery with >50% stenosis is 90% (range 83–100%), while the average specificity is 89% (range 73–100%). The corresponding average posi-tive predictive value (PPV) and negative pre-dictive value (NPV) are 94% (range 80–100%) and 73% (range 36–100%), respectively, and the overall diagnostic accuracy is 90% (range 84–98%) [18]. Myocardial perfusion PET has higher diagnostic accuracy than SPECT [19]. This is because coronary vasodilator reserve
Chapter 1 State of the Art in Myocardial Imaging
EAN
M
11
is globally reduced in patients with diffuse CAD, limiting detection of multivessel coro-nary artery stenosis. Diagnosis of multivessel CAD can be helped by PET measurements of MBF (ml/min/g) and coronary flow reserve. It has been demonstrated that estimates of coronary vasodilator reserve by PET are in-versely and non-linearly related to the sever-ity of stenosis [20]. Segments with reversible ischaemia and coronary stenosis had re-duced hyperaemic MBF. Even segments that had significant coronary stenosis, but were negative for ischaemia, had reduced hyper-aemic MBF compared with non-stenotic segments. Thus, MBF quantification by 82Rb PET may provide additional diagnostic infor-mation in patients with CAD [21]. However, it is important to note that myocardial perfu-sion quantitation with PET methods cannot help in differentiating decreased perfusion due to epicardial coronary artery stenosis from that due to microvascular dysfunc-tion. Hybrid PET/coronary CT angiography may be particularly helpful in this regard. It has been demonstrated that 82Rb PET MPI provides independent and incremental information for the prediction of cardiac events and all-cause death. Risk-adjusted survival analysis showed that both statisti-cal (increased chi-square and ROC analysis) and clinical enhanced risk stratification was achieved on the basis of the ischaemic bur-den and scar on PET MPI. The percentage of ischaemic or scarred myocardium on 82Rb PET MPI added incremental value to the clinical data and rest LVEF in predicting car-diac event and all-cause death. Importantly,
a novel finding in this study was that LVEF reserve is a significant independent predic-tor of these events [22]. In particular, LVEF re-serve is inversely and independently related to the risk of events.
Comprehensive overviews of the role of [18F]-2fluoro-2-deoxy-D-glucose (FDG) PET in the assessment of hibernating myocardium have recently been published (e.g. [23]). In the setting of persistent low-flow ischaemia, in which perfusion defects may show little evidence of reversibility, the ischaemic car-diac myocytes will utilise glycolysis and FDG uptake will increase, producing the classic mismatch pattern between blood flow, de-termined by perfusion PET, and metabolism. FDG PET assesses cellular metabolism, and thus also cellular integrity. As recently point-ed out, techniques that detect presence of cellular integrity are likely to be more sensi-tive but less specific than techniques that detect contractile reserve, like dobutamine CMR, because a critical myocardial mass needs to be viable for a functional response to occur [24].
Other myocardial imaging modalitiesEchocardiography Echocardiography represents the most fre-quently performed cardiac imaging investi-gation and is an invaluable tool for accurate evaluation of cardiac structure and function. Numerous modalities are available for assess-ment of cardiac morphology and function: M-mode has a high temporal resolution and permits accurate depiction of rapidly moving
12
structures; 2D transthoracic echocardiogra-phy allows identification of structural abnor-malities; transoesophageal echocardiogra-phy permits more detailed views of cardiac structures; and Doppler echocardiography is able to identify the direction, velocity, ampli-tude and timing of blood flow through the heart.
Stress echocardiographyStress echocardiography (SE) has proved a useful diagnostic and prognostic tool in pa-tients with known or suspected CAD. Several advances have helped to define this role, including the introduction of synchronised display of rest and stress images side by side using digital acquisition, the improve-ment of endocardial detection by tissue har-monic imaging, the use of contrast agent to achieve LV enhancement and detection of myocardial perfusion, 3D imaging and myo-cardial tissue quantitative techniques (tissue Doppler, myocardial strain and strain rate imaging). Stress ischaemia can be induced by exercise, pharmacological agents (such as dobutamine and vasodilator agents, e.g. dipyridamole or adenosine) or transoesoph-ageal atrial pacing [25]. Evaluation of SE im-aging is performed using qualitative assess-ment based on comparison of rest and stress images for global and regional dysfunction. Four response patterns are described: “nor-mal”, “inducible ischaemia”, “fixed scar (ne-crosis)” and “stunned” or “biphasic response”, as may be seen in dobutamine SE viability studies [26].
Compared with MPS, SE was found to dis-play significantly superior specificity for detection of CAD, while nuclear perfusion had better sensitivity [27]. The ischaemic cascade can explain this finding, whereby the perfusion abnormalities precede wall motion abnormalities.
Coronary CT angiographyCoronary CT angiography has evolved into a robust and non-invasive tool for the as-sessment of CAD, being able to identify cor-onary anatomy, presence of obstructive and non-obstructive CAD and plaque charac-teristics. With the latest multislice CT scan-ners (64- and post-64-slice CT), coronary CT angiography has been reported to have high diagnostic and prognostic value for prediction of major cardiac events. It pro-vides non-invasive visualisation of the coro-nary artery with a high sensitivity (>95%) and good specificity (82%) for detection of coronary artery stenosis [28]. Despite this, the presence of anatomically significant coronary stenosis does not always equate to functional significance. An alternative ap-proach to assessment of the functional sig-nificance of a coronary stenosis is CT-based fractional flow reserve (CT-FFR) quantifica-tion. This method employs computational fluid dynamics to calculate pressure gradi-ents across coronary lesions on standard CT coronary angiograms. Use of CT-FFR data improves diagnostic accuracy and discrimi-nation of functionally significant stenosis over CT angiography alone [29]. Other
Chapter 1 State of the Art in Myocardial Imaging
EAN
M
13
limitations of coronary CT angiography in-clude inferior temporal resolution, motion-related artefacts and high false positive re-sults due to severe calcification, presence of coronary stents and coronary artery bypass grafts, and arrhythmia.
Calcium scoreThe amount of coronary artery calcium, based on CT and traditionally expressed as the calcium score, is a marker of coronary atherosclerosis, correlated with the coronary atherosclerotic plaque burden. The coronary artery calcium score is associated with the risk of future cardiovascular events, and the detection of coronary artery calcification with cardiac CT has been used for risk strati-fication. Although coronary artery calcium scoring reflects the coronary atherosclerotic plaque burden, the absence of coronary ar-tery calcification does not exclude obstruc-tive CAD with non-calcified plaque.
Cardiac magnetic resonanceMagnetic resonance imaging has rapidly developed into a versatile tool for investi-gating CAD, being able to evaluate cardiac structure and ventricular function and to detect myocardial perfusion defects or in-farction scar. CMR stress protocols are very useful for evaluation of myocardial perfu-sion and wall motion. For the assessment of myocardial perfusion, first-pass myocardial enhancement with gadolinium is performed using predominantly stress induced by a va-sodilator, while stress-induced wall motion
analysis most commonly employs dobuta-mine stress. Advantages of CMR are good specificity and sensitivity in detecting perfu-sion and wall motion abnormalities, concur-rent assessment of cardiac structures and function and lack of radiation [30]. However, CMR has several limitations, including cost, test duration, variable centre expertise, pa-tient claustrophobia, paramagnetic implants and gadolinium-associated nephrogenic sys-temic fibrosis. For the assessment of coronary anatomy, magnetic resonance angiography is used, but its operating characteristics are inferior to those of other available modalities.
New advances: PET/MRThe first available whole-body system for PET/MR hybrid imaging was introduced in 2010, based on two separate MR and PET im-agers in one room. This system was followed by a fully integrated hybrid PET/MR system (Biograph mMR, Siemens AG, Healthcare Sec-tor, Erlangen, Germany) that enables simulta-neous PET/MR data acquisition. Integrated PET/MR appears a promising diagnostic tool for evaluation of cardiovascular disease be-cause it combines the ability of MR to pro-duce high-resolution images and provide in-formation about anatomy, function, flow and perfusion with the strength of PET in quanti-fying physiological and metabolic processes.
14
References Chapter 1
References1. Shaw LJ, Hage FG, Berman DS, Hachamovitch R, Iskan-
drian A. Prognosis in the era of comparative effective-ness research: where is nuclear cardiology now and where should it be? J Nucl Cardiol. 2012;19:1026–43. Erratum in: J Nucl Cardiol. 2012;19:1092–3.
2. Nakazato R, Berman DS, Hayes SW, Fish M, Padgett R, Xu Y, et al. Myocardial perfusion imaging with a solid-state camera: simulation of a very low dose imaging protocol. J Nucl Med. 2013;54:373–9.
3. Garcia EV, Faber TL, Esteves FP. Cardiac dedicated ultra-fast SPECT cameras: new designs and clinical implica-tions. J Nucl Med. 2011;52:210–7.
4. Schindler TH, Magosaki N, Jeserich M, Oser U, Krause T, Fischer R, et al. Fusion imaging: combined visualiza-tion of 3D reconstructed coronary artery tree and 3D myocardial scintigraphic image in coronary artery dis-ease. Int J Card Imaging. 1999;15:357–68.
5. Shaw LJ, Iskandrian AE. Prognostic value of gated myo-cardial perfusion SPECT. J Nucl Cardiol. 2004;11:171–85.
6. Shaw LJ, Hendel R, Borges-Neto S, Lauer MS, Alazraki N, Burnette J, et al.; Myoview Multicenter Registry. Prog-nostic value of normal exercise and adenosine (99m)Tc-tetrofosmin SPECT imaging: results from the multicenter registry of 4,728 patients. J Nucl Med. 2003;44:134–9.
7. Hachamovitch R, Hayes S, Friedman JD, Cohen I, Shaw LJ, Germano G, Berman DS. Determinants of risk and its temporal variation in patients with normal stress myo-cardial perfusion scans: what is the warranty period of a normal scan? J Am Coll Cardiol. 2003;41:1329–40.
8. Sharir T, Germano G, Kang X, Lewin HC, Miranda R, Co-hen I, et al. Prediction of myocardial infarction versus cardiac death by gated myocardial perfusion SPECT: risk stratification by the amount of stress-induced isch-emia and the poststress ejection fraction. J Nucl Med. 2001;42:831–7.
9. Petretta M, Cuocolo A. Prediction models for risk clas-sification in cardiovascular disease. Eur J Nucl Med Mol Imaging. 2012;39:1959–69.
10. Acampa W, Petretta M, Evangelista L, Daniele S, Xhoxhi E, De Rimini ML, et al. Myocardial perfusion imaging and risk classification for coronary heart disease in diabetic patients. The IDIS study: a prospective, multicentre trial. Eur J Nucl Med Mol Imaging. 2012;39:387–95.
11. Acampa W, Petretta M, Daniele S, Del Prete G, Assante R, Zampella E, Cuocolo A. Incremental prognostic value of stress myocardial perfusion imaging in asymptomatic diabetic patients. Atherosclerosis. 2013;227:307–12.
12. Petretta M, Acampa W, Daniele S, Petretta MP, Nappi C, Assante R, et al. Transient ischemic dilation in SPECT myocardial perfusion imaging for prediction of severe coronary artery disease in diabetic patients. J Nucl Car-diol. 2013;20:45–52.
13. Petretta M, Acampa W, Daniele S, Petretta MP, Plaitano M, Cuocolo A. Transient ischemic dilation in patients with diabetes mellitus: prognostic value and effect on clinical outcome after coronary revascularization. Circ Cardiovasc Imaging. 2013;6:908–15.
14. Acampa W, Cantoni V, Green R, Cuocolo R, Petretta MP, Orlandi M, Petretta M. Prognostic value of stress myocar-dial perfusion imaging in asymptomatic diabetic patients. Current Cardiovascular Imaging Reports. 2014;7:9268.
15. Xu Y, Hayes S, Ali I, Ruddy TD, Wells RG, Berman DS, et al. Automatic and visual reproducibility of perfusion and function measures for myocardial perfusion SPECT. J Nucl Cardiol. 2010;17 :1050–7.
16. Mahmarian JJ, Moyé LA, Verani MS, Bloom MF, Pratt CM. High reproducibility of myocardial perfusion defects in patients undergoing serial exercise thallium-201 to-mography. Am J Cardiol. 1995;75:1116–9.
17. Shaw LJ, Berman DS, Maron DJ, Mancini GB, Hayes SW, Hartigan PM, et al.; COURAGE Investigators. Optimal medical therapy with or without percutaneous coronary intervention to reduce ischemic burden: results from the Clinical Outcomes Utilizing Revascularization and Aggressive Drug Evaluation (COURAGE) trial nuclear substudy. Circulation. 2008;117:1283–91.
18. Di Carli MF, Murthy VL. Cardiac PET/CT for the evalua-tion of known or suspected coronary artery disease. Radiographics. 2011;31:1239–54.
EAN
M
15
References Chapter 1
19. Bateman TM, Heller GV, McGhie AI, Friedman JD, Case JA, Bryngelson JR, et al. Diagnostic accuracy of rest/stress ECG-gated Rb-82 myocardial perfusion PET: com-parison with ECGgated Tc-99m sestamibi SPECT. J Nucl Cardiol. 2006;13:24–33.
20. Anagnostopoulos C, Almonacid A, El Fakhri G, Curillova Z, Sitek A, Roughton M, et al. Quantitative relationship between coronary vasodilator reserve assessed by 82Rb PET imaging and coronary artery stenosis severity. Eur J Nucl Med Mol Imaging. 2008;35:1593–1601.
21. Yoshinaga K, Katoh C, Manabe O, Klein R, Naya M, Sakaki-bara M, et al. Incremental diagnostic value of regional myocardial blood flow quantification over relative per-fusion imaging with generator-produced rubidium-82 PET. Circ J. 2011;75:2628–34.
22. Dorbala S, Hachamovitch R, Curillova Z, Thomas D, Van-gala D, Kwong RY, Di Carli MF. Incremental prognostic value of gated Rb-82 positron emission tomography myocardial perfusion imaging over clinical variables and rest LVEF. JACC Cardiovasc Imaging. 2009;2:846–54.
23. Ghosh N, Rimoldi OE, Beanlands RS, Camici PG. Assess-ment of myocardial ischemia and viability: role of posi-tron emission tomography. Eur Heart J. 2010;31:2984–95.
24. Shah BN, Khattar RS, Senior R. The hibernating myo-cardium: current concepts, diagnostic dilemmas, and clinical challenges in the post-STICH era. Eur Heart J. 2013;34:1323–36
25. Shah BN. Echocardiography in the era of multi-modality cardiovascular imaging. Biomed Res Int. 2013;2013:310483. doi: 10.1155/2013/310483. Epub 2013 Jun 26.
26. Pellikka PA, Nagueh SF, Elhendy AA, Kuehl CA, Sawada SG; American Society of Echocardiography. American Society of Echocardiography recommendations for per-formance, interpretation, and application of stress echo-cardiography. J Am Soc Echocardiogr. 2007;20:1021–41.
27. Heijenbrok-Kal MH, Fleischmann KE, Hunink MG. Stress echocardiography, stress single-photon-emission com-puted tomography and electron beam computed to-mography for the assessment of coronary artery disease: a meta-analysis of diagnostic performance. Am Heart J. 2007;154:415–23.
28. Paech DC, Weston AR. A systematic review of the clinical effectiveness of 64-slice or higher computed tomogra-phy angiography as an alternative to invasive coronary angiography in the investigation of suspected coronary artery disease. BMC Cardiovasc Disord. 2011;11:32.
29. Min JK, Leipsic J, Pencina MJ, Berman DS, Koo BK, van Mieghem C, et al. Diagnostic accuracy of fractional flow reserve from anatomic CT angiography. JAMA. 2012;308:1237–45.
30. Nandalur KR, Dwamena BA, Choudhri AF, Nandalur MR, Carlos RC. Diagnostic performance of stress cardiac magnetic resonance imaging in the detection of coro-nary artery disease: a meta-analysis. J Am Coll Cardiol. 2007;50:1343–53.
16
Chapter 2Clinical Indications
Luka Lezaic
IntroductionCoronary artery disease (CAD) is a major cause of morbidity and mortality. Early and reliable detection of disease as well as assess-ment of its extent and severity have impor-tant implications for patient management.
Myocardial perfusion scintigraphy (MPS) is an essential clinical tool in patients with CAD. Initially, its main role was detection of disease and today it is still used extensively for this purpose. However, its role has gradu-ally evolved to encompass risk assessment in patients with suspected or known CAD and/or cardiac risk factors; in specific patient sub-sets, it can effectively guide therapeutic de-cisions. Common clinical indications for MPS are discussed in the text.
Detection of ischaemic heart diseaseMost common indication for MPS is detec-tion of coronary artery disease.
Through a process of lipid deposition and cal-cification (atherosclerosis), coronary vessels are progressively narrowed by a local build-up (atheroma), allowing continued normal blood flow at rest but limiting the ability of the vessel to increase blood flow at increased demand (for example, at exercise, which in-creases cardiac contractility and heart rate). Normally, vessels adapt to increased demand by increasing their diameter (vasodilation). Myocardial perfusion scintigraphy is based on this pathophysiological principle that stenosed coronary arteries cannot increase blood flow by vasodilation in response to
stress to the degree that normal vessels can (coronary flow reserve is decreased), where-as at rest blood flow in stenosed arteries is comparable to that in normal arteries until stenosis is far advanced (over 90% of luminal area). Regional uptake of radiopharmaceuti-cal is dependent on regional blood flow. The difference in regional uptake (lower in areas supplied by a stenosed vessel) is a sign of re-gionally proportionally decreased blood flow (ischaemia).
For diagnostic purposes, stress is commonly induced in two ways: by exercise (on a sta-tionary bicycle or treadmill) or by pharmaco-logical agents. These options differ in terms of the mechanism by which they simulate changes induced by exercise: vasodilators, such as adenosine, dipyridamole and re-gadenoson, induce vasodilation, while do-butamine induces an increase in heart rate and contractility. Primarily, vasodilators are reserved for patients unable to exercise, but they are also used in patients with specific conditions (left bundle branch block, car-diac pacemakers, changes in resting ECG) in which exercise-induced increase in heart rate may induce changes in ECG and/or myocar-dial perfusion which could erroneously be interpreted as ischaemia [1, 2].
With all tracers in clinical use, extraction from blood pool and uptake in the myocardium is proportional to regional blood flow only at lower rates (up to approximately 2 ml/g car-diac tissue/min); at higher rates, it approaches a plateau. The non-linearity of tracer uptake is
Chapter 2 Clinical Indications
EAN
M
17
least expressed with thallium-201 (201Tl), more so with technetium-99m (99mTc)-sestamibi and most with 99mTc-tetrofosmin. At exercise and particularly with pharmacological stress (which increases regional blood flow approxi-mately 5 times above rest, while exercise-in-duced stress increases it to 2–3 times above rest), mild-to-moderate narrowing of coro-nary vessels may go undetected. Fortunately, significant (>70%) coronary stenoses result in a sufficient difference in myocardial uptake to be detected at imaging. In addition to de-tecting myocardial ischaemia, MPS is able to assess its location (and therefore predict the major epicardial vessel involved), extent (the amount of myocardium involved) and sever-ity (level of ischaemia). MPS can be quantified: the left ventricle is divided into 17 segments using a universally accepted model for cardiac imaging [3] and segmental perfusion deficit is scored on a 0 (no defect) to 4 (no perfusion) scale by visual analysis or, preferably, by com-parison to a normal database. Quantification adds to confidence, reproducibility and ob-jective assessment of the degree of perfusion abnormality [4]. However, if all major epicardi-al vessels are equally affected (similar degree of stenosis), no relative difference in coronary flow reserve exists in different parts of the myocardium and therefore no ischaemia is detected, although coronary flow reserve is reduced (“balanced” ischaemia). In this case, absolute quantification of myocardial blood flow using positron-emitting flow tracers [rubidium-82 (82Rb), nitrogen-13 ammonia (13NH3) or oxygen-15 labelled water (H2
15O)] and positron emission tomography (PET) is
able to detect diffuse reduction in coronary flow reserve.
Differences in kinetics of clinically used trac-ers do not result in clinically detectable dif-ferences. Overall, the substantial body of evidence accumulated over four decades shows that for detection of significant isch-aemic heart disease, MPS yields a sensitivity of approximately 85% with a slightly lower specificity of approximately 70% [5–11]. Im-provement in specificity can be achieved by the use of ECG-gated imaging and/or attenu-ation correction. ECG-gated imaging allows assessment of LV volumes, ejection fraction and regional contractility (wall motion and thickening). Regional contractility analysis is used for differentiation of attenuation ar-tefacts from ischaemic changes through re-tained regional contraction, improving speci-ficity (approaching 85%) [12]. Furthermore, extensive balanced ischaemia can be de-tected through relative reduction of ejection fraction at stress and/or increase in volume of the left ventricle (transient ischaemic dila-tion [13]). Attenuation correction also serves to differentiate attenuation artefacts from ischaemic changes and has been shown to improve specificity and overall accuracy [14]. Both techniques require constant quality control to provide reliable information.
Risk assessment/prognosis in ischaemic heart diseaseArguably the most important role of MPS is risk assessment – identification of patients at risk for major adverse cardiac events
18
(myocardial infarction, sudden cardiac death). Pooled data from numerous studies suggest that patients with normal or near-normal MPS are at a very low risk for a major adverse cardiac event (defined at <1% per year). Furthermore, the extent (amount of myocardium affected) and severity (level of ischaemia) of reversible perfusion abnor-malities can further stratify patients in terms of risk for a cardiac event. However, these findings cannot be generalised to all pa-tients referred for MPS. While patients with-out known prior CAD or known myocardial infarction and normal MPS have been re-ported to be at low annual risk (0.6%) for an adverse cardiac event [15], the predictive value of MPS may be lower in specific pa-tient subsets (those with known CAD [16], the elderly [17], women [18] and patients with cardiac risk factors, particularly diabe-tes [19] and chronic kidney disease [20]). Nevertheless, in most clinical contexts in which patients are referred to MPS, addi-tional risk stratification can be provided by the results of the examination. An addition-al advantage of MPS is the ability to guide therapeutic strategy according to quan-titative assessment of ischaemic burden [21]. Observational data have shown that patients with a large amount of ischaemic myocardium (exceeding 10% of total myo-cardium) benefit from revascularisation, while in patients with a small amount of ischaemic myocardium appropriate medi-cal therapy alone may suffice for improve-ment in survival [22].
An effective risk assessment and manage-ment strategy is essential in patients with known CAD treated by revascularisation [by either percutaneous coronary interven-tion (PCI) or coronary artery bypass grafting (CABG)]. Improvements in revascularisation techniques (such as drug-eluting stents and arterial grafts) have reduced the number of post-procedural major cardiac events, but a significant number of patients remain at high risk. After PCI, repeated occurrence of symptoms may be related to restenosis at a treated site or to disease progression at a different site; typically, symptoms within 6 months of the procedure occur due to re-stenosis and at 9 months and beyond due to progression of disease elsewhere. No-tably, only about half of the patients with restenosis exhibit symptoms. MPS is able to detect ischaemia due to restenosis, residual stenoses and disease progression (repre-senting high risk of a major adverse cardiac event) and should thus be performed in symptomatic patients. As ischaemia is fre-quently silent in patients after revascularisa-tion, MPS may have a role in asymptomatic patients after PCI, taking clinical variables into consideration [23]. MPS should not be performed sooner than 3 (ideally 6) months after PCI to allow recovery of normal en-dothelial function and avoid false positive ischaemic findings. In patients after CABG, similar risk stratification is achieved by late (≥5 years post procedure) MPS, again with consideration of clinical variables (par-ticularly diabetes, where early MPS may be
Chapter 2 Clinical Indications
EAN
M
19
considered) [24]. Repeated revascularisa-tion in these patients significantly reduces cardiovascular risk [25].
In patients considered for a major operative procedure, MPS aids in assessing risk of peri-operative cardiac mortality. It is indicated in patients with moderate-to-high clinical risk and reduced exercise tolerance. In the pres-ence of reduced left ventricular ejection frac-tion (LVEF), ischaemic changes signify a high perioperative risk [26].
Viability assessmentSevere ischaemia leads to transient regional contractile dysfunction (“stunning”), which persists beyond the ischaemic episode. Re-peated episodes of stunning and progres-sion of CAD lead to changes in regional myo-cardial perfusion, metabolism and eventually structure. Resulting myocardial adaptation through regional reduction in contractil-ity (hypokinesis or akinesis) and metabolism shift (from free fatty acids to glucose as the main metabolic substrate) is termed “hiber-nation”. Importantly, hibernating myocardi-um can regain function upon restoration of regional blood flow [27].
Myocardial functional impairment (degree of reduction in LVEF) is an important predictor of survival in patients with ischaemic cardio-myopathy. If coronary anatomy is amenable to a revascularisation procedure, assessment of myocardial viability should be performed. If a significant amount of viable, hibernating
myocardium is present, revascularisation is likely to lead to improvement in symptoms, myocardial function and overall survival [28].
The role of MPS in viability assessment is well established. It relies on the physiological principle that tracer uptake in myocardium is related to preservation of the integrity of cell membranes and metabolism with main-tenance of the internal cellular milieu (trans-membrane pumps for ion analogues in the case of 201Tl and transmembrane gradient in mitochondria in the case of 99mTc-labelled tracers) [29]. Patient preparation and imag-ing protocols are adapted to the selected myocardial perfusion tracer. With 201Tl, a rest-redistribution protocol with delayed imaging after 4 h is usually employed. If 99mTc-labelled tracers are used, patient preparation with nitrates is performed; induction of vasodila-tion and increased collateral flow results in an increase in tracer uptake and augments detection of viable myocardium. Segmental tracer uptake is quantified to identify areas in which the amount of viable myocardium present is too small to result in a clinically observable benefit. Relative uptake of >50% of maximum myocardial uptake at rest and ≥10% increase in uptake at redistribution with 201Tl and relative uptake >50–60% of maximum myocardial uptake on rest imag-ing with 99mTc-labelled tracers are considered to signify viable myocardium.
ECG-gated SPECT is an important integral part of viability assessment. By definition,
20
hibernating myocardium is regionally dys-functional (hypokinetic or akinetic). Similarly to its role in the detection of ischaemic heart disease, ECG-gated SPECT assists in differ-entiation between regionally dysfunctional myocardium and attenuation artefacts. With the addition of low-dose dobutamine, the contractile reserve of dysfunctional seg-ments can be assessed for complementary determination of viable myocardium [30]. In doubtful cases and advanced heart failure due to ischaemic heart disease (ischaemic cardiomyopathy), the gold standard for vi-ability assessment remains fluorine-18 (18F) fluorodeoxyglucose (FDG) PET, which iden-tifies viable myocardium by the presence of preserved glucose metabolism, performed
in conjunction with myocardial perfusion as-sessment with SPECT or, preferentially, PET tracers.
ConclusionMyocardial perfusion scintigraphy is a well-established tool for assessment of various clinical manifestations of ischaemic heart dis-ease. Information provided by the technique is highly dependent on appropriate indica-tion, patient selection and implementation of the examination; ultimately, these factors determine its clinical usefulness.
Acknowledgement. The author would like to thank Barbara Guzic Salobir, MD, PhD, for use-ful comments during finalisation of the text.
EAN
M
21
References Chapter 2
References1. Hesse B, Tägil K, Cuocolo A, Anagnostopoulos C, Bardiés
M, Bax J, et al.; EANM/ESC Group. EANM/ESC procedural guidelines for myocardial perfusion imaging in nuclear cardiology. Eur J Nucl Med Mol Imaging. 2005;32:855–97.
2. Task Force Members, Montalescot G, Sechtem U, Achen-bach S, Andreotti F, Arden C, Budaj A, et al. 2013 ESC guidelines on the management of stable coronary artery disease: the Task Force on the management of stable coronary artery disease of the European Society of Cardiology. Eur Heart J. 2013;34:2949–3003.
3. Cerqueira MD, Weissman NJ, Dilsizian V, Jacobs AK, Kaul S, Laskey WK, et al.; American Heart Association Writing Group on Myocardial Segmentation and Registration for Cardiac Imaging. Standardized myocardial segmenta-tion and nomenclature for tomographic imaging of the heart. A statement for healthcare professionals from the Cardiac Imaging Committee of the Council on Clinical Cardiology of the American Heart Association. Circula-tion. 2002;105:539–42.
4. Berman DS, Kang X, Gransar H, Gerlach J, Friedman JD, Hayes SW, et al. Quantitative assessment of myocardial perfusion abnormality on SPECT myocardial perfusion imaging is more reproducible than expert visual analy-sis. J Nucl Cardiol. 2009;16:45–53.
5. Health Quality Ontario. Single photon emission com-puted tomography for the diagnosis of coronary artery disease: an evidence-based analysis. Ont Health Technol Assess Ser. 2010;10:1–64.
6. Mowatt G, Vale L, Brazzelli M, Hernandez R, Murray A, Scott N, et al. Systematic review of the effectiveness and cost-effectiveness, and economic evaluation, of myocardial perfusion scintigraphy for the diagnosis and management of angina and myocardial infarction. Health Technol Assess. 2004;8(30):iii-iv, 1–207.
7. Imran MB, Pálinkás A, Picano E. Head-to-head com-parison of dipyridamole echocardiography and stress perfusion scintigraphy for the detection of coronary artery disease: a meta-analysis. Comparison between stress echo and scintigraphy. Int J Cardiovasc Imaging. 2003;19:23–8.
8. Kim C, Kwok YS, Heagerty P, Redberg R. Pharmacologic stress testing for coronary disease diagnosis: A meta-analysis. Am Heart J. 2001;42:934–44.
9. Heijenbrok-Kal MH, Fleischmann KE, Hunink MG. Stress echocardiography, stress single-photon-emission com-puted tomography and electron beam computed to-mography for the assessment of coronary artery disease: a meta-analysis of diagnostic performance. Am Heart J. 2007;154:415–23.
10. O’Keefe JH Jr, Barnhart CS, Bateman TM. Comparison of stress echocardiography and stress myocardial perfu-sion scintigraphy for diagnosing coronary artery disease and assessing its severity. Am J Cardiol. 1995;75:25D–34D.
11. Fleischmann KE, Hunink MG, Kuntz KM, Douglas PS. Exercise echocardiography or exercise SPECT imaging? A meta-analysis of diagnostic test performance. JAMA. 1998;280:913–20.
12. Smanio PE, Watson DD, Segalla DL, Vinson EL, Smith WH, Beller GA. Value of gating of technetium-99m sestamibi single-photon emission computed tomographic imag-ing. J Am Coll Cardiol. 1997;30:1687–92.
13. McLaughlin MG, Danias PG. Transient ischemic dila-tion: a powerful diagnostic and prognostic finding of stress myocardial perfusion imaging. J Nucl Cardiol. 2002;9:663–7.
14. Hendel RC. Attenuation correction: eternal dilemma or real improvement? Q J Nucl Med Mol Imaging. 2005;49:30–42.
15. Klocke FJ, Baird MG, Lorell BH, Bateman TM, Messer JV, Berman DS, et al.; American College of Cardiology; American Heart Association Task Force on Practice Guidelines; American Society for Nuclear Cardiology. ACC/AHA/ASNC guidelines for the clinical use of cardiac radionuclide imaging--executive summary: a report of the American College of Cardiology/American Heart Association Task Force on Practice Guidelines (ACC/AHA/ASNC Committee to Revise the 1995 Guidelines for the Clinical Use of Cardiac Radionuclide Imaging). Circulation. 2003;108:1404–18.
22
16. Parisi AF, Hartigan PM, Folland ED. Evaluation of exercise thallium scintigraphy versus exercise electrocardiogra-phy in predicting survival outcomes and morbid cardiac events in patients with single- and double-vessel dis-ease. Findings from the Angioplasty Compared to Medi-cine (ACME) Study. J Am Coll Cardiol. 1997;30:1256–63.
17. Hachamovitch R, Kang X, Amanullah AM, Abidov A, Hayes SW, Friedman JD, et al. Prognostic implica-tions of myocardial perfusion single-photon emission computed tomography in the elderly. Circulation. 2009;120:2197–206.
18. Cerci MS, Cerci JJ, Cerci RJ, Pereira Neto CC, Trindade E, Delbeke D, et al. Myocardial perfusion imaging is a strong predictor of death in women. JACC Cardiovasc Imaging. 2011;4:880–8.
19. Bourque JM, Patel CA, Ali MM, Perez M, Watson DD, Beller GA. Prevalence and predictors of ischemia and outcomes in outpatients with diabetes mellitus referred for single-photon emission computed tomography myocardial perfusion imaging. Circ Cardiovasc Imag-ing. 2013;6:466–77.
20. Al-Mallah MH, Hachamovitch R, Dorbala S, Di Carli MF. Incremental prognostic value of myocardial perfusion imaging in patients referred to stress single-photon emission computed tomography with renal dysfunc-tion. Circ Cardiovasc Imaging. 2009;2:429–36.
21. Hachamovitch R, Di Carli MF. Methods and limitations of assessing new noninvasive tests: Part II: Outcomes-based validation and reliability assessment of noninva-sive testing. Circulation. 2008;117:2793–801.
22. Hachamovitch R, Hayes SW, Friedman JD, Cohen I, Ber-man DS. Comparison of the short-term survival benefit associated with revascularization compared with medi-cal therapy in patients with no prior coronary artery disease undergoing stress myocardial perfusion single photon emission computed tomography. Circulation. 2003;107:2900–7.
23. Acampa W, Evangelista L, Petretta M, Liuzzi R, Cuocolo A. Usefulness of stress cardiac single-photon emission computed tomographic imaging late after percutane-ous coronary intervention for assessing cardiac events and time to such events. Am J Cardiol. 2007;100:436–41.
24. Acampa W, Petretta M, Evangelista L, Nappi G, Luongo L, Petretta MP, et al. Stress cardiac single-photon emission computed tomographic imaging late after coronary artery bypass surgery for risk stratification and estima-tion of time to cardiac events. J Thorac Cardiovasc Surg. 2008;136:46–51.
25. Rizzello V, Poldermans D, Schinkel AF, Biagini E, Boersma E, Elhendy A, et al. Outcome after redo coronary artery bypass grafting in patients with ischaemic cardiomy-opathy and viable myocardium. Heart. 2007;93:221–5.
26. Weinstein H, Steingart R. Myocardial perfusion im-aging for preoperative risk stratification. J Nucl Med. 2011;52:750–60.
27. Rahimtoola SH. The hibernating myocardium. Am Heart J. 1989;117:211–21.
28. Schinkel AF, Bax JJ, Poldermans D, Elhendy A, Ferrari R, Rahimtoola SH. Hibernating myocardium: diagnosis and patient outcomes. Curr Probl Cardiol. 2007;32:375–410.
29. Schinkel AF, Poldermans D, Elhendy A, Bax JJ. Assess-ment of myocardial viability in patients with heart fail-ure. J Nucl Med. 2007;48:1135–46.
30. Leoncini M, Sciagrà R, Bellandi F, Maioli M, Sestini S, Mar-cucci G, et al. Low-dose dobutamine nitrate-enhanced technetium 99m sestamibi gated SPECT versus low-dose dobutamine echocardiography for detecting reversible dysfunction in ischemic cardiomyopathy. J Nucl Cardiol. 2002;9:402–6.
EAN
M
23
Chapter 3Patient Preparation and Stress Protocols
Giuseppe Medolago and Adriana Ghilardi
IntroductionNon-invasive nuclear cardiology techniques for diagnosis and risk stratification of coro-nary artery disease (CAD) employ both exer-cise and pharmacological stressors to induce flow heterogeneity or functional abnormali-ties attributable to myocardial ischaemia.
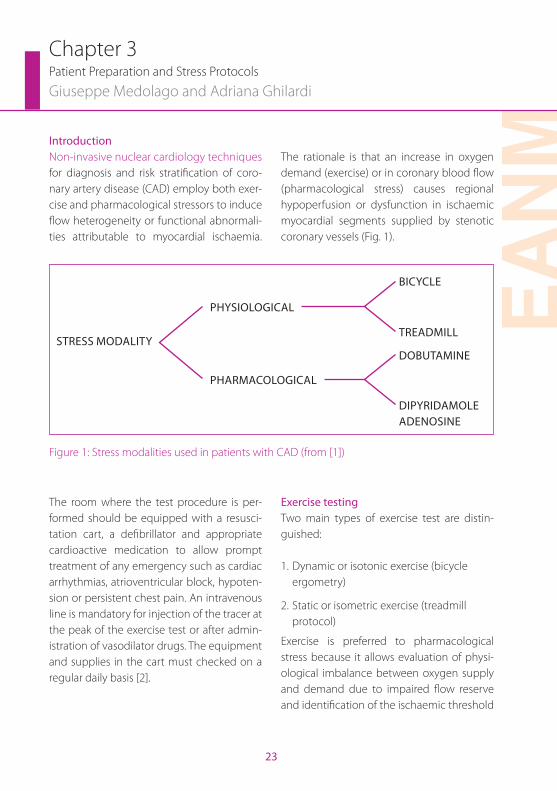
The rationale is that an increase in oxygen demand (exercise) or in coronary blood flow (pharmacological stress) causes regional hypoperfusion or dysfunction in ischaemic myocardial segments supplied by stenotic coronary vessels (Fig. 1).
STRESS MODALITY
PHYSIOLOGICAL
BICYCLE
TREADMILL
PHARMACOLOGICAL
DOBUTAMINE
DIPYRIDAMOLEADENOSINE
Figure 1: Stress modalities used in patients with CAD (from [1])
The room where the test procedure is per-formed should be equipped with a resusci-tation cart, a defibrillator and appropriate cardioactive medication to allow prompt treatment of any emergency such as cardiac arrhythmias, atrioventricular block, hypoten-sion or persistent chest pain. An intravenous line is mandatory for injection of the tracer at the peak of the exercise test or after admin-istration of vasodilator drugs. The equipment and supplies in the cart must checked on a regular daily basis [2].
Exercise testingTwo main types of exercise test are distin-guished:
1. Dynamic or isotonic exercise (bicycle ergometry)
2. Static or isometric exercise (treadmill protocol)
Exercise is preferred to pharmacological stress because it allows evaluation of physi-ological imbalance between oxygen supply and demand due to impaired flow reserve and identification of the ischaemic threshold
24
related to heart workload [calculated by mul-tiplying the heart rate (HR) by the systolic blood pressure (BP) at the peak of exercise]. In patients without CAD, exercise test causes vasodilation and increases coronary blood flow to 2–2.5 times above baseline levels.
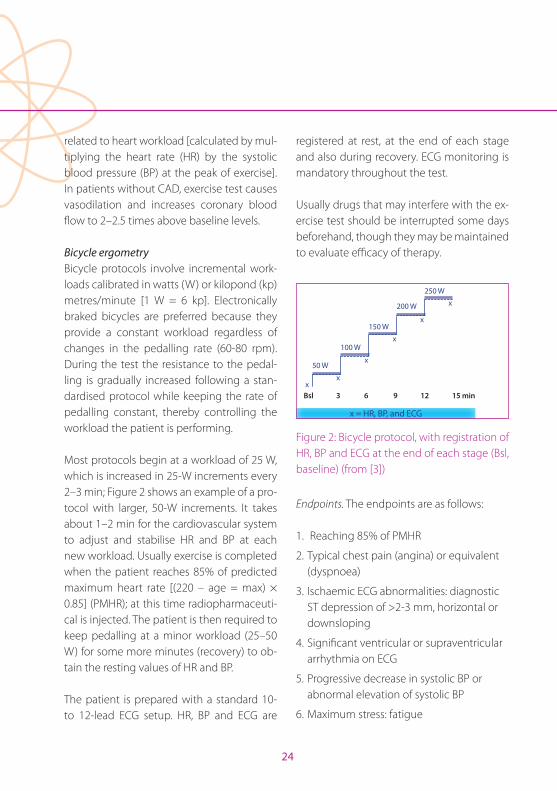
Bicycle ergometry Bicycle protocols involve incremental work-loads calibrated in watts (W) or kilopond (kp) metres/minute [1 W = 6 kp]. Electronically braked bicycles are preferred because they provide a constant workload regardless of changes in the pedalling rate (60-80 rpm). During the test the resistance to the pedal-ling is gradually increased following a stan-dardised protocol while keeping the rate of pedalling constant, thereby controlling the workload the patient is performing.
Most protocols begin at a workload of 25 W, which is increased in 25-W increments every 2–3 min; Figure 2 shows an example of a pro-tocol with larger, 50-W increments. It takes about 1–2 min for the cardiovascular system to adjust and stabilise HR and BP at each new workload. Usually exercise is completed when the patient reaches 85% of predicted maximum heart rate [(220 – age = max) × 0.85] (PMHR); at this time radiopharmaceuti-cal is injected. The patient is then required to keep pedalling at a minor workload (25–50 W) for some more minutes (recovery) to ob-tain the resting values of HR and BP.
The patient is prepared with a standard 10- to 12-lead ECG setup. HR, BP and ECG are
registered at rest, at the end of each stage and also during recovery. ECG monitoring is mandatory throughout the test.
Usually drugs that may interfere with the ex-ercise test should be interrupted some days beforehand, though they may be maintained to evaluate efficacy of therapy.
x
x
x
x
xx
50 W
100 W
150 W
200 W
250 W
Bsl 3 6 9 12 15 min
x = HR, BP, and ECG
Figure 2: Bicycle protocol, with registration of HR, BP and ECG at the end of each stage (Bsl, baseline) (from [3])
Endpoints. The endpoints are as follows:
1. Reaching 85% of PMHR
2. Typical chest pain (angina) or equivalent (dyspnoea)
3. Ischaemic ECG abnormalities: diagnostic ST depression of >2-3 mm, horizontal or downsloping
4. Significant ventricular or supraventricular arrhythmia on ECG
5. Progressive decrease in systolic BP or abnormal elevation of systolic BP
6. Maximum stress: fatigue
Chapter 3 Patient Preparation and Stress Protocols
EAN
M
25
Safety and risks. Bicycle ergometry is an ex-tremely safe procedure. The risk is deter-mined by the clinical characteristics of the patient. In non-selected patient populations the mortality is negligible and the morbidity less than 0.05%; the risk of complications is greater in patients with known CAD (infarc-tion, multivessel disease) [4]. Indications, contraindications and limitations to exercise testing are shown in Tables 1 and 2. Exercise testing should always be undertaken un-der the supervision of a physician properly trained to perform such a test and able to deal with any emergency.
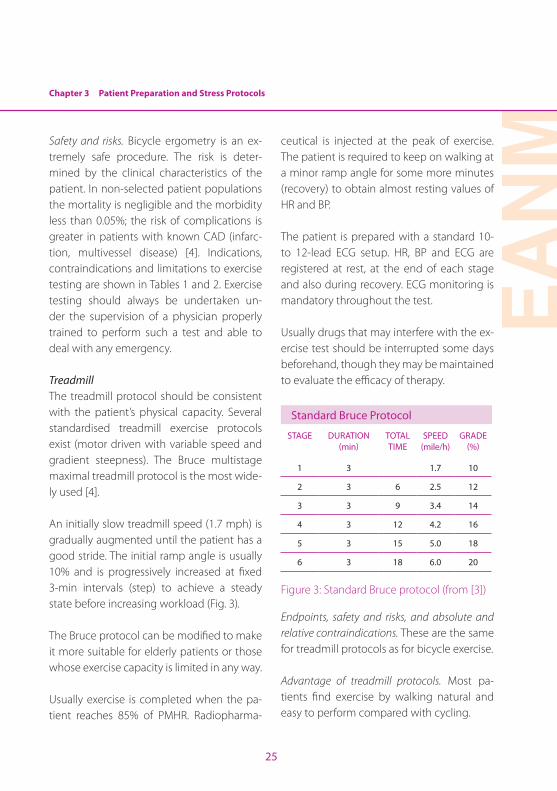
TreadmillThe treadmill protocol should be consistent with the patient’s physical capacity. Several standardised treadmill exercise protocols exist (motor driven with variable speed and gradient steepness). The Bruce multistage maximal treadmill protocol is the most wide-ly used [4].
An initially slow treadmill speed (1.7 mph) is gradually augmented until the patient has a good stride. The initial ramp angle is usually 10% and is progressively increased at fixed 3-min intervals (step) to achieve a steady state before increasing workload (Fig. 3).
The Bruce protocol can be modified to make it more suitable for elderly patients or those whose exercise capacity is limited in any way.
Usually exercise is completed when the pa-tient reaches 85% of PMHR. Radiopharma-
ceutical is injected at the peak of exercise. The patient is required to keep on walking at a minor ramp angle for some more minutes (recovery) to obtain almost resting values of HR and BP.
The patient is prepared with a standard 10- to 12-lead ECG setup. HR, BP and ECG are registered at rest, at the end of each stage and also during recovery. ECG monitoring is mandatory throughout the test.
Usually drugs that may interfere with the ex-ercise test should be interrupted some days beforehand, though they may be maintained to evaluate the efficacy of therapy.
Standard Bruce Protocol
STAGE DURATION (min)
TOTAL TIME
SPEED (mile/h)
GRADE (%)
1 3 1.7 10
2 3 6 2.5 12
3 3 9 3.4 14
4 3 12 4.2 16
5 3 15 5.0 18
6 3 18 6.0 20
Figure 3: Standard Bruce protocol (from [3])
Endpoints, safety and risks, and absolute and relative contraindications. These are the same for treadmill protocols as for bicycle exercise.
Advantage of treadmill protocols. Most pa-tients find exercise by walking natural and easy to perform compared with cycling.
26
Disadvantages of both exercise tests. BP mea-surements are often difficult to obtain and ECG tracings may be subject to more motion artefacts.
Pharmacological testingPharmacological stress is increasingly em-ployed as an alternative to exercise testing. Most patients referred to the nuclear cardi-ology laboratory are unable to perform a di-agnostic exercise test owing to orthopaedic, neurological, systemic or vascular disease. In these patients, the presence of CAD can be evaluated on the basis of pharmacological vasodilation or chronotropic effect.
Three main types of pharmacological stress-or are distinguished:
1. Dipyridamole
2. Adenosine/regadenoson
3. Dobutamine
Dipyridamole infusion protocolMore clinical experience has been gained with dipyridamole (a synthetic indirect vaso-dilator) than with the other pharmacological tests [5]. When intravenously infused, dipyri-damole blocks cellular uptake (in vascular endothelium and red blood cell membranes) of the natural vasodilator adenosine (syn-thesised and released by endothelial cells), which regulates coronary blood flow to meet myocardial metabolic demands (by reacting with specific receptors which stimulate vas-cular smooth muscle cell relaxation).
In patients without CAD, dipyridamole in-fusion causes vasodilation and increases coronary blood flow 3–5 times above base-line levels. By contrast, in patients with sig-nificant CAD, the resistance vessels distal to the stenosis are already dilated, potentially even maximally, to maintain normal resting flow. Infusion of dipyridamole in the adjacent myocardium, supplied by normal vessels, causes a substantial increase in blood flow, producing heterogeneity in the myocardial blood flow (coronary steal).
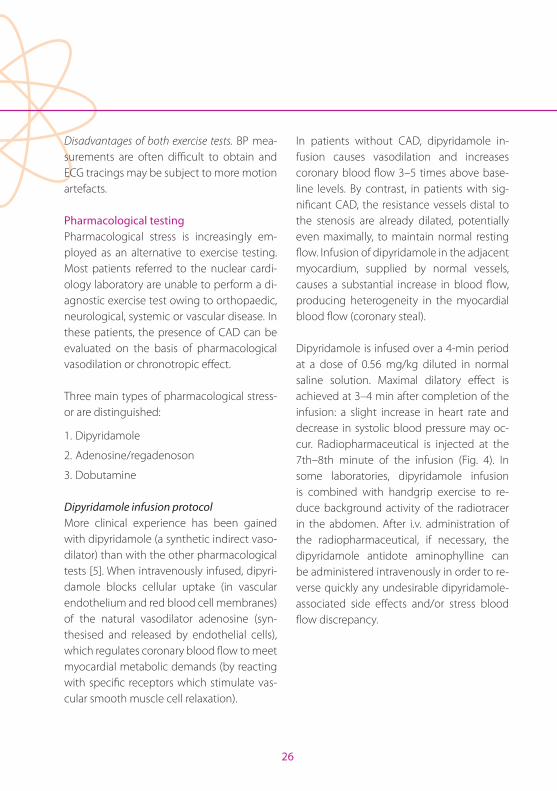
Dipyridamole is infused over a 4-min period at a dose of 0.56 mg/kg diluted in normal saline solution. Maximal dilatory effect is achieved at 3–4 min after completion of the infusion: a slight increase in heart rate and decrease in systolic blood pressure may oc-cur. Radiopharmaceutical is injected at the 7th–8th minute of the infusion (Fig. 4). In some laboratories, dipyridamole infusion is combined with handgrip exercise to re-duce background activity of the radiotracer in the abdomen. After i.v. administration of the radiopharmaceutical, if necessary, the dipyridamole antidote aminophylline can be administered intravenously in order to re-verse quickly any undesirable dipyridamole-associated side effects and/or stress blood flow discrepancy.
Chapter 3 Patient Preparation and Stress Protocols
EAN
M
27
DIPYRIDAMOLE PROTOCOL
Inject Tracer
0
BP x x x x x x x x x HR x x x x x x x x xCont ECG x ..............x................x ...............x ...............x ...........x .........x ............x ..........x
2 4 6 8
Total dose: 0.56 mg / kg
Figure 4: Dipyridamole infusion protocol (from [3])
The patient is prepared with a standard 10- to 12-lead ECG setup in the supine or semi-orthostatic (stress table) position. HR, BP and ECG are registered at rest and every minute throughout the test and also during recov-ery. ECG monitoring is mandatory through-out the test.
Usually cardiovascular drugs (calcium antag-onists, nitrates) should be interrupted some days before the pharmacological test, as should caffeine and theophylline (adenosine receptor blockers).
The dipyridamole protocol is particularly well suited for patients with left bundle branch block, as it has a false positive rate of only 2–5% in such patients, compared with 30–40% for exercise testing [6].
Safety and risks. Even if side effects with di-pyridamole are often more severe and more difficult to control, dipyridamole infusion is a safe procedure. The risk is determined by the
clinical characteristics of the patient referred for the procedure (Table 3). Dipyridamole in-fusion should be undertaken under the su-pervision of a physician properly trained to perform such a test and able to deal with any emergency.
Absolute contraindications. The absolute con-traindications to dipyridamole testing are:
1. Bronchospasm
2. Drug intolerance
Limitations. Like any other drug, in some pa-tients (non-responders) dipyridamole may display only slight or moderate pharmaco-logical efficacy, thus reducing the accuracy of the stress testing.
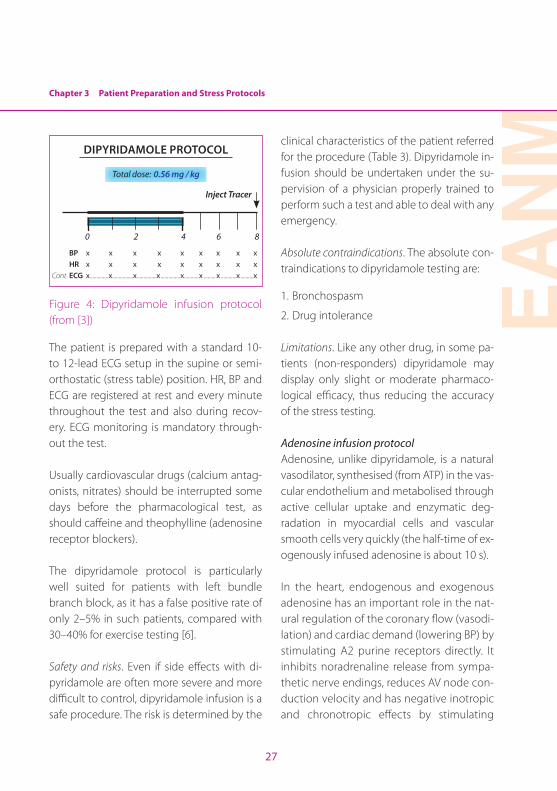
Adenosine infusion protocolAdenosine, unlike dipyridamole, is a natural vasodilator, synthesised (from ATP) in the vas-cular endothelium and metabolised through active cellular uptake and enzymatic deg-radation in myocardial cells and vascular smooth cells very quickly (the half-time of ex-ogenously infused adenosine is about 10 s).
In the heart, endogenous and exogenous adenosine has an important role in the nat-ural regulation of the coronary flow (vasodi-lation) and cardiac demand (lowering BP) by stimulating A2 purine receptors directly. It inhibits noradrenaline release from sympa-thetic nerve endings, reduces AV node con-duction velocity and has negative inotropic and chronotropic effects by stimulating
28
A1 purine receptors in the sinoatrial and the atrioventricular node.
The regional and systemic vascular effects of adenosine occur early (within 20–30 s) and quickly disappear after discontinuation of the infusion (T1/2 in plasma is about 15 s). Maximal effect has been observed invasively after 60 s and continues as long as the drug is infused. These metabolic characteristics ex-plain the lower rate of most side effects with adenosine in comparison with dipyridamole (Table 3).
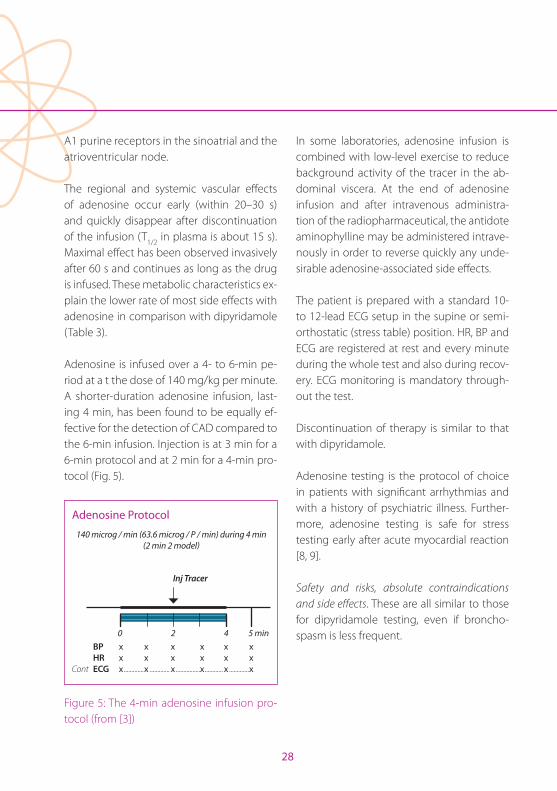
Adenosine is infused over a 4- to 6-min pe-riod at a t the dose of 140 mg/kg per minute. A shorter-duration adenosine infusion, last-ing 4 min, has been found to be equally ef-fective for the detection of CAD compared to the 6-min infusion. Injection is at 3 min for a 6-min protocol and at 2 min for a 4-min pro-tocol (Fig. 5).
Adenosine Protocol
140 microg / min (63.6 microg / P / min) during 4 min(2 min 2 model)
Inj Tracer
0 BP x x x x x x HR x x x x x xCont ECG x .............x ............. x ................x ............x .............x
2 4 5 min
Figure 5: The 4-min adenosine infusion pro-tocol (from [3])
In some laboratories, adenosine infusion is combined with low-level exercise to reduce background activity of the tracer in the ab-dominal viscera. At the end of adenosine infusion and after intravenous administra-tion of the radiopharmaceutical, the antidote aminophylline may be administered intrave-nously in order to reverse quickly any unde-sirable adenosine-associated side effects.
The patient is prepared with a standard 10- to 12-lead ECG setup in the supine or semi-orthostatic (stress table) position. HR, BP and ECG are registered at rest and every minute during the whole test and also during recov-ery. ECG monitoring is mandatory through-out the test.
Discontinuation of therapy is similar to that with dipyridamole.
Adenosine testing is the protocol of choice in patients with significant arrhythmias and with a history of psychiatric illness. Further-more, adenosine testing is safe for stress testing early after acute myocardial reaction [8, 9].
Safety and risks, absolute contraindications and side effects. These are all similar to those for dipyridamole testing, even if broncho-spasm is less frequent.
Chapter 3 Patient Preparation and Stress Protocols
EAN
M
29
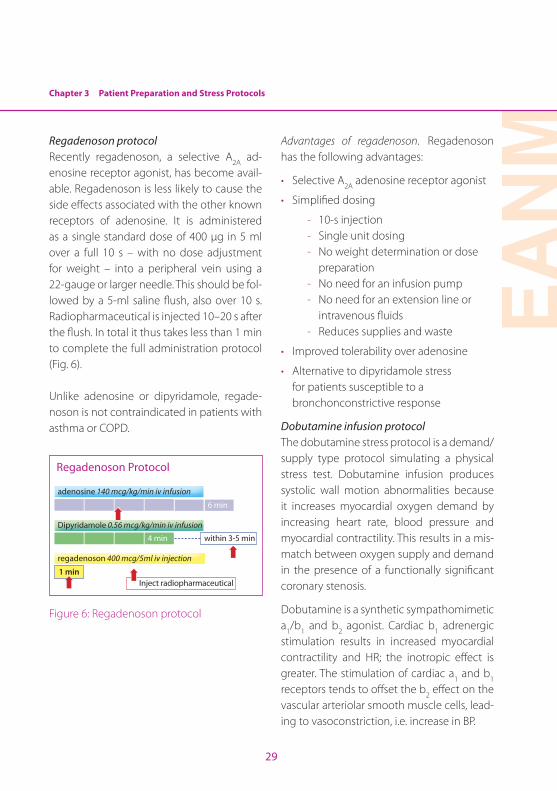
Regadenoson protocolRecently regadenoson, a selective A2A ad-enosine receptor agonist, has become avail-able. Regadenoson is less likely to cause the side effects associated with the other known receptors of adenosine. It is administered as a single standard dose of 400 µg in 5 ml over a full 10 s – with no dose adjustment for weight – into a peripheral vein using a 22-gauge or larger needle. This should be fol-lowed by a 5-ml saline flush, also over 10 s. Radiopharmaceutical is injected 10–20 s after the flush. In total it thus takes less than 1 min to complete the full administration protocol (Fig. 6).
Unlike adenosine or dipyridamole, regade-noson is not contraindicated in patients with asthma or COPD.
adenosine 140 mcg/kg/min iv infusion
Dipyridamole 0.56 mcg/kg/min iv infusion
within 3-5 min
Inject radiopharmaceutical
regadenoson 400 mcg/5ml iv injection
1 min
6 min
Regadenoson Protocol
4 min
➡ ➡
➡
➡
Figure 6: Regadenoson protocol
Advantages of regadenoson. Regadenoson has the following advantages:
• Selective A2A adenosine receptor agonist
• Simplified dosing
- 10-s injection - Single unit dosing - No weight determination or dose
preparation - No need for an infusion pump - No need for an extension line or
intravenous fluids - Reduces supplies and waste
• Improved tolerability over adenosine
• Alternative to dipyridamole stress for patients susceptible to a bronchonconstrictive response
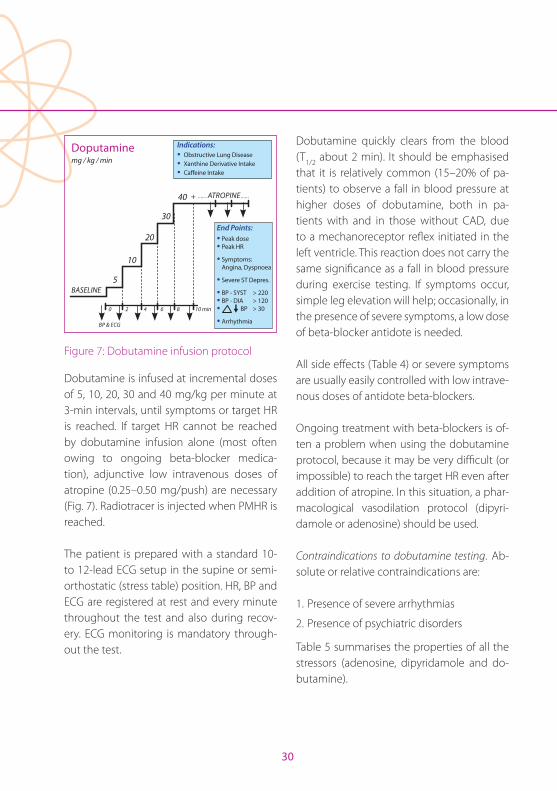
Dobutamine infusion protocolThe dobutamine stress protocol is a demand/supply type protocol simulating a physical stress test. Dobutamine infusion produces systolic wall motion abnormalities because it increases myocardial oxygen demand by increasing heart rate, blood pressure and myocardial contractility. This results in a mis-match between oxygen supply and demand in the presence of a functionally significant coronary stenosis.
Dobutamine is a synthetic sympathomimetic a1/b1 and b2 agonist. Cardiac b1 adrenergic stimulation results in increased myocardial contractility and HR; the inotropic effect is greater. The stimulation of cardiac a1 and b1 receptors tends to offset the b2 effect on the vascular arteriolar smooth muscle cells, lead-ing to vasoconstriction, i.e. increase in BP.
30
Doputamine
BASELINE
mg / kg / min
5
Indications:· Obstructive Lung Disease · Xanthine Derivative Intake· Caffeine Intake
10
20
30
40 + ...... ATROPINE ......
0 2 4
BP & ECG
6 8 10 min
End Points:· Peak dose · Peak HR
· Symptoms: Angina, Dyspnoea
· Severe ST Depres.
· BP - SYST > 220· BP - DIA > 120· BP > 30
· Arrhythmia
Figure 7: Dobutamine infusion protocol
Dobutamine is infused at incremental doses of 5, 10, 20, 30 and 40 mg/kg per minute at 3-min intervals, until symptoms or target HR is reached. If target HR cannot be reached by dobutamine infusion alone (most often owing to ongoing beta-blocker medica-tion), adjunctive low intravenous doses of atropine (0.25–0.50 mg/push) are necessary (Fig. 7). Radiotracer is injected when PMHR is reached.
The patient is prepared with a standard 10- to 12-lead ECG setup in the supine or semi-orthostatic (stress table) position. HR, BP and ECG are registered at rest and every minute throughout the test and also during recov-ery. ECG monitoring is mandatory through-out the test.
Dobutamine quickly clears from the blood (T1/2 about 2 min). It should be emphasised that it is relatively common (15–20% of pa-tients) to observe a fall in blood pressure at higher doses of dobutamine, both in pa-tients with and in those without CAD, due to a mechanoreceptor reflex initiated in the left ventricle. This reaction does not carry the same significance as a fall in blood pressure during exercise testing. If symptoms occur, simple leg elevation will help; occasionally, in the presence of severe symptoms, a low dose of beta-blocker antidote is needed.
All side effects (Table 4) or severe symptoms are usually easily controlled with low intrave-nous doses of antidote beta-blockers.
Ongoing treatment with beta-blockers is of-ten a problem when using the dobutamine protocol, because it may be very difficult (or impossible) to reach the target HR even after addition of atropine. In this situation, a phar-macological vasodilation protocol (dipyri-damole or adenosine) should be used.
Contraindications to dobutamine testing. Ab-solute or relative contraindications are:
1. Presence of severe arrhythmias
2. Presence of psychiatric disorders
Table 5 summarises the properties of all the stressors (adenosine, dipyridamole and do-butamine).
Chapter 3 Patient Preparation and Stress Protocols
EAN
M
31
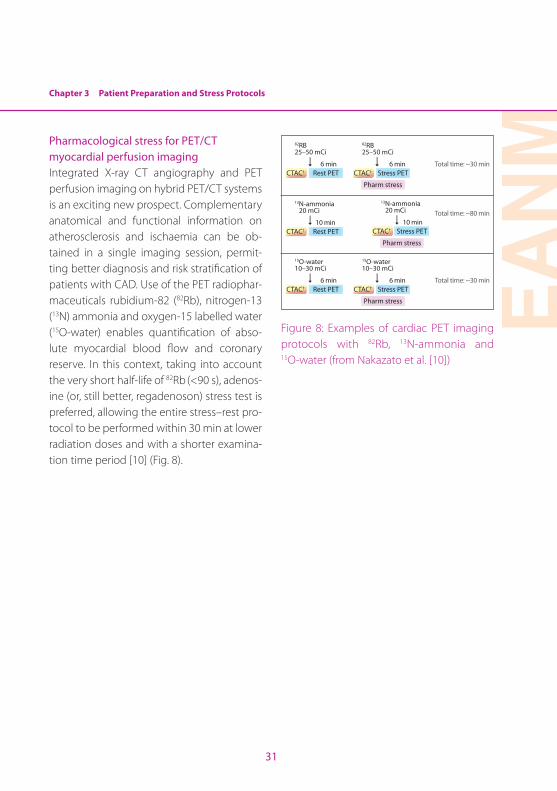
Pharmacological stress for PET/CT myocardial perfusion imagingIntegrated X-ray CT angiography and PET perfusion imaging on hybrid PET/CT systems is an exciting new prospect. Complementary anatomical and functional information on atherosclerosis and ischaemia can be ob-tained in a single imaging session, permit-ting better diagnosis and risk stratification of patients with CAD. Use of the PET radiophar-maceuticals rubidium-82 (82Rb), nitrogen-13 (13N) ammonia and oxygen-15 labelled water (15O-water) enables quantification of abso-lute myocardial blood flow and coronary reserve. In this context, taking into account the very short half-life of 82Rb (<90 s), adenos-ine (or, still better, regadenoson) stress test is preferred, allowing the entire stress–rest pro-tocol to be performed within 30 min at lower radiation doses and with a shorter examina-tion time period [10] (Fig. 8).
Rest PET
Rest PET
Rest PET
Pharm stress
Pharm stress
Pharm stress
CTAC†
CTAC†
CTAC†
CTAC†
CTAC†
CTAC†
Stress PET
Stress PET
Stress PET
82RB25–50 mCi
15O-water10–30 mCi
13N-ammonia 20 mCi
6 min
6 min
10 min
6 min
6 min
10 min
Total time: ~30 min
Total time: ~80 min
Total time: ~30 min
82RB25–50 mCi
15O-water10–30 mCi
13N-ammonia 20 mCi
Figure 8: Examples of cardiac PET imaging protocols with 82Rb, 13N-ammonia and 15O-water (from Nakazato et al. [10])
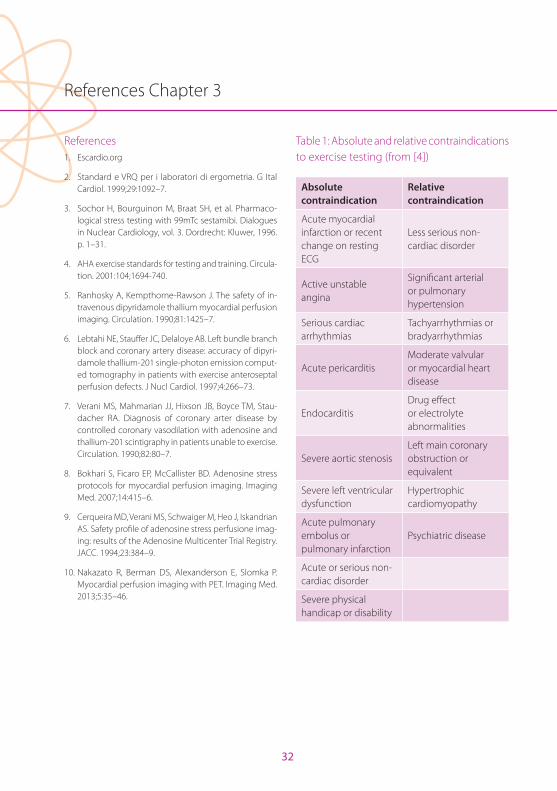
32
References Chapter 3
References1. Escardio.org
2. Standard e VRQ per i laboratori di ergometria. G Ital Cardiol. 1999;29:1092–7.
3. Sochor H, Bourguinon M, Braat SH, et al. Pharmaco-logical stress testing with 99mTc sestamibi. Dialogues in Nuclear Cardiology, vol. 3. Dordrecht: Kluwer, 1996. p. 1–31.
4. AHA exercise standards for testing and training. Circula-tion. 2001:104;1694-740.
5. Ranhosky A, Kempthorne-Rawson J. The safety of in-travenous dipyridamole thallium myocardial perfusion imaging. Circulation. 1990;81:1425–7.
6. Lebtahi NE, Stauffer JC, Delaloye AB. Left bundle branch block and coronary artery disease: accuracy of dipyri-damole thallium-201 single-photon emission comput-ed tomography in patients with exercise anteroseptal perfusion defects. J Nucl Cardiol. 1997;4:266–73.
7. Verani MS, Mahmarian JJ, Hixson JB, Boyce TM, Stau-dacher RA. Diagnosis of coronary arter disease by controlled coronary vasodilation with adenosine and thallium-201 scintigraphy in patients unable to exercise. Circulation. 1990;82:80–7.
8. Bokhari S, Ficaro EP, McCallister BD. Adenosine stress protocols for myocardial perfusion imaging. Imaging Med. 2007;14:415–6.
9. Cerqueira MD, Verani MS, Schwaiger M, Heo J, Iskandrian AS. Safety profile of adenosine stress perfusione imag-ing: results of the Adenosine Multicenter Trial Registry. JACC. 1994;23:384–9.
10. Nakazato R, Berman DS, Alexanderson E, Slomka P. Myocardial perfusion imaging with PET. Imaging Med. 2013;5:35–46.
Table 1: Absolute and relative contraindications to exercise testing (from [4])
Absolute contraindication
Relative contraindication
Acute myocardial infarction or recent change on resting ECG
Less serious non-cardiac disorder
Active unstable angina
Significant arterial or pulmonary hypertension
Serious cardiac arrhythmias
Tachyarrhythmias or bradyarrhythmias
Acute pericarditis Moderate valvular or myocardial heart disease
EndocarditisDrug effect or electrolyte abnormalities
Severe aortic stenosis Left main coronary obstruction or equivalent
Severe left ventricular dysfunction
Hypertrophic cardiomyopathy
Acute pulmonary embolus or pulmonary infarction
Psychiatric disease
Acute or serious non-cardiac disorder
Severe physical handicap or disability
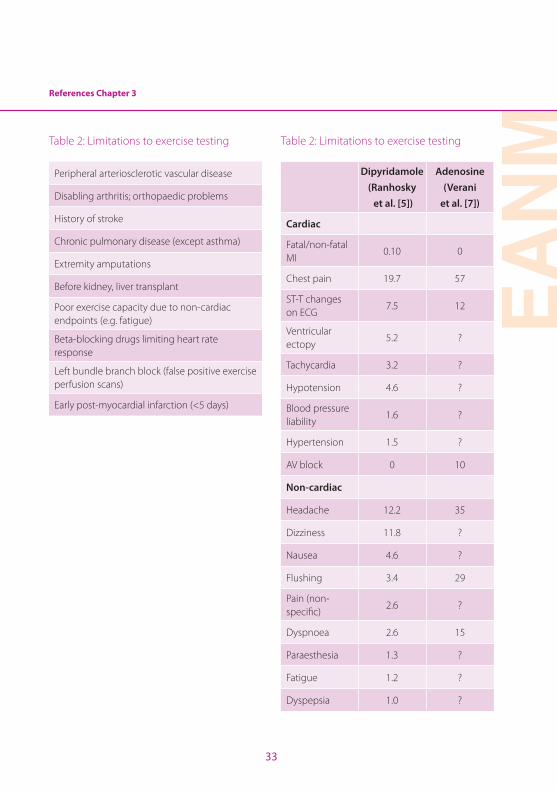
EAN
M
33
References Chapter 3
Table 2: Limitations to exercise testing
Peripheral arteriosclerotic vascular disease
Disabling arthritis; orthopaedic problems
History of stroke
Chronic pulmonary disease (except asthma)
Extremity amputations
Before kidney, liver transplant
Poor exercise capacity due to non-cardiac endpoints (e.g. fatigue)
Beta-blocking drugs limiting heart rate response
Left bundle branch block (false positive exercise perfusion scans)
Early post-myocardial infarction (<5 days)
Table 2: Limitations to exercise testing
Dipyridamole(Ranhosky et al. [5])
Adenosine(Verani
et al. [7])
Cardiac
Fatal/non-fatal MI
0.10 0
Chest pain 19.7 57
ST-T changes on ECG
7.5 12
Ventricular ectopy
5.2 ?
Tachycardia 3.2 ?
Hypotension 4.6 ?
Blood pressure liability
1.6 ?
Hypertension 1.5 ?
AV block 0 10
Non-cardiac
Headache 12.2 35
Dizziness 11.8 ?
Nausea 4.6 ?
Flushing 3.4 29
Pain (non-specific)
2.6 ?
Dyspnoea 2.6 15
Paraesthesia 1.3 ?
Fatigue 1.2 ?
Dyspepsia 1.0 ?
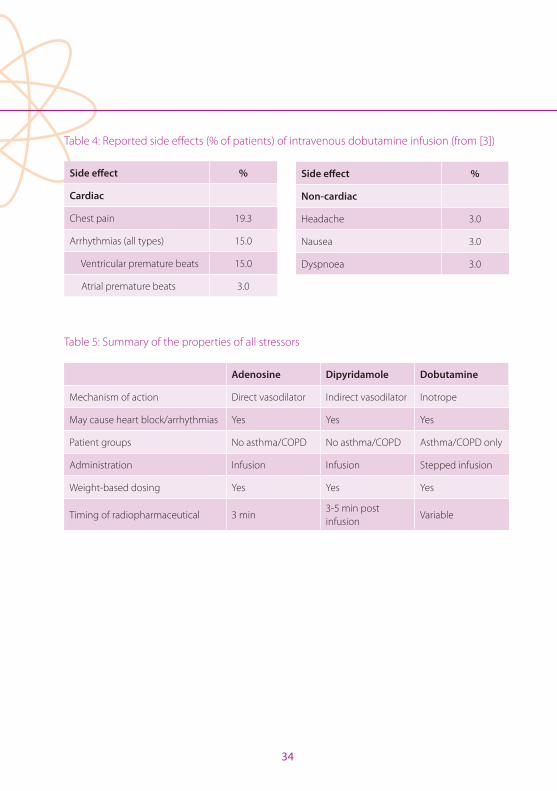
34
Table 4: Reported side effects (% of patients) of intravenous dobutamine infusion (from [3])
Side effect %
Cardiac
Chest pain 19.3
Arrhythmias (all types) 15.0
Ventricular premature beats 15.0
Atrial premature beats 3.0
Table 5: Summary of the properties of all stressors
Adenosine Dipyridamole Dobutamine
Mechanism of action Direct vasodilator Indirect vasodilator Inotrope
May cause heart block/arrhythmias Yes Yes Yes
Patient groups No asthma/COPD No asthma/COPD Asthma/COPD only
Administration Infusion Infusion Stepped infusion
Weight-based dosing Yes Yes Yes
Timing of radiopharmaceutical 3 min3-5 min post infusion
Variable
Side effect %
Non-cardiac
Headache 3.0
Nausea 3.0
Dyspnoea 3.0

EAN
M
35
IntroductionA multidisciplinary team (MDT) with re-sponsibility for formulation of patient care pathways is composed of members from dif-ferent healthcare professions who have spe-cialised skills and expertise. A patient being examined for cardiology-related issues will be seen by a group of general practitioners,
cardiologists, technologists, nurses, health-care assistants and cardiac surgeons, who jointly provide an integrated care approach appropriate for that patient. Within nuclear medicine, too, such an approach is adopted, with the MDT team consisting of the profes-sional groups shown in Fig. 1.
TechnologistTechnical professional in
nuclear medicine.Responsible for radioisotope administration, processing,
scanning and advicePhysicist
Scientific professional in nuclear medicine.
Responsible for radiation protection and expertise on
physics
ClinicianMedical professional in
nuclear medicine.Responsible for justification of scan, prescribing, medical advice, reporting and stress
leads
RadiopharmacyChemistry/pharmacy
professional in nuclear medicine.
Responsible for preparation of radiopharmaceuticals and
advice
NursesNursing professional in
nuclear medicine. Responsible for patient
care, drug administration, clinical observations and
emergency support.AdministrationAdministrative/
managerial professional in nuclear medicine.
Responsible for back office functions, operational
management, administrative staff
and process
PATIENT
Figure 1: The professional groups involved in the MDT team and their roles
Chapter 4 Multidisciplinary Approach and Advanced Practice
Anil Vara
36
Nature of the multidisciplinary approach in myocardial perfusion imagingMyocardial perfusion imaging (MPI) is a com-plex examination that is often very daunting for the patient, given the discomfort during exercise stress testing and the requirement to keep still for long periods and to lie flat for the scan. The MDT approach to MPI reas-sures the patient that they are being cared for by professionals with the requisite com-petencies and with clear responsibility for individual roles during the MPI exam. Fig-ure 1 outlines the key professions and briefly describes how they contribute to the overall MPI exam.
The main advantages and disadvantages of the MDT approach in MPI are outlined in Table 1. Overall, the advantages do outweigh the disadvantages, and it is important to re-member that the MDT approach is consid-ered more effective given the higher levels of quality and efficiency that it can provide. In addition, there are many emerging chal-lenges to the delivery of healthcare in Eu-rope, and without an MDT approach there is a high risk that MPI exams will be overtaken by other diagnostic approaches and become obsolete.
What is advanced practice? Recently, boundaries between the profes-sions represented in MDTs have started to break down, and it is becoming more com-mon for professionals responsible for health-care delivery to have overlapping respon-sibilities (e.g. in the United Kingdom). “Ad-
vanced practice” is the term used to describe the situation where technologists develop a set of competencies that allows them to perform tasks previously within the bound-aries of other professionals. Advanced prac-tice is impacting on MPI as it is becoming more common for technologists to adopt enhanced roles after learning the appropri-ate set of nuclear cardiology competencies (as set out, for example, for the “Nuclear Medicine Advanced Associate” in the SNM’s Nuclear Medicine Advanced Associate Curricu-lum Guide, 1st Edition [1]; see Appendix).
The introduction of advanced practice is not unique to technologists, as many other professionals such as radiographers and nurses have also increased their contribu-tion to patient care through the adoption of advanced practice. In the United Kingdom, the introduction of the NICE 73 appraisal in the management and diagnosis of angina resulted in large numbers of patients being referred for MPI. The guidelines outlined an expectation that service provision to 4000 patients per million population would be achieved. This level of provision, coupled with the aim of performance of MPI within 6 weeks following referral, would have placed tremendous pressure on hospital services in the absence of modification of practices. The challenge led nuclear medicine services to adopt new ways of working through service configuration and skill mix within existing professional groups. Through the adoption of an enhanced technologist role in stress testing, the nuclear cardiology service was
Chapter 4 Multidisciplinary Approach and Advanced Practice
EAN
M
37
able to effectively increase the capacity for stress sessions and allow clinicians to focus their resources on reporting, clinical devel-opments/research, and development of the clinical service.
The nursing profession had already estab-lished an advanced practice role through the acquisition of skills in cardiac physiol-ogy, and nurses could easily gain further competencies in advising on and managing clinical issues arising from pharmacological and exercise-induced stress. However, such nursing support has often been limited to large hospitals where nurses rotate through all of the imaging modalities. In contrast, technologists remain solely responsible to the nuclear cardiology department, which facilitates skill development and acquisition of the competencies required for advanced practice roles in the performance of stress studies. It remains the case, however, that these advanced practice roles are adopted only to complement the MDT involved in MPI in order to enhance patient care, reduce costs and provide more efficient service [2].
Advanced practice competencies for technologists in MPITechnologists with an advanced practice role within nuclear cardiology would nor-mally have acquired competencies to an enhanced level in nuclear medicine [1]. The core competencies required for such a role have been published by the British Nuclear Medicine Society (BNMS) and the Society of Nuclear Medicine, both of which have pub-
lished a competency framework that pro-vides a useful guide for training.
The fundamental competency framework set out by the BNMS [3] should ensure the technologist can take responsibility for di-verse specific aspects of a stress test:
• Communication – with patients, the MPI team, clinical referrers and other profes-sionals
• Clinical assessment – taking a patient history, examination, justification and au-thorisation, obtaining patient consent, examination of the patient’s clinical notes and drug charts
• Physical preparation – venous cannulation, ECG and blood pressure interpretation, stress equipment and pharmaceuticals
• Selection of the appropriate stress test – correct method, individual variations, plans for adverse events
• Conducting a stress test – safety, observa-tions and interpretation, handling radionu-clides, knowledge and safe administration of stress drugs, use of equipment, patient needs and documentation
The appendix to this chapter provides a de-tailed list of the competencies listed in the Nuclear Medicine Advanced Associate Cur-riculum Guide, 1st edition [1], which represent good guidelines for delivery of a suitable technologist training programme. In the United Kingdom, some academic centres
38
have developed courses that deliver the core competencies for advanced practice within nuclear cardiology for a wide group of pro-fessionals, including technologists, radiog-raphers and nurses. These courses comprise both theoretical and work-based practical components, with case studies, assessments and written assignments.
Possibility of building a career ladder for the technologist practising MPITechnologists partaking in advanced prac-tice within nuclear cardiology are profes-sionally accountable to their nuclear medi-cine consultant, who must ensure that the technologist’s practice is routinely audited to reassure patients that they are receiving an appropriate quality of care. It must be em-phasised that such technologists are oper-ating as part of an MDT. They should always have adequate medical support available and must work in accordance with the writ-ten protocols and seek medical advice when difficult issues arise.
In the United Kingdom, technologists are not yet state registered and therefore advanced practice can often pose difficulties in respect of assurance to the employing organisation and the patient, compared with other pro-fessional groups such as radiographers and nurses. This should not, however, deter the technologist from developing a career in advanced practice. In the United Kingdom, certain professional groups will provide in-demnity as well as an infrastructure to en-sure maintenance of continuing professional development. The technologist’s role in MPI might be further advanced to include au-thorisation of request forms, prescription of drugs as part of MPI and possibly even re-porting of MPI scans. Such a level of practice for technologists could be accomplished by ensuring that state registration is available for nuclear medicine technologists and by em-bedding the technologist’s role more deeply within the MDT delivering the MPI service.

EAN
M
39
Appendix Chapter 4
Appendix
Detailed nuclear cardiology competencies for a Nuclear Medicine Advanced Associate as set out in the SNM’s Nuclear Medicine Ad-vanced Associate Curriculum Guide 1st Edition.
1. Successfully complete Advanced Cardiac Life Sup-port credentialing
2. Assess normal electrocardiogram to determine pa-tient safety for stress testing
3. Assess abnormal electrocardiographic conduction in preparation for stress testing
4. Develop procedural policies and standards for pre-cardiac arrest emergencies that might occur within the department as directed by institutional policy and practice standards
5. Identify the signs and symptoms of symptomatic bradycardia and symptomatic tachycardia
6. Follow a step-by-step course of action for the pa-tient who develops asymptomatic bradycardia or tachycardia while in office (before, during or after the stress test)
7. Follow a step-by-step course of action for the pa-tient who develops signs and symptoms of brady-cardia or tachycardia while in office (before, during or after the stress test)
8. Identify the proper medications and dosages for stable cardiac rhythms
9. List contraindications and precautions of common cardiac medications
10. Follow a step-by-step approach to handling an ST elevated myocardial infarction
11. Follow a step-by-step approach to handling a stroke situation
12. Follow a step-by-step approach to handling other patient incidents
13. Identify and delegate personnel to perform various tasks in preparation for cardiac emergencies
14. Incorporate the appropriate guidelines into de-partmental policies and procedures
15. Develop procedural policies and standards for cardiac arrest emergencies that occur within the department as directed by institutional policy and practice standards and provide indicated interven-tion for a cardiac emergency event
16. Establish intravenous access
17. Identify and administer the appropriate medica-tions for commonly occurring cardiac arrhythmias under the direction of the supervising physician
18. Perform cardiac compression or defibrillate patient if required
19. Facilitate the ordering of laboratory tests or other tests as needed for a cardiac arrest event under the direction of the supervising physician
20. Facilitate admission of the patient to the hospital if necessary
21. Provide indicated intervention for non-cardiac emergency events
22. Manage crash cart for compliance
23. Follow the appropriate guidelines in implement-ing regulation for managing the department’s crash cart
24. Inventory crash cart components according to in-stitutional policy
25. Properly dispose of expired drugs
26. Replace expired drugs
27. Perform quality assurance testing on defibrillator and document results
28. Take comprehensive patient history and evaluate for patient pathology
29. Interview the patient and document on depart-ment form a complete past and current cardiac history
30. Review non-cardiac history for prevalence to study requested
31. Perform physical assessment
32. Evaluate patient laboratory biochemical markers relevant to cardiac pathology
33. Review most recent laboratory test results relevant to cardiovascular diseases
34. Order relevant blood tests if necessary (including pregnancy testing)
35. Evaluate patient medications for contraindications to stress testing
36. Understand contraindications to each type of stress test and evaluate for each

40
37. Review patient medications for contraindications to exercise stress testing
38. Obtain patient informed consent as required for nuclear cardiology procedures according to state law and hospital policy
39. Understand the ethical and legal underpinnings of informed consent
40. Determine the capability of the patient to give in-formed consent
41. Explain the procedure to the patient, including all components of a valid informed consent
42. Obtain the patient’s or guardian’s signature
43. Conduct treadmill testing per all protocol options under the direction of the supervising physician
44. Prepare the patient for exercise protocol
45. Determine type of exercise stress test
46. Monitor electrocardiographic tracings and blood pressure for specific pathology and cardiac events during stress testing
47. Use the appropriate termination protocols
48. Prescribe and administer interventional drugs for pharmacologic stress under the direction of the supervising physician
49. Explain the indications and contraindications for each pharmacological stress agent
50. Identify the physiological action of each pharma-cological agent as it relates to stress testing
51. Calculate total dose, volume and dose rate for each of the most common pharmacological stress agents
52. Set up drug administration pump
53. Prepare pharmacological agents for administration utilising sterile technique
54. Administer pharmacological agents
55. Monitor patient response to pharmacological agents and treat the patient appropriately in the event of an adverse effect
56. Analyse results of the stress test and imaging por-tion of the examination and prepare a preliminary description of findings for the supervising physi-cian
57. Create a preliminary description of findings detail-ing the results of the stress portion of the test
58. Examine rotating raw data from both stress and resting image acquisitions and evaluate image quality
59. Review data for incidental finding outside of the heart
60. Compare and contrast stress versus resting pro-cessed images for perfusion defects
61. Determine whether the heart-to-lung ratio and transient ischaemic dilation are abnormal
62. Evaluate the wall motion of stress and resting im-ages for ejection fraction and kinetic abnormalities
63. Review and evaluate bull’s eye polar maps and summed stress scores
64. Create a preliminary description of findings detail-ing the results of the imaging portion of the test
65. Facilitate or recommend patient-specific cardiac-related procedures based on nuclear cardiology examination results (outcome management) ac-cording to the supervising physician
66. Order or facilitate scheduling of complementary diagnostic procedures as indicated
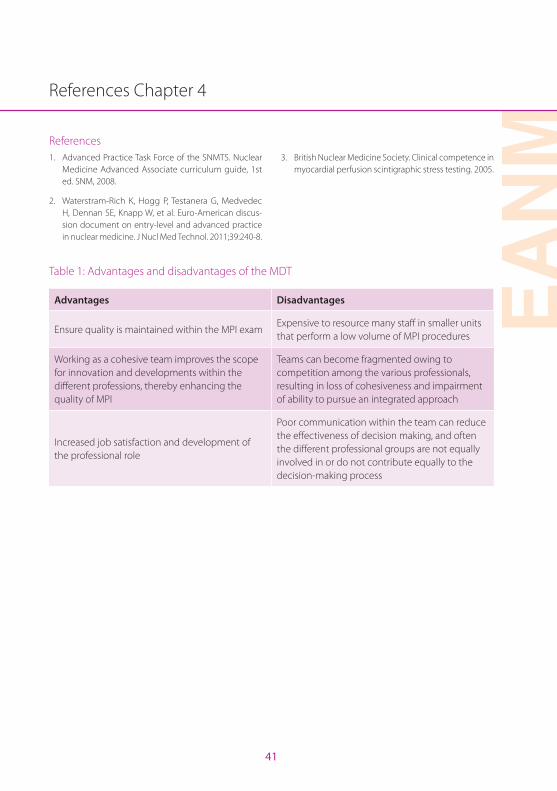
EAN
M
41
References Chapter 4
References1. Advanced Practice Task Force of the SNMTS. Nuclear
Medicine Advanced Associate curriculum guide, 1st ed. SNM, 2008.
2. Waterstram-Rich K, Hogg P, Testanera G, Medvedec H, Dennan SE, Knapp W, et al. Euro-American discus-sion document on entry-level and advanced practice in nuclear medicine. J Nucl Med Technol. 2011;39:240-8.
3. British Nuclear Medicine Society. Clinical competence in myocardial perfusion scintigraphic stress testing. 2005.
Table 1: Advantages and disadvantages of the MDT
Advantages Disadvantages
Ensure quality is maintained within the MPI examExpensive to resource many staff in smaller units that perform a low volume of MPI procedures
Working as a cohesive team improves the scope for innovation and developments within the different professions, thereby enhancing the quality of MPI
Teams can become fragmented owing to competition among the various professionals, resulting in loss of cohesiveness and impairment of ability to pursue an integrated approach
Increased job satisfaction and development of the professional role
Poor communication within the team can reduce the effectiveness of decision making, and often the different professional groups are not equally involved in or do not contribute equally to the decision-making process
42
Chapter 5Advances in Radiopharmaceuticals for Myocardial Perfusion Imaging
James R. Ballinger and Jacek Koziorowski
IntroductionMyocardial perfusion imaging (MPI) is one of the greatest success stories of nuclear medicine, growing continuously since the late 1970s to now constitute more than 50% of imaging procedures in some countries such as the United States[1,2]. This success resulted from the development of improved imaging agents, the direct impact of the test results on patient prognosis and the tech-nique being embraced by cardiologists. With single-photon emission computed tomog-raphy (SPECT) myocardial imaging now be-ing firmly entrenched, we may see a similar growth in cardiac positron emission tomog-raphy (PET).
Properties of the ideal agentThe objectives of MPI are to detect abnor-mal perfusion to the heart, to differentiate permanent defects (due to blockage of coro-nary arteries such as following a myocardial infarction) from reversible defects (due to coronary artery disease, CAD), to determine which coronary arteries are involved and to estimate the extent of the defect. Permanent and reversible defects are differentiated by performing the test with the patient at rest and again following exercise or pharmaco-logical stress. Detection and quantification of CAD are important in determining the prog-nosis of patients. In particular, a normal MPI scan is associated with an extremely low risk of cardiac events [1].
An ideal agent for MPI would have the fol-lowing properties [3]:
• Efficient extraction from the blood on first pass in proportion to regional perfusion
• Linear relationship between perfusion and accumulation, particularly at high flow rates
• Retention in initial distribution for long enough that a SPECT or PET image can be acquired
• Rapid clearance from adjacent organs, particularly the lungs and liver, to achieve a high heart/background ratio
• Suitable emission energy for imaging, and absence of other emissions which increase radiation dose or degrade the image
• Physical half-life appropriate to the study
• Cost effectiveness and convenience of supply
It will be seen that the MPI tracers in current use vary in their conformity to these ideal properties.
History of MPIThe first approach taken was to use radioiso-topes of potassium, particularly 43K, making use of the sodium-potassium (Na+/K+) ATPase pump as a mechanism for efficient entry of the radiotracer into the cell. For clinical use, thallium-201 (201Tl) was introduced in the mid
Chapter 5 Advances in Radiopharmaceuticals for Myocardial Perfusion Imaging
EAN
M
43
1970s as a potassium analogue. Its 3-day half-life made it convenient to supply, but limited the administered activity because of concerns about radiation dosimetry. The initial distri-bution of 201Tl reflects regional MPI; however, over time there is redistribution from storage depots in other tissues, resulting in the filling in of transient defects. This property allows stress and rest images to be obtained at differ-ent times after a single injection.
At the time, 201Tl was relatively expensive, so there was interest in finding a technetium-99m (99mTc)-labelled tracer which would be suitable for MPI. In the late 1970s a group of inorganic chemists began to explore the chemistry of technetium and to develop compounds in which the 99mTc atom was hidden inside the molecule and functional groups on the exterior of the molecule deter-mined its biological properties. This was un-like the metal chelates which had been used previously. For targeting the Na+/K+ ATPase, it was believed that a monovalent cation was required. The first promising compound was bis(1,2-dimethylphosphino)ethane (DMPE), developed by Deutsch et al. in Cincinatti. Im-ages of a dog heart were published in Science but the compound failed in humans due to binding to a protein in blood which did not allow activity to clear from the circulation. Davison and Jones in Boston developed the isonitrile complexes, of which sesta-mibi (Cardiolite) was brought to market by DuPont Pharma, becoming the most com-mercially successful radiopharmaceutical in
history. Deutsch et al. continued work with the phosphines and developed furifosmin, which Mallinckrodt brought to market, but its properties were definitely inferior to those of sestamibi. Radiochemists at the University of Cardiff developed another monovalent cation, tetrofosmin (Myoview), with Amer-sham International and it became a rival to sestamibi. Ironically, it turned out that these tracers entered the heart by passive diffusion rather than active transport, though their re-tention was due to the positive charge caus-ing them to localise in the mitochondria.
The group of Nunn et al. at Squibb devel-oped the boronic acid adduct of technetium oxime (BATO) compound teboroxime (Car-diotec), a neutral complex which showed good myocardial extraction but rapid wash-out, meaning that SPECT imaging had to be performed soon after injection. It was li-censed in the United States at the same time as sestamibi but dropped out of the market within a few years. Ironically, its properties are well suited to the solid state cardiac cameras now in use. Pasqualini et al. at CIS Bio Interna-tional developed 99mTc(N)-N-ethoxy-N-ethyl dithiocarbamate (NOEt), a neutral complex which showed good extraction and reten-tion by the myocardium. Although it was very promising, it was not brought to market because sestamibi and tetrofosmin were too well established by that time.
PET imaging of myocardial perfusion can be performed using 13N-ammonia and
44
15O-water, as described below, though both have limitations including the requirement for a nearby cyclotron due to their short half-lives. As an analogue of 201Tl, generator-produced rubidium-82 (82Rb) was marketed by Squibb (later Bracco) and became widely used in the United States. Its use is gradu-ally increasing in Europe. More recently, Lan-theus Medical Imaging has developed an 18F-labelled mitochondrial targeting agent, flurpiridaz, which may come to market in the near future.
Mechanisms of accumulationThe tracers used for MPI accumulate in the myocardium by different mechanisms. They will be categorised with respect to their mechanisms of localisation rather than their types of emission (i.e. SPECT vs PET). The three main mechanisms are active transport, pas-sive diffusion and mitochondrial targeting.
Active transportThe Na+/K+ ATPase pump regulates the bal-ance of these two cations in the heart.
Both 82Rb and 201Tl are biological analogues of potassium and are thus extracted by the same mechanism as potassium from the blood pool and transported into the myo-cyte (Fig. 1). 201Tl has a slower clearance time from the myocardium than potassium; this facilitates the imaging of the myocardium by gamma cameras. In a standard MPI pro-cedure, 201Tl is injected when the patient is undergoing peak stress, either exercise or pharmacological [4,5]. The initial distribu-
tion of 201Tl reflects perfusion, due to its high extraction, and thus ischaemic and infarcted regions are evident as defects (low activity). However, 201Tl is not retained in its initial dis-tribution and as the patient rests it diffuses into regions which had been ischaemic due to increased demand. Repeat imaging 4 h after injection provides an image in which only infarcted areas will be seen as defects. However, the imaging properties of 201Tl are not ideal, with its gamma photons in low abundance and the more abundant X-rays being subject to attenuation and scatter. Fur-thermore, its long half-life and poor dosim-etry limit the amount of activity which can be administered and hence the image qual-ity. It has largely been replaced by the 99mTc agents, though it is useful during times of molybdenum-99 shortage.
82Rb is a generator-produced positron emit-ter which is taken up by the same mecha-nism as 201Tl [6,7]. However, its half-life is too short for redistribution images to be per-formed so separate injections are required for stress and rest images, but the entire pro-cedure, including attenuation correction by CT, takes less than 30 min. The generator is relatively expensive and must be replaced monthly, so a high throughput of patients is required to make the test cost effective [7]. However, the quantitative nature of the re-sults obtained more than justify the cost of the test by producing a more accurate diag-nosis with savings on alternative treatments [7]. 82Rb is eluted from the generator with sa-line and infused directly into the patient.
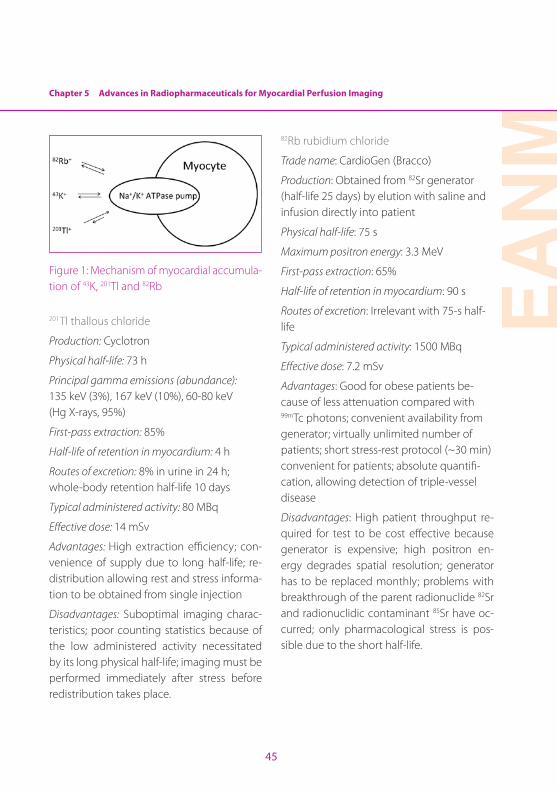
Chapter 5 Advances in Radiopharmaceuticals for Myocardial Perfusion Imaging
EAN
M
45
Figure 1: Mechanism of myocardial accumula-tion of 43K, 201Tl and 82Rb
201Tl thallous chloride
Production: Cyclotron
Physical half-life: 73 h
Principal gamma emissions (abundance): 135 keV (3%), 167 keV (10%), 60-80 keV (Hg X-rays, 95%)
First-pass extraction: 85%
Half-life of retention in myocardium: 4 h
Routes of excretion: 8% in urine in 24 h; whole-body retention half-life 10 days
Typical administered activity: 80 MBq
Effective dose: 14 mSv
Advantages: High extraction efficiency; con-venience of supply due to long half-life; re-distribution allowing rest and stress informa-tion to be obtained from single injection
Disadvantages: Suboptimal imaging charac-teristics; poor counting statistics because of the low administered activity necessitated by its long physical half-life; imaging must be performed immediately after stress before redistribution takes place.
82Rb rubidium chloride
Trade name: CardioGen (Bracco)
Production: Obtained from 82Sr generator (half-life 25 days) by elution with saline and infusion directly into patient
Physical half-life: 75 s
Maximum positron energy: 3.3 MeV
First-pass extraction: 65%
Half-life of retention in myocardium: 90 s
Routes of excretion: Irrelevant with 75-s half-life
Typical administered activity: 1500 MBq
Effective dose: 7.2 mSv
Advantages: Good for obese patients be-cause of less attenuation compared with 99mTc photons; convenient availability from generator; virtually unlimited number of patients; short stress-rest protocol (~30 min) convenient for patients; absolute quantifi-cation, allowing detection of triple-vessel disease
Disadvantages: High patient throughput re-quired for test to be cost effective because generator is expensive; high positron en-ergy degrades spatial resolution; generator has to be replaced monthly; problems with breakthrough of the parent radionuclide 82Sr and radionuclidic contaminant 85Sr have oc-curred; only pharmacological stress is pos-sible due to the short half-life.
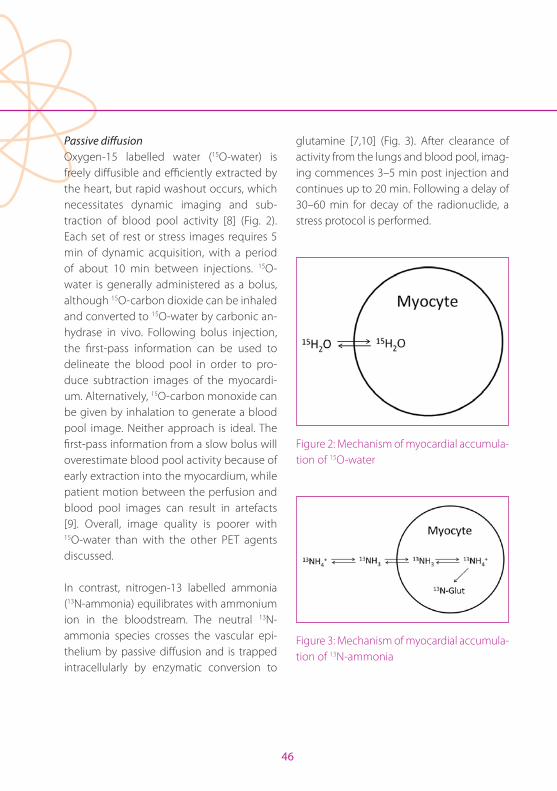
46
Passive diffusionOxygen-15 labelled water (15O-water) is freely diffusible and efficiently extracted by the heart, but rapid washout occurs, which necessitates dynamic imaging and sub-traction of blood pool activity [8] (Fig. 2). Each set of rest or stress images requires 5 min of dynamic acquisition, with a period of about 10 min between injections. 15O-water is generally administered as a bolus, although 15O-carbon dioxide can be inhaled and converted to 15O-water by carbonic an-hydrase in vivo. Following bolus injection, the first-pass information can be used to delineate the blood pool in order to pro-duce subtraction images of the myocardi-um. Alternatively, 15O-carbon monoxide can be given by inhalation to generate a blood pool image. Neither approach is ideal. The first-pass information from a slow bolus will overestimate blood pool activity because of early extraction into the myocardium, while patient motion between the perfusion and blood pool images can result in artefacts [9]. Overall, image quality is poorer with 15O-water than with the other PET agents discussed.
In contrast, nitrogen-13 labelled ammonia (13N-ammonia) equilibrates with ammonium ion in the bloodstream. The neutral 13N-ammonia species crosses the vascular epi-thelium by passive diffusion and is trapped intracellularly by enzymatic conversion to
glutamine [7,10] (Fig. 3). After clearance of activity from the lungs and blood pool, imag-ing commences 3–5 min post injection and continues up to 20 min. Following a delay of 30–60 min for decay of the radionuclide, a stress protocol is performed.
Figure 2: Mechanism of myocardial accumula-tion of 15O-water
Figure 3: Mechanism of myocardial accumula-tion of 13N-ammonia
Chapter 5 Advances in Radiopharmaceuticals for Myocardial Perfusion Imaging
EAN
M
47
15O-water
Production: Cyclotron
Physical half-life: 2 min
Maximum positron energy: 1.7 MeV
First-pass extraction: 100%
Half-life of retention in myocardium: Washes out freely
Routes of excretion: Irrelevant with 2-min half-life
Typical administered activity: 2200 MBq
Effective dose: 2.6 mSv
Advantages: Does not require high patient throughput; absolute quantification can be performed; high extraction, not affected by flow; due to short half-life, studies can be repeated after 15 min with physiological intervention
Disadvantages: Requires on-site cyclotron; blood pool activity must be subtracted; poor counting statistics due to short half-life
13N-ammonia
Production: Cyclotron
Physical half-life: 10 min
Maximum positron energy: 1.2 MeV
First-pass extraction: 80%
Half-life of retention in myocardium: 4 h
Route of excretion: Hepatobiliary
Typical administered activity: 740 MBq
Effective dose: 1.7 mSv
Advantages: Convenient for small number of patient studies; absolute quantification can be performed
Disadvantages: Requires nearby cyclotron; rest-stress protocol requires 1 h between tests to allow for decay; intense liver activity can mask inferior wall of heart
Mitochondrial targetingThe two most commercially successful and widely used 99mTc-labelled agents for MPI both target the mitochondria, though this was not intentional (Fig. 4). They were de-veloped as lipophilic cations, intended to be substrates for Na+/K+ ATPase as a trans-port pump. However, in vitro studies early in their development demonstrated that their uptake was not inhibited by pretreatment with ouabain, which blocks Na+/K+ ATPase. It was later determined that both compounds enter cells by passive diffusion due to their lipophilicity. Once in the cell they home to the mitochondria, where they are trapped by their positive charge. Both sestamibi and tetrofosmin consist of a 99mTc core hidden within a lipophilic structure with methoxy or ethoxy groups on the exterior to fine tune the biodistribution of the complex. Follow-ing intravenous injection at rest or during peak exercise or pharmacological stress, both are extracted quickly into the heart; however, imaging cannot begin until activity has cleared from the lungs and clearance has begun from the liver [1,5,11,12]. This occurs
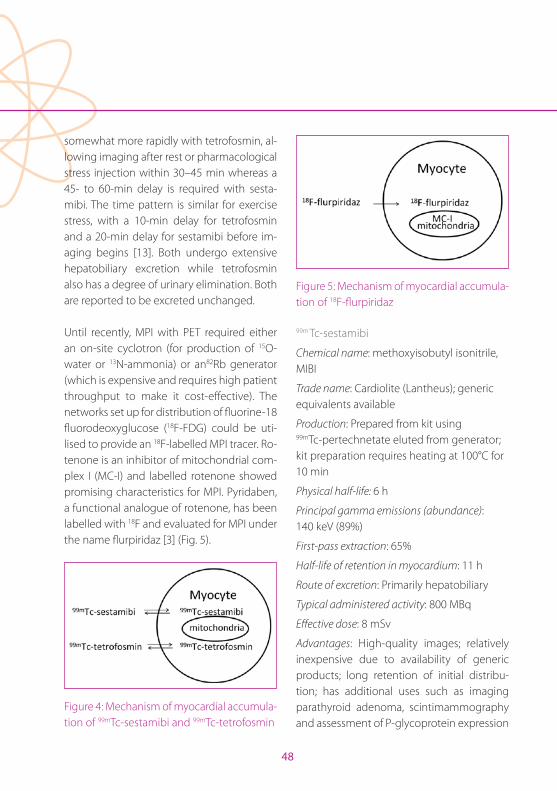
48
somewhat more rapidly with tetrofosmin, al-lowing imaging after rest or pharmacological stress injection within 30–45 min whereas a 45- to 60-min delay is required with sesta-mibi. The time pattern is similar for exercise stress, with a 10-min delay for tetrofosmin and a 20-min delay for sestamibi before im-aging begins [13]. Both undergo extensive hepatobiliary excretion while tetrofosmin also has a degree of urinary elimination. Both are reported to be excreted unchanged.
Until recently, MPI with PET required either an on-site cyclotron (for production of 15O-water or 13N-ammonia) or an82Rb generator (which is expensive and requires high patient throughput to make it cost-effective). The networks set up for distribution of fluorine-18 fluorodeoxyglucose (18F-FDG) could be uti-lised to provide an 18F-labelled MPI tracer. Ro-tenone is an inhibitor of mitochondrial com-plex I (MC-I) and labelled rotenone showed promising characteristics for MPI. Pyridaben, a functional analogue of rotenone, has been labelled with 18F and evaluated for MPI under the name flurpiridaz [3] (Fig. 5).
Figure 4: Mechanism of myocardial accumula-tion of 99mTc-sestamibi and 99mTc-tetrofosmin
Figure 5: Mechanism of myocardial accumula-tion of 18F-flurpiridaz
99m Tc-sestamibi
Chemical name: methoxyisobutyl isonitrile, MIBI
Trade name: Cardiolite (Lantheus); generic equivalents available
Production: Prepared from kit using 99mTc-pertechnetate eluted from generator; kit preparation requires heating at 100°C for 10 min
Physical half-life: 6 h
Principal gamma emissions (abundance): 140 keV (89%)
First-pass extraction: 65%
Half-life of retention in myocardium: 11 h
Route of excretion: Primarily hepatobiliary
Typical administered activity: 800 MBq
Effective dose: 8 mSv
Advantages: High-quality images; relatively inexpensive due to availability of generic products; long retention of initial distribu-tion; has additional uses such as imaging parathyroid adenoma, scintimammography and assessment of P-glycoprotein expression
Chapter 5 Advances in Radiopharmaceuticals for Myocardial Perfusion Imaging
EAN
M
49
Disadvantages: Preparation requires heating; hepatobiliary excretion delays imaging and can compromise cardiac resolution
99m Tc-tetrofosmin
Chemical name: 6,9-bis(2-ethoxyethyl)- 3,12-dioxa-6,9-diphosphatetradecane
Trade name: Myoview (GE Healthcare)
Production: Prepared from kit using 99mTc-pertechnetate eluted from generator and incubation at room temperature
Physical half-life: 6 h
Principal gamma emissions (abundance): 140 keV (89%)
First-pass extraction: 55%
Half-life of retention in myocardium: 4.5 h
Routes of excretion: Hepatobiliary and renal
Typical administered activity: 800 MBq
Effective dose: 6 mSv
Advantages: High-quality images; room temperature preparation is more convenient; faster background clearance than sestamibi, allowing earlier imaging
Disadvantages: Slightly lower first-pass extraction than sestamibi
18F-flurpiridaz (aka flupiridaz)
Chemical name: 2-tert-butyl-4-chloro-5-[(4-(2-[18F]fluoroanylethoxymethyl)phenyl) methoxy]pyridazin-3-one, BMS747158-02, RP1012, Lantheus Medical Imaging)
Production: Cyclotron
Physical half-life: 109 min
Maximum positron energy: 1.6 MeV
First-pass extraction: 90%
Half-life of retention in myocardium: 6 h
Route of excretion: Renal
Typical administered activity: 100 MBq (rest), 300 MBq (stress)
Effective dose: 6 mSv (rest + stress)
Advantages: Available as unit dose; high extraction, no flow limitation
Disadvantages: Expensive for high throughput
Production and quality assurance aspectsLicensed products201Tl is a fully licensed product which arrives ready to use. The end user only needs to check the documentation and verify the ra-dioactivity measurement. 18F-flurpiridaz will eventually be in the same class.
99mTc products prepared on siteSestamibi and tetrofosmin are prepared on site or at a central radiopharmacy from licensed kits and a licensed 99Mo/99mTc gen-erator under national regulations. Appropri-ate facilities are required and radiochemical purity testing may be performed.
50
PET products prepared on site15O-water and 13N-ammonia are prepared in a local cyclotron. Because of the short half-lives, quality testing is performed on a test production immediately prior to the clinical production. 15O-water is particularly prob-lematic as it can be produced adjacent to the patient and infused directly.
Generator-produced PET products82Rb is obtained from a generator and in-fused directly into the patient. Problems have occurred with breakthrough of the parent radionuclide 82Sr and radiocontaminant 85Sr. As a result it is now imperative that radionu-clidic purity testing is performed on a test elution prior to clinical use each day.
Summary and future directionsMPI with SPECT is an extensively validated test which is useful for cost-effective risk stratification and patient management[14]. It is widely available in the outpatient set-ting using relatively inexpensive technol-ogy. Protocols are standardised and there are excellent procedural and clinical utilization guidelines published by professional medi-cal societies internationally [14]. However, SPECT suffers the limitations that the radio-tracers are not optimal and are subject to at-tenuation artefacts,the test is time inefficient (stress-rest requires 4 h) and attenuation cor-rection is not robust and, as a result, may un-derestimate the extent of CAD [7].
MPI with PET offers a number of real or po-tential advantages. There is higher spatial and temporal resolution of images, with few-er attenuation defects. Diagnostic accuracy is reported to be higher and thus better for risk stratification[15]. In most cases the pro-cedure is shorter (30–90 min). PET/CT allows the potential for complementary information such as calcium scoring [14]. However, on the downside there are higher capital costs and, at present, more limited availability [14,15].
The properties of the discussed SPECT and PET agents are compared in Tables 1 and 2.
Current research in MPI tracersThere is great interest in developing MPI trac-ers for PET using the generator-produced radionuclides copper-62 (62Cu) (half-life 10 min) and gallium-68 (68Ga) (half-life 68 min). 62Cu-pyruvaldehyde-bis(N4-methylthiosemi-carbazone (62Cu-PTSM) produced good myo-cardial images in patients but accumulation was non-linear with relation to blood flow due to binding to albumin in the circulation [16]. An optimal 68Ga-labelled agent remains to be identified. A series of 68Ga-labelled sali-cylaldimine ligands failed to show suitable behaviour in a pig model [17]. However, the immense potential benefits of generator-produced PET radionuclides will ensure that this research continues.
Chapter 5 Advances in Radiopharmaceuticals for Myocardial Perfusion Imaging
EAN
M
51
Alternatives to flurpiridaz are under develop-ment, including BFPET (4-18F-fluorophenyl)triphenylphosphonium ion, FluoroPharma), a lipophilic cationic mitochondrial targeting agent currently in phase 2 clinical trials. Other 18F-labelled cations are also under develop-ment [18].
In contrast, there has been relatively little recent interest in novel SPECT agents as the market is felt to be mature, with sestamibi and tetrofosmin being well established. Re-cently an iodine-123 labelled analogue of ro-tenone has shown promising characteristics for mitochondrial targeting [19].
Competing modalitiesCompeting modalities include cardiac mag-netic resonance (CMR), echocardioradiog-raphy (ECR) and multi-detector computed tomography (MDCT) or dual-source CT (DSCT) [14,20]. CMR and ECR provide good diagnostic accuracy but variable intra- and inter-observer agreement for the presence
or exclusion of CAD [21]. CMR cannot be performed in most patients with pacemak-ers and implantable cardiac devices. Unlike PET/CT, these methods cannot provide abso-lute quantification (mL/g per minute), which is necessary to calculate the myocardial per-fusion reserve (MPR), and have lower sensitiv-ity for the detection of balanced ischaemia, multi-vessel disease and other pathological conditions that cannot be easily visualised by relative perfusion [7]. MDCT/DSCT has so far proven to be clinically feasible only for the detection of CAD (stenosis), and has shown limited success with MPI [21]. There is also concern about the radiation dose associated with the CT techniques.
ProspectsMPI with SPECT is a well-established proce-dure used widely around the world. MPI with PET/CT offers some potential advantages but at a cost. Competing modalities are being developed, but it will be a number of years before these replace MPI.

52
References Chapter 5
References1. Notghi A, Low CS. Myocardial perfusion scintigraphy:
past, present and future, Br J Radiol. 2011;84:S229-36.
2. Reyes E, Wiener S, Underwood SR. Myocardial perfusion scintigraphy in Europe 2007: a survey of the European Council of Nuclear Cardiology. Eur J Nucl Med Mol Imag-ing.2012;39:160-4.
3. Yu M, Nekolla SG, SchwaigerM, Robinson SP. The next generation of cardiac positron emission tomography imaging agents: discovery of flurpiridaz F-18 for detec-tion of coronary disease.SeminNucl Med.2011;41:305-13.
4. Ritchie JL, Albro PC, Caldwell JH, TrobaughGB, Ham-ilton GW. Thallium-201 myocardial imaging: a com-parison of the redistribution and rest images.J Nucl Med.1979;20:477-83.
5. Hesse B, Tägil K, Cuocolo A, Anagnostopoulos C, Bardiés M, Bax J, et al. and EANM/ESC Group. EANM/ESC procedural guidelines for myocardial perfusion imaging in nuclear cardiology.Eur J Nucl Med Mol Im-aging.2005;32:855-97.
6. Selwyn AP, Allan RM, L’Abbate A, Horlock P, Camici P, Clark J, et al. Relation between regional myocardial uptake of rubidium-82 and perfusion: absolute reduction of cation uptake in ischemia. Am J Cardiol.1982;50:112-21.
7. Machac J. Cardiac positron emission tomography imag-ing.SeminNucl Med.2005;35:17-36.
8. Bergmann SR, Herrero P, Markham J, WeinheimerCJ, Walsh MN.Noninvasive quantitation of myocardial blood flow in human subjects with oxygen-15-labeled water and positron emission tomography.J Am Col-lCardiol.1989;14:639-52.
9. Bergmann SR. Clinical applications of myocardial perfu-sion assessments made with oxygen-15 water and posi-tron emission tomography. Cardiology.1997;88:71-9.
10. Schelbert HR, Phelps ME, Hoffman EJ, Huang SC, SelinCE, Kuhl DE. Regional myocardial perfusion assessed with N-13 labeled ammonia and positron emission comput-erized axial tomography. Am J Cardiol.1979;43:209-18.
11. Wackers FJ, Berman DS, Maddahi J, Watson DD, Beller GA, Strauss HW, et al. Technetium-99m hexakis 2-methoxyiso-butyl isonitrile: human biodistribution, dosimetry, safety, and preliminary comparison to thallium-201 for myo-cardial perfusion imaging.J Nucl Med.1989;30:301-11.
12. Kelly JD, Forster AM, Higley B, Archer CM, Booker FS, Canning LR, et al. Technetium-99m-tetrofosmin as a new radiopharmaceutical for myocardial perfusion imaging.J Nucl Med.1993;34:222-7.
13. BaggishAL, Boucher CA. Radiopharmaceutical agents for myocardial perfusion imaging. Circula-tion.2008;118:1668-74.
14. Flotats A, Knuuti J, Gutberlet M, Marcassa C, Bengel FM, Kaufmann PA, et al., Cardiovascular Committee of the EANM, the ESCR and the ECNC. Hybrid cardiac imaging: SPECT/CT and PET/CT. A joint position statement by the European Association of Nuclear Medicine (EANM), the European Society of Cardiac Radiology (ESCR) and the European Council of Nuclear Cardiology (ECNC).Eur J Nucl Med Mol Imaging.2011;38:201-12.
15. McArdle BA, Dowsley TF, deKemp RA, Wells GA, Bean-lands RS.Does rubidium-82 PET have superior accuracy to SPECT perfusion imaging for the diagnosis of ob-structive coronary disease? A systematic review and meta-analysis.J Am CollCardiol.2012;60:1828-37.
16. Herrero P, Hartman JJ, Green MA, Anderson CJ, Welch MJ, Markham J, Bergmann SR. Regional myocardial perfusion assessed with generator-produced copper-62-PTSM and PET.J Nucl Med.1996;37:1294-300.
17. Tarkia M, Saraste A, Saanijoki T, Oikonen V, Vähäsilta T, Strandberg M, et al. Evaluation of 68Ga-labeled tracers for PET imaging of myocardial perfusion in pigs.Nucl Med Biol.2012;39:715-23.
18. Kim DY, Kim HJ, Yu KH, Min JJ. Synthesis of [18F]-la-beled (2-(2-fluoroethoxy)ethyl)tris(4-methoxyphenyl)phosphoniumcation as a potential agent for positron emission tomography myocardial imaging.Nucl Med Biol.2012;39:1093-8.
19. Wei L, Bensimon C, Lockwood J, Yan X, Fernando P, Wells RG, et al. Synthesis and characterization of 123I-CMICE-013: a potential SPECT myocardial perfusion imaging agent.Bioorg Med Chem.2013;21:2903-11.
20. Greenwood JP, Maredia N, Younger JF, Brown JM, Nixon J, Everett CC, et al. Cardiovascular magnetic resonance and single-photon emission computed tomography for diagnosis of coronary heart disease (CE-MARC): a prospective trial.Lancet.2012;379:453-60.
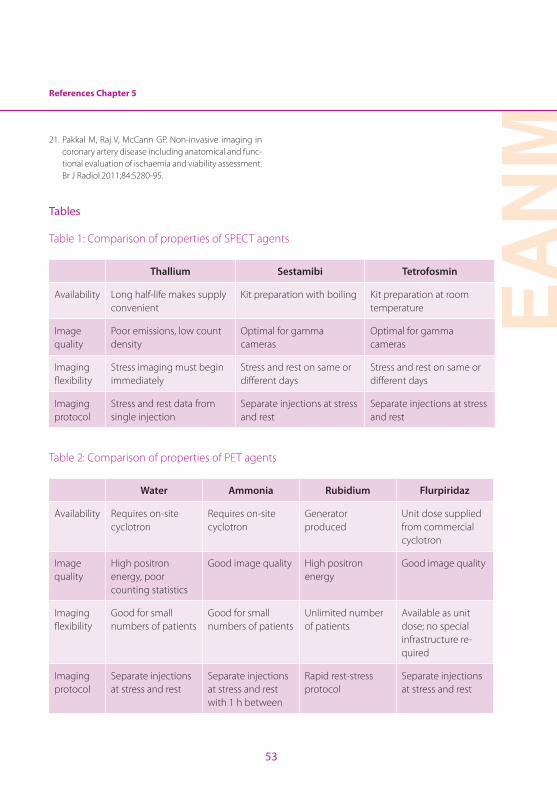
EAN
M
53
References Chapter 5
21. Pakkal M, Raj V, McCann GP. Non-invasive imaging in coronary artery disease including anatomical and func-tional evaluation of ischaemia and viability assessment. Br J Radiol.2011;84:S280-95.
Tables
Table 1: Comparison of properties of SPECT agents
Thallium Sestamibi Tetrofosmin
Availability Long half-life makes supply convenient
Kit preparation with boiling Kit preparation at room temperature
Image quality
Poor emissions, low count density
Optimal for gamma cameras
Optimal for gamma cameras
Imaging flexibility
Stress imaging must begin immediately
Stress and rest on same or different days
Stress and rest on same or different days
Imaging protocol
Stress and rest data from single injection
Separate injections at stress and rest
Separate injections at stress and rest
Table 2: Comparison of properties of PET agents
Water Ammonia Rubidium Flurpiridaz
Availability Requires on-site cyclotron
Requires on-site cyclotron
Generator produced
Unit dose supplied from commercial cyclotron
Image quality
High positron energy, poor counting statistics
Good image quality High positron energy
Good image quality
Imaging flexibility
Good for small numbers of patients
Good for small numbers of patients
Unlimited number of patients
Available as unit dose; no special infrastructure re-quired
Imaging protocol
Separate injections at stress and rest
Separate injections at stress and rest with 1 h between
Rapid rest-stress protocol
Separate injections at stress and rest
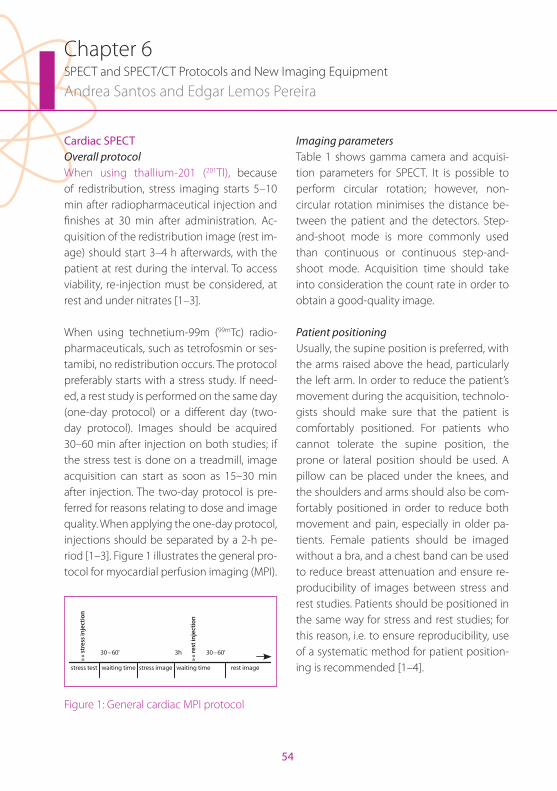
54
Chapter 6SPECT and SPECT/CT Protocols and New Imaging Equipment
Andrea Santos and Edgar Lemos Pereira
Cardiac SPECTOverall protocolWhen using thallium-201 (201Tl), because of redistribution, stress imaging starts 5–10 min after radiopharmaceutical injection and finishes at 30 min after administration. Ac-quisition of the redistribution image (rest im-age) should start 3–4 h afterwards, with the patient at rest during the interval. To access viability, re-injection must be considered, at rest and under nitrates [1–3].
When using technetium-99m (99mTc) radio-pharmaceuticals, such as tetrofosmin or ses-tamibi, no redistribution occurs. The protocol preferably starts with a stress study. If need-ed, a rest study is performed on the same day (one-day protocol) or a different day (two-day protocol). Images should be acquired 30–60 min after injection on both studies; if the stress test is done on a treadmill, image acquisition can start as soon as 15–30 min after injection. The two-day protocol is pre-ferred for reasons relating to dose and image quality. When applying the one-day protocol, injections should be separated by a 2-h pe-riod [1–3]. Figure 1 illustrates the general pro-tocol for myocardial perfusion imaging (MPI).
stress test
»» st
ress
inje
ctio
n
»» re
st in
ject
ion
waiting time waiting time rest imagestress image
30–60' 3h 30–60'
Figure 1: General cardiac MPI protocol
Imaging parametersTable 1 shows gamma camera and acquisi-tion parameters for SPECT. It is possible to perform circular rotation; however, non-circular rotation minimises the distance be-tween the patient and the detectors. Step-and-shoot mode is more commonly used than continuous or continuous step-and-shoot mode. Acquisition time should take into consideration the count rate in order to obtain a good-quality image.
Patient positioningUsually, the supine position is preferred, with the arms raised above the head, particularly the left arm. In order to reduce the patient’s movement during the acquisition, technolo-gists should make sure that the patient is comfortably positioned. For patients who cannot tolerate the supine position, the prone or lateral position should be used. A pillow can be placed under the knees, and the shoulders and arms should also be com-fortably positioned in order to reduce both movement and pain, especially in older pa-tients. Female patients should be imaged without a bra, and a chest band can be used to reduce breast attenuation and ensure re-producibility of images between stress and rest studies. Patients should be positioned in the same way for stress and rest studies; for this reason, i.e. to ensure reproducibility, use of a systematic method for patient position-ing is recommended [1–4].
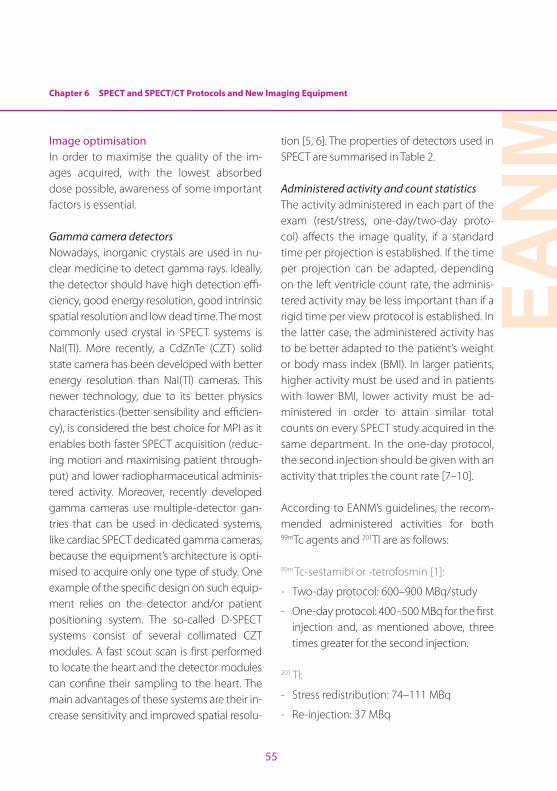
EAN
M
55
Chapter 6 SPECT and SPECT/CT Protocols and New Imaging Equipment
Image optimisationIn order to maximise the quality of the im-ages acquired, with the lowest absorbed dose possible, awareness of some important factors is essential.
Gamma camera detectorsNowadays, inorganic crystals are used in nu-clear medicine to detect gamma rays. Ideally, the detector should have high detection effi-ciency, good energy resolution, good intrinsic spatial resolution and low dead time. The most commonly used crystal in SPECT systems is NaI(Tl). More recently, a CdZnTe (CZT) solid state camera has been developed with better energy resolution than NaI(Tl) cameras. This newer technology, due to its better physics characteristics (better sensibility and efficien-cy), is considered the best choice for MPI as it enables both faster SPECT acquisition (reduc-ing motion and maximising patient through-put) and lower radiopharmaceutical adminis-tered activity. Moreover, recently developed gamma cameras use multiple-detector gan-tries that can be used in dedicated systems, like cardiac SPECT dedicated gamma cameras, because the equipment’s architecture is opti-mised to acquire only one type of study. One example of the specific design on such equip-ment relies on the detector and/or patient positioning system. The so-called D-SPECT systems consist of several collimated CZT modules. A fast scout scan is first performed to locate the heart and the detector modules can confine their sampling to the heart. The main advantages of these systems are their in-crease sensitivity and improved spatial resolu-
tion [5, 6]. The properties of detectors used in SPECT are summarised in Table 2.
Administered activity and count statisticsThe activity administered in each part of the exam (rest/stress, one-day/two-day proto-col) affects the image quality, if a standard time per projection is established. If the time per projection can be adapted, depending on the left ventricle count rate, the adminis-tered activity may be less important than if a rigid time per view protocol is established. In the latter case, the administered activity has to be better adapted to the patient’s weight or body mass index (BMI). In larger patients, higher activity must be used and in patients with lower BMI, lower activity must be ad-ministered in order to attain similar total counts on every SPECT study acquired in the same department. In the one-day protocol, the second injection should be given with an activity that triples the count rate [7–10].
According to EANM’s guidelines, the recom-mended administered activities for both 99mTc agents and 201Tl are as follows:
99m Tc-sestamibi or -tetrofosmin [1]:
- Two-day protocol: 600–900 MBq/study
- One-day protocol: 400–500 MBq for the first injection and, as mentioned above, three times greater for the second injection.
201 Tl:
- Stress redistribution: 74–111 MBq
- Re-injection: 37 MBq
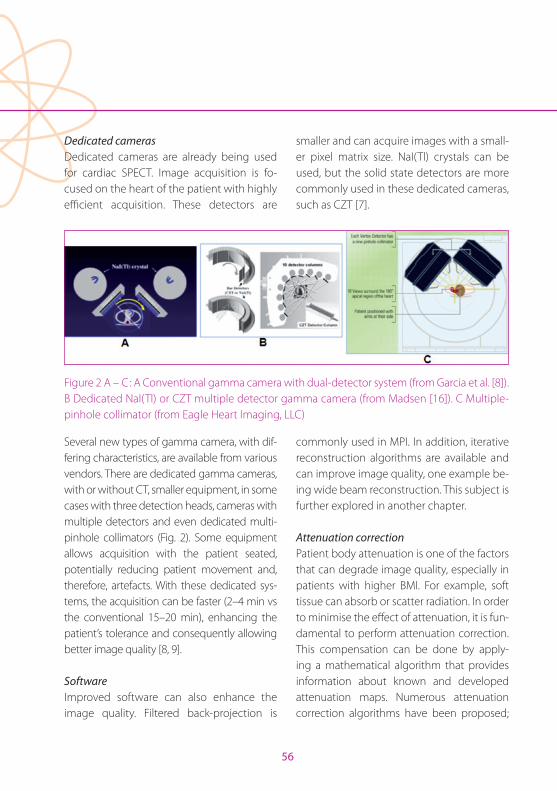
56
Dedicated camerasDedicated cameras are already being used for cardiac SPECT. Image acquisition is fo-cused on the heart of the patient with highly efficient acquisition. These detectors are
smaller and can acquire images with a small-er pixel matrix size. NaI(Tl) crystals can be used, but the solid state detectors are more commonly used in these dedicated cameras, such as CZT [7].
Figure 2 A – C: A Conventional gamma camera with dual-detector system (from Garcia et al. [8]). B Dedicated NaI(Tl) or CZT multiple detector gamma camera (from Madsen [16]). C Multiple-pinhole collimator (from Eagle Heart Imaging, LLC)
Several new types of gamma camera, with dif-fering characteristics, are available from various vendors. There are dedicated gamma cameras, with or without CT, smaller equipment, in some cases with three detection heads, cameras with multiple detectors and even dedicated multi-pinhole collimators (Fig. 2). Some equipment allows acquisition with the patient seated, potentially reducing patient movement and, therefore, artefacts. With these dedicated sys-tems, the acquisition can be faster (2–4 min vs the conventional 15–20 min), enhancing the patient’s tolerance and consequently allowing better image quality [8, 9].
SoftwareImproved software can also enhance the image quality. Filtered back-projection is
commonly used in MPI. In addition, iterative reconstruction algorithms are available and can improve image quality, one example be-ing wide beam reconstruction. This subject is further explored in another chapter.
Attenuation correctionPatient body attenuation is one of the factors that can degrade image quality, especially in patients with higher BMI. For example, soft tissue can absorb or scatter radiation. In order to minimise the effect of attenuation, it is fun-damental to perform attenuation correction. This compensation can be done by apply-ing a mathematical algorithm that provides information about known and developed attenuation maps. Numerous attenuation correction algorithms have been proposed;
Chapter 6 SPECT and SPECT/CT Protocols and New Imaging Equipment
EAN
M
57
the most commonly used algorithms are the Chang algorithm (from 1978) and the maxi-mum-likelihood expectation-maximisation (MLEM) reconstruction algorithm [10].
There is also a more patient-specific method to correct or compensate attenuation: esti-mation of patient-specific attenuation maps. This method is more accurate as it develops a patient-personal attenuation map. This type of attenuation correction can be applied by co-registration of the maps of another modal-ity (such as computed tomography), or ob-tained by the estimation of attenuation maps with the emission data. Use of the attenua-tion map generated by the CT image is one of the most accurate methods of attenuation correction but it must be very carefully used owing to both the increased radiation burden and the need for perfect emission and trans-mission alignment, systematically controlled. In the absence of the latter, motion artefacts between the images can cause a mismatch between the attenuation correction map from CT and the emission image [10].
GatingGated studies should be acquired whenever possible despite the slight increase in acqui-sition time. This technique allows evaluation of functional parameters such as ejection fraction, left ventricle volumes and regional wall motion and improves the diagnostic accuracy of perfusion imaging. For gating purposes, only the systolic signal is needed (usually the R wave), as it is not a diagnostic ECG. Usually, a 20% window of acceptance
is allowed, without reduction of the study quality. One can define 8–32 images per car-diac cycle (usually 8–16), depending on the desired information. The larger the number of images per cycle, the longer the exam will take. It is important that the heart rate re-mains stable and consistent during the entire procedure; an arrhythmic/dysrhythmic heart rate can significantly decrease the accuracy of the study [1, 4, 5].
Cardiac SPECT/CTSPECT/CT combines SPECT MPI with a CT scan in the same gantry. It allows acquisition of a SPECT scan and/or a CT scan, registration and fusion of the two images, and hybrid imaging, which adds specificity. Hybrid im-ages can also be achieved by registering and fusing scans from different equipment. Ade-quacy of the registration process is crucial, to avoid reconstruction artefacts. Some authors recommend the acquisition of a different CT scan at stress and rest for the purpose of at-tenuation correction [11–14].
Attenuation correction can be achieved with CT attenuation maps from linear at-tenuation coefficients. Table 3 summarises the general characteristics of CT for non-diagnostic and diagnostic purposes. When used for a non-diagnostic purpose, CT is performed only for attenuation correction as an alternative to the mathematical meth-ods previously discussed (it offers a more accurate method to correct attenuation, but at the cost of an increase in radiation burden). If CT is performed for a diagnostic
58
purpose, it maintains the ability to correct attenuation but can also be used to assess calcium scores or coronary angiography.
Diagnostic calcium scoring allows the detec-tion of calcified plaques within the coronary vessels and can thus help in the early detec-tion of coronary artery disease. Since the presence of calcified plaques does not mean that the myocardium is already in ischaemia, the information provided by this method is complementary to that acquired by MPI.
CT coronary angiography (CTCA) pro-vides detailed anatomical information on coronary vessels, which, when combined with the functional information offered by SPECT, increases diagnostic accuracy. CTCA is performed in several steps. Prior to CTCA, technologists should instruct the patient on breath-hold technique. First, a scout scan is performed for anatomical localisation of the heart, to define the start and end location of the CTCA scan. The scan should extend from 2.5–5 cm above the aortic root to be-low the bottom of the heart, in accordance with the scout image. It is important that scan length is optimised for the purpose of dose optimisation. The aim is to minimise the distance scanned from above to below the heart, while avoiding excessive restriction of the scan volume. CT coronary angiography is a contrast-enhanced scan: the scan starts about 10 s after intravenous contrast admin-istration as a single CT slice, with acquisition of one image every 2 s until a decrease in opacification of the aorta is observed [13, 14].
Calcium scoring CT and CTCA are comple-mentary exams and the information provid-ed by each one should be considered in con-junction with the results of MPI in order to maximise the information available regard-ing possible heart disease in each patient.
Radiation doseNowadays, the reduction of radiation doses related to myocardial scintigraphy is an im-portant issue. New reconstruction methods and modern detectors and/or collimators optimised for cardiac SPECT may provide a solution. Exclusion of the rest study when stress is normal can also appreciably reduce the radiation dose. CT for the purpose of at-tenuation correction (non-diagnostic) does not increase the radiation dose significantly. In any case, physicians and technologists must always pay due attention to adjusting CT protocols to the patient’s BMI, respecting the ALARA principle.
The estimated radiation dose due to CTCA ranges from 8 to 18 mSv. However, modern cardiac CT protocols (step-and-shoot ECG triggering, ECG-controlled current modula-tion that reduces the tube current by 80% during systole and body mass-adapted tube voltage that reduces the tube voltage to 100 kV in patients under 90 kg) allow reduc-tion of the radiation dose by 60–80%. Some studies have reported a radiation dose of 5.4 mSv at stress-only hybrid 99mTc-tetrofos-min SPECT/CT [11].
EAN
M
59
References Chapter 6
References1. Hesse B, Tägil K, Cuocolo A, Anagnostopoulos C, Bar-
dies M, Bax J, et al. EANM/ESC procedural guidelines for myocardial perfusion imaging in nuclear cardiology. Eur J NUcl Med Mol Imaging. 2005;32:855–97.
2. Strauss HW, Miller DD, Wittry MD, Cerqueira MD, Garcia EV, Iskandrian AS, et al. Procedure guideline for myo-cardial perfusion imaging 3.3. J Nucl Med Technol. 2008;36:155–61.
3. Lecoultre R, Jorge JP. Preparation and use of imaging equipment. In: Myocardial perfusion imaging – a tech-nologist’s guide. EANM. 2004:29–35.
4. Holly TA, Abbott BG, Al-Mallah M, Calnon DA, Cohen MC, DiFilippo FP, et al. ASNC imaging guidelines for nuclear cardiology procedures. J Nucl Cardiol. 2010.
5. Pedroso de Lima J. Física em Medicina Nuclear: Temas e aplicações. Coimbra: Coimbra University Press; 2008:159–86.
6. Arlt R, Ivanov V, Parnham K. Advantages and use of CdZnTe detectors in safeguard measurements. Ac-cessed in January, 2014. Available from http://www.evproducts.com/pdf/Applications/Advantages%20and%20use%20of%20CdZnTe.pdf
7. Frans J, Wackers T. Cardiac single-photon emission computed tomography myocardial perfusion imag-ing: finally up to speed. J Am Coll Cardiol. 55:1975–8.
8. Garcia EV, Faber TL, Esteves FP. Cardiac dedicated ultra-fast SPECT cameras: new designs and clinical implica-tions. J Nucl Med. 2011;52:210–7.
9. Sharir T, Slomka PJ, Berman DS. Solid-state SPECT tech-nology: fast and furious. J Nucl Cardiol. 2010;17:890–6.
10. King M, Glick S, Pretorius P. Attenuation, scatter and spatial resolution compensation in SPECT. In: Wernick M, Aarsvold J. Emssion tomograph: The fundamen-tals of PET and SPECT. USA: Elsevier Academic Press; 2004:473–85.
11. Flotats A, Knuuti J, Gutberlet M, Marcassa C, Bengel FM, Kaufmann PA, et al. Hybrid cardiac imaging: SPECT/CT and PET/CT. A joint position statement by the European Association of Nuclear Medicine (EANM), the European Society of Cardiac Radiology (ESCR) and the European Council of Nuclear Cardiology (ECNC). Eur J Nucl Med Mol Imaging 2011;38:201–12.
12. Delbeke D, Coleman RE, Guiberteau MJ, Brown ML, Royal HD, Siegel BA, et al. Procedure guidelines for SPECT/CT imaging 1.0. SNM. 2006.
13. Dorbala S, Di Carli MF, Delbeke D, Abbara S, DePuey EG, Dilsizian V, et al. SNMMI/ASNC/SCCT guideline for cardiac SPECT/CT and PET/CT 1.0. J Nucl Med. 2013;54:1485–507.
14. Mariani G, Flotats A, Israel O, Kim EE, Kuwert T. Clinical applications of SPECT/CT: New hybrid nuclear medicine imaging system. IAEA-TECDOC-1597. 2008.
15. Patton JA, Turkington TG. SNM SPECT/CT physical prin-ciples and attenuation correction. J Nucl Med Technol. 2008;36:1–10.
16. Madsen MT. Recent advances in SPECT imaging. J Nucl Med. 2007;48:661–73.
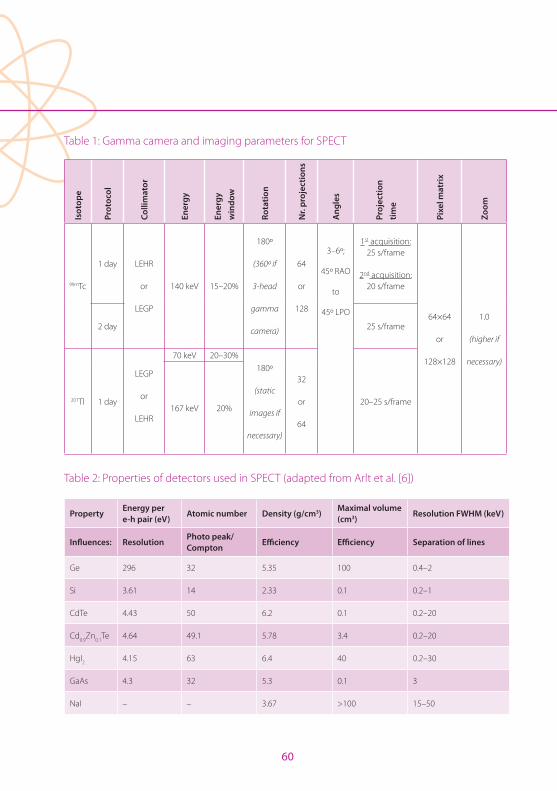
60
Table 1: Gamma camera and imaging parameters for SPECT
Isot
ope
Prot
ocol
Colli
mat
or
Ener
gy
Ener
gy
win
dow
Rota
tion
Nr.
proj
ectio
ns
Ang
les
Proj
ectio
n tim
e
Pixe
l mat
rix
Zoom
99mTc
1 day LEHR
or
LEGP
140 keV 15–20%
180º
(360º if
3-head
gamma
camera)
64
or
128
3–6º;
45º RAO
to
45º LPO
1st acquisition: 25 s/frame
2nd acquisition: 20 s/frame
64×64
or
128×128
1.0
(higher if
necessary)
2 day 25 s/frame
201Tl 1 day
LEGP
or
LEHR
70 keV 20–30%180º
(static
images if
necessary)
32
or
64
20–25 s/frame167 keV 20%
Table 2: Properties of detectors used in SPECT (adapted from Arlt et al. [6])
PropertyEnergy per e-h pair (eV)
Atomic number Density (g/cm3)Maximal volume (cm3)
Resolution FWHM (keV)
Influences: ResolutionPhoto peak/Compton
Efficiency Efficiency Separation of lines
Ge 296 32 5.35 100 0.4–2
Si 3.61 14 2.33 0.1 0.2–1
CdTe 4.43 50 6.2 0.1 0.2–20
Cd0.9Zn0.1Te 4.64 49.1 5.78 3.4 0.2–20
HgI2 4.15 63 6.4 40 0.2–30
GaAs 4.3 32 5.3 0.1 3
NaI – – 3.67 >100 15–50
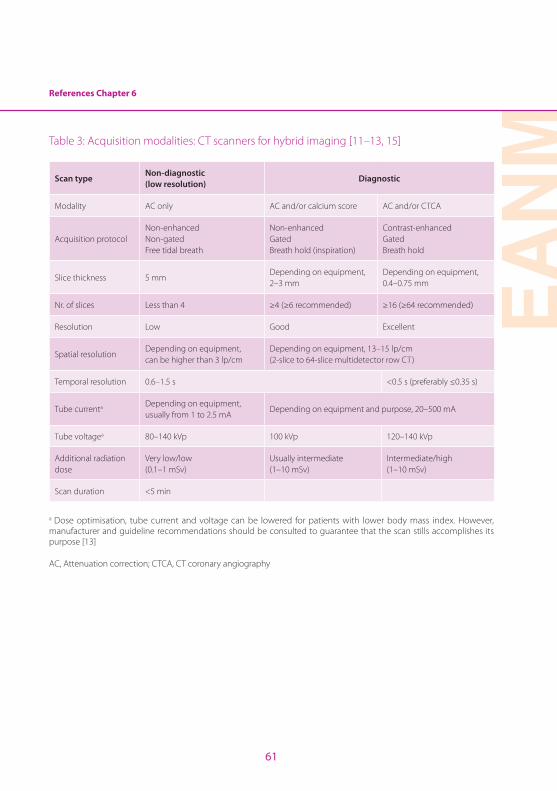
EAN
M
61
References Chapter 6
Table 3: Acquisition modalities: CT scanners for hybrid imaging [11–13, 15]
Scan typeNon-diagnostic (low resolution)
Diagnostic
Modality AC only AC and/or calcium score AC and/or CTCA
Acquisition protocolNon-enhancedNon-gatedFree tidal breath
Non-enhancedGatedBreath hold (inspiration)
Contrast-enhancedGatedBreath hold
Slice thickness 5 mmDepending on equipment, 2–3 mm
Depending on equipment, 0.4–0.75 mm
Nr. of slices Less than 4 ≥4 (≥6 recommended) ≥16 (≥64 recommended)
Resolution Low Good Excellent
Spatial resolutionDepending on equipment, can be higher than 3 lp/cm
Depending on equipment, 13–15 lp/cm (2-slice to 64-slice multidetector row CT)
Temporal resolution 0.6–1.5 s <0.5 s (preferably ≤0.35 s)
Tube currenta Depending on equipment, usually from 1 to 2.5 mA
Depending on equipment and purpose, 20–500 mA
Tube voltagea 80–140 kVp 100 kVp 120–140 kVp
Additional radiation dose
Very low/low(0.1–1 mSv)
Usually intermediate(1–10 mSv)
Intermediate/high(1–10 mSv)
Scan duration <5 min
a Dose optimisation, tube current and voltage can be lowered for patients with lower body mass index. However, manufacturer and guideline recommendations should be consulted to guarantee that the scan stills accomplishes its purpose [13]
AC, Attenuation correction; CTCA, CT coronary angiography
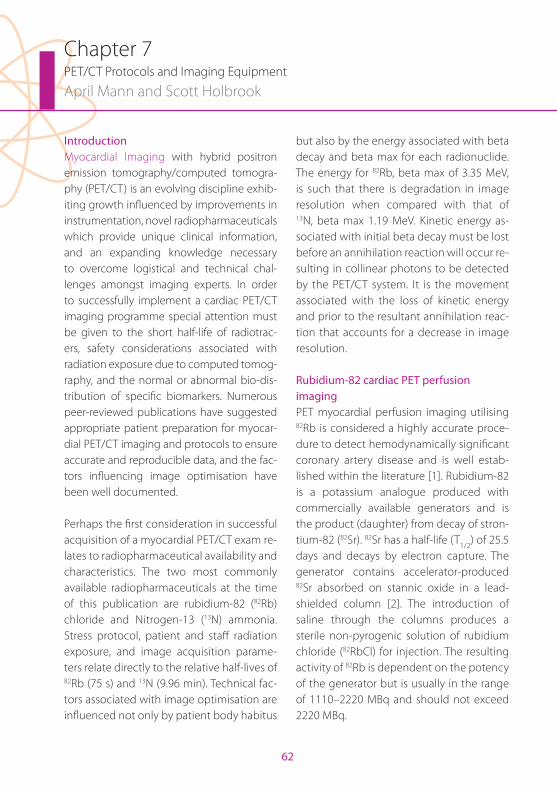
62
Chapter 7PET/CT Protocols and Imaging Equipment
April Mann and Scott Holbrook
IntroductionMyocardial Imaging with hybrid positron emission tomography/computed tomogra-phy (PET/CT) is an evolving discipline exhib-iting growth influenced by improvements in instrumentation, novel radiopharmaceuticals which provide unique clinical information, and an expanding knowledge necessary to overcome logistical and technical chal-lenges amongst imaging experts. In order to successfully implement a cardiac PET/CT imaging programme special attention must be given to the short half-life of radiotrac-ers, safety considerations associated with radiation exposure due to computed tomog-raphy, and the normal or abnormal bio-dis-tribution of specific biomarkers. Numerous peer-reviewed publications have suggested appropriate patient preparation for myocar-dial PET/CT imaging and protocols to ensure accurate and reproducible data, and the fac-tors influencing image optimisation have been well documented.
Perhaps the first consideration in successful acquisition of a myocardial PET/CT exam re-lates to radiopharmaceutical availability and characteristics. The two most commonly available radiopharmaceuticals at the time of this publication are rubidium-82 (82Rb) chloride and Nitrogen-13 (13N) ammonia. Stress protocol, patient and staff radiation exposure, and image acquisition parame-ters relate directly to the relative half-lives of 82Rb (75 s) and 13N (9.96 min). Technical fac-tors associated with image optimisation are influenced not only by patient body habitus
but also by the energy associated with beta decay and beta max for each radionuclide. The energy for 82Rb, beta max of 3.35 MeV, is such that there is degradation in image resolution when compared with that of 13N, beta max 1.19 MeV. Kinetic energy as-sociated with initial beta decay must be lost before an annihilation reaction will occur re-sulting in collinear photons to be detected by the PET/CT system. It is the movement associated with the loss of kinetic energy and prior to the resultant annihilation reac-tion that accounts for a decrease in image resolution.
Rubidium-82 cardiac PET perfusion imagingPET myocardial perfusion imaging utilising 82Rb is considered a highly accurate proce-dure to detect hemodynamically significant coronary artery disease and is well estab-lished within the literature [1]. Rubidium-82 is a potassium analogue produced with commercially available generators and is the product (daughter) from decay of stron-tium-82 (82Sr). 82Sr has a half-life (T1/2) of 25.5 days and decays by electron capture. The generator contains accelerator-produced 82Sr absorbed on stannic oxide in a lead-shielded column [2]. The introduction of saline through the columns produces a sterile non-pyrogenic solution of rubidium chloride (82RbCl) for injection. The resulting activity of 82Rb is dependent on the potency of the generator but is usually in the range of 1110–2220 MBq and should not exceed 2220 MBq.
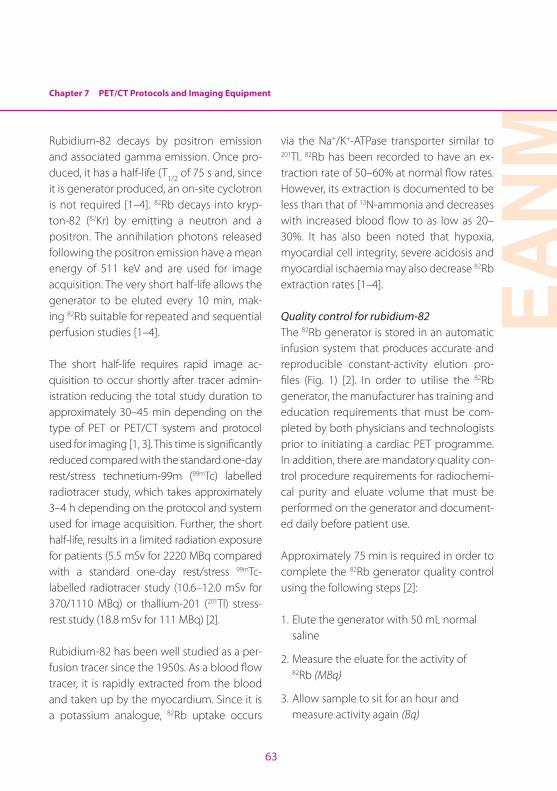
Chapter 7 PET/CT Protocols and Imaging Equipment
EAN
M
63
Rubidium-82 decays by positron emission and associated gamma emission. Once pro-duced, it has a half-life (T1/2 of 75 s and, since it is generator produced, an on-site cyclotron is not required [1–4]. 82Rb decays into kryp-ton-82 (82Kr) by emitting a neutron and a positron. The annihilation photons released following the positron emission have a mean energy of 511 keV and are used for image acquisition. The very short half-life allows the generator to be eluted every 10 min, mak-ing 82Rb suitable for repeated and sequential perfusion studies [1–4].
The short half-life requires rapid image ac-quisition to occur shortly after tracer admin-istration reducing the total study duration to approximately 30–45 min depending on the type of PET or PET/CT system and protocol used for imaging [1, 3]. This time is significantly reduced compared with the standard one-day rest/stress technetium-99m (99mTc) labelled radiotracer study, which takes approximately 3–4 h depending on the protocol and system used for image acquisition. Further, the short half-life, results in a limited radiation exposure for patients (5.5 mSv for 2220 MBq compared with a standard one-day rest/stress 99mTc-labelled radiotracer study (10.6–12.0 mSv for 370/1110 MBq) or thallium-201 (201Tl) stress-rest study (18.8 mSv for 111 MBq) [2].
Rubidium-82 has been well studied as a per-fusion tracer since the 1950s. As a blood flow tracer, it is rapidly extracted from the blood and taken up by the myocardium. Since it is a potassium analogue, 82Rb uptake occurs
via the Na+/K+-ATPase transporter similar to 201Tl. 82Rb has been recorded to have an ex-traction rate of 50–60% at normal flow rates. However, its extraction is documented to be less than that of 13N-ammonia and decreases with increased blood flow to as low as 20–30%. It has also been noted that hypoxia, myocardial cell integrity, severe acidosis and myocardial ischaemia may also decrease 82Rb extraction rates [1–4].
Quality control for rubidium-82The 82Rb generator is stored in an automatic infusion system that produces accurate and reproducible constant-activity elution pro-files (Fig. 1) [2]. In order to utilise the 82Rb generator, the manufacturer has training and education requirements that must be com-pleted by both physicians and technologists prior to initiating a cardiac PET programme. In addition, there are mandatory quality con-trol procedure requirements for radiochemi-cal purity and eluate volume that must be performed on the generator and document-ed daily before patient use.
Approximately 75 min is required in order to complete the 82Rb generator quality control using the following steps [2]:
1. Elute the generator with 50 mL normal saline
2. Measure the eluate for the activity of 82Rb (MBq)
3. Allow sample to sit for an hour and measure activity again (Bq)
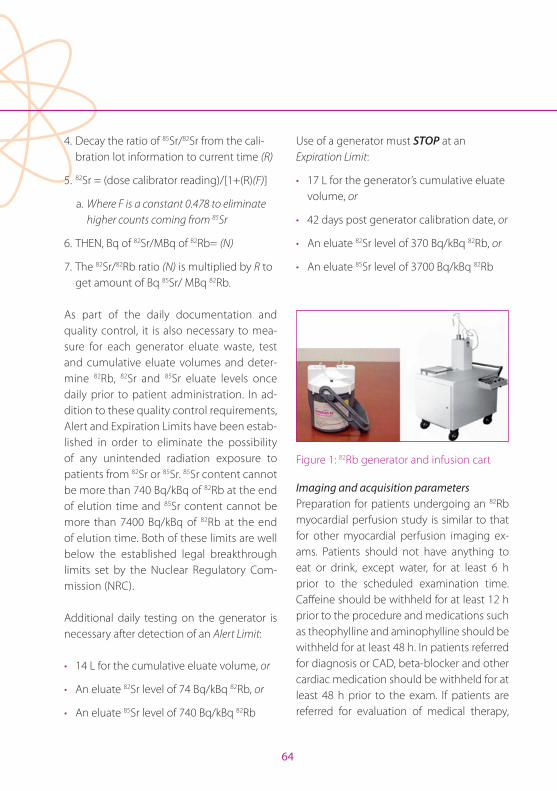
64
4. Decay the ratio of 85Sr/82Sr from the cali-bration lot information to current time (R)
5. 82Sr = (dose calibrator reading)/[1+(R)(F)]
a. Where F is a constant 0.478 to eliminate higher counts coming from 85Sr
6. THEN, Bq of 82Sr/MBq of 82Rb= (N)
7. The 82Sr/82Rb ratio (N) is multiplied by R to get amount of Bq 85Sr/ MBq 82Rb.
As part of the daily documentation and quality control, it is also necessary to mea-sure for each generator eluate waste, test and cumulative eluate volumes and deter-mine 82Rb, 82Sr and 85Sr eluate levels once daily prior to patient administration. In ad-dition to these quality control requirements, Alert and Expiration Limits have been estab-lished in order to eliminate the possibility of any unintended radiation exposure to patients from 82Sr or 85Sr. 85Sr content cannot be more than 740 Bq/kBq of 82Rb at the end of elution time and 85Sr content cannot be more than 7400 Bq/kBq of 82Rb at the end of elution time. Both of these limits are well below the established legal breakthrough limits set by the Nuclear Regulatory Com-mission (NRC).
Additional daily testing on the generator is necessary after detection of an Alert Limit:
• 14 L for the cumulative eluate volume, or
• An eluate 82Sr level of 74 Bq/kBq 82Rb, or
• An eluate 85Sr level of 740 Bq/kBq 82Rb
Use of a generator must STOP at an Expiration Limit:
• 17 L for the generator’s cumulative eluate volume, or
• 42 days post generator calibration date, or
• An eluate 82Sr level of 370 Bq/kBq 82Rb, or
• An eluate 85Sr level of 3700 Bq/kBq 82Rb
Figure 1: 82Rb generator and infusion cart
Imaging and acquisition parametersPreparation for patients undergoing an 82Rb myocardial perfusion study is similar to that for other myocardial perfusion imaging ex-ams. Patients should not have anything to eat or drink, except water, for at least 6 h prior to the scheduled examination time. Caffeine should be withheld for at least 12 h prior to the procedure and medications such as theophylline and aminophylline should be withheld for at least 48 h. In patients referred for diagnosis or CAD, beta-blocker and other cardiac medication should be withheld for at least 48 h prior to the exam. If patients are referred for evaluation of medical therapy,
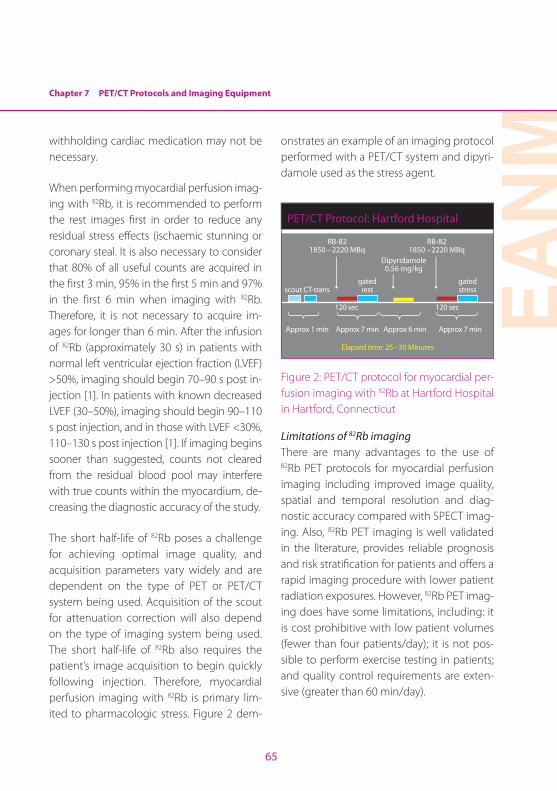
Chapter 7 PET/CT Protocols and Imaging Equipment
EAN
M
65
withholding cardiac medication may not be necessary.
When performing myocardial perfusion imag-ing with 82Rb, it is recommended to perform the rest images first in order to reduce any residual stress effects (ischaemic stunning or coronary steal. It is also necessary to consider that 80% of all useful counts are acquired in the first 3 min, 95% in the first 5 min and 97% in the first 6 min when imaging with 82Rb. Therefore, it is not necessary to acquire im-ages for longer than 6 min. After the infusion of 82Rb (approximately 30 s) in patients with normal left ventricular ejection fraction (LVEF) >50%, imaging should begin 70–90 s post in-jection [1]. In patients with known decreased LVEF (30–50%), imaging should begin 90–110 s post injection, and in those with LVEF <30%, 110–130 s post injection [1]. If imaging begins sooner than suggested, counts not cleared from the residual blood pool may interfere with true counts within the myocardium, de-creasing the diagnostic accuracy of the study.
The short half-life of 82Rb poses a challenge for achieving optimal image quality, and acquisition parameters vary widely and are dependent on the type of PET or PET/CT system being used. Acquisition of the scout for attenuation correction will also depend on the type of imaging system being used. The short half-life of 82Rb also requires the patient’s image acquisition to begin quickly following injection. Therefore, myocardial perfusion imaging with 82Rb is primary lim-ited to pharmacologic stress. Figure 2 dem-
onstrates an example of an imaging protocol performed with a PET/CT system and dipyri-damole used as the stress agent.
RB-821850 –2220 MBq
RB-821850 –2220 MBq
Dipyridamole0.56 mg/kg
scout CT-transgated
rest
120 sec 120 sec
Approx 1 min Approx 7 min Approx 6 min
Elapsed time: 25–30 Minutes
Approx 7 min
gated stress
PET/CT Protocol: Hartford Hospital
Figure 2: PET/CT protocol for myocardial per-fusion imaging with 82Rb at Hartford Hospital in Hartford, Connecticut
Limitations of 82Rb imagingThere are many advantages to the use of 82Rb PET protocols for myocardial perfusion imaging including improved image quality, spatial and temporal resolution and diag-nostic accuracy compared with SPECT imag-ing. Also, 82Rb PET imaging is well validated in the literature, provides reliable prognosis and risk stratification for patients and offers a rapid imaging procedure with lower patient radiation exposures. However, 82Rb PET imag-ing does have some limitations, including: it is cost prohibitive with low patient volumes (fewer than four patients/day); it is not pos-sible to perform exercise testing in patients; and quality control requirements are exten-sive (greater than 60 min/day).
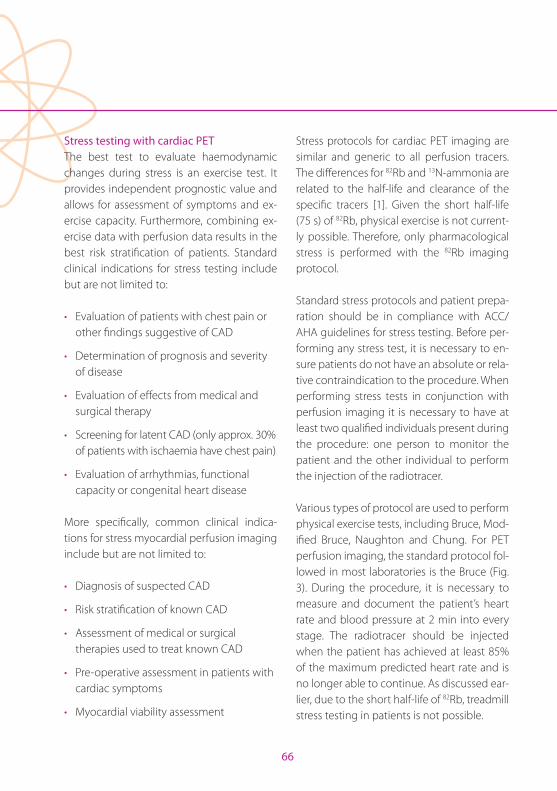
66
Stress testing with cardiac PETThe best test to evaluate haemodynamic changes during stress is an exercise test. It provides independent prognostic value and allows for assessment of symptoms and ex-ercise capacity. Furthermore, combining ex-ercise data with perfusion data results in the best risk stratification of patients. Standard clinical indications for stress testing include but are not limited to:
• Evaluation of patients with chest pain or other findings suggestive of CAD
• Determination of prognosis and severity of disease
• Evaluation of effects from medical and surgical therapy
• Screening for latent CAD (only approx. 30% of patients with ischaemia have chest pain)
• Evaluation of arrhythmias, functional capacity or congenital heart disease
More specifically, common clinical indica-tions for stress myocardial perfusion imaging include but are not limited to:
• Diagnosis of suspected CAD
• Risk stratification of known CAD
• Assessment of medical or surgical therapies used to treat known CAD
• Pre-operative assessment in patients with cardiac symptoms
• Myocardial viability assessment
Stress protocols for cardiac PET imaging are similar and generic to all perfusion tracers. The differences for 82Rb and 13N-ammonia are related to the half-life and clearance of the specific tracers [1]. Given the short half-life (75 s) of 82Rb, physical exercise is not current-ly possible. Therefore, only pharmacological stress is performed with the 82Rb imaging protocol.
Standard stress protocols and patient prepa-ration should be in compliance with ACC/AHA guidelines for stress testing. Before per-forming any stress test, it is necessary to en-sure patients do not have an absolute or rela-tive contraindication to the procedure. When performing stress tests in conjunction with perfusion imaging it is necessary to have at least two qualified individuals present during the procedure: one person to monitor the patient and the other individual to perform the injection of the radiotracer.
Various types of protocol are used to perform physical exercise tests, including Bruce, Mod-ified Bruce, Naughton and Chung. For PET perfusion imaging, the standard protocol fol-lowed in most laboratories is the Bruce (Fig. 3). During the procedure, it is necessary to measure and document the patient’s heart rate and blood pressure at 2 min into every stage. The radiotracer should be injected when the patient has achieved at least 85% of the maximum predicted heart rate and is no longer able to continue. As discussed ear-lier, due to the short half-life of 82Rb, treadmill stress testing in patients is not possible.
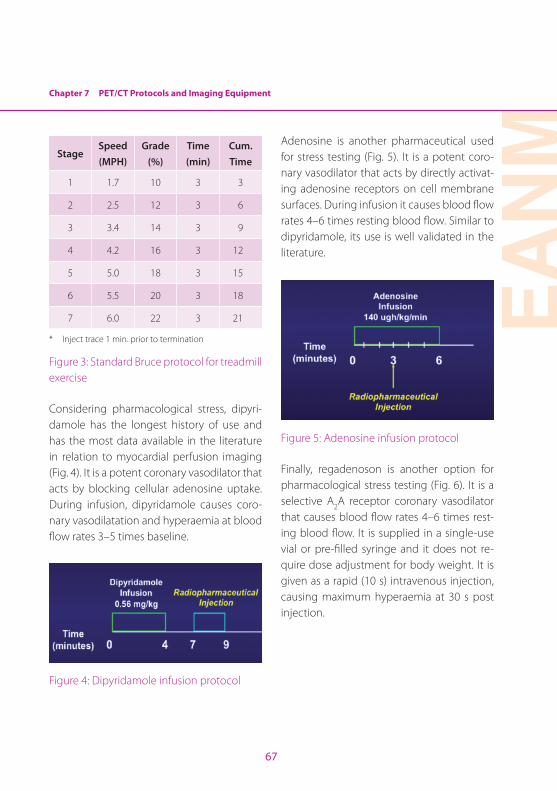
Chapter 7 PET/CT Protocols and Imaging Equipment
EAN
M
67
StageSpeed (MPH)
Grade (%)
Time (min)
Cum. Time
1 1.7 10 3 3
2 2.5 12 3 6
3 3.4 14 3 9
4 4.2 16 3 12
5 5.0 18 3 15
6 5.5 20 3 18
7 6.0 22 3 21
* Inject trace 1 min. prior to termination
Figure 3: Standard Bruce protocol for treadmill exercise
Considering pharmacological stress, dipyri-damole has the longest history of use and has the most data available in the literature in relation to myocardial perfusion imaging (Fig. 4). It is a potent coronary vasodilator that acts by blocking cellular adenosine uptake. During infusion, dipyridamole causes coro-nary vasodilatation and hyperaemia at blood flow rates 3–5 times baseline.
Figure 4: Dipyridamole infusion protocol
Adenosine is another pharmaceutical used for stress testing (Fig. 5). It is a potent coro-nary vasodilator that acts by directly activat-ing adenosine receptors on cell membrane surfaces. During infusion it causes blood flow rates 4–6 times resting blood flow. Similar to dipyridamole, its use is well validated in the literature.
Figure 5: Adenosine infusion protocol
Finally, regadenoson is another option for pharmacological stress testing (Fig. 6). It is a selective A2A receptor coronary vasodilator that causes blood flow rates 4–6 times rest-ing blood flow. It is supplied in a single-use vial or pre-filled syringe and it does not re-quire dose adjustment for body weight. It is given as a rapid (10 s) intravenous injection, causing maximum hyperaemia at 30 s post injection.
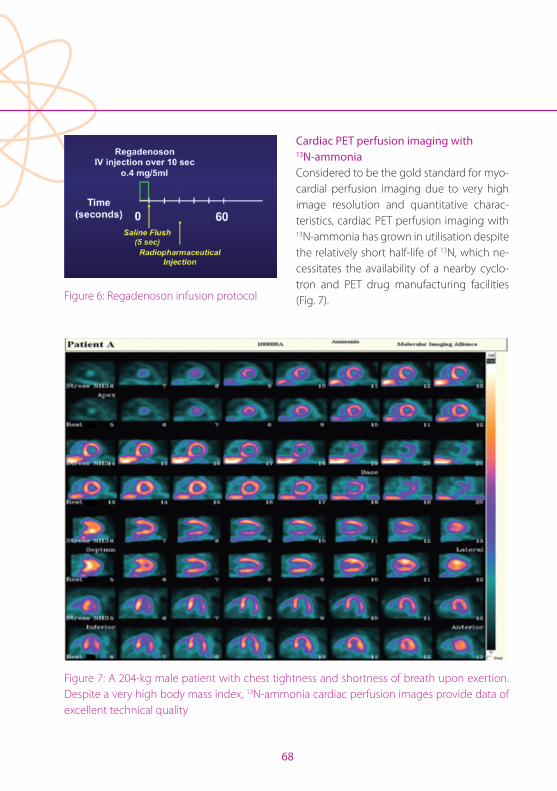
68
Figure 6: Regadenoson infusion protocol
Cardiac PET perfusion imaging with 13N-ammoniaConsidered to be the gold standard for myo-cardial perfusion imaging due to very high image resolution and quantitative charac-teristics, cardiac PET perfusion imaging with 13N-ammonia has grown in utilisation despite the relatively short half-life of 13N, which ne-cessitates the availability of a nearby cyclo-tron and PET drug manufacturing facilities (Fig. 7).
Figure 7: A 204-kg male patient with chest tightness and shortness of breath upon exertion. Despite a very high body mass index, 13N-ammonia cardiac perfusion images provide data of excellent technical quality
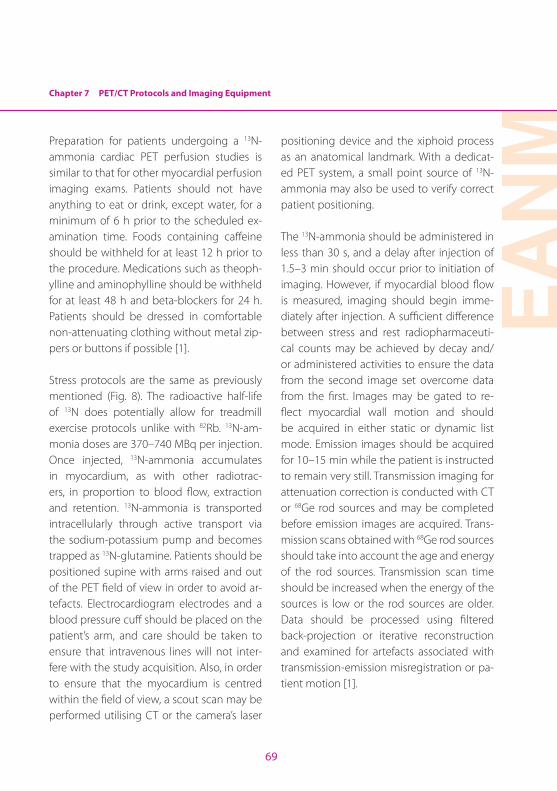
Chapter 7 PET/CT Protocols and Imaging Equipment
EAN
M
69
Preparation for patients undergoing a 13N-ammonia cardiac PET perfusion studies is similar to that for other myocardial perfusion imaging exams. Patients should not have anything to eat or drink, except water, for a minimum of 6 h prior to the scheduled ex-amination time. Foods containing caffeine should be withheld for at least 12 h prior to the procedure. Medications such as theoph-ylline and aminophylline should be withheld for at least 48 h and beta-blockers for 24 h. Patients should be dressed in comfortable non-attenuating clothing without metal zip-pers or buttons if possible [1].
Stress protocols are the same as previously mentioned (Fig. 8). The radioactive half-life of 13N does potentially allow for treadmill exercise protocols unlike with 82Rb. 13N-am-monia doses are 370–740 MBq per injection. Once injected, 13N-ammonia accumulates in myocardium, as with other radiotrac-ers, in proportion to blood flow, extraction and retention. 13N-ammonia is transported intracellularly through active transport via the sodium-potassium pump and becomes trapped as 13N-glutamine. Patients should be positioned supine with arms raised and out of the PET field of view in order to avoid ar-tefacts. Electrocardiogram electrodes and a blood pressure cuff should be placed on the patient’s arm, and care should be taken to ensure that intravenous lines will not inter-fere with the study acquisition. Also, in order to ensure that the myocardium is centred within the field of view, a scout scan may be performed utilising CT or the camera’s laser
positioning device and the xiphoid process as an anatomical landmark. With a dedicat-ed PET system, a small point source of 13N-ammonia may also be used to verify correct patient positioning.
The 13N-ammonia should be administered in less than 30 s, and a delay after injection of 1.5–3 min should occur prior to initiation of imaging. However, if myocardial blood flow is measured, imaging should begin imme-diately after injection. A sufficient difference between stress and rest radiopharmaceuti-cal counts may be achieved by decay and/or administered activities to ensure the data from the second image set overcome data from the first. Images may be gated to re-flect myocardial wall motion and should be acquired in either static or dynamic list mode. Emission images should be acquired for 10–15 min while the patient is instructed to remain very still. Transmission imaging for attenuation correction is conducted with CT or 68Ge rod sources and may be completed before emission images are acquired. Trans-mission scans obtained with 68Ge rod sources should take into account the age and energy of the rod sources. Transmission scan time should be increased when the energy of the sources is low or the rod sources are older. Data should be processed using filtered back-projection or iterative reconstruction and examined for artefacts associated with transmission-emission misregistration or pa-tient motion [1].
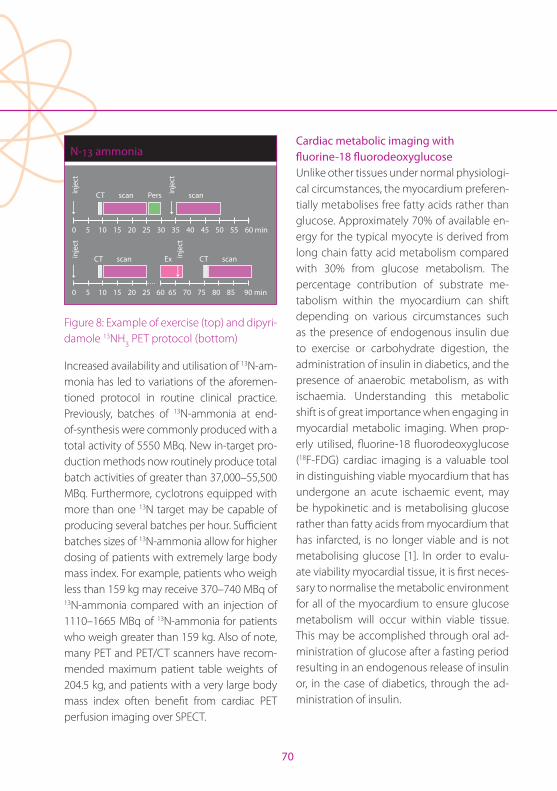
70
CT scan Pers
0 5 10 15 20 25
0 5 10 15 20 25 30 35 40 45 50 55 60 min
60 65 70 75 80 85 90 min
CT scan CT scanEx
scaninje
ctin
ject
inje
ctin
ject
N-13 ammonia
Figure 8: Example of exercise (top) and dipyri-damole 13NH3 PET protocol (bottom)
Increased availability and utilisation of 13N-am-monia has led to variations of the aforemen-tioned protocol in routine clinical practice. Previously, batches of 13N-ammonia at end-of-synthesis were commonly produced with a total activity of 5550 MBq. New in-target pro-duction methods now routinely produce total batch activities of greater than 37,000–55,500 MBq. Furthermore, cyclotrons equipped with more than one 13N target may be capable of producing several batches per hour. Sufficient batches sizes of 13N-ammonia allow for higher dosing of patients with extremely large body mass index. For example, patients who weigh less than 159 kg may receive 370–740 MBq of 13N-ammonia compared with an injection of 1110–1665 MBq of 13N-ammonia for patients who weigh greater than 159 kg. Also of note, many PET and PET/CT scanners have recom-mended maximum patient table weights of 204.5 kg, and patients with a very large body mass index often benefit from cardiac PET perfusion imaging over SPECT.
Cardiac metabolic imaging with fluorine-18 fluorodeoxyglucoseUnlike other tissues under normal physiologi-cal circumstances, the myocardium preferen-tially metabolises free fatty acids rather than glucose. Approximately 70% of available en-ergy for the typical myocyte is derived from long chain fatty acid metabolism compared with 30% from glucose metabolism. The percentage contribution of substrate me-tabolism within the myocardium can shift depending on various circumstances such as the presence of endogenous insulin due to exercise or carbohydrate digestion, the administration of insulin in diabetics, and the presence of anaerobic metabolism, as with ischaemia. Understanding this metabolic shift is of great importance when engaging in myocardial metabolic imaging. When prop-erly utilised, fluorine-18 fluorodeoxyglucose (18F-FDG) cardiac imaging is a valuable tool in distinguishing viable myocardium that has undergone an acute ischaemic event, may be hypokinetic and is metabolising glucose rather than fatty acids from myocardium that has infarcted, is no longer viable and is not metabolising glucose [1]. In order to evalu-ate viability myocardial tissue, it is first neces-sary to normalise the metabolic environment for all of the myocardium to ensure glucose metabolism will occur within viable tissue. This may be accomplished through oral ad-ministration of glucose after a fasting period resulting in an endogenous release of insulin or, in the case of diabetics, through the ad-ministration of insulin.
Chapter 7 PET/CT Protocols and Imaging Equipment
EAN
M
71
Fluorine-18 fluorodeoxyglucose, an ana-logue for dietary glucose, is transported across cell membranes via glucose transport-er proteins such as GLUT-1. Once in the intra-cellular space, glucose is acted upon by the enzyme hexokinase and converted to two molecules of pyruvate (glycolysis) that then proceed to the Krebs cycle and subsequent steps associated with oxidative metabolism. Alternatively, 18F-FDG becomes converted to 18F-FDG-6-phosphatase, which is not a suitable substrate for oxidative metabolism and cannot pass to subsequent steps associ-ated with glucose metabolism. Additionally, 18F-FDG-6-phosphatase becomes trapped within the intracellular space and serves as an excellent marker for relative glucose me-tabolism.
On the day of the scheduled procedure, pa-tients should arrive with nothing by mouth for at least 6 h prior to the scheduled exami-nation time. An initial blood serum glucose measurement should be taken prior to ad-ministration of glucose. If initial blood serum glucose values are less than 250 mg/dl, then the protocol may proceed with 25–100 mg of oral glucose. Subsequent blood serum glucose measurements should be taken until a blood serum glucose level of 100–140 mg/dl is obtained. The increase in blood serum glucose associated with oral administration of glucose and its subsequent decrease indi-cate the release of endogenous insulin by the pancreas, creating a suitable environment for administration and imaging of 18F-FDG. If the patient’s initial fasting blood serum glucose
measurement is greater than 250 mg/dl, no further oral glucose loading is necessary. However, it may be necessary to administer insulin to achieve the desired effect [5]. Once the desired blood serum glucose/insulin re-sponse has been achieved, 185–555 MBq 18F-FDG should be administered.
Image acquisition typically begins 45–60 min post injection. Certain patient popula-tions such as diabetics may present glucose management challenges because insulin resistance may result in the need to delay imaging up to 2 or 3 h. Patients should be instructed to wear comfortable, non-atten-uating clothing and be positioned supine with arms above the head and outside of the camera field of view. Scout scans may be per-formed with 18F-FDG data or CT data in the case of PET/CT. Images may be acquired for 10–30 min in static or dynamic list mode. At-tenuation correction may be performed im-mediately before or after the emission scan, prior to patient movement, using either CT or 68Ge rod sources. Data are reconstructed with filtered back-projection or iterative re-construction [1].
Cardiac PET images obtained with 18F-FDG are often compared with resting perfusion images in order to identify tissue that was not readily detectible based on potassium transport or other mechanisms relied upon by cardiac perfusion radiopharmaceuticals but still participates in active glucose metab-olism and is therefore viable. This mismatch represents viable myocardium that is either
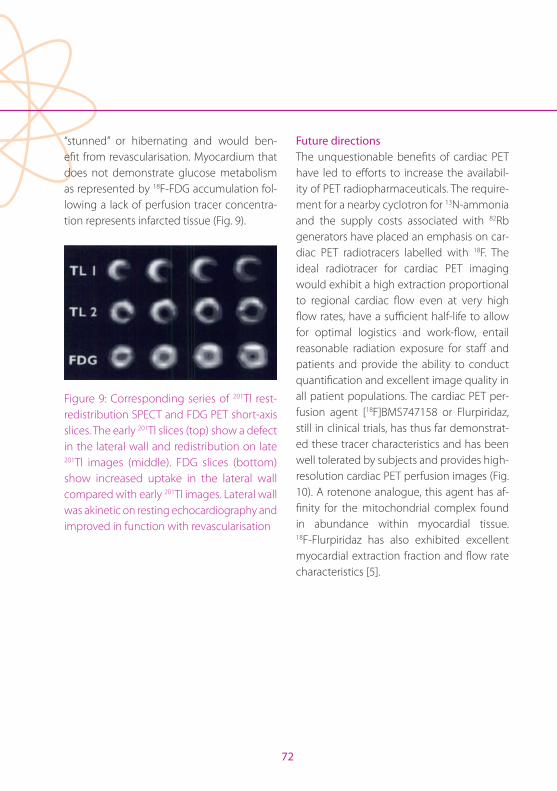
72
“stunned” or hibernating and would ben-efit from revascularisation. Myocardium that does not demonstrate glucose metabolism as represented by 18F-FDG accumulation fol-lowing a lack of perfusion tracer concentra-tion represents infarcted tissue (Fig. 9).
Figure 9: Corresponding series of 201Tl rest-redistribution SPECT and FDG PET short-axis slices. The early 201Tl slices (top) show a defect in the lateral wall and redistribution on late 201Tl images (middle). FDG slices (bottom) show increased uptake in the lateral wall compared with early 201Tl images. Lateral wall was akinetic on resting echocardiography and improved in function with revascularisation
Future directionsThe unquestionable benefits of cardiac PET have led to efforts to increase the availabil-ity of PET radiopharmaceuticals. The require-ment for a nearby cyclotron for 13N-ammonia and the supply costs associated with 82Rb generators have placed an emphasis on car-diac PET radiotracers labelled with 18F. The ideal radiotracer for cardiac PET imaging would exhibit a high extraction proportional to regional cardiac flow even at very high flow rates, have a sufficient half-life to allow for optimal logistics and work-flow, entail reasonable radiation exposure for staff and patients and provide the ability to conduct quantification and excellent image quality in all patient populations. The cardiac PET per-fusion agent [18F]BMS747158 or Flurpiridaz, still in clinical trials, has thus far demonstrat-ed these tracer characteristics and has been well tolerated by subjects and provides high-resolution cardiac PET perfusion images (Fig. 10). A rotenone analogue, this agent has af-finity for the mitochondrial complex found in abundance within myocardial tissue. 18F-Flurpiridaz has also exhibited excellent myocardial extraction fraction and flow rate characteristics [5].
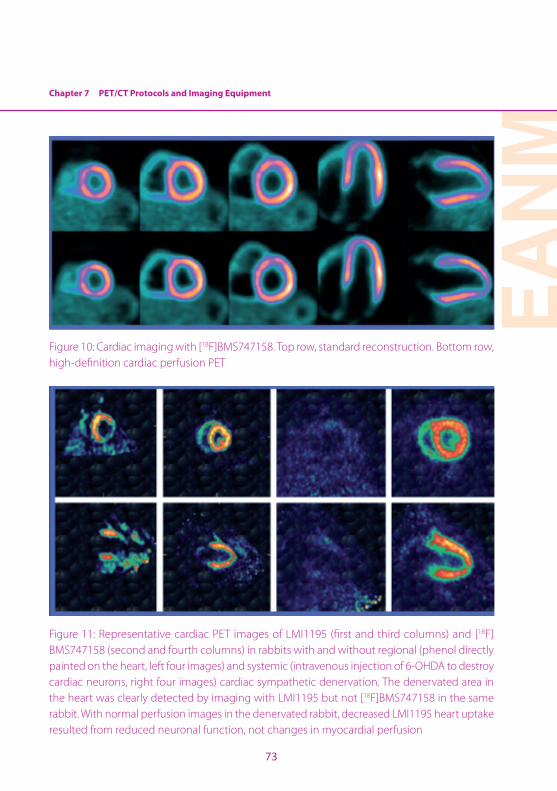
Chapter 7 PET/CT Protocols and Imaging Equipment
EAN
M
73
Figure 10: Cardiac imaging with [18F]BMS747158. Top row, standard reconstruction. Bottom row, high-definition cardiac perfusion PET
Figure 11: Representative cardiac PET images of LMI1195 (first and third columns) and [18F]BMS747158 (second and fourth columns) in rabbits with and without regional (phenol directly painted on the heart, left four images) and systemic (intravenous injection of 6-OHDA to destroy cardiac neurons, right four images) cardiac sympathetic denervation. The denervated area in the heart was clearly detected by imaging with LMI1195 but not [18F]BMS747158 in the same rabbit. With normal perfusion images in the denervated rabbit, decreased LMI1195 heart uptake resulted from reduced neuronal function, not changes in myocardial perfusion
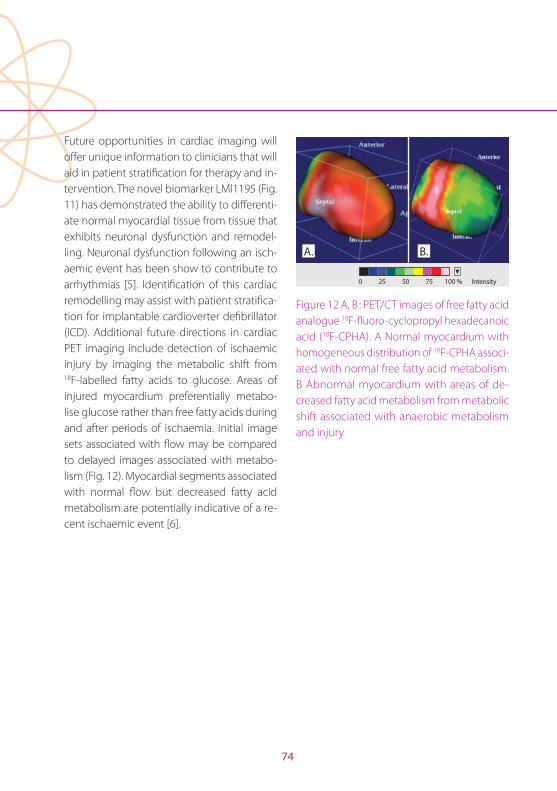
74
Future opportunities in cardiac imaging will offer unique information to clinicians that will aid in patient stratification for therapy and in-tervention. The novel biomarker LMI1195 (Fig. 11) has demonstrated the ability to differenti-ate normal myocardial tissue from tissue that exhibits neuronal dysfunction and remodel-ling. Neuronal dysfunction following an isch-aemic event has been show to contribute to arrhythmias [5]. Identification of this cardiac remodelling may assist with patient stratifica-tion for implantable cardioverter defibrillator (ICD). Additional future directions in cardiac PET imaging include detection of ischaemic injury by imaging the metabolic shift from 18F-labelled fatty acids to glucose. Areas of injured myocardium preferentially metabo-lise glucose rather than free fatty acids during and after periods of ischaemia. Initial image sets associated with flow may be compared to delayed images associated with metabo-lism (Fig. 12). Myocardial segments associated with normal flow but decreased fatty acid metabolism are potentially indicative of a re-cent ischaemic event [6].
0 25 50 75 100 %
s
A. B.
Intensity
Figure 12 A, B : PET/CT images of free fatty acid analogue 18F-fluoro-cyclopropyl hexadecanoic acid (18F-CPHA). A Normal myocardium with homogeneous distribution of 18F-CPHA associ-ated with normal free fatty acid metabolism. B Abnormal myocardium with areas of de-creased fatty acid metabolism from metabolic shift associated with anaerobic metabolism and injury
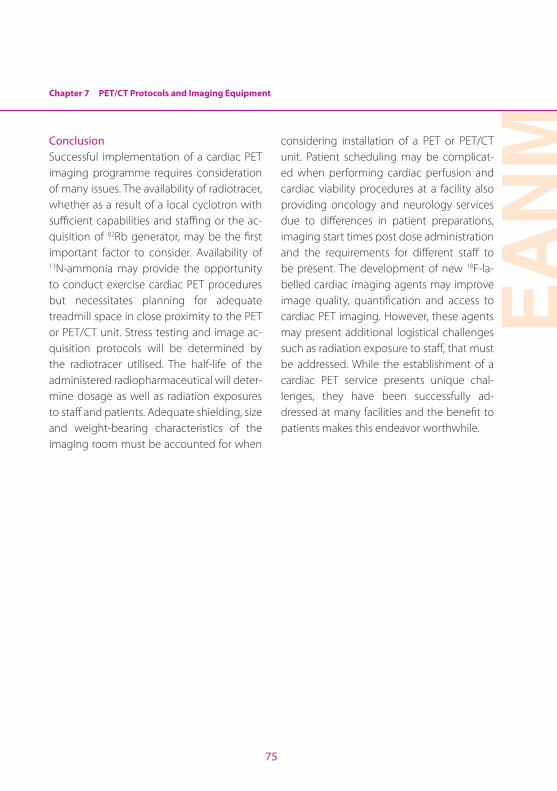
Chapter 7 PET/CT Protocols and Imaging Equipment
EAN
M
75
ConclusionSuccessful implementation of a cardiac PET imaging programme requires consideration of many issues. The availability of radiotracer, whether as a result of a local cyclotron with sufficient capabilities and staffing or the ac-quisition of 82Rb generator, may be the first important factor to consider. Availability of 13N-ammonia may provide the opportunity to conduct exercise cardiac PET procedures but necessitates planning for adequate treadmill space in close proximity to the PET or PET/CT unit. Stress testing and image ac-quisition protocols will be determined by the radiotracer utilised. The half-life of the administered radiopharmaceutical will deter-mine dosage as well as radiation exposures to staff and patients. Adequate shielding, size and weight-bearing characteristics of the imaging room must be accounted for when
considering installation of a PET or PET/CT unit. Patient scheduling may be complicat-ed when performing cardiac perfusion and cardiac viability procedures at a facility also providing oncology and neurology services due to differences in patient preparations, imaging start times post dose administration and the requirements for different staff to be present. The development of new 18F-la-belled cardiac imaging agents may improve image quality, quantification and access to cardiac PET imaging. However, these agents may present additional logistical challenges such as radiation exposure to staff, that must be addressed. While the establishment of a cardiac PET service presents unique chal-lenges, they have been successfully ad-dressed at many facilities and the benefit to patients makes this endeavor worthwhile.

76
References Chapter 7
References1. Dilsizian V, Bacharach SL, Beanlands RS, et al. PET
myocardial perfusion and metabolism clinical imag-ing. ASNC Imaging Guidelines for Nuclear Cardiology Procedures. American Society of Nuclear Cardiology J Nucl Cardiol. 2009:16.
2. CARDIOGEN-82® (Rubidium Rb82 Generator) package insert. Bracco Diagnostics, Princeton, New Jersey. 2012.
3. Yoshinaga K, Kein R, Tamaki M. Generator-produced rubidium-82 positron emission tomography myocar-dial perfusion imaging – From basic aspects to clinical applications. J Cardiol. 2010;55:163–73.
4. Heller GV, Hendel R, Mann A. Nuclear cardiology: Tech-nical applications. 2009. New York: McGraw Hill, 2009.
5. Sherif HM, Nekolla SG, Saraste A, Reder S, Yu M, Rob-inson S, Schwaiger M. Simplified quantification of myocardial blood flow reserve with Flurpiridaz F 18: Validation with microspheres in a pig model. J Nucl Med. 2011;52:617–24.
6. Gropler RJ, Beanlands RS, Dilsizian V, Lewandowski ED, Villanueva FS, Ziadi MC. Imaging myocardial metabolic remodeling. J Nucl Med. 2010; 51 Suppl 1:885–1015.
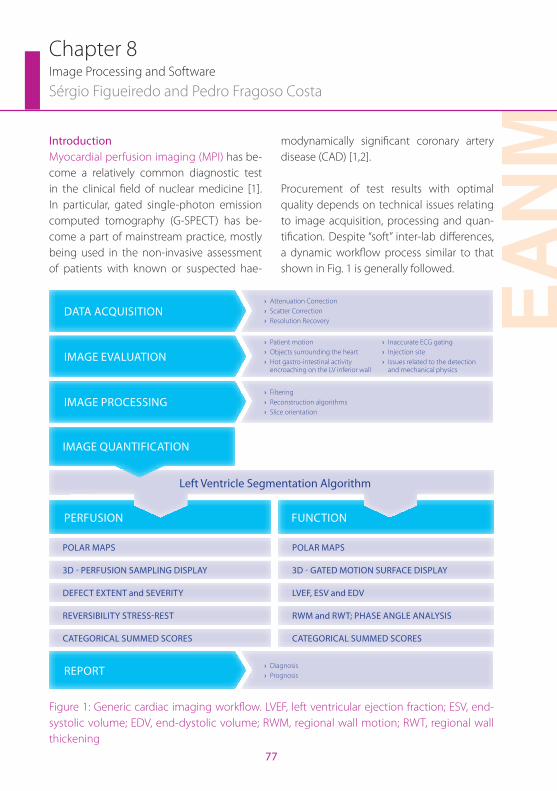
EAN
M
77
IntroductionMyocardial perfusion imaging (MPI) has be-come a relatively common diagnostic test in the clinical field of nuclear medicine [1]. In particular, gated single-photon emission computed tomography (G-SPECT) has be-come a part of mainstream practice, mostly being used in the non-invasive assessment of patients with known or suspected hae-
modynamically significant coronary artery disease (CAD) [1,2].
Procurement of test results with optimal quality depends on technical issues relating to image acquisition, processing and quan-tification. Despite “soft” inter-lab differences, a dynamic workflow process similar to that shown in Fig. 1 is generally followed.
Chapter 8Image Processing and Software
Sérgio Figueiredo and Pedro Fragoso Costa
PERFUSION
POLAR MAPS POLAR MAPS
3D - GATED MOTION SURFACE DISPLAY
LVEF, ESV and EDV
RWM and RWT; PHASE ANGLE ANALYSIS
CATEGORICAL SUMMED SCORES
3D - PERFUSION SAMPLING DISPLAY
DEFECT EXTENT and SEVERITY
REVERSIBILITY STRESS-REST
CATEGORICAL SUMMED SCORES
FUNCTION
DATA ACQUISITION › Attenuation Correction › Scatter Correction › Resolution Recovery
IMAGE EVALUATION › Patient motion › Objects surrounding the heart › Hot gastro-intestinal activity
encroaching on the LV inferior wall
› Inaccurate ECG gating › Injection site › Issues related to the detection
and mechanical physics
IMAGE PROCESSING › Filtering › Reconstruction algorithms › Slice orientation
Left Ventricle Segmentation Algorithm
IMAGE QUANTIFICATION
REPORT › Diagnosis › Prognosis
Figure 1: Generic cardiac imaging workflow. LVEF, left ventricular ejection fraction; ESV, end-systolic volume; EDV, end-dystolic volume; RWM, regional wall motion; RWT, regional wall thickening
78
After the data acquisition, with or without attenuation and scatter correction, the pla-nar projection images should be inspected immediately by the technologist in order to identify technical problems that might re-quire repetition of the acquisition. This step is referred to as “image evaluation” and parame-ters to consider may include: patient motion, inaccurate ECG gating, hot gastro-intestinal activity encroaching on the left ventricular (LV) inferior wall, injection site, objects sur-rounding the heart and issues related to de-tection and mechanical physics (Fig. 1). Only after proper evaluation of these parameters and correct validation of the acquisition is it possible to proceed to the next steps of the flowchart: image reconstruction, image quantification and report.
Image reconstructionImage reconstruction has traditionally been performed using filtered back-projec-tion (FBP), but reconstruction algorithms such as iterative methods can be applied in MPI [3]. Similarly, filtering techniques help improve image clarity by, potentially, removing noise and blur after back-projec-tion of the raw data [4]. Recently, improve-ments in hardware and software have been introduced in an attempt to meet the chal-lenges of modern healthcare MPI studies through the implementation of resolution recovery (RR) and noise suppression (NS) algorithms [5]. After reconstruction, re-orientation of stress and rest data can be displayed and images should be appropri-
ately aligned in a format that allows ready comparison of corresponding tomograms [6].
Analytical and iterative reconstruction Filtered back-projection is an analytical recon-struction method that has been widely used in clinical cardiac G-SPECT because of its sim-plicity, speed and the fact of being relatively simple to compute. However, it has gradually declined in importance compared with itera-tive methods, mainly because of its inability to model basic physical processes in emis-sion tomography, e.g. attenuation and scat-ter [7, 8].
Figure 2A illustrates the practical steps in-volved in reconstruction by FBP. In a 2D ac-quisition, each row of projections represents the sum of all counts along a straight line through the depth of the object, and all pro-jections are organised as a function of the an-gle in a sinogram. The back-projection tech-nique redistributes the number of counts uniformly at each particular point along the line from which they were originally detect-ed, for all pixels and all angles. Star artefacts and blurring of the image are the main con-sequences of this process. In order to elimi-nate these problems, the projections are fil-tered with a window filter, in the frequency domain, before being back-projected onto the image matrix, mathematically using the fast Fourier transform (FFT). The back-pro-jection takes place in the spatial domain in order to obtain the final image [4, 8].
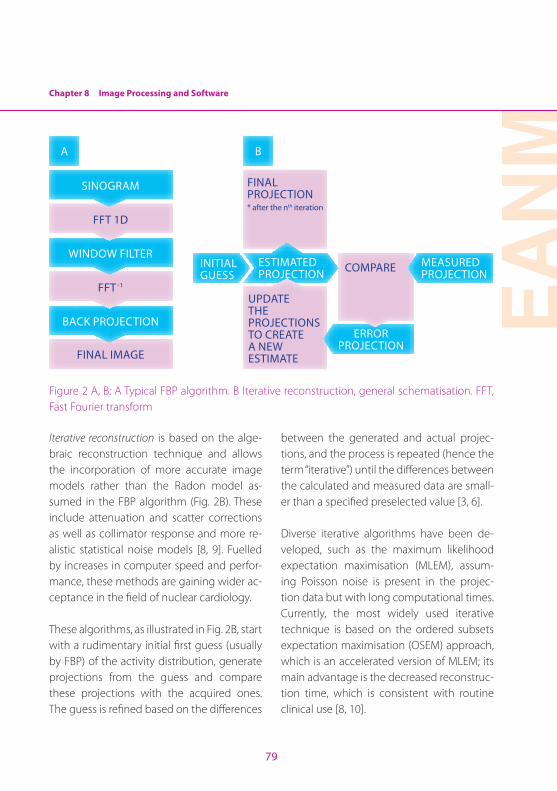
Chapter 8 Image Processing and Software
EAN
M
79
FINAL PROJECTION* after the nth iteration
FINAL IMAGE
A B
BACK PROJECTION
FFT -1
WINDOW FILTER
FFT 1D
SINOGRAM
INITIAL GUESS
ESTIMATED PROJECTION
UPDATE THE PROJECTIONS TO CREATE A NEW ESTIMATE
COMPARE
ERROR PROJECTION
MEASURED PROJECTION
Figure 2 A, B: A Typical FBP algorithm. B Iterative reconstruction, general schematisation. FFT, Fast Fourier transform
Iterative reconstruction is based on the alge-braic reconstruction technique and allows the incorporation of more accurate image models rather than the Radon model as-sumed in the FBP algorithm (Fig. 2B). These include attenuation and scatter corrections as well as collimator response and more re-alistic statistical noise models [8, 9]. Fuelled by increases in computer speed and perfor-mance, these methods are gaining wider ac-ceptance in the field of nuclear cardiology.
These algorithms, as illustrated in Fig. 2B, start with a rudimentary initial first guess (usually by FBP) of the activity distribution, generate projections from the guess and compare these projections with the acquired ones. The guess is refined based on the differences
between the generated and actual projec-tions, and the process is repeated (hence the term “iterative”) until the differences between the calculated and measured data are small-er than a specified preselected value [3, 6].
Diverse iterative algorithms have been de-veloped, such as the maximum likelihood expectation maximisation (MLEM), assum-ing Poisson noise is present in the projec-tion data but with long computational times. Currently, the most widely used iterative technique is based on the ordered subsets expectation maximisation (OSEM) approach, which is an accelerated version of MLEM; its main advantage is the decreased reconstruc-tion time, which is consistent with routine clinical use [8, 10].
80
New trends in iterative image reconstructionAlthough it is a well-established medical imaging modality, MPI suffers from some fundamental limitations, including long im-age acquisition time, low image resolution (depending on scanner/camera photon sen-sitivity, primarily controlled by the type of collimator and imaging detection geometry) and patient radiation dose [11]. Typically, to balance the binomial resolution–sensitivity (higher resolution images require lowering of image sensitivity), the scan time is about 15–20 min for each stress and rest acquisition, resulting in frequent artefacts due to patient motion [2, 11]. Additionally, the traditional dual-head cameras with standard parallel hole collimators are over 50 years old and the basic FBP algorithm is even older, dating from 90 years ago [2]. Recently, however, new imaging systems and iterative reconstruction algorithms have gone through several stages of development with the aim of increasing signal to noise ratio (SNR) and system resolu-tion, which will simultaneously allow higher photon sensitivity and improve both image quality and resolution [2, 5, 11].
For this purpose various methods have been implemented in the RR reconstruction algo-rithms. Resolution recovery integrates the de-tector’s physics into the iterative algorithm so as to compensate for the distance-dependent blurring, illustrated in Fig. 3, which is known to be the main factor affecting the resolution and noise properties of nuclear medicine images [2, 5, 12]. The modelling of this phenomenon is often called point spread function (PSF).
COLLIMATOR
DETECTOR
POINT SOURCE
SHARP IMAGE
POINT SOURCE
BLURRED IMAGE
Figure 3: Point spread function and the subse-quent distance-dependent blurring
Knowledge of the distance from the patient to the elliptical path of the detector and the collimator detector response (CDR) permits inclusion of correct compensation for the blurring effect in the iterative reconstruction process [5]. During the course of image re-construction, specific information needs to be incorporated in respect of the CDR, i.e. collimator design parameters (hole length and diameter, septa thickness), detector characteristics (intrinsic resolution, crystal thickness, collimator–detector gap) and ac-quisition parameters (centre of rotation to collimator face distances for every projection collected and geometric orbit of radius ac-quisition) [5, 12].
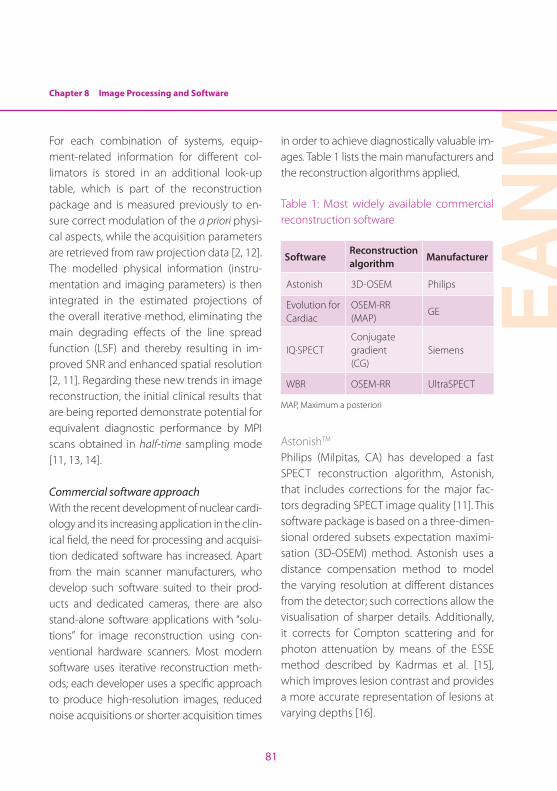
Chapter 8 Image Processing and Software
EAN
M
81
For each combination of systems, equip-ment-related information for different col-limators is stored in an additional look-up table, which is part of the reconstruction package and is measured previously to en-sure correct modulation of the a priori physi-cal aspects, while the acquisition parameters are retrieved from raw projection data [2, 12]. The modelled physical information (instru-mentation and imaging parameters) is then integrated in the estimated projections of the overall iterative method, eliminating the main degrading effects of the line spread function (LSF) and thereby resulting in im-proved SNR and enhanced spatial resolution [2, 11]. Regarding these new trends in image reconstruction, the initial clinical results that are being reported demonstrate potential for equivalent diagnostic performance by MPI scans obtained in half-time sampling mode [11, 13, 14].
Commercial software approachWith the recent development of nuclear cardi-ology and its increasing application in the clin-ical field, the need for processing and acquisi-tion dedicated software has increased. Apart from the main scanner manufacturers, who develop such software suited to their prod-ucts and dedicated cameras, there are also stand-alone software applications with “solu-tions” for image reconstruction using con-ventional hardware scanners. Most modern software uses iterative reconstruction meth-ods; each developer uses a specific approach to produce high-resolution images, reduced noise acquisitions or shorter acquisition times
in order to achieve diagnostically valuable im-ages. Table 1 lists the main manufacturers and the reconstruction algorithms applied.
Table 1: Most widely available commercial reconstruction software
SoftwareReconstruction algorithm
Manufacturer
Astonish 3D-OSEM Philips
Evolution for Cardiac
OSEM-RR (MAP)
GE
IQ·SPECTConjugate gradient (CG)
Siemens
WBR OSEM-RR UltraSPECT
MAP, Maximum a posteriori
AstonishTM
Philips (Milpitas, CA) has developed a fast SPECT reconstruction algorithm, Astonish, that includes corrections for the major fac-tors degrading SPECT image quality [11]. This software package is based on a three-dimen-sional ordered subsets expectation maximi-sation (3D-OSEM) method. Astonish uses a distance compensation method to model the varying resolution at different distances from the detector; such corrections allow the visualisation of sharper details. Additionally, it corrects for Compton scattering and for photon attenuation by means of the ESSE method described by Kadrmas et al. [15], which improves lesion contrast and provides a more accurate representation of lesions at varying depths [16].
82
Noise suppression – one problem that all it-erative methods must address is amplifica-tion of statistical noise – is attained through a matched filtering. This process consists of filtering before reconstruction and using an identical filter to forward project the informa-tion. This avoids the dissipation of features that could have been “smoothed away” and the in-creased iteration-associated noise [11, 16].
EvolutionTM for CardiacGE Healthcare (Waukesha, WI) has also developed a modification of the OSEM al-gorithm that incorporates RR named “Evo-lution for Cardiac” [11]. Focussed on CDR modeling, the Evolution approach is able to achieve resolution recovery by integration of the collimator and detector response in an iterative reconstruction algorithm [13]. The CDR compensation technique is ac-complished by convolving the projected photon ray with the corresponding LSF dur-ing iterative projection and back-projection. The following compensation parameters are taken into account: collimator hole length and septa thickness, intrinsic resolution, crystal thickness and collimator–detector gap. Acquisition parameters, including the distance from the centre of rotation to the collimator for every acquired projection, ob-tained from the raw data, also contribute for modulation [11, 12].
Noise suppression is achieved with a maxi-mum a posteriori (MAP) algorithm. This algo-rithm is a modification of the EM. It operates in order to maximise the similarity between estimated and measured projections and to ensure that reconstructed images are not too noisy [5].
IQ·SPECTTM
This software package works in synergy with a dedicated collimator (SMARTZOOM), the design of which enables a cardio-centric orbit at a fixed radius of 28 cm. While most software designs are based in the EM opti-misation method, IQ·SPECT uses a precondi-tioned conjugate gradient (CG) [17]. This al-gorithm is based on the minimisation of the Poisson noise function. In the CG method the aim is not to maximise the likelihood that the objective function is an answer to the system but to minimise the objective function; for this purpose, steps conjugate to one another are taken in the direction in which the objec-tive function decreases more quickly [7].
Similarly to EM, an increase in iterations with the CG results in noise accumulation on the produced images, and to diminish the extent of this the CG is preconditioned with a nearly complete description of the imaging system, from emission to collimator acceptance: scat-ter and attenuation correction are included, a vector map of the collimator angles in included
Chapter 8 Image Processing and Software
EAN
M
83
in the matrix, PSF is modulated based on the radius of rotation and a post filter is applied to the final reconstructed images [17, 18].
WBRTM
UltraSPECT Limited (Haifa, Israel) has devel-oped a stand-alone workstation (Xpress.car-diac) that utilises the patented Wide Beam Reconstruction (WBR) algorithm [11]. The WBR technique is an OSEM-based algorithm that models the physics and geometry of the ac-quisition for resolution recovery [19] in a similar fashion to the previously described methods. Using a segmentation algorithm, the distance from the detector to the body can be extrapo-lated and integrated in the CDR model. Noise suppression is achieved using a likelihood function with a combination of the Poisson (high frequency recovery) and Gaussian (high frequency suppression) distributions, accom-plished by Fourier analysis of a projection to determine the approximate SNR, thus avoid-ing post-reconstruction filtering (the standard approach to overcome noise) [11, 19, 20].
WBR utilises a stand-alone running hardware platform and can reconstruct data acquired from most scanners with standard collimator design [20].
Importance of reconstruction filters Once a Fourier spectrum has been gener-ated for an image, it can be filtered so that certain spatial frequencies can be modified, enhanced or suppressed. The filtered spec-trum can then be inverse transformed, using a mathematical operator (inverse Fourier trans-form), to generate a filtered image with, for example, sharpened or smoothed features [8].
These operations are commonly applied in order to obtain good quality images, and specifically to maximise the SNR, which describes the relative strength of the sig-nal component compared with noise. The SNR is much higher at low spatial frequen-cies (broad features that are constant over many pixels, such as large uniform objects) and decreases at higher spatial frequen-cies (features that change over a few pix-els, such as edges) [1, 3]. Window filters are such tools; those most frequently used in nuclear cardiology are passive filters, of which low-pass and high-pass are repre-sentative examples [4].
In order to achieve an optimal compromise between the extent of noise reduction and suppression of fine detail, the typical star ar-tefact from FBP can be reduced by applying
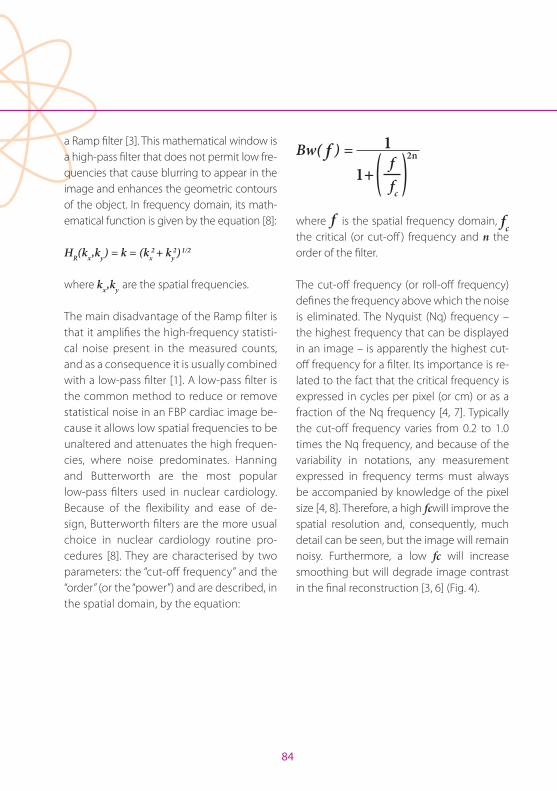
84
a Ramp filter [3]. This mathematical window is a high-pass filter that does not permit low fre-quencies that cause blurring to appear in the image and enhances the geometric contours of the object. In frequency domain, its math-ematical function is given by the equation [8]:
HR(kx,ky) = k = (kx2 + ky
2) 1/2
where kx,ky are the spatial frequencies.
The main disadvantage of the Ramp filter is that it amplifies the high-frequency statisti-cal noise present in the measured counts, and as a consequence it is usually combined with a low-pass filter [1]. A low-pass filter is the common method to reduce or remove statistical noise in an FBP cardiac image be-cause it allows low spatial frequencies to be unaltered and attenuates the high frequen-cies, where noise predominates. Hanning and Butterworth are the most popular low-pass filters used in nuclear cardiology. Because of the flexibility and ease of de-sign, Butterworth filters are the more usual choice in nuclear cardiology routine pro-cedures [8]. They are characterised by two parameters: the “cut-off frequency” and the “order” (or the “power”) and are described, in the spatial domain, by the equation:
Bw( f ) = 1
1+( ) 2nffc
where f is the spatial frequency domain, fc the critical (or cut-off ) frequency and n the order of the filter.
The cut-off frequency (or roll-off frequency) defines the frequency above which the noise is eliminated. The Nyquist (Nq) frequency – the highest frequency that can be displayed in an image – is apparently the highest cut-off frequency for a filter. Its importance is re-lated to the fact that the critical frequency is expressed in cycles per pixel (or cm) or as a fraction of the Nq frequency [4, 7]. Typically the cut-off frequency varies from 0.2 to 1.0 times the Nq frequency, and because of the variability in notations, any measurement expressed in frequency terms must always be accompanied by knowledge of the pixel size [4, 8]. Therefore, a high fcwill improve the spatial resolution and, consequently, much detail can be seen, but the image will remain noisy. Furthermore, a low fc will increase smoothing but will degrade image contrast in the final reconstruction [3, 6] (Fig. 4).
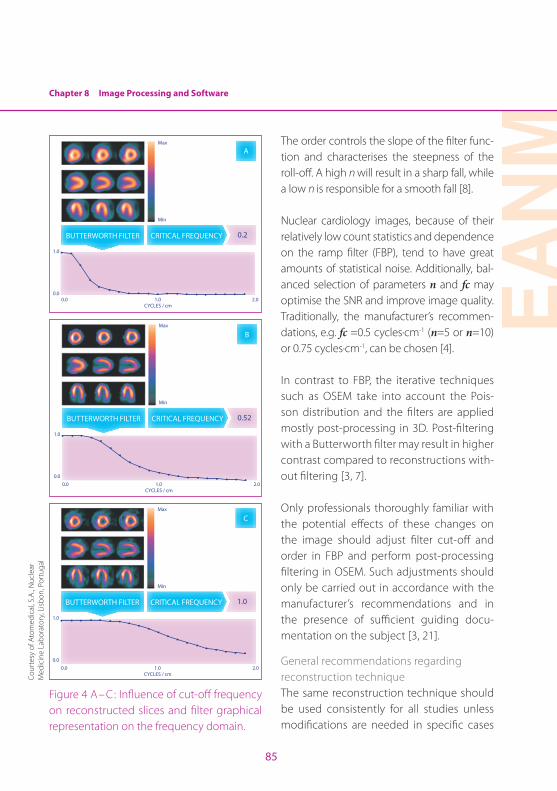
Chapter 8 Image Processing and Software
EAN
M
85
BUTTERWORTH FILTER CRITICAL FREQUENCY 0.2
1.0
0.0
Max
Min
0.0 1.0CYCLES / cm
2.0
A
BUTTERWORTH FILTER CRITICAL FREQUENCY 0.52
1.0
0.0
Max
Min
0.0 1.0CYCLES / cm
2.0
B
BUTTERWORTH FILTER CRITICAL FREQUENCY 1.0
1.0
0.0
Max
Min
0.0 1.0CYCLES / cm
2.0
C
Figure 4 A– C: Influence of cut-off frequency on reconstructed slices and filter graphical representation on the frequency domain.
The order controls the slope of the filter func-tion and characterises the steepness of the roll-off. A high n will result in a sharp fall, while a low n is responsible for a smooth fall [8].
Nuclear cardiology images, because of their relatively low count statistics and dependence on the ramp filter (FBP), tend to have great amounts of statistical noise. Additionally, bal-anced selection of parameters n and fc may optimise the SNR and improve image quality. Traditionally, the manufacturer’s recommen-dations, e.g. fc =0.5 cycles·cm-1 (n=5 or n=10) or 0.75 cycles·cm-1, can be chosen [4].
In contrast to FBP, the iterative techniques such as OSEM take into account the Pois-son distribution and the filters are applied mostly post-processing in 3D. Post-filtering with a Butterworth filter may result in higher contrast compared to reconstructions with-out filtering [3, 7].
Only professionals thoroughly familiar with the potential effects of these changes on the image should adjust filter cut-off and order in FBP and perform post-processing filtering in OSEM. Such adjustments should only be carried out in accordance with the manufacturer’s recommendations and in the presence of sufficient guiding docu-mentation on the subject [3, 21].
General recommendations regarding reconstruction techniqueThe same reconstruction technique should be used consistently for all studies unless modifications are needed in specific cases
Cour
tesy
of A
tom
edic
al, S
.A., N
ucle
ar
Med
icin
e La
bora
tory
, Lisb
on, P
ortu
gal
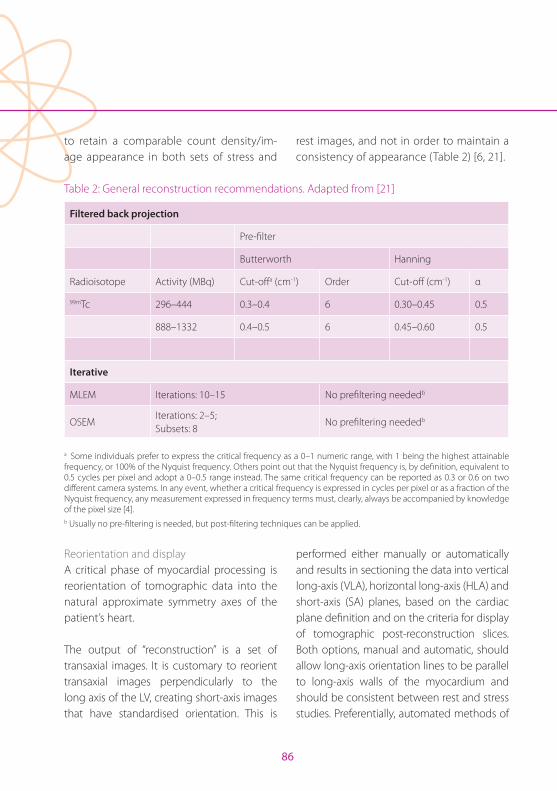
86
to retain a comparable count density/im-age appearance in both sets of stress and
rest images, and not in order to maintain a consistency of appearance (Table 2) [6, 21].
Table 2: General reconstruction recommendations. Adapted from [21]
Filtered back projection
Pre-filter
Butterworth Hanning
Radioisotope Activity (MBq) Cut-offa (cm-1) Order Cut-off (cm-1) α
99mTc 296–444 0.3–0.4 6 0.30–0.45 0.5
888–1332 0.4–0.5 6 0.45–0.60 0.5
Iterative
MLEM Iterations: 10–15 No prefiltering neededb
OSEMIterations: 2–5; Subsets: 8
No prefiltering neededb
a Some individuals prefer to express the critical frequency as a 0–1 numeric range, with 1 being the highest attainable frequency, or 100% of the Nyquist frequency. Others point out that the Nyquist frequency is, by definition, equivalent to 0.5 cycles per pixel and adopt a 0–0.5 range instead. The same critical frequency can be reported as 0.3 or 0.6 on two different camera systems. In any event, whether a critical frequency is expressed in cycles per pixel or as a fraction of the Nyquist frequency, any measurement expressed in frequency terms must, clearly, always be accompanied by knowledge of the pixel size [4].b Usually no pre-filtering is needed, but post-filtering techniques can be applied.
Reorientation and displayA critical phase of myocardial processing is reorientation of tomographic data into the natural approximate symmetry axes of the patient’s heart.
The output of “reconstruction” is a set of transaxial images. It is customary to reorient transaxial images perpendicularly to the long axis of the LV, creating short-axis images that have standardised orientation. This is
performed either manually or automatically and results in sectioning the data into vertical long-axis (VLA), horizontal long-axis (HLA) and short-axis (SA) planes, based on the cardiac plane definition and on the criteria for display of tomographic post-reconstruction slices. Both options, manual and automatic, should allow long-axis orientation lines to be parallel to long-axis walls of the myocardium and should be consistent between rest and stress studies. Preferentially, automated methods of
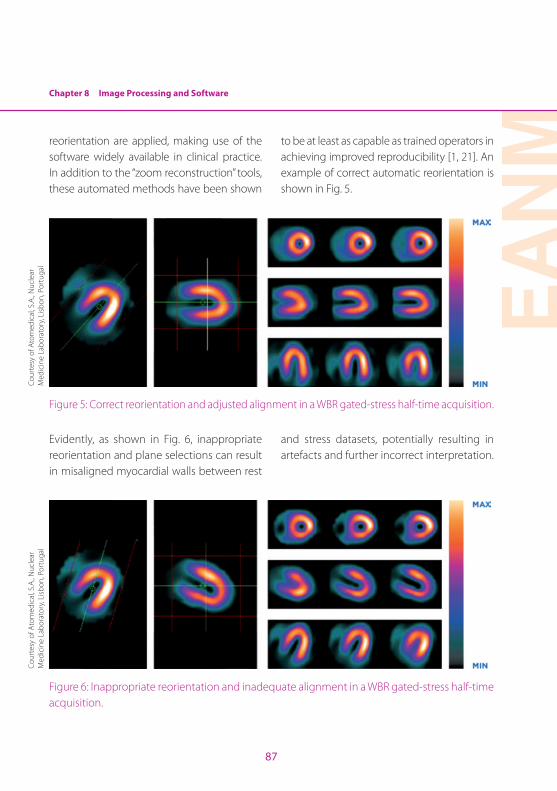
Chapter 8 Image Processing and Software
EAN
M
87
reorientation are applied, making use of the software widely available in clinical practice. In addition to the “zoom reconstruction” tools, these automated methods have been shown
to be at least as capable as trained operators in achieving improved reproducibility [1, 21]. An example of correct automatic reorientation is shown in Fig. 5.
Figure 5: Correct reorientation and adjusted alignment in a WBR gated-stress half-time acquisition.
Evidently, as shown in Fig. 6, inappropriate reorientation and plane selections can result in misaligned myocardial walls between rest
and stress datasets, potentially resulting in artefacts and further incorrect interpretation.
Figure 6: Inappropriate reorientation and inadequate alignment in a WBR gated-stress half-time acquisition.
Cour
tesy
of A
tom
edic
al, S
.A., N
ucle
ar
Med
icin
e La
bora
tory
, Lisb
on, P
ortu
gal
Cour
tesy
of A
tom
edic
al, S
.A., N
ucle
ar
Med
icin
e La
bora
tory
, Lisb
on, P
ortu
gal
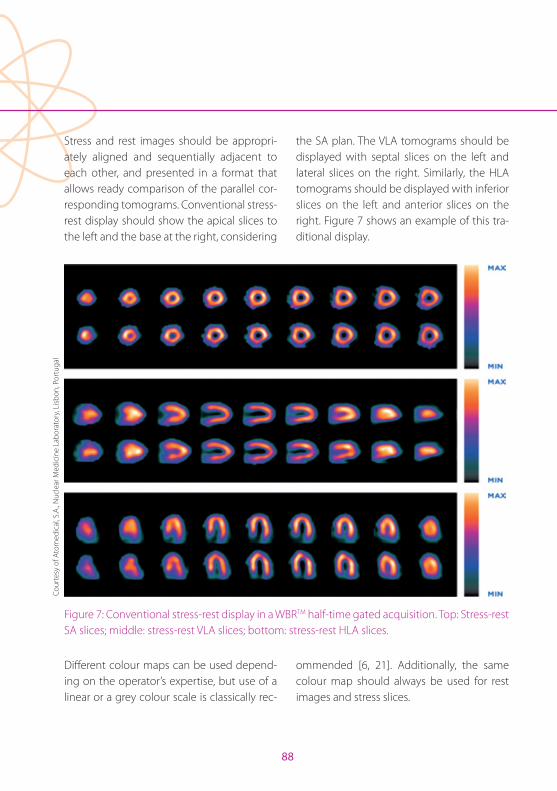
88
Stress and rest images should be appropri-ately aligned and sequentially adjacent to each other, and presented in a format that allows ready comparison of the parallel cor-responding tomograms. Conventional stress-rest display should show the apical slices to the left and the base at the right, considering
the SA plan. The VLA tomograms should be displayed with septal slices on the left and lateral slices on the right. Similarly, the HLA tomograms should be displayed with inferior slices on the left and anterior slices on the right. Figure 7 shows an example of this tra-ditional display.
Figure 7: Conventional stress-rest display in a WBRTM half-time gated acquisition. Top: Stress-rest SA slices; middle: stress-rest VLA slices; bottom: stress-rest HLA slices.
Different colour maps can be used depend-ing on the operator’s expertise, but use of a linear or a grey colour scale is classically rec-
ommended [6, 21]. Additionally, the same colour map should always be used for rest images and stress slices.
Cour
tesy
of A
tom
edic
al, S
.A., N
ucle
ar M
edic
ine
Labo
rato
ry, L
isbon
, Por
tuga
l
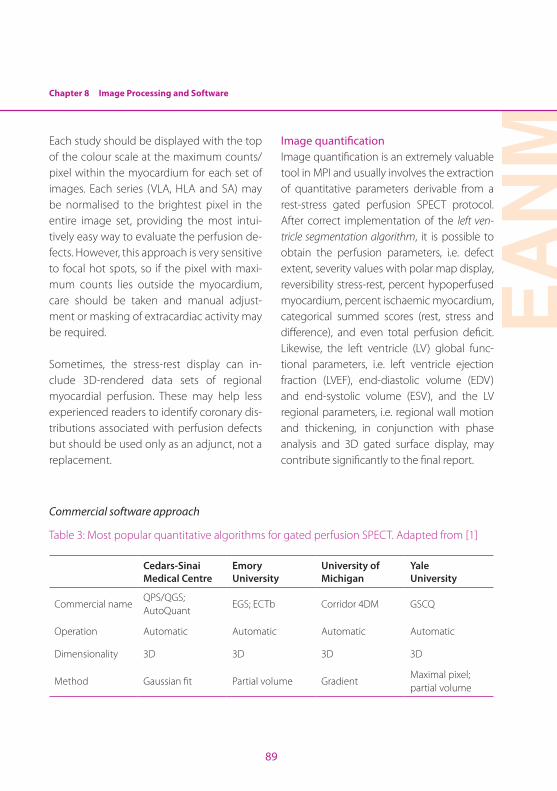
Chapter 8 Image Processing and Software
EAN
M
89
Each study should be displayed with the top of the colour scale at the maximum counts/pixel within the myocardium for each set of images. Each series (VLA, HLA and SA) may be normalised to the brightest pixel in the entire image set, providing the most intui-tively easy way to evaluate the perfusion de-fects. However, this approach is very sensitive to focal hot spots, so if the pixel with maxi-mum counts lies outside the myocardium, care should be taken and manual adjust-ment or masking of extracardiac activity may be required.
Sometimes, the stress-rest display can in-clude 3D-rendered data sets of regional myocardial perfusion. These may help less experienced readers to identify coronary dis-tributions associated with perfusion defects but should be used only as an adjunct, not a replacement.
Image quantificationImage quantification is an extremely valuable tool in MPI and usually involves the extraction of quantitative parameters derivable from a rest-stress gated perfusion SPECT protocol. After correct implementation of the left ven-tricle segmentation algorithm, it is possible to obtain the perfusion parameters, i.e. defect extent, severity values with polar map display, reversibility stress-rest, percent hypoperfused myocardium, percent ischaemic myocardium, categorical summed scores (rest, stress and difference), and even total perfusion deficit. Likewise, the left ventricle (LV) global func-tional parameters, i.e. left ventricle ejection fraction (LVEF), end-diastolic volume (EDV) and end-systolic volume (ESV), and the LV regional parameters, i.e. regional wall motion and thickening, in conjunction with phase analysis and 3D gated surface display, may contribute significantly to the final report.
Commercial software approach
Table 3: Most popular quantitative algorithms for gated perfusion SPECT. Adapted from [1]
Cedars-Sinai Medical Centre
Emory University
University of Michigan
Yale University
Commercial nameQPS/QGS; AutoQuant
EGS; ECTb Corridor 4DM GSCQ
Operation Automatic Automatic Automatic Automatic
Dimensionality 3D 3D 3D 3D
Method Gaussian fit Partial volume GradientMaximal pixel; partial volume
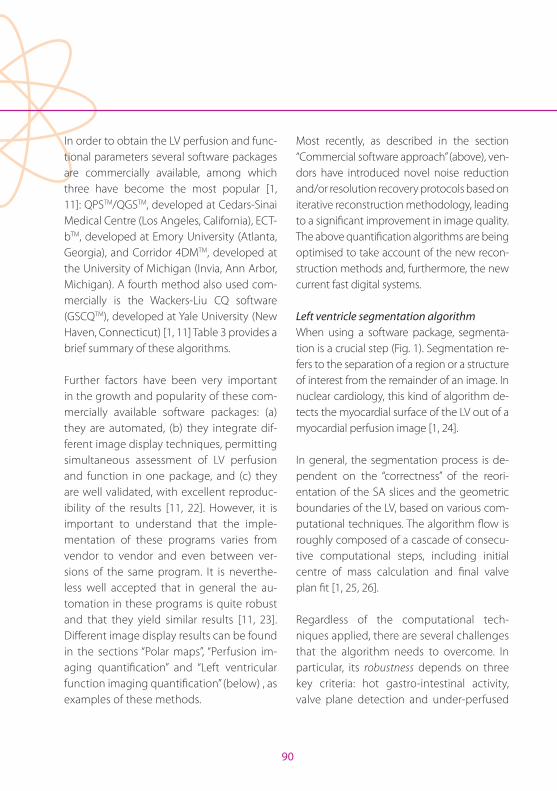
90
In order to obtain the LV perfusion and func-tional parameters several software packages are commercially available, among which three have become the most popular [1, 11]: QPSTM/QGSTM, developed at Cedars-Sinai Medical Centre (Los Angeles, California), ECT-bTM, developed at Emory University (Atlanta, Georgia), and Corridor 4DMTM, developed at the University of Michigan (Invia, Ann Arbor, Michigan). A fourth method also used com-mercially is the Wackers-Liu CQ software (GSCQTM), developed at Yale University (New Haven, Connecticut) [1, 11] Table 3 provides a brief summary of these algorithms.
Further factors have been very important in the growth and popularity of these com-mercially available software packages: (a) they are automated, (b) they integrate dif-ferent image display techniques, permitting simultaneous assessment of LV perfusion and function in one package, and (c) they are well validated, with excellent reproduc-ibility of the results [11, 22]. However, it is important to understand that the imple-mentation of these programs varies from vendor to vendor and even between ver-sions of the same program. It is neverthe-less well accepted that in general the au-tomation in these programs is quite robust and that they yield similar results [11, 23]. Different image display results can be found in the sections “Polar maps”, “Perfusion im-aging quantification” and “Left ventricular function imaging quantification” (below) , as examples of these methods.
Most recently, as described in the section “Commercial software approach” (above), ven-dors have introduced novel noise reduction and/or resolution recovery protocols based on iterative reconstruction methodology, leading to a significant improvement in image quality. The above quantification algorithms are being optimised to take account of the new recon-struction methods and, furthermore, the new current fast digital systems.
Left ventricle segmentation algorithmWhen using a software package, segmenta-tion is a crucial step (Fig. 1). Segmentation re-fers to the separation of a region or a structure of interest from the remainder of an image. In nuclear cardiology, this kind of algorithm de-tects the myocardial surface of the LV out of a myocardial perfusion image [1, 24].
In general, the segmentation process is de-pendent on the “correctness” of the reori-entation of the SA slices and the geometric boundaries of the LV, based on various com-putational techniques. The algorithm flow is roughly composed of a cascade of consecu-tive computational steps, including initial centre of mass calculation and final valve plan fit [1, 25, 26].
Regardless of the computational tech-niques applied, there are several challenges that the algorithm needs to overcome. In particular, its robustness depends on three key criteria: hot gastro-intestinal activity, valve plane detection and under-perfused
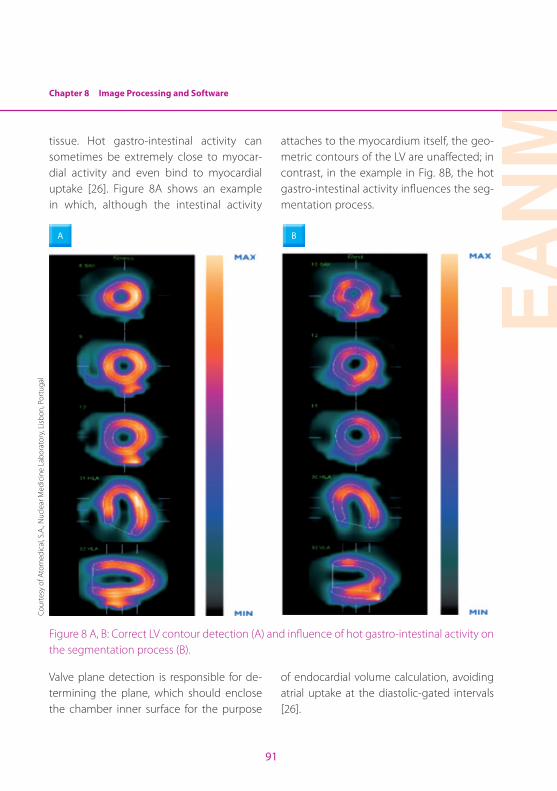
Chapter 8 Image Processing and Software
EAN
M
91
tissue. Hot gastro-intestinal activity can sometimes be extremely close to myocar-dial activity and even bind to myocardial uptake [26]. Figure 8A shows an example in which, although the intestinal activity
attaches to the myocardium itself, the geo-metric contours of the LV are unaffected; in contrast, in the example in Fig. 8B, the hot gastro-intestinal activity influences the seg-mentation process.
A B
Figure 8 A, B: Correct LV contour detection (A) and influence of hot gastro-intestinal activity on the segmentation process (B).
Valve plane detection is responsible for de-termining the plane, which should enclose the chamber inner surface for the purpose
of endocardial volume calculation, avoiding atrial uptake at the diastolic-gated intervals [26].
Cour
tesy
of A
tom
edic
al, S
.A., N
ucle
ar M
edic
ine
Labo
rato
ry, L
isbon
, Por
tuga
l
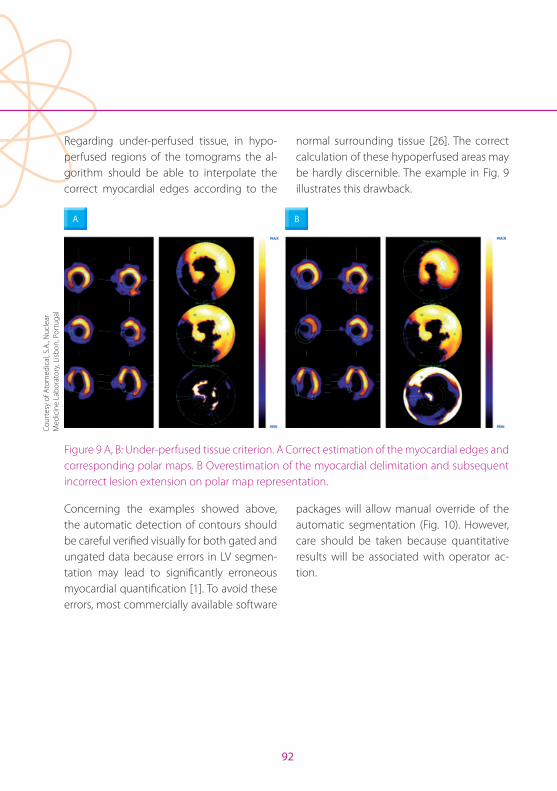
92
Regarding under-perfused tissue, in hypo-perfused regions of the tomograms the al-gorithm should be able to interpolate the correct myocardial edges according to the
normal surrounding tissue [26]. The correct calculation of these hypoperfused areas may be hardly discernible. The example in Fig. 9 illustrates this drawback.
BA
Figure 9 A, B: Under-perfused tissue criterion. A Correct estimation of the myocardial edges and corresponding polar maps. B Overestimation of the myocardial delimitation and subsequent incorrect lesion extension on polar map representation.
Concerning the examples showed above, the automatic detection of contours should be careful verified visually for both gated and ungated data because errors in LV segmen-tation may lead to significantly erroneous myocardial quantification [1]. To avoid these errors, most commercially available software
packages will allow manual override of the automatic segmentation (Fig. 10). However, care should be taken because quantitative results will be associated with operator ac-tion.
Cour
tesy
of A
tom
edic
al, S
.A., N
ucle
ar
Med
icin
e La
bora
tory
, Lisb
on, P
ortu
gal
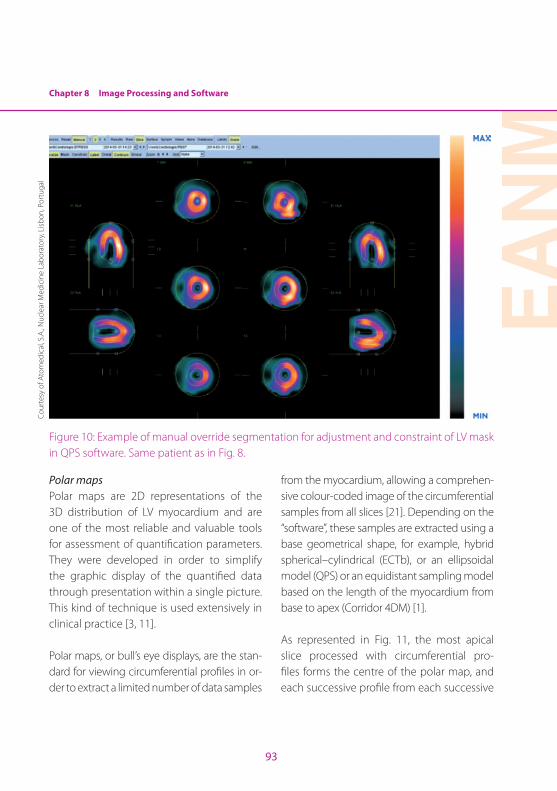
Chapter 8 Image Processing and Software
EAN
M
93
Figure 10: Example of manual override segmentation for adjustment and constraint of LV mask in QPS software. Same patient as in Fig. 8.
Polar mapsPolar maps are 2D representations of the 3D distribution of LV myocardium and are one of the most reliable and valuable tools for assessment of quantification parameters. They were developed in order to simplify the graphic display of the quantified data through presentation within a single picture. This kind of technique is used extensively in clinical practice [3, 11].
Polar maps, or bull’s eye displays, are the stan-dard for viewing circumferential profiles in or-der to extract a limited number of data samples
from the myocardium, allowing a comprehen-sive colour-coded image of the circumferential samples from all slices [21]. Depending on the “software”, these samples are extracted using a base geometrical shape, for example, hybrid spherical–cylindrical (ECTb), or an ellipsoidal model (QPS) or an equidistant sampling model based on the length of the myocardium from base to apex (Corridor 4DM) [1].
As represented in Fig. 11, the most apical slice processed with circumferential pro-files forms the centre of the polar map, and each successive profile from each successive
Cour
tesy
of A
tom
edic
al, S
.A., N
ucle
ar M
edic
ine
Labo
rato
ry, L
isbon
, Por
tuga
l
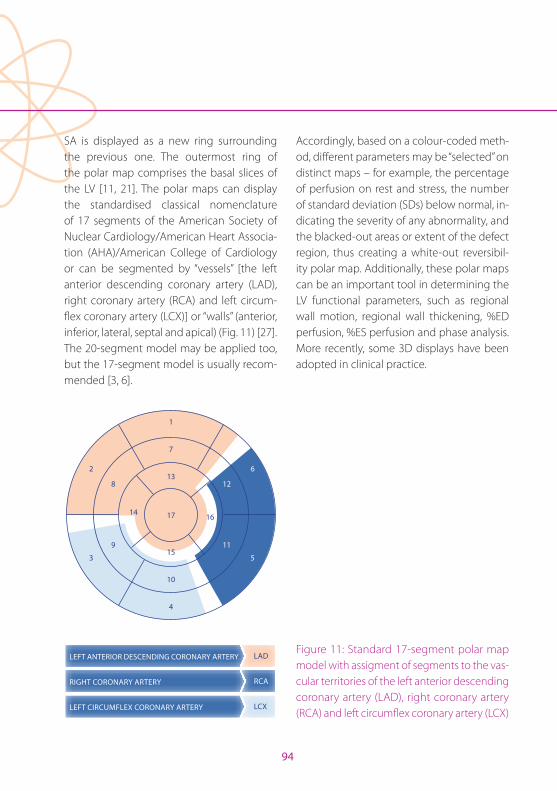
94
SA is displayed as a new ring surrounding the previous one. The outermost ring of the polar map comprises the basal slices of the LV [11, 21]. The polar maps can display the standardised classical nomenclature of 17 segments of the American Society of Nuclear Cardiology/American Heart Associa-tion (AHA)/American College of Cardiology or can be segmented by “vessels” [the left anterior descending coronary artery (LAD), right coronary artery (RCA) and left circum-flex coronary artery (LCX)] or “walls” (anterior, inferior, lateral, septal and apical) (Fig. 11) [27]. The 20-segment model may be applied too, but the 17-segment model is usually recom-mended [3, 6].
LEFT CIRCUMFLEX CORONARY ARTERY
RIGHT CORONARY ARTERY
LEFT ANTERIOR DESCENDING CORONARY ARTERY
LCX
RCA
LAD
1
7
13
17
15
10
4
2
8
9
3
1416
12
11
5
6
Accordingly, based on a colour-coded meth-od, different parameters may be “selected” on distinct maps – for example, the percentage of perfusion on rest and stress, the number of standard deviation (SDs) below normal, in-dicating the severity of any abnormality, and the blacked-out areas or extent of the defect region, thus creating a white-out reversibil-ity polar map. Additionally, these polar maps can be an important tool in determining the LV functional parameters, such as regional wall motion, regional wall thickening, %ED perfusion, %ES perfusion and phase analysis. More recently, some 3D displays have been adopted in clinical practice.
Figure 11: Standard 17-segment polar map model with assigment of segments to the vas-cular territories of the left anterior descending coronary artery (LAD), right coronary artery (RCA) and left circumflex coronary artery (LCX)
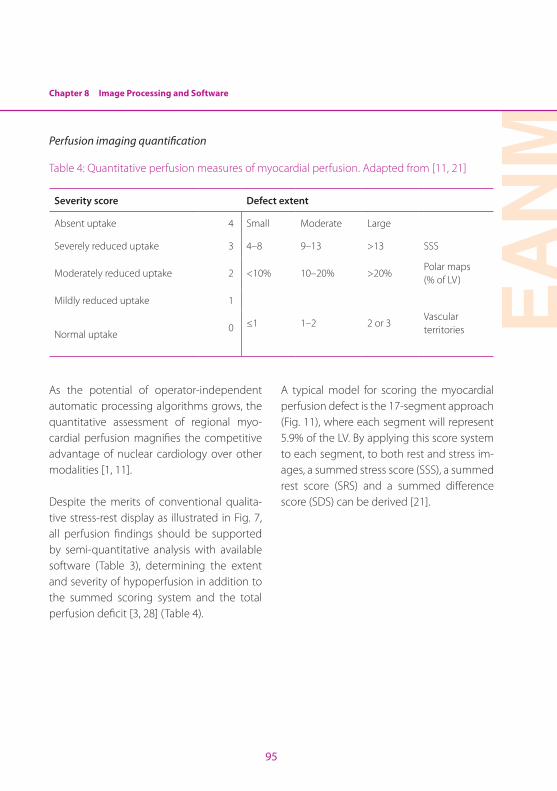
Chapter 8 Image Processing and Software
EAN
M
95
Perfusion imaging quantification
Table 4: Quantitative perfusion measures of myocardial perfusion. Adapted from [11, 21]
Severity score Defect extent
Absent uptake 4 Small Moderate Large
Severely reduced uptake 3 4–8 9–13 >13 SSS
Moderately reduced uptake 2 <10% 10–20% >20%Polar maps(% of LV)
Mildly reduced uptake 1
≤1 1–2 2 or 3Vascular territoriesNormal uptake
0
As the potential of operator-independent automatic processing algorithms grows, the quantitative assessment of regional myo-cardial perfusion magnifies the competitive advantage of nuclear cardiology over other modalities [1, 11].
Despite the merits of conventional qualita-tive stress-rest display as illustrated in Fig. 7, all perfusion findings should be supported by semi-quantitative analysis with available software (Table 3), determining the extent and severity of hypoperfusion in addition to the summed scoring system and the total perfusion deficit [3, 28] (Table 4).
A typical model for scoring the myocardial perfusion defect is the 17-segment approach (Fig. 11), where each segment will represent 5.9% of the LV. By applying this score system to each segment, to both rest and stress im-ages, a summed stress score (SSS), a summed rest score (SRS) and a summed difference score (SDS) can be derived [21].
96
The SSS represents the perfusion defect seen at stress (it equals the sum of the stress scores of all segments). The SRS is considered equal to the magnitude of a fixed defect (it equals the sum of the rest scores of all segments) and hence represents – in most cases – the size and severity of a myocardial infarction (although in some cases it may also repre-sent hibernating myocardium with viability). Finally, the SDS is the difference between the SSS and the SRS and expresses the magni-tude of ischaemia (reversibility), the most im-
portant parameter in terms of prognosis [21]. These semiquantitative scores have been shown to provide important prognostic in-formation. The maximal abnormal score is 68.
For the calculation of the summed scores, the basic quantitative software approaches (shown in Table 3) are similar: regional ra-diotracer uptake is quantitatively compared with normal databases [1, 11] and can be ex-pressed by:
SummedScores = (SeverityScoreEachDefect) x (TotalSegmentsWithDefect)
These normal databases are usually gener-ated from patients with a low likelihood of CAD, i.e. usually less than 5% probability [11]. Consequently the automatic assignment score results should be carefully interpreted by experienced and authorised professionals.
It is also possible to combine defect severity and extent through calculation of the total perfusion deficit, using QPS software. This parameter reflects the extent and severity of the overall perfusion defect and can be an important tool for MPI quantification, having a strong correlation with a variety of widely used SSS displays [26].
Each of the programs is based on slightly different models that are used to generate the quantitative profiles, where the main difference is largely in the display data [11]. Examples of application of three commer-cial programs for quantification in the same patient are shown in Figs. 12–14. However, interpretation of summed scores should be consistent with the visual analysis of the im-ages, since there are several possible pitfalls in the score calculation [21, 29].
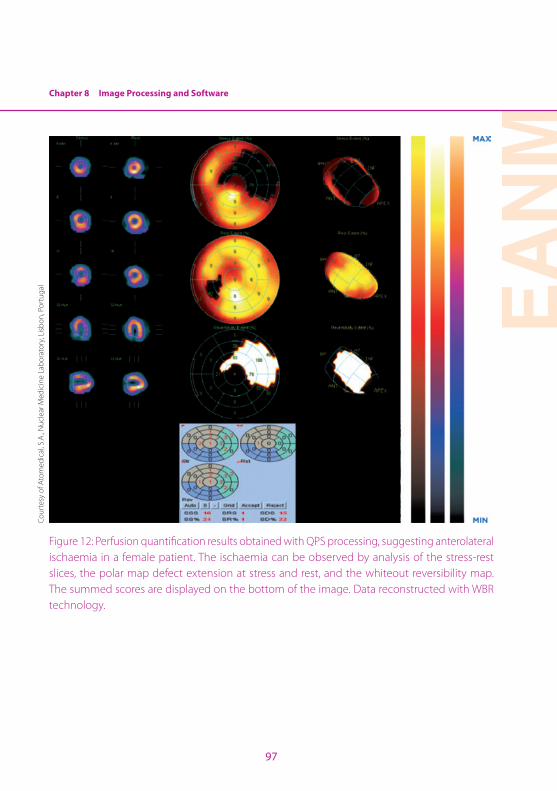
Chapter 8 Image Processing and Software
EAN
M
97
Figure 12: Perfusion quantification results obtained with QPS processing, suggesting anterolateral ischaemia in a female patient. The ischaemia can be observed by analysis of the stress-rest slices, the polar map defect extension at stress and rest, and the whiteout reversibility map. The summed scores are displayed on the bottom of the image. Data reconstructed with WBR technology.
Cour
tesy
of A
tom
edic
al, S
.A., N
ucle
ar M
edic
ine
Labo
rato
ry, L
isbon
, Por
tuga
l
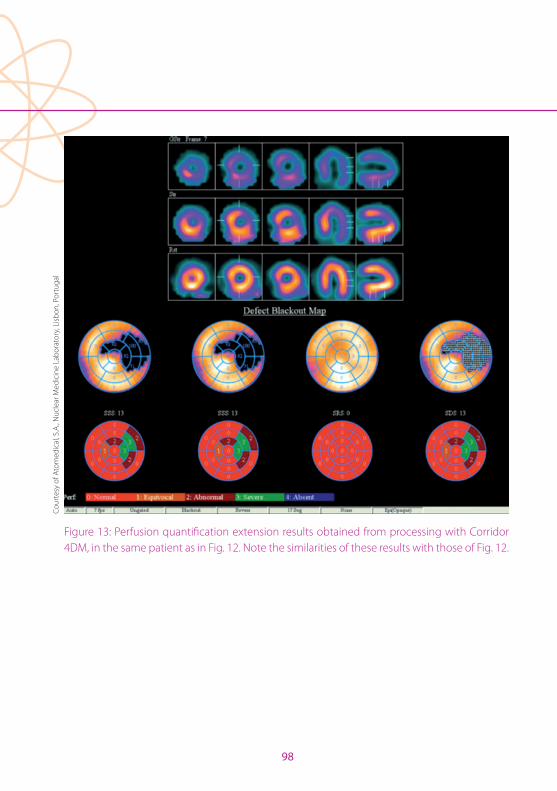
98
Figure 13: Perfusion quantification extension results obtained from processing with Corridor 4DM, in the same patient as in Fig. 12. Note the similarities of these results with those of Fig. 12.
Cour
tesy
of A
tom
edic
al, S
.A., N
ucle
ar M
edic
ine
Labo
rato
ry, L
isbon
, Por
tuga
l
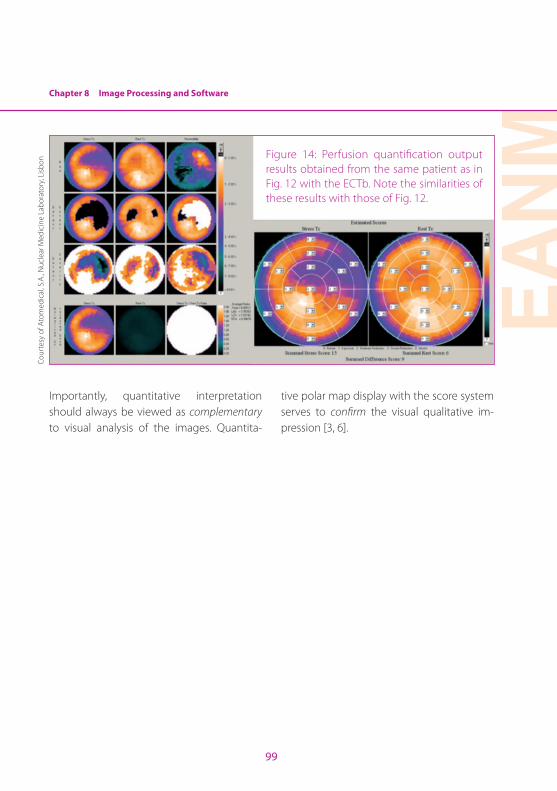
Chapter 8 Image Processing and Software
EAN
M
99
Figure 14: Perfusion quantification output results obtained from the same patient as in Fig. 12 with the ECTb. Note the similarities of these results with those of Fig. 12.
Importantly, quantitative interpretation should always be viewed as complementary to visual analysis of the images. Quantita-
tive polar map display with the score system serves to confirm the visual qualitative im-pression [3, 6].
Cour
tesy
of A
tom
edic
al, S
.A., N
ucle
ar M
edic
ine
Labo
rato
ry, L
isbon
100
Left ventricular function imaging quantification
Table 5: Global and regional parameters of systolic and diastolic left ventricular function
Parameter Systolic function Diastolic function
Global LVEF PFR, TPFR
EDV PER, TPER
ESV MFR/3
SWM
SWT
Phase
Regional WM
WT
Phase
LVEF, left ventricular ejection fraction; EDV, end-diatolic volume; ESV, end-systolic volume; SWM, systolic wall motion; SWT, systolic wall thickening; WM, wall motion; WT, wall thickening; PFR, peak filling rate; TPFR, time to peak filling rate; PER, peak emptying rate; TPER, time to peak emptying rate; MFR/3, filling rate during first third of diastole
The gated technique is a widely used clinical tool that may improve the prognostic power of MPI through measurements of functional parameters [1, 11]. Gated perfusion images can be quantitatively analysed to assess a remarkable number of parameters of cardiac function: global, regional, systolic and dia-stolic (Table 5) [11].
Commonly a “canonical” shape of the time-volume curve for an 8- or 16-frame acquisi-tion can also be obtained as a valuable tool for clinical interpretation. Quantitative phase analysis can also be performed either in a global manner (synchrony of contraction of the LV as a whole) or regionally, as the differ-ence between the onset of contraction in dif-ferent myocardial walls (see section “Ejection fraction and phase analysis”).
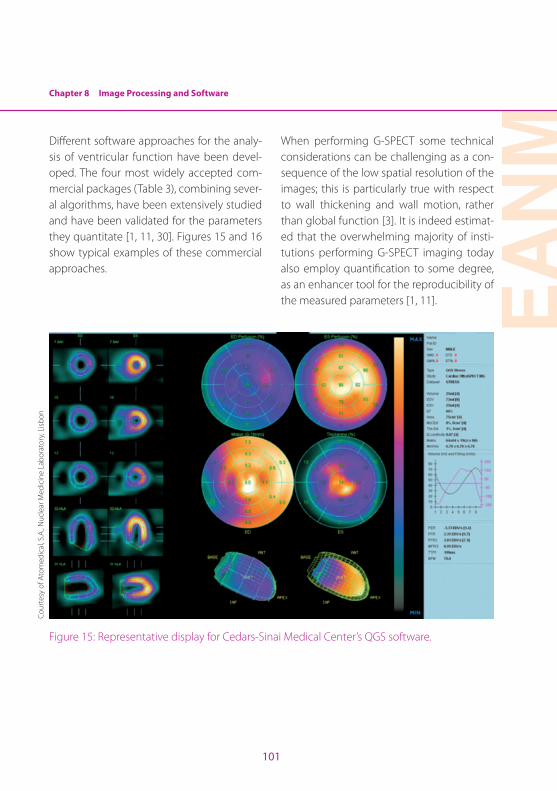
Chapter 8 Image Processing and Software
EAN
M
101
Different software approaches for the analy-sis of ventricular function have been devel-oped. The four most widely accepted com-mercial packages (Table 3), combining sever-al algorithms, have been extensively studied and have been validated for the parameters they quantitate [1, 11, 30]. Figures 15 and 16 show typical examples of these commercial approaches.
When performing G-SPECT some technical considerations can be challenging as a con-sequence of the low spatial resolution of the images; this is particularly true with respect to wall thickening and wall motion, rather than global function [3]. It is indeed estimat-ed that the overwhelming majority of insti-tutions performing G-SPECT imaging today also employ quantification to some degree, as an enhancer tool for the reproducibility of the measured parameters [1, 11].
Figure 15: Representative display for Cedars-Sinai Medical Center’s QGS software.
Cour
tesy
of A
tom
edic
al, S
.A., N
ucle
ar M
edic
ine
Labo
rato
ry, L
isbon
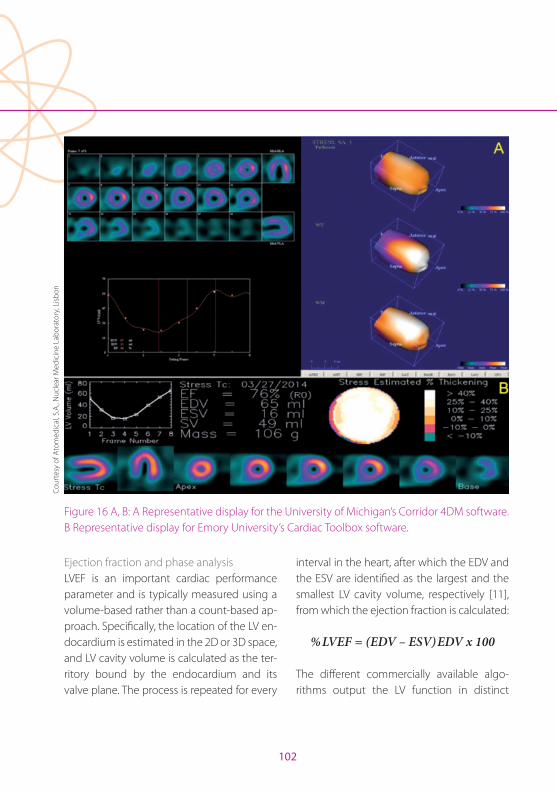
102
Figure 16 A, B: A Representative display for the University of Michigan’s Corridor 4DM software. B Representative display for Emory University’s Cardiac Toolbox software.
Ejection fraction and phase analysisLVEF is an important cardiac performance parameter and is typically measured using a volume-based rather than a count-based ap-proach. Specifically, the location of the LV en-docardium is estimated in the 2D or 3D space, and LV cavity volume is calculated as the ter-ritory bound by the endocardium and its valve plane. The process is repeated for every
interval in the heart, after which the EDV and the ESV are identified as the largest and the smallest LV cavity volume, respectively [11], from which the ejection fraction is calculated:
%LVEF = (EDV – ESV)EDV x 100
The different commercially available algo-rithms output the LV function in distinct
Cour
tesy
of A
tom
edic
al, S
.A., N
ucle
ar M
edic
ine
Labo
rato
ry, L
isbon
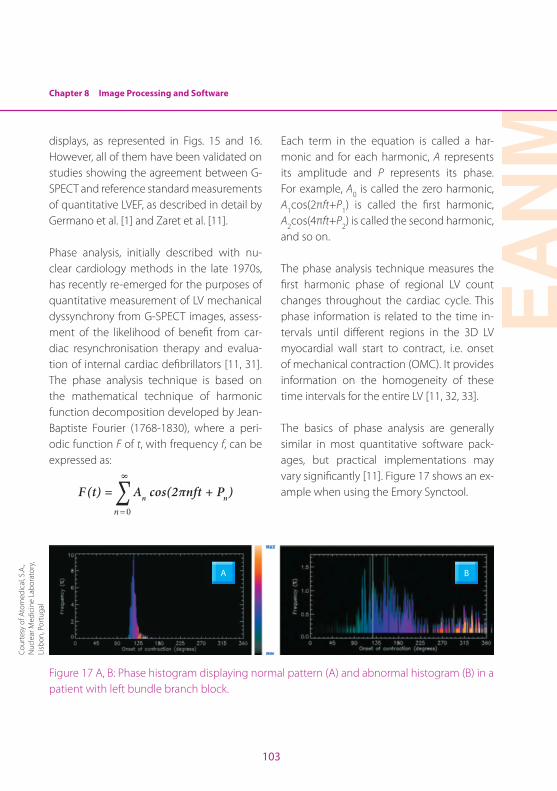
Chapter 8 Image Processing and Software
EAN
M
103
displays, as represented in Figs. 15 and 16. However, all of them have been validated on studies showing the agreement between G-SPECT and reference standard measurements of quantitative LVEF, as described in detail by Germano et al. [1] and Zaret et al. [11].
Phase analysis, initially described with nu-clear cardiology methods in the late 1970s, has recently re-emerged for the purposes of quantitative measurement of LV mechanical dyssynchrony from G-SPECT images, assess-ment of the likelihood of benefit from car-diac resynchronisation therapy and evalua-tion of internal cardiac defibrillators [11, 31]. The phase analysis technique is based on the mathematical technique of harmonic function decomposition developed by Jean-Baptiste Fourier (1768-1830), where a peri-odic function F of t, with frequency f, can be expressed as:
F (t) = Σ An cos(2πnft + Pn)
8
n=0
Each term in the equation is called a har-monic and for each harmonic, A represents its amplitude and P represents its phase. For example, A0 is called the zero harmonic, A1cos(2πft+P1) is called the first harmonic, A2cos(4πft+P2) is called the second harmonic, and so on.
The phase analysis technique measures the first harmonic phase of regional LV count changes throughout the cardiac cycle. This phase information is related to the time in-tervals until different regions in the 3D LV myocardial wall start to contract, i.e. onset of mechanical contraction (OMC). It provides information on the homogeneity of these time intervals for the entire LV [11, 32, 33].
The basics of phase analysis are generally similar in most quantitative software pack-ages, but practical implementations may vary significantly [11]. Figure 17 shows an ex-ample when using the Emory Synctool.
A B
Figure 17 A, B: Phase histogram displaying normal pattern (A) and abnormal histogram (B) in a patient with left bundle branch block.
Cour
tesy
of A
tom
edic
al, S
.A.,
Nuc
lear
Med
icin
e La
bora
tory
, Li
sbon
, Por
tuga
l
104
Attenuation correctionThe attenuation phenomenon is a result of the interaction between the photons emit-ted by the radiopharmaceutical and the tis-sue or other materials as the photons pass through the body. The degree of attenuation increases with the atomic number of the atom, depends on the tissue density and de-creases as the inverse of the photon energy. This interaction is predominant for heavy at-oms like lead and for low energetic gamma rays, X-rays or bremsstrahlung [34].
Attenuation is particularly challenging for MPI because of the variability of the tis-sue density in the thoracic region (the at-tenuation values of lungs, myocardial tissue, breasts and diaphragm vary significantly). This normally produces attenuation-related artefacts, which vary in size and severity de-pending on the attenuator density and loca-tion. A typical breast artefact will be present in the lateral wall of the heart, given the over-lay of the breast tissue and the anterolateral wall of the heart [35].
To achieve attenuation correction (AC), a de-tailed knowledge of the patient’s anatomy is fundamental. This can be obtained either through direct measurements of the patient using an external radiation source or by com-puting an estimate using body contour de-lineation based on the acquired data set.
Transmission-based AC can be attained through a line source system, consisting of a collimated rod source of gadolinium-153 (153Gd), cobalt-57 (57Co), or cerium-139 (139Ce), which can be fixed or rotating around the patient. The transmission acqui-sition provides an attenuation map for the specific radionuclide gamma ray, which is then derived for the imaging photon. This configuration presented drawbacks such as high cost for maintenance of long-lived ra-dionuclide sources and unnecessary radia-tion exposure for staff and patients and did not produce diagnostic information other than AC [36]. Recent advances on imaging technology have led to hybrid imaging, in which a SPECT or PET scanner is coupled to a CT scanner. CT provides a regional map of attenuation coefficients, specific to each patient. This works in a similar fashion to the above-mentioned technique, with supe-rior spatial resolution and the possibility of anatomical correlation. Since the patient’s breathing or the constant myocardial mo-tion can create discrepant co-registration between SPECT and CT images, it is man-datory to perform alignment quality control after image acquisition [34].
There has been much controversy on the subject of AC in MPI, mainly owing to the wide variety of available AC methods, which makes it difficult to achieve a consensus [37].
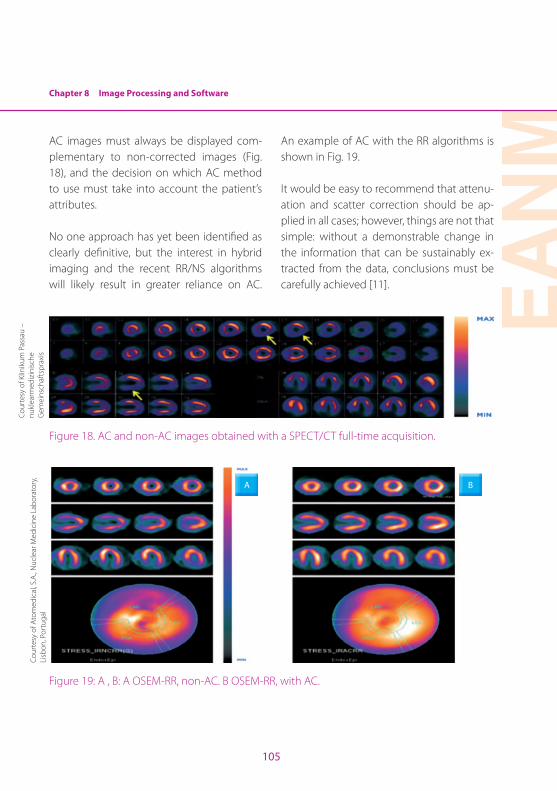
Chapter 8 Image Processing and Software
EAN
M
105
AC images must always be displayed com-plementary to non-corrected images (Fig. 18), and the decision on which AC method to use must take into account the patient’s attributes.
No one approach has yet been identified as clearly definitive, but the interest in hybrid imaging and the recent RR/NS algorithms will likely result in greater reliance on AC.
An example of AC with the RR algorithms is shown in Fig. 19.
It would be easy to recommend that attenu-ation and scatter correction should be ap-plied in all cases; however, things are not that simple: without a demonstrable change in the information that can be sustainably ex-tracted from the data, conclusions must be carefully achieved [11].
Figure 18. AC and non-AC images obtained with a SPECT/CT full-time acquisition.
A B
Figure 19: A , B: A OSEM-RR, non-AC. B OSEM-RR, with AC.
Cour
tesy
of K
linik
um P
assa
u –
nu
klea
rmed
izin
ische
G
emei
nsch
afts
prax
isCo
urte
sy o
f Ato
med
ical
, S.A
., Nuc
lear
Med
icin
e La
bora
tory
, Li
sbon
, Por
tuga
l
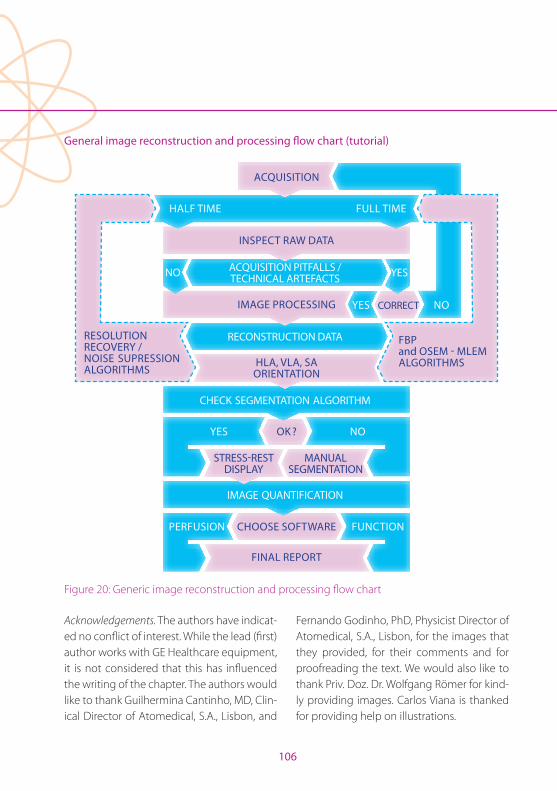
106
General image reconstruction and processing flow chart (tutorial)
INSPECT RAW DATA
CORRECTIMAGE PROCESSING
OK ?
HLA, VLA, SA ORIENTATION
CHOOSE SOFTWARE
FINAL REPORT
STRESS-REST DISPLAY
MANUAL SEGMENTATION
FBP and OSEM - MLEM ALGORITHMS
RESOLUTION RECOVERY / NOISE SUPRESSION ALGORITHMS
ACQUISITION
HALF TIME FULL TIME
NOYES
YES
PERFUSION FUNCTION
NO
YESNO ACQUISITION PITFALLS / TECHNICAL ARTEFACTS
RECONSTRUCTION DATA
CHECK SEGMENTATION ALGORITHM
IMAGE QUANTIFICATION
Figure 20: Generic image reconstruction and processing flow chart
Acknowledgements. The authors have indicat-ed no conflict of interest. While the lead (first) author works with GE Healthcare equipment, it is not considered that this has influenced the writing of the chapter. The authors would like to thank Guilhermina Cantinho, MD, Clin-ical Director of Atomedical, S.A., Lisbon, and
Fernando Godinho, PhD, Physicist Director of Atomedical, S.A., Lisbon, for the images that they provided, for their comments and for proofreading the text. We would also like to thank Priv. Doz. Dr. Wolfgang Römer for kind-ly providing images. Carlos Viana is thanked for providing help on illustrations.
EAN
M
107
References Chapter 8
References1. Germano G, Berman DS, eds. Clinical gated cardiac
SPECT. Armonk, NY: Blackwell-Futura Publishing; 2006.
2. Garcia EV, Faber TL, Esteves FP. Cardiac dedicated ultra-fast SPECT cameras: new designs and clinical implica-tions. J Nucl Med. 2011;52:210-7.
3. Holly TA, Abbott BG, Al-Mallah M, Calnon DA, Cohen MC, DiFilippo FP, et al. Single photon-emission computed tomography. J Nucl Cardiol. 2010;17:941-73.
4. Germano G. Technical aspects of myocardial SPECT imaging. J Nucl Med. 2001;42:1499-507.
5. DePuey EG. Advances in SPECT camera software and hardware: Currently available and new on the horizon. J Nucl Cardiol. 2012;19:551-81.
6. Hesse B, Tägil K, Cuocolo A, Anagnostopoulos C, Bardiés M, Bax J, et al. EANM/ESC procedural guidelines for myo-cardial perfusion imaging in nuclear cardiology. Eur J Nucl Med Mol Imaging. 2005;32:855-97.
7. Bruyant PP. Analytic and iterative reconstruction algo-rithms in SPECT. J Nucl Med. 2002;43:1343-58.
8. Lyra M, Ploussi A. Filtering in SPECT image reconstruc-tion. Int J Biol Imaging. 2011;2011:1-14.
9. Vandenberghe S, D‘Asseler Y, Van de Walle R, Kauppinen T, Koole M, Bouwens L, et al. Iterative reconstruction algorithms in nuclear medicine. Comput Med Imaging Graph. 2001;25:105-11.
10. Zeng GL. Image reconstruction – a tutorial. Comput Med Imaging Graph. 2001;25:97-103.
11. Zaret BL, Beller G. Clinical nuclear cardiology : state of the art and future directions, 4th ed. St. Louis, London: Elsevier Mosby; 2010.
12. GE, Healthcare. Evolution for Cardiac - White Paper. 2007.
13. DePuey EG, Gadiraju R, Clark J, Thompson L, Anstett F, Shwartz SC. Ordered subset expectation maximization and wide beam reconstruction “half-time” gated myo-cardial perfusion SPECT functional imaging: a compari-son to “full-time” filtered backprojection. J Nucl Cardiol. 2008;15:547-63.
14. Pena H, Cantinho G, Shwartz SC, Figueiredo S, Marona D, Monteiro J, et al. Wide beam reconstruction technology: does it respect myocardial perfusion SPECT functional parameters? J Nucl Cardiol. 2007;14:S108.
15. Kadrmas DJ, Frey EC, Karimi SS, Tsui BM. Fast implemen-tations of reconstruction-based scatter compensation in fully 3D SPECT image reconstruction. Phys Med Biol. 1998;43:857-73.
16. Yen J, Song X, Durbin M, Zhao M, Shao L, Garrard J. SPECT image quality improvement with Astonish soft-ware. White Paper - Philips Healthcare. 2010.
17. Hawman P, Ghosh P. IQ·SPECT: A technical and clinical overview. White Paper - Siemens AG. 2012.
18. Vija H. Introduction to xSPECT Technology: Evolving multi-modal SPECT to become context-based and quantitiative. White Paper - Siemens Medical Solutions USA, Inc Molecular Imaging. 2013.
19. Borges-Neto S, Pagnanelli RA, Shaw LK, Honeycutt E, Shwartz SC, Adams GL, et al. Clinical results of a novel wide beam reconstruction method for shortening scan time of Tc-99m cardiac SPECT perfusion studies. J Nucl Cardiol. 2007;14:555-65.
20. UltraSPECT. Wide beam reconstruction: Breaking the limitation of the line spread function. White Paper - Ul-traSPECT. 2007.
21. IAEA. Nuclear cardiology: Guidance and recommen-dations for implementation in developing countries. Vienna: IAEA; 2012.
22. Garcia EV, Faber TL, Cooke CD, Folks RD, Chen J, San-tana C. The increasing role of quantification in clinical nuclear cardiology: the Emory approach. J Nucl Cardiol. 2007;14:420-32.
23. Sharir T, Germano G, Waechter PB, Kavanagh PB, Areeda JS, Gerlach J, et al. A new algorithm for the quantita-tion of myocardial perfusion SPECT. II: validation and diagnostic yield. J Nucl Med. 2000;41:720-7.
24. Germano G, Kiat H, Kavanagh PB, Moriel M, Mazzanti M, Su HT, et al. Automatic quantification of ejection fraction from gated myocardial perfusion SPECT. J Nucl Med. 1995;36:2138-47.

108
25. QPS User Manual. Cedars-Sinai Medical Center. 2007.
26. GE, Healthcare. Myovation PROTOCOL for XelerisTM 2 Functional Imaging P&R Systems - Operator Guide. Technical Publications - Revision 1. Milwaukee, Wiscon-sin 2006.
27. Cerqueira MD, Weissman NJ, Dilsisian V, Jacobs AK, Kaul S, Laskey WK, et al. Standardised myocardial segmenta-tion and nomenclature for tomographic imaging of the heart. A statement for healthcare professionals from the Cardiac Imaging Committee of the Council on Clinical Cardiology of the American Heart Association. J Nucl Cardiol. 2002;9:240-5.
28. Slomka PJ, Nishina H, Berman DS, Akincioglu C, Abidov A, Friedman JD, et al. Automated quantification of myo-cardial perfusion SPECT using simplified normal limits. J Nucl Cardiol. 2005;12:66-77.
29. Burrell S, MacDonald A. Artefacts and pitfalls in myocardial perfusion imaging. J Nucl Med Technol. 2006;34:193-211.
30. Iskandrian AE, Garcia EV. Nuclear cardiac imaging: prin-ciples and applications. New York: Oxford University Press, 2008.
31. Chen J, Henneman MM, Trimble MA, Bax JJ, Borges-Neto S, Iskandrian AE, et al. Assessment of left ventricular me-chanical dyssynchrony by phase analysis of ECG-gated SPECT myocardial perfusion imaging. J Nucl Cardiol. 2008;15:127-36.
32. Boogers MM, Van Kriekinge SD, Henneman MM, Ypen-burg C, Van Bommel RJ, Boersma E, et al. Quantitative gated SPECT-derived phase analysis on gated myocar-dial perfusion SPECT detects left ventricular dyssynchro-ny and predicts response to cardiac resynchronisation therapy. J Nucl Med. 2009;50:718-25.
33. Chen J, Kalogeropoulos AP, Verdes L, Butler J, Garcia EV. Left-ventricular systolic and diastolic dyssynchrony as assessed by multi-harmonic phase analysis of gated SPECT myocardial perfusion imaging in patients with end-stage renal disease and normal LVEF. J Nucl Cardiol. 2011;18:299-308.
34. Patton JA, Turkington TG. SPECT/CT physical princi-ples and attenuation correction. J Nucl Med Technol. 2008;36:1-10.
35. Bateman TM, Cullom SJ. Attenuation correction single-photon emission computed tomography myocardial perfusion imaging. Semin Nucl Med. 2005;35:37-51.
36. Cherry SR, Sorenson JA, Phelps ME. Physics in nuclear medicine, 4th ed. Philadelphia: Saunders; 2012.
37. Hendel RC, Corbett JR, Cullom SJ, DePuey EG, Garcia EV, Bateman TM. The value and practice of attenuation correction for myocardial perfusion SPECT imaging: a joint position statement from the American Society of Nuclear Cardiology and the Society of Nuclear Medicine. J Nucl Cardiol. 2002;9:135-43.
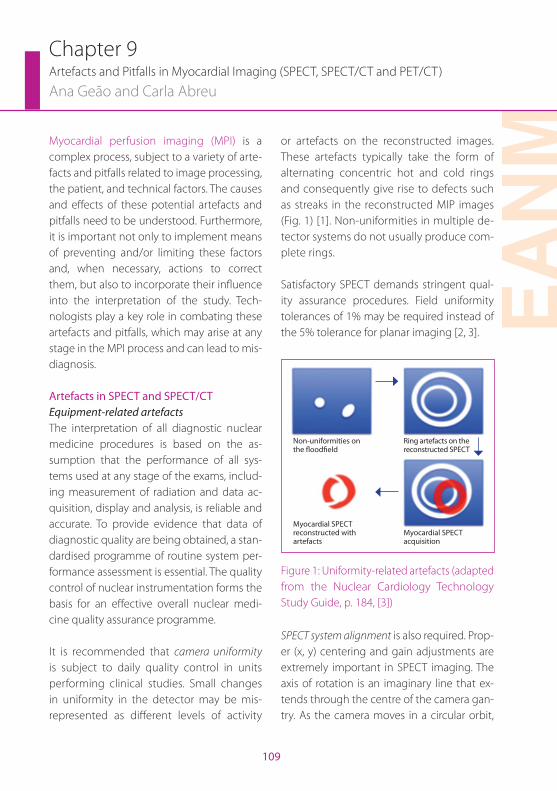
EAN
M
109
Chapter 9Artefacts and Pitfalls in Myocardial Imaging (SPECT, SPECT/CT and PET/CT)
Ana Geão and Carla Abreu
Myocardial perfusion imaging (MPI) is a complex process, subject to a variety of arte-facts and pitfalls related to image processing, the patient, and technical factors. The causes and effects of these potential artefacts and pitfalls need to be understood. Furthermore, it is important not only to implement means of preventing and/or limiting these factors and, when necessary, actions to correct them, but also to incorporate their influence into the interpretation of the study. Tech-nologists play a key role in combating these artefacts and pitfalls, which may arise at any stage in the MPI process and can lead to mis-diagnosis.
Artefacts in SPECT and SPECT/CTEquipment-related artefactsThe interpretation of all diagnostic nuclear medicine procedures is based on the as-sumption that the performance of all sys-tems used at any stage of the exams, includ-ing measurement of radiation and data ac-quisition, display and analysis, is reliable and accurate. To provide evidence that data of diagnostic quality are being obtained, a stan-dardised programme of routine system per-formance assessment is essential. The quality control of nuclear instrumentation forms the basis for an effective overall nuclear medi-cine quality assurance programme.
It is recommended that camera uniformity is subject to daily quality control in units performing clinical studies. Small changes in uniformity in the detector may be mis-represented as different levels of activity
or artefacts on the reconstructed images. These artefacts typically take the form of alternating concentric hot and cold rings and consequently give rise to defects such as streaks in the reconstructed MIP images (Fig. 1) [1]. Non-uniformities in multiple de-tector systems do not usually produce com-plete rings.
Satisfactory SPECT demands stringent qual-ity assurance procedures. Field uniformity tolerances of 1% may be required instead of the 5% tolerance for planar imaging [2, 3].
Non-uniformities on the floodfield
Myocardial SPECT reconstructed with artefacts
Ring artefacts on the reconstructed SPECT
Myocardial SPECT acquisition
Figure 1: Uniformity-related artefacts (adapted from the Nuclear Cardiology Technology Study Guide, p. 184, [3])
SPECT system alignment is also required. Prop-er (x, y) centering and gain adjustments are extremely important in SPECT imaging. The axis of rotation is an imaginary line that ex-tends through the centre of the camera gan-try. As the camera moves in a circular orbit,
110
the distance of the detectors to this axis of rotation should not be variable. This requires that both the camera head and the yoke ro-tation be carefully set to place the plane of the camera crystal parallel to the axis of rota-tion. The computer image matrix must also be correctly aligned with the axis of rotation. Any misalignment in the acquired images, whatever the cause, will mean blurring and loss of resolution in the reconstructed im-ages.
Centre of rotation (COR) is a calibration per-formed regularly to ensure that the frame of reference used by the computer in re-constructing images is aligned with the mechanical axis of rotation of the SPECT. If an offset error exists, spatial resolution and image contrast will be reduced and there will be increased blurring of the image with resultant significant image artefacts, espe-cially in the apex of MPI images [1]. Such an error can also induce, in transverse im-ages, characteristic “doughnut” (360° orbit) or “tuning fork” (180° orbit) artefacts. COR errors are easy to detect with radioactive point sources. However, they may be very difficult to detect with a clinical distribution of activity [4, 5].
Attenuation correction is an important tool to distinguish artefacts due to attenuation, but attenuation correction itself can cause arte-facts. First of all, the emission scan and the transmission scan that are used to correct photon attenuation must be perfectly regis-tered with each other. Improper quality con-
trol of an attenuation correction device can lead to a MIP artefact such as a truncation ar-tefact due to a positioning error, a cross-talk artefact due to the off-peak or window set-up of the transmission source or a low-count density artefact due to decreased activity of the transmission source [1].
The use of SPECT/CT has improved the at-tenuation map quality that can be obtained with sealed transmission sources. However, the pixel values must be scaled to match attenuation coefficients appropriate for the radionuclide being imaged and the CT and SPECT images must be precisely aligned. This alignment should always be verified be-cause any patient movement or even deep breathing can result in a spatial mismatch and consequently introduce artefacts into the attenuation correction map. Realign-ment can be done to correct some mis-matches. It is also important to keep in mind that every artefact in the CT will reverberate into artefacts in the emission scan, such as metal objects, which will cause over-correc-tion in the SPECT image.
Processing-related artefactsA substantial numbers of artefacts are due to the processing phase of MPI. A proper orientation of the heart is vital to ensure that the entire myocardium is included and the axis angles are correct, otherwise significant errors in the perfusion imaging will occur (Fig. 2). In addition, unusual patient charac-teristics such as dextrocardia may cause pit-falls [1, 3].
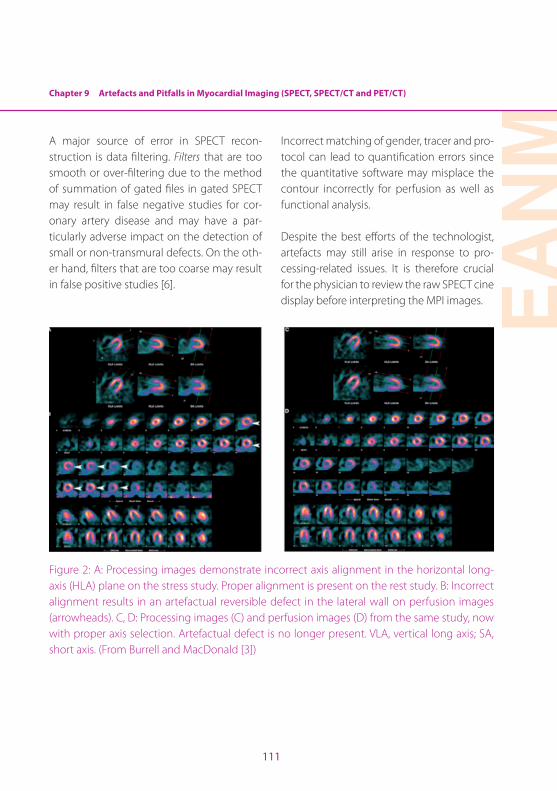
Chapter 9 Artefacts and Pitfalls in Myocardial Imaging (SPECT, SPECT/CT and PET/CT)
EAN
M
111
A major source of error in SPECT recon-struction is data filtering. Filters that are too smooth or over-filtering due to the method of summation of gated files in gated SPECT may result in false negative studies for cor-onary artery disease and may have a par-ticularly adverse impact on the detection of small or non-transmural defects. On the oth-er hand, filters that are too coarse may result in false positive studies [6].
Incorrect matching of gender, tracer and pro-tocol can lead to quantification errors since the quantitative software may misplace the contour incorrectly for perfusion as well as functional analysis.
Despite the best efforts of the technologist, artefacts may still arise in response to pro-cessing-related issues. It is therefore crucial for the physician to review the raw SPECT cine display before interpreting the MPI images.
Figure 2: A: Processing images demonstrate incorrect axis alignment in the horizontal long-axis (HLA) plane on the stress study. Proper alignment is present on the rest study. B: Incorrect alignment results in an artefactual reversible defect in the lateral wall on perfusion images (arrowheads). C, D: Processing images (C) and perfusion images (D) from the same study, now with proper axis selection. Artefactual defect is no longer present. VLA, vertical long axis; SA, short axis. (From Burrell and MacDonald [3])
112
Patient-related artefactsGood patient preparation is mandatory to ensure an optimal study and minimise the existence of artefacts and pitfalls. A maximal safe level of cardiac stressing (physical or pharmacological) optimises the sensitivity of MPI for ischaemia. In order to achieve that level of cardiac stressing, the patient should avoid some substances, such as chocolate and caffeine; in addition, when medically required, certain cardiac medications should be withheld [3].
Before imaging, radio-opaque material or another potential attenuator in the acquired region on the thorax must be removed. How-ever, it is not only external material project-ing over the heart during the SPECT acqui-sition that results in focal attenuation: the patient’s body itself is responsible for one of the most frequent and discrete source of artefacts in MPI – attenuation. There are gen-erally three sources of soft tissue attenuation artefacts (usually fixed defects in both stress and rest images): breast (anteroseptal, anteri-or and/or anterolateral wall), diaphragm and ‘cold’ bowel (inferior wall) and obese patients with lateral fat pads (lateral wall). One way of distinguishing attenuation artefacts from significant perfusion abnormalities, if attenu-ation correction is not available, is to perform a gated study (Table 1) [1, 6].
Proper patient positioning entails ensur-ing patient comfort during the scan, which will minimise or even avoid many artefacts caused by attenuation as well as patient mo-
tion. Typically, two positions can be used, su-pine (most commonly used) and prone, the latter having been shown to reduce patient motion and inferior wall attenuation when compared with supine imaging. Other posi-tions may be considered according to the patient’s needs [1].
When using 180° orbits for SPECT, the pa-tient’s left arm must be positioned outside the field of view. This is usually accomplished by placing the left or even both arms above the head using an arm support device to maximise comfort. When using 360° orbits, both arms need to be positioned away from the patient’s side. Likewise, it is well known that the collimator surface should be as close to the patient’s body as possible, to increase the image resolution. These requirements mean that the technician must be very aware of the danger that the patient’s position will interfere with the gantry radius. It is impor-tant that patients be positioned similarly for both the rest and the stress study, with a con-sistent radius of rotation [2].
Inspection of cine display projection im-ages or even the sinogram and linogram is one of the most useful means available to physicians to detect patient motion (Fig. 3). Most processing computers provide motion correction software; nevertheless, motion correction software does not always correct appropriately and must be used judiciously. Prevention of motion is the most effective way to avoid artefacts. Another type of mo-tion is cardiac or upward creep, which can
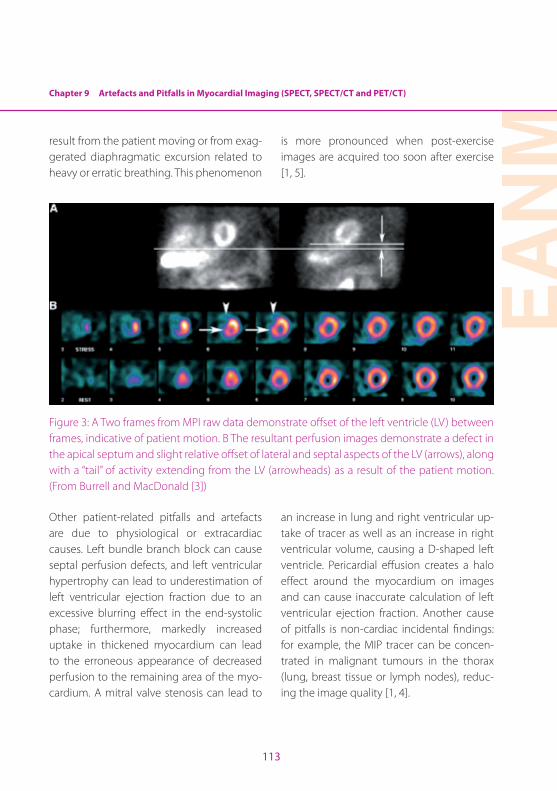
Chapter 9 Artefacts and Pitfalls in Myocardial Imaging (SPECT, SPECT/CT and PET/CT)
EAN
M
113
result from the patient moving or from exag-gerated diaphragmatic excursion related to heavy or erratic breathing. This phenomenon
is more pronounced when post-exercise images are acquired too soon after exercise [1, 5].
Figure 3: A Two frames from MPI raw data demonstrate offset of the left ventricle (LV) between frames, indicative of patient motion. B The resultant perfusion images demonstrate a defect in the apical septum and slight relative offset of lateral and septal aspects of the LV (arrows), along with a ‘‘tail’’ of activity extending from the LV (arrowheads) as a result of the patient motion. (From Burrell and MacDonald [3])
Other patient-related pitfalls and artefacts are due to physiological or extracardiac causes. Left bundle branch block can cause septal perfusion defects, and left ventricular hypertrophy can lead to underestimation of left ventricular ejection fraction due to an excessive blurring effect in the end-systolic phase; furthermore, markedly increased uptake in thickened myocardium can lead to the erroneous appearance of decreased perfusion to the remaining area of the myo-cardium. A mitral valve stenosis can lead to
an increase in lung and right ventricular up-take of tracer as well as an increase in right ventricular volume, causing a D-shaped left ventricle. Pericardial effusion creates a halo effect around the myocardium on images and can cause inaccurate calculation of left ventricular ejection fraction. Another cause of pitfalls is non-cardiac incidental findings: for example, the MIP tracer can be concen-trated in malignant tumours in the thorax (lung, breast tissue or lymph nodes), reduc-ing the image quality [1, 4].
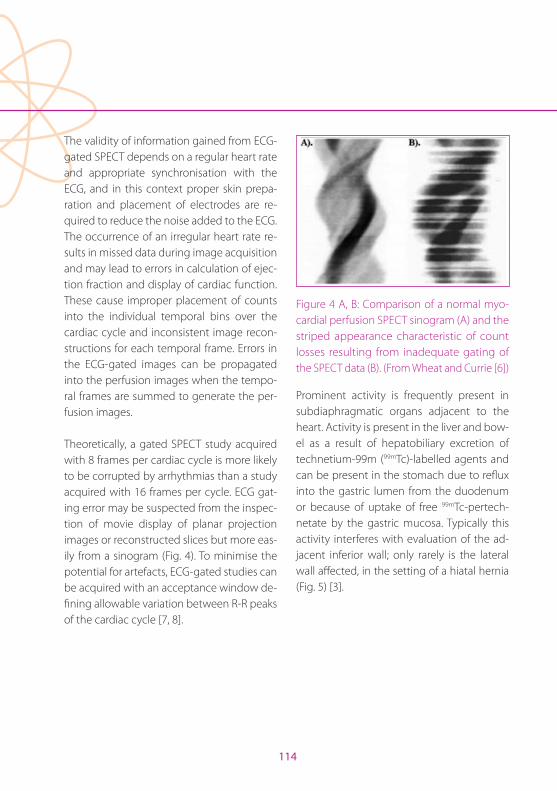
114
The validity of information gained from ECG-gated SPECT depends on a regular heart rate and appropriate synchronisation with the ECG, and in this context proper skin prepa-ration and placement of electrodes are re-quired to reduce the noise added to the ECG. The occurrence of an irregular heart rate re-sults in missed data during image acquisition and may lead to errors in calculation of ejec-tion fraction and display of cardiac function. These cause improper placement of counts into the individual temporal bins over the cardiac cycle and inconsistent image recon-structions for each temporal frame. Errors in the ECG-gated images can be propagated into the perfusion images when the tempo-ral frames are summed to generate the per-fusion images.
Theoretically, a gated SPECT study acquired with 8 frames per cardiac cycle is more likely to be corrupted by arrhythmias than a study acquired with 16 frames per cycle. ECG gat-ing error may be suspected from the inspec-tion of movie display of planar projection images or reconstructed slices but more eas-ily from a sinogram (Fig. 4). To minimise the potential for artefacts, ECG-gated studies can be acquired with an acceptance window de-fining allowable variation between R-R peaks of the cardiac cycle [7, 8].
Figure 4 A, B: Comparison of a normal myo-cardial perfusion SPECT sinogram (A) and the striped appearance characteristic of count losses resulting from inadequate gating of the SPECT data (B). (From Wheat and Currie [6])
Prominent activity is frequently present in subdiaphragmatic organs adjacent to the heart. Activity is present in the liver and bow-el as a result of hepatobiliary excretion of technetium-99m (99mTc)-labelled agents and can be present in the stomach due to reflux into the gastric lumen from the duodenum or because of uptake of free 99mTc-pertech-netate by the gastric mucosa. Typically this activity interferes with evaluation of the ad-jacent inferior wall; only rarely is the lateral wall affected, in the setting of a hiatal hernia (Fig. 5) [3].
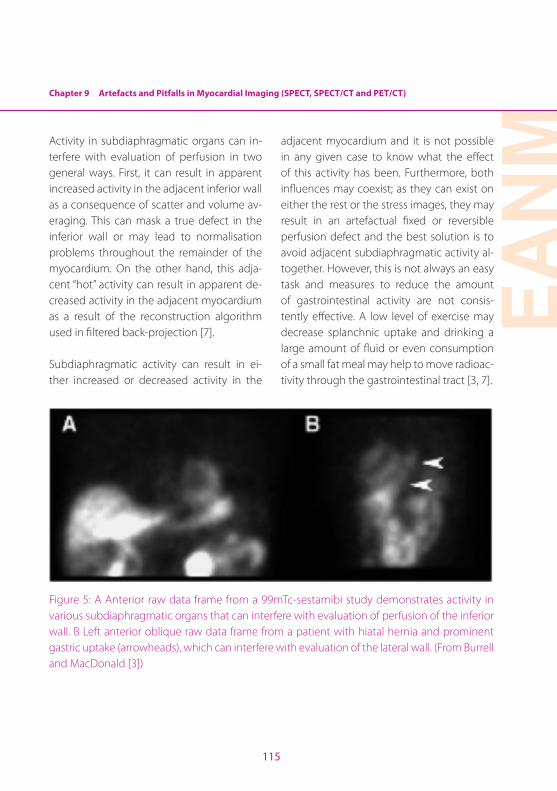
Chapter 9 Artefacts and Pitfalls in Myocardial Imaging (SPECT, SPECT/CT and PET/CT)
EAN
M
115
Activity in subdiaphragmatic organs can in-terfere with evaluation of perfusion in two general ways. First, it can result in apparent increased activity in the adjacent inferior wall as a consequence of scatter and volume av-eraging. This can mask a true defect in the inferior wall or may lead to normalisation problems throughout the remainder of the myocardium. On the other hand, this adja-cent ‘‘hot’’ activity can result in apparent de-creased activity in the adjacent myocardium as a result of the reconstruction algorithm used in filtered back-projection [7].
Subdiaphragmatic activity can result in ei-ther increased or decreased activity in the
adjacent myocardium and it is not possible in any given case to know what the effect of this activity has been. Furthermore, both influences may coexist; as they can exist on either the rest or the stress images, they may result in an artefactual fixed or reversible perfusion defect and the best solution is to avoid adjacent subdiaphragmatic activity al-together. However, this is not always an easy task and measures to reduce the amount of gastrointestinal activity are not consis-tently effective. A low level of exercise may decrease splanchnic uptake and drinking a large amount of fluid or even consumption of a small fat meal may help to move radioac-tivity through the gastrointestinal tract [3, 7].
Figure 5: A Anterior raw data frame from a 99mTc-sestamibi study demonstrates activity in various subdiaphragmatic organs that can interfere with evaluation of perfusion of the inferior wall. B Left anterior oblique raw data frame from a patient with hiatal hernia and prominent gastric uptake (arrowheads), which can interfere with evaluation of the lateral wall. (From Burrell and MacDonald [3])
116
Technical-related artefactsA very important technical issue that can compromise the quality of MPI is the ad-ministered patient dose in each stress and rest phase. Dose recommendations for MPI are provided in guidelines and should be adjusted according to patient weight to ensure the appropriate counting statistics and consequently a good quality study. The importance of the correct dose increases in the second phase of a same-day study, since the second scan will be dominated by activ-ity from the first injection if insufficient dose is provided. Nevertheless, there are many reasons why a low-activity study may occur. Infiltration in the injection site and spilled dose in the patient’s clothes not only provide low counting statistics but may also lead to an erroneous diagnosis of malignancy if “hot spots” are in the field of view. The insertion of an intravenous line reduces the possibility of an infiltrated dose, although it is imperative when administering the radiopharmaceuti-cal to beware of potential contamination as well as to perform flushing with saline after the injection to reduce its retention in the in-travenous line [1, 3].
The various pitfalls technical and equip-ment-, processing- and patient-related arte-facts in SPECT MPI are summarized in Table 2.
Artefacts in PET/CTCardiac PET/CT has gained an important role in the evaluation of patients with either known or suspected cardiac disease. Adequate quality control of the imaging data is crucial to optimise clinical results. This section specifically outlines the most typical appearances of artefacts encountered in cardiac PET/CT, and describes some potential solutions to avoid and correct them. As with SPECT and SPECT/CT, the most commonly seen artefacts are due to the patient, processing and technical factors.
Patient motion- and patient-related artefactsMetallic implants, including the metallic components of pacemaker and implant-able cardioverter defibrillator leads near the myocardium, may give rise to artefacts on CT transmission images and pose an even more significant problem than in oncology. Such artefacts on PET images usually result in either over- or underestimation of the tracer uptake, so caution is required during the CT-based attenuation correction (CT-AC) procedures [9]. DiFillipo and Brunken [10] found that the presence of the aforemen-tioned metal objects in the field of view of the heart can introduce artefacts in over 50% of patients.
Chapter 9 Artefacts and Pitfalls in Myocardial Imaging (SPECT, SPECT/CT and PET/CT)
EAN
M
117
Patient preparation is, as in SPECT MPI, a key component for successful cardiac PET/CT. Glucose metabolism in the heart is influ-enced by the availability of substrate, myo-cardial workload and adequacy of myocar-dial perfusion. Significant myocardial FDG uptake may impede detection of a lesion that is located either behind or closely at-tached to the heart border. Blood glucose level and fasting duration before the FDG PET scan are two well-known factors that influence the myocardial uptake [11]. FDG is decreased in normal myocardium, owing to the relatively low glucose and insulin levels and high free fatty acid levels, as well as in diabetics, owing to the low glucose levels. On the other hand, when a patient has a shorter period of fasting, the tracer uptake will be high [12].
Patient positioning is also important in avoid-ing artefacts. Patients are usually imaged supine with their arms raised above their head to prevent streak artefacts from beam hardening. Also, imaging of large patients with the arms down may result in a tight fit within the gantry and lead to truncation ar-tefacts that appear as linear streaks through the reconstructed images. This issue is usu-ally resolved by using full field of view recon-struction [13].
Image reconstruction and softwareSeveral quantitative measures of myocardial perfusion can be derived automatically by software. The quantification of perfusion is relative in nature and therefore image counts in each study need to be normalised to a common level before comparison is made. The local samples of hypoperfusion can be aggregated into regional (per vascular ter-ritory) or global (per ventricle) measures in a polar map. The visual assessment of the amount of ischaemia may be challenging for the observer because there can be dif-ferences between rest and stress [14]. Lima et al. found that in patients with triple-vessel disease, combined perfusion/function analy-sis resulted in a significantly greater number of abnormal segments per patient compared with perfusion analysis alone [15]. The fact that PET can be acquired dynamically allows, through the use of kinetic models, absolute measures of myocardial blood flow or myocar-dial metabolism. These techniques rely on a dynamic acquisition of the tracer and a mod-el for tracer transport from the blood into the cell. Use of a two-compartment model offers a way of modelling the transport from the blood pool into the myocardium. Ideally, the first dynamic frame is free of any counts from the radiotracer, so beginning the acquisition late can lead to an underestimation of the blood pool and thereby an overestimation of the myocardial blood flow [3].
118
As in SPECT MPI, excessive subdiaphragmatic activity from high counts in the liver or bowel may result in decreased counts in the adja-cent inferior left ventricular wall when filtered back-projection is used for image reconstruc-tion. This kind of artefact is not common with PET as iterative methods are generally used for image reconstruction [13].
Attenuation correctionAccurate attenuation correction is critical for cardiac PET images. The transmission images and attenuation map should be checked for quality.
Artefacts may also be introduced when contrast-enhanced CT data are used for PET attenuation correction due to overestima-tion of absorption values for PET attenuation correction. Nevertheless, these artefacts can be minimised by use of post-processing al-gorithms [16]. Misalignment of transmission and emission images can produce an erro-neous attenuation map that projects lung attenuation parameters onto the heart wall, thereby causing underestimation of the at-tenuation and creating artefactual areas of hypoperfusion that can be misinterpreted as myocardial ischaemia or infarction and con-sequently produce false-positive results. The extent and direction of this misalignment will determine whether artefacts will be ap-parent in the attenuation-corrected images. Over-correction of the inferior wall is a possi-
ble artefact that results from the difference in scanning times between PET and CT images.
Respiratory, gross physical motion of the patient and cardiac motion are the major causes of misalignment leading to inconsistencies and hence artefacts when CT-AC is used. By far the most common technique for misalignment correction is a rigid shift of the emission da-taset over the attenuation image to achieve optimal superimposition and co-registration of the cardiac free wall and re-reconstruction of the images using the shifted emission data [3]. The cardiac motion due to heart contrac-tion and respiration can cause artefacts that are difficult to compensate. Whilst diagnostic CT is acquired during breath-holding and cor-rected for cardiac motion by prospective ECG triggering, the PET data have to be acquired during free breathing and are normally ac-quired without gating [13, 16].
A potential solution to the effects of possible respiratory motion when using CT-AC for PET studies is the use of cine CT, in which the idea is to acquire multiple phases of the breathing cycle and average all of the phases together. Another solution to correct the motion ef-fects is gating both the CT and the PET. Four-dimensional (4D) PET and CT imaging (re-spiratory gating) is technically feasible and is realised during free normal breathing. Each gate contains a small portion of the respira-tory cycle and correspondingly reduces the
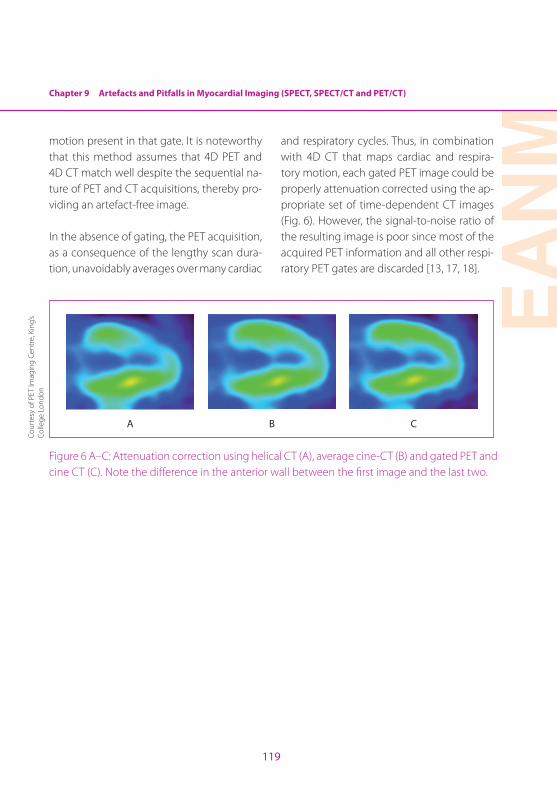
Chapter 9 Artefacts and Pitfalls in Myocardial Imaging (SPECT, SPECT/CT and PET/CT)
EAN
M
119
motion present in that gate. It is noteworthy that this method assumes that 4D PET and 4D CT match well despite the sequential na-ture of PET and CT acquisitions, thereby pro-viding an artefact-free image.
In the absence of gating, the PET acquisition, as a consequence of the lengthy scan dura-tion, unavoidably averages over many cardiac
and respiratory cycles. Thus, in combination with 4D CT that maps cardiac and respira-tory motion, each gated PET image could be properly attenuation corrected using the ap-propriate set of time-dependent CT images (Fig. 6). However, the signal-to-noise ratio of the resulting image is poor since most of the acquired PET information and all other respi-ratory PET gates are discarded [13, 17, 18].
A B C
Figure 6 A–C: Attenuation correction using helical CT (A), average cine-CT (B) and gated PET and cine CT (C). Note the difference in the anterior wall between the first image and the last two.
Cour
tesy
of P
ET Im
agin
g Ce
ntre
, Kin
g’s
Colle
ge L
ondo
n

120
References Chapter 9
References 1. Alessi AM, Farrell MB, Grabher BJ, Hyun MC, Johnson SG,
Squires P. Nuclear cardiology technology study guide. Reston, VA: Society of Nuclear Medicine; 2010:37–46; 99–108; 137– 143.
2. Christian PE, Waterstram-Rich KM. Nuclear medicine and PET/CT technology and techniques. 6th ed. Missouri: Mosby Elsevier; 2007:85–98; 267–313; 487–495.
3. Burrell S, MacDonald A. Artifacts and pitfalls in myocardi-al perfusion imaging; J Nucl Med Technol. 2006;34:193–211.
4. Dilsizian V, Narula J. Atlas of nuclear cardiology. 4 ed. New York: Springer; 2013:1–54;
5. DePuey EG. Imaging Guidelines for Nuclear Cardiol-ogy Procedures. A Report of The American Society of Nuclear Cardiology Quality Assurance Committee. American Society of Nuclear Cardiology; 2006.
6. Wheat J, Currie G. Recognising and dealing with artifact in myocardial perfusion SPECT. The Internet Journal of Cardiovascular Research. 2006; 4(1). Available from: http://ispub.com/IJCVR/4/1/10112#
7. Wackers FJ, Bruni W, Zaret BL. Nuclear cardiology: The basics. How to set up and maintain a laboratory. New Jersey: Humana Press Inc.; 2004:143–225.
8. Heller GV, Mann A, Hendel RC. Nuclear cardiology. Tech-nical applications. New York: McGraw–Hill; 2009:187–210.
9. Case JA, Baterman TM. Taking the perfect nuclear image: Quality control, acquisition, and processing techniques for cardiac SPECT, PET, and hybrid imaging. J Nucl Car-diol. 2013;20:891–907.
10. DiFilippo FP, Brunken RC. Do implanted pacemaker leads and ICD leads cause metal-related artifact in cardiac PET/CT? J Nucl Med 2005;46:436–43.
11. Ding HJ, Shiau YC, Wang JJ, Ho ST, Kao A. The influences of blood glucose and duration of fasting on myocardial glucose uptake [18F]fluoro-2-deoxy-D-glucose. Nucl Med Commun. 2002;23:961–5.
12. Lobert P, Brown RK, Dvorak RA, Corbett JR, Kazerooni EA, Wong KK. Spectrum of physiological and pathologi-cal cardiac and pericardial uptake of FDG in oncology PET-CT. Clin Radiol. 2013;68:e59–e71.
13. Di Carli MF, Lipton MJ. Cardiac PET and PET/CT imaging. New York: Springer; 2007.
14. Slomka P, Xu Y, Berman D, Germano G. Quantitative analysis of perfusion studies: Strengths and pitfalls. J Nucl Cardiol. 2013;19:338–46.
15. Lima RS, Watson DD, Goode AR, Siadaty MS, Ragosta M, Beller GA, Samady H. Incremental value of combined perfusion and perfusion over perfusion alone by gated SPECT myocardial perfusion imaging for detection of severe three-vessel coronary artery disease. J Am Coll Cardiol. 2003;42:64–70.
16. Schafers KP, Stegger L. Combined imaging of molecular function and morphology with PET/CT and SPECT/CT: image fusion and motion correction. Basic Res Cardiol. 2008;103:191–9.
17. Daou D. Respiratory motion handling is mandatory to accomplish the high-resolution PET destiny. Eur J Nucl Med Mol Imaging. 2008;35:1961–70.
18. Nehmeh SA, Erdi YE. Respiratory motion in positron emission tomography/computed tomography: A re-view. Semin Nucl Med. 2008;38:167–76.
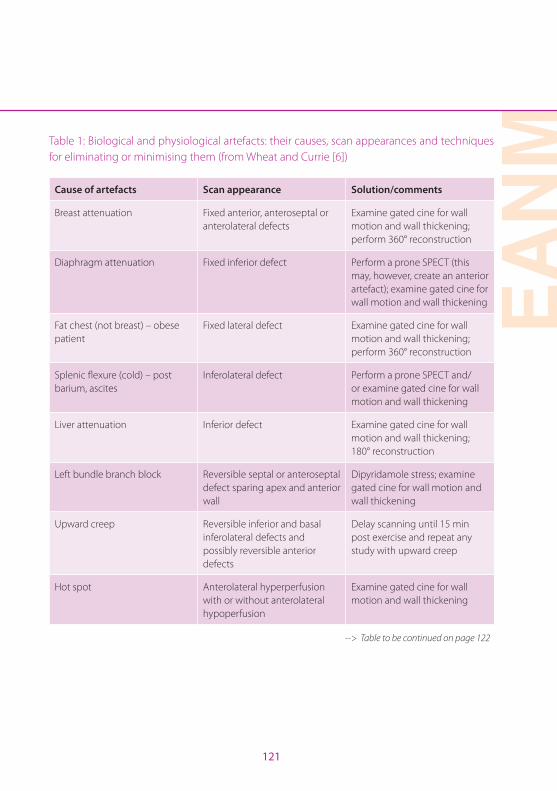
EAN
M
121
Table 1: Biological and physiological artefacts: their causes, scan appearances and techniques for eliminating or minimising them (from Wheat and Currie [6])
Cause of artefacts Scan appearance Solution/comments
Breast attenuation Fixed anterior, anteroseptal or anterolateral defects
Examine gated cine for wall motion and wall thickening; perform 360° reconstruction
Diaphragm attenuation Fixed inferior defect Perform a prone SPECT (this may, however, create an anterior artefact); examine gated cine for wall motion and wall thickening
Fat chest (not breast) – obese patient
Fixed lateral defect Examine gated cine for wall motion and wall thickening; perform 360° reconstruction
Splenic flexure (cold) – post barium, ascites
Inferolateral defect Perform a prone SPECT and/or examine gated cine for wall motion and wall thickening
Liver attenuation Inferior defect Examine gated cine for wall motion and wall thickening; 180° reconstruction
Left bundle branch block Reversible septal or anteroseptal defect sparing apex and anterior wall
Dipyridamole stress; examine gated cine for wall motion and wall thickening
Upward creep Reversible inferior and basal inferolateral defects and possibly reversible anterior defects
Delay scanning until 15 min post exercise and repeat any study with upward creep
Hot spot Anterolateral hyperperfusion with or without anterolateral hypoperfusion
Examine gated cine for wall motion and wall thickening
--> Table to be continued on page 122
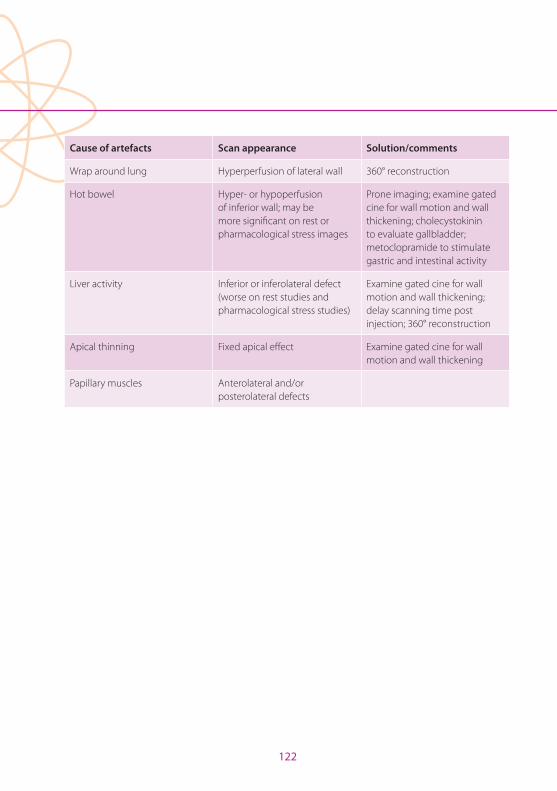
122
Cause of artefacts Scan appearance Solution/comments
Wrap around lung Hyperperfusion of lateral wall 360° reconstruction
Hot bowel Hyper- or hypoperfusion of inferior wall; may be more significant on rest or pharmacological stress images
Prone imaging; examine gated cine for wall motion and wall thickening; cholecystokinin to evaluate gallbladder; metoclopramide to stimulate gastric and intestinal activity
Liver activity Inferior or inferolateral defect (worse on rest studies and pharmacological stress studies)
Examine gated cine for wall motion and wall thickening; delay scanning time post injection; 360° reconstruction
Apical thinning Fixed apical effect Examine gated cine for wall motion and wall thickening
Papillary muscles Anterolateral and/or posterolateral defects
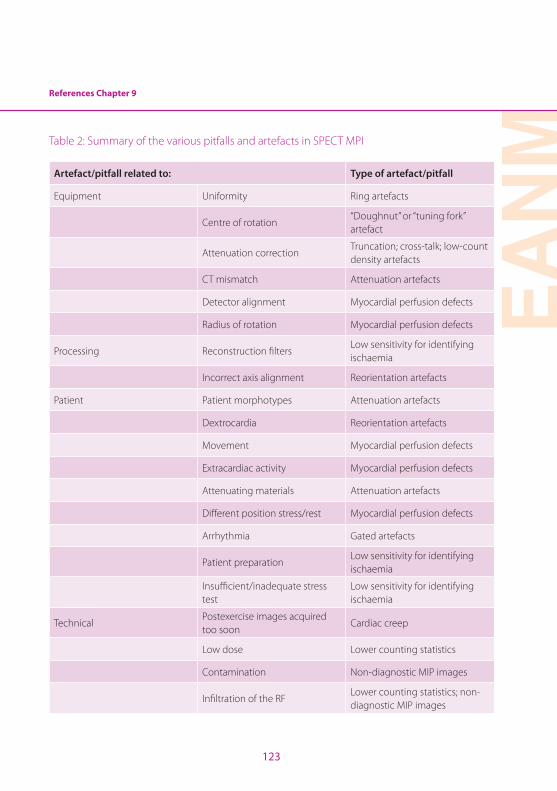
EAN
M
123
References Chapter 9
Table 2: Summary of the various pitfalls and artefacts in SPECT MPI
Artefact/pitfall related to: Type of artefact/pitfall
Equipment Uniformity Ring artefacts
Centre of rotation“Doughnut” or “tuning fork” artefact
Attenuation correctionTruncation; cross-talk; low-count density artefacts
CT mismatch Attenuation artefacts
Detector alignment Myocardial perfusion defects
Radius of rotation Myocardial perfusion defects
Processing Reconstruction filtersLow sensitivity for identifying ischaemia
Incorrect axis alignment Reorientation artefacts
Patient Patient morphotypes Attenuation artefacts
Dextrocardia Reorientation artefacts
Movement Myocardial perfusion defects
Extracardiac activity Myocardial perfusion defects
Attenuating materials Attenuation artefacts
Different position stress/rest Myocardial perfusion defects
Arrhythmia Gated artefacts
Patient preparationLow sensitivity for identifying ischaemia
Insufficient/inadequate stress test
Low sensitivity for identifying ischaemia
TechnicalPostexercise images acquired too soon
Cardiac creep
Low dose Lower counting statistics
Contamination Non-diagnostic MIP images
Infiltration of the RFLower counting statistics; non-diagnostic MIP images

124
Notes

EAN
M
125
Notes
126
Imprint
ISBN: 978-3-902785-09-1
Publisher:European Association of Nuclear Medicinec/o vereint: Association & Conference Management Ltd.Hollandstrasse 14, 1020 Vienna, AustriaPhone: +43-(0)1-212 80 30 | Fax: +43-(0)1-212 80 30-9Email: [email protected] | URL: www.eanm.org
Editors:Ryder, Helen (Dublin) Testanera, Giorgio (Rozzano, Milan) Veloso Jerónimo, Vanessa (Almada)Vidovič, Borut (Munich)
English Language Editing:Rick Mills
Project Management:Katharina Leissing
Content:No responsibility is taken for the correctness of this information.Information as per date of printing September 2014.
Association & Conference Management:vereint: Association & Conference Management Ltd.Hollandstrasse 14, 1020 Vienna, AustriaPhone: +43-(0)1-533 35 42 | Fax: +43-(0)1-533 35 42-19Email: [email protected] | URL: www.vereint.com
Layout & Design:kreativ · Mag. Evelyne Sacher-ToporekLinzer Strasse 358a/1/7, 1140 Vienna, AustriaPhone: +43-(0)1-416 52 27 | Fax: +43-(0)1-416 85 26Email: [email protected] | URL: www.kreativ-sacher.at
Printing: Colordruck GmbHKalkofenweg 6, 5400 Hallein, AustriaPhone: +43 (0)6245 90 111 26 | Fax: +43 (0)6245 90 111 22Email: [email protected] | URL: www.colordruck.at
G R a f i k & d e s i G n
kreativMag. Evelyne Sacher-Toporek
vereint Ltd. is licensee of the Austrian Eco-label for
„Green Meetings and Green Events“
LizenznehmerUmweltzeichenGreen Meetings & Green Events
Österreichisches

EAN
M