Embed Size (px)
Citation preview
A Research on the use of UMP library facilities among the undergraduate students
WONG YING YIN (CA10107)
SITI NORLIANA BINTI MOHD NASIR (CA10102)
SHAHIDAH BINTI SARMIJAN (CA10100)
MIMI ILANI BINTI MISPUN (CA10114)
A REPORT SUBMITTED TO FULLFIL PART OF THE REQUIREMENTS FOR
UHL 2332-ACADEMIC REPORT WRITING COURSE
FOR THE ATTTENTION OF:
PROF. MADYA AINOL HARYATI IBRAHIM
CENTRE FOR MODERN LANGUAGES AND HUMAN SCIENCES
UNIVERSITY MALAYSIA PAHANG
29th OCTOBER 2010

Table of ContentsDECLARATION................................................................................................................................... ii
ACKNOWLEDGEMENT...................................................................................................................iii
LIST OF FIGURES..............................................................................................................................iv
LIST OF TABLES.................................................................................................................................v
CHAPTER I: INTRODUCTION.......................................................................................................1
1.1 Background............................................................................................................................1
1.2 Research Objectives...............................................................................................................1
1.3 Research Questions................................................................................................................2
1.4 Definition of terms.................................................................................................................2
CHAPTER II: LITERATURE REVIEW..........................................................................................3
2.1 Types of library facilities.......................................................................................................3
2.2 Types of electronic resources.................................................................................................4
2.3 Satisfaction level of students regarding to the library facilities..............................................4
2.4 Impact of students performance regarding to the library facilities.........................................5
2.5 Conclusion.............................................................................................................................6
CHAPTER III: METHODOLOGY...................................................................................................7
3.1 Setting....................................................................................................................................7
3.2 Data Collection......................................................................................................................8
3.2.1 Instrument......................................................................................................................8
3.2.2 Procedure.......................................................................................................................9
3.3 Data Analysis.........................................................................................................................9
CHAPTER VI: FINDINGS AND DISCUSSIONS..........................................................................10
4.1 Demographic.......................................................................................................................10
4.2 Types of library facilities.....................................................................................................11
4.3 Types of electronic resources...............................................................................................15
4.4 Satisfaction level of students regarding to the library facilities............................................19
CHAPTER V: CONCLUSIONS AND RECOMMENDATIONS..................................................24
5.1 Conclusions.........................................................................................................................24
5.1.1 Types of library facilities.............................................................................................24
5.1.2 Types of electronic resources.......................................................................................24
5.1.3 Satisfaction level of students regarding to the library facilities....................................24
5.2 Recommendations................................................................................................................24
REFERENCES..................................................................................................................................26
i
APPENDICES...................................................................................................................................28
A. Questionnaire..............................................................................................................................28
B. Code Book..................................................................................................................................31
C. Coding Sheet...............................................................................................................................34
DECLARATION
We declare that this report is own work except for quotations and summaries which have been duly acknowledged
29.10.2010 Names: Wong Ying Yin Signature...........................
Date Names: Siti Norliana Binti Mohd Nasir Signature...........................
Names: Shahidah Binti Sarmijan Signature...........................
Names: Mimi Ilani Binti Mispun Signature...........................
ii
ACKNOWLEDGEMENT
We wish to express our eternal gratitude and sincere appreciation to our UHL 2332 Academic
Report Writing Lecturer Ms. Ainol, for her invaluable guidance, empowering support and
profound advice throughout the preparation and realisation of this academic report.
Our heartfelt gratitude also goes to our university from Faculty of Faculty of Computer
Systems & Software Engineering who were respondents for this study, for their full support and
co-operation to make this study possible.
Finally, above all, to Almighty God for giving us good health, strength and perseverance to
complete this academic report.
iii
LIST OF FIGURES
No. Title Page0 Percentages of gender respondents by course (year) 101 Different types of library facilities 112 Percentages of using library system 113 Different types of reading materials 124 The percentages of reference books provided enough for doing research or as references 135 The percentages of computer provided enough in the library 136 Percentages of using the types of e-resources by the respondents 157 Percentages of main reason of using e-resources by the respondents 158 Percentages of using e-resources among UMP students 169 Percentages of states to access to electronic resources among UMP students 17
10 Percentages of satisfaction for the electronic facilities provided in the library among the UMP students
18
11 Percentages of frequent use of the library 1912 Reason of why UMP students do not use library facilities 2013 Main reason of using the library facilities 2114 Percentages of factor contributed towards a conductive environment 2215 Percentages of satisfaction level among the UMP students 23
iv
LIST OF TABLES
No. Title Page1 Distribution of respondents by course (year) 7
v

1.0 Introduction
The research for this report is the use of UMP library facilities among the
undergraduate students. So, the introduction will consist of background, research
objectives, research questions and definition of terms for this research.
1.1 Background
Library is a building or room containing collections of books, periodicals, and
sometimes films and recorded music for people to read, borrow, or refer to (Simpson
& Weiner, 2009).
UMP Library is a comfortable and convenient place for students especially the
undergraduates to do revision, study, group discussion. Besides, it is also provides a lot
of facilities for all the UMP students, such as provide seminar room, media room,
internet services, reader advisor, self check machine, e-journal, e-book, e-newspaper
and so on. Perhaps, not all the students know how to use those facilities which are
provided in the UMP Library.
The goal of this study is to investigate whether or not the UMP undergraduate
students know about the library facilities and fully utilize the library facilities. This
report describes the procedure used and the findings of the research.
1.2 Research Objectives
The following are the objectives of this research:-
To identify the types of UMP library facilities that are commonly used by UMP
students.
To determine the different types of electronic resources that are commonly used by
UMP students.
To investigate the satisfaction level of UMP students about the UMP library
facilities.
1
1.3 Research Questions
The following are the questions of this research:-
What are the library facilities that commonly used by UMP students?
Which types of electronic resources that commonly used by UMP students?
What is the satisfaction level of UMP students regarding to the UMP library
facilities?
How do the library facilities affect the performance of UMP students?
1.4 Definition of terms
The New Oxford English Dictionary (2009) defined facility as a service offered
by an organization, or a feature of a piece of equipment, which gives the opportunity to
do or benefit from something. So, library facilities are the services that offered by the
library to the students to benefit from the resources.
Undergraduate means that a student at a college or university who has not yet
earned a bachelor's or equivalent degree (Stevenson & Lindberg, 2008).
The following shows the acronyms used in this research:-
UMP = University Malaysia Pahang
FSKKP = Faculty of Computer Systems & Software Engineering
BCS = Bachelor of Computer Science (Software Engineering)
BCN = Bachelor of Computer Science (Networking)
BCG = Bachelor of Computer Science (Graphic Design)
2
2.0 Literature Review
A literature review is a piece of discursive prose, which organize by breaking into
the relevant subtitles, which are types of library facilities, types of electronic resources
and satisfaction level of students regarding to library facilities. Besides, literature review
is a secondary data source collection such as journals, articles, books and so on.
Furthermore, it must quote or list all the references, which take the sources from
someone else.
2.1 Types of library facilities
There are many different types of library facilities used by the respondents. The
majority of the respondents were do research or find references 31(23%) from the
library, followed by borrowing or returning books 29(21.6%) and quiet study
29(21.6%) at the library. However, there is less respondents that having group study
13(10%) and photocopying 12(9%) at the library (Wang, Wu, Perng, & Tsai, 2009).
A study by Perera (2009) showed that, most of the respondents are very familiar
in searching references (45%), followed by borrowing and returning books (18%).
However, there are less respondents photocopy library materials (5%), used the
discussion room (3%) and carry out CD-ROM searches (1%). (Perera, 2009)
The majority of the students were doing their homework or study (48%) at the
library, followed by using the computer or internet (45%). However, there are 39% of
respondents borrowing the print book, 32% of respondents photocopy library
materials. (Rosa, Cantrell, Hawk, & Wilson, 2005).
The students were most likely having quiet study place (59%) at library.
Besides, there are 58% of the students like to use computer facilities or electronic
resources. While there are 37% of the students used the group study space (Dickenson,
2006).
3
4
2.2 Types of electronic resources
There are many electronic resources that commonly used by the students. Based
on the Providing Better Services of Digital Library, a system is the most important for
the students to collect more information during learning. However, according to the
user experience, system is very important because it can help users to find information
fast and accurate. System is also necessary to help users find information only by
typing in the keywords or retrieval sentences (Ji, 2009).
Finding from Ma, Clegg, and O'Brien (2006) found that "Digital collections
such as institutional repositories, cultural heritage, crusted digitally and a variety of
versions of digital libraries are blooming worldwide". Other research found that users
can access the information resources to evaluate and at the same time submitting their
personal information needs, the system also feedback for analysis and results of the
recommendation for further adjustments (Lan & Ping, 2009).
Besides that, Ji (2009) stated that "Website is the interaction surface between
users and digital library system". Website also can give users feelings of pleasure and
success, influence the users first impression on system, user friendly interface and not
only can transmit the information to guide users to operate.
2.3 Satisfaction level of students regarding to the library facilities
Service quality is an important factor to determine whether the users are
satisfied or not with our services. It is same for the library’s facilities that must fulfill
the level of quality that the users or students want it. Research from Wang (2007) in
LibQUAL+TM for evaluated the satisfaction level of library facility’s users describe
that 92.5% of the readers use the library service on the spot frequently. So, the readers
sure want the good quality of services in the library for make sure no problem occur
during they using that services.
5

Wang, Wu, Perng, and Tsai (2009) stated that user’s always demanding to get
the information or knowledge. So, the variety and useful of facilities are needed to
achieved the purpose that is to bring the great versatile resource and thinking to attract
users to presence and use the library. Besides, although the library is smaller, the
varieties of facilities are efficiency for transmission resource to users. The variety of
facilities in library should be easy to use and support the instruction and education by
user’s needs.
According to Cao (2010), the development of space of library should be planned
carefully due to the budget. Library managers need to concern themselves with
resource allocation in that they arrange their physical or electronic collections and
services in a way that will attract users to enter or use the library.
2.4 Impact of students performance regarding to the library facilities
A library is a collection of sources, resources, and services, and the structure in
which it is housed; it is organized for use and maintained by a public body, an
institution, or a private individual. Nowadays, library has introduced many new
services, either by converting existing services into e-services such as online delivery,
portals, personalized services, online teaching modules, online reference, digitized
collections, or electronic publishing. Therefore, how the library facilities affect the
student performance.
Firstly, collection of information contained in the library, which is constantly
updated and more efficient is used to assist and facilitate the students to make a
reference. In addition, student will get the latest information, get a lot of knowledge
and will be able to develop themselves. This point supported by Smith (2001),
“Informed library users know that libraries have resources that are more
comprehensive and scholarly than most web site provide”.
6
Next, a research conducted by Waldman (2003) stated “Providing a good and
comfort environment, library is a place of silence for studying”. Other than that, he
stated that “By using all facilities provided in library, student can save more time and
can finish their work earlier”. Regarding these two points, it shows that the peaceful
environment and good time management can help students in performing task with
easy, fast and effective without any disruption and stress.
Last but not least, a review by Lonsdale (2003) stated that, “Libraries can make
a positive difference to student self-esteem, confidence and sense of responsibility in
regard to their own learning.” From independence and responsibilities on doing task, it
automatically builds a good attitude among students. In addition, students can fill their
free time with something beneficial, which is not affected by the negative elements.
2.5 Conclusion
Based on the types of library facilities, electronic resources, the satisfaction
level and the impact of students performance, it could help to study whether the
students have made use of the library facilities.
In a nutshell, the library environment and the study attitude will impact the
performance of the students in doing the research by using the electronic resources,
studying or having discussion at library. Besides, the up to date resources are also very
important.
7

3.0 Methodology
Methodology may be referring to the steps or procedures of data collection. After
that, analyse the data by calculating the statistics, drawing bar line, chart or table. At last,
come out with the result which can understand, simplify and highlight the most
important findings in the particular research.
3.1 Setting
Based on the study, we have selected the students from first year to third year
Bachelor of Software Engineering (BCS), Networking (BCN) and from first year to
second year Bachelor of Graphic Design (BCG) students of the Faculty of Computer
Systems & Software Engineering (FSKKP) as our respondents, which conducted at
University Malaysia Pahang (UMP).
The total number of respondents is 80 students. The respondents are those
undergraduate students who study at UMP. We will pick those respondents in
randomly, based on different courses and years. Each year will pick 10 respondents as
shown in Table 1.
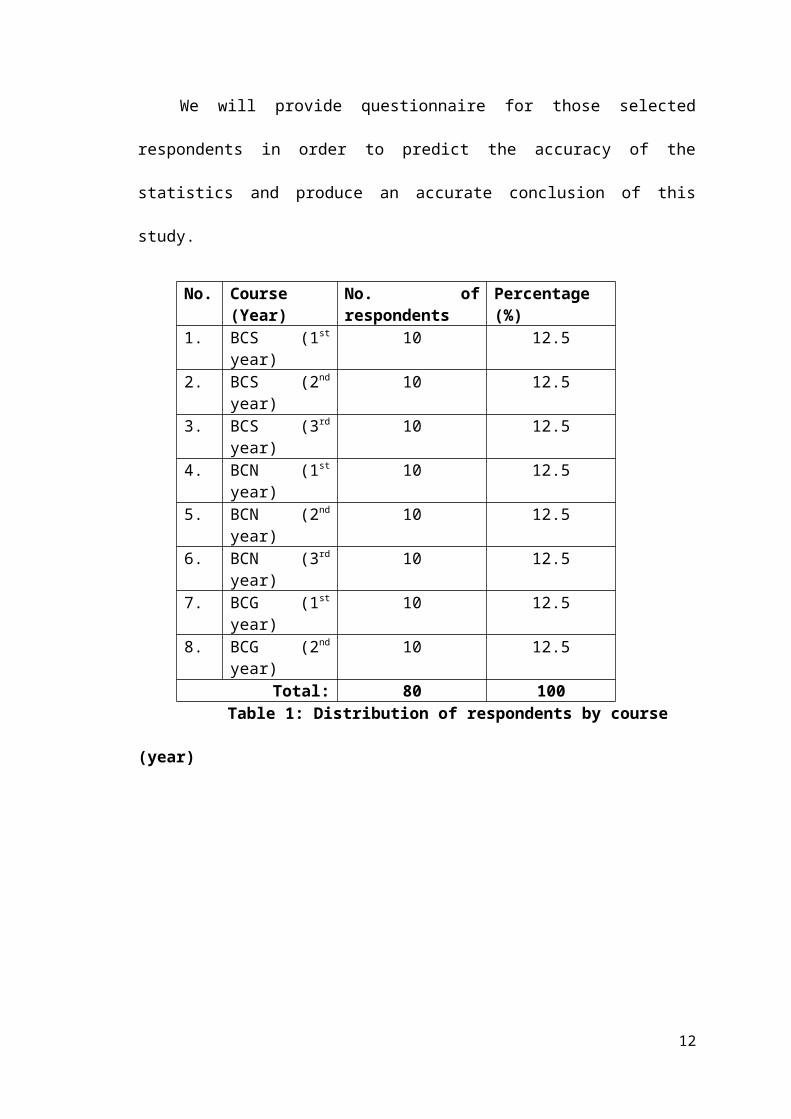
We will provide questionnaire for those selected respondents in order to predict
the accuracy of the statistics and produce an accurate conclusion of this study.
No. Course (Year) No. of respondents Percentage (%)1. BCS (1st year) 10 12.52. BCS (2nd year) 10 12.53. BCS (3rd year) 10 12.54. BCN (1st year) 10 12.55. BCN (2nd year) 10 12.56. BCN (3rd year) 10 12.57. BCG (1st year) 10 12.58. BCG (2nd year) 10 12.5
Total: 80 100Table 1: Distribution of respondents by course (year)
8
3.2 Data Collection
In this research, we will collect and analysis the data. There are a lot of data
collection methods such as interviews, questionnaires, journals, books and so on. We
used primary data source collection, which is questionnaire. Besides, we also used
secondary data source collection from journals and articles.
3.2.1 Instrument
We used the most common data collection method which is questionnaire, the
primary source data. It is easier for us to collect the standardized information. Firstly,
we stated our purpose; appreciate to our respondents and provided the instructions.
In our questionnaire, we provided 18 close-ended questions and 1 open-ended
question. The close-ended questions consist of multiple-choice questions and scale
question, while the open-ended question is provided for respondents to leave any
other comments.
The questionnaire is categorized into 4 sections, which are from section A to
section D. For section A is demographic, which includes gender, course and year.
However, the following sections are based on our research objectives and each of the
sections provided 5 questions. For section B includes questions about the library
facilities. While section C is about the electronic resources. The last part, which is
section D, includes questions about the satisfaction level of UMP students.
Our questionnaire was short, simple and direct, which could help respondents
to understand our questions easily.
9
3.2.2 Procedure
We collected the data begin with the secondary data source collection, which
is finding and collecting the related journals and articles as done in literature review.
After that, we used the primary data source collection, which is questionnaire
to study whether the UMP students have fully utilized the UMP library facilities. To
collect the data, we used two weeks to complete it.
Firstly, our questionnaire had to get approval from lecturer. After getting the
approval from lecturer, we distributed 80 sets of questionnaire for those selected
respondents at the library. The respondents answered the questionnaire and sent it
back to us. So, we collected the questionnaire right after the respondents finished
answered or later a few minutes. Finally, we received the same amount as we have
distributed which are 80 sets of questionnaire.
3.3 Data Analysis
Firstly, we created and assigned the unique code for our questionnaire based on
the formula provided by our lecturer. After that, we tabulated a table by using
Microsoft Office Excel. Then, we calculated and analyzed the data. Lastly, we can
calculate and generate graphs by applying formula based on our data sheet by using
Microsoft Office Excel.
10
4.0Findings and Discussions
In this chapter, the findings and discussions are based on the research questions.
The findings are analyzed data and implemented formula based on the code book. Then,
the discussions will discuss about the supported result and findings with literature
review.
4.1 Demographic
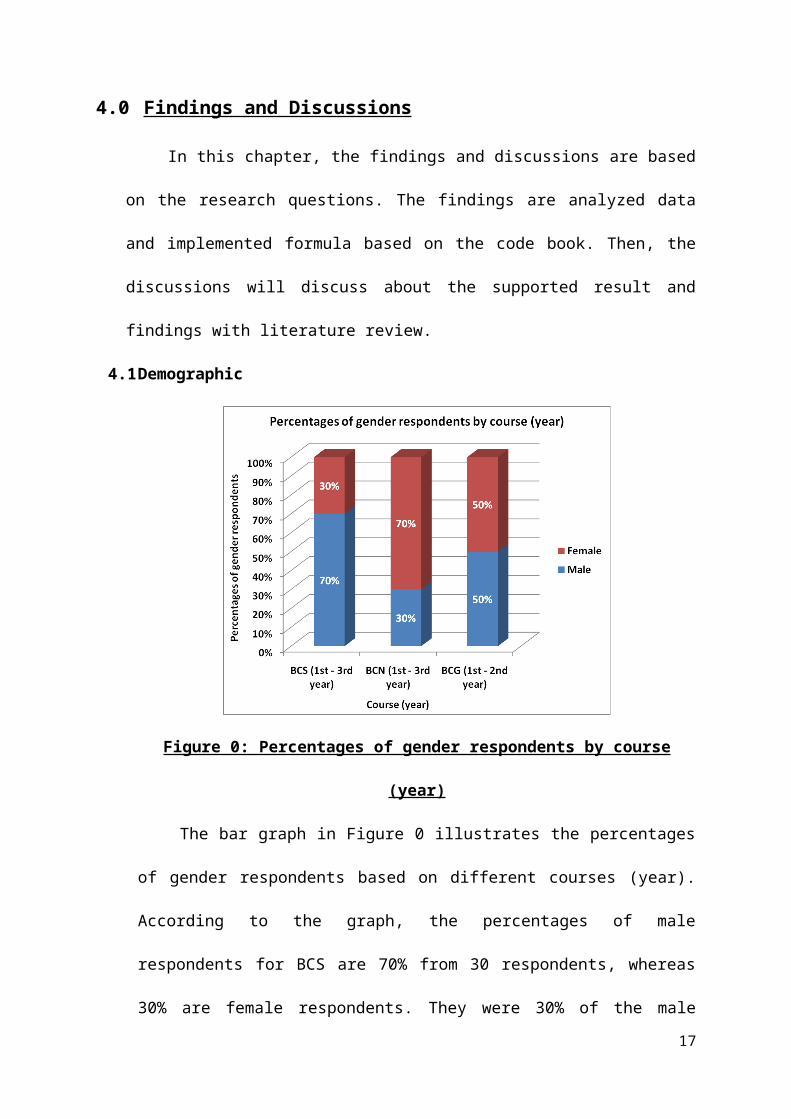
Figure 0: Percentages of gender respondents by course (year)
The bar graph in Figure 0 illustrates the percentages of gender respondents
based on different courses (year). According to the graph, the percentages of male
respondents for BCS are 70% from 30 respondents, whereas 30% are female
respondents. They were 30% of the male respondents and 70% of female respondents
from BCN. The Figure 0 shows that the gender from BCG course, both male and
female was having the same percentages of respondents, which are 50%.
It can be concluded that most of the male respondents from BCS would like to
enter the UMP library. Besides, the majority of female respondents from BCN would
like to enter the UMP library.
11
12
4.2 Types of library facilities
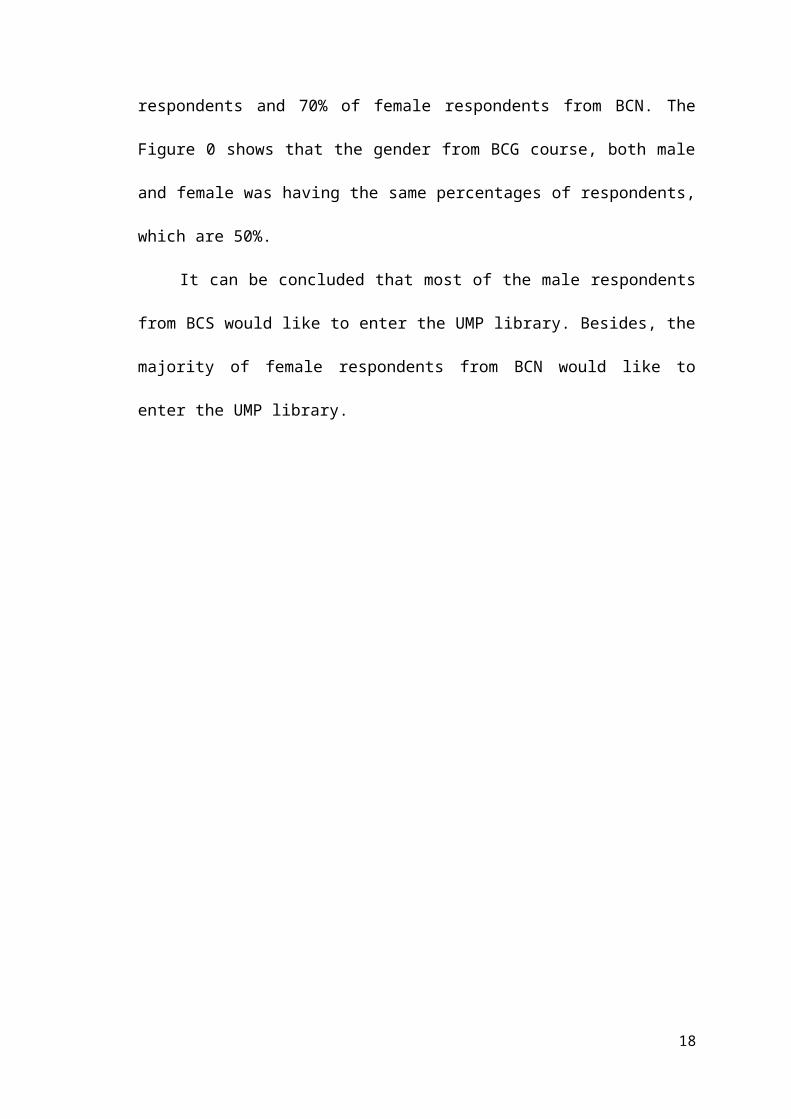
Figure 1: Different types of library facilities
The bar graph in Figure 1 illustrates that the different types of UMP library
facilities used by the respondents. According to the graph, self-checked machine, book
drop (borrow books) is the highest percentage (30.27%) whereas others types of library
facilities like e-proxy is the lowest percentage (0.54%). 24.86% of the respondents are
used internet access, followed by discussion room (18.38%), computer (14.59%) and
e-library (11.35%).
It can be concluded that most of the respondents commonly used the self-
checked machine, book drop (borrow books) facility at UMP library.
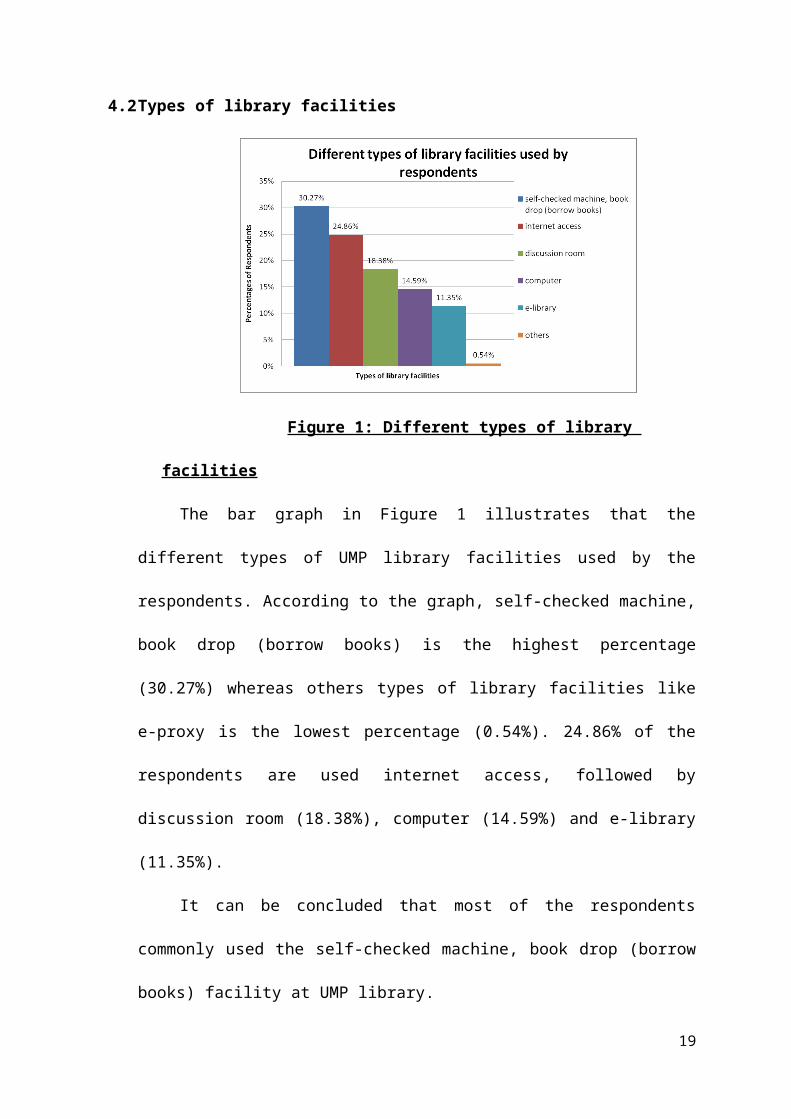
Figure 2: Percentages of using library system
13
The pie chart in Figure 2 shows the percentages of using library system among
UMP students. According to the chart, 42% of the students stated that they sometimes
used the library system to search the books and other materials. This followed by 25%
and 19% of the students rarely and often used the library system. While 14% of the
students stated that they never used the library system before.
It shows that most of the UMP students used the library system occasionally. It
can be concluded that the UMP students used the library system when needed only.
Figure 3: Different types of reading materials
The bar graph in Figure 3 illustrates that the different types of materials read by
the respondents. According to the graph, reference books is the highest respondents
whereas they do not have any others recommended types of materials read by
respondents. Reference books read by 56 respondents while 32 of respondents read
articles at UMP library. Nevertheless, they are 30 of respondents read journals and
newspapers. However, they are 26 of respondents read articles at the library. Besides,
they are no any others recommended reading material from respondents.
It can be concluded that most of the respondents read and find reference books
at the library, which are same as the study from those researchers.
14
Figure 4: The percentages of reference books provided enough for doing research
or as references
The pie chart in Figure 4 shows the percentage of reference books provided
enough for doing research or as references. 62% of the respondents agreed and 38% of
the respondents disagreed that the library provided enough references.
It can be concluded that more than half of the students agreed that the library
provided a lot of up-to-date references at UMP library, as the researchers found that
most of the respondents do researches at the library because of the library provide a lot
of reference books.
Figure 5: The percentages of computer provided enough in the library
15
The pie chart in Figure 5 shows the percentages of computer provided enough in
the library. 55% of the respondents agreed while 45% of the respondents disagreed that
computers provided enough in the library.
It can be concluded that more than half of the students agreed that the library
have enough computers for the respondents to do their work at UMP library.
Discussion
A study from Wang et al (2009), most of the respondents were borrowing or
returning books by using the machines provided at the Colorado Academic Library.
Through the research from Perera (2009), they were a lot of respondents were
borrowing and returning books by using the machines provided at University
Librarians Association of Sri Lanka.
It was more than half of the students used computer facilities or electronic
resources (Dickenson, 2006).
The majority of the respondents were do research or find references from the
library (Wang, Wu, Perng, & Tsai, 2009). Besides, a study by Perera (2009) showed
that, most of the respondents very familiar in searching references.
They were partially of the students used the computer or internet provided at the
library (Rosa, Cantrell, Hawk, & Wilson, 2005).
From the findings, most of the UMP students used self-check machine, book
drop to borrow or return books, followed by internet access, discussion rooms and
computers. The computers and references provided enough at UMP library. So, the
majority of UMP students like to do their research or find some references at the
library.
16
4.3 Types of electronic resources
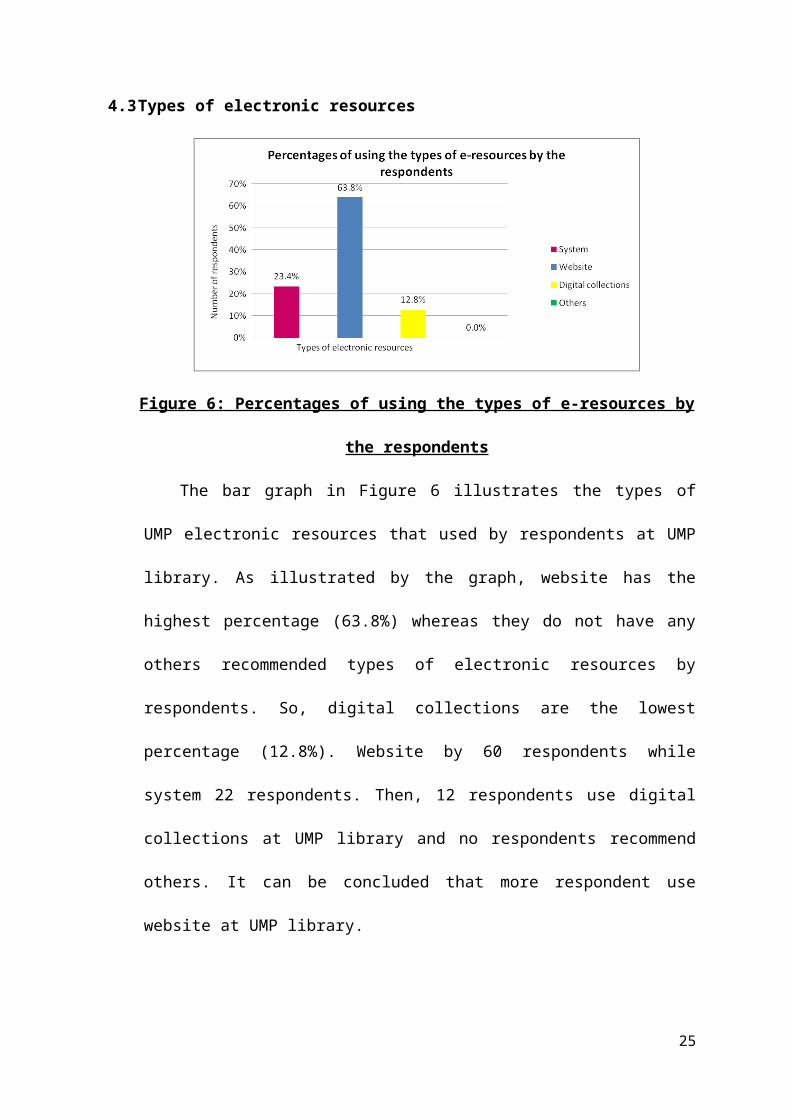
Figure 6: Percentages of using the types of e-resources by the respondents
The bar graph in Figure 6 illustrates the types of UMP electronic resources that
used by respondents at UMP library. As illustrated by the graph, website has the
highest percentage (63.8%) whereas they do not have any others recommended types
of electronic resources by respondents. So, digital collections are the lowest
percentage (12.8%). Website by 60 respondents while system 22 respondents. Then,
12 respondents use digital collections at UMP library and no respondents recommend
others. It can be concluded that more respondent use website at UMP library.
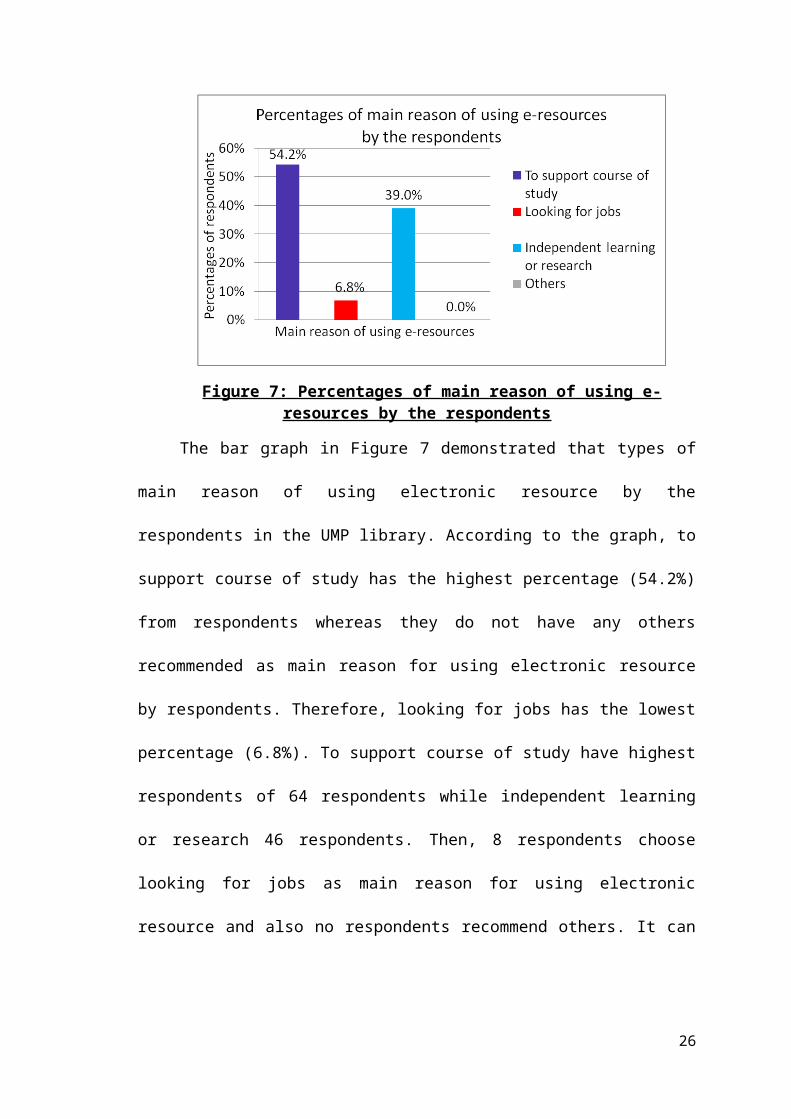
Figure 7: Percentages of main reason of using e-resources by the respondents
17
The bar graph in Figure 7 demonstrated that types of main reason of using
electronic resource by the respondents in the UMP library. According to the graph, to
support course of study has the highest percentage (54.2%) from respondents whereas
they do not have any others recommended as main reason for using electronic resource
by respondents. Therefore, looking for jobs has the lowest percentage (6.8%). To
support course of study have highest respondents of 64 respondents while independent
learning or research 46 respondents. Then, 8 respondents choose looking for jobs as
main reason for using electronic resource and also no respondents recommend others.
It can be concluded that most of the respondents using this electronic resources to
support course of study.
Percentages of using electronic resourcesamong UMP students
DailyOnce or twice a weekOnce every two weeksOnce a monthLess than once a month
37.5%
20%20%
17.5%
5%
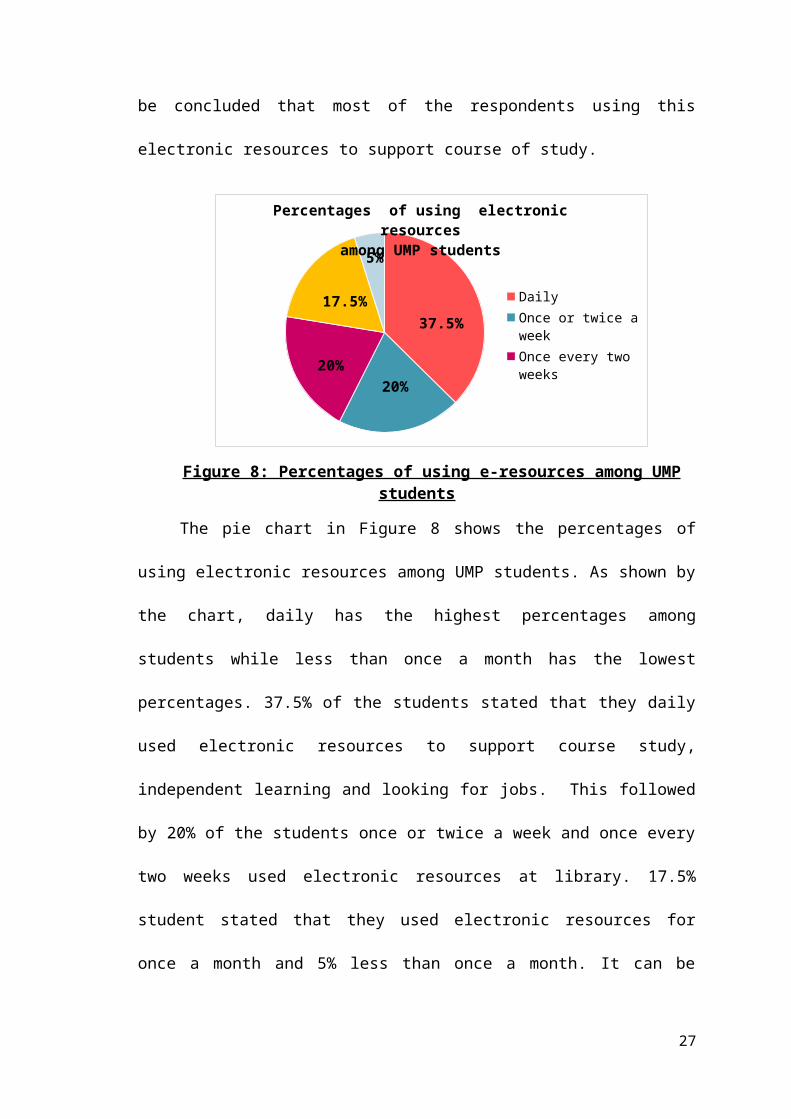
Figure 8: Percentages of using e-resources among UMP students
The pie chart in Figure 8 shows the percentages of using electronic resources
among UMP students. As shown by the chart, daily has the highest percentages among
students while less than once a month has the lowest percentages. 37.5% of the
students stated that they daily used electronic resources to support course study,
independent learning and looking for jobs. This followed by 20% of the students once
or twice a week and once every two weeks used electronic resources at library. 17.5%
student stated that they used electronic resources for once a month and 5% less than
18
once a month. It can be concluded that probably students daily used electronic
resources at the library.
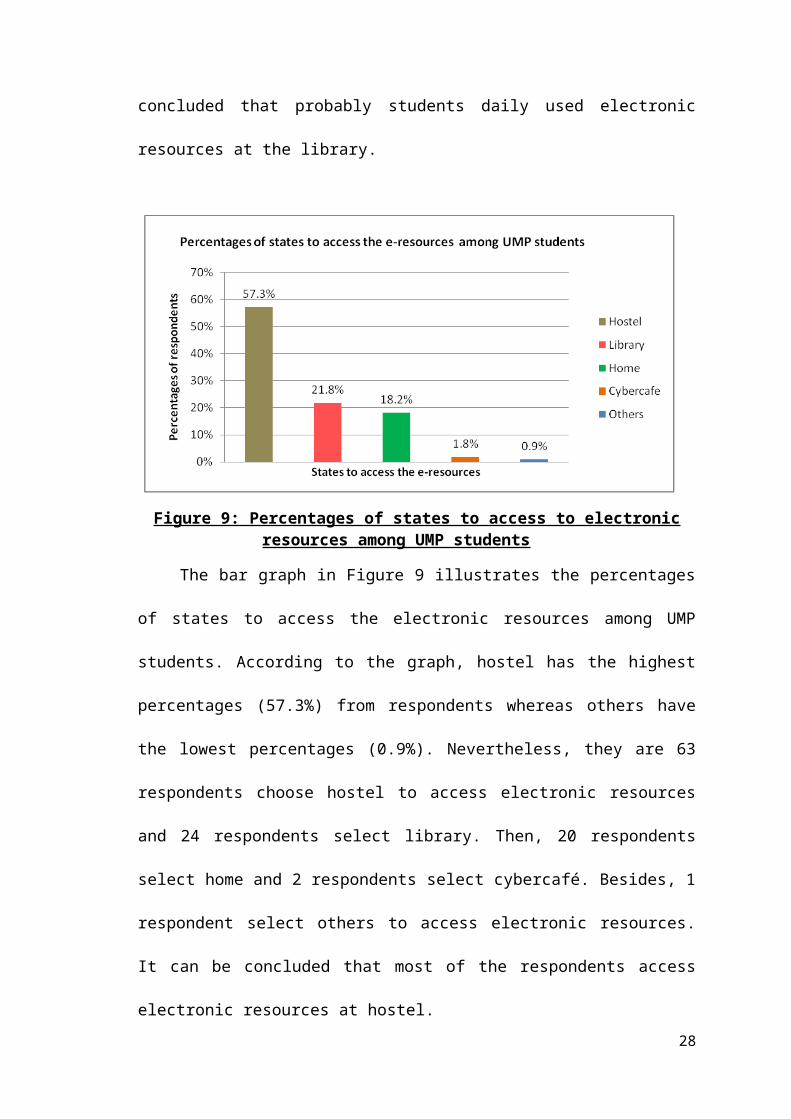
Figure 9: Percentages of states to access to electronic resources among UMP students
The bar graph in Figure 9 illustrates the percentages of states to access the
electronic resources among UMP students. According to the graph, hostel has the
highest percentages (57.3%) from respondents whereas others have the lowest
percentages (0.9%). Nevertheless, they are 63 respondents choose hostel to access
electronic resources and 24 respondents select library. Then, 20 respondents select
home and 2 respondents select cybercafé. Besides, 1 respondent select others to access
electronic resources. It can be concluded that most of the respondents access electronic
resources at hostel.
19
Yes
No
28.77%
71.23%
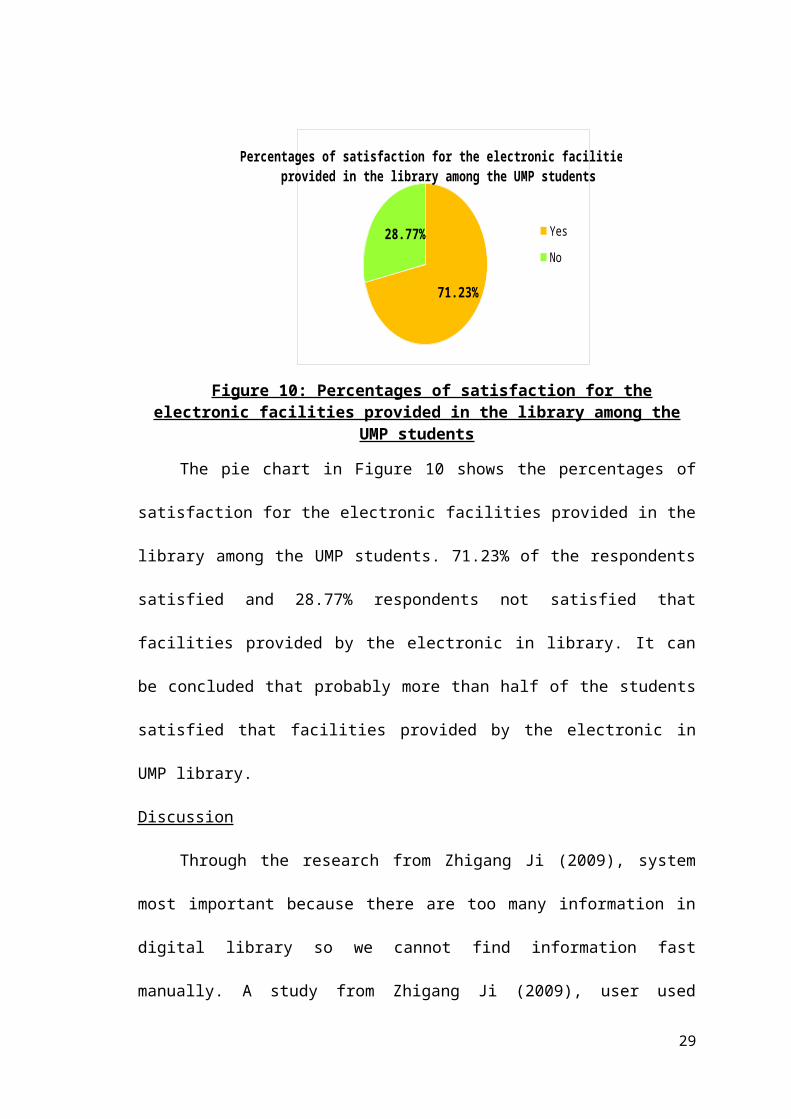
Percentages of satisfaction for the electronic facilities provided in the library among the UMP students
Figure 10: Percentages of satisfaction for the electronic facilities provided in the library among the UMP students
The pie chart in Figure 10 shows the percentages of satisfaction for the
electronic facilities provided in the library among the UMP students. 71.23% of the
respondents satisfied and 28.77% respondents not satisfied that facilities provided by
the electronic in library. It can be concluded that probably more than half of the
students satisfied that facilities provided by the electronic in UMP library.
Discussion
Through the research from Zhigang Ji (2009), system most important because
there are too many information in digital library so we cannot find information fast
manually. A study from Zhigang Ji (2009), user used electronic resources to find
information fast and accurate. Besides, a study by Wang Lan, Wang Ping (2009) can
be concluded that users daily using electronic resources to find information. A study
show that, users can access electronic resources anywhere they are not determine place
to use electronic resources. Through the research from Zhigang Ji (2009), most of the
respondents satisfied with the facilities provided by the electronic in the library.
From the findings, most of the UMP students used the electronic resources to
support their course study through websites. Besides, UMP students daily used
20
electronic resources at the library. The majority of UMP students are satisfied with the
electronic resources at the library.
4.4 Satisfaction level of students regarding to the library facilities
Figure 11: Percentages of frequent use of the library
The pie chart in Figure 11 shows the majority 28.75% of 80 respondents are use
the library once in a month while 22.5% respondents are once in a week. This is
followed by 20%, 15% and 8.75% of the students use the library once every two
weeks, once a month and two or three times a week. However, they were only 5% of
the respondents use the library less than once a month. According to the result, it can
be concluded that less students go to the library because of the student can access
information elsewhere.
21
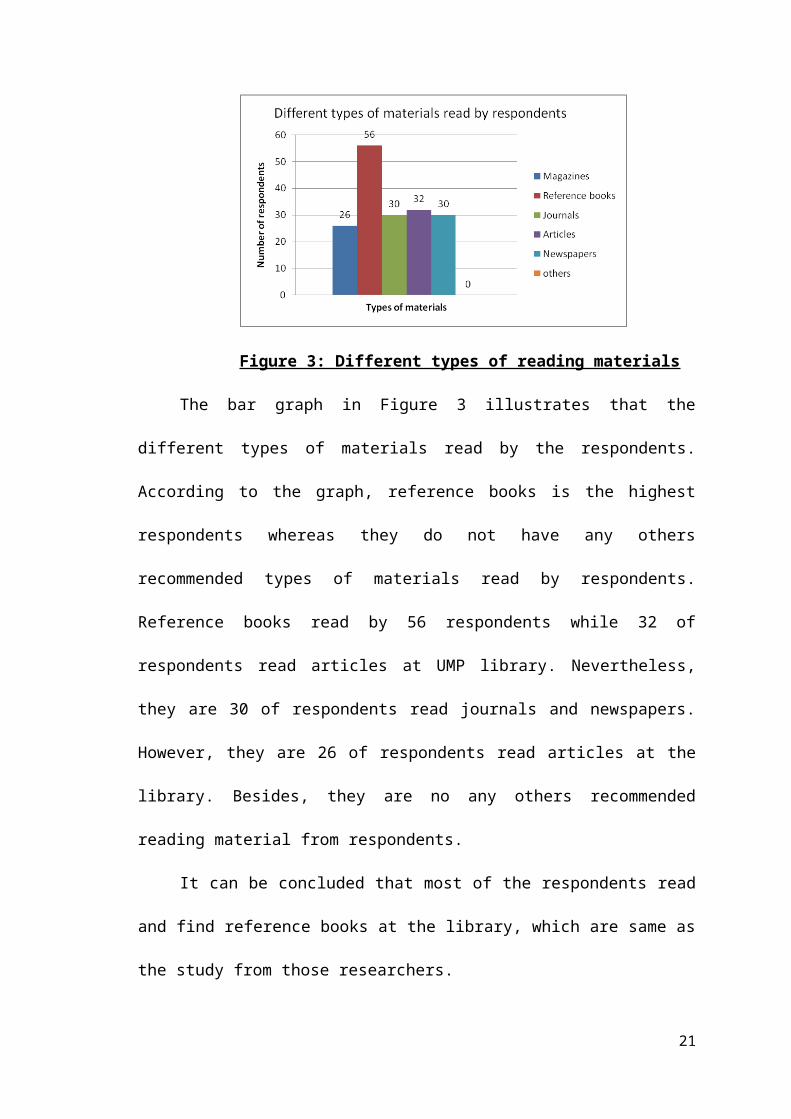
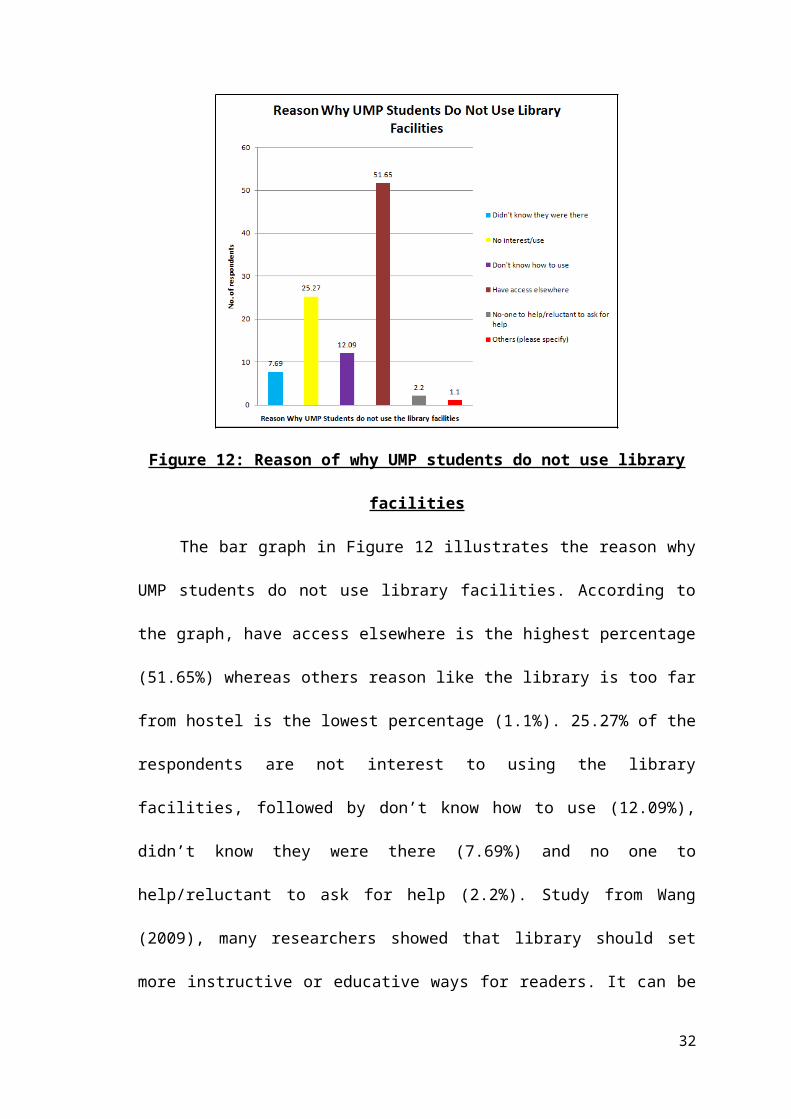
Figure 12: Reason of why UMP students do not use library facilities
The bar graph in Figure 12 illustrates the reason why UMP students do not use
library facilities. According to the graph, have access elsewhere is the highest
percentage (51.65%) whereas others reason like the library is too far from hostel is the
lowest percentage (1.1%). 25.27% of the respondents are not interest to using the
library facilities, followed by don’t know how to use (12.09%), didn’t know they were
there (7.69%) and no one to help/reluctant to ask for help (2.2%). Study from Wang
(2009), many researchers showed that library should set more instructive or educative
ways for readers. It can be concluded that most of the respondents not used the library
facilities because of have access elsewhere.
22
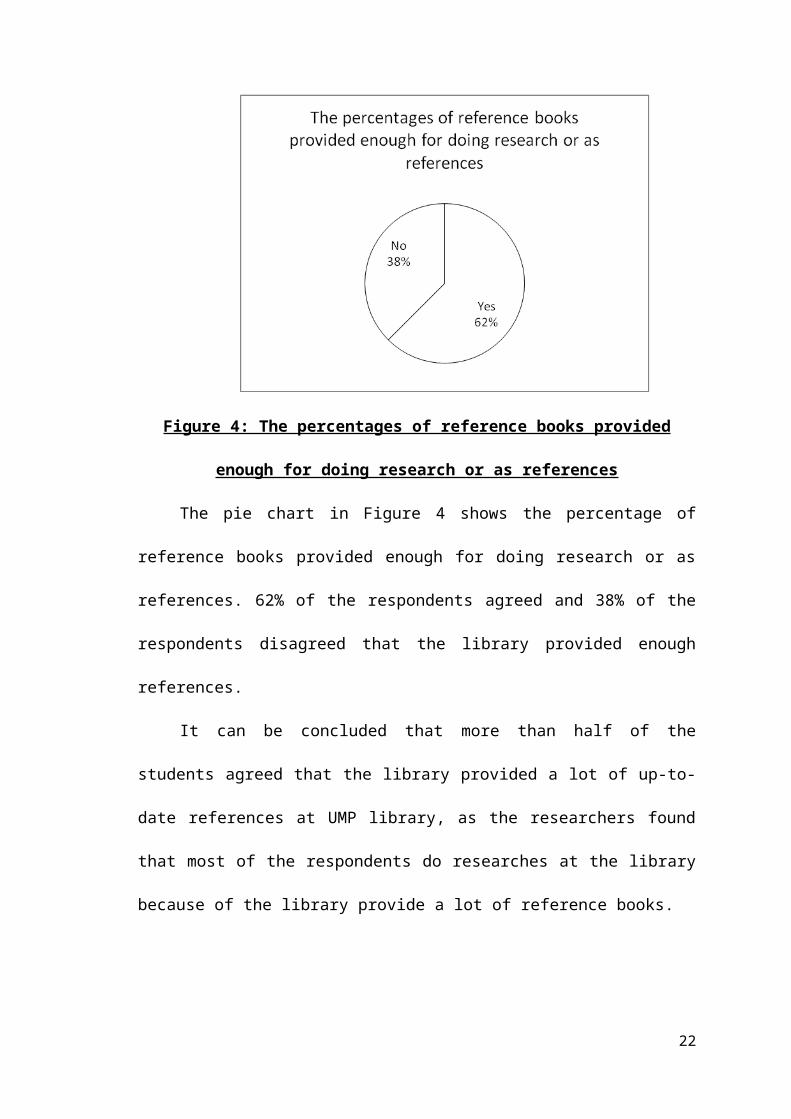
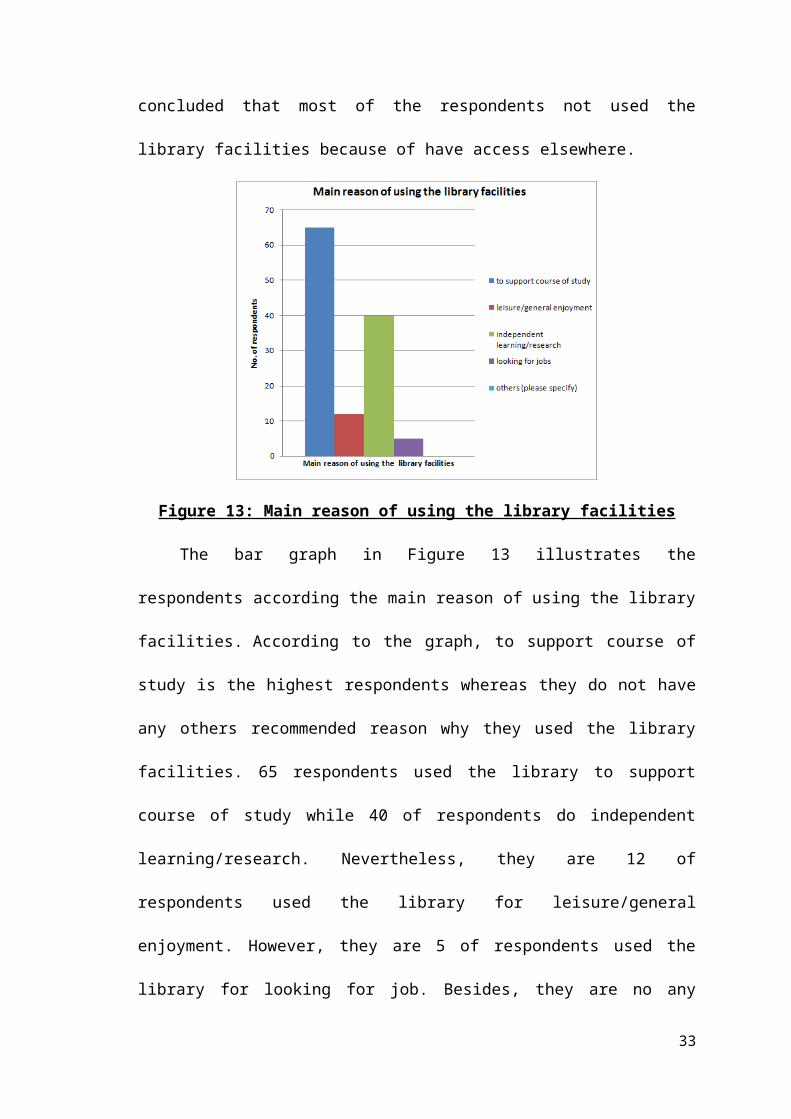
Figure 13: Main reason of using the library facilities
The bar graph in Figure 13 illustrates the respondents according the main reason
of using the library facilities. According to the graph, to support course of study is the
highest respondents whereas they do not have any others recommended reason why
they used the library facilities. 65 respondents used the library to support course of
study while 40 of respondents do independent learning/research. Nevertheless, they are
12 of respondents used the library for leisure/general enjoyment. However, they are 5
of respondents used the library for looking for job. Besides, they are no any others
recommended reason why the respondent using the library. It can be concluded that
most of the respondents used the library to support their course of study.
23

Space Of Reading
Cleanliness Lighting Furniture Ventilation0
1020304050607080
Percentages (%) Rate of Factor Contributed To-wards a Conductive Environment at UMP Library
Perc
enta
ges (
%)
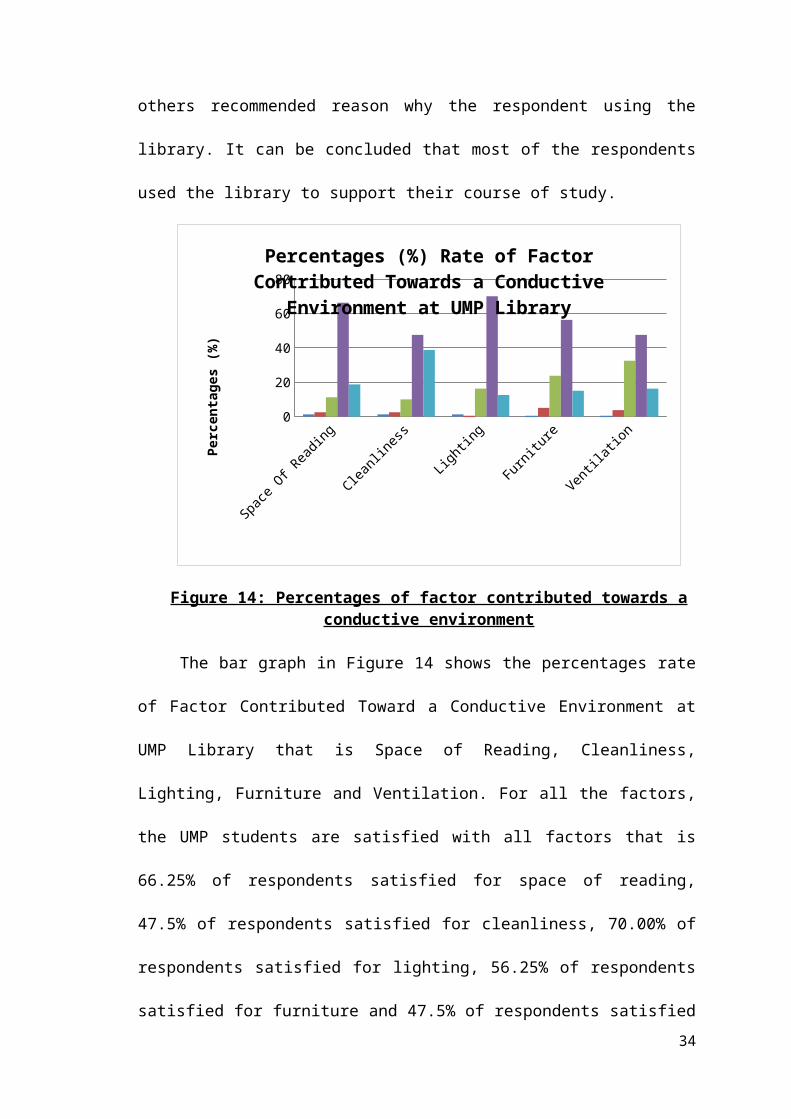
Figure 14: Percentages of factor contributed towards a conductive environment
The bar graph in Figure 14 shows the percentages rate of Factor Contributed
Toward a Conductive Environment at UMP Library that is Space of Reading,
Cleanliness, Lighting, Furniture and Ventilation. For all the factors, the UMP students
are satisfied with all factors that is 66.25% of respondents satisfied for space of
reading, 47.5% of respondents satisfied for cleanliness, 70.00% of respondents
satisfied for lighting, 56.25% of respondents satisfied for furniture and 47.5% of
respondents satisfied for ventilation. The lowest percentages are respondents choose
very unsatisfied for all factors that are 1.25 % for space of reading, cleanliness and
lighting. Otherwise, none of the respondents feel very unsatisfied with the furniture
and ventilation at the UMP library. It can be concluded that overall of the students
satisfied that the UMP library fulfill the factors of space of reading, cleanliness,
lighting, furniture and ventilation.
24
2.5 5 1.25 %
35 %
42.5 %
18.75 %
Percentages (%) of Satisfac-tion of UMP Students with
Library FacilitiesVery satisfiedUnsatisfiedNeutralSatisfiedVery Unsatisfied
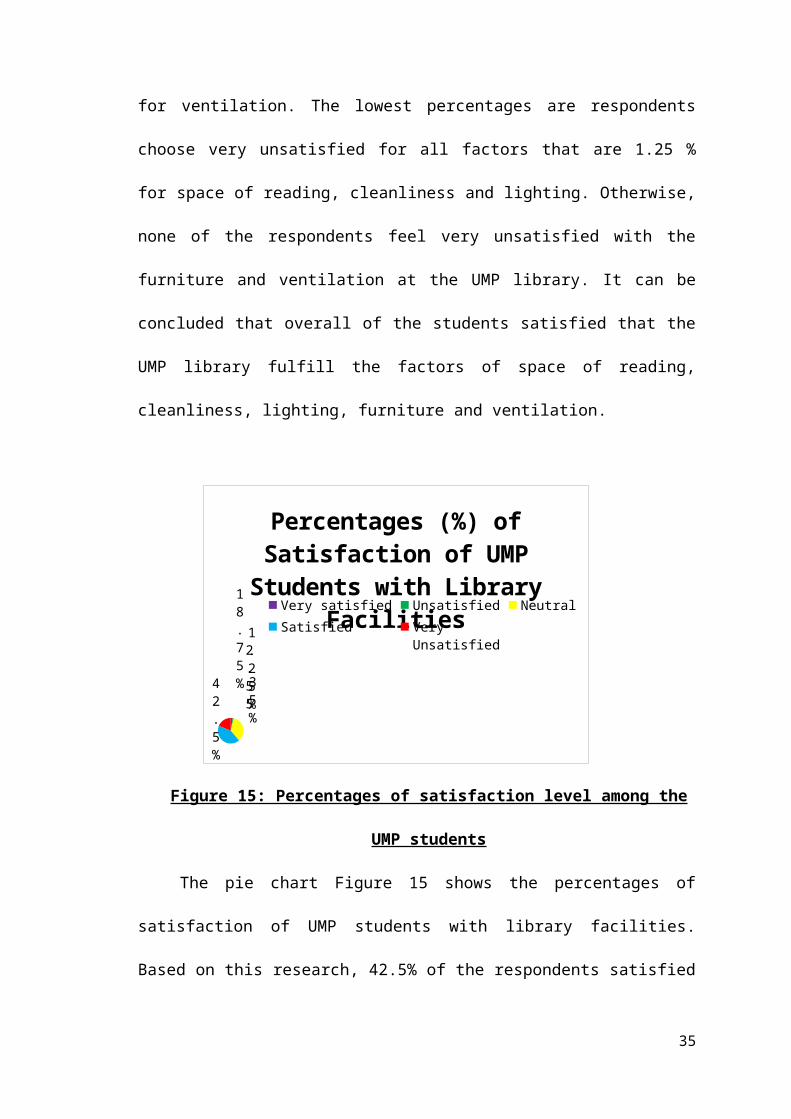
Figure 15: Percentages of satisfaction level among the UMP students
The pie chart Figure 15 shows the percentages of satisfaction of UMP students
with library facilities. Based on this research, 42.5% of the respondents satisfied with
library facilities while 1.25% of the respondents unsatisfied with the library facilities.
It can be concluded that most of the UMP students satisfied with library facilities.
Discussion
Based on research from Wang and Perng (2009), library managers need to
concern themselves with resource allocation in that they arrange their physical or
electronic collections and services in a way that will attract users to enter or use the
library. According to research from Wang (2007), the readers or students expect an
excellent university library with satisfying service quality. Improving the service
quality is the main aim for the staff of library and the university organization to make
sure the readers especially students satisfy and come frequently to the library.
From the findings, most of the UMP students used the library facilities for
support their course study. UMP library haves conductive environment for UMP’s
student. So, the majority of UMP students are satisfied with the library’s facilities.
25
5.0 Conclusions an d recommendations
In this chapter, the conclusions are based on the research questions of our study. Besides,
we will propose some recommendations to help the students fully utilize the library
facilities.
51 Conclusions
The conclusion that we derived from our study are:-
5.1.1 Types of library facilities
It can be concluded that the majority of the respondents preferred to find references
and do researches at the library, as it provided enough computers and references.
Besides, the library facilities such as borrowing or returning books, internet access,
discussion rooms and computers are the most commonly used by the students.
5.1.2 Types of electronic resources
It can be concluded that the majority of the respondents used electronic resources
to support course of study at the library. Besides, the types of electronic resources
such as system, website and digital collections also the students daily used
electronic resources at the library.
5.1.3 Satisfaction level of students regarding to the library facilities
It can be concluded that the majority of the respondents are satisfied with the
library facilities. Besides, the respondents also are satisfied with the environment
of the UMP's library.
52 Recommendations
In order to help the students fully utilize the library facilities, we suggested that the
library should improve, do maintenance, and always check that the e-library system is
always available for the students to access it. Besides, they are a lot of students find
references and do researches at the library, so it should always keep track with the up-
26
to-date reference books. So that, the students will feel comfortable with the
environment and they will fully utilize the facilities provided at the library.
27
6.0 References
Cao, H. (2010). An Approach to Academic Library Service Quality Evaluation Based on Fuzzy Linguistic Quantifier. International Conference on Optics, Photonics and Energy Engineering, Shijiazhuang, China. Retrieved August 17, 2010, from IEEEXplore.
Dickenson, D. (2006). How Academic Libraries Help Faculty Teach and Students Learn. Library Research Service , 1-100.
Ji, Z. (2009). Providing Better Services of Digital Library Based on User Experience. International Conference on Test and Measurement , Handan, China. Retrieved August 07, 2010, from IEEEXplore.
Lan, W., & Ping, W. (2009). The Research of Personalized Information Services Based on the Digital Library. World Congress on Software Engineering Journal , 1-4.
Lonsdale, M. (2003). Impact of School Libraries on Student Achievement. Australian Council for Educational Research, 1-40.
Ma, Y., Clegg, W., & O'Brien, A. (2006). Digital Library Education: The Current Status. Institute of Electrical and Electronics Engineers , 1-10.
Perera, P. (2009). A Study on the pattern of usage of library facilities at the Medical. Journal of the University Librarians Association of Sri Lanka , 1-21.
Rosa, C. D., Cantrell, J., Hawk, J., & Wilson, A. (2005). College Students’ Perceptions of Libraries and Information Resources. Online Computer Library Center , 1-16.
Simpson, J., & Weiner, E. (Eds.). (2009). New Oxford English Dictionary (3rd ed.). Oxford University Press.
Smith, E. G. (2001). Texas School Libraries: Standards, Resources, Services, and Students Performance. Journal of Texas State Library and Archives Commission, 1-212.
Stevenson, A., & Lindberg, C. A. (Eds.). (2008). New Oxford American (3rd ed.). Oxford University Press.
Waldman, M. (2003). Freshmen's use of library electronic resources and self-efficacy. Information Research. Retrieved August 7, 2010, from http://informationr.net/ir/8-2/paper150.html
Wang, K. (2007). Users’ Evaluation on Library Service Quality: A LibQUAL+TM Empirical Study. Institute of Electrical and Electronics Engineers, 1-5.
Wang, S.L., Wu, C.H., Perng, C., & Tsai, J.T. (2009). An Examination of Library Use for Improving Services on the IT Impact. International Conference on Virtual
28
Environments, Human-Computer Interfaces and Measurements Systems, Hong Kong, China. Retrieved August 06, 2010, from IEEEXplore.
29
7.0 AppendicesA. Questionnaire
Questionnaire on UMP library facilities
Purpose:The purpose of this questionnaire is to identify the types of UMP library facilities and to determine the different types of electronic resources that are commonly used by the UMP students. The questionnaire is also to investigate the satisfaction level of UMP students about the UMP library facilities. Thank you for taking the time to fill in this questionnaire.
Instructions:1. Please answer all the questions below.2. Please tick one answer only, except otherwise stated.
SECTION A: Demographic1. Gender:
Male Female
2. Course: BCS BCN BCG
3. Year: 1st year 2nd year 3rd year
SECTION B: Library Facilities1. Which library facilities do you use most frequently? (can tick more than one)
self-checked machine, book drop (borrow books) internet access discussion room computer e-library Others (please specify):______________________________________
2. How often do you use the library computer system to locate books or other materials? Often Sometimes Rarely Never
30
3. What type of materials do you usually read at the library? Magazine Reference books Journals Articles Newspaper Others (please specify) :______________________________________
4. Are the books at the library enough for you to do a research or to use as references? Yes No
5. Are the computers provided enough in the library? Yes No
SECTION C: Electronic Resources1. Which electronic resources do you use?
System Website Digital collections Others (please specify) :_____________________________________
2. What is your main reason for using this electronic resource? To support course of study Looking for jobs Independent learning / research Others (please specify) :______________________________________
3. How often do you use the electronic resources? Daily Once or twice a week Once every two weeks Once a month Less than once a month
4. If you have access to use electronic resources elsewhere, please state where: Hostel Library Home Cybercafé Others (please specify) :______________________________________
5. Are you satisfied with the facilities provided by the electronic resources in UMP library?
Yes No
31

SECTION D: Satisfaction Level of UMP students1. How often do you use the library, on average
Less than once a month Once a month Once every two weeks Once a week Two or three times a week Daily
2. If you do not use the library facilities, please state reason… Didn’t know they were there No interest/use Don’t know how to use Have access elsewhere No-one to help /reluctant to ask for help Others (please specify) :______________________________________
3. What is your main reason for using the library facilities? to support course of study leisure/general enjoyment independent learning/research looking for jobs Others (please specify) :_______________________________________
4. Please rate each of the factors below (which contributed towards a conducive environment at the library) based on the scale given (please tick one).
Very unsatisfied Unsatisfied Neutral Satisfied Very satisfiedSpace of readingCleanlinessLightingFurnitureVentilation
5. Overall, how satisfied are you with the facilities provided by the library? Very unsatisfied Unsatisfied Neutral Satisfied Very satisfied
If you have any other comments, please add them below:-____________________________________________________________________________________________________________________________________________________________________________________________________________________________________________________________________________________________________________
32
B. Code Book
Questionnaire on UMP library facilities
Purpose:The purpose of this questionnaire is to identify the types of UMP library facilities and to determine the different types of electronic resources that are commonly used by the UMP students. The questionnaire is also to investigate the satisfaction level of UMP students about the UMP library facilities. Thank you for taking the time to fill in this questionnaire.
Instructions:3. Please answer all the questions below.4. Please tick one answer only, except otherwise stated.
SECTION A: Demographic1. Gender: (V1)
Male (1) Female (2)
2. Course: (V2) BCS (1) BCN (2) BCG (3)
3. Year: (V3) 1st year (1) 2nd year (2) 3rd year (3)
SECTION B: Library Facilities1. Which library facilities do you use most frequently? (can tick more than one)
self-checked machine, book drop (borrow books) (V4) internet access (V5) discussion room (V6) computer (V7) e-library (V8) Others (please specify):______________________________________ (V9)
2. How often do you use the library computer system to locate books or other materials? (V10) Often (1) Sometimes (2) Rarely (3) Never (4)
33
3. What type of materials do you usually read at the library? Magazine (V11) Reference books (V12) Journals (V13) Articles (V14) Newspaper (V15) Others (please specify) :______________________________________ (V16)
4. Are the books at the library enough for you to do a research or to use as references? (V17) Yes (1) No (2)
5. Are the computers provided enough in the library? (V18) Yes (1) No (2)
SECTION C: Electronic Resources1. Which electronic resources do you use?
System (V19) Website (V20) Digital collections (V21) Others (please specify) :_____________________________________ (V22)
2. What is your main reason for using this electronic resource? To support course of study (V23) Looking for jobs (V24) Independent learning / research (V25) Others (please specify) :______________________________________ (V26)
3. How often do you use the electronic resources? (V27) Daily (1) Once or twice a week (2) Once every two weeks (3) Once a month (4) Less than once a month (5)
4. If you have access to use electronic resources elsewhere, please state where: Hostel (V28) Library (V29) Home (V30) Cybercafé (V31) Others (please specify) :______________________________________ (V32)
5. Are you satisfied with the facilities provided by the electronic resources in UMP library? (V33)
Yes (1) No (2)
34
SECTION D: Satisfaction Level of UMP students1. How often do you use the library, on average (V34)
Less than once a month (1) Once a month (2) Once every two weeks (3) Once a week (4) Two or three times a week (5) Daily (6)
2. If you do not use the library facilities, please state reason… Didn’t know they were there (V35) No interest/use (V36) Don’t know how to use (V37) Have access elsewhere (V38) No-one to help /reluctant to ask for help (V39) Others (please specify) :______________________________________ (V40)
3. What is your main reason for using the library facilities? to support course of study (V41) leisure/general enjoyment (V42) independent learning/research (V43) looking for jobs (V44) Others (please specify) :_______________________________________ (V45)
4. Please rate each of the factors below (which contributed towards a conducive environment at the library) based on the scale given (please tick one).
Very unsatisfied(1)
Unsatisfied(2)
Neutral(3)
Satisfied(4)
Very satisfied(5)
Space of reading (V46)Cleanliness (V47)Lighting (V48)Furniture (V49)Ventilation (V50)
5. Overall, how satisfied are you with the facilities provided by the library? (V51) Very unsatisfied (1) Unsatisfied (2) Neutral (3) Satisfied (4) Very satisfied (5)
If you have any other comments, please add them below: - (V52)____________________________________________________________________________________________________________________________________________________________________________________________________________________________________________________________________________________________________________
35
C. Coding Sheet
36