Embed Size (px)
Citation preview

f
NORTH CAROLINA AGRICULTURAL AND TECHNICAL STATE UNIVERSITY
GREENSBORO, NORTH CAROLINA FINANCIAL STATEMENT AUDIT REPORT FOR THE YEAR ENDED JUNE 30, 2019
A CONSTITUENT INSTITUTION OF THE UNIVERSITY OF NORTH CAROLINA SYSTEM AND A COMPONENT UNIT OF THE STATE OF NORTH CAROLINA
STATE OF NORTH CAROLINA OFFICE OF THE STATE AUDITOR
BETH A. WOOD, CPA
STATE OF NORTH CAROLINA Office of the State Auditor
Beth A. Wood, CPA
State Auditor
2 S. Salisbury Street 20601 Mail Service Center
Raleigh, NC 27699-0600 Telephone: (919) 807-7500
Fax: (919) 807-7647 https://www.auditor.nc.gov
AUDITOR’S TRANSMITTAL
The Honorable Roy Cooper, Governor The General Assembly of North Carolina Board of Trustees, North Carolina Agricultural and Technical State University
We have completed a financial statement audit of North Carolina Agricultural and Technical State University for the year ended June 30, 2019, and our audit results are included in this report. You will note from the independent auditor’s report that we determined that the financial statements are presented fairly in all material respects.
The results of our tests disclosed no deficiencies in internal control over financial reporting that we consider to be material weaknesses in relation to our audit scope or any instances of noncompliance or other matters that are required to be reported under Government Auditing Standards.
North Carolina General Statutes require the State Auditor to make audit reports available to the public. Copies of audit reports issued by the Office of the State Auditor may be obtained through one of the options listed in the back of this report.
Beth A. Wood, CPA State Auditor
TABLE OF CONTENTS
PAGE
INDEPENDENT AUDITOR’S REPORT ................................................................ 1
MANAGEMENT’S DISCUSSION AND ANALYSIS .................................................. 3
BASIC FINANCIAL STATEMENTS
UNIVERSITY EXHIBITS A-1 STATEMENT OF NET POSITION .................................................. 11 A-2 STATEMENT OF REVENUES, EXPENSES, AND CHANGES IN NET
POSITION ................................................................................ 13 A-3 STATEMENT OF CASH FLOWS ................................................... 14
COMPONENT UNIT EXHIBITS B-1 CONSOLIDATED STATEMENT OF FINANCIAL POSITION ................ 16 B-2 CONSOLIDATED STATEMENT OF ACTIVITIES ............................... 17
NOTES TO THE FINANCIAL STATEMENTS ................................................. 18
REQUIRED SUPPLEMENTARY INFORMATION
C-1 SCHEDULE OF THE PROPORTIONATE SHARE OF THE NET PENSION LIABILITY (COST-SHARING, MULTIPLE-EMPLOYER, DEFINED BENEFIT PENSION PLAN) ............................................................................. 60
C-2 SCHEDULE OF UNIVERSITY CONTRIBUTIONS (COST-SHARING, MULTIPLE-EMPLOYER, DEFINED BENEFIT PENSION PLAN) ............... 61
NOTES TO REQUIRED SUPPLEMENTARY INFORMATION (COST-SHARING, MULTIPLE-EMPLOYER, DEFINED BENEFIT PENSION PLAN) .................... 62
C-3 SCHEDULE OF THE PROPORTIONATE SHARE OF THE NET OPEB LIABILITY OR ASSET (COST-SHARING, MULTIPLE-EMPLOYER, DEFINED BENEFIT OPEB PLANS) ................................................... 63
C-4 SCHEDULE OF UNIVERSITY CONTRIBUTIONS (COST-SHARING, MULTIPLE-EMPLOYER, DEFINED BENEFIT OPEB PLANS) ................. 64
NOTES TO REQUIRED SUPPLEMENTARY INFORMATION (COST-SHARING, MULTIPLE-EMPLOYER, DEFINED BENEFIT OPEB PLANS) ...................... 65
INDEPENDENT AUDITOR’S REPORT ON INTERNAL CONTROL OVER FINANCIAL REPORTING AND ON COMPLIANCE AND OTHER MATTERS BASED ON AN AUDIT OF FINANCIAL STATEMENTS PERFORMED IN ACCORDANCE WITH GOVERNMENT AUDITING STANDARDS.................................................. 66
ORDERING INFORMATION ............................................................................ 68
Article V, Chapter 147 of the North Carolina General Statutes, gives the Auditor broad powers to examine all books, records, files, papers, documents, and financial affairs of every state agency and any organization that receives public funding. The Auditor also has the power to summon people to produce records and to answer questions under oath.
Beth A. Wood, CPA
State Auditor
INDEPENDENT AUDITOR’S REPORT
STATE OF NORTH CAROLINA Office of the State Auditor
Beth A. Wood, CPA
State Auditor
1
2 S. Salisbury Street 20601 Mail Service Center
Raleigh, NC 27699-0600 Telephone: (919) 807-7500
Fax: (919) 807-7647 https://www.auditor.nc.gov
INDEPENDENT AUDITOR’S REPORT
Board of Trustees North Carolina Agricultural and Technical State University Greensboro, North Carolina
Report on the Financial Statements We have audited the accompanying financial statements of North Carolina Agricultural and Technical State University (University), a constituent institution of the multi-campus University of North Carolina System, which is a component unit of the State of North Carolina, and its discretely presented component unit, as of and for the year ended June 30, 2019, and the related notes to the financial statements, which collectively comprise the University’s basic financial statements as listed in the table of contents.
Management’s Responsibility for the Financial Statements Management is responsible for the preparation and fair presentation of these financial statements in accordance with accounting principles generally accepted in the United States of America; this includes the design, implementation, and maintenance of internal control relevant to the preparation and fair presentation of financial statements that are free from material misstatement, whether due to fraud or error.
Auditor’s Responsibility Our responsibility is to express opinions on these financial statements based on our audit. We did not audit the consolidated financial statements of The North Carolina A&T Real Estate Foundation, Inc., the University’s discretely presented component unit. Those statements were audited by other auditors, whose report has been furnished to us, and our opinions, insofar as they relate to the amounts included for the discretely presented component unit, are based solely on the report of the other auditors. We conducted our audit in accordance with auditing standards generally accepted in the United States of America and the standards applicable to financial audits contained in Government Auditing Standards, issued by the Comptroller General of the United States. Those standards require that we plan and perform the audit to obtain reasonable assurance about whether the financial statements are free from material misstatement. The consolidated financial statements of The North Carolina A&T Real Estate Foundation, Inc. were not audited in accordance with Government Auditing Standards.
An audit involves performing procedures to obtain audit evidence about the amounts and disclosures in the financial statements. The procedures selected depend on the auditor’s judgment, including the assessment of the risks of material misstatement of the financial statements, whether due to fraud or error. In making those risk assessments, the auditor considers internal control relevant to the University’s preparation and fair presentation of the
2
INDEPENDENT AUDITOR’S REPORT
financial statements in order to design audit procedures that are appropriate in the circumstances, but not for the purpose of expressing an opinion on the effectiveness of the University’s internal control. Accordingly, we express no such opinion. An audit also includes evaluating the appropriateness of accounting policies used and the reasonableness of significant accounting estimates made by management, as well as evaluating the overall presentation of the financial statements.
We believe that the audit evidence we have obtained is sufficient and appropriate to provide a basis for our audit opinions.
Opinions In our opinion, based on our audit and the report of the other auditors, the financial statements referred to above present fairly, in all material respects, the respective financial position of North Carolina Agricultural and Technical State University, and its discretely presented component unit, as of June 30, 2019, and the respective changes in financial position and, where applicable, cash flows thereof for the year then ended in accordance with accounting principles generally accepted in the United States of America.
Other Matters – Required Supplementary Information Accounting principles generally accepted in the United States of America require that the Management’s Discussion and Analysis and other required supplementary information, as listed in the table of contents, be presented to supplement the basic financial statements. Such information, although not a part of the basic financial statements, is required by the Governmental Accounting Standards Board who considers it to be an essential part of financial reporting for placing the basic financial statements in an appropriate operational, economic, or historical context. We have applied certain limited procedures to the required supplementary information in accordance with auditing standards generally accepted in the United States of America, which consisted of inquiries of management about the methods of preparing the information and comparing the information for consistency with management’s responses to our inquiries, the basic financial statements, and other knowledge we obtained during our audit of the basic financial statements. We do not express an opinion or provide any assurance on the information because the limited procedures do not provide us with sufficient evidence to express an opinion or provide any assurance.
Other Reporting Required by Government Auditing Standards In accordance with Government Auditing Standards, we have also issued our report dated December 12, 2019 on our consideration of the University’s internal control over financial reporting and on our tests of its compliance with certain provisions of laws, regulations, contracts, and grant agreements and other matters. The purpose of that report is to describe the scope of our testing of internal control over financial reporting and compliance and the results of that testing, and not to provide an opinion on internal control over financial reporting or on compliance. That report is an integral part of an audit performed in accordance with Government Auditing Standards in considering the University’s internal control over financial reporting and compliance.
Beth A. Wood, CPA State Auditor
Raleigh, North Carolina
December 12, 2019
MANAGEMENT’S DISCUSSION AND
ANALYSIS
3
MANAGEMENT’S DISCUSSION AND ANALYSIS
Introduction North Carolina Agricultural and Technical State University (University) provides the following discussion and analysis in order to give the reader a summary of its financial activities and to aid in understanding the financial statements for the fiscal year ended June 30, 2019. Comparative data for the year ended June 30, 2018 is also included. All information provided has been prepared by University staff for the purpose of identifying significant transactions, trends, and events that have had an impact on the fiscal health of the University and may continue to exert influence in future years. To properly use and interpret the information provided in this discussion and analysis, it is recommended that it be read in conjunction with the related financial statements and the accompanying Notes to the Financial Statements for further explanation and details.
The Financial Statements The financial statements for the University include the Statement of Net Position, the Statement of Revenues, Expenses, and Changes in Net Position, and the Statement of Cash Flows.
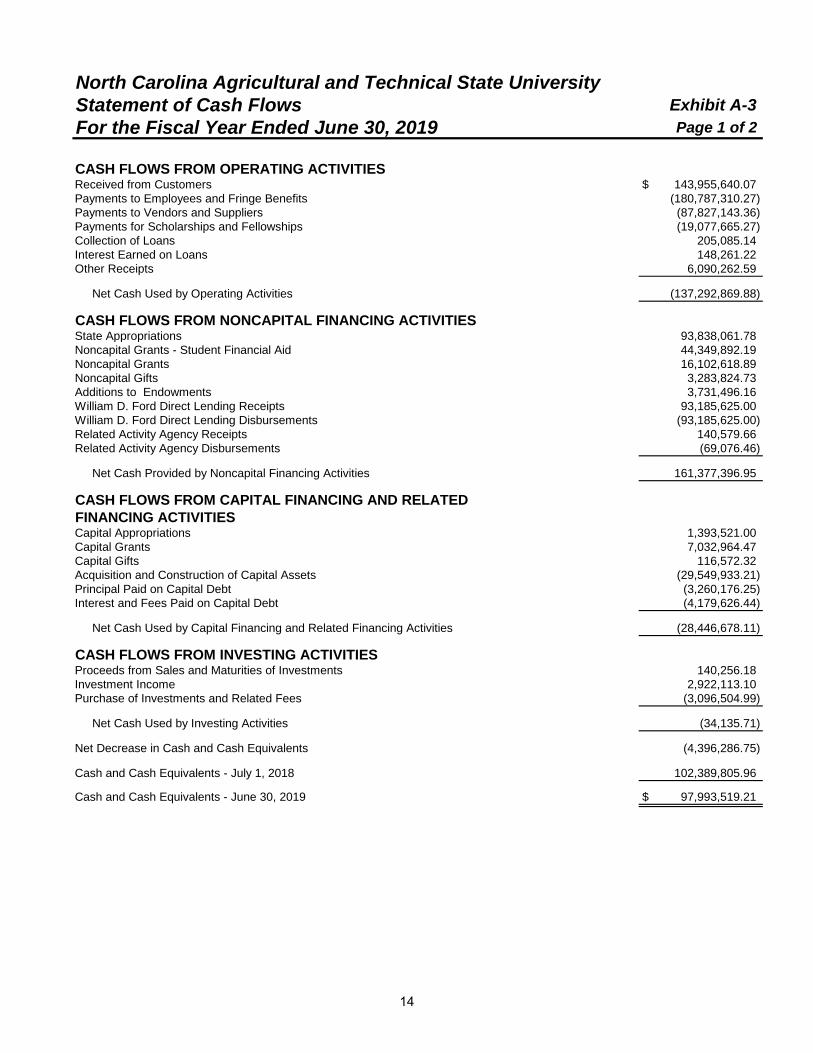
Each statement has been prepared in accordance with Governmental Accounting Standards Board (GASB) Statement No. 35, Basic Financial Statements - and Management’s Discussion and Analysis - for Public Colleges and Universities, and reflects an economic resource measurement focus and the accrual basis of accounting. The Statement of Cash Flows provides information relative to the University’s sources and uses of cash for operating activities, noncapital financing activities, capital and related financing activities, and investing activities. The statement provides a reconciliation of beginning cash balances to ending cash balances and is representative of the activity reported on the Statement of Revenues, Expenses, and Changes in Net Position as adjusted for changes in the beginning and ending balances of noncash accounts on the Statement of Net Position. For the purpose of this discussion, we will address the Statement of Net Position and the Statement of Revenues, Expenses, and Changes in Net Position using condensed versions. The full-length versions of each of the financial statements are presented as exhibits immediately following the management’s discussion and analysis.
In addition to the University’s financial statements and accompanying notes, information for a component unit is presented. The Consolidated Statement of Financial Position, Consolidated Statement of Activities, and certain notes for The North Carolina A&T Real Estate Foundation, Inc. (Foundation) are discretely presented alongside the University financial statements; however, the component unit is not included in management’s discussion and analysis. More information describing the relationship between the University and its discretely presented component unit can be found in Note 1A, Significant Accounting Policies - Financial Reporting Entity.
Statement of Net Position The Statement of Net Position presented below summarizes the financial wellness of the University at June 30, 2019. It presents the financial position of the University as defined by the balances of assets, deferred outflows of resources, liabilities, deferred inflows of resources, and net position. Assets and liabilities are classified as current or noncurrent. Current assets and liabilities include those resources and obligations that pertain to current operating requirements. Noncurrent assets and liabilities include those resources and obligations that pertain to future operating requirements.
4
MANAGEMENT’S DISCUSSION AND ANALYSIS
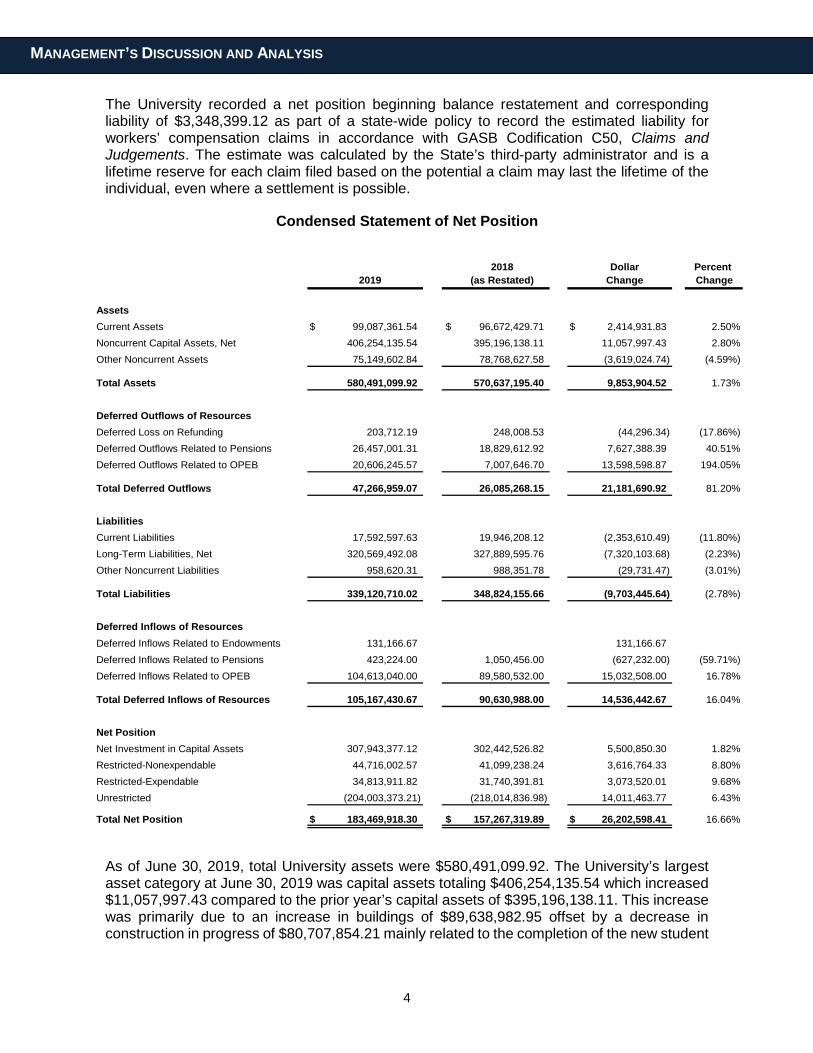
The University recorded a net position beginning balance restatement and corresponding liability of $3,348,399.12 as part of a state-wide policy to record the estimated liability for workers’ compensation claims in accordance with GASB Codification C50, Claims and Judgements. The estimate was calculated by the State’s third-party administrator and is a lifetime reserve for each claim filed based on the potential a claim may last the lifetime of the individual, even where a settlement is possible.
Condensed Statement of Net Position
2018 Dollar Percent
2019 (as Restated) Change Change
AssetsCurrent Assets $ 99,087,361.54 $ 96,672,429.71 $ 2,414,931.83 2.50%Noncurrent Capital Assets, Net 406,254,135.54 395,196,138.11 11,057,997.43 2.80%Other Noncurrent Assets 75,149,602.84 78,768,627.58 (3,619,024.74) (4.59%)
Total Assets 580,491,099.92 570,637,195.40 9,853,904.52 1.73%
Deferred Outflows of ResourcesDeferred Loss on Refunding 203,712.19 248,008.53 (44,296.34) (17.86%)Deferred Outflows Related to Pensions 26,457,001.31 18,829,612.92 7,627,388.39 40.51%Deferred Outflows Related to OPEB 20,606,245.57 7,007,646.70 13,598,598.87 194.05%
Total Deferred Outflows 47,266,959.07 26,085,268.15 21,181,690.92 81.20%
LiabilitiesCurrent Liabilities 17,592,597.63 19,946,208.12 (2,353,610.49) (11.80%)Long-Term Liabilities, Net 320,569,492.08 327,889,595.76 (7,320,103.68) (2.23%)Other Noncurrent Liabilities 958,620.31 988,351.78 (29,731.47) (3.01%)
Total Liabilities 339,120,710.02 348,824,155.66 (9,703,445.64) (2.78%)
Deferred Inflows of ResourcesDeferred Inflows Related to Endowments 131,166.67 131,166.67 Deferred Inflows Related to Pensions 423,224.00 1,050,456.00 (627,232.00) (59.71%)Deferred Inflows Related to OPEB 104,613,040.00 89,580,532.00 15,032,508.00 16.78%
Total Deferred Inflows of Resources 105,167,430.67 90,630,988.00 14,536,442.67 16.04%
Net PositionNet Investment in Capital Assets 307,943,377.12 302,442,526.82 5,500,850.30 1.82%Restricted-Nonexpendable 44,716,002.57 41,099,238.24 3,616,764.33 8.80%Restricted-Expendable 34,813,911.82 31,740,391.81 3,073,520.01 9.68%Unrestricted (204,003,373.21) (218,014,836.98) 14,011,463.77 6.43%
Total Net Position $ 183,469,918.30 $ 157,267,319.89 $ 26,202,598.41 16.66%
As of June 30, 2019, total University assets were $580,491,099.92. The University’s largest asset category at June 30, 2019 was capital assets totaling $406,254,135.54 which increased $11,057,997.43 compared to the prior year’s capital assets of $395,196,138.11. This increase was primarily due to an increase in buildings of $89,638,982.95 offset by a decrease in construction in progress of $80,707,854.21 mainly related to the completion of the new student
5
MANAGEMENT’S DISCUSSION AND ANALYSIS
center. Current assets increased $2,414,931.83 primarily due to an increase in unrestricted cash resulting from increased enrollment and rates for student auxiliaries.
Other noncurrent assets decreased during the year by $3,619,024.74 primarily due to a decrease in restricted cash and cash equivalents of $10,234,105.79 offset by an increase in endowment investments of $6,872,608.50. The decrease in noncurrent restricted cash was primarily from expenditures related to the construction of the new student center. Endowment investments increased as a result of a strong financial market performance as well as receiving $3,731,496.16 in additions to endowments during the year.
Total deferred outflows of resources increased $21,181,690.92 due to increases in deferred outflows related to pensions and deferred outflows related to other postemployment benefits (OPEB) totaling $21,225,987.26. The increase in deferred outflows related to pensions was due to changes in actuarial assumptions, the difference between actual and expected experience, as well as University contributions to the defined pension plan for fiscal year 2019. The increase in deferred outflows related to OPEB was primarily due to changes in proportion and differences between the University’s contributions and proportionate share of contributions. For more information about the University’s deferred outflows related to pensions and other postemployment benefits, refer to Notes 13 and 14 of the Notes to the Financial Statements.
University liabilities totaled $339,120,710.02 at June 30, 2019 compared to $348,824,155.66 per the prior year as restated (refer to Note 19 of the Notes to the Financial Statements for details), a decrease of $9,703,445.64. This decrease is primarily due to reductions in long-term liabilities of $7,320,103.68 and current liabilities of $2,353,610.49. Long-term liabilities decreased primarily due to a net decrease in net pension liability and net OPEB liability of $4,019,067.00 based on changes in actuarial valuations. The decrease in long-term liabilities was also attributed to a decrease in outstanding bonds payable and notes from direct borrowings of $3,481,918.52 due to principal payments made during the year. Current liabilities decreased primarily due to a decrease in current accounts payable and accrued liabilities of $3,911,326.11 offset by an increase in current workers’ compensation liability of $796,399.00 and unearned revenue of $632,937.00. The decrease in accounts payable and accrued liabilities was primarily due to decreases in contract retainage and accounts payable for construction projects.
Total deferred inflows of resources increased $14,536,442.67 primarily due to an increase in deferred inflows related to OPEB of $15,032,508.00 resulting from changes in actuarial assumptions. For more information about the University’s deferred inflows related to other postemployment benefits, refer to Note 14 of the Notes to the Financial Statements.
Net position at year-end was $183,469,918.30, an increase of $26,202,598.41 over the prior year, as restated (refer to Note 19 of the Notes to the Financial Statements for details) for workers’ compensation liability. The increase was composed of the following: an increase of $5,500,850.30 in net investment in capital assets, increases in nonexpendable and expendable net position of $3,616,764.33 and $3,073,520.01, respectively; and an increase of $14,011,463.77 in unrestricted net position.
• Net investment in capital assets increased $5,500,850.30 due to construction activity and other capital asset additions of $24,911,089.79, offset by annual depreciation.
6
MANAGEMENT’S DISCUSSION AND ANALYSIS
• The increase in nonexpendable net position was primarily due to restricted additions to
endowments gifted in fiscal year 2019 totaling $3,731,496.16.
• Expendable restricted net position increased $3,073,520.01 primarily due to an increase of $2,994,597.49 in endowment earnings, net of management fees, resulting from solid market performance in fiscal year 2019.
• Unrestricted net position increased $14,011,463.77 primarily due to a net decrease in the year-end balances related to pension and OPEB plans, along with increased enrollment and rates for student auxiliaries.
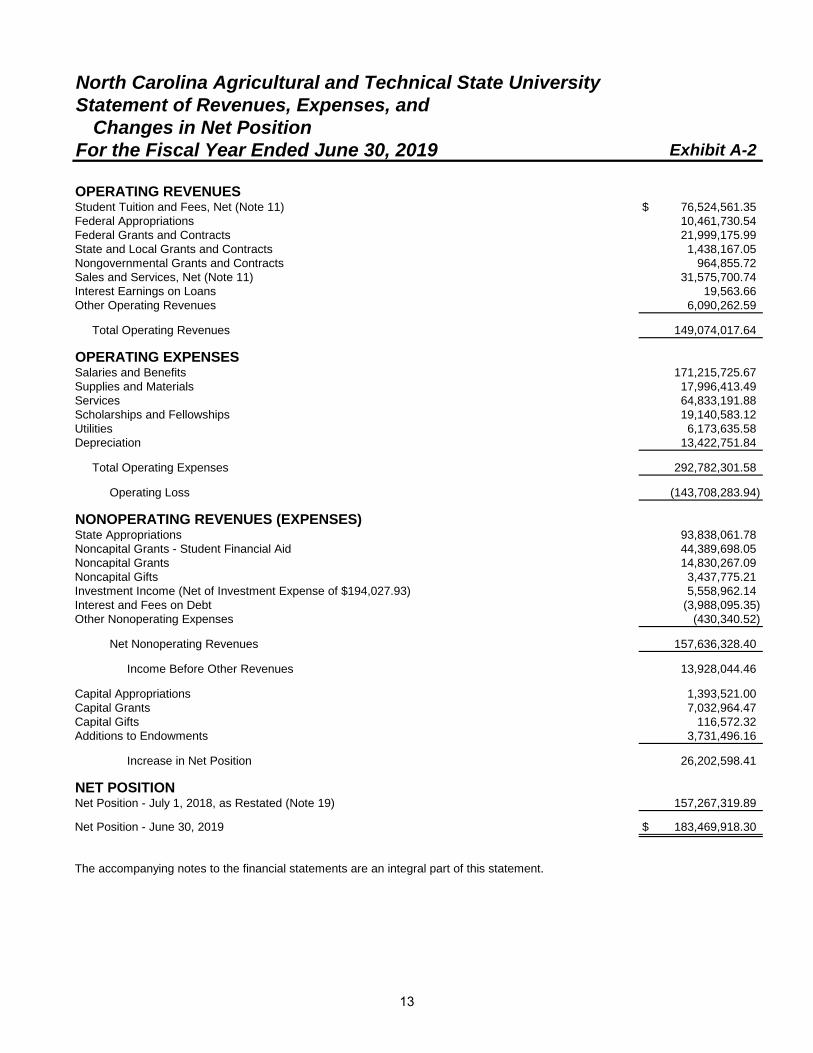
Statement of Revenues, Expenses, and Changes in Net Position The Statement of Revenues, Expenses, and Changes in Net Position reports the activity of the University during the year and is divided into four major components: operating revenues; operating expenses; nonoperating revenues (expenses); and other revenues. Revenues are reported by major source and expenses are reported by natural classification. Intra-departmental sales, services, and transfers are eliminated, and depreciation of capital assets is recorded.
7
MANAGEMENT’S DISCUSSION AND ANALYSIS
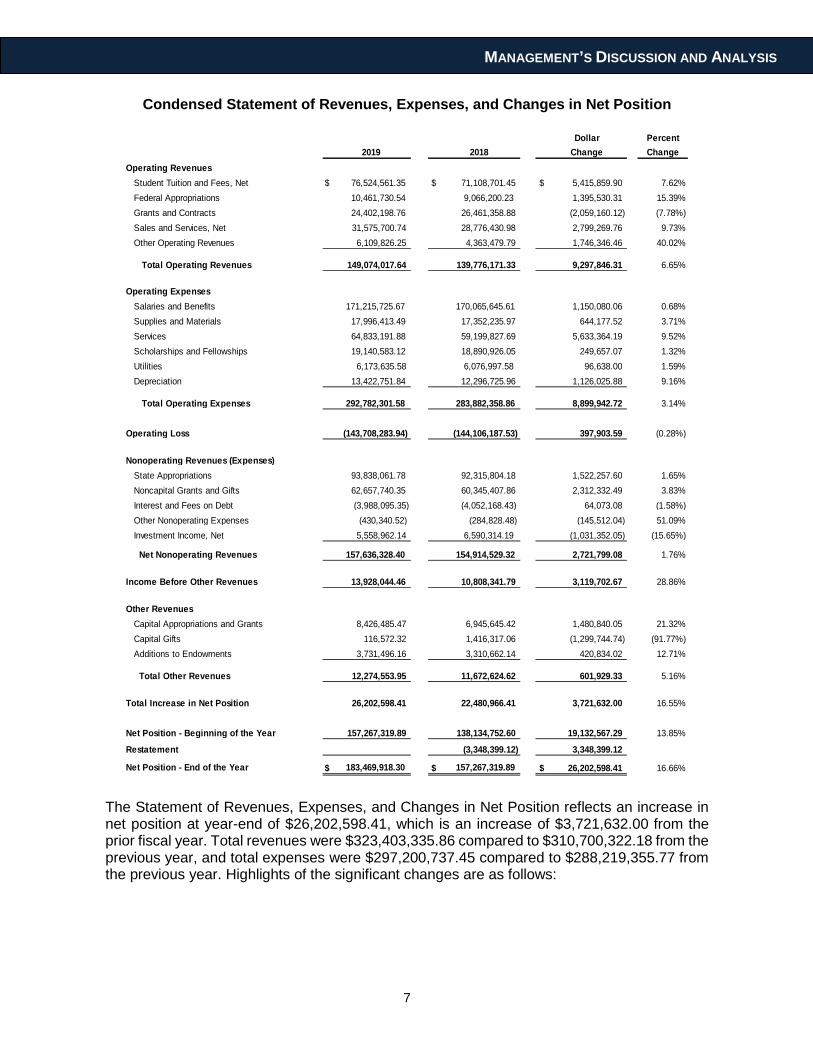
Condensed Statement of Revenues, Expenses, and Changes in Net Position
Dollar Percent2019 2018 Change Change
Operating Revenues Student Tuition and Fees, Net $ 76,524,561.35 $ 71,108,701.45 $ 5,415,859.90 7.62% Federal Appropriations 10,461,730.54 9,066,200.23 1,395,530.31 15.39% Grants and Contracts 24,402,198.76 26,461,358.88 (2,059,160.12) (7.78%) Sales and Services, Net 31,575,700.74 28,776,430.98 2,799,269.76 9.73% Other Operating Revenues 6,109,826.25 4,363,479.79 1,746,346.46 40.02%
Total Operating Revenues 149,074,017.64 139,776,171.33 9,297,846.31 6.65%
Operating Expenses Salaries and Benefits 171,215,725.67 170,065,645.61 1,150,080.06 0.68% Supplies and Materials 17,996,413.49 17,352,235.97 644,177.52 3.71% Services 64,833,191.88 59,199,827.69 5,633,364.19 9.52% Scholarships and Fellowships 19,140,583.12 18,890,926.05 249,657.07 1.32% Utilities 6,173,635.58 6,076,997.58 96,638.00 1.59% Depreciation 13,422,751.84 12,296,725.96 1,126,025.88 9.16%
Total Operating Expenses 292,782,301.58 283,882,358.86 8,899,942.72 3.14%
Operating Loss (143,708,283.94) (144,106,187.53) 397,903.59 (0.28%)
Nonoperating Revenues (Expenses) State Appropriations 93,838,061.78 92,315,804.18 1,522,257.60 1.65% Noncapital Grants and Gifts 62,657,740.35 60,345,407.86 2,312,332.49 3.83% Interest and Fees on Debt (3,988,095.35) (4,052,168.43) 64,073.08 (1.58%) Other Nonoperating Expenses (430,340.52) (284,828.48) (145,512.04) 51.09% Investment Income, Net 5,558,962.14 6,590,314.19 (1,031,352.05) (15.65%)
Net Nonoperating Revenues 157,636,328.40 154,914,529.32 2,721,799.08 1.76%
Income Before Other Revenues 13,928,044.46 10,808,341.79 3,119,702.67 28.86%
Other Revenues Capital Appropriations and Grants 8,426,485.47 6,945,645.42 1,480,840.05 21.32% Capital Gifts 116,572.32 1,416,317.06 (1,299,744.74) (91.77%) Additions to Endowments 3,731,496.16 3,310,662.14 420,834.02 12.71%
Total Other Revenues 12,274,553.95 11,672,624.62 601,929.33 5.16%
Total Increase in Net Position 26,202,598.41 22,480,966.41 3,721,632.00 16.55%
Net Position - Beginning of the Year 157,267,319.89 138,134,752.60 19,132,567.29 13.85%
Restatement (3,348,399.12) 3,348,399.12
Net Position - End of the Year $ 183,469,918.30 $ 157,267,319.89 $ 26,202,598.41 16.66%
The Statement of Revenues, Expenses, and Changes in Net Position reflects an increase in net position at year-end of $26,202,598.41, which is an increase of $3,721,632.00 from the prior fiscal year. Total revenues were $323,403,335.86 compared to $310,700,322.18 from the previous year, and total expenses were $297,200,737.45 compared to $288,219,355.77 from the previous year. Highlights of the significant changes are as follows:
8
MANAGEMENT’S DISCUSSION AND ANALYSIS
• Total operating revenues increased by $9,297,846.31. This change was due to an
increase in tuition and fees of $5,415,859.90, attributable to an increase in enrollment as well as increases in tuition and fees rates. Sales and services increased by $2,799,269.76, also due to increased enrollment and rates for student auxiliaries.
• Total operating expenses increased $8,899,942.72 or 3.14%. Salaries and benefits increased $1,150,080.06 due to the following factors: Salaries increased $5,761,407.64, the result of hiring new employees and a salary cost-of-living increase during the fiscal year. These increases were offset by a decrease of $4,611,327.58 in pension and OPEB expense. Services increased $5,633,364.19 primarily due to increases in several areas resulting from increases in full-time employees and student enrollment: (1) $1,203,945.80 in food services; (2) $1,060,021.51 in web-based software and professional services; (3) $1,182,633.51 in building rental; and (4) $1,038,586.99 in travel. Depreciation increased $1,126,025.88 primarily due to depreciation related to the new student center.
• The University experienced an increase in net nonoperating revenues of $2,721,799.08. State appropriations increased by $1,522,257.60 based on increased enrollment. Noncapital grants and gifts increased $2,312,332.49 primarily due to an increase in student financial aid of $1,213,504.76 related to an increase in student eligibility for the Pell grant award in fiscal year 2019. These increases were offset by a decrease in investment income of $1,031,352.05 due to receiving less realized gains during the year.
• Other revenues increased by $601,929.33, due primarily to an increase capital appropriations and grants of $1,480,840.05 offset by a decrease in capital gifts of $1,299,744.74 from the prior year. Capital appropriations and grants increased primarily due to an increase in funding for the new engineering facility of $1,527,117.93. Capital gifts decreased primarily due to the University receiving a gift for improvements to the football stadium in the prior year.
The University presents operating expenses by natural classification in the Statement of Revenues, Expenses, and Changes in Net Position. Salaries and benefits accounted for 58.48% of operating expenses, followed by services at 22.14%, scholarships and fellowships at 6.54%, supplies and materials at 6.15%, depreciation at 4.58%, and utilities expense at 2.11%.
Capital Assets and Debt Administration The University is fiscally conservative in the administration of its debt and is prudent in its expenditures for capital projects that enhance the teaching/learning experience for its students, provide adequate space and equipment for its research, and maintain the quality of its physical plant. As a state university, NC A&T receives funding from the state budget but because of limitations on that budget, the University very thoughtfully and purposefully issues debt when necessary. Current debt capacity is calculated to be $76.5 million and over $100.6 million by 2023 if no other debt is issued. Bond agencies Moody’s and Fitch assigned A1 and A+ ratings, respectively.
The University’s new student center that opened in the fall of 2018 was funded with a bond issuance of $82,955,000.00 in 2015. Principal debt outstanding on the student center at June 30, 2019 was $78,270,000.00 and is being financed through available resources for a period of 30 years.
9
MANAGEMENT’S DISCUSSION AND ANALYSIS
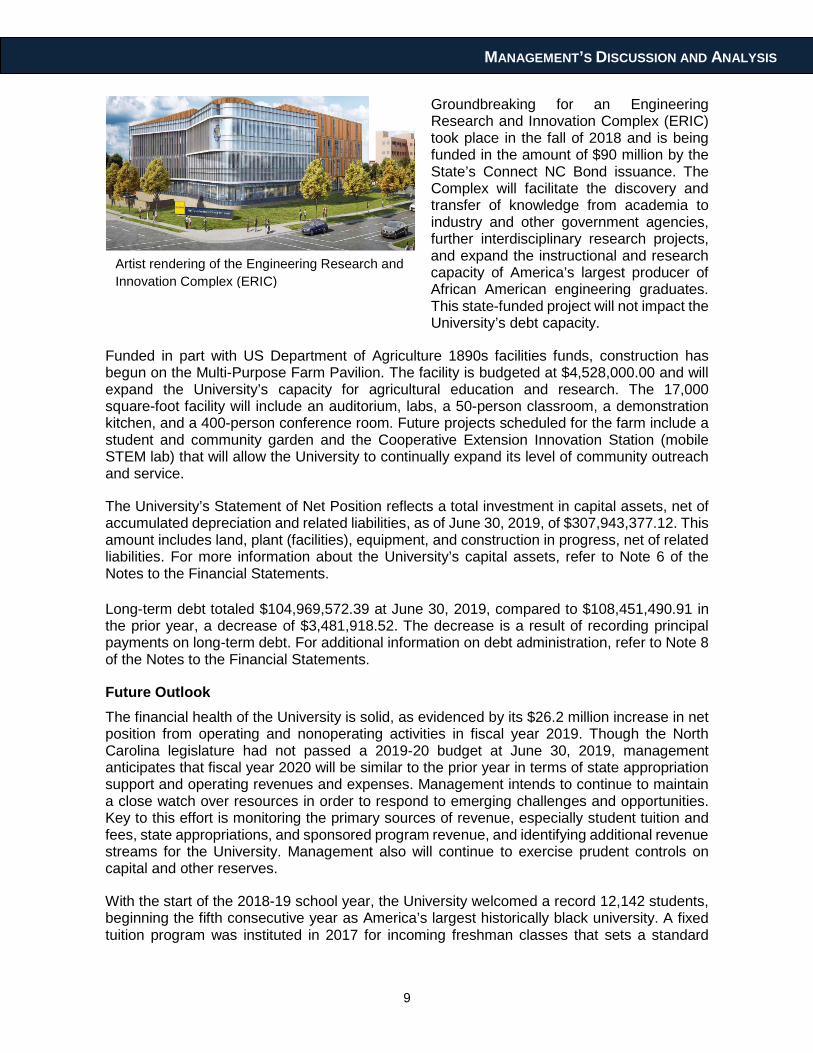
Groundbreaking for an Engineering Research and Innovation Complex (ERIC) took place in the fall of 2018 and is being funded in the amount of $90 million by the State’s Connect NC Bond issuance. The Complex will facilitate the discovery and transfer of knowledge from academia to industry and other government agencies, further interdisciplinary research projects, and expand the instructional and research capacity of America’s largest producer of African American engineering graduates. This state-funded project will not impact the University’s debt capacity.
Funded in part with US Department of Agriculture 1890s facilities funds, construction has begun on the Multi-Purpose Farm Pavilion. The facility is budgeted at $4,528,000.00 and will expand the University’s capacity for agricultural education and research. The 17,000 square-foot facility will include an auditorium, labs, a 50-person classroom, a demonstration kitchen, and a 400-person conference room. Future projects scheduled for the farm include a student and community garden and the Cooperative Extension Innovation Station (mobile STEM lab) that will allow the University to continually expand its level of community outreach and service.
The University’s Statement of Net Position reflects a total investment in capital assets, net of accumulated depreciation and related liabilities, as of June 30, 2019, of $307,943,377.12. This amount includes land, plant (facilities), equipment, and construction in progress, net of related liabilities. For more information about the University’s capital assets, refer to Note 6 of the Notes to the Financial Statements.
Long-term debt totaled $104,969,572.39 at June 30, 2019, compared to $108,451,490.91 in the prior year, a decrease of $3,481,918.52. The decrease is a result of recording principal payments on long-term debt. For additional information on debt administration, refer to Note 8 of the Notes to the Financial Statements.
Future Outlook The financial health of the University is solid, as evidenced by its $26.2 million increase in net position from operating and nonoperating activities in fiscal year 2019. Though the North Carolina legislature had not passed a 2019-20 budget at June 30, 2019, management anticipates that fiscal year 2020 will be similar to the prior year in terms of state appropriation support and operating revenues and expenses. Management intends to continue to maintain a close watch over resources in order to respond to emerging challenges and opportunities. Key to this effort is monitoring the primary sources of revenue, especially student tuition and fees, state appropriations, and sponsored program revenue, and identifying additional revenue streams for the University. Management also will continue to exercise prudent controls on capital and other reserves.
With the start of the 2018-19 school year, the University welcomed a record 12,142 students, beginning the fifth consecutive year as America’s largest historically black university. A fixed tuition program was instituted in 2017 for incoming freshman classes that sets a standard
Artist rendering of the Engineering Research and Innovation Complex (ERIC)
10
MANAGEMENT’S DISCUSSION AND ANALYSIS
tuition rate for eight semesters, providing certainty and stability of tuition rates throughout the four-year degree. The transparency is appreciated by parents and students and may be one of several reasons why student enrollment has been steadily increasing. For 2020, the UNC Board of Governors is eliminating a tuition surcharge that penalized students for extended time-to-graduate. While the intent of the surcharge was to encourage steady progress to graduation, the added fee also created a barrier to those who might otherwise return to school after a hiatus. The removal reflects the reality of changing demographics, as many potential students now enter the workforce while continuing their studies. The move may initially cost the University approximately $500,000 in lost tuition but should be a positive factor for enrollment growth.
The University continues to excel in high-quality academic research. Recognized by the Carnegie Foundation as a high research activity institution, the University has ranked third in sponsored research funding in the University of North Carolina System since 2005, receiving approximately $64.37 million in sponsored programs, grant, and contract funding in fiscal year 2019. University efforts toward proactively pursuing new federal, state, industry, and other grants and contracts have been rewarded with the largest totals in school history - a 21% increase in funding since fiscal year 2015. Despite the ever-increasing competition for federal and state research dollars, the University’s Division of Research and Economic Development is striving to increase 2020 research funding by another 3-4%.
With the public launch of “The Power of DO: The Campaign for North Carolina Agricultural and Technical State University”, the institution has reached the $81 million mark in an $85 million campaign with more than 18 months remaining.
Over one-third of campaign dollars have been committed for student support, with 200 new endowments for scholarship funds from donors, and six new endowed chairs and professorships created. The endowment-per-student ratio is now greater than $5,400 per-student, which is competitive among the University’s peers and will provide a perpetual source of revenue to support its institutional aspirations. In the decade between 2009 and 2019, the endowment has grown from $20.74 million to $68.46 million, an average annual growth rate of 13%. The campaign, concluding on December 31, 2020, is expected to be the most successful in the University’s history.
In the fall of 2010, the Chancellor led the University community in shaping a new vision for the University, launching the comprehensive strategic plan “Preeminence 2020, Embracing Our Past, Creating our Future”. The plan included a set of competitive metrics by which to define and evaluate preeminence for the University. By fully committing to the strategic plan and its core values (responsibility, excellence, integrity, inclusiveness, and learning), the University community launched an exciting decade of unprecedented growth and success as noted above, leading to a refresh and stretching of the plan to “A&T Preeminence: Taking the Momentum to 2023”. By continuing to embrace and relentlessly pursue the tenets of the strategic plan and mission, the University intends to remain a transformative engine for its students and faculty, for ground-breaking research, and for both the local and global communities in which we live and serve.

FINANCIAL STATEMENTS
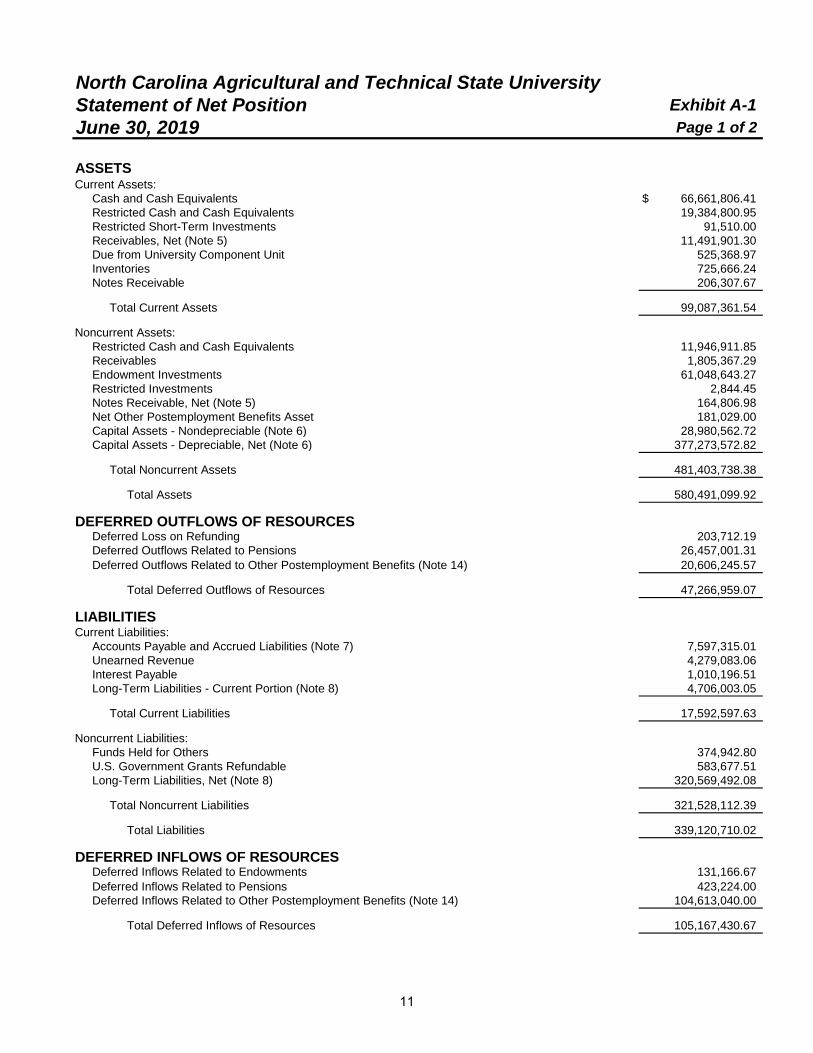
North Carolina Agricultural and Technical State UniversityStatement of Net Position Exhibit A-1June 30, 2019 Page 1 of 2
ASSETSCurrent Assets:
Cash and Cash Equivalents $ 66,661,806.41Restricted Cash and Cash Equivalents 19,384,800.95Restricted Short-Term Investments 91,510.00Receivables, Net (Note 5) 11,491,901.30Due from University Component Unit 525,368.97Inventories 725,666.24Notes Receivable 206,307.67
Total Current Assets 99,087,361.54
Noncurrent Assets:Restricted Cash and Cash Equivalents 11,946,911.85Receivables 1,805,367.29Endowment Investments 61,048,643.27Restricted Investments 2,844.45Notes Receivable, Net (Note 5) 164,806.98Net Other Postemployment Benefits Asset 181,029.00Capital Assets - Nondepreciable (Note 6) 28,980,562.72Capital Assets - Depreciable, Net (Note 6) 377,273,572.82
Total Noncurrent Assets 481,403,738.38
Total Assets 580,491,099.92
DEFERRED OUTFLOWS OF RESOURCESDeferred Loss on Refunding 203,712.19Deferred Outflows Related to Pensions 26,457,001.31Deferred Outflows Related to Other Postemployment Benefits (Note 14) 20,606,245.57
Total Deferred Outflows of Resources 47,266,959.07
LIABILITIESCurrent Liabilities:
Accounts Payable and Accrued Liabilities (Note 7) 7,597,315.01Unearned Revenue 4,279,083.06Interest Payable 1,010,196.51Long-Term Liabilities - Current Portion (Note 8) 4,706,003.05
Total Current Liabilities 17,592,597.63
Noncurrent Liabilities:Funds Held for Others 374,942.80U.S. Government Grants Refundable 583,677.51Long-Term Liabilities, Net (Note 8) 320,569,492.08
Total Noncurrent Liabilities 321,528,112.39
Total Liabilities 339,120,710.02
DEFERRED INFLOWS OF RESOURCESDeferred Inflows Related to Endowments 131,166.67Deferred Inflows Related to Pensions 423,224.00Deferred Inflows Related to Other Postemployment Benefits (Note 14) 104,613,040.00
Total Deferred Inflows of Resources 105,167,430.67
11
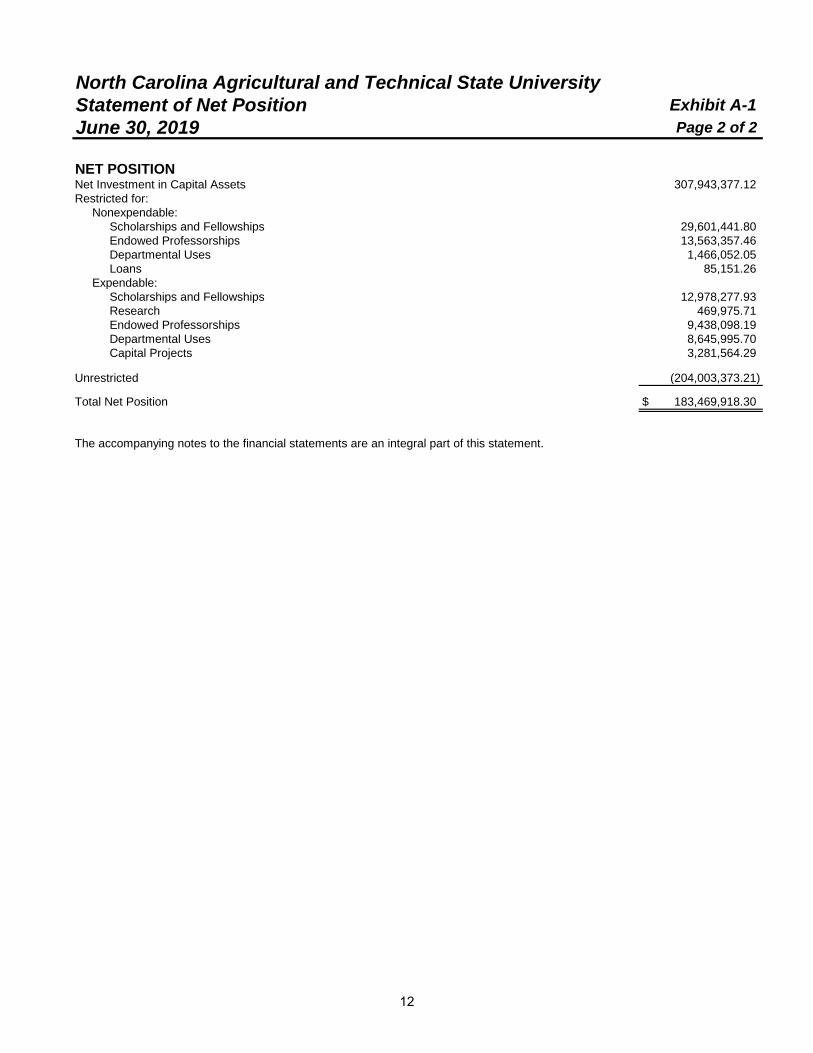
North Carolina Agricultural and Technical State University Statement of Net Position Exhibit A-1June 30, 2019 Page 2 of 2
NET POSITIONNet Investment in Capital Assets 307,943,377.12Restricted for:
Nonexpendable:Scholarships and Fellowships 29,601,441.80Endowed Professorships 13,563,357.46Departmental Uses 1,466,052.05Loans 85,151.26
Expendable:Scholarships and Fellowships 12,978,277.93Research 469,975.71Endowed Professorships 9,438,098.19Departmental Uses 8,645,995.70Capital Projects 3,281,564.29
Unrestricted (204,003,373.21)
Total Net Position $ 183,469,918.30
The accompanying notes to the financial statements are an integral part of this statement.
12
North Carolina Agricultural and Technical State University
Statement of Revenues, Expenses, and Changes in Net Position
For the Fiscal Year Ended June 30, 2019 Exhibit A-2
OPERATING REVENUESStudent Tuition and Fees, Net (Note 11) $ 76,524,561.35Federal Appropriations 10,461,730.54Federal Grants and Contracts 21,999,175.99State and Local Grants and Contracts 1,438,167.05Nongovernmental Grants and Contracts 964,855.72Sales and Services, Net (Note 11) 31,575,700.74Interest Earnings on Loans 19,563.66Other Operating Revenues 6,090,262.59
Total Operating Revenues 149,074,017.64
OPERATING EXPENSESSalaries and Benefits 171,215,725.67Supplies and Materials 17,996,413.49Services 64,833,191.88Scholarships and Fellowships 19,140,583.12Utilities 6,173,635.58Depreciation 13,422,751.84
Total Operating Expenses 292,782,301.58
Operating Loss (143,708,283.94)
NONOPERATING REVENUES (EXPENSES)State Appropriations 93,838,061.78Noncapital Grants - Student Financial Aid 44,389,698.05Noncapital Grants 14,830,267.09Noncapital Gifts 3,437,775.21Investment Income (Net of Investment Expense of $194,027.93) 5,558,962.14Interest and Fees on Debt (3,988,095.35)Other Nonoperating Expenses (430,340.52)
Net Nonoperating Revenues 157,636,328.40
Income Before Other Revenues 13,928,044.46
Capital Appropriations 1,393,521.00Capital Grants 7,032,964.47Capital Gifts 116,572.32Additions to Endowments 3,731,496.16
Increase in Net Position 26,202,598.41
NET POSITIONNet Position - July 1, 2018, as Restated (Note 19) 157,267,319.89
Net Position - June 30, 2019 $ 183,469,918.30
The accompanying notes to the financial statements are an integral part of this statement.
13
North Carolina Agricultural and Technical State University
Statement of Cash Flows Exhibit A-3For the Fiscal Year Ended June 30, 2019 Page 1 of 2
CASH FLOWS FROM OPERATING ACTIVITIESReceived from Customers $ 143,955,640.07Payments to Employees and Fringe Benefits (180,787,310.27)Payments to Vendors and Suppliers (87,827,143.36)Payments for Scholarships and Fellowships (19,077,665.27)Collection of Loans 205,085.14Interest Earned on Loans 148,261.22Other Receipts 6,090,262.59
Net Cash Used by Operating Activities (137,292,869.88)
CASH FLOWS FROM NONCAPITAL FINANCING ACTIVITIESState Appropriations 93,838,061.78Noncapital Grants - Student Financial Aid 44,349,892.19Noncapital Grants 16,102,618.89Noncapital Gifts 3,283,824.73Additions to Endowments 3,731,496.16William D. Ford Direct Lending Receipts 93,185,625.00William D. Ford Direct Lending Disbursements (93,185,625.00)Related Activity Agency Receipts 140,579.66Related Activity Agency Disbursements (69,076.46)
Net Cash Provided by Noncapital Financing Activities 161,377,396.95
CASH FLOWS FROM CAPITAL FINANCING AND RELATEDFINANCING ACTIVITIESCapital Appropriations 1,393,521.00Capital Grants 7,032,964.47Capital Gifts 116,572.32Acquisition and Construction of Capital Assets (29,549,933.21)Principal Paid on Capital Debt (3,260,176.25)Interest and Fees Paid on Capital Debt (4,179,626.44)
Net Cash Used by Capital Financing and Related Financing Activities (28,446,678.11)
CASH FLOWS FROM INVESTING ACTIVITIESProceeds from Sales and Maturities of Investments 140,256.18Investment Income 2,922,113.10Purchase of Investments and Related Fees (3,096,504.99)
Net Cash Used by Investing Activities (34,135.71)
Net Decrease in Cash and Cash Equivalents (4,396,286.75)
Cash and Cash Equivalents - July 1, 2018 102,389,805.96
Cash and Cash Equivalents - June 30, 2019 $ 97,993,519.21
14
North Carolina Agricultural and Technical State University
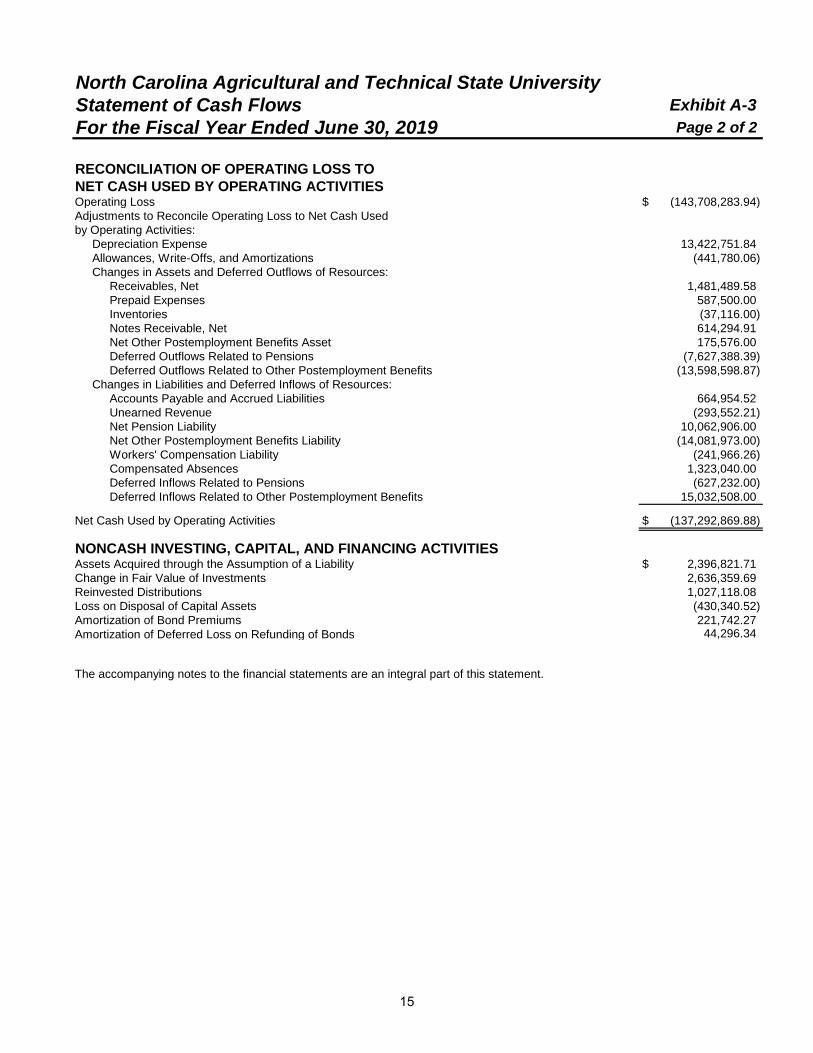
Statement of Cash Flows Exhibit A-3For the Fiscal Year Ended June 30, 2019 Page 2 of 2
RECONCILIATION OF OPERATING LOSS TONET CASH USED BY OPERATING ACTIVITIESOperating Loss $ (143,708,283.94)Adjustments to Reconcile Operating Loss to Net Cash Usedby Operating Activities:
Depreciation Expense 13,422,751.84Allowances, Write-Offs, and Amortizations (441,780.06)Changes in Assets and Deferred Outflows of Resources:
Receivables, Net 1,481,489.58Prepaid Expenses 587,500.00Inventories (37,116.00)Notes Receivable, Net 614,294.91Net Other Postemployment Benefits Asset 175,576.00Deferred Outflows Related to Pensions (7,627,388.39)Deferred Outflows Related to Other Postemployment Benefits (13,598,598.87)
Changes in Liabilities and Deferred Inflows of Resources:Accounts Payable and Accrued Liabilities 664,954.52Unearned Revenue (293,552.21)Net Pension Liability 10,062,906.00Net Other Postemployment Benefits Liability (14,081,973.00)Workers' Compensation Liability (241,966.26)Compensated Absences 1,323,040.00Deferred Inflows Related to Pensions (627,232.00)Deferred Inflows Related to Other Postemployment Benefits 15,032,508.00
Net Cash Used by Operating Activities $ (137,292,869.88)
NONCASH INVESTING, CAPITAL, AND FINANCING ACTIVITIESAssets Acquired through the Assumption of a Liability $ 2,396,821.71Change in Fair Value of Investments 2,636,359.69Reinvested Distributions 1,027,118.08Loss on Disposal of Capital Assets (430,340.52)Amortization of Bond Premiums 221,742.27Amortization of Deferred Loss on Refunding of Bonds 44,296.34
The accompanying notes to the financial statements are an integral part of this statement.
15
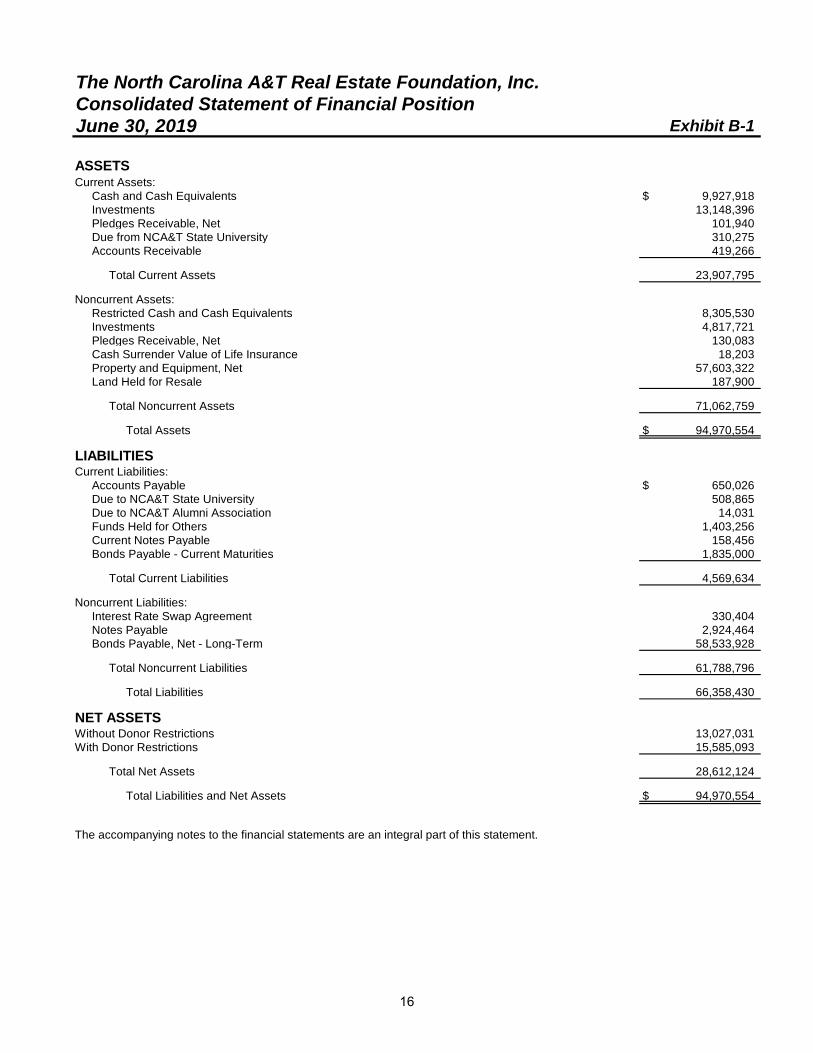
The North Carolina A&T Real Estate Foundation, Inc. Consolidated Statement of Financial PositionJune 30, 2019 Exhibit B-1
ASSETSCurrent Assets:
Cash and Cash Equivalents $ 9,927,918Investments 13,148,396Pledges Receivable, Net 101,940Due from NCA&T State University 310,275Accounts Receivable 419,266
Total Current Assets 23,907,795
Noncurrent Assets:Restricted Cash and Cash Equivalents 8,305,530Investments 4,817,721Pledges Receivable, Net 130,083Cash Surrender Value of Life Insurance 18,203Property and Equipment, Net 57,603,322Land Held for Resale 187,900
Total Noncurrent Assets 71,062,759
Total Assets $ 94,970,554
LIABILITIESCurrent Liabilities:
Accounts Payable $ 650,026Due to NCA&T State University 508,865Due to NCA&T Alumni Association 14,031Funds Held for Others 1,403,256Current Notes Payable 158,456Bonds Payable - Current Maturities 1,835,000
Total Current Liabilities 4,569,634
Noncurrent Liabilities:Interest Rate Swap Agreement 330,404Notes Payable 2,924,464Bonds Payable, Net - Long-Term 58,533,928
Total Noncurrent Liabilities 61,788,796
Total Liabilities 66,358,430
NET ASSETSWithout Donor Restrictions 13,027,031With Donor Restrictions 15,585,093
Total Net Assets 28,612,124
Total Liabilities and Net Assets $ 94,970,554
The accompanying notes to the financial statements are an integral part of this statement.
16
The North Carolina A&T Real Estate Foundation, Inc.
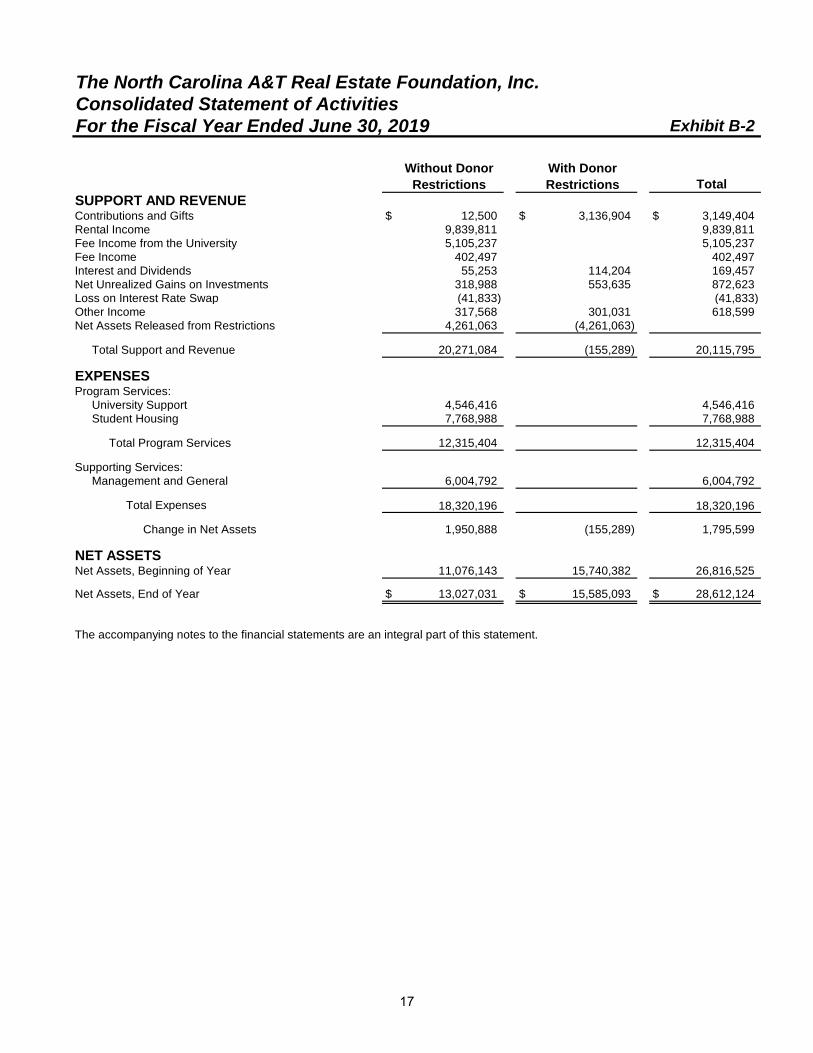
Consolidated Statement of ActivitiesFor the Fiscal Year Ended June 30, 2019 Exhibit B-2
TotalSUPPORT AND REVENUEContributions and Gifts $ 12,500 $ 3,136,904 $ 3,149,404Rental Income 9,839,811 9,839,811Fee Income from the University 5,105,237 5,105,237Fee Income 402,497 402,497Interest and Dividends 55,253 114,204 169,457Net Unrealized Gains on Investments 318,988 553,635 872,623Loss on Interest Rate Swap (41,833) (41,833)Other Income 317,568 301,031 618,599Net Assets Released from Restrictions 4,261,063 (4,261,063)
Total Support and Revenue 20,271,084 (155,289) 20,115,795
EXPENSESProgram Services:
University Support 4,546,416 4,546,416Student Housing 7,768,988 7,768,988
Total Program Services 12,315,404 12,315,404
Supporting Services:Management and General 6,004,792 6,004,792
Total Expenses 18,320,196 18,320,196
Change in Net Assets 1,950,888 (155,289) 1,795,599
NET ASSETSNet Assets, Beginning of Year 11,076,143 15,740,382 26,816,525
Net Assets, End of Year $ 13,027,031 $ 15,585,093 $ 28,612,124
The accompanying notes to the financial statements are an integral part of this statement.
Without Donor Restrictions
With Donor Restrictions
17

NOTES TO THE FINANCIAL
STATEMENTS
18
NOTES TO THE FINANCIAL STATEMENTS
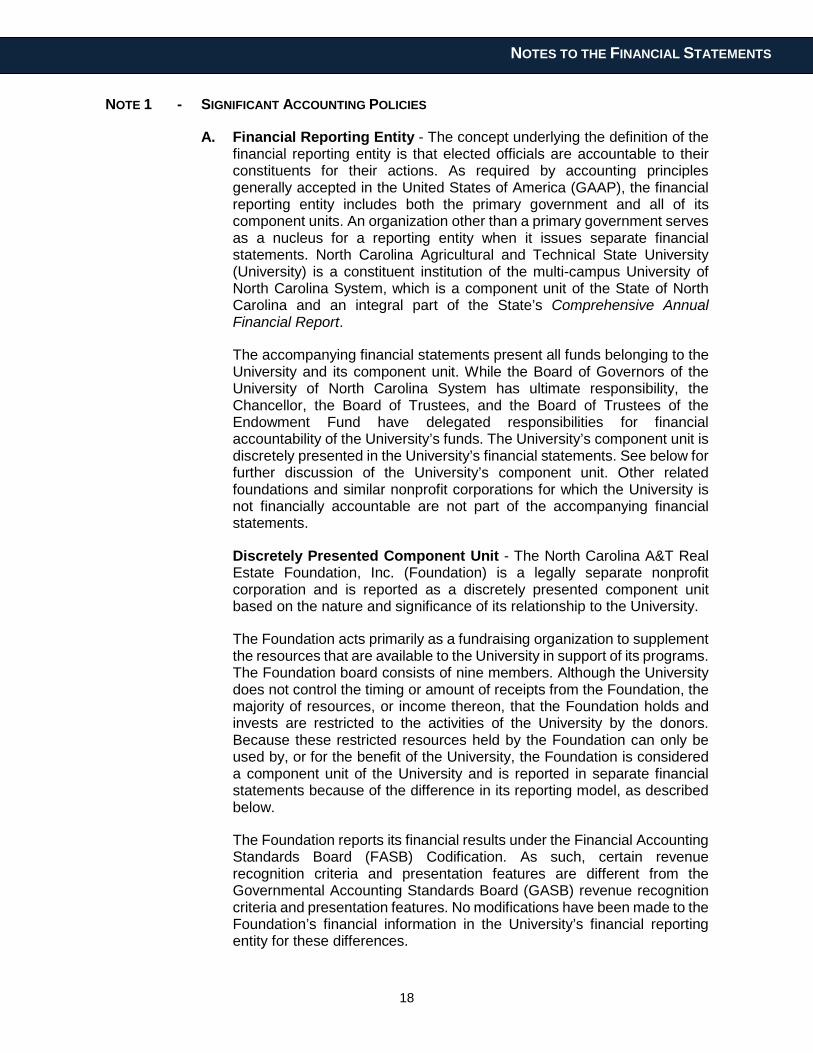
NOTE 1 - SIGNIFICANT ACCOUNTING POLICIES
A. Financial Reporting Entity - The concept underlying the definition of the financial reporting entity is that elected officials are accountable to their constituents for their actions. As required by accounting principles generally accepted in the United States of America (GAAP), the financial reporting entity includes both the primary government and all of its component units. An organization other than a primary government serves as a nucleus for a reporting entity when it issues separate financial statements. North Carolina Agricultural and Technical State University (University) is a constituent institution of the multi-campus University of North Carolina System, which is a component unit of the State of North Carolina and an integral part of the State’s Comprehensive Annual Financial Report.
The accompanying financial statements present all funds belonging to the University and its component unit. While the Board of Governors of the University of North Carolina System has ultimate responsibility, the Chancellor, the Board of Trustees, and the Board of Trustees of the Endowment Fund have delegated responsibilities for financial accountability of the University’s funds. The University’s component unit is discretely presented in the University’s financial statements. See below for further discussion of the University’s component unit. Other related foundations and similar nonprofit corporations for which the University is not financially accountable are not part of the accompanying financial statements.
Discretely Presented Component Unit - The North Carolina A&T Real Estate Foundation, Inc. (Foundation) is a legally separate nonprofit corporation and is reported as a discretely presented component unit based on the nature and significance of its relationship to the University.
The Foundation acts primarily as a fundraising organization to supplement the resources that are available to the University in support of its programs. The Foundation board consists of nine members. Although the University does not control the timing or amount of receipts from the Foundation, the majority of resources, or income thereon, that the Foundation holds and invests are restricted to the activities of the University by the donors. Because these restricted resources held by the Foundation can only be used by, or for the benefit of the University, the Foundation is considered a component unit of the University and is reported in separate financial statements because of the difference in its reporting model, as described below.
The Foundation reports its financial results under the Financial Accounting Standards Board (FASB) Codification. As such, certain revenue recognition criteria and presentation features are different from the Governmental Accounting Standards Board (GASB) revenue recognition criteria and presentation features. No modifications have been made to the Foundation’s financial information in the University’s financial reporting entity for these differences.
19
NOTES TO THE FINANCIAL STATEMENTS
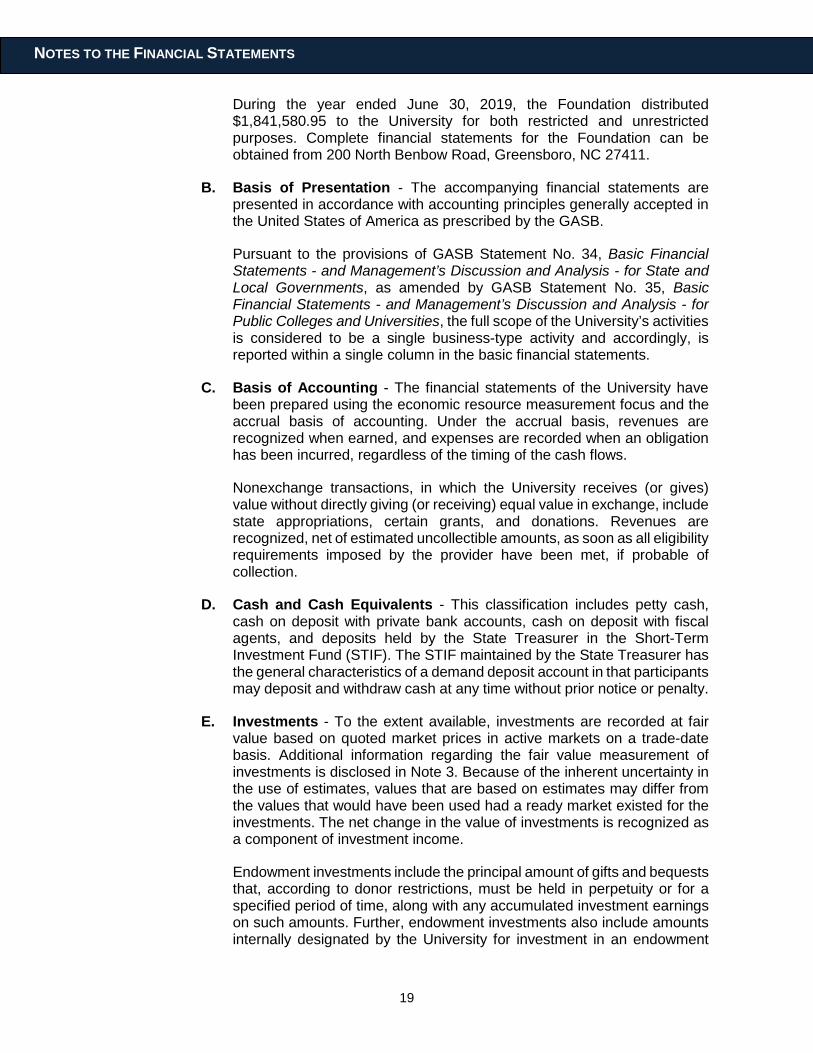
During the year ended June 30, 2019, the Foundation distributed $1,841,580.95 to the University for both restricted and unrestricted purposes. Complete financial statements for the Foundation can be obtained from 200 North Benbow Road, Greensboro, NC 27411.
B. Basis of Presentation - The accompanying financial statements are presented in accordance with accounting principles generally accepted in the United States of America as prescribed by the GASB.
Pursuant to the provisions of GASB Statement No. 34, Basic Financial Statements - and Management’s Discussion and Analysis - for State and Local Governments, as amended by GASB Statement No. 35, Basic Financial Statements - and Management’s Discussion and Analysis - for Public Colleges and Universities, the full scope of the University’s activities is considered to be a single business-type activity and accordingly, is reported within a single column in the basic financial statements.
C. Basis of Accounting - The financial statements of the University have been prepared using the economic resource measurement focus and the accrual basis of accounting. Under the accrual basis, revenues are recognized when earned, and expenses are recorded when an obligation has been incurred, regardless of the timing of the cash flows.
Nonexchange transactions, in which the University receives (or gives) value without directly giving (or receiving) equal value in exchange, include state appropriations, certain grants, and donations. Revenues are recognized, net of estimated uncollectible amounts, as soon as all eligibility requirements imposed by the provider have been met, if probable of collection.
D. Cash and Cash Equivalents - This classification includes petty cash, cash on deposit with private bank accounts, cash on deposit with fiscal agents, and deposits held by the State Treasurer in the Short-Term Investment Fund (STIF). The STIF maintained by the State Treasurer has the general characteristics of a demand deposit account in that participants may deposit and withdraw cash at any time without prior notice or penalty.
E. Investments - To the extent available, investments are recorded at fair value based on quoted market prices in active markets on a trade-date basis. Additional information regarding the fair value measurement of investments is disclosed in Note 3. Because of the inherent uncertainty in the use of estimates, values that are based on estimates may differ from the values that would have been used had a ready market existed for the investments. The net change in the value of investments is recognized as a component of investment income.
Endowment investments include the principal amount of gifts and bequests that, according to donor restrictions, must be held in perpetuity or for a specified period of time, along with any accumulated investment earnings on such amounts. Further, endowment investments also include amounts internally designated by the University for investment in an endowment
20
NOTES TO THE FINANCIAL STATEMENTS
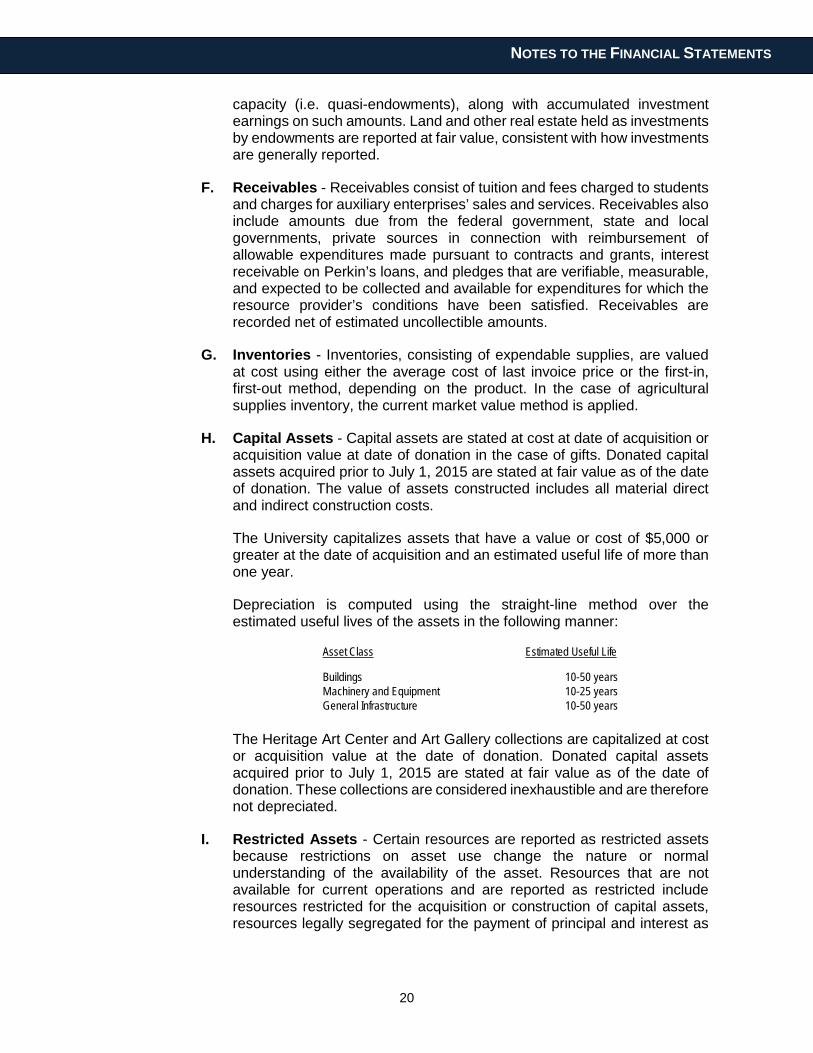
capacity (i.e. quasi-endowments), along with accumulated investment earnings on such amounts. Land and other real estate held as investments by endowments are reported at fair value, consistent with how investments are generally reported.
F. Receivables - Receivables consist of tuition and fees charged to students and charges for auxiliary enterprises’ sales and services. Receivables also include amounts due from the federal government, state and local governments, private sources in connection with reimbursement of allowable expenditures made pursuant to contracts and grants, interest receivable on Perkin’s loans, and pledges that are verifiable, measurable, and expected to be collected and available for expenditures for which the resource provider’s conditions have been satisfied. Receivables are recorded net of estimated uncollectible amounts.
G. Inventories - Inventories, consisting of expendable supplies, are valued at cost using either the average cost of last invoice price or the first-in, first-out method, depending on the product. In the case of agricultural supplies inventory, the current market value method is applied.
H. Capital Assets - Capital assets are stated at cost at date of acquisition or acquisition value at date of donation in the case of gifts. Donated capital assets acquired prior to July 1, 2015 are stated at fair value as of the date of donation. The value of assets constructed includes all material direct and indirect construction costs.
The University capitalizes assets that have a value or cost of $5,000 or greater at the date of acquisition and an estimated useful life of more than one year.
Depreciation is computed using the straight-line method over the estimated useful lives of the assets in the following manner:
Asset Class Estimated Useful Life
Buildings 10-50 yearsMachinery and Equipment 10-25 yearsGeneral Infrastructure 10-50 years
The Heritage Art Center and Art Gallery collections are capitalized at cost or acquisition value at the date of donation. Donated capital assets acquired prior to July 1, 2015 are stated at fair value as of the date of donation. These collections are considered inexhaustible and are therefore not depreciated.
I. Restricted Assets - Certain resources are reported as restricted assets because restrictions on asset use change the nature or normal understanding of the availability of the asset. Resources that are not available for current operations and are reported as restricted include resources restricted for the acquisition or construction of capital assets, resources legally segregated for the payment of principal and interest as
21
NOTES TO THE FINANCIAL STATEMENTS
required by debt covenants, unspent debt proceeds, and endowment and other restricted investments.
J. Noncurrent Long-Term Liabilities - Noncurrent long-term liabilities include principal amounts of long-term debt and other long-term liabilities that will not be paid within the next fiscal year. Debt is defined as a liability that arises from a contractual obligation to pay cash (or other assets that may be used in lieu of cash) in one or more payments to settle an amount that is fixed at the date the contractual obligation is established. Long-term debt includes: revenue bonds payable, bonds from direct placements, and notes from direct borrowings. Other long-term liabilities include: compensated absences, net pension liability, net other postemployment benefits (OPEB) liability, and workers’ compensation.
Revenue bonds payable are reported net of unamortized premiums. The University amortizes bond premiums over the life of the bonds using the straight-line method that approximates the effective interest method. Deferred gains and losses on refundings are amortized over the life of the old debt or new debt (whichever is shorter) using the straight-line method, and are aggregated as deferred outflows of resources or deferred inflows of resources on the Statement of Net Position. Issuance costs are expensed in the reporting period in which they are incurred.
The net pension liability represents the University’s proportionate share of the collective net pension liability reported in the State of North Carolina’s 2018 Comprehensive Annual Financial Report. This liability represents the University’s portion of the collective total pension liability less the fiduciary net position of the Teachers’ and State Employees’ Retirement System. See Note 13 for further information regarding the University’s policies for recognizing liabilities, expenses, deferred outflows of resources, and deferred inflows of resources related to pensions.
The net OPEB liability represents the University’s proportionate share of the collective net OPEB liability reported in the State of North Carolina’s 2018 Comprehensive Annual Financial Report. This liability represents the University’s portion of the collective total OPEB liability less the fiduciary net position of the Retiree Health Benefit Fund. See Note 14 for further information regarding the University’s policies for recognizing liabilities, expenses, deferred outflows of resources, and deferred inflows of resources related to OPEB.
K. Compensated Absences - The University’s policy is to record the cost of vacation leave when earned. The policy provides for a maximum accumulation of unused vacation leave of 30 days which can be carried forward each January 1 or for which an employee can be paid upon termination of employment. When classifying compensated absences into current and noncurrent, leave is considered taken using a last-in, first-out (LIFO) method. Also, any accumulated vacation leave in excess of 30 days at year-end is converted to sick leave. Under this policy, the accumulated vacation leave for each employee at June 30 equals the leave carried
22
NOTES TO THE FINANCIAL STATEMENTS
forward at the previous December 31 plus the leave earned, less the leave taken between January 1 and June 30.
In addition to the vacation leave described above, compensated absences include the accumulated unused portion of the special annual leave bonuses awarded by the North Carolina General Assembly. The bonus leave balance on December 31 is retained by employees and transferred into the next calendar year. It is not subject to the limitation on annual leave carried forward described above and is not subject to conversion to sick leave.
There is no liability for unpaid accumulated sick leave because the University has no obligation to pay sick leave upon termination or retirement. However, additional service credit for retirement pension benefits is given for accumulated sick leave upon retirement.
L. Deferred Outflows/Inflows of Resources - In addition to assets, the Statement of Net Position reports a separate section for deferred outflows of resources. This separate financial statement element, deferred outflows of resources, represents a consumption of net position that applies to a future period(s) and so will not be recognized as an outflow of resources (expense) until then. The University has the following items that qualify for reporting in this category: deferred loss on refunding, deferred outflows related to pensions, and deferred outflows related to other postemployment benefits.
In addition to liabilities, the Statement of Net Position reports a separate section for deferred inflows of resources. This separate financial statement element, deferred inflows of resources, represents an acquisition of net position that applies to a future period(s) and so will not be recognized as an inflow of resources (revenue) until then. The University has the following items that qualify for reporting in this category: deferred inflows related to endowments, deferred inflows related to pensions, and deferred inflows related to other postemployment benefits.
M. Net Position - The University’s net position is classified as follows:
Net Investment in Capital Assets - This represents the University’s total investment in capital assets, net of outstanding liabilities related to those capital assets. To the extent debt has been incurred but not yet expended for capital assets, such amounts are not included as a component of net investment in capital assets. Additionally, deferred outflows of resources and deferred inflows of resources that are attributable to the acquisition, construction, or improvement of capital assets or related debt are also included in this component of net position.
Restricted Net Position - Nonexpendable - Nonexpendable restricted net position includes endowments and similar type assets whose use is limited by donors or other outside sources, and, as a condition of the gift, the principal is to be maintained in perpetuity.
23
NOTES TO THE FINANCIAL STATEMENTS
Restricted Net Position - Expendable - Expendable restricted net position includes resources for which the University is legally or contractually obligated to spend in accordance with restrictions imposed by external parties.
Unrestricted Net Position - Unrestricted net position includes resources derived from student tuition and fees, sales and services, unrestricted gifts, royalties, and interest income. It also includes the net position of accrued employee benefits such as compensated absences, pension plans, and other postemployment benefits.
Restricted and unrestricted resources are tracked using a fund accounting system and are spent in accordance with established fund authorities. Fund authorities provide rules for the fund activity and are separately established for restricted and unrestricted activities. When both restricted and unrestricted funds are available for expenditure, the decision for funding is transactional based within the departmental management system in place at the University. For projects funded by tax-exempt debt proceeds and other sources, the debt proceeds are always used first. Both restricted and unrestricted net position include consideration of deferred outflows of resources and deferred inflows of resources. See Note 10 for further information regarding deferred outflows of resources and deferred inflows of resources that had a significant effect on unrestricted net position.
N. Scholarship Discounts - Student tuition and fees revenues and certain other revenues from University charges are reported net of scholarship discounts in the accompanying Statement of Revenues, Expenses, and Changes in Net Position. The scholarship discount is the difference between the actual charge for goods and services provided by the University and the amount that is paid by students or by third parties on the students’ behalf. Student financial assistance grants, such as Pell grants, and other federal, state, or nongovernmental programs, are recorded as nonoperating revenues in the accompanying Statement of Revenues, Expenses, and Changes in Net Position. To the extent that revenues from these programs are used to satisfy tuition, fees, and other charges, the University has recorded a scholarship discount.
O. Revenue and Expense Recognition - The University classifies its revenues and expenses as operating or nonoperating in the accompanying Statement of Revenues, Expenses, and Changes in Net Position. Operating revenues and expenses generally result from providing services and producing and delivering goods in connection with the University’s principal ongoing operations. Operating revenues include activities that have characteristics of exchange transactions, such as (1) student tuition and fees, (2) sales and services of auxiliary enterprises, (3) certain federal, state, and local grants and contracts that are essentially contracts for services, and (4) interest earned on loans. Operating expenses are all expense transactions incurred other than those related to capital and noncapital financing or investing activities as defined by GASB Statement
24
NOTES TO THE FINANCIAL STATEMENTS
No. 9, Reporting Cash Flows of Proprietary and Nonexpendable Trust Funds and Governmental Entities That Use Proprietary Fund Accounting.
Nonoperating revenues include activities that have the characteristics of nonexchange transactions. Revenues from nonexchange transactions that represent subsidies or gifts to the University, as well as investment income, are considered nonoperating since these are either investing, capital, or noncapital financing activities. Capital contributions are presented separately after nonoperating revenues and expenses.
P. Internal Sales Activities - Certain institutional auxiliary operations provide goods and services to University departments, as well as to its customers. These institutional auxiliary operations include activities such as motor pool and maintenance of auxiliary facilities. In addition, the University has other miscellaneous sales and service units that operated either on a reimbursement or charge basis. All internal sales activities to University departments from auxiliary operations and sales and service units have been eliminated in the accompanying financial statements. These eliminations are recorded by removing the revenue and expense in the auxiliary operations and sales and service units and, if significant, allocating any residual balances to those departments receiving the goods and services during the year.
NOTE 2 - DEPOSITS AND INVESTMENTS
A. Deposits - Unless specifically exempt, the University is required by North Carolina General Statute 147-77 to deposit moneys received with the State Treasurer or with a depository institution in the name of the State Treasurer. However, the University of North Carolina Board of Governors, pursuant to G.S. 116-36.1, may authorize the University to deposit its institutional trust funds in interest-bearing accounts and other investments authorized by the Board of Governors, without regard to any statute or rule of law relating to the investment of funds by fiduciaries. Although specifically exempted, the University may voluntarily deposit institutional trust funds, endowment funds, special funds, revenue bond proceeds, debt service funds, and funds received for services rendered by health care professionals with the State Treasurer. Special funds consist of moneys for intercollegiate athletics and agency funds held directly by the University.
At June 30, 2019, the amount shown on the Statement of Net Position as cash and cash equivalents includes $97,871,577.44, which represents the University’s equity position in the State Treasurer’s Short-Term Investment Fund (STIF). The STIF (a portfolio within the State Treasurer’s Investment Pool, an external investment pool that is not registered with the Securities and Exchange Commission or subject to any other regulatory oversight and does not have a credit rating) had a weighted average maturity of 1.3 years as of June 30, 2019. Assets and shares of the STIF are valued at fair value. Deposit and investment risks associated with the State Treasurer’s Investment Pool (which includes the State Treasurer’s STIF)
25
NOTES TO THE FINANCIAL STATEMENTS
are included in the North Carolina Department of State Treasurer Investment Programs’ separately issued audit report. This separately issued report can be obtained from the Department of State Treasurer, 3200 Atlantic Avenue, Raleigh, NC 27604 or can be accessed from the Department of State Treasurer’s website at https://www.nctreasurer.com/ in the Audited Financial Statements section.
Cash on hand at June 30, 2019 was $8,499.00. The carrying amount of the University’s deposits not with the State Treasurer was $113,442.77, and the bank balance was $106,200.05. Custodial credit risk is the risk that in the event of a bank failure, the University’s deposits may not be returned to it. The University does not have a deposit policy for custodial credit risk. As of June 30, 2019, the University’s bank balance was not exposed to custodial credit risk.
B. Investments
University - The University is authorized by the University of North Carolina Board of Governors pursuant to G.S. 116-36.2 and Section 600.2.4 of the Policy Manual of the University of North Carolina to invest its special funds and funds received for services rendered by health care professionals in the same manner as the State Treasurer is required to invest, as discussed below.
Additionally, the University has also been delegated authority by the President of the University of North Carolina pursuant to G.S. 116-36.1 and Section 600.2.4.1 of the Policy Manual of the University of North Carolina to invest its trust funds in the same manner as the State Treasurer is required to invest, as discussed below.
G.S. 147-69.1(c), applicable to the State’s General Fund, and G.S. 147-69.2, applicable to institutional trust funds, authorize the State Treasurer to invest in the following: obligations of or fully guaranteed by the United States; obligations of certain federal agencies; repurchase agreements; obligations of the State of North Carolina; certificates of deposit and other deposit accounts of specified financial institutions; prime quality commercial paper; asset-backed securities with specified ratings, specified bills of exchange or time drafts, and corporate bonds/notes with specified ratings; general obligations of other states; general obligations of North Carolina local governments; and obligations of certain entities with specified ratings.
In accordance with the bond resolutions, bond proceeds and debt service funds are invested in obligations that will by their terms mature on or before the date funds are expected to be required for expenditure or withdrawal.
G.S. 116-36(e) provides that the trustees of the Endowment Fund shall be responsible for the prudent investment of the Fund in the exercise of their sound discretion, without regard to any statute or rule of law relating to the investment of funds by fiduciaries but in compliance with any lawful
26
NOTES TO THE FINANCIAL STATEMENTS
condition placed by the donor upon that part of the Endowment Fund to be invested.
Investments of various funds may be pooled unless prohibited by statute or by terms of the gift or contract. The University utilizes investment pools to manage investments and distribute investment income.
Investments are subject to the following risks as defined by GASB Statement No. 40, Deposit and Investment Risk Disclosures - An Amendment of GASB Statement No. 3.
Interest Rate Risk: Interest rate risk is the risk the University may face should interest rate variances affect the value of investments. The University does not have a formal policy that addresses interest rate risk.
Credit Risk: Credit risk is the risk that an issuer or other counterparty to an investment will not fulfill its obligations. The University does not have a formal policy that addresses credit risk.
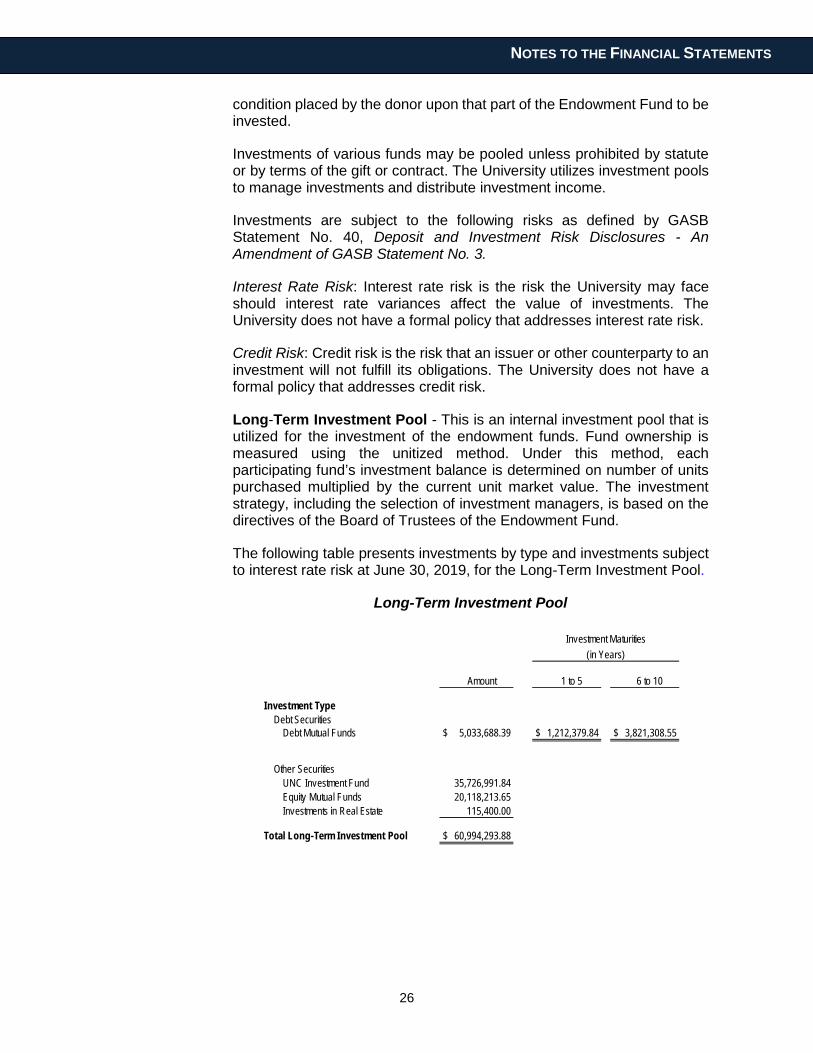
Long-Term Investment Pool - This is an internal investment pool that is utilized for the investment of the endowment funds. Fund ownership is measured using the unitized method. Under this method, each participating fund’s investment balance is determined on number of units purchased multiplied by the current unit market value. The investment strategy, including the selection of investment managers, is based on the directives of the Board of Trustees of the Endowment Fund.
The following table presents investments by type and investments subject to interest rate risk at June 30, 2019, for the Long-Term Investment Pool.
Long-Term Investment Pool
Amount 1 to 5 6 to 10
Investment TypeDebt Securities
Debt Mutual Funds $ 5,033,688.39 $ 1,212,379.84 $ 3,821,308.55
Other SecuritiesUNC Investment Fund 35,726,991.84Equity Mutual Funds 20,118,213.65Investments in Real Estate 115,400.00
Total Long-Term Investment Pool $ 60,994,293.88
(in Years)Investment Maturities
27
NOTES TO THE FINANCIAL STATEMENTS
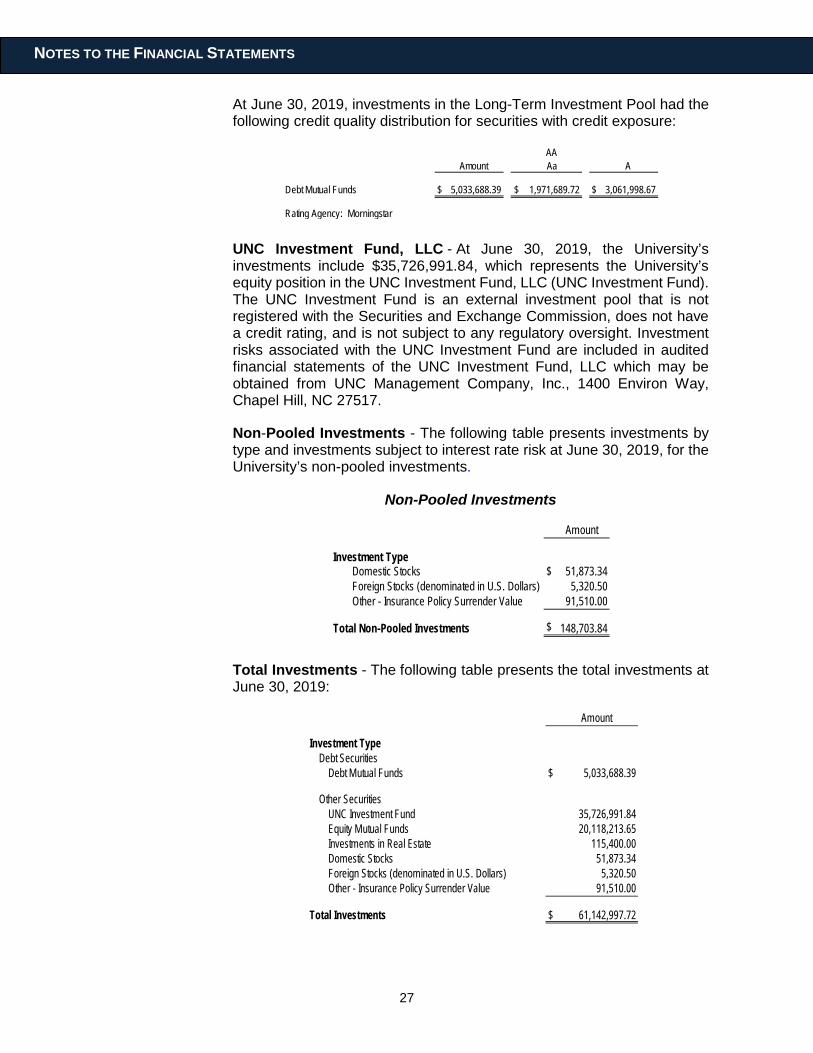
At June 30, 2019, investments in the Long-Term Investment Pool had the following credit quality distribution for securities with credit exposure:
AAAmount Aa A
Debt Mutual Funds $ 5,033,688.39 $ 1,971,689.72 $ 3,061,998.67
Rating Agency: Morningstar
UNC Investment Fund, LLC - At June 30, 2019, the University’s investments include $35,726,991.84, which represents the University’s equity position in the UNC Investment Fund, LLC (UNC Investment Fund). The UNC Investment Fund is an external investment pool that is not registered with the Securities and Exchange Commission, does not have a credit rating, and is not subject to any regulatory oversight. Investment risks associated with the UNC Investment Fund are included in audited financial statements of the UNC Investment Fund, LLC which may be obtained from UNC Management Company, Inc., 1400 Environ Way, Chapel Hill, NC 27517.
Non-Pooled Investments - The following table presents investments by type and investments subject to interest rate risk at June 30, 2019, for the University’s non-pooled investments.
Non-Pooled Investments
Amount
Investment TypeDomestic Stocks $ 51,873.34Foreign Stocks (denominated in U.S. Dollars) 5,320.50Other - Insurance Policy Surrender Value 91,510.00
Total Non-Pooled Investments $ 148,703.84
Total Investments - The following table presents the total investments at June 30, 2019:
Amount
Investment TypeDebt Securities
Debt Mutual Funds $ 5,033,688.39
Other SecuritiesUNC Investment Fund 35,726,991.84Equity Mutual Funds 20,118,213.65Investments in Real Estate 115,400.00Domestic Stocks 51,873.34Foreign Stocks (denominated in U.S. Dollars) 5,320.50Other - Insurance Policy Surrender Value 91,510.00
Total Investments $ 61,142,997.72
28
NOTES TO THE FINANCIAL STATEMENTS
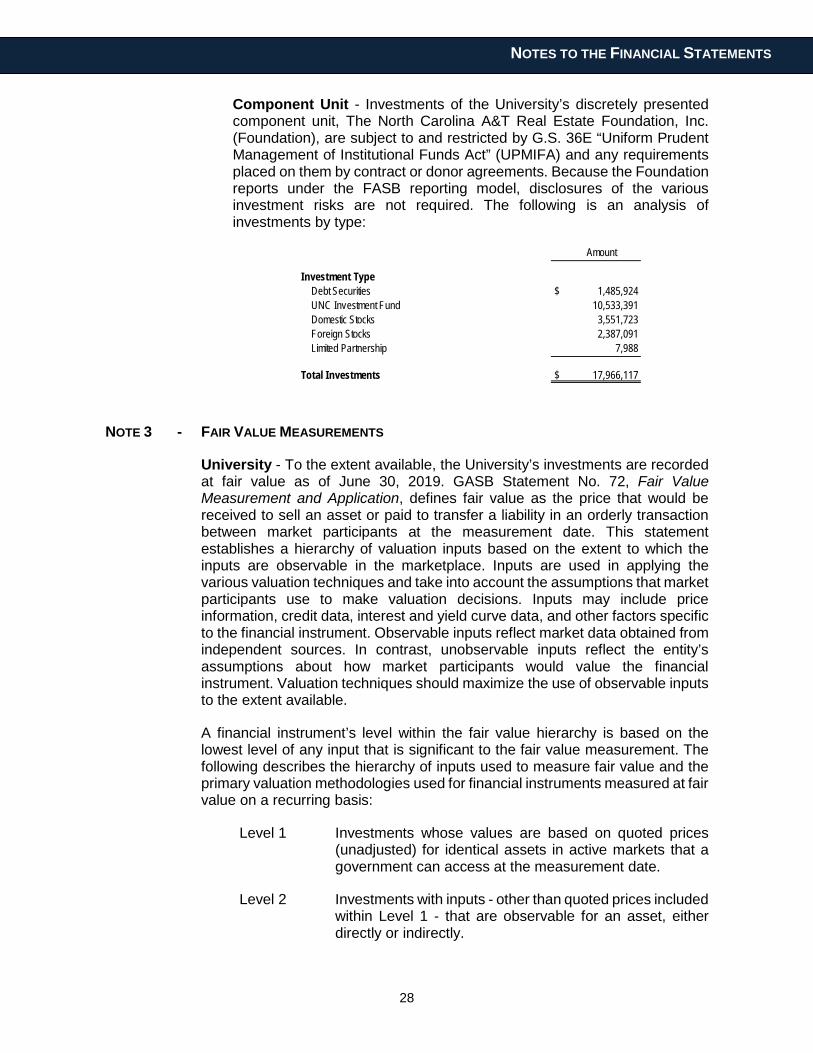
Component Unit - Investments of the University’s discretely presented component unit, The North Carolina A&T Real Estate Foundation, Inc. (Foundation), are subject to and restricted by G.S. 36E “Uniform Prudent Management of Institutional Funds Act” (UPMIFA) and any requirements placed on them by contract or donor agreements. Because the Foundation reports under the FASB reporting model, disclosures of the various investment risks are not required. The following is an analysis of investments by type:
Amount
Investment TypeDebt Securities $ 1,485,924UNC Investment Fund 10,533,391Domestic Stocks 3,551,723Foreign Stocks 2,387,091Limited Partnership 7,988
Total Investments $ 17,966,117
NOTE 3 - FAIR VALUE MEASUREMENTS
University - To the extent available, the University’s investments are recorded at fair value as of June 30, 2019. GASB Statement No. 72, Fair Value Measurement and Application, defines fair value as the price that would be received to sell an asset or paid to transfer a liability in an orderly transaction between market participants at the measurement date. This statement establishes a hierarchy of valuation inputs based on the extent to which the inputs are observable in the marketplace. Inputs are used in applying the various valuation techniques and take into account the assumptions that market participants use to make valuation decisions. Inputs may include price information, credit data, interest and yield curve data, and other factors specific to the financial instrument. Observable inputs reflect market data obtained from independent sources. In contrast, unobservable inputs reflect the entity’s assumptions about how market participants would value the financial instrument. Valuation techniques should maximize the use of observable inputs to the extent available.
A financial instrument’s level within the fair value hierarchy is based on the lowest level of any input that is significant to the fair value measurement. The following describes the hierarchy of inputs used to measure fair value and the primary valuation methodologies used for financial instruments measured at fair value on a recurring basis:
Level 1 Investments whose values are based on quoted prices (unadjusted) for identical assets in active markets that a government can access at the measurement date.
Level 2 Investments with inputs - other than quoted prices included within Level 1 - that are observable for an asset, either directly or indirectly.
29
NOTES TO THE FINANCIAL STATEMENTS
Level 3 Investments classified as Level 3 have unobservable inputs for an asset and may require a degree of professional judgment.
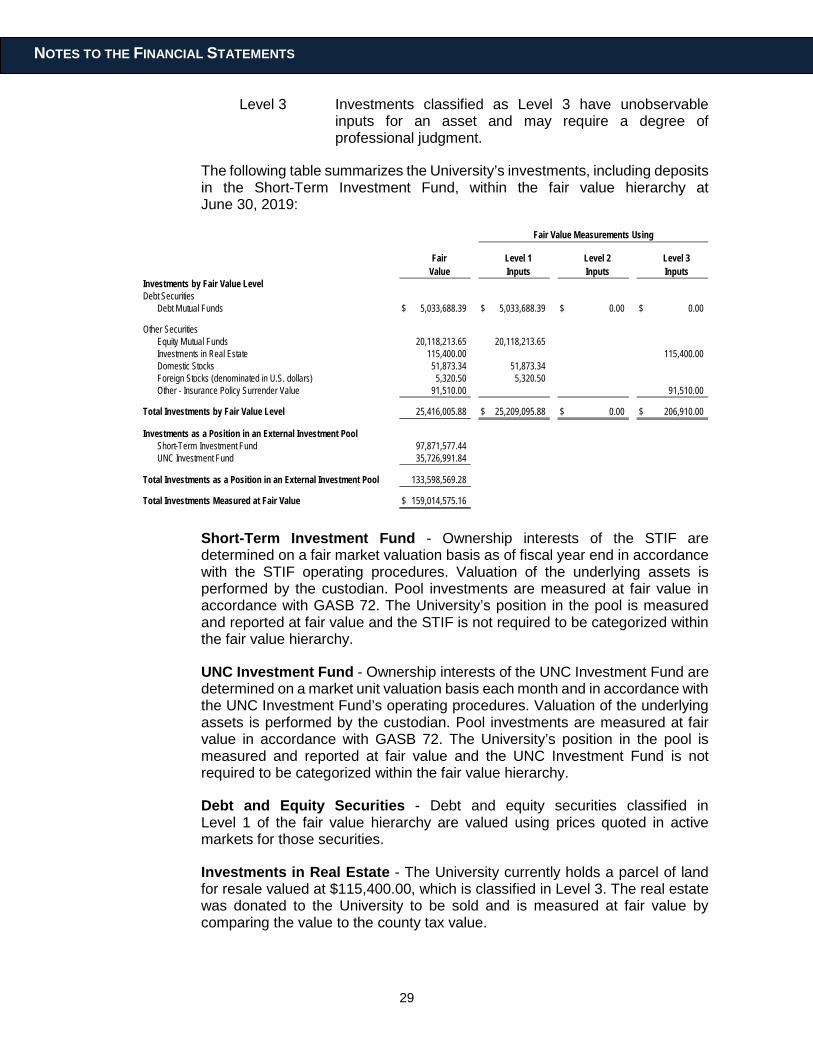
The following table summarizes the University’s investments, including deposits in the Short-Term Investment Fund, within the fair value hierarchy at June 30, 2019:
Fair Level 1 Level 2 Level 3Value Inputs Inputs Inputs
Investments by Fair Value LevelDebt Securities
Debt Mutual Funds $ 5,033,688.39 $ 5,033,688.39 $ 0.00 $ 0.00
Other SecuritiesEquity Mutual Funds 20,118,213.65 20,118,213.65Investments in Real Estate 115,400.00 115,400.00Domestic Stocks 51,873.34 51,873.34Foreign Stocks (denominated in U.S. dollars) 5,320.50 5,320.50Other - Insurance Policy Surrender Value 91,510.00 91,510.00
Total Investments by Fair Value Level 25,416,005.88 $ 25,209,095.88 $ 0.00 $ 206,910.00
Investments as a Position in an External Investment PoolShort-Term Investment Fund 97,871,577.44UNC Investment Fund 35,726,991.84
Total Investments as a Position in an External Investment Pool 133,598,569.28
Total Investments Measured at Fair Value $ 159,014,575.16
Fair Value Measurements Using
Short-Term Investment Fund - Ownership interests of the STIF are determined on a fair market valuation basis as of fiscal year end in accordance with the STIF operating procedures. Valuation of the underlying assets is performed by the custodian. Pool investments are measured at fair value in accordance with GASB 72. The University’s position in the pool is measured and reported at fair value and the STIF is not required to be categorized within the fair value hierarchy.
UNC Investment Fund - Ownership interests of the UNC Investment Fund are determined on a market unit valuation basis each month and in accordance with the UNC Investment Fund’s operating procedures. Valuation of the underlying assets is performed by the custodian. Pool investments are measured at fair value in accordance with GASB 72. The University’s position in the pool is measured and reported at fair value and the UNC Investment Fund is not required to be categorized within the fair value hierarchy.
Debt and Equity Securities - Debt and equity securities classified in Level 1 of the fair value hierarchy are valued using prices quoted in active markets for those securities.
Investments in Real Estate - The University currently holds a parcel of land for resale valued at $115,400.00, which is classified in Level 3. The real estate was donated to the University to be sold and is measured at fair value by comparing the value to the county tax value.
30
NOTES TO THE FINANCIAL STATEMENTS
Insurance Policy Surrender Value - Other investments include an insurance policy with a cash surrender value of $91,510.00. This investment is classified in Level 3. The University uses the value that is supplied by the insurer and is based on the amount available in cash upon cancellation of the insurance policy before maturity.
Component Unit
Because the Foundation reports under the FASB reporting model, the disclosure of fair value measurements differs from the GASB reporting model used by the University.
FASB ASC 820-10, Fair Value Measurements and Disclosures, provides a fair value hierarchy that prioritizes the inputs to valuation techniques used to measure fair value. The hierarchy gives the highest priority to unadjusted quoted prices in active markets for identical assets or liabilities (Level 1 measurements) and the lowest priority to unobservable inputs (Level 3 measurements).
The three levels of the fair-value hierarchy are described as below:
Level 1 Quoted prices in active markets for identical assets or liabilities at the measurement date;
Level 2 Inputs other than Level 1 that are observable, either directly or indirectly, such as quoted prices in active markets for similar assets or liabilities, quoted prices for identical or similar assets or liabilities in markets that are not active, or other inputs that are observable or can be corroborated by observable market data for substantially the full term of the assets or liabilities; or
Level 3 Unobservable inputs that are supported by little or no market activity and that reflect the Foundation’s own assumptions about market prices.
In determining the appropriate levels, the Foundation performs a detailed analysis of the assets and liabilities that are subject to FASB ASC 820-10.
In determining the fair value, the Foundation uses various valuation approaches within the FASB ASC 820-10 fair value measurement framework. The following is a description of the valuation methodologies used for instruments measured at fair value and their classification within the hierarchy:
Equities: Equity securities and equity mutual funds listed on national markets or exchanges are valued at the last sales price, or if there is no sale and the market is considered active, at the mean of the last bid and asked prices on such exchange. Such securities are classified within Level 1 of the valuation hierarchy.
Limited Partnership: Ownership interest in the limited partnership is typically valued using the member’s equity valuation provided by the partnership.
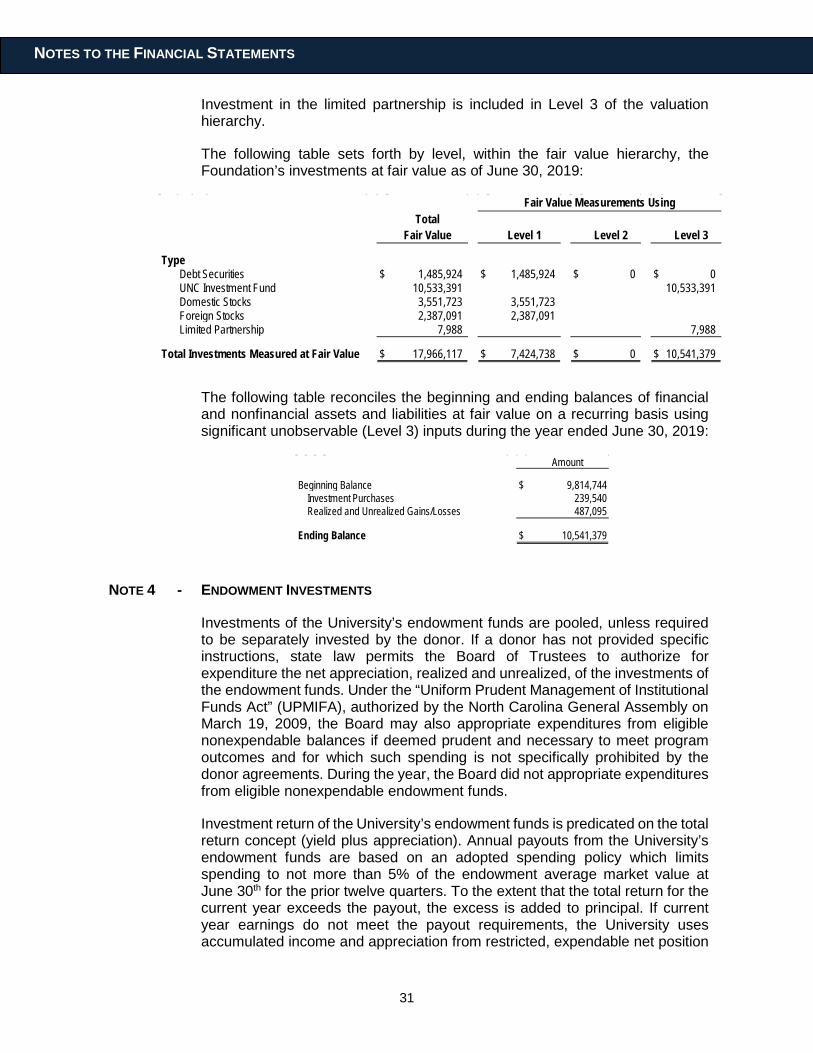
31
NOTES TO THE FINANCIAL STATEMENTS
Investment in the limited partnership is included in Level 3 of the valuation hierarchy.
The following table sets forth by level, within the fair value hierarchy, the Foundation’s investments at fair value as of June 30, 2019:
TotalFair Value Level 1 Level 2 Level 3
TypeDebt Securities $ 1,485,924 $ 1,485,924 $ 0 $ 0UNC Investment Fund 10,533,391 10,533,391Domestic Stocks 3,551,723 3,551,723Foreign Stocks 2,387,091 2,387,091Limited Partnership 7,988 7,988
Total Investments Measured at Fair Value $ 17,966,117 $ 7,424,738 $ 0 $ 10,541,379
Fair Value Measurements Using
The following table reconciles the beginning and ending balances of financial and nonfinancial assets and liabilities at fair value on a recurring basis using significant unobservable (Level 3) inputs during the year ended June 30, 2019:
Amount
Beginning Balance $ 9,814,744Investment Purchases 239,540Realized and Unrealized Gains/Losses 487,095
Ending Balance $ 10,541,379
NOTE 4 - ENDOWMENT INVESTMENTS
Investments of the University’s endowment funds are pooled, unless required to be separately invested by the donor. If a donor has not provided specific instructions, state law permits the Board of Trustees to authorize for expenditure the net appreciation, realized and unrealized, of the investments of the endowment funds. Under the “Uniform Prudent Management of Institutional Funds Act” (UPMIFA), authorized by the North Carolina General Assembly on March 19, 2009, the Board may also appropriate expenditures from eligible nonexpendable balances if deemed prudent and necessary to meet program outcomes and for which such spending is not specifically prohibited by the donor agreements. During the year, the Board did not appropriate expenditures from eligible nonexpendable endowment funds.
Investment return of the University’s endowment funds is predicated on the total return concept (yield plus appreciation). Annual payouts from the University’s endowment funds are based on an adopted spending policy which limits spending to not more than 5% of the endowment average market value at June 30th for the prior twelve quarters. To the extent that the total return for the current year exceeds the payout, the excess is added to principal. If current year earnings do not meet the payout requirements, the University uses accumulated income and appreciation from restricted, expendable net position
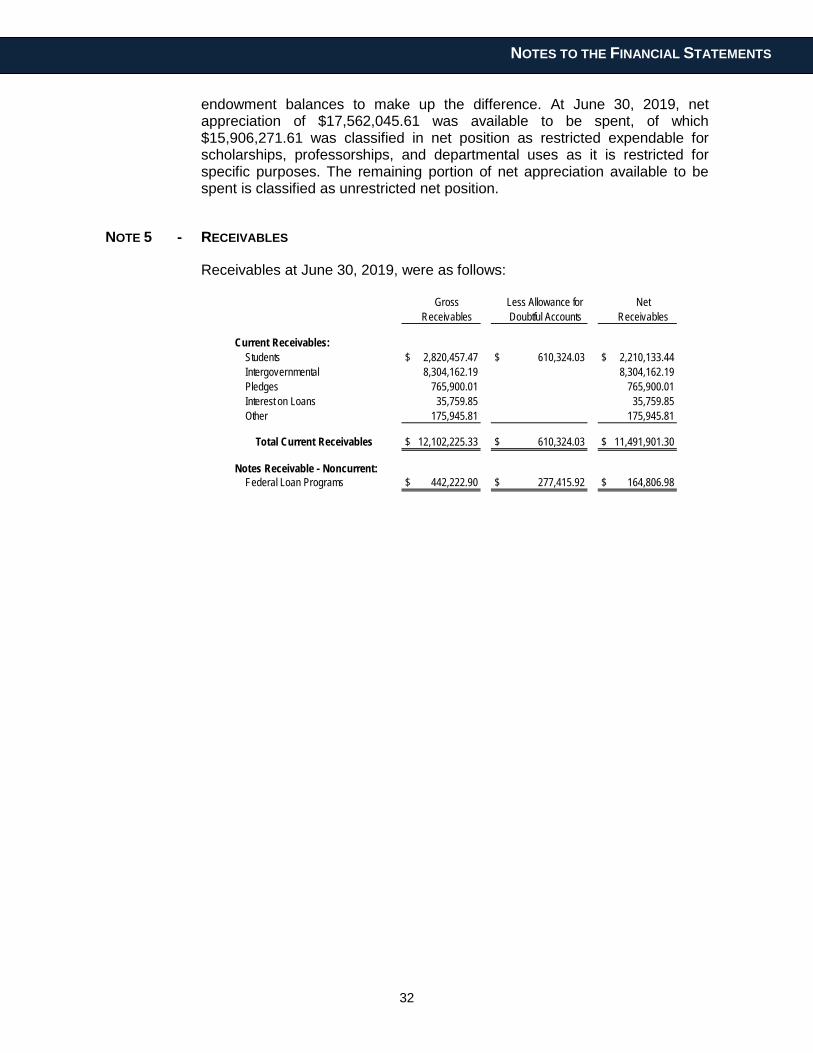
32
NOTES TO THE FINANCIAL STATEMENTS
endowment balances to make up the difference. At June 30, 2019, net appreciation of $17,562,045.61 was available to be spent, of which $15,906,271.61 was classified in net position as restricted expendable for scholarships, professorships, and departmental uses as it is restricted for specific purposes. The remaining portion of net appreciation available to be spent is classified as unrestricted net position.
NOTE 5 - RECEIVABLES
Receivables at June 30, 2019, were as follows:
Gross Less Allowance for NetReceivables Doubtful Accounts Receivables
Current Receivables:Students $ 2,820,457.47 $ 610,324.03 $ 2,210,133.44Intergovernmental 8,304,162.19 8,304,162.19Pledges 765,900.01 765,900.01Interest on Loans 35,759.85 35,759.85Other 175,945.81 175,945.81
Total Current Receivables $ 12,102,225.33 $ 610,324.03 $ 11,491,901.30
Notes Receivable - Noncurrent:Federal Loan Programs $ 442,222.90 $ 277,415.92 $ 164,806.98

33
NOTES TO THE FINANCIAL STATEMENTS
NOTE 6 - CAPITAL ASSETS
A summary of changes in the capital assets for the year ended June 30, 2019, is presented as follows:
Balance BalanceJuly 1, 2018 Increases Decreases June 30, 2019
Capital Assets, Nondepreciable:Land $ 11,228,572.26 $ 47,000.00 $ 0.00 $ 11,275,572.26Art, Literature, and Artifacts 2,538,797.00 2,538,797.00Construction in Progress 86,705,258.38 9,168,789.29 80,707,854.21 15,166,193.46
Total Capital Assets, Nondepreciable 100,472,627.64 9,215,789.29 80,707,854.21 28,980,562.72
Capital Assets, Depreciable:Buildings 374,659,527.46 89,638,982.95 464,298,510.41Machinery and Equipment 77,932,346.35 6,587,264.74 1,795,231.34 82,724,379.75General Infrastructure 20,214,357.19 176,907.02 20,391,264.21
Total Capital Assets, Depreciable 472,806,231.00 96,403,154.71 1,795,231.34 567,414,154.37
Less Accumulated Depreciation for:Buildings 131,543,875.47 8,864,900.88 140,408,776.35Machinery and Equipment 37,469,851.51 3,856,085.13 1,364,890.82 39,961,045.82General Infrastructure 9,068,993.55 701,765.83 9,770,759.38
Total Accumulated Depreciation 178,082,720.53 13,422,751.84 1,364,890.82 190,140,581.55
Total Capital Assets, Depreciable, Net 294,723,510.47 82,980,402.87 430,340.52 377,273,572.82
Capital Assets, Net $ 395,196,138.11 $ 92,196,192.16 $ 81,138,194.73 $ 406,254,135.54
NOTE 7 - ACCOUNTS PAYABLE AND ACCRUED LIABILITIES
Accounts payable and accrued liabilities at June 30, 2019, were as follows:
AmountAccounts Payable and Accrued Liabilities
Accounts Payable $ 3,600,673.11Accounts Payable - Capital Assets 2,111,605.66Accrued Payroll 925,604.67Contract Retainage 709,942.05Intergovernmental Payables 249,489.52
Total Accounts Payable and Accrued Liabilities $ 7,597,315.01
NOTE 8 - LONG-TERM LIABILITIES
University
A. Changes in Long-Term Liabilities - A summary of changes in the long-term liabilities for the year ended June 30, 2019, is presented as follows:
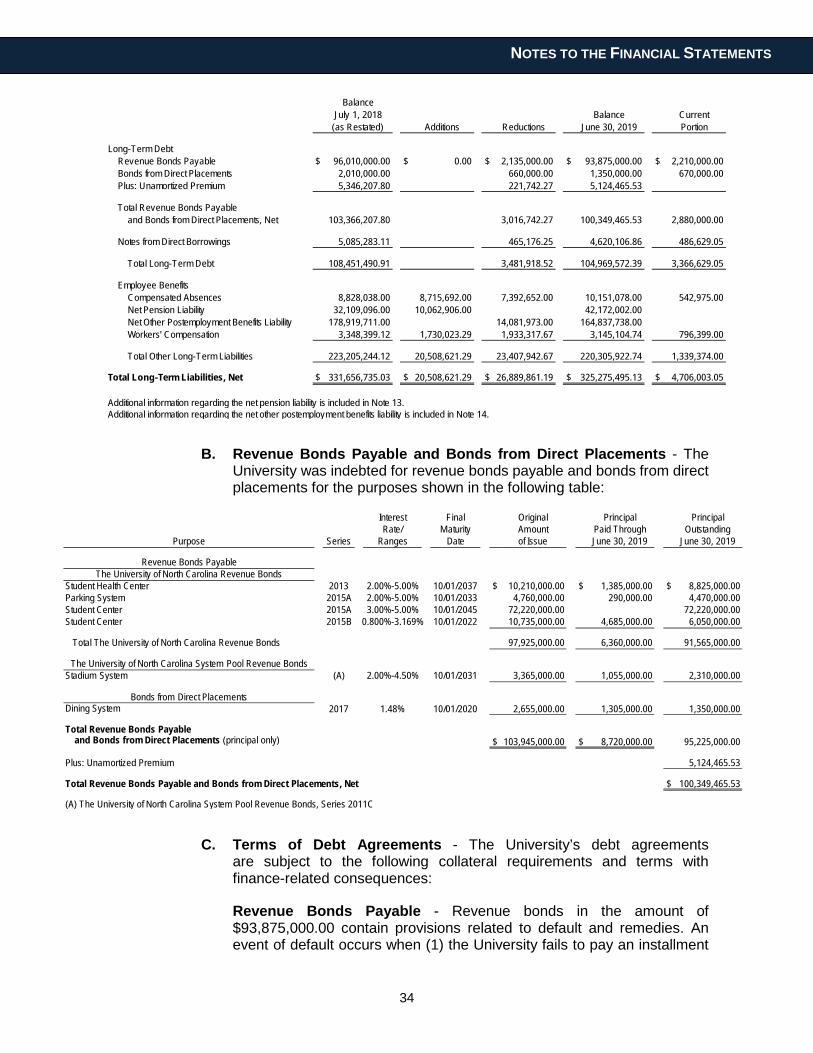
34
NOTES TO THE FINANCIAL STATEMENTS
BalanceJuly 1, 2018 Balance Current
(as Restated) Additions Reductions June 30, 2019 Portion
Long-Term DebtRevenue Bonds Payable $ 96,010,000.00 $ 0.00 $ 2,135,000.00 $ 93,875,000.00 $ 2,210,000.00Bonds from Direct Placements 2,010,000.00 660,000.00 1,350,000.00 670,000.00Plus: Unamortized Premium 5,346,207.80 221,742.27 5,124,465.53
Total Revenue Bonds Payableand Bonds from Direct Placements, Net 103,366,207.80 3,016,742.27 100,349,465.53 2,880,000.00
Notes from Direct Borrowings 5,085,283.11 465,176.25 4,620,106.86 486,629.05
Total Long-Term Debt 108,451,490.91 3,481,918.52 104,969,572.39 3,366,629.05
Employee BenefitsCompensated Absences 8,828,038.00 8,715,692.00 7,392,652.00 10,151,078.00 542,975.00Net Pension Liability 32,109,096.00 10,062,906.00 42,172,002.00Net Other Postemployment Benefits Liability 178,919,711.00 14,081,973.00 164,837,738.00Workers' Compensation 3,348,399.12 1,730,023.29 1,933,317.67 3,145,104.74 796,399.00
Total Other Long-Term Liabilities 223,205,244.12 20,508,621.29 23,407,942.67 220,305,922.74 1,339,374.00
Total Long-Term Liabilities, Net $ 331,656,735.03 $ 20,508,621.29 $ 26,889,861.19 $ 325,275,495.13 $ 4,706,003.05
Additional information regarding the net pension liability is included in Note 13.Additional information regarding the net other postemployment benefits liability is included in Note 14.
B. Revenue Bonds Payable and Bonds from Direct Placements - The University was indebted for revenue bonds payable and bonds from direct placements for the purposes shown in the following table:
Interest Final Original Principal PrincipalRate/ Maturity Amount Paid Through Outstanding
Purpose Series Ranges Date of Issue June 30, 2019 June 30, 2019
Revenue Bonds PayableThe University of North Carolina Revenue Bonds
Student Health Center 2013 2.00%-5.00% 10/01/2037 $ 10,210,000.00 $ 1,385,000.00 $ 8,825,000.00Parking System 2015A 2.00%-5.00% 10/01/2033 4,760,000.00 290,000.00 4,470,000.00Student Center 2015A 3.00%-5.00% 10/01/2045 72,220,000.00 72,220,000.00Student Center 2015B 0.800%-3.169% 10/01/2022 10,735,000.00 4,685,000.00 6,050,000.00
Total The University of North Carolina Revenue Bonds 97,925,000.00 6,360,000.00 91,565,000.00
The University of North Carolina System Pool Revenue BondsStadium System (A) 2.00%-4.50% 10/01/2031 3,365,000.00 1,055,000.00 2,310,000.00
Bonds from Direct PlacementsDining System 2017 1.48% 10/01/2020 2,655,000.00 1,305,000.00 1,350,000.00
Total Revenue Bonds Payableand Bonds from Direct Placements (principal only) $ 103,945,000.00 $ 8,720,000.00 95,225,000.00
Plus: Unamortized Premium 5,124,465.53
Total Revenue Bonds Payable and Bonds from Direct Placements, Net $ 100,349,465.53
(A) The University of North Carolina System Pool Revenue Bonds, Series 2011C
C. Terms of Debt Agreements - The University’s debt agreements are subject to the following collateral requirements and terms with finance-related consequences:
Revenue Bonds Payable - Revenue bonds in the amount of $93,875,000.00 contain provisions related to default and remedies. An event of default occurs when (1) the University fails to pay an installment
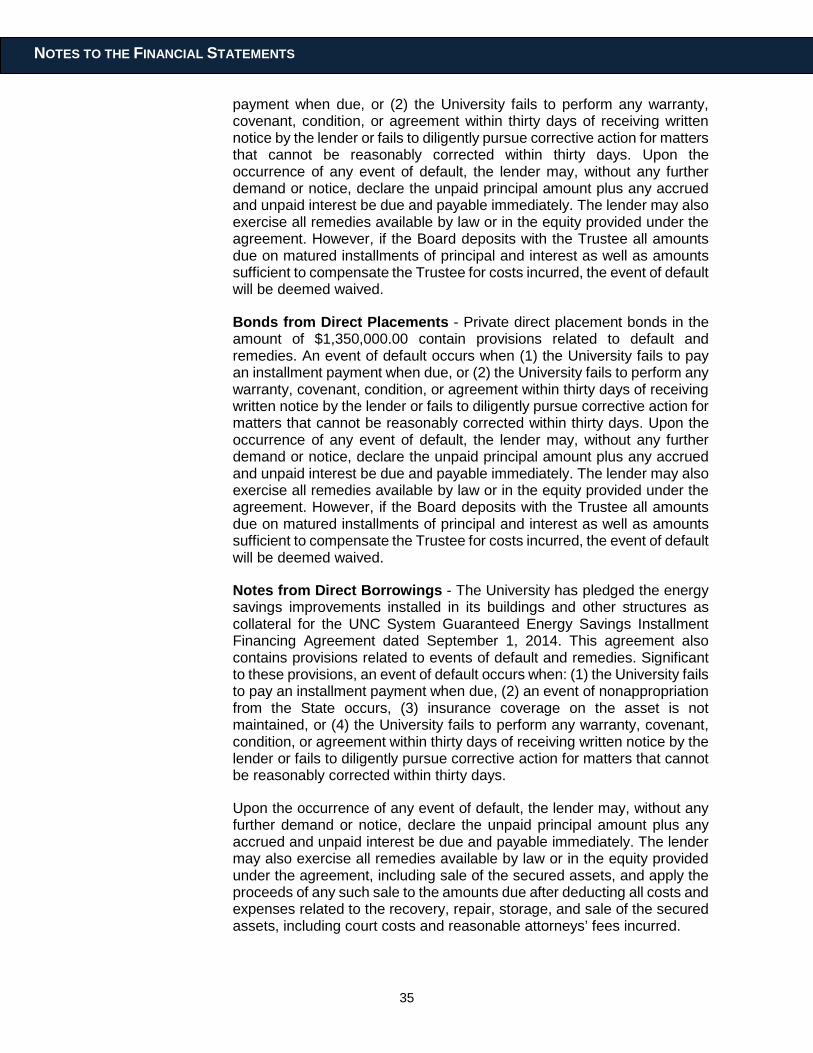
35
NOTES TO THE FINANCIAL STATEMENTS
payment when due, or (2) the University fails to perform any warranty, covenant, condition, or agreement within thirty days of receiving written notice by the lender or fails to diligently pursue corrective action for matters that cannot be reasonably corrected within thirty days. Upon the occurrence of any event of default, the lender may, without any further demand or notice, declare the unpaid principal amount plus any accrued and unpaid interest be due and payable immediately. The lender may also exercise all remedies available by law or in the equity provided under the agreement. However, if the Board deposits with the Trustee all amounts due on matured installments of principal and interest as well as amounts sufficient to compensate the Trustee for costs incurred, the event of default will be deemed waived.
Bonds from Direct Placements - Private direct placement bonds in the amount of $1,350,000.00 contain provisions related to default and remedies. An event of default occurs when (1) the University fails to pay an installment payment when due, or (2) the University fails to perform any warranty, covenant, condition, or agreement within thirty days of receiving written notice by the lender or fails to diligently pursue corrective action for matters that cannot be reasonably corrected within thirty days. Upon the occurrence of any event of default, the lender may, without any further demand or notice, declare the unpaid principal amount plus any accrued and unpaid interest be due and payable immediately. The lender may also exercise all remedies available by law or in the equity provided under the agreement. However, if the Board deposits with the Trustee all amounts due on matured installments of principal and interest as well as amounts sufficient to compensate the Trustee for costs incurred, the event of default will be deemed waived.
Notes from Direct Borrowings - The University has pledged the energy savings improvements installed in its buildings and other structures as collateral for the UNC System Guaranteed Energy Savings Installment Financing Agreement dated September 1, 2014. This agreement also contains provisions related to events of default and remedies. Significant to these provisions, an event of default occurs when: (1) the University fails to pay an installment payment when due, (2) an event of nonappropriation from the State occurs, (3) insurance coverage on the asset is not maintained, or (4) the University fails to perform any warranty, covenant, condition, or agreement within thirty days of receiving written notice by the lender or fails to diligently pursue corrective action for matters that cannot be reasonably corrected within thirty days.
Upon the occurrence of any event of default, the lender may, without any further demand or notice, declare the unpaid principal amount plus any accrued and unpaid interest be due and payable immediately. The lender may also exercise all remedies available by law or in the equity provided under the agreement, including sale of the secured assets, and apply the proceeds of any such sale to the amounts due after deducting all costs and expenses related to the recovery, repair, storage, and sale of the secured assets, including court costs and reasonable attorneys’ fees incurred.
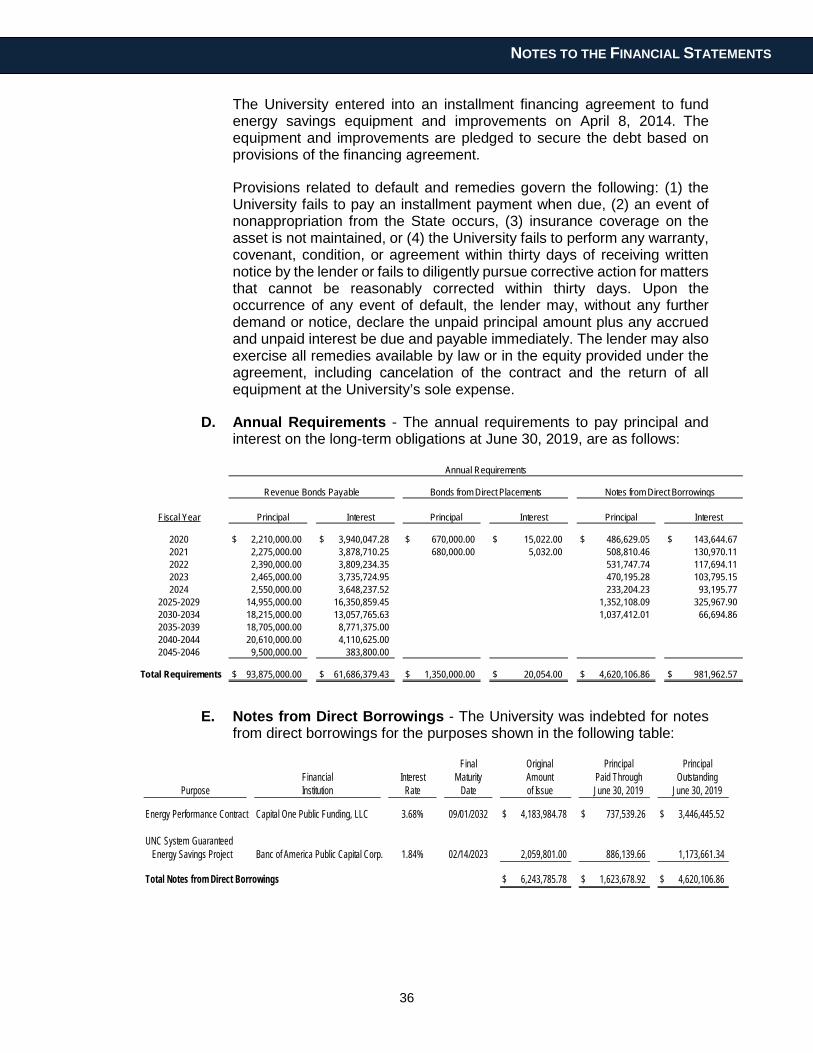
36
NOTES TO THE FINANCIAL STATEMENTS
The University entered into an installment financing agreement to fund energy savings equipment and improvements on April 8, 2014. The equipment and improvements are pledged to secure the debt based on provisions of the financing agreement.
Provisions related to default and remedies govern the following: (1) the University fails to pay an installment payment when due, (2) an event of nonappropriation from the State occurs, (3) insurance coverage on the asset is not maintained, or (4) the University fails to perform any warranty, covenant, condition, or agreement within thirty days of receiving written notice by the lender or fails to diligently pursue corrective action for matters that cannot be reasonably corrected within thirty days. Upon the occurrence of any event of default, the lender may, without any further demand or notice, declare the unpaid principal amount plus any accrued and unpaid interest be due and payable immediately. The lender may also exercise all remedies available by law or in the equity provided under the agreement, including cancelation of the contract and the return of all equipment at the University’s sole expense.
D. Annual Requirements - The annual requirements to pay principal and interest on the long-term obligations at June 30, 2019, are as follows:
Fiscal Year Principal Interest Principal Interest Principal Interest
2020 $ 2,210,000.00 $ 3,940,047.28 $ 670,000.00 $ 15,022.00 $ 486,629.05 $ 143,644.672021 2,275,000.00 3,878,710.25 680,000.00 5,032.00 508,810.46 130,970.112022 2,390,000.00 3,809,234.35 531,747.74 117,694.112023 2,465,000.00 3,735,724.95 470,195.28 103,795.152024 2,550,000.00 3,648,237.52 233,204.23 93,195.77
2025-2029 14,955,000.00 16,350,859.45 1,352,108.09 325,967.902030-2034 18,215,000.00 13,057,765.63 1,037,412.01 66,694.862035-2039 18,705,000.00 8,771,375.002040-2044 20,610,000.00 4,110,625.002045-2046 9,500,000.00 383,800.00
Total Requirements $ 93,875,000.00 $ 61,686,379.43 $ 1,350,000.00 $ 20,054.00 $ 4,620,106.86 $ 981,962.57
Revenue Bonds Payable
Annual Requirements
Bonds from Direct Placements Notes from Direct Borrowings
E. Notes from Direct Borrowings - The University was indebted for notes from direct borrowings for the purposes shown in the following table:
Final Original Principal PrincipalFinancial Interest Maturity Amount Paid Through Outstanding
Purpose Institution Rate Date of Issue June 30, 2019 June 30, 2019
Energy Performance Contract Capital One Public Funding, LLC 3.68% 09/01/2032 $ 4,183,984.78 $ 737,539.26 $ 3,446,445.52
UNC System Guaranteed Energy Savings Project Banc of America Public Capital Corp. 1.84% 02/14/2023 2,059,801.00 886,139.66 1,173,661.34
Total Notes from Direct Borrowings $ 6,243,785.78 $ 1,623,678.92 $ 4,620,106.86
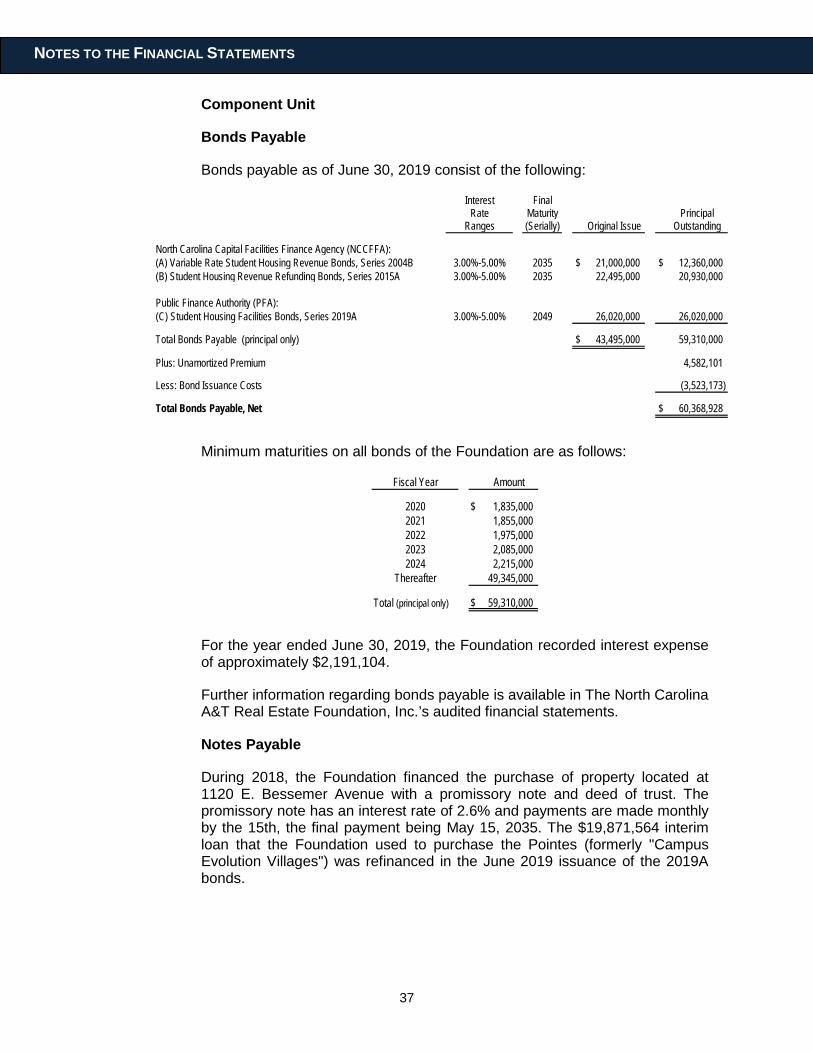
37
NOTES TO THE FINANCIAL STATEMENTS
Component Unit
Bonds Payable
Bonds payable as of June 30, 2019 consist of the following:
Interest FinalRate Maturity Principal
Ranges (Serially) Original Issue Outstanding
North Carolina Capital Facilities Finance Agency (NCCFFA):(A) Variable Rate Student Housing Revenue Bonds, Series 2004B 3.00%-5.00% 2035 $ 21,000,000 $ 12,360,000(B) Student Housing Revenue Refunding Bonds, Series 2015A 3.00%-5.00% 2035 22,495,000 20,930,000
Public Finance Authority (PFA): (C) Student Housing Facilities Bonds, Series 2019A 3.00%-5.00% 2049 26,020,000 26,020,000
Total Bonds Payable (principal only) $ 43,495,000 59,310,000
Plus: Unamortized Premium 4,582,101
Less: Bond Issuance Costs (3,523,173)
Total Bonds Payable, Net $ 60,368,928
Minimum maturities on all bonds of the Foundation are as follows:
Fiscal Year Amount
2020 $ 1,835,0002021 1,855,0002022 1,975,0002023 2,085,0002024 2,215,000
Thereafter 49,345,000
Total (principal only) $ 59,310,000
For the year ended June 30, 2019, the Foundation recorded interest expense of approximately $2,191,104.
Further information regarding bonds payable is available in The North Carolina A&T Real Estate Foundation, Inc.’s audited financial statements.
Notes Payable
During 2018, the Foundation financed the purchase of property located at 1120 E. Bessemer Avenue with a promissory note and deed of trust. The promissory note has an interest rate of 2.6% and payments are made monthly by the 15th, the final payment being May 15, 2035. The $19,871,564 interim loan that the Foundation used to purchase the Pointes (formerly "Campus Evolution Villages") was refinanced in the June 2019 issuance of the 2019A bonds.
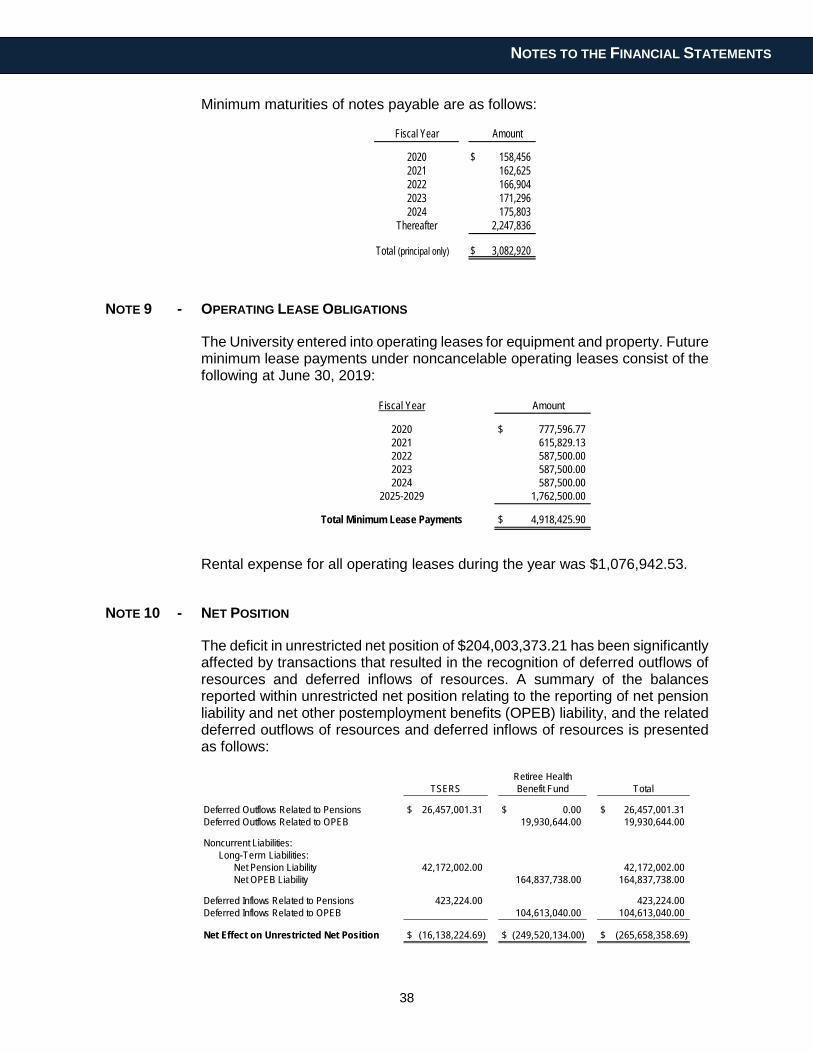
38
NOTES TO THE FINANCIAL STATEMENTS
Minimum maturities of notes payable are as follows:
Fiscal Year Amount
2020 $ 158,4562021 162,6252022 166,9042023 171,2962024 175,803
Thereafter 2,247,836
Total (principal only) $ 3,082,920
NOTE 9 - OPERATING LEASE OBLIGATIONS
The University entered into operating leases for equipment and property. Future minimum lease payments under noncancelable operating leases consist of the following at June 30, 2019:
Fiscal Year Amount
2020 $ 777,596.772021 615,829.132022 587,500.002023 587,500.002024 587,500.00
2025-2029 1,762,500.00
Total Minimum Lease Payments $ 4,918,425.90
Rental expense for all operating leases during the year was $1,076,942.53.
NOTE 10 - NET POSITION
The deficit in unrestricted net position of $204,003,373.21 has been significantly affected by transactions that resulted in the recognition of deferred outflows of resources and deferred inflows of resources. A summary of the balances reported within unrestricted net position relating to the reporting of net pension liability and net other postemployment benefits (OPEB) liability, and the related deferred outflows of resources and deferred inflows of resources is presented as follows:
Deferred Outflows Related to Pensions $ 26,457,001.31 $ 0.00 $ 26,457,001.31Deferred Outflows Related to OPEB 19,930,644.00 19,930,644.00
Noncurrent Liabilities:Long-Term Liabilities:
Net Pension Liability 42,172,002.00 42,172,002.00Net OPEB Liability 164,837,738.00 164,837,738.00
Deferred Inflows Related to Pensions 423,224.00 423,224.00Deferred Inflows Related to OPEB 104,613,040.00 104,613,040.00
Net Effect on Unrestricted Net Position $ (16,138,224.69) $ (249,520,134.00) $ (265,658,358.69)
TSERS Benefit Fund TotalRetiree Health
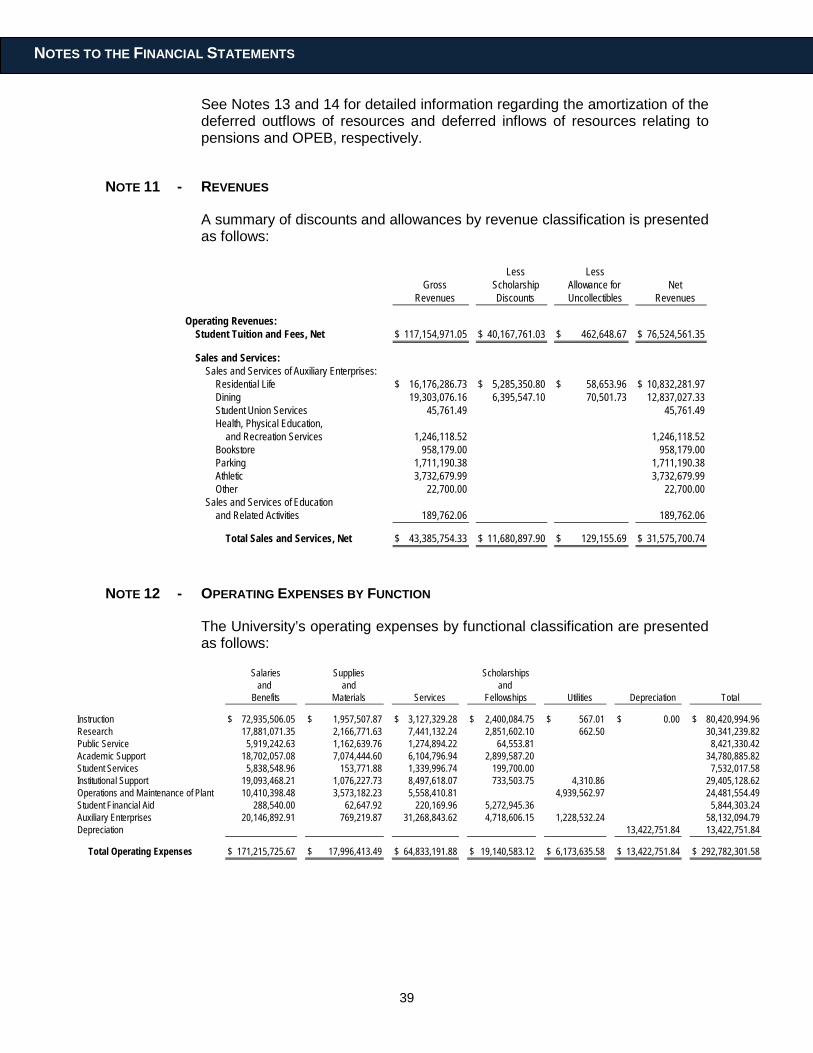
39
NOTES TO THE FINANCIAL STATEMENTS
See Notes 13 and 14 for detailed information regarding the amortization of the deferred outflows of resources and deferred inflows of resources relating to pensions and OPEB, respectively.
NOTE 11 - REVENUES
A summary of discounts and allowances by revenue classification is presented as follows:
Less LessGross Scholarship Allowance for Net
Revenues Discounts Uncollectibles Revenues
Operating Revenues:Student Tuition and Fees, Net $ 117,154,971.05 $ 40,167,761.03 $ 462,648.67 $ 76,524,561.35
Sales and Services:Sales and Services of Auxiliary Enterprises:
Residential Life $ 16,176,286.73 $ 5,285,350.80 $ 58,653.96 $ 10,832,281.97Dining 19,303,076.16 6,395,547.10 70,501.73 12,837,027.33Student Union Services 45,761.49 45,761.49Health, Physical Education,
and Recreation Services 1,246,118.52 1,246,118.52Bookstore 958,179.00 958,179.00Parking 1,711,190.38 1,711,190.38Athletic 3,732,679.99 3,732,679.99Other 22,700.00 22,700.00
Sales and Services of Education and Related Activities 189,762.06 189,762.06
Total Sales and Services, Net $ 43,385,754.33 $ 11,680,897.90 $ 129,155.69 $ 31,575,700.74
NOTE 12 - OPERATING EXPENSES BY FUNCTION
The University’s operating expenses by functional classification are presented as follows:
Salaries Supplies Scholarshipsand and and
Benefits Materials Services Fellowships Utilities Depreciation Total
Instruction $ 72,935,506.05 $ 1,957,507.87 $ 3,127,329.28 $ 2,400,084.75 $ 567.01 $ 0.00 $ 80,420,994.96Research 17,881,071.35 2,166,771.63 7,441,132.24 2,851,602.10 662.50 30,341,239.82Public Service 5,919,242.63 1,162,639.76 1,274,894.22 64,553.81 8,421,330.42Academic Support 18,702,057.08 7,074,444.60 6,104,796.94 2,899,587.20 34,780,885.82Student Services 5,838,548.96 153,771.88 1,339,996.74 199,700.00 7,532,017.58Institutional Support 19,093,468.21 1,076,227.73 8,497,618.07 733,503.75 4,310.86 29,405,128.62Operations and Maintenance of Plant 10,410,398.48 3,573,182.23 5,558,410.81 4,939,562.97 24,481,554.49Student Financial Aid 288,540.00 62,647.92 220,169.96 5,272,945.36 5,844,303.24Auxiliary Enterprises 20,146,892.91 769,219.87 31,268,843.62 4,718,606.15 1,228,532.24 58,132,094.79Depreciation 13,422,751.84 13,422,751.84
Total Operating Expenses $ 171,215,725.67 $ 17,996,413.49 $ 64,833,191.88 $ 19,140,583.12 $ 6,173,635.58 $ 13,422,751.84 $ 292,782,301.58
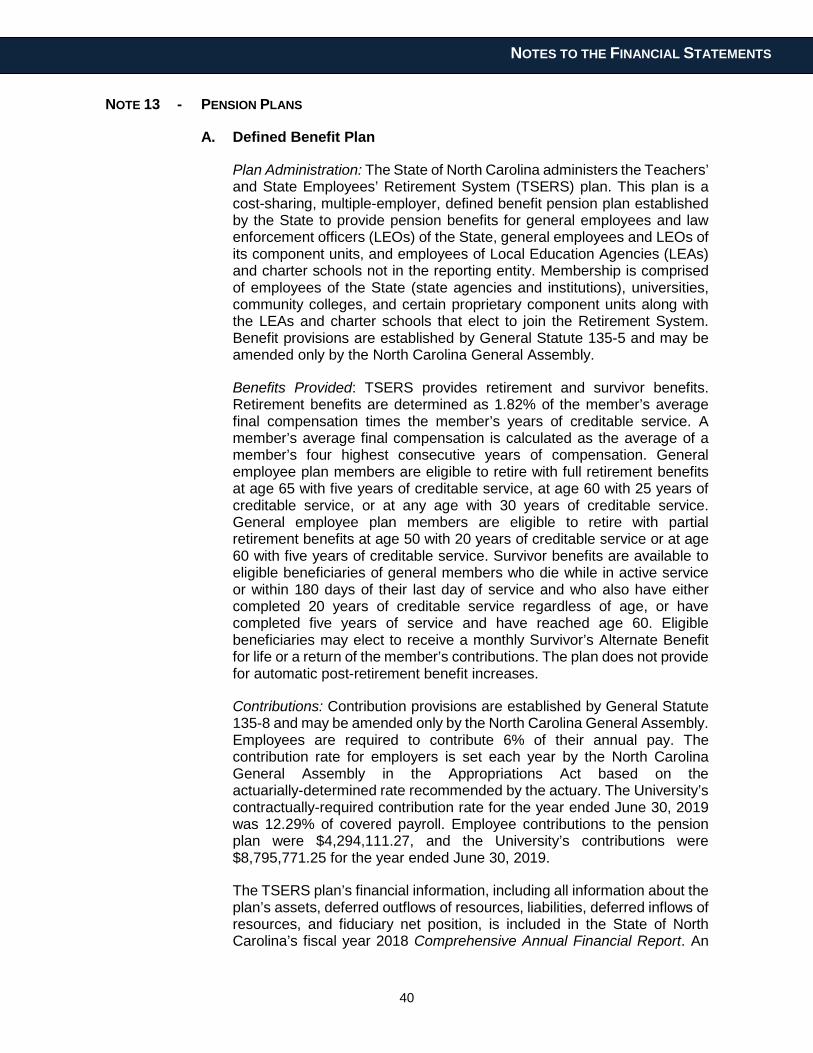
40
NOTES TO THE FINANCIAL STATEMENTS
NOTE 13 - PENSION PLANS
A. Defined Benefit Plan
Plan Administration: The State of North Carolina administers the Teachers’ and State Employees’ Retirement System (TSERS) plan. This plan is a cost-sharing, multiple-employer, defined benefit pension plan established by the State to provide pension benefits for general employees and law enforcement officers (LEOs) of the State, general employees and LEOs of its component units, and employees of Local Education Agencies (LEAs) and charter schools not in the reporting entity. Membership is comprised of employees of the State (state agencies and institutions), universities, community colleges, and certain proprietary component units along with the LEAs and charter schools that elect to join the Retirement System. Benefit provisions are established by General Statute 135-5 and may be amended only by the North Carolina General Assembly.
Benefits Provided: TSERS provides retirement and survivor benefits. Retirement benefits are determined as 1.82% of the member’s average final compensation times the member’s years of creditable service. A member’s average final compensation is calculated as the average of a member’s four highest consecutive years of compensation. General employee plan members are eligible to retire with full retirement benefits at age 65 with five years of creditable service, at age 60 with 25 years of creditable service, or at any age with 30 years of creditable service. General employee plan members are eligible to retire with partial retirement benefits at age 50 with 20 years of creditable service or at age 60 with five years of creditable service. Survivor benefits are available to eligible beneficiaries of general members who die while in active service or within 180 days of their last day of service and who also have either completed 20 years of creditable service regardless of age, or have completed five years of service and have reached age 60. Eligible beneficiaries may elect to receive a monthly Survivor’s Alternate Benefit for life or a return of the member’s contributions. The plan does not provide for automatic post-retirement benefit increases.
Contributions: Contribution provisions are established by General Statute 135-8 and may be amended only by the North Carolina General Assembly. Employees are required to contribute 6% of their annual pay. The contribution rate for employers is set each year by the North Carolina General Assembly in the Appropriations Act based on the actuarially-determined rate recommended by the actuary. The University’s contractually-required contribution rate for the year ended June 30, 2019 was 12.29% of covered payroll. Employee contributions to the pension plan were $4,294,111.27, and the University’s contributions were $8,795,771.25 for the year ended June 30, 2019.
The TSERS plan’s financial information, including all information about the plan’s assets, deferred outflows of resources, liabilities, deferred inflows of resources, and fiduciary net position, is included in the State of North Carolina’s fiscal year 2018 Comprehensive Annual Financial Report. An
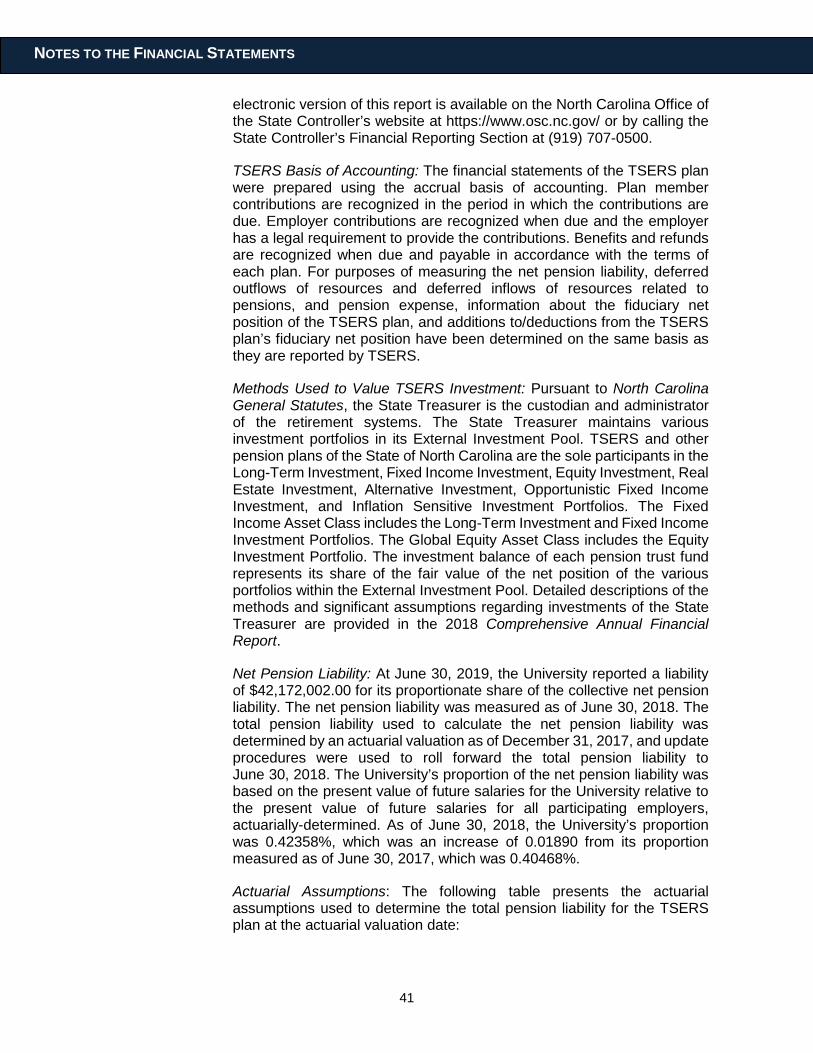
41
NOTES TO THE FINANCIAL STATEMENTS
electronic version of this report is available on the North Carolina Office of the State Controller’s website at https://www.osc.nc.gov/ or by calling the State Controller’s Financial Reporting Section at (919) 707-0500.
TSERS Basis of Accounting: The financial statements of the TSERS plan were prepared using the accrual basis of accounting. Plan member contributions are recognized in the period in which the contributions are due. Employer contributions are recognized when due and the employer has a legal requirement to provide the contributions. Benefits and refunds are recognized when due and payable in accordance with the terms of each plan. For purposes of measuring the net pension liability, deferred outflows of resources and deferred inflows of resources related to pensions, and pension expense, information about the fiduciary net position of the TSERS plan, and additions to/deductions from the TSERS plan’s fiduciary net position have been determined on the same basis as they are reported by TSERS.
Methods Used to Value TSERS Investment: Pursuant to North Carolina General Statutes, the State Treasurer is the custodian and administrator of the retirement systems. The State Treasurer maintains various investment portfolios in its External Investment Pool. TSERS and other pension plans of the State of North Carolina are the sole participants in the Long-Term Investment, Fixed Income Investment, Equity Investment, Real Estate Investment, Alternative Investment, Opportunistic Fixed Income Investment, and Inflation Sensitive Investment Portfolios. The Fixed Income Asset Class includes the Long-Term Investment and Fixed Income Investment Portfolios. The Global Equity Asset Class includes the Equity Investment Portfolio. The investment balance of each pension trust fund represents its share of the fair value of the net position of the various portfolios within the External Investment Pool. Detailed descriptions of the methods and significant assumptions regarding investments of the State Treasurer are provided in the 2018 Comprehensive Annual Financial Report.
Net Pension Liability: At June 30, 2019, the University reported a liability of $42,172,002.00 for its proportionate share of the collective net pension liability. The net pension liability was measured as of June 30, 2018. The total pension liability used to calculate the net pension liability was determined by an actuarial valuation as of December 31, 2017, and update procedures were used to roll forward the total pension liability to June 30, 2018. The University’s proportion of the net pension liability was based on the present value of future salaries for the University relative to the present value of future salaries for all participating employers, actuarially-determined. As of June 30, 2018, the University’s proportion was 0.42358%, which was an increase of 0.01890 from its proportion measured as of June 30, 2017, which was 0.40468%.
Actuarial Assumptions: The following table presents the actuarial assumptions used to determine the total pension liability for the TSERS plan at the actuarial valuation date:
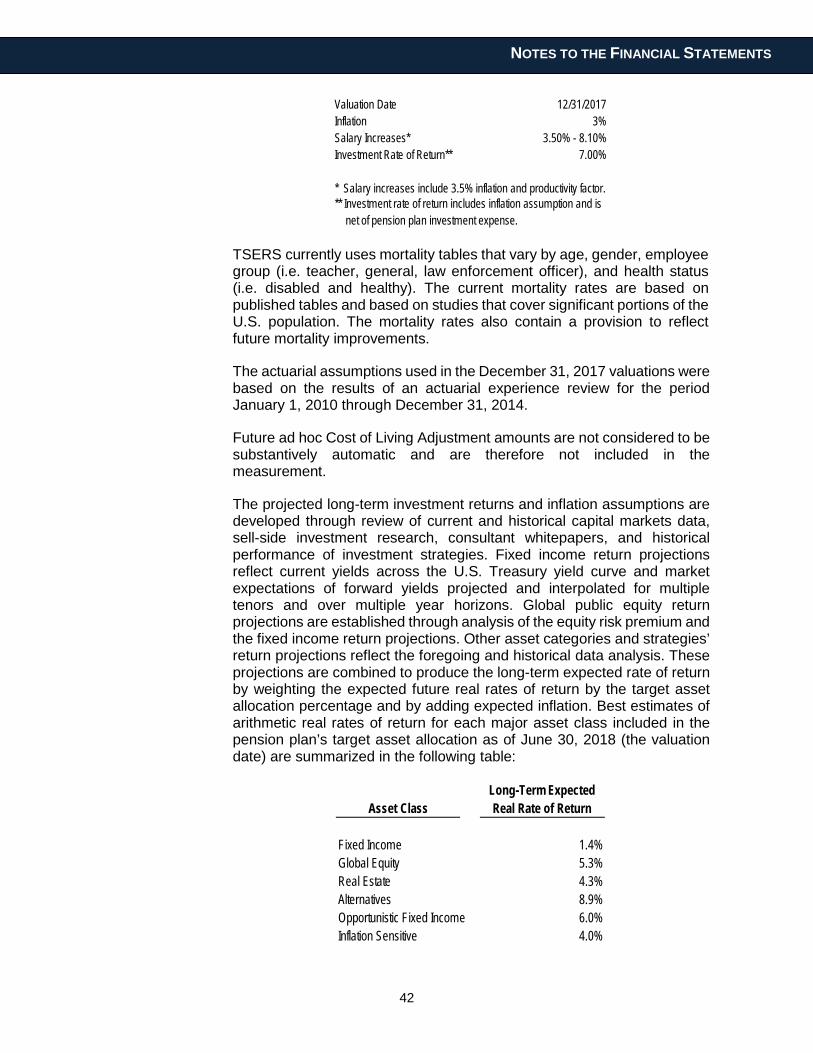
42
NOTES TO THE FINANCIAL STATEMENTS
Valuation Date 12/31/2017Inflation 3%Salary Increases* 3.50% - 8.10%Investment Rate of Return** 7.00%
* Salary increases include 3.5% inflation and productivity factor.** Investment rate of return includes inflation assumption and is net of pension plan investment expense.
TSERS currently uses mortality tables that vary by age, gender, employee group (i.e. teacher, general, law enforcement officer), and health status (i.e. disabled and healthy). The current mortality rates are based on published tables and based on studies that cover significant portions of the U.S. population. The mortality rates also contain a provision to reflect future mortality improvements.
The actuarial assumptions used in the December 31, 2017 valuations were based on the results of an actuarial experience review for the period January 1, 2010 through December 31, 2014.
Future ad hoc Cost of Living Adjustment amounts are not considered to be substantively automatic and are therefore not included in the measurement.
The projected long-term investment returns and inflation assumptions are developed through review of current and historical capital markets data, sell-side investment research, consultant whitepapers, and historical performance of investment strategies. Fixed income return projections reflect current yields across the U.S. Treasury yield curve and market expectations of forward yields projected and interpolated for multiple tenors and over multiple year horizons. Global public equity return projections are established through analysis of the equity risk premium and the fixed income return projections. Other asset categories and strategies’ return projections reflect the foregoing and historical data analysis. These projections are combined to produce the long-term expected rate of return by weighting the expected future real rates of return by the target asset allocation percentage and by adding expected inflation. Best estimates of arithmetic real rates of return for each major asset class included in the pension plan’s target asset allocation as of June 30, 2018 (the valuation date) are summarized in the following table:
Asset ClassLong-Term Expected Real Rate of Return
Fixed Income 1.4%Global Equity 5.3%Real Estate 4.3%Alternatives 8.9%Opportunistic Fixed Income 6.0%Inflation Sensitive 4.0%
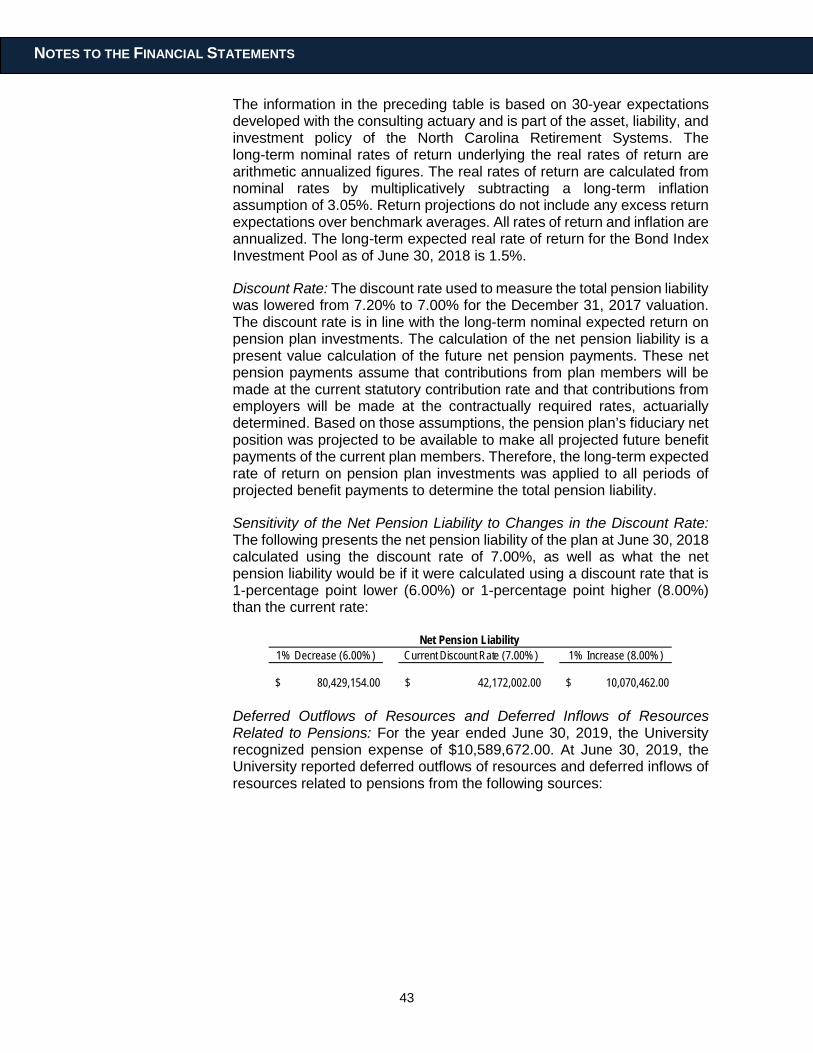
43
NOTES TO THE FINANCIAL STATEMENTS
The information in the preceding table is based on 30-year expectations developed with the consulting actuary and is part of the asset, liability, and investment policy of the North Carolina Retirement Systems. The long-term nominal rates of return underlying the real rates of return are arithmetic annualized figures. The real rates of return are calculated from nominal rates by multiplicatively subtracting a long-term inflation assumption of 3.05%. Return projections do not include any excess return expectations over benchmark averages. All rates of return and inflation are annualized. The long-term expected real rate of return for the Bond Index Investment Pool as of June 30, 2018 is 1.5%.
Discount Rate: The discount rate used to measure the total pension liability was lowered from 7.20% to 7.00% for the December 31, 2017 valuation. The discount rate is in line with the long-term nominal expected return on pension plan investments. The calculation of the net pension liability is a present value calculation of the future net pension payments. These net pension payments assume that contributions from plan members will be made at the current statutory contribution rate and that contributions from employers will be made at the contractually required rates, actuarially determined. Based on those assumptions, the pension plan’s fiduciary net position was projected to be available to make all projected future benefit payments of the current plan members. Therefore, the long-term expected rate of return on pension plan investments was applied to all periods of projected benefit payments to determine the total pension liability.
Sensitivity of the Net Pension Liability to Changes in the Discount Rate: The following presents the net pension liability of the plan at June 30, 2018 calculated using the discount rate of 7.00%, as well as what the net pension liability would be if it were calculated using a discount rate that is 1-percentage point lower (6.00%) or 1-percentage point higher (8.00%) than the current rate:
$ 80,429,154.00 $ 42,172,002.00 $ 10,070,462.00
Net Pension Liability 1% Decrease (6.00% ) Current Discount Rate (7.00% ) 1% Increase (8.00% )
Deferred Outflows of Resources and Deferred Inflows of Resources Related to Pensions: For the year ended June 30, 2019, the University recognized pension expense of $10,589,672.00. At June 30, 2019, the University reported deferred outflows of resources and deferred inflows of resources related to pensions from the following sources:
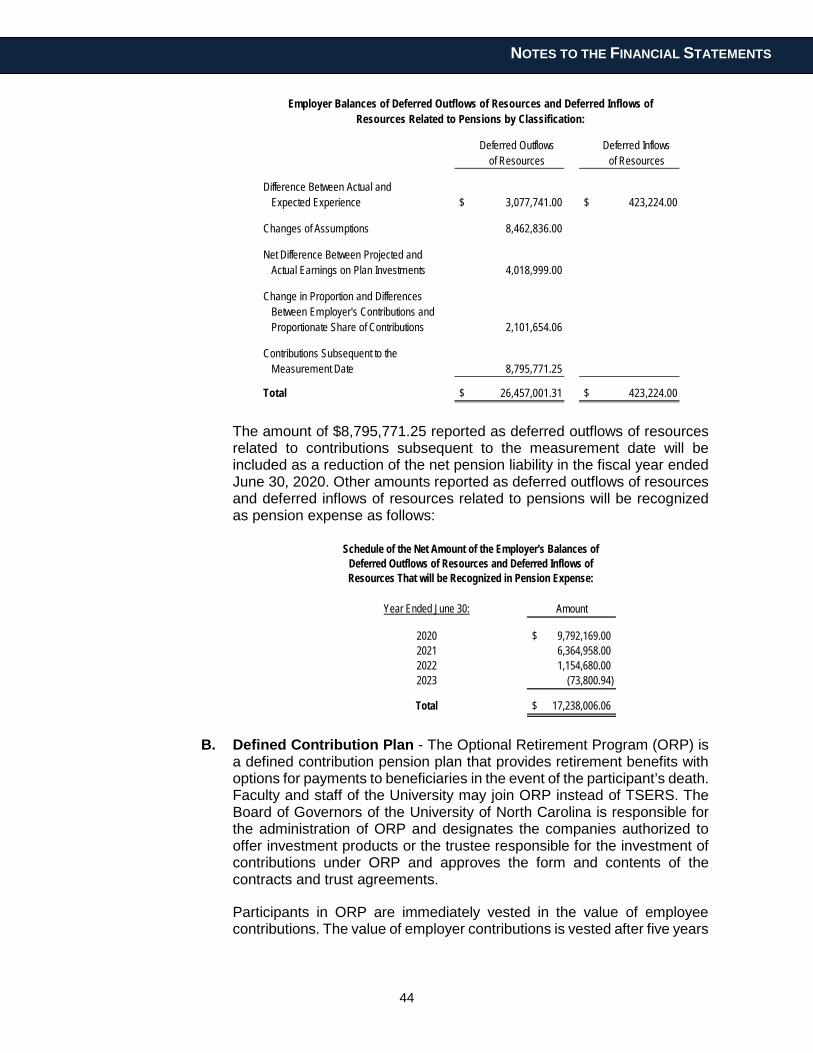
44
NOTES TO THE FINANCIAL STATEMENTS
Deferred Outflows Deferred Inflowsof Resources of Resources
Difference Between Actual and Expected Experience $ 3,077,741.00 $ 423,224.00
Changes of Assumptions 8,462,836.00
Net Difference Between Projected andActual Earnings on Plan Investments 4,018,999.00
Change in Proportion and DifferencesBetween Employer's Contributions andProportionate Share of Contributions 2,101,654.06
Contributions Subsequent to the Measurement Date 8,795,771.25
Total $ 26,457,001.31 $ 423,224.00
Employer Balances of Deferred Outflows of Resources and Deferred Inflows ofResources Related to Pensions by Classification:
The amount of $8,795,771.25 reported as deferred outflows of resources related to contributions subsequent to the measurement date will be included as a reduction of the net pension liability in the fiscal year ended June 30, 2020. Other amounts reported as deferred outflows of resources and deferred inflows of resources related to pensions will be recognized as pension expense as follows:
Year Ended June 30:
2020 $ 9,792,169.00 2021 6,364,958.00 2022 1,154,680.00 2023 (73,800.94)
Total $ 17,238,006.06
Amount
Schedule of the Net Amount of the Employer's Balances of Deferred Outflows of Resources and Deferred Inflows of Resources That will be Recognized in Pension Expense:
B. Defined Contribution Plan - The Optional Retirement Program (ORP) is a defined contribution pension plan that provides retirement benefits with options for payments to beneficiaries in the event of the participant’s death. Faculty and staff of the University may join ORP instead of TSERS. The Board of Governors of the University of North Carolina is responsible for the administration of ORP and designates the companies authorized to offer investment products or the trustee responsible for the investment of contributions under ORP and approves the form and contents of the contracts and trust agreements.
Participants in ORP are immediately vested in the value of employee contributions. The value of employer contributions is vested after five years
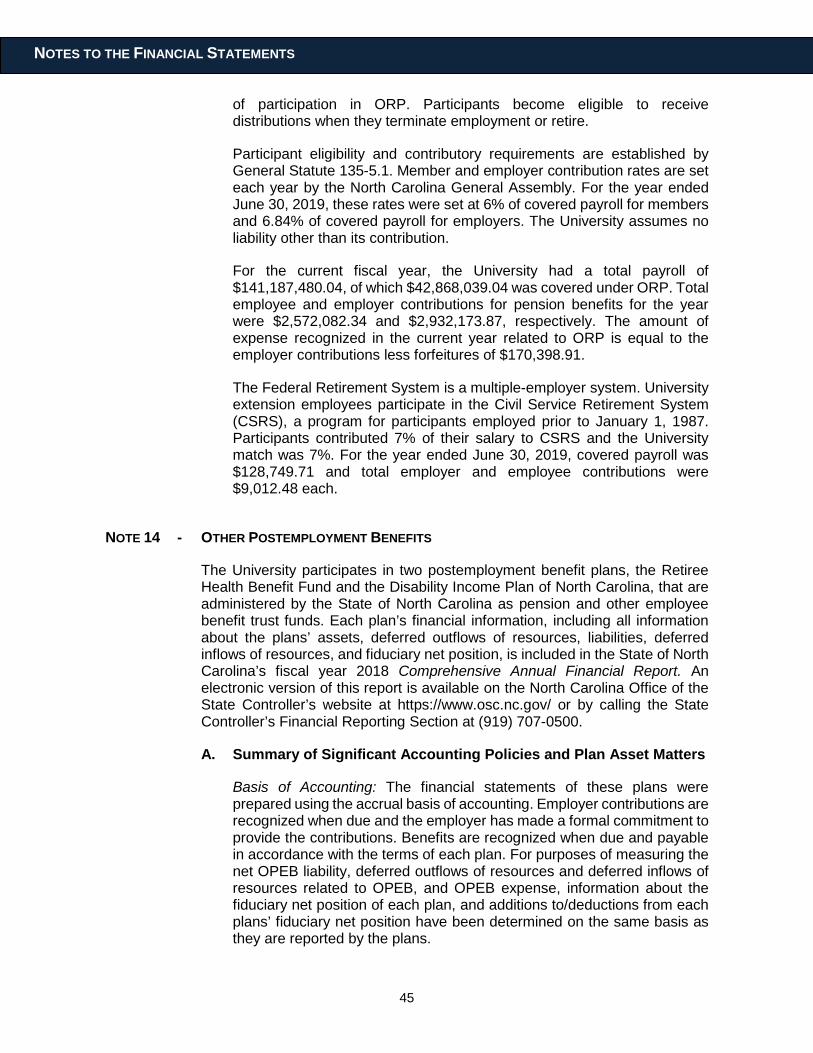
45
NOTES TO THE FINANCIAL STATEMENTS
of participation in ORP. Participants become eligible to receive distributions when they terminate employment or retire.
Participant eligibility and contributory requirements are established by General Statute 135-5.1. Member and employer contribution rates are set each year by the North Carolina General Assembly. For the year ended June 30, 2019, these rates were set at 6% of covered payroll for members and 6.84% of covered payroll for employers. The University assumes no liability other than its contribution.
For the current fiscal year, the University had a total payroll of $141,187,480.04, of which $42,868,039.04 was covered under ORP. Total employee and employer contributions for pension benefits for the year were $2,572,082.34 and $2,932,173.87, respectively. The amount of expense recognized in the current year related to ORP is equal to the employer contributions less forfeitures of $170,398.91.
The Federal Retirement System is a multiple-employer system. University extension employees participate in the Civil Service Retirement System (CSRS), a program for participants employed prior to January 1, 1987. Participants contributed 7% of their salary to CSRS and the University match was 7%. For the year ended June 30, 2019, covered payroll was $128,749.71 and total employer and employee contributions were $9,012.48 each.
NOTE 14 - OTHER POSTEMPLOYMENT BENEFITS
The University participates in two postemployment benefit plans, the Retiree Health Benefit Fund and the Disability Income Plan of North Carolina, that are administered by the State of North Carolina as pension and other employee benefit trust funds. Each plan’s financial information, including all information about the plans’ assets, deferred outflows of resources, liabilities, deferred inflows of resources, and fiduciary net position, is included in the State of North Carolina’s fiscal year 2018 Comprehensive Annual Financial Report. An electronic version of this report is available on the North Carolina Office of the State Controller’s website at https://www.osc.nc.gov/ or by calling the State Controller’s Financial Reporting Section at (919) 707-0500.
A. Summary of Significant Accounting Policies and Plan Asset Matters
Basis of Accounting: The financial statements of these plans were prepared using the accrual basis of accounting. Employer contributions are recognized when due and the employer has made a formal commitment to provide the contributions. Benefits are recognized when due and payable in accordance with the terms of each plan. For purposes of measuring the net OPEB liability, deferred outflows of resources and deferred inflows of resources related to OPEB, and OPEB expense, information about the fiduciary net position of each plan, and additions to/deductions from each plans’ fiduciary net position have been determined on the same basis as they are reported by the plans.
46
NOTES TO THE FINANCIAL STATEMENTS
Methods Used to Value Plan Investments: Pursuant to North Carolina General Statutes, the State Treasurer is the custodian and administrator of the other postemployment benefits funds. The State Treasurer maintains various investment portfolios in its External Investment Pool. The Retiree Health Benefit Fund participates in the External Investment Pool. The Disability Income Plan of North Carolina is invested in the Short-Term Investment Portfolio of the External Investment Pool and the Bond Index External Investment Pool. The investment balance of each other employee benefit trust fund represents its share of the fair value of the net position of the various portfolios within the pool. Detailed descriptions of the methods and significant assumptions regarding investments of the State Treasurer are provided in the 2018 Comprehensive Annual Financial Report.
B. Plan Descriptions
1. Health Benefits
Plan Administration: The State of North Carolina administers the North Carolina State Health Plan for Teachers and State Employees, referred to as the State Health Plan (the Plan), a healthcare plan exclusively for the benefit of employees of the State, the University of North Carolina System, community colleges, and certain other component units. In addition, Local Education Agencies (LEAs), charter schools, and some select local governments that are not part of the State’s financial reporting entity also participate. Health benefit programs and premium rates are determined by the State Treasurer upon approval of the Plan Board of Trustees.
The Retiree Health Benefit Fund (RHBF) has been established as a fund to provide health benefits to retired and disabled employees and their applicable beneficiaries. RHBF is established by General Statute 135-7, Article 1. RHBF is a cost-sharing, multiple-employer, defined benefit healthcare plan, exclusively for the benefit of eligible former employees of the State, the University of North Carolina System, and community colleges. In addition, LEAs, charter schools, and some select local governments that are not part of the State’s financial reporting entity also participate.
By statute, RHBF is administered by the Board of Trustees of the Teachers’ and State Employees’ Retirement System (TSERS). RHBF is supported by a percent of payroll contribution from participating employing units. Each year the percentage is set in legislation, as are the maximum per retiree contributions from RHBF to the Plan. The State Treasurer, with the approval of the Plan Board of Trustees, then sets the employer contributions (subject to the legislative cap) and the premiums to be paid by retirees, as well as the health benefits to be provided through the Plan.
Benefits Provided: Plan benefits received by retired employees and disabled employees from RHBF are OPEB. The healthcare benefits
47
NOTES TO THE FINANCIAL STATEMENTS
for retired and disabled employees who are not eligible for Medicare are the same as for active employees as described in Note 15. The plan options change when former employees become eligible for Medicare. Medicare retirees have the option of selecting one of two fully-insured Medicare Advantage/Prescription Drug Plan options or the self-funded Traditional 70/30 Preferred Provider Organization plan option that is also offered to non-Medicare members. If the Traditional 70/30 Plan is selected by a Medicare retiree, the self-funded State Health Plan coverage is secondary to Medicare.
Those former employees who are eligible to receive medical benefits from RHBF are long-term disability beneficiaries of the Disability Income Plan of North Carolina and retirees of TSERS, the Consolidated Judicial Retirement System, the Legislative Retirement System, the Optional Retirement Program (ORP), and a small number of local governments, with five or more years of contributory membership service in their retirement system prior to disability or retirement, with the following exceptions: for employees first hired on or after October 1, 2006, and members of the North Carolina General Assembly first taking office on or after February 1, 2007, future coverage as retired employees and retired members of the North Carolina General Assembly is subject to the requirement that the future retiree have 20 or more years of retirement service credit in order to receive coverage on a noncontributory basis. Employees first hired on or after October 1, 2006 and members of the North Carolina General Assembly first taking office on or after February 1, 2007 with 10 but less than 20 years of retirement service credit are eligible for coverage on a partially contributory basis. For such future retirees, the State will pay 50% of the State Health Plan’s total noncontributory premium.
The Plan’s and RHBF’s benefit and contribution provisions are established by Chapter 135-7, Article 1, and Chapter 135, Article 3B of the General Statutes and may be amended only by the North Carolina General Assembly. RHBF does not provide for automatic post-retirement benefit increases.
Contributions: Contribution rates to RHBF, which are intended to finance benefits and administrative expenses on a pay-as-you-go basis, are determined by the North Carolina General Assembly in the Appropriations Bill. The University’s contractually-required contribution rate for the year ended June 30, 2019 was 6.27% of covered payroll. The University’s contributions to the RHBF were $7,175,172.32 for the year ended June 30, 2019.
2. Disability Income
Plan Administration: As discussed in Note 15, short-term and long-term disability benefits are provided through the Disability Income Plan of North Carolina (DIPNC), a cost-sharing, multiple-employer, defined benefit plan, to the eligible members of TSERS which includes
48
NOTES TO THE FINANCIAL STATEMENTS
employees of the State, the University of North Carolina System, community colleges, certain participating component units, LEAs which are not part of the reporting entity, and the ORP. By statute, DIPNC is administered by the Department of State Treasurer and the Board of Trustees of TSERS.
Benefits Provided: Long-term disability benefits are payable as an OPEB from DIPNC after the conclusion of the short-term disability period or after salary continuation payments cease, whichever is later, for as long as an employee is disabled. An employee is eligible to receive long-term disability benefits provided the following requirements are met: (1) the employee has five or more years of contributing membership service in TSERS or the ORP, earned within 96 months prior to the end of the short-term disability period or cessation of salary continuation payments, whichever is later; (2) the employee must make application to receive long-term benefits within 180 days after the conclusion of the short-term disability period or after salary continuation payments cease or after monthly payments for Workers’ Compensation cease (excluding monthly payments for permanent partial benefits), whichever is later; (3) the employee must be certified by the Medical Board to be mentally or physically disabled for the further performance of his/her usual occupation; (4) the disability must have been continuous, likely to be permanent, and incurred at the time of active employment; (5) the employee must not be eligible to receive an unreduced retirement benefit from TSERS; and (6) the employee must terminate employment as a permanent, full-time employee. An employee is eligible to receive an unreduced retirement benefit from TSERS after (1) reaching the age of 65 and completing five years of membership service, or (2) reaching the age of 60 and completing 25 years of creditable service, or (3) completing 30 years of creditable service, at any age.
For employees who had five or more years of membership service as of July 31, 2007, during the first 36 months of the long-term disability period, the monthly long-term disability benefit is equal to 65% of one-twelfth of an employee’s annual base rate of compensation last payable to the participant or beneficiary prior to the beginning of the short-term disability period, plus the like percentage of one-twelfth of the annual longevity payment and local supplements to which the participant or beneficiary would be eligible. The monthly benefits are subject to a maximum of $3,900 per month reduced by any primary Social Security disability benefits and by monthly payments for Workers’ Compensation to which the participant or beneficiary may be entitled, but the benefits payable shall be no less than $10 a month. After the first 36 months of the long-term disability, the long-term benefit is calculated in the same manner as described above except the monthly benefit is reduced by an amount equal to a monthly primary Social Security disability benefit to which the participant or beneficiary might be entitled had Social Security disability benefits been awarded. When an employee qualifies for an unreduced service retirement allowance from TSERS, the benefits payable from DIPNC
49
NOTES TO THE FINANCIAL STATEMENTS
will cease, and the employee will commence retirement under TSERS or the ORP.
For employees who had less than five years of membership service as of July 31, 2007, and meet the requirements for long-term disability on or after August 1, 2007, during the first 36 months of the long-term disability period, the monthly long-term benefit shall be reduced by an amount equal to the monthly primary Social Security retirement benefit to which the employee might be entitled should the employee become age 62 during the first 36 months. This reduction becomes effective as of the first day of the month following the month of initial entitlement to Social Security benefits. After the first 36 months of the long-term disability, no further benefits are payable under the terms of this section unless the employee has been approved and is in receipt of primary Social Security disability benefits.
Contributions: Although DIPNC operates on a calendar year, disability income benefits are funded by actuarially determined employer contributions that are established in the Appropriations Bill by the North Carolina General Assembly and coincide with the State’s fiscal year. The University’s contractually-required contribution rate for the year ended June 30, 2019 was 0.14% of covered payroll. The University’s contributions to DIPNC were $160,211.18 for the year ended June 30, 2019.
C. Net OPEB Liability (Asset)
Net OPEB Liability: At June 30, 2019, the University reported a liability of $164,837,738.00 for its proportionate share of the collective net OPEB liability for RHBF. The net OPEB liability was measured as of June 30, 2018. The total OPEB liability used to calculate the net OPEB liability was determined by an actuarial valuation as of December 31, 2017, and update procedures were used to roll forward the total OPEB liability to June 30, 2018. The University’s proportion of the net OPEB liability was based on the present value of future salaries for the University relative to the present value of future salaries for all participating employers, actuarially-determined. As of June 30, 2018, the University’s proportion was 0.57862%, which was an increase of 0.03291 from its proportion measured as of June 30, 2017, which was 0.54571%.
Net OPEB Asset: At June 30, 2019, the University reported an asset of $181,029.00 for its proportionate share of the collective net OPEB asset for DIPNC. The net OPEB asset was measured as of June 30, 2018. The total OPEB asset used to calculate the net OPEB asset was determined by an actuarial valuation as of December 31, 2017, and update procedures were used to roll forward the total OPEB asset to June 30, 2018. The University’s proportion of the net OPEB asset was based on the present value of future salaries for the University relative to the present value of future salaries for all participating employers, actuarially-determined. As of June 30, 2018, the University’s proportion was 0.59596%, which was an
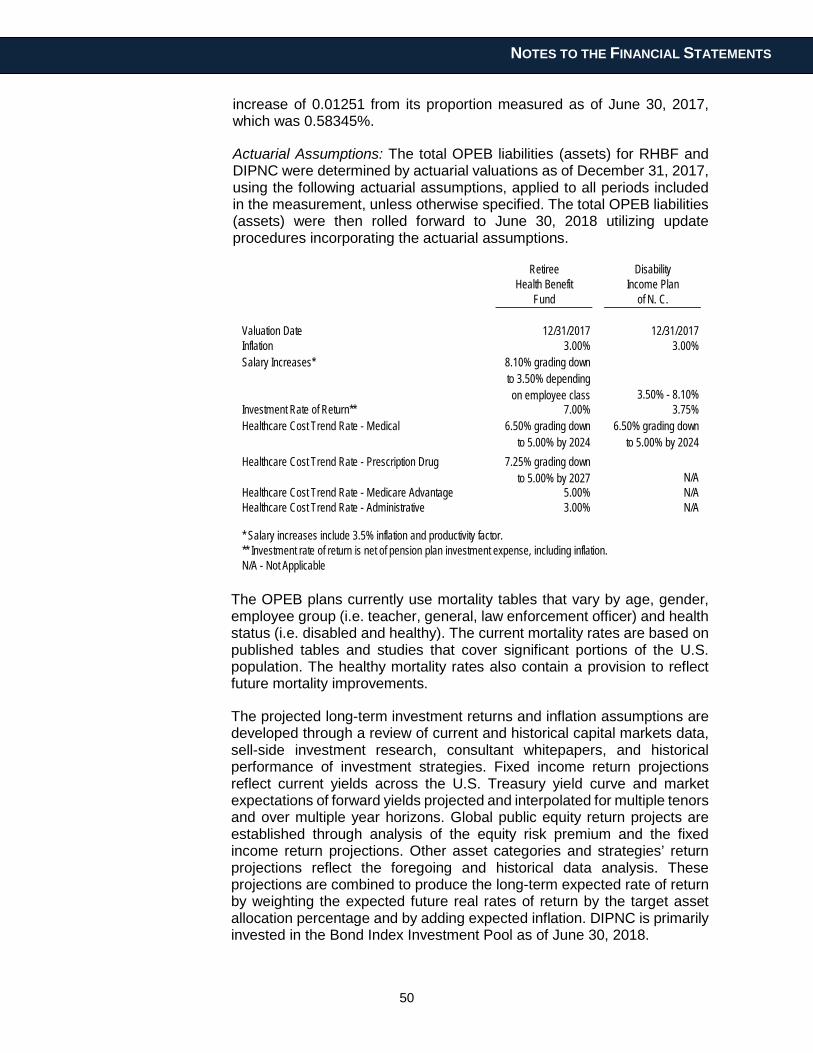
50
NOTES TO THE FINANCIAL STATEMENTS
increase of 0.01251 from its proportion measured as of June 30, 2017, which was 0.58345%.
Actuarial Assumptions: The total OPEB liabilities (assets) for RHBF and DIPNC were determined by actuarial valuations as of December 31, 2017, using the following actuarial assumptions, applied to all periods included in the measurement, unless otherwise specified. The total OPEB liabilities (assets) were then rolled forward to June 30, 2018 utilizing update procedures incorporating the actuarial assumptions.
Retiree DisabilityHealth Benefit Income Plan
Fund of N. C.
Valuation Date 12/31/2017 12/31/2017Inflation 3.00% 3.00%Salary Increases* 8.10% grading down
to 3.50% depending on employee class 3.50% - 8.10%
Investment Rate of Return** 7.00% 3.75%Healthcare Cost Trend Rate - Medical 6.50% grading down
to 5.00% by 20246.50% grading down
to 5.00% by 2024Healthcare Cost Trend Rate - Prescription Drug 7.25% grading down
to 5.00% by 2027 N/AHealthcare Cost Trend Rate - Medicare Advantage 5.00% N/AHealthcare Cost Trend Rate - Administrative 3.00% N/A
* Salary increases include 3.5% inflation and productivity factor.** Investment rate of return is net of pension plan investment expense, including inflation.N/A - Not Applicable
The OPEB plans currently use mortality tables that vary by age, gender, employee group (i.e. teacher, general, law enforcement officer) and health status (i.e. disabled and healthy). The current mortality rates are based on published tables and studies that cover significant portions of the U.S. population. The healthy mortality rates also contain a provision to reflect future mortality improvements.
The projected long-term investment returns and inflation assumptions are developed through a review of current and historical capital markets data, sell-side investment research, consultant whitepapers, and historical performance of investment strategies. Fixed income return projections reflect current yields across the U.S. Treasury yield curve and market expectations of forward yields projected and interpolated for multiple tenors and over multiple year horizons. Global public equity return projects are established through analysis of the equity risk premium and the fixed income return projections. Other asset categories and strategies’ return projections reflect the foregoing and historical data analysis. These projections are combined to produce the long-term expected rate of return by weighting the expected future real rates of return by the target asset allocation percentage and by adding expected inflation. DIPNC is primarily invested in the Bond Index Investment Pool as of June 30, 2018.
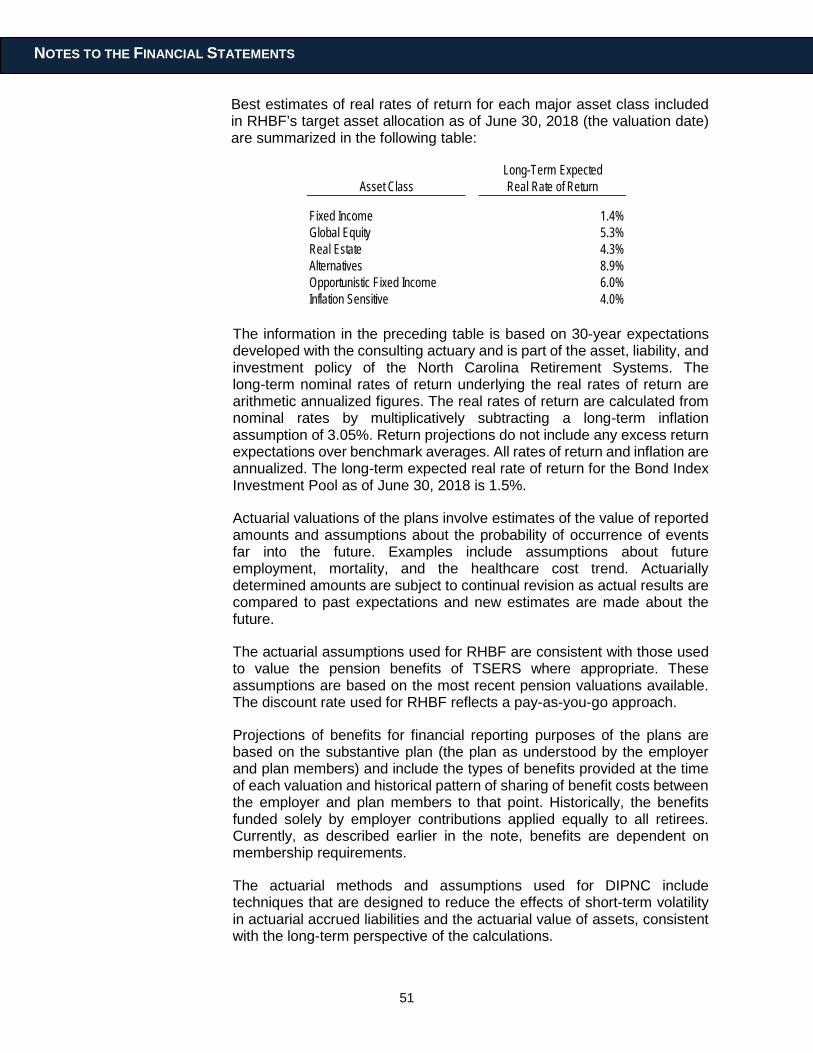
51
NOTES TO THE FINANCIAL STATEMENTS
Best estimates of real rates of return for each major asset class included in RHBF’s target asset allocation as of June 30, 2018 (the valuation date) are summarized in the following table:
Long-Term ExpectedAsset Class Real Rate of Return
Fixed Income 1.4%Global Equity 5.3%Real Estate 4.3%Alternatives 8.9%Opportunistic Fixed Income 6.0%Inflation Sensitive 4.0%
The information in the preceding table is based on 30-year expectations developed with the consulting actuary and is part of the asset, liability, and investment policy of the North Carolina Retirement Systems. The long-term nominal rates of return underlying the real rates of return are arithmetic annualized figures. The real rates of return are calculated from nominal rates by multiplicatively subtracting a long-term inflation assumption of 3.05%. Return projections do not include any excess return expectations over benchmark averages. All rates of return and inflation are annualized. The long-term expected real rate of return for the Bond Index Investment Pool as of June 30, 2018 is 1.5%.
Actuarial valuations of the plans involve estimates of the value of reported amounts and assumptions about the probability of occurrence of events far into the future. Examples include assumptions about future employment, mortality, and the healthcare cost trend. Actuarially determined amounts are subject to continual revision as actual results are compared to past expectations and new estimates are made about the future.
The actuarial assumptions used for RHBF are consistent with those used to value the pension benefits of TSERS where appropriate. These assumptions are based on the most recent pension valuations available. The discount rate used for RHBF reflects a pay-as-you-go approach.
Projections of benefits for financial reporting purposes of the plans are based on the substantive plan (the plan as understood by the employer and plan members) and include the types of benefits provided at the time of each valuation and historical pattern of sharing of benefit costs between the employer and plan members to that point. Historically, the benefits funded solely by employer contributions applied equally to all retirees. Currently, as described earlier in the note, benefits are dependent on membership requirements.
The actuarial methods and assumptions used for DIPNC include techniques that are designed to reduce the effects of short-term volatility in actuarial accrued liabilities and the actuarial value of assets, consistent with the long-term perspective of the calculations.
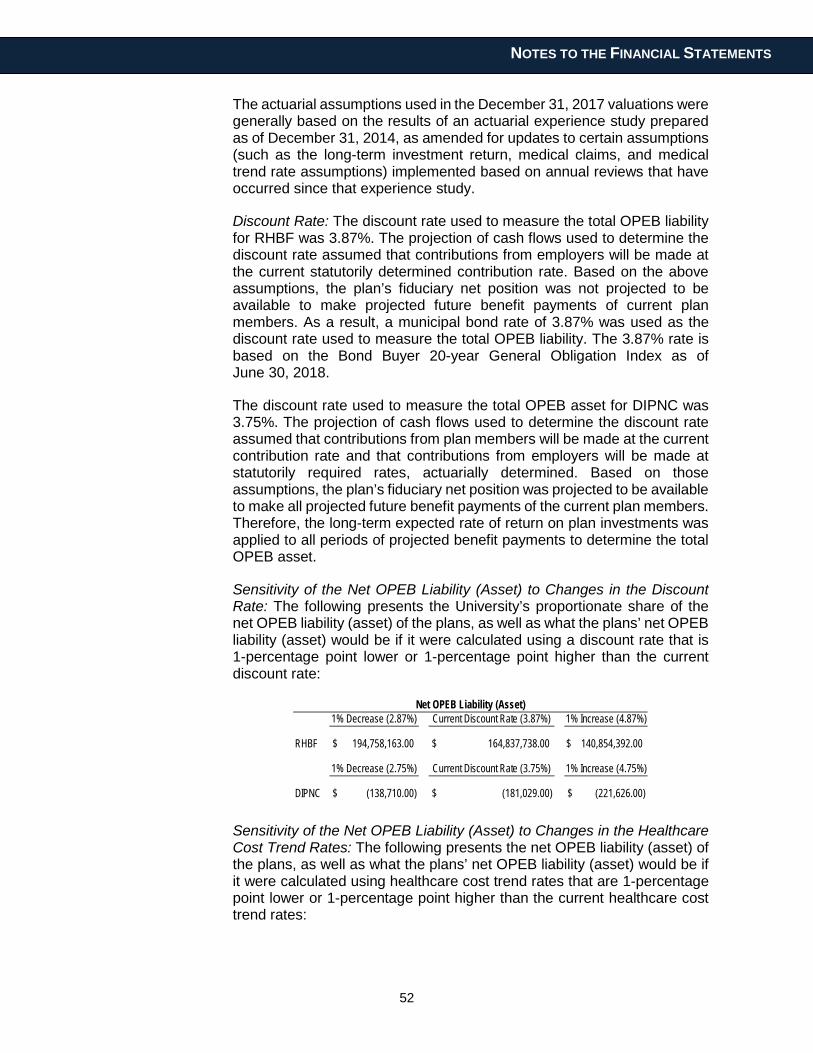
52
NOTES TO THE FINANCIAL STATEMENTS
The actuarial assumptions used in the December 31, 2017 valuations were generally based on the results of an actuarial experience study prepared as of December 31, 2014, as amended for updates to certain assumptions (such as the long-term investment return, medical claims, and medical trend rate assumptions) implemented based on annual reviews that have occurred since that experience study.
Discount Rate: The discount rate used to measure the total OPEB liability for RHBF was 3.87%. The projection of cash flows used to determine the discount rate assumed that contributions from employers will be made at the current statutorily determined contribution rate. Based on the above assumptions, the plan’s fiduciary net position was not projected to be available to make projected future benefit payments of current plan members. As a result, a municipal bond rate of 3.87% was used as the discount rate used to measure the total OPEB liability. The 3.87% rate is based on the Bond Buyer 20-year General Obligation Index as of June 30, 2018.
The discount rate used to measure the total OPEB asset for DIPNC was 3.75%. The projection of cash flows used to determine the discount rate assumed that contributions from plan members will be made at the current contribution rate and that contributions from employers will be made at statutorily required rates, actuarially determined. Based on those assumptions, the plan’s fiduciary net position was projected to be available to make all projected future benefit payments of the current plan members. Therefore, the long-term expected rate of return on plan investments was applied to all periods of projected benefit payments to determine the total OPEB asset.
Sensitivity of the Net OPEB Liability (Asset) to Changes in the Discount Rate: The following presents the University’s proportionate share of the net OPEB liability (asset) of the plans, as well as what the plans’ net OPEB liability (asset) would be if it were calculated using a discount rate that is 1-percentage point lower or 1-percentage point higher than the current discount rate:
RHBF $ 194,758,163.00 $ 164,837,738.00 $ 140,854,392.00
DIPNC $ (138,710.00) $ (181,029.00) $ (221,626.00)
Net OPEB Liability (Asset)
1% Decrease (2.75%) Current Discount Rate (3.75%) 1% Increase (4.75%)
1% Decrease (2.87%) Current Discount Rate (3.87%) 1% Increase (4.87%)
Sensitivity of the Net OPEB Liability (Asset) to Changes in the Healthcare Cost Trend Rates: The following presents the net OPEB liability (asset) of the plans, as well as what the plans’ net OPEB liability (asset) would be if it were calculated using healthcare cost trend rates that are 1-percentage point lower or 1-percentage point higher than the current healthcare cost trend rates:
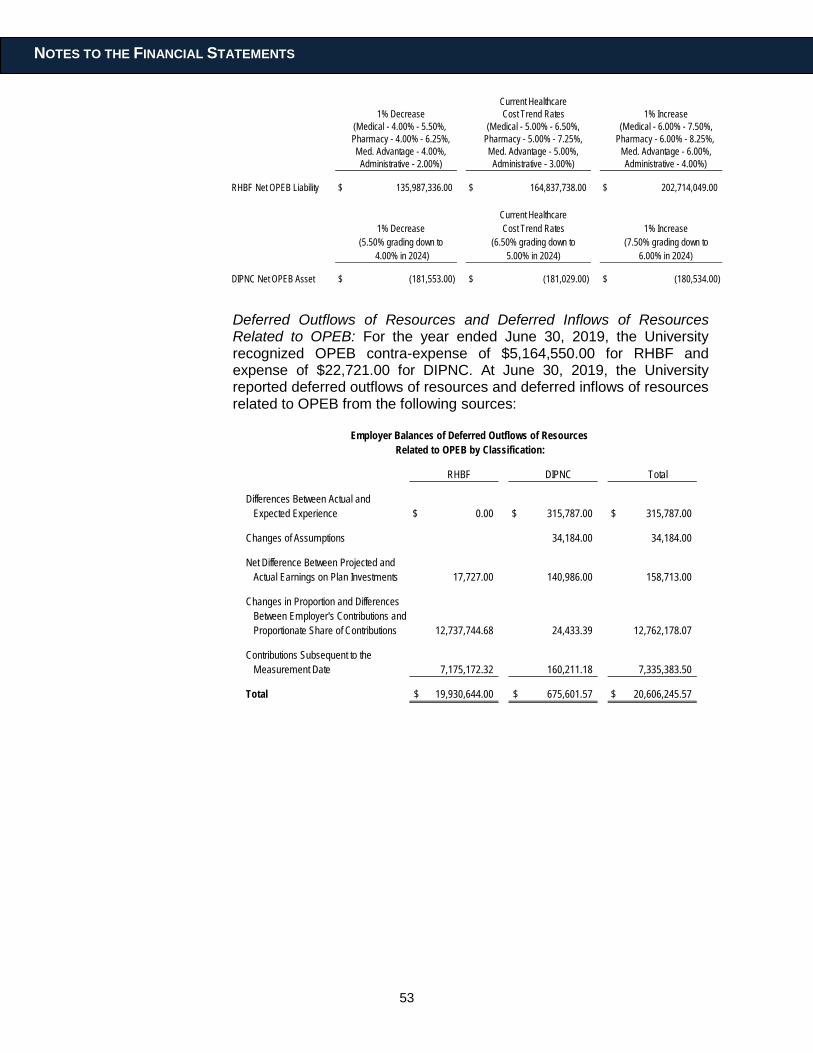
53
NOTES TO THE FINANCIAL STATEMENTS
Current Healthcare1% Decrease Cost Trend Rates 1% Increase
(Medical - 4.00% - 5.50%, (Medical - 5.00% - 6.50%, (Medical - 6.00% - 7.50%,Pharmacy - 4.00% - 6.25%, Pharmacy - 5.00% - 7.25%, Pharmacy - 6.00% - 8.25%, Med. Advantage - 4.00%, Med. Advantage - 5.00%, Med. Advantage - 6.00%,
Administrative - 2.00%) Administrative - 3.00%) Administrative - 4.00%)
RHBF Net OPEB Liability $ 135,987,336.00 $ 164,837,738.00 $ 202,714,049.00
Current Healthcare1% Decrease Cost Trend Rates 1% Increase
(5.50% grading down to (6.50% grading down to (7.50% grading down to 4.00% in 2024) 5.00% in 2024) 6.00% in 2024)
DIPNC Net OPEB Asset $ (181,553.00) $ (181,029.00) $ (180,534.00)
Deferred Outflows of Resources and Deferred Inflows of Resources Related to OPEB: For the year ended June 30, 2019, the University recognized OPEB contra-expense of $5,164,550.00 for RHBF and expense of $22,721.00 for DIPNC. At June 30, 2019, the University reported deferred outflows of resources and deferred inflows of resources related to OPEB from the following sources:
RHBF DIPNC Total
Differences Between Actual and Expected Experience $ 0.00 $ 315,787.00 $ 315,787.00
Changes of Assumptions 34,184.00 34,184.00
Net Difference Between Projected andActual Earnings on Plan Investments 17,727.00 140,986.00 158,713.00
Changes in Proportion and DifferencesBetween Employer's Contributions andProportionate Share of Contributions 12,737,744.68 24,433.39 12,762,178.07
Contributions Subsequent to the Measurement Date 7,175,172.32 160,211.18 7,335,383.50
Total $ 19,930,644.00 $ 675,601.57 $ 20,606,245.57
Employer Balances of Deferred Outflows of Resources Related to OPEB by Classification:
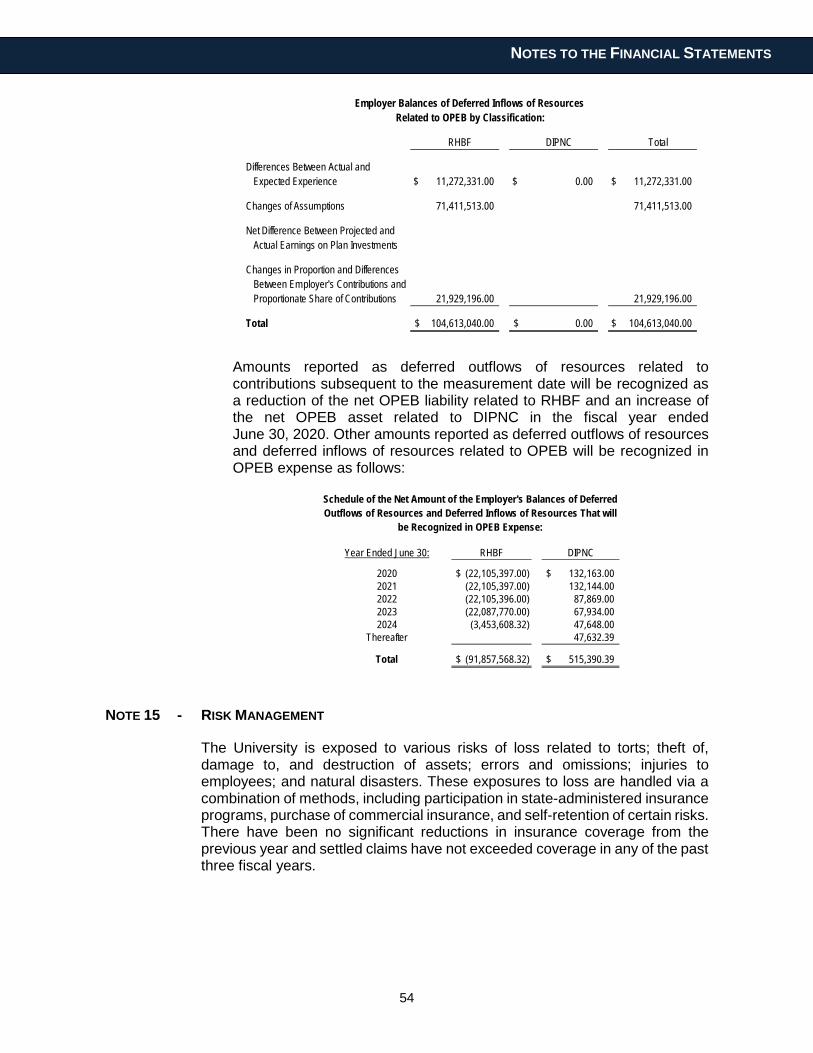
54
NOTES TO THE FINANCIAL STATEMENTS
RHBF DIPNC Total
Differences Between Actual and Expected Experience $ 11,272,331.00 $ 0.00 $ 11,272,331.00
Changes of Assumptions 71,411,513.00 71,411,513.00
Net Difference Between Projected andActual Earnings on Plan Investments
Changes in Proportion and DifferencesBetween Employer's Contributions andProportionate Share of Contributions 21,929,196.00 21,929,196.00
Total $ 104,613,040.00 $ 0.00 $ 104,613,040.00
Employer Balances of Deferred Inflows of Resources Related to OPEB by Classification:
Amounts reported as deferred outflows of resources related to contributions subsequent to the measurement date will be recognized as a reduction of the net OPEB liability related to RHBF and an increase of the net OPEB asset related to DIPNC in the fiscal year ended June 30, 2020. Other amounts reported as deferred outflows of resources and deferred inflows of resources related to OPEB will be recognized in OPEB expense as follows:
Year Ended June 30:
2020 $ (22,105,397.00) $ 132,163.002021 (22,105,397.00) 132,144.002022 (22,105,396.00) 87,869.002023 (22,087,770.00) 67,934.002024 (3,453,608.32) 47,648.00
Thereafter 47,632.39
Total $ (91,857,568.32) $ 515,390.39
RHBF DIPNC
Schedule of the Net Amount of the Employer's Balances of Deferred Outflows of Resources and Deferred Inflows of Resources That will
be Recognized in OPEB Expense:
NOTE 15 - RISK MANAGEMENT
The University is exposed to various risks of loss related to torts; theft of, damage to, and destruction of assets; errors and omissions; injuries to employees; and natural disasters. These exposures to loss are handled via a combination of methods, including participation in state-administered insurance programs, purchase of commercial insurance, and self-retention of certain risks. There have been no significant reductions in insurance coverage from the previous year and settled claims have not exceeded coverage in any of the past three fiscal years.
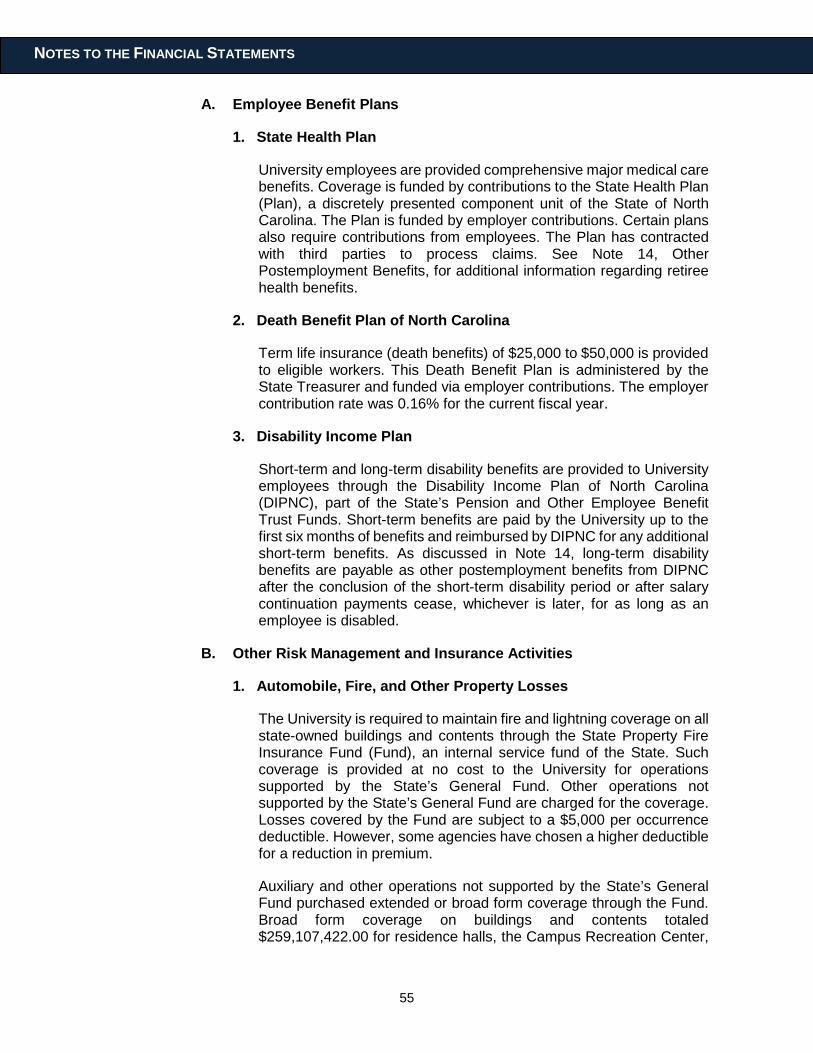
55
NOTES TO THE FINANCIAL STATEMENTS
A. Employee Benefit Plans
1. State Health Plan
University employees are provided comprehensive major medical care benefits. Coverage is funded by contributions to the State Health Plan (Plan), a discretely presented component unit of the State of North Carolina. The Plan is funded by employer contributions. Certain plans also require contributions from employees. The Plan has contracted with third parties to process claims. See Note 14, Other Postemployment Benefits, for additional information regarding retiree health benefits.
2. Death Benefit Plan of North Carolina
Term life insurance (death benefits) of $25,000 to $50,000 is provided to eligible workers. This Death Benefit Plan is administered by the State Treasurer and funded via employer contributions. The employer contribution rate was 0.16% for the current fiscal year.
3. Disability Income Plan
Short-term and long-term disability benefits are provided to University employees through the Disability Income Plan of North Carolina (DIPNC), part of the State’s Pension and Other Employee Benefit Trust Funds. Short-term benefits are paid by the University up to the first six months of benefits and reimbursed by DIPNC for any additional short-term benefits. As discussed in Note 14, long-term disability benefits are payable as other postemployment benefits from DIPNC after the conclusion of the short-term disability period or after salary continuation payments cease, whichever is later, for as long as an employee is disabled.
B. Other Risk Management and Insurance Activities
1. Automobile, Fire, and Other Property Losses
The University is required to maintain fire and lightning coverage on all state-owned buildings and contents through the State Property Fire Insurance Fund (Fund), an internal service fund of the State. Such coverage is provided at no cost to the University for operations supported by the State’s General Fund. Other operations not supported by the State’s General Fund are charged for the coverage. Losses covered by the Fund are subject to a $5,000 per occurrence deductible. However, some agencies have chosen a higher deductible for a reduction in premium.
Auxiliary and other operations not supported by the State’s General Fund purchased extended or broad form coverage through the Fund. Broad form coverage on buildings and contents totaled $259,107,422.00 for residence halls, the Campus Recreation Center,
56
NOTES TO THE FINANCIAL STATEMENTS
the new Student Center, and the Environmental Health and Safety facility. The University purchased extended coverage and fire insurance for the building and all risk insurance for the contents for Williams Cafeteria in the amount of $52,222,510.00. The University also carried $7,337,554.00 in fire insurance on the building and broad form coverage on the contents of Brown Hall.
Basic coverage for buildings and contents was carried on the Aggie Skybox, parking deck, stadium complex, and housing office in the amount of $28,781,127.00. The University also carried fire insurance on the building and all risk insurance on the contents of the Bryan Fitness and Wellness Center.
Supplemental insurance was carried on several academic facilities. The University maintained $54,958,768.00 in broad form coverage on the contents of the Student Health Center, McNair Hall, and Bluford Library. All risk insurance was carried on the IRC research building in the amount of $9,771,407.00 while other forms of insurance totaling $7,186,311.00 was maintained on several academic buildings, including contents.
All state-owned vehicles are covered by liability insurance through a private insurance company and handled by the North Carolina Department of Insurance. The liability limits for losses are $1,000,000 per claim and $10,000,000 per occurrence. The University pays premiums to the North Carolina Department of Insurance for the coverage.
2. Public Officers’ and Employees’ Liability Insurance
The risk of tort claims of up to $1,000,000 per claimant is retained under the authority of the State Tort Claims Act. In addition, the State provides excess public officers’ and employees’ liability insurance up to $2,000,000 per claim and $10,000,000 in the aggregate per fiscal year via contract with a private insurance company. The University pays the premium, based on a composite rate, directly to the private insurer.
3. Employee Dishonesty and Computer Fraud
The University is protected for losses from employee dishonesty and computer fraud. This coverage is with a private insurance company and is handled by the North Carolina Department of Insurance. Universities are charged a premium by the private insurance company. Coverage limit is $5,000,000 per occurrence. The private insurance company pays 90% of each loss less a $100,000 deductible.
4. Statewide Workers’ Compensation Program
The North Carolina Workers’ Compensation Program provides benefits to workers injured on the job. All employees of the State and
57
NOTES TO THE FINANCIAL STATEMENTS
its component units are included in the program. When an employee is injured, the University’s primary responsibility is to arrange for and provide the necessary treatment for work related injury. The University is responsible for paying medical benefits and compensation in accordance with the North Carolina Workers’ Compensation Act. The University retains the risk for workers’ compensation.
Additional details on the state-administered risk management programs are disclosed in the State’s Comprehensive Annual Financial Report, issued by the Office of the State Controller.
5. Other Insurance Held by the University
The University purchased other authorized coverage from private insurance companies through the North Carolina Department of Insurance. Professional medical liability coverage has been purchased for physicians and non-physician staff members. Individual policies provide coverage of $1 million per person, with a $3 million total.
NOTE 16 - COMMITMENTS AND CONTINGENCIES
A. Commitments - The University has established an encumbrance system to track its outstanding commitments on construction projects and other purchases. Outstanding commitments on construction contracts were $75,817,534.16 and on other purchases were $17,253,759.36 at June 30, 2019.
B. Pending Litigation and Claims - The University is a party to litigation and claims in the ordinary course of its operations. Since it is not possible to predict the ultimate outcome of these matters, no provision for any liability has been made in the financial statements. University management is of the opinion that the liability, if any, for any of these matters will not have a material adverse effect on the financial position of the University.
C. Other Contingent Receivables - The University has received notification of other gifts and grants for which funds have not been disbursed by the resource provider and for which conditions attached to the gift or grant have not been satisfied or, in the case of permanent endowments, cannot begin to be satisfied. In accordance with accounting principles generally accepted in the United States of America, these amounts have not been recorded on the accompanying financial statements. The purpose and amount of other contingent receivables at year-end are as follows:
Purpose Amount
Pledges to Endowments $ 6,258,472.32
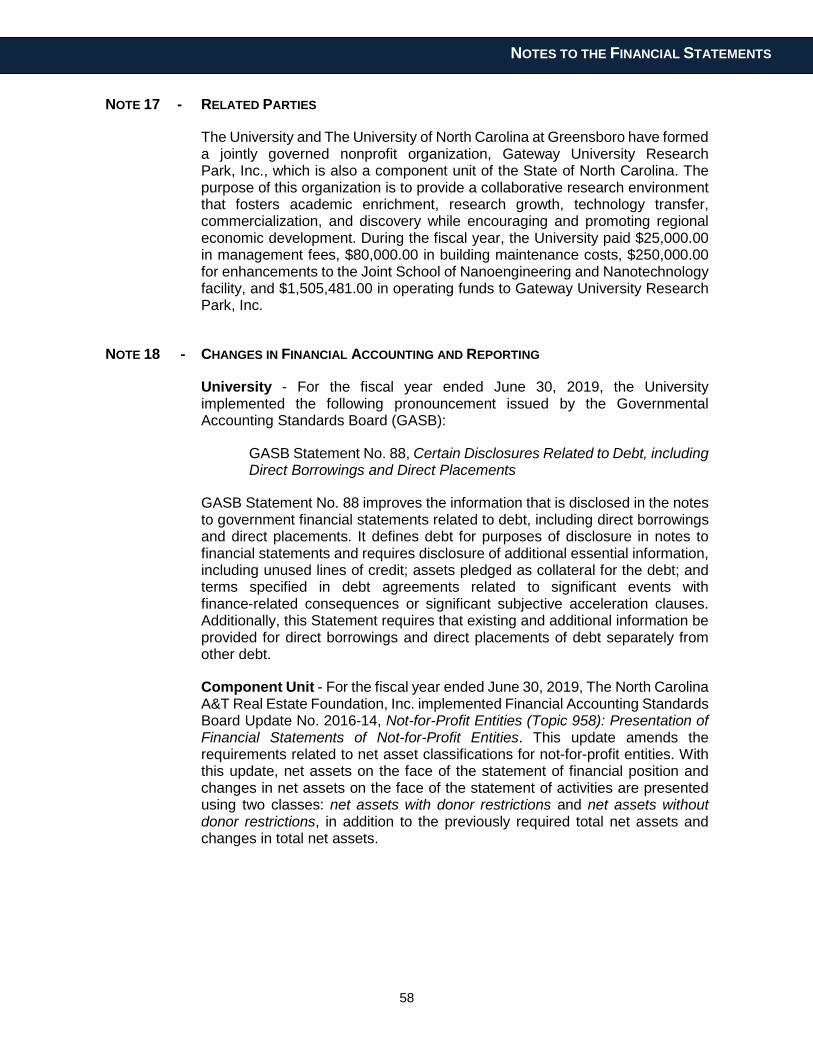
58
NOTES TO THE FINANCIAL STATEMENTS
NOTE 17 - RELATED PARTIES
The University and The University of North Carolina at Greensboro have formed a jointly governed nonprofit organization, Gateway University Research Park, Inc., which is also a component unit of the State of North Carolina. The purpose of this organization is to provide a collaborative research environment that fosters academic enrichment, research growth, technology transfer, commercialization, and discovery while encouraging and promoting regional economic development. During the fiscal year, the University paid $25,000.00 in management fees, $80,000.00 in building maintenance costs, $250,000.00 for enhancements to the Joint School of Nanoengineering and Nanotechnology facility, and $1,505,481.00 in operating funds to Gateway University Research Park, Inc.
NOTE 18 - CHANGES IN FINANCIAL ACCOUNTING AND REPORTING
University - For the fiscal year ended June 30, 2019, the University implemented the following pronouncement issued by the Governmental Accounting Standards Board (GASB):
GASB Statement No. 88, Certain Disclosures Related to Debt, including Direct Borrowings and Direct Placements
GASB Statement No. 88 improves the information that is disclosed in the notes to government financial statements related to debt, including direct borrowings and direct placements. It defines debt for purposes of disclosure in notes to financial statements and requires disclosure of additional essential information, including unused lines of credit; assets pledged as collateral for the debt; and terms specified in debt agreements related to significant events with finance-related consequences or significant subjective acceleration clauses. Additionally, this Statement requires that existing and additional information be provided for direct borrowings and direct placements of debt separately from other debt.
Component Unit - For the fiscal year ended June 30, 2019, The North Carolina A&T Real Estate Foundation, Inc. implemented Financial Accounting Standards Board Update No. 2016-14, Not-for-Profit Entities (Topic 958): Presentation of Financial Statements of Not-for-Profit Entities. This update amends the requirements related to net asset classifications for not-for-profit entities. With this update, net assets on the face of the statement of financial position and changes in net assets on the face of the statement of activities are presented using two classes: net assets with donor restrictions and net assets without donor restrictions, in addition to the previously required total net assets and changes in total net assets.
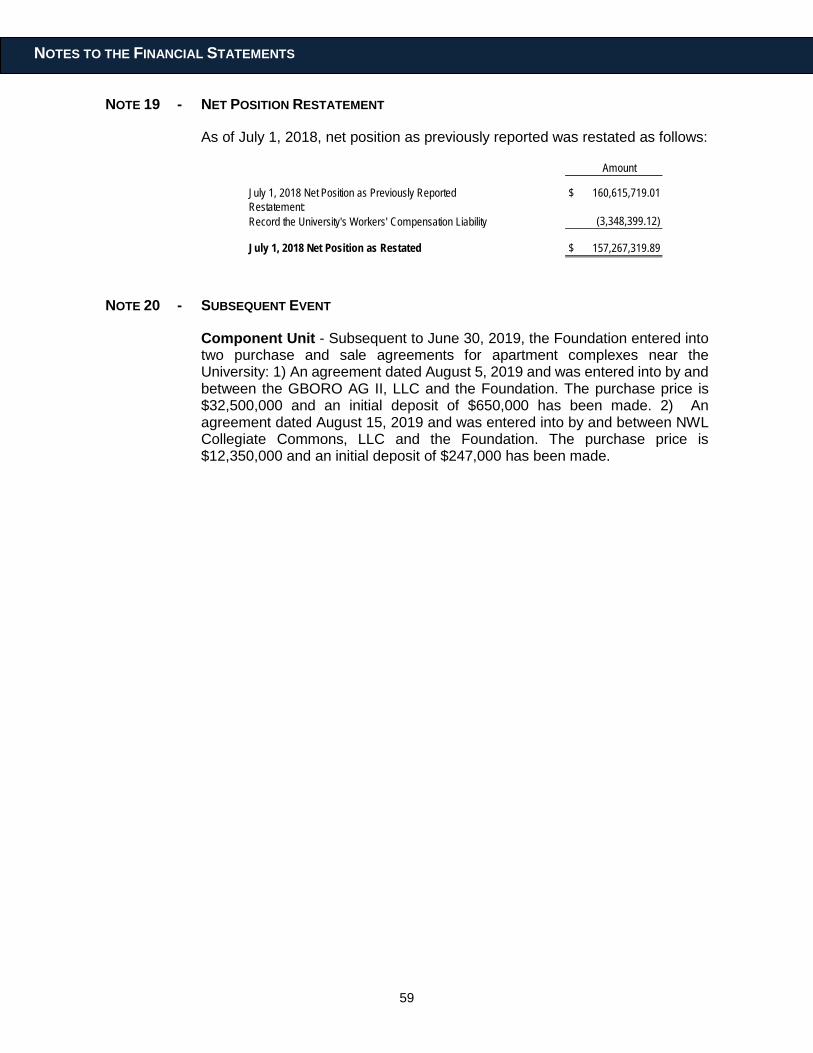
59
NOTES TO THE FINANCIAL STATEMENTS
NOTE 19 - NET POSITION RESTATEMENT
As of July 1, 2018, net position as previously reported was restated as follows:
Amount
July 1, 2018 Net Position as Previously Reported $ 160,615,719.01Restatement: Record the University's Workers' Compensation Liability (3,348,399.12)
July 1, 2018 Net Position as Restated $ 157,267,319.89
NOTE 20 - SUBSEQUENT EVENT
Component Unit - Subsequent to June 30, 2019, the Foundation entered into two purchase and sale agreements for apartment complexes near the University: 1) An agreement dated August 5, 2019 and was entered into by and between the GBORO AG II, LLC and the Foundation. The purchase price is $32,500,000 and an initial deposit of $650,000 has been made. 2) An agreement dated August 15, 2019 and was entered into by and between NWL Collegiate Commons, LLC and the Foundation. The purchase price is $12,350,000 and an initial deposit of $247,000 has been made.

REQUIRED SUPPLEMENTARY
INFORMATION
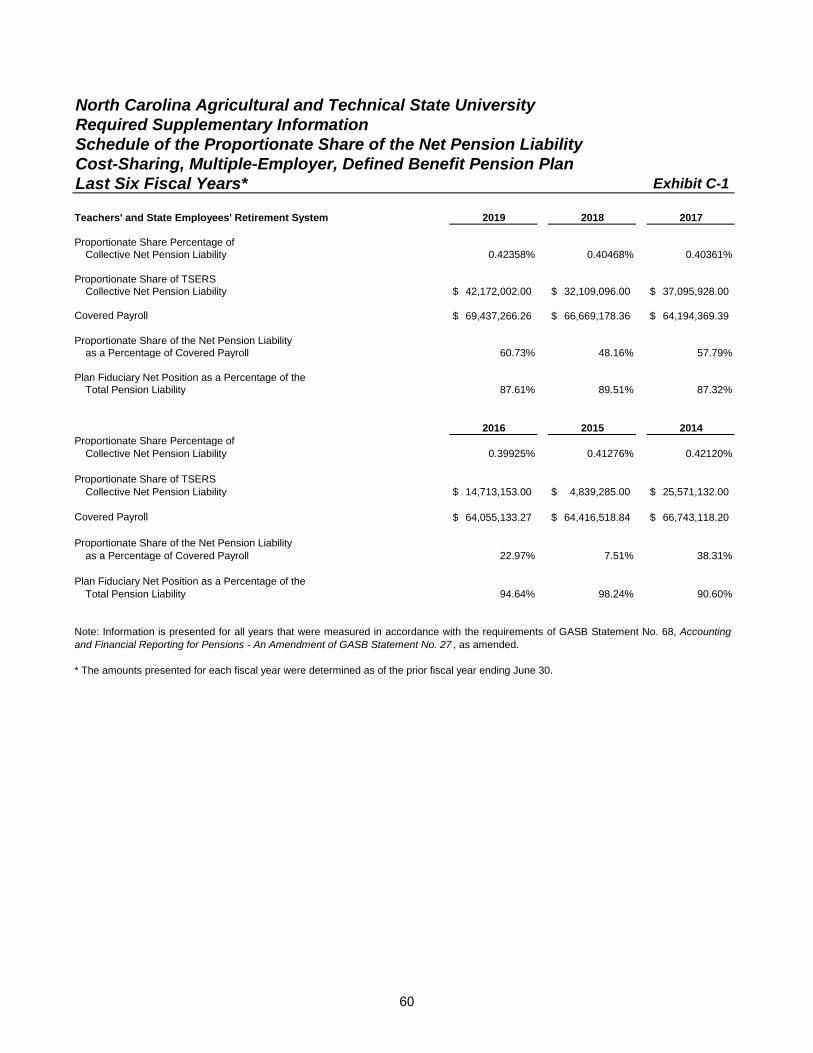
North Carolina Agricultural and Technical State UniversityRequired Supplementary InformationSchedule of the Proportionate Share of the Net Pension Liability Cost-Sharing, Multiple-Employer, Defined Benefit Pension PlanLast Six Fiscal Years* Exhibit C-1
Teachers' and State Employees' Retirement System
Proportionate Share Percentage ofCollective Net Pension Liability 0.42358% 0.40468% 0.40361%
Proportionate Share of TSERSCollective Net Pension Liability $ 42,172,002.00 $ 32,109,096.00 $ 37,095,928.00
Covered Payroll $ 69,437,266.26 $ 66,669,178.36 $ 64,194,369.39
Proportionate Share of the Net Pension Liabilityas a Percentage of Covered Payroll 60.73% 48.16% 57.79%
Plan Fiduciary Net Position as a Percentage of theTotal Pension Liability 87.61% 89.51% 87.32%
Proportionate Share Percentage ofCollective Net Pension Liability 0.39925% 0.41276% 0.42120%
Proportionate Share of TSERSCollective Net Pension Liability $ 14,713,153.00 $ 4,839,285.00 $ 25,571,132.00
Covered Payroll $ 64,055,133.27 $ 64,416,518.84 $ 66,743,118.20
Proportionate Share of the Net Pension Liabilityas a Percentage of Covered Payroll 22.97% 7.51% 38.31%
Plan Fiduciary Net Position as a Percentage of theTotal Pension Liability 94.64% 98.24% 90.60%
* The amounts presented for each fiscal year were determined as of the prior fiscal year ending June 30.
Note: Information is presented for all years that were measured in accordance with the requirements of GASB Statement No. 68, Accounting and Financial Reporting for Pensions - An Amendment of GASB Statement No. 27 , as amended.
20172019 2018
2016 2015 2014
60
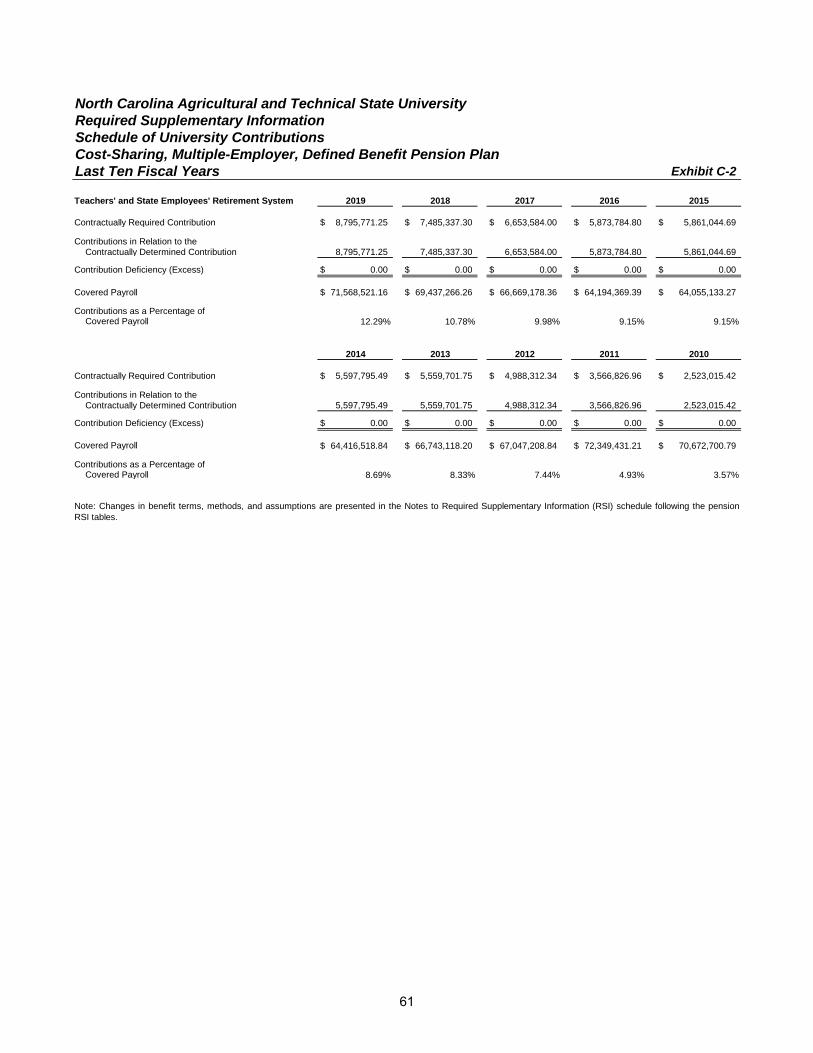
North Carolina Agricultural and Technical State UniversityRequired Supplementary InformationSchedule of University ContributionsCost-Sharing, Multiple-Employer, Defined Benefit Pension PlanLast Ten Fiscal Years Exhibit C-2
Teachers' and State Employees' Retirement System
Contractually Required Contribution $ 8,795,771.25 $ 7,485,337.30 $ 6,653,584.00 $ 5,873,784.80 $ 5,861,044.69
Contributions in Relation to theContractually Determined Contribution 8,795,771.25 7,485,337.30 6,653,584.00 5,873,784.80 5,861,044.69
Contribution Deficiency (Excess) $ 0.00 $ 0.00 $ 0.00 $ 0.00 $ 0.00
Covered Payroll $ 71,568,521.16 $ 69,437,266.26 $ 66,669,178.36 $ 64,194,369.39 $ 64,055,133.27
Contributions as a Percentage ofCovered Payroll 12.29% 10.78% 9.98% 9.15% 9.15%
Contractually Required Contribution $ 5,597,795.49 $ 5,559,701.75 $ 4,988,312.34 $ 3,566,826.96 $ 2,523,015.42
Contributions in Relation to theContractually Determined Contribution 5,597,795.49 5,559,701.75 4,988,312.34 3,566,826.96 2,523,015.42
Contribution Deficiency (Excess) $ 0.00 $ 0.00 $ 0.00 $ 0.00 $ 0.00
Covered Payroll $ 64,416,518.84 $ 66,743,118.20 $ 67,047,208.84 $ 72,349,431.21 $ 70,672,700.79
Contributions as a Percentage ofCovered Payroll 8.69% 8.33% 7.44% 4.93% 3.57%
Note: Changes in benefit terms, methods, and assumptions are presented in the Notes to Required Supplementary Information (RSI) schedule following the pensionRSI tables.
2015
2014 2013
2019 2018 2017 2016
2012 2011 2010
61
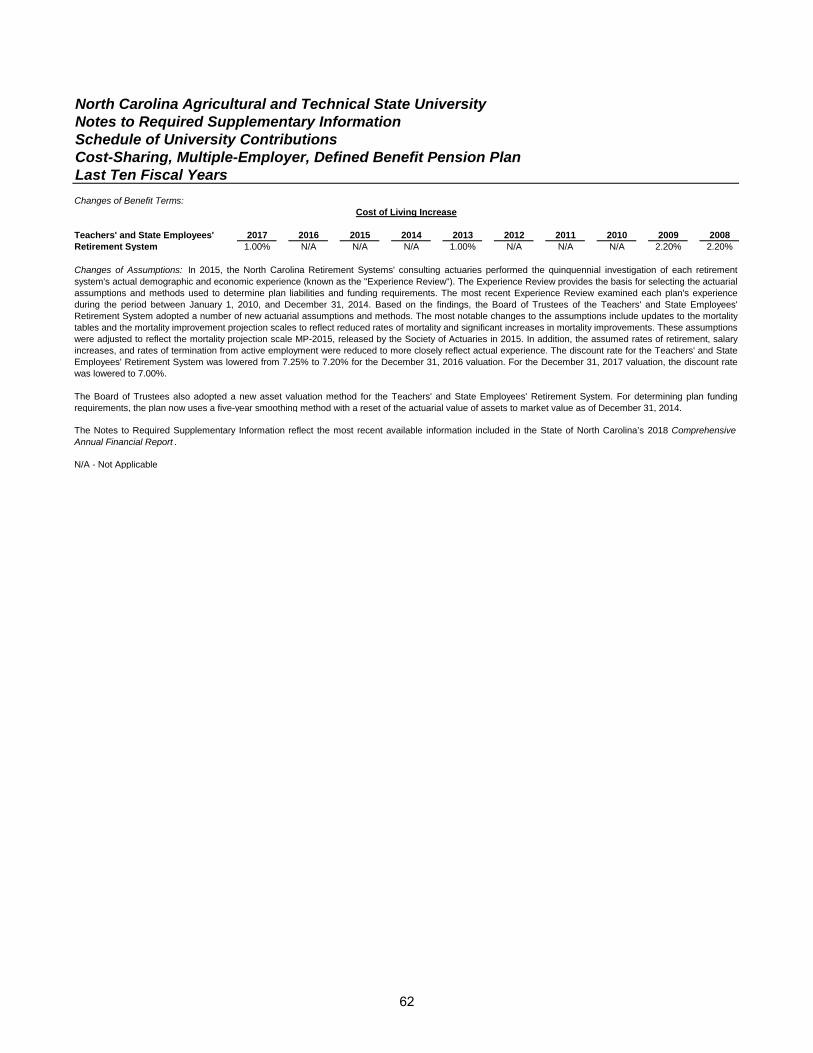
North Carolina Agricultural and Technical State UniversityNotes to Required Supplementary InformationSchedule of University ContributionsCost-Sharing, Multiple-Employer, Defined Benefit Pension PlanLast Ten Fiscal YearsChanges of Benefit Terms:
Teachers' and State Employees' 2017 2016 2015 2014 2013 2012 2011 2010 2009 2008Retirement System 1.00% N/A N/A N/A 1.00% N/A N/A N/A 2.20% 2.20%
N/A - Not Applicable
Changes of Assumptions: In 2015, the North Carolina Retirement Systems' consulting actuaries performed the quinquennial investigation of each retirementsystem's actual demographic and economic experience (known as the "Experience Review"). The Experience Review provides the basis for selecting the actuarialassumptions and methods used to determine plan liabilities and funding requirements. The most recent Experience Review examined each plan's experienceduring the period between January 1, 2010, and December 31, 2014. Based on the findings, the Board of Trustees of the Teachers' and State Employees'Retirement System adopted a number of new actuarial assumptions and methods. The most notable changes to the assumptions include updates to the mortalitytables and the mortality improvement projection scales to reflect reduced rates of mortality and significant increases in mortality improvements. These assumptionswere adjusted to reflect the mortality projection scale MP-2015, released by the Society of Actuaries in 2015. In addition, the assumed rates of retirement, salaryincreases, and rates of termination from active employment were reduced to more closely reflect actual experience. The discount rate for the Teachers' and StateEmployees' Retirement System was lowered from 7.25% to 7.20% for the December 31, 2016 valuation. For the December 31, 2017 valuation, the discount ratewas lowered to 7.00%.
The Board of Trustees also adopted a new asset valuation method for the Teachers' and State Employees' Retirement System. For determining plan fundingrequirements, the plan now uses a five-year smoothing method with a reset of the actuarial value of assets to market value as of December 31, 2014.
The Notes to Required Supplementary Information reflect the most recent available information included in the State of North Carolina’s 2018 Comprehensive Annual Financial Report .
Cost of Living Increase
62
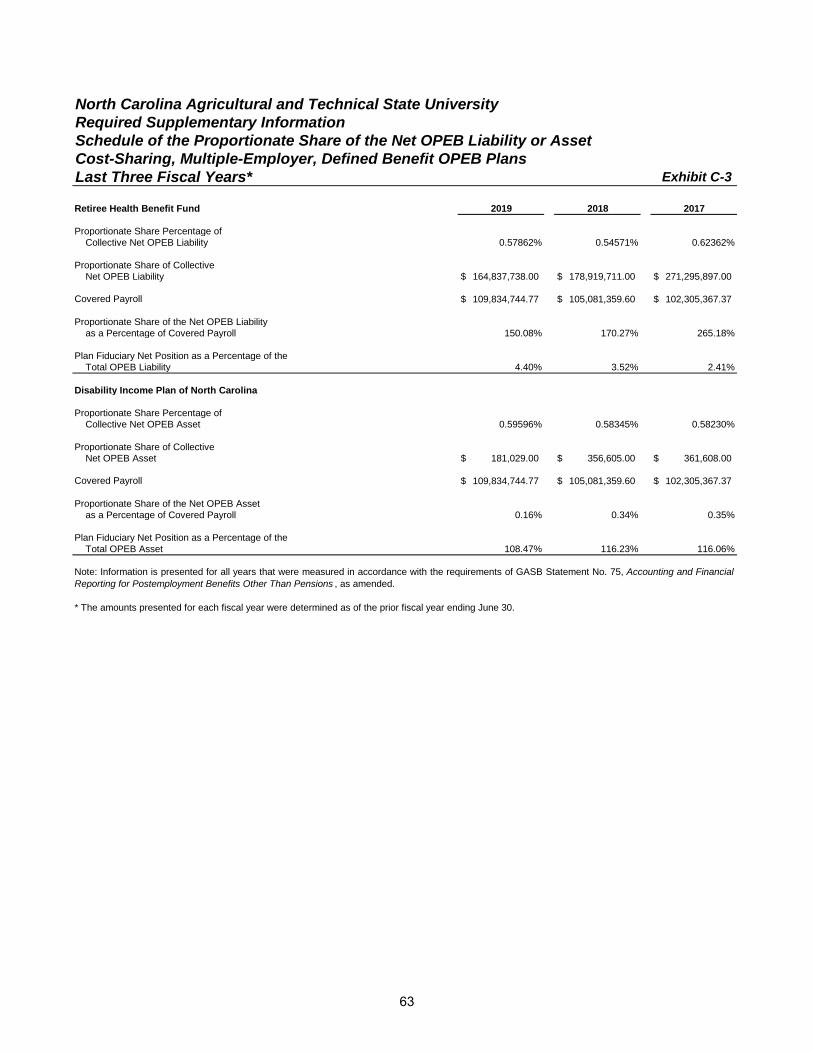
North Carolina Agricultural and Technical State UniversityRequired Supplementary InformationSchedule of the Proportionate Share of the Net OPEB Liability or AssetCost-Sharing, Multiple-Employer, Defined Benefit OPEB PlansLast Three Fiscal Years* Exhibit C-3
Retiree Health Benefit Fund
Proportionate Share Percentage ofCollective Net OPEB Liability 0.57862% 0.54571% 0.62362%
Proportionate Share of CollectiveNet OPEB Liability $ 164,837,738.00 $ 178,919,711.00 $ 271,295,897.00
Covered Payroll $ 109,834,744.77 $ 105,081,359.60 $ 102,305,367.37
Proportionate Share of the Net OPEB Liability as a Percentage of Covered Payroll 150.08% 170.27% 265.18%
Plan Fiduciary Net Position as a Percentage of theTotal OPEB Liability 4.40% 3.52% 2.41%
Disability Income Plan of North Carolina
Proportionate Share Percentage ofCollective Net OPEB Asset 0.59596% 0.58345% 0.58230%
Proportionate Share of CollectiveNet OPEB Asset $ 181,029.00 $ 356,605.00 $ 361,608.00
Covered Payroll $ 109,834,744.77 $ 105,081,359.60 $ 102,305,367.37
Proportionate Share of the Net OPEB Asset as a Percentage of Covered Payroll 0.16% 0.34% 0.35%
Plan Fiduciary Net Position as a Percentage of theTotal OPEB Asset 108.47% 116.23% 116.06%
* The amounts presented for each fiscal year were determined as of the prior fiscal year ending June 30.
2018 2017
Note: Information is presented for all years that were measured in accordance with the requirements of GASB Statement No. 75, Accounting and FinancialReporting for Postemployment Benefits Other Than Pensions , as amended.
2019
63
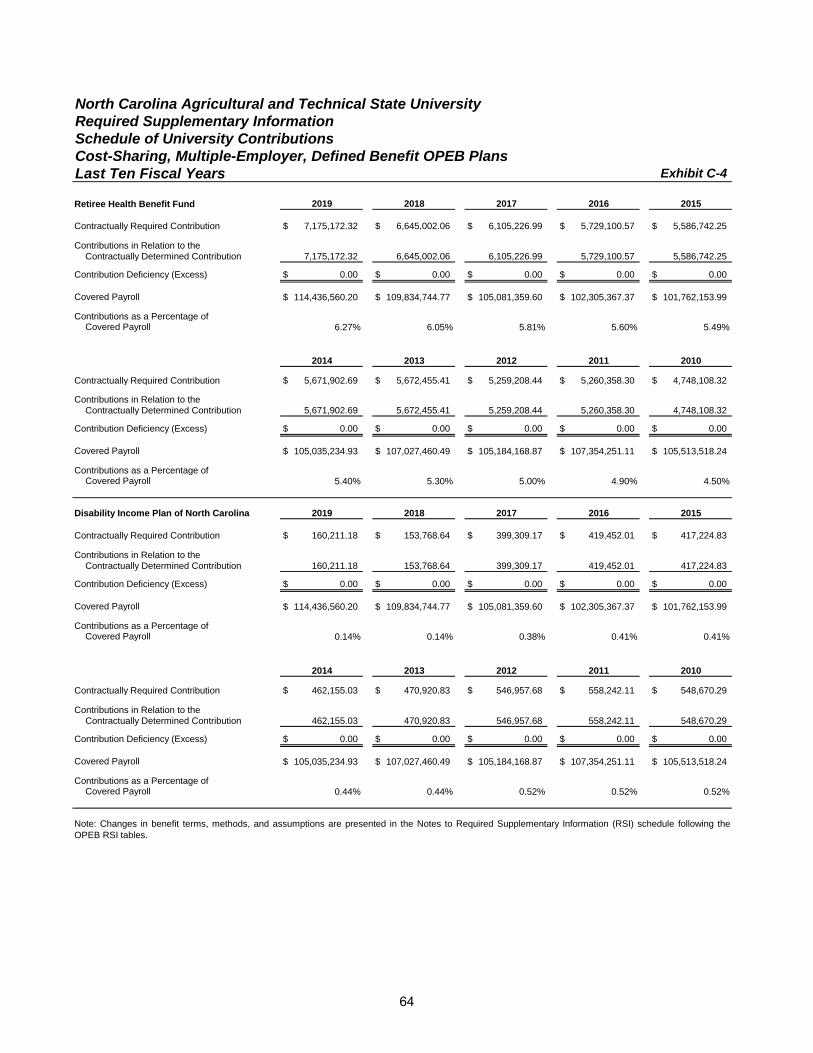
North Carolina Agricultural and Technical State UniversityRequired Supplementary InformationSchedule of University ContributionsCost-Sharing, Multiple-Employer, Defined Benefit OPEB PlansLast Ten Fiscal Years Exhibit C-4
Retiree Health Benefit Fund
Contractually Required Contribution $ 7,175,172.32 $ 6,645,002.06 $ 6,105,226.99 $ 5,729,100.57 $ 5,586,742.25
Contributions in Relation to theContractually Determined Contribution 7,175,172.32 6,645,002.06 6,105,226.99 5,729,100.57 5,586,742.25
Contribution Deficiency (Excess) $ 0.00 $ 0.00 $ 0.00 $ 0.00 $ 0.00
Covered Payroll $ 114,436,560.20 $ 109,834,744.77 $ 105,081,359.60 $ 102,305,367.37 $ 101,762,153.99
Contributions as a Percentage ofCovered Payroll 6.27% 6.05% 5.81% 5.60% 5.49%
Contractually Required Contribution $ 5,671,902.69 $ 5,672,455.41 $ 5,259,208.44 $ 5,260,358.30 $ 4,748,108.32
Contributions in Relation to theContractually Determined Contribution 5,671,902.69 5,672,455.41 5,259,208.44 5,260,358.30 4,748,108.32
Contribution Deficiency (Excess) $ 0.00 $ 0.00 $ 0.00 $ 0.00 $ 0.00
Covered Payroll $ 105,035,234.93 $ 107,027,460.49 $ 105,184,168.87 $ 107,354,251.11 $ 105,513,518.24
Contributions as a Percentage ofCovered Payroll 5.40% 5.30% 5.00% 4.90% 4.50%
Disability Income Plan of North Carolina
Contractually Required Contribution $ 160,211.18 $ 153,768.64 $ 399,309.17 $ 419,452.01 $ 417,224.83
Contributions in Relation to theContractually Determined Contribution 160,211.18 153,768.64 399,309.17 419,452.01 417,224.83
Contribution Deficiency (Excess) $ 0.00 $ 0.00 $ 0.00 $ 0.00 $ 0.00
Covered Payroll $ 114,436,560.20 $ 109,834,744.77 $ 105,081,359.60 $ 102,305,367.37 $ 101,762,153.99
Contributions as a Percentage ofCovered Payroll 0.14% 0.14% 0.38% 0.41% 0.41%
Contractually Required Contribution $ 462,155.03 $ 470,920.83 $ 546,957.68 $ 558,242.11 $ 548,670.29
Contributions in Relation to theContractually Determined Contribution 462,155.03 470,920.83 546,957.68 558,242.11 548,670.29
Contribution Deficiency (Excess) $ 0.00 $ 0.00 $ 0.00 $ 0.00 $ 0.00
Covered Payroll $ 105,035,234.93 $ 107,027,460.49 $ 105,184,168.87 $ 107,354,251.11 $ 105,513,518.24
Contributions as a Percentage ofCovered Payroll 0.44% 0.44% 0.52% 0.52% 0.52%
Note: Changes in benefit terms, methods, and assumptions are presented in the Notes to Required Supplementary Information (RSI) schedule following theOPEB RSI tables.
2019 2018 2017 2016 2015
2014 2013 2012 2011 2010
2019 2018 2017 2016 2015
2014 2013 2012 2011 2010
64
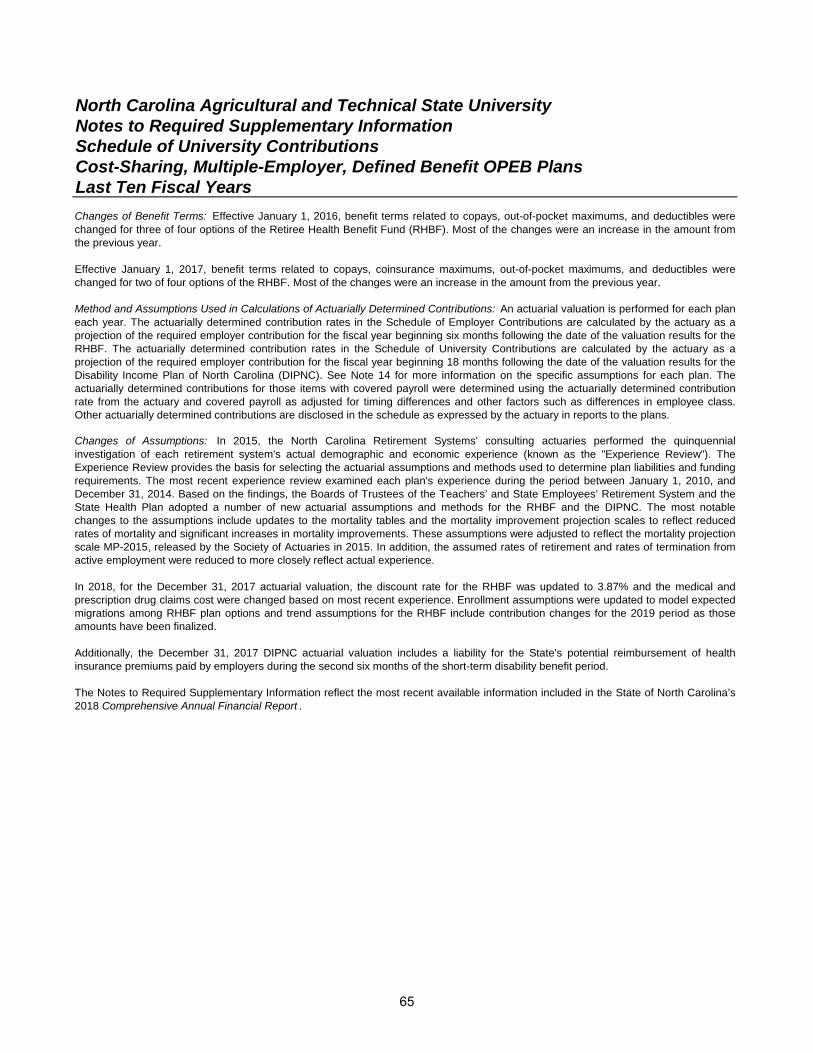
North Carolina Agricultural and Technical State UniversityNotes to Required Supplementary InformationSchedule of University ContributionsCost-Sharing, Multiple-Employer, Defined Benefit OPEB PlansLast Ten Fiscal Years
The Notes to Required Supplementary Information reflect the most recent available information included in the State of North Carolina’s2018 Comprehensive Annual Financial Report .
Additionally, the December 31, 2017 DIPNC actuarial valuation includes a liability for the State's potential reimbursement of healthinsurance premiums paid by employers during the second six months of the short-term disability benefit period.
Changes of Benefit Terms: Effective January 1, 2016, benefit terms related to copays, out-of-pocket maximums, and deductibles werechanged for three of four options of the Retiree Health Benefit Fund (RHBF). Most of the changes were an increase in the amount fromthe previous year.
Effective January 1, 2017, benefit terms related to copays, coinsurance maximums, out-of-pocket maximums, and deductibles werechanged for two of four options of the RHBF. Most of the changes were an increase in the amount from the previous year.
Method and Assumptions Used in Calculations of Actuarially Determined Contributions: An actuarial valuation is performed for each planeach year. The actuarially determined contribution rates in the Schedule of Employer Contributions are calculated by the actuary as aprojection of the required employer contribution for the fiscal year beginning six months following the date of the valuation results for theRHBF. The actuarially determined contribution rates in the Schedule of University Contributions are calculated by the actuary as aprojection of the required employer contribution for the fiscal year beginning 18 months following the date of the valuation results for theDisability Income Plan of North Carolina (DIPNC). See Note 14 for more information on the specific assumptions for each plan. Theactuarially determined contributions for those items with covered payroll were determined using the actuarially determined contributionrate from the actuary and covered payroll as adjusted for timing differences and other factors such as differences in employee class.Other actuarially determined contributions are disclosed in the schedule as expressed by the actuary in reports to the plans.
Changes of Assumptions: In 2015, the North Carolina Retirement Systems' consulting actuaries performed the quinquennialinvestigation of each retirement system's actual demographic and economic experience (known as the "Experience Review"). TheExperience Review provides the basis for selecting the actuarial assumptions and methods used to determine plan liabilities and fundingrequirements. The most recent experience review examined each plan's experience during the period between January 1, 2010, andDecember 31, 2014. Based on the findings, the Boards of Trustees of the Teachers’ and State Employees’ Retirement System and theState Health Plan adopted a number of new actuarial assumptions and methods for the RHBF and the DIPNC. The most notablechanges to the assumptions include updates to the mortality tables and the mortality improvement projection scales to reflect reducedrates of mortality and significant increases in mortality improvements. These assumptions were adjusted to reflect the mortality projectionscale MP-2015, released by the Society of Actuaries in 2015. In addition, the assumed rates of retirement and rates of termination fromactive employment were reduced to more closely reflect actual experience.
In 2018, for the December 31, 2017 actuarial valuation, the discount rate for the RHBF was updated to 3.87% and the medical andprescription drug claims cost were changed based on most recent experience. Enrollment assumptions were updated to model expectedmigrations among RHBF plan options and trend assumptions for the RHBF include contribution changes for the 2019 period as thoseamounts have been finalized.
65
INDEPENDENT AUDITOR’S REPORT
STATE OF NORTH CAROLINA Office of the State Auditor
Beth A. Wood, CPA
State Auditor
66
2 S. Salisbury Street 20601 Mail Service Center
Raleigh, NC 27699-0600 Telephone: (919) 807-7500
Fax: (919) 807-7647 https://www.auditor.nc.gov
INDEPENDENT AUDITOR’S REPORT ON INTERNAL CONTROL OVER FINANCIAL REPORTING
AND ON COMPLIANCE AND OTHER MATTERS BASED ON AN AUDIT OF FINANCIAL STATEMENTS PERFORMED IN ACCORDANCE WITH
GOVERNMENT AUDITING STANDARDS
Board of Trustees North Carolina Agricultural and Technical State University Greensboro, North Carolina
We have audited, in accordance with the auditing standards generally accepted in the United States of America and the standards applicable to financial audits contained in Government Auditing Standards issued by the Comptroller General of the United States, the financial statements of North Carolina Agricultural and Technical State University (University), a constituent institution of the multi-campus University of North Carolina System, which is a component unit of the State of North Carolina, and its discretely presented component unit, as of and for the year ended June 30, 2019, and the related notes to the financial statements, which collectively comprise the University’s basic financial statements, and have issued our report thereon dated December 12, 2019. Our report includes a reference to other auditors who audited the consolidated financial statements of The North Carolina A&T Real Estate Foundation, Inc., as described in our report on the University’s financial statements. The consolidated financial statements of The North Carolina A&T Real Estate Foundation, Inc. were not audited in accordance with Government Auditing Standards, and accordingly, this report does not include reporting on internal control over financial reporting or instances of reportable noncompliance associated with this entity.
Internal Control Over Financial Reporting In planning and performing our audit of the financial statements, we considered the University's internal control over financial reporting (internal control) to determine the audit procedures that are appropriate in the circumstances for the purpose of expressing our opinions on the financial statements, but not for the purpose of expressing an opinion on the effectiveness of the University’s internal control. Accordingly, we do not express an opinion on the effectiveness of the University’s internal control.
A deficiency in internal control exists when the design or operation of a control does not allow management or employees, in the normal course of performing their assigned functions, to prevent, or detect and correct, misstatements on a timely basis. A material weakness is a deficiency, or a combination of deficiencies, in internal control such that there is a reasonable
67
INDEPENDENT AUDITOR’S REPORT
possibility that a material misstatement of the University’s financial statements will not be prevented, or detected and corrected on a timely basis. A significant deficiency is a deficiency, or a combination of deficiencies, in internal control that is less severe than a material weakness, yet important enough to merit attention by those charged with governance.
Our consideration of internal control was for the limited purpose described in the first paragraph of this section and was not designed to identify all deficiencies in internal control that might be material weaknesses or significant deficiencies. Given these limitations, during our audit we did not identify any deficiencies in internal control that we consider to be material weaknesses. However, material weaknesses may exist that have not been identified.
Compliance and Other Matters As part of obtaining reasonable assurance about whether the University’s financial statements are free from material misstatement, we performed tests of its compliance with certain provisions of laws, regulations, contracts, and grant agreements, noncompliance with which could have a direct and material effect on the determination of financial statement amounts. However, providing an opinion on compliance with those provisions was not an objective of our audit, and accordingly, we do not express such an opinion. The results of our tests disclosed no instances of noncompliance or other matters that are required to be reported under Government Auditing Standards.
Purpose of this Report The purpose of this report is solely to describe the scope of our testing of internal control and compliance and the results of that testing, and not to provide an opinion on the effectiveness of the University’s internal control or on compliance. This report is an integral part of an audit performed in accordance with Government Auditing Standards in considering the University’s internal control and compliance. Accordingly, this communication is not suitable for any other purpose.
Beth A. Wood, CPA State Auditor
Raleigh, North Carolina
December 12, 2019
This audit required 753 hours at an approximate cost of $78,312.
68
ORDERING INFORMATION
COPIES OF THIS REPORT MAY BE OBTAINED BY CONTACTING:
Office of the State Auditor State of North Carolina
2 South Salisbury Street 20601 Mail Service Center
Raleigh, North Carolina 27699-0600
Telephone: 919-807-7500 Facsimile: 919-807-7647
Internet: https://www.auditor.nc.gov
To report alleged incidents of fraud, waste or abuse in state government contact the Office of the State Auditor Fraud Hotline: 1-800-730-8477
or download our free app.
https://play.google.com/store/apps/details?id=net.ncstateauditor.ncauditor&hl=en_US
https://itunes.apple.com/us/app/nc-state-auditor-hotline/id567315745
For additional information, contact the North Carolina Office of the State Auditor at 919-807-7666.