Embed Size (px)
Citation preview
NASA
0 h 00
P; U
CONTRACTOR
REPORT
LUNAR ORBITER I
EXTENDED-MISSION SPACECRAFT SUBSYSTEM PERFORMANCE
Prepared by
THE BOEING COMPANY
Seattle, Wash.
for Langley Research Center
NATIONAL AERONAUTICS AND SPACE ADMINISTRATION l WASHINGTON, D. C. l SEPTEMBER 1967
https://ntrs.nasa.gov/search.jsp?R=19670026411 2018-08-26T20:06:08+00:00Z
TECH LIBRARY KAFB. NM
NASA CR-87O
LUNAR ORBITER I
EXTENDED-MISSION SPACECRAFT SUBSYSTEM PERFORMANCE
Distribution of this report is provided in the interest of information exchange. Responsibility for the contents resides in the author or organization that prepared it.
Issued by Originator as Report No. D2-100727-5
Prepared under Contract No. NAS l-3800 by THE BOEING COMPANY
Seattle, Wash.
for Langley Research Center
NATIONAL AERONAUTICS AND SPACE ADMINISTRATION ..--- ~~~~ - -.
For sale by the Clearinghouse for Federal Scientific and Technical Information
Springfield, Virginia 22151 - CFSTI price $3.00

CONTENTS section*
5.0 EXTENDED-MISSION SPACECRAFT SUBSYSTEM PERFORMANCE
5.1 SUMMARY
5.1.1 Attitude Control 5.1.2 Communications 5.1.3 Power 5.1.4 Photo 5.1.5 Structure and Mechanisms 5.1.6 Velocity and Reaction Control
5.2 SUBSYSTEM PERFORMANCE 3
5.2.1 Attitude Control Subsystem 5.2.2 Communications Subsystem 5.2.3 Power Subsystem 5.2.4 Photo Subsystem 5.2.5 Structure and Mechanisms 5.2.6 Velocity and Reaction Control Subsystem
3 11 15 19 20 22
5.2.6.1 Reaction Control Subsystem Performance 5.2.6.2 Velocity Control Subsystem Performance
24 30
5.2.7 Special Tests 35
5.2.7.1 Low-Gain-Antenna Glint Test 5.2.7.2 Bright-ObjectSensor Test 5.2.7.3 Northern Hemisphere Star Map 5.2.7.4 Extended-Mission Mode -Wide Deadband 5.2.7.5 Second Goldstone Test Film Readout 5.2.7.6 Investigations Related to Cyclic Doppler
Residuals Near Perilune
38 42 43 46 48 56
5.2.7.7 Downlink Modulation Index Test 56
Page 1
* The section number 5 signifies only that this rep,ort
is the fifth in a series of numbered volumes submitted by the contractor on the Lunar Orbiter I Project. Publication of the complete series by NASA is not necessarily contemplated.
iii
5.0 EXTENDED-MISSION SPACECRAmSUBSYSTEM PERFORMANCE
The primary Lunar Orbiter I mission was to perform photographic reconnaissance of potential manned landing sites and obtain scientific data about the size, shape, gravitational characteristics, and environment of the Moon. The results of the primary mission are reported in Volumes I through III. Following the primary mission, additional scientific knowledge was gained during that phase of flight designated as the extended mission, which began at completion of photo readout on September 14, 1966, and continued through termination of the mission on October 29, 1966. Lunar Orbiter I extended-mission operational activities are reported in Volume IV. It is the purpose of this volume to report on spacecraft subsystem performance during the Lunar Orbiter I extended mission.
5.1 SUMMARY
The performance of each subsystem during the Lunar Orbiter I extended mission -which began on September 14, 1966 (Day 257) and ended on October 29, 1966 (Day 302) -is summarized below. Detail performance and operation of each subsystem is presented in Section 5.2. The special exercises performed during the extended mission are presented,in Section 5.2.7.
5.1.1 ATTITUDE CONTROL
The attitude control subsystem entered the extended mission with all components operating normally. Attitude control performance throughout the extended mis- sion was normal. Gyro drift rates remained relatively constant, i. e. : roll, approximately 0.5 degree/hour; pitch, approximately 0.35 degree/hour; yaw, approximately 1.3 degree/hour. Although the gyro temperature increased be- yond the upper limit to saturation, no deleterious effects were noted to IRU per- formance. The star tracker during the extended mission continued to experi- ence the severe glint; however, the flight operational procedures developed during the primary mission were successfully used to circumvent the problem. Sun sensors were normal, the output remaining relatively constant for the entire extended mission.
The flight programmer operated as planned, except when the programmer supply voltage dropped below that necessary to maintain the programmer power supply output voltage.
5.1.2 COMMUNICATIONS
The communication subsystem met all performance requirements during the extended mission, in spite of continued operation above the design temperature limitations of the equipment and a temporary drop in bus voltage when the equip- ment ceased to operate. The data indicates that communication subsystem per- formance was normal down to 17.6 volts, which is 3.8 volts below the compo- nent specification minimum requirement.
1
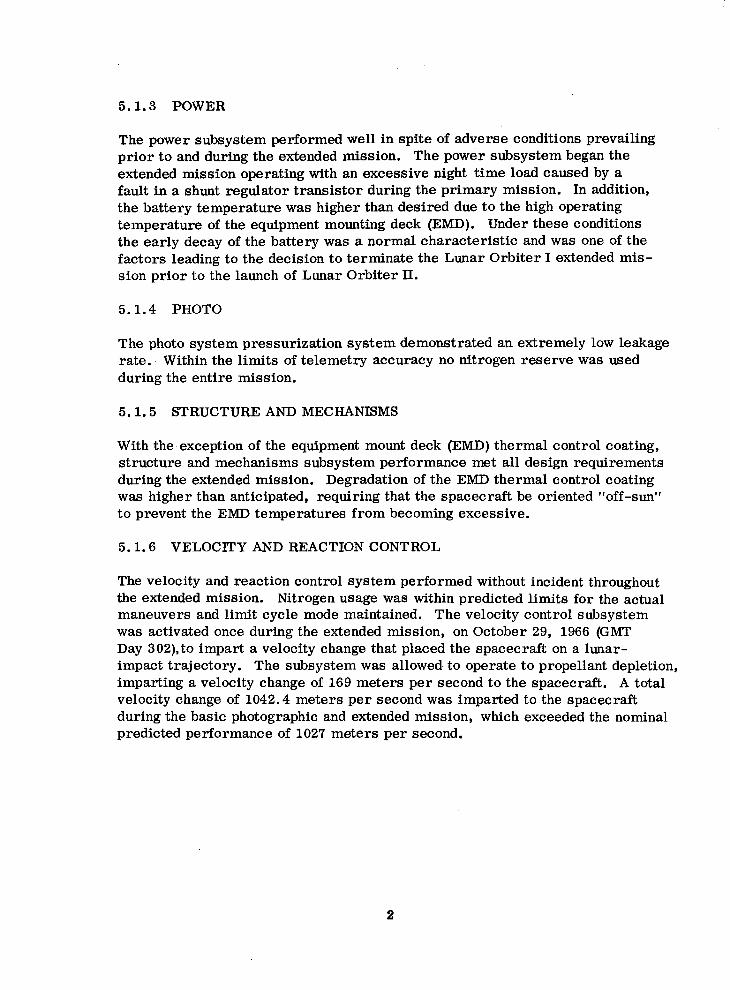
5.1.3 POWER
The power subsystem performed well in spite of adverse conditions prevailing prior to and during the extended mission. The power subsystem began the extended mission operating with an excessive night time load caused by a fault in a shunt regulator transistor during the primary mission. In addition, the battery temperature was higher than desired due to the high operating temperature of the equipment mounting deck (EMD). Under these conditions the early decay of the battery was a normal characteristic and was one of the factors leading to the decision to terminate the Lunar Orbiter I extended mis- sion prior to the launch of Lunar Orbiter II.
5.1.4 PHOTO
The photo system pressurization system demonstrated an extremely low leakage rate.. Within the limits of telemetry accuracy no nitrogen reserve was used during the entire mission.
5.1.5 STRUCTURE AND MECHANISMS
With the exception of the equipment mount deck (EMD) thermal control coating, structure and mechanisms subsystem performance met all design requirements during the extended mission. Degradation of the EMD thermal control coating was higher than anticipated, requiring that the spacecraft be oriented “off-sun” to prevent the EMD temperatures from becoming excessive.
5.1.6 VELOCITY AND REACTION CONTROL
The velocity and reaction control system performed without incident throughout the extended mission. Nitrogen usage was within predicted limits for the actual maneuvers and limit cycle mode maintained. The velocity control subsystem was activated once during the extended mission, on October 29, 1966 (GMT Day 302),to impart a velocity change that placed the spacecraft on a lunar- impact trajectory. The subsystem was allowed- to operate to propellant depletion, imparting a velocity change of 169 meters per second to the spacecraft. A total velocity change of 1042.4 meters per second was imparted to the spacecraft during the basic photographic and extended mission, which exceeded the nominal predicted performance of 1027 meters per second.
2
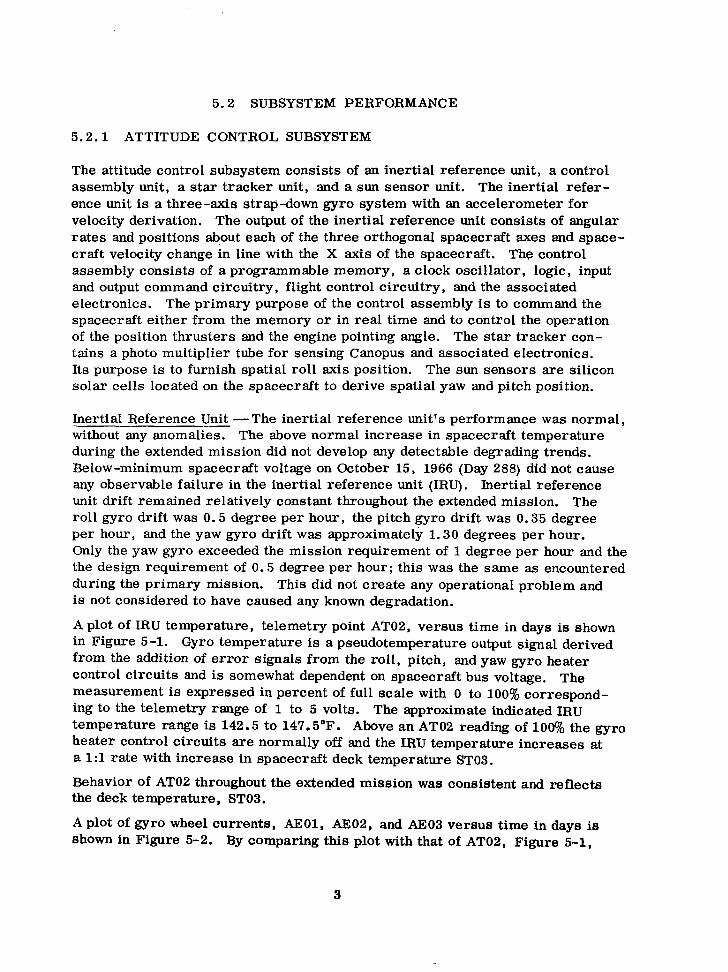
5.2 SUBSYSTEM PERFORMANCE
5.2.1 ATTITUDE CONTROL SUBSYSTEM
The attitude control subsystem consists of an inertial reference unit, a control’ assembly unit, a star tracker unit, and a sun sensor unit. The inertial refer- ence unit is a three-axis strap-down gyro system with an accelerometer for velocity derivation. The output of the inertial reference unit consists of angular rates and positions &,out each of the three orthogonal spacecraft axes and space- craft velocity change in line with the X axis of the spacecraft. The control assembly consists of a programmable memory, a clock oscillator, logic, input and output command circuitry, flight control circuitry, and the associated electronics. The primary purpose of the control assembly is to command the spacecraft either from the memory or in real time and to control the operation of the position thrusters and the engine pointing angle. The star tracker con- tains a photo multiplier tube for sensing Canopus and associated electronics. Its purpose is to furnish spatial roll axis position. The sun sensors are silicon solar cells located on the spacecraft to derive spatial yaw and pitch position.
Inertial Reference Unit -- -The inertial reference unit’s performance was normal,
without any anomalies. The above normal increase in spacecraft temperature during the extended mission did not develop any detectable degrading trends. Below-minimum spacecraft voltage on October 15, 1966 (Day 288) did not cause any observable failure in the inertial reference unit (IRU). Inertial reference unit drift remained relatively constant throughout the extended mission. The roll gyro drift was 0.5 degree per hour, the pitch gyro drift was 0.3’5 degree per hour, and the yaw gyro drift was approximately 1.30 degrees per hour. Only the yaw gyro exceeded the mission requirement of 1 degree per hour and the the design requirement of 0.5 degree per hour; this was the same as encountered during the primary mission. This did not create any operational problem and is not considered to have caused any known degradation.
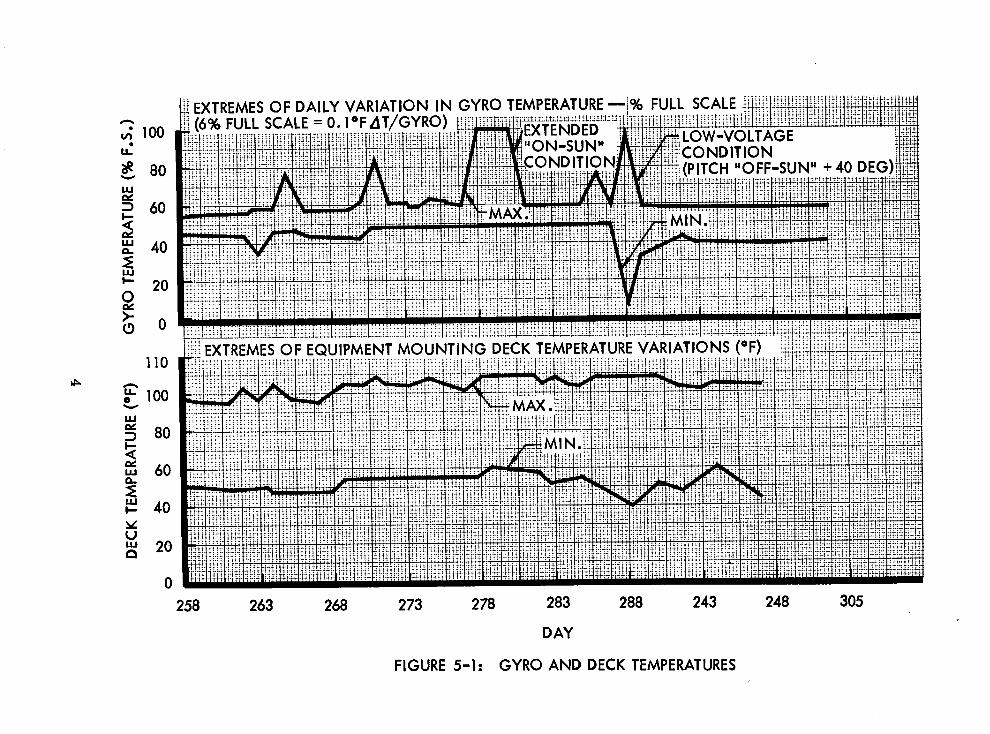
A plot of IRU temperature, telemetry point AT02, versus time in days is shown in Figure 5-l. Gyro temperature is a pseudotemperature output signal derived from the addition of error signals from the roll, pitch, and yaw gyro heater control circuits and is somewhat dependent on spacecraft bus voltage. The measurement is expressed in percent of full scale with 0 to 100% correspond- ing to the telemetry range of 1 to 5 volts. The approximate indicated IRU temperature range is 142.5 to 147.5’F. Above an AT02 reading of 100% the gyro heater control circuits are normally off and the IRU temperature increases at a 1:l rate with increase in spacecraft deck temperature ST03.
Behavior of AT02 throughout the extended mission was consistent and reflects the deck temperature, ST03.
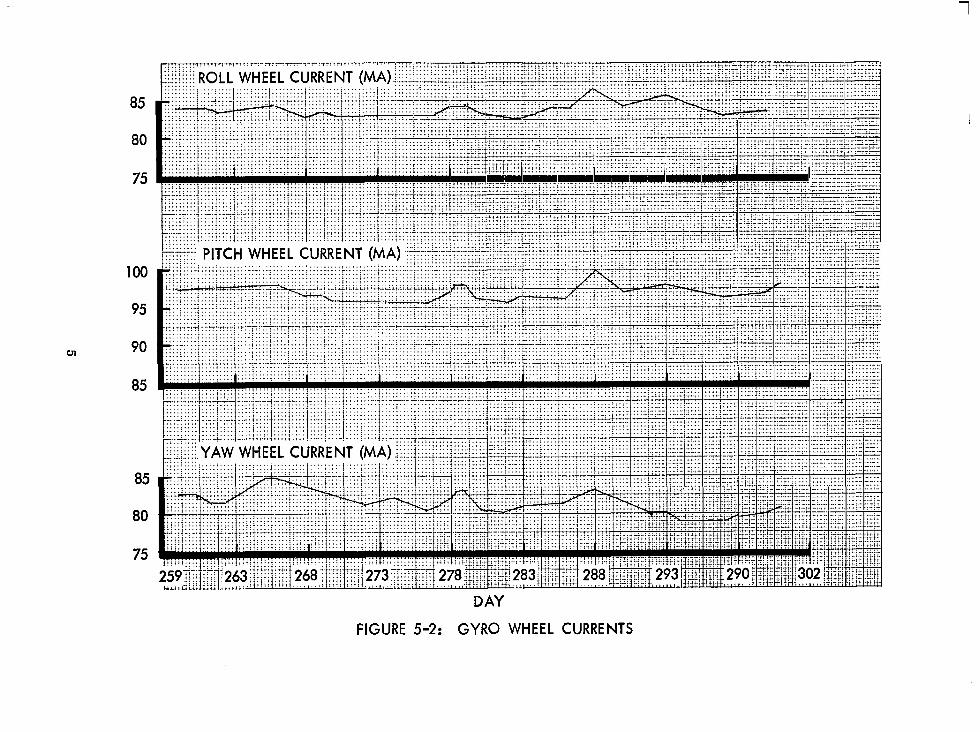
A plot of gyro wheel currents, AEOl, AE02, and AE03 versus time in days is shown in Figure 5-2. By comparing this plot with that of AT02, Figure 5-1,
3
100
80
60
40
20
0
Tm + 40 DEG)$jq
bit EXTREMES OF EQUIPMENT MOUNTING DECK TEMPERATURE VARIATIONS (OF) i
258 263 268 273 278 283 288 243 248 305
DAY
FIGURE 5-l: GYRO AND DECK TEMPERATURES
85
80
75
100
95
90
85
85
80
75
DAY
FIGURE 5-2: GYRO WHEEL CURRENTS
it may be seen that short-term wheel current changes occur in conjunction with IRU temperature changes. Temperature is unlikely to significantly affect the spin motor current, therefore the temperature effect probably originates in the IRU wheel current signal conditioning circuitry. There is no indication of long- term change in wheel current. From the available evidence, the wheel current telemetry displayed normal operation throughout the extended mission.
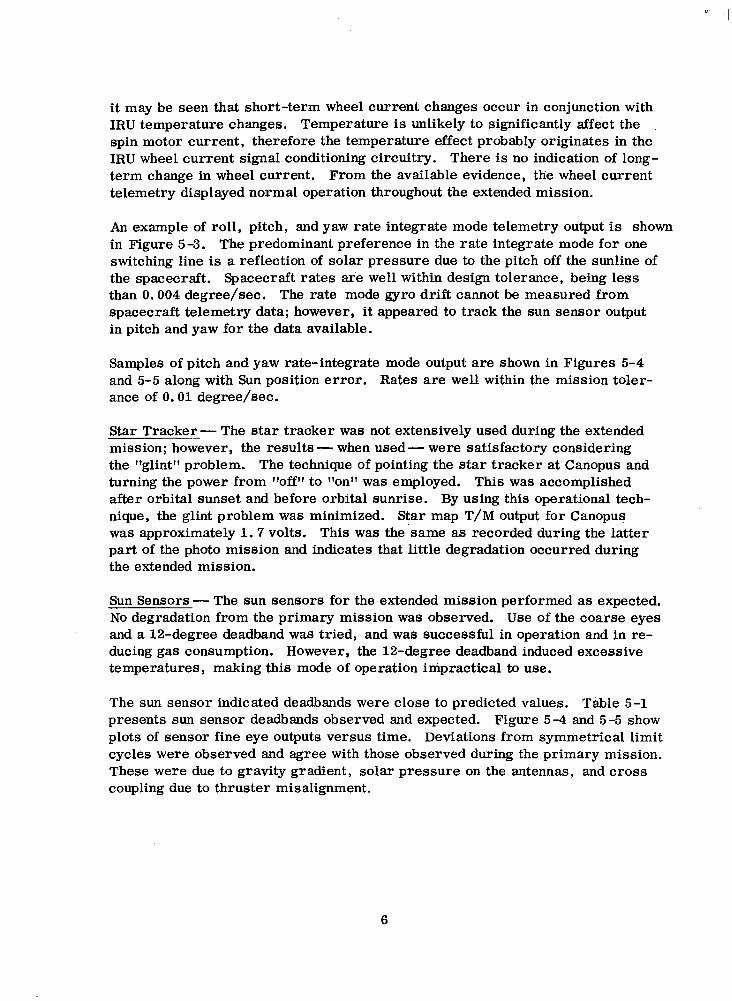
An example of roll, pitch, and yaw rate integrate mode telemetry output is shown in Figure 5-3. The predominant preference in the rate integrate mode for one switching line is a reflection of solar pressure due to the pitch off the sunline of the spacecraft. Spacecraft rates are well within design tolerance, being less than 0.004 degree/set. The rate mode gyro drift cannot be measured from spacecraft telemetry data; however, it appeared to track the sun sensor output in pitch and yaw for the data available.
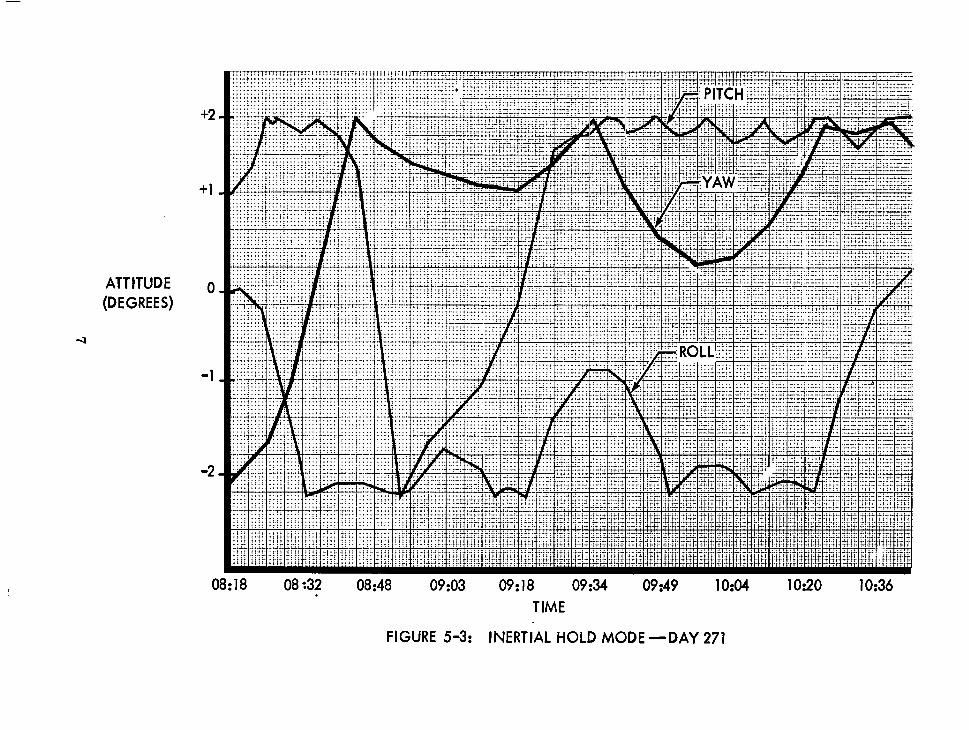
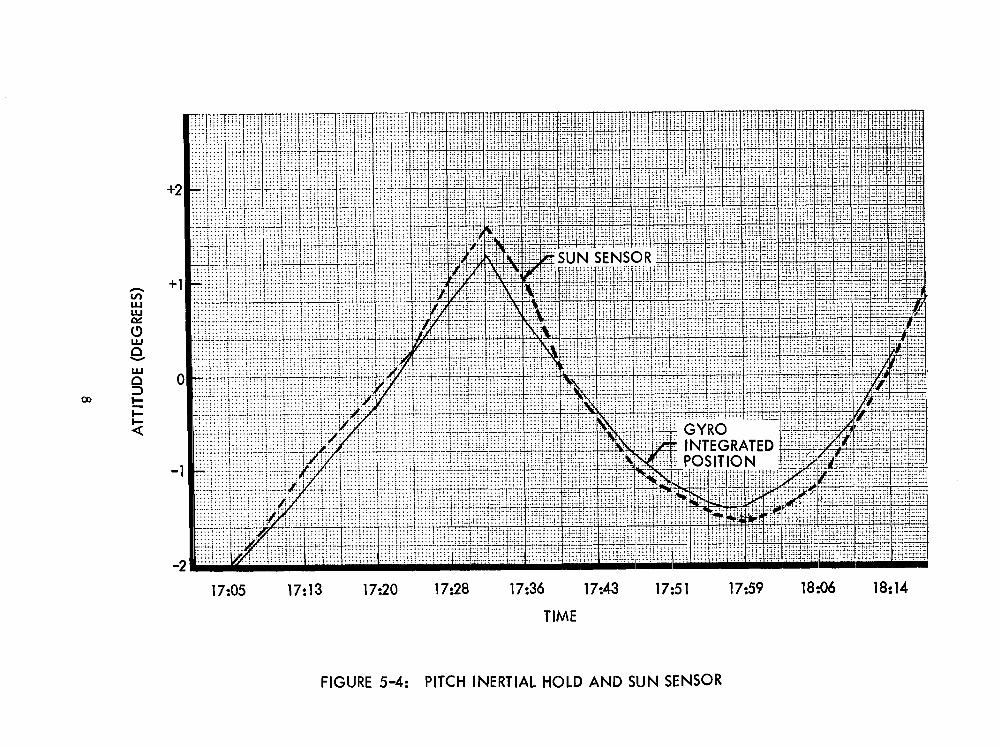
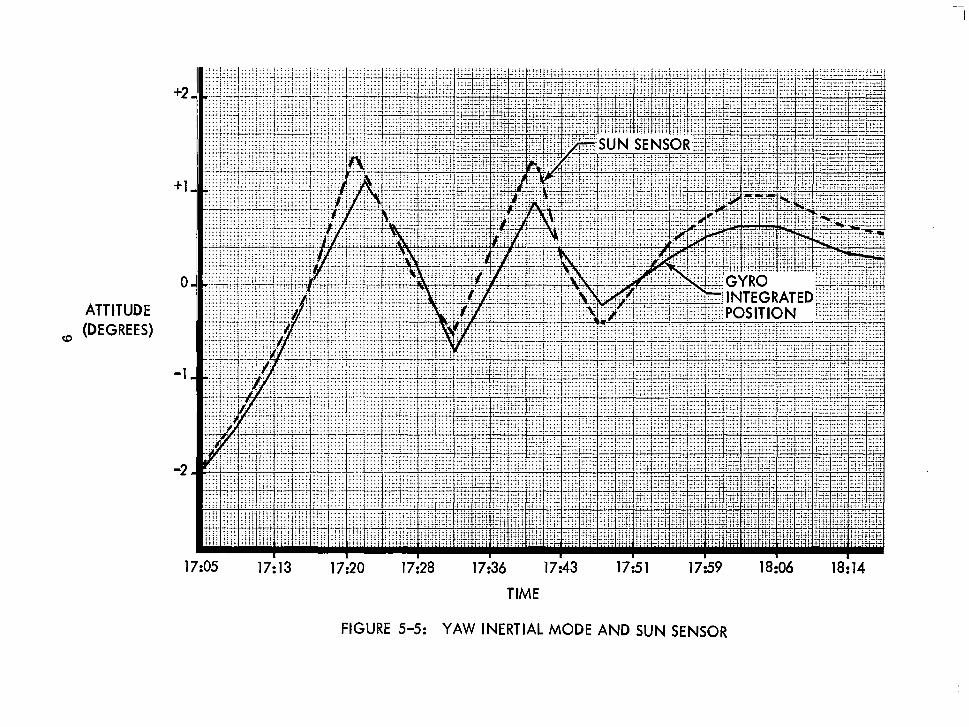
Samples of pitch and yaw rate-integrate mode output are shown in Figures 5-4 and 5-5 along with Sun position error. Rates are well within the mission toler- ance of 0.01 degree/set.
Star Tracker - The star tracker was not extensively used during the extended mission; however, the results - when used- were satisfactory considering the “glint” problem. The technique of pointing the star tracker at Canopus and turning the power from “off” to rronf’ was employed. This was accomplished after orbital sunset and before orbital sunrise. By using this operational tech- nique, the glint problem was minimized. Star map T/M output for Canopus was approximately 1.7 volts. This was the ‘same as recorded during the latter part of the photo mission and indicates that little degradation occurred during the extended mission.
Sun Sensors - The sun sensors for the extended mission performed as expected. No degradation from the primary mission was observed. Use of the coarse eyes and a 12-degree deadband was tried, and was successful in operation and in re- ducing gas consumption. However, the 12-degree deadband induced excessive temperatures, making this mode of operation impractical to use.
The sun sensor indicated deadbands were close to predicted values. Table 5-l presents sun sensor deadbands observed and expected. Figure 5-4 and 5-5 show plots of sensor fine eye outputs versus time. Deviations from symmetrical limit cycles were observed and agree with those observed during the primary mission. These were due to gravity gradient, solar pressure on the antennas, and cross coupling due to thruster misalignment.
6
+2
+1
ATTITUDE 0 (DEGREES)
-1
-2
08 :32 . 09:18 09:34 TIME
FIGURE 5-3: INERTIAL HOLD MODE-DAY 271
17:05 17:13 17:20 17:28 17:36 17:43 17:51 17:59 18:06 18:14
TIME
FIGURE 5-4: PITCH INERTIAL HOLD AND SUN SENSOR
+2
+1
0
ATTITUDE ED (DEGREES)
-1
-2
17:05 17:13 17:20 17:28 17:36 17:43 17:51 17:59
TIME
FIGURE 5-5: YAW INERTIAL MODE AND SUN SENSOR
18:14
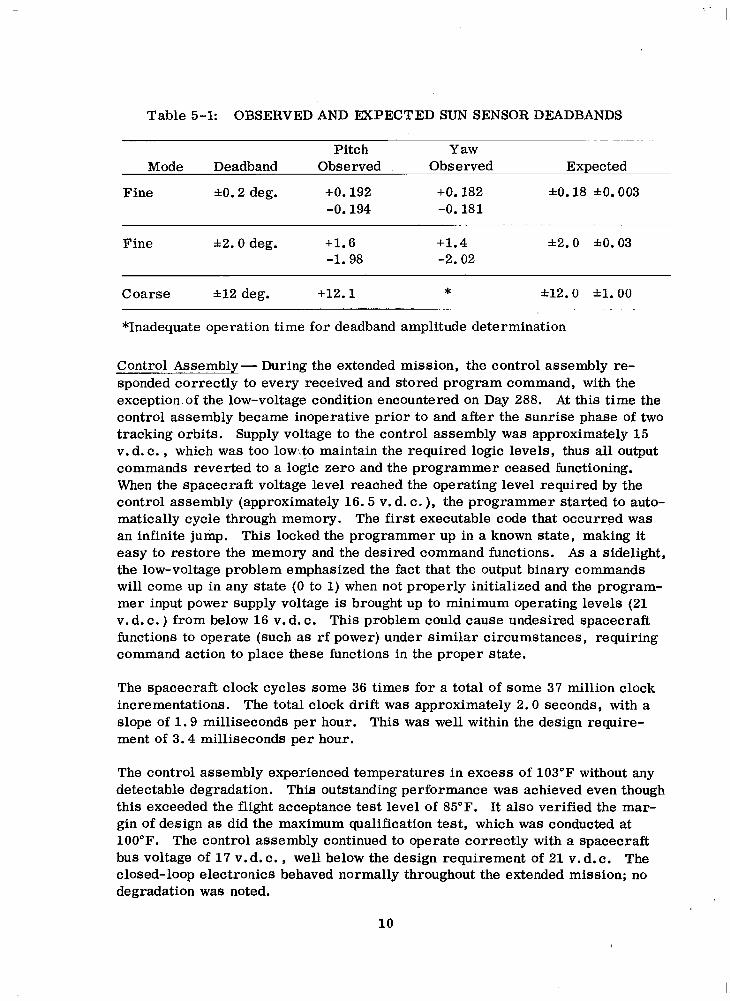
Table 5-l: OBSERVED AND EXPECTED SUN SENSOR DEADBANDS
Mode Deadband
Fine ito. 2 deg.
Pitch Observed
+o. 192 -0.194
Yaws. Observed
+O. 182 -0.181
Expected
*O. 18 &O. 003
Fine
Coarse
52.0 deg.
~12 deg.
+l. 6 +1.4 h2.0 kO.03 -1.98 -2.02
+12.1 * hl2.0 hl. 00
*Inadequate operation time for deadband amplitude determination
Control Assembly- During the extended mission, the control assembly re- sponded correctly to every received and stored program command, with the exception.of the low-voltage condition encountered on Day 288. At this time the control assembly became inoperative prior to and after the sunrise phase of two tracking orbits. Supply voltage to the control assembly was approximately 15 v. d. c. , which was too 1ow;to maintain the required logic levels, thus all output commands reverted to a logic zero and the programmer ceased functioning. When the spacecraft voltage level reached the operating level required by the control assembly (approximately 16.5 v. d. c. ), the programmer started to auto- matically cycle through memory. The first executable code that occurred was an infinite jump. This locked the programmer up in a known state, making it easy to restore the memory and the desired command functions. As a sidelight, the low-voltage problem emphasized the fact that the output binary commands will come up in any state (0 to 1) when not properly initialized and the program- mer input power supply voltage is brought up to minimum operating levels (21 v. d. c. ) from below 16 v. d. c. This problem could cause undesired spacecraft functions to operate (such as rf power) under similar circumstances, requiring command action to place these functions in the proper state.
The spacecraft clock cycles some 36 times for a total of some 37 million clock incrementations. The total clock drift was approximately 2.0 seconds, with a slope of 1.9 milliseconds per hour. This was well within the design require- ment of 3.4 milliseconds per hour.
The control assembly experienced temperatures in excess of 103°F without any detectable degradation. This outstanding performance was achieved even though this exceeded the flight acceptance test level of 85°F. It also verified the mar- gin of design as did the maximum qualification test, which was conducted at 100°F. The control assembly continued to operate correctly with a spacecraft bus voltage of 17 v. d. c. , well below the design requirement of 21 v. d. c. The closed-loop electronics behaved normally throughout the extended mission; no degradation was noted.
10
I -
5.2.2 COMMUNICATIONS SUBSYSTEM
The communications subsystem consists of the equipment which: (1) receives information from the ground via an rf link and converts this information to a form suitable for use by the spacecraft; (2) receives information from the spacecraft (telemetry and video), converts this information to modulation on an rf carrier, and transmits this modulated rf carrier to the ground; (3) receives ranging infor- mation from the ground via rf link, modulates this information on a rf carrier, and retransmits this to the ground for use in range determination; and (4) estab- lishes a specific ratio between the received rf frequency from the ground and the spacecraft transmitted frequency for accurate determination of the spacecraft velocity using doppler information.
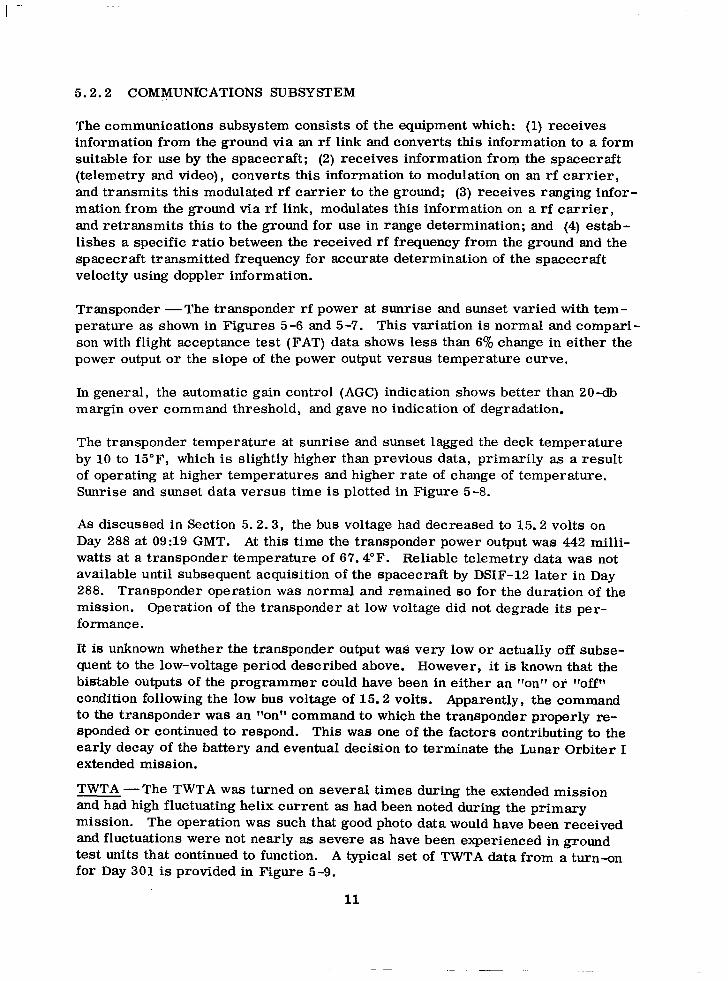
Transponder -The transponder rf power at sunrise and sunset varied with tem- perature as shown in Figures 5 -6 and 5-7. This variation is normal and compari- son with flight acceptance test (FAT) data shows less than 6% change in either the power output or the slope of the power output versus temperature curve.
In general, the automatic gain control (AGC) indication shows better than 2O-db margin over command threshold, and gave no indication of degradation.
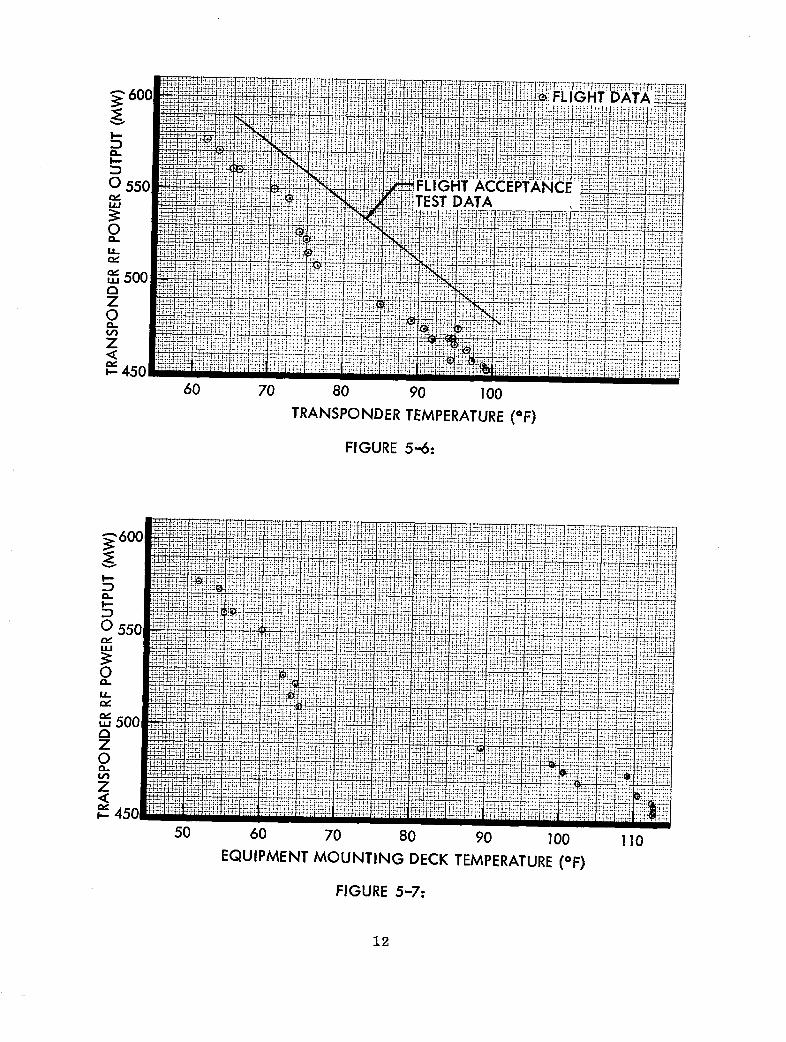
The transponder temperature at sunrise and sunset lagged the deck temperature by 10 to 15”F, which is slightly higher than previous data, primarily as a result of operating at higher temperatures and higher rate of change of temperature. Sunrise and sunset data versus time is plotted in Figure 5-8.
As discussed in Section 5.2.3, the bus voltage had decreased to 15.2 volts on Day 288 at 09:19 GMT. At this time the transponder power output was 442 milli- watts at a transponder temperature of 67.4”F. Reliable telemetry data was not available until subsequent acquisition of the spacecraft by DSIF-12 later in Day 288. Transponder operation was normal and remained so for the duration of the mission. Operation of the transponder at low voltage did not degrade its per- formance.
It is unknown whether the transponder output was very low or actually off subse- quent to the low-voltage period described above. However, it is known that the bistable outputs of the programmer could have been in either an f’onll or “off” condition following the low bus voltage of 15.2 volts. Apparently, the command to the transponder was an “on” command to which the transponder properly re- sponded or continued to respond. This was one of the factors contributing to the early decay of the battery and eventual decision to terminate the Lunar Orbiter I extended mission.
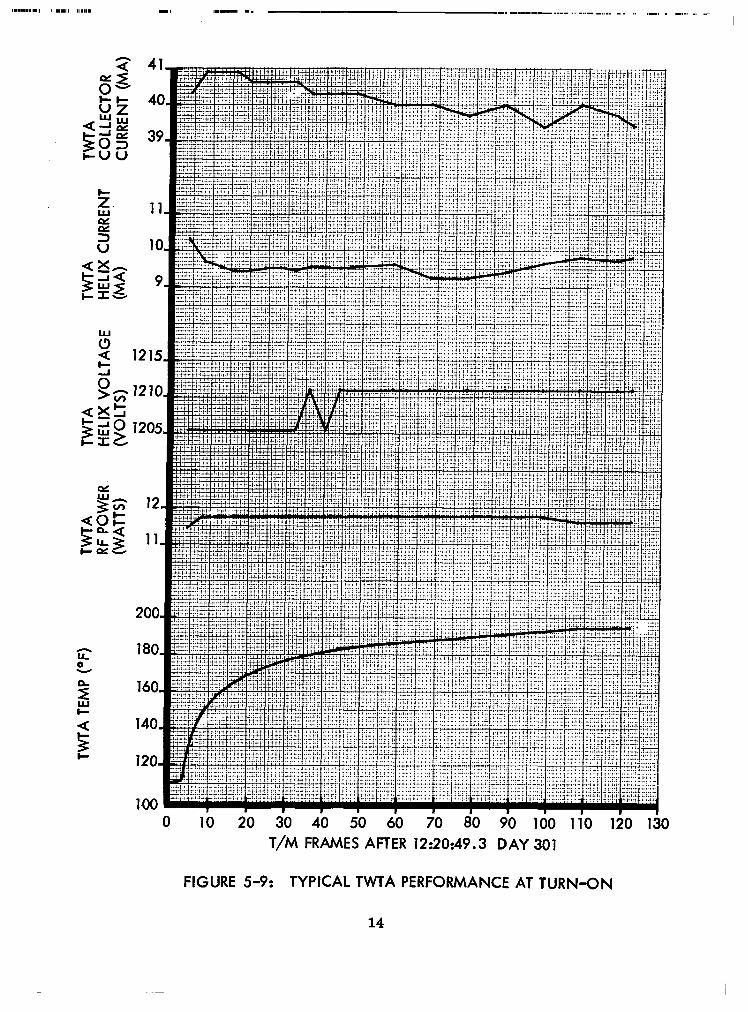
TWTA -The TWTA was turned on several times during the extended mission and had high fluctuating helix current as had been noted during the primary
mission. The operation was such that good photo data would have been received and fluctuations were not nearly as severe as have been experienced in ground
test units that continued to function. A typical set of TWTA data from a turn-on for Day 301 is provided in Figure 5-9.
11
TRANSPONDER TEMPERATURE (OF)
FIGURE 5-6:
EQUIPMENT MOUNTING DECK TEMPERATURE (OF)
FIGURE 5-7:
12
270 275 280 285 290 295 298 DAY (GMT)
FIGURE 5-8: TRANSPONDER TEMPERATURE/POWER HISTORY
13
L
c 0
FIGURE 5-9: TYPICAL TWTA PERFORMANCE AT TURN-ON
14
0‘
F
The remaining equipment in the communications subsystem responded properly when commanded and provided no indication of degradation.
5.2.3 POWER SUBSYSTEM
The electrical power subsystem is the sole source of all the electrical power used by the spacecraft as it performs all phases of its space mission. Radiant solar energy is collected by 2’714 N-on-P solar cells mounted on each of four solar panels and is converted into electrical energy. This energy supplies all space- craft loads, power subsystem losses, and charge current to the nickel-cadmium battery. The shunt regulator limits the bus voltage to less than 31 volts and dissipates excess electrical energy in resistors mounted external to the space- craft heat shield. A charge controller protects the battery from overvoltage and overtemperature conditions by regulating the charging current. The 12 -ampere- hour battery provides electrical power to the spacecraft loads during periods of Sun occultation.
Solar Array -The solar array operated normally throughout the extended mis- - sion. Sufficient power was provided to the spacecraft to maintain a constant bus voltage of 30.56 volts when in the sunlight. The solar panel power output with the spacecraft on Sun during initial Orbit 10 of the primary mission was 12.73 amperes at 92°F on August 16, 1966 (Day 228). Twice during the extended mis- sion the spacecraft was oriented on Sun; the solar panel output was 12.67 amperes at 120°F on Day 278, and 12.73 amperes at 108°F on Day 301.
The solar array degradation was more than offset by an increasing solar constant during this extended mission. The temperature variations shown above for the quoted solar array output currents have an insignificant effect on array output. They occur at the crest of the array output-temperature characteristic curve.
Battery -The battery performed in a near normal manner considering the oper- ating restraints imposed on it. Due to the shunt regularor (transistor) failure that occurred during the primary mission the battery had to supply an additional 1.25 amperes during periods of Sun occultation. This abnormal load took an additional 1 ampere-hour out of the battery each orbit. The second restraint was the high operating temperature resulting from a deck temperature that was above its design point. As a result, the end-of -charge battery temperatures frequently reached 100 to 116”F, or 15 to 31 degrees above the normal upper limit.
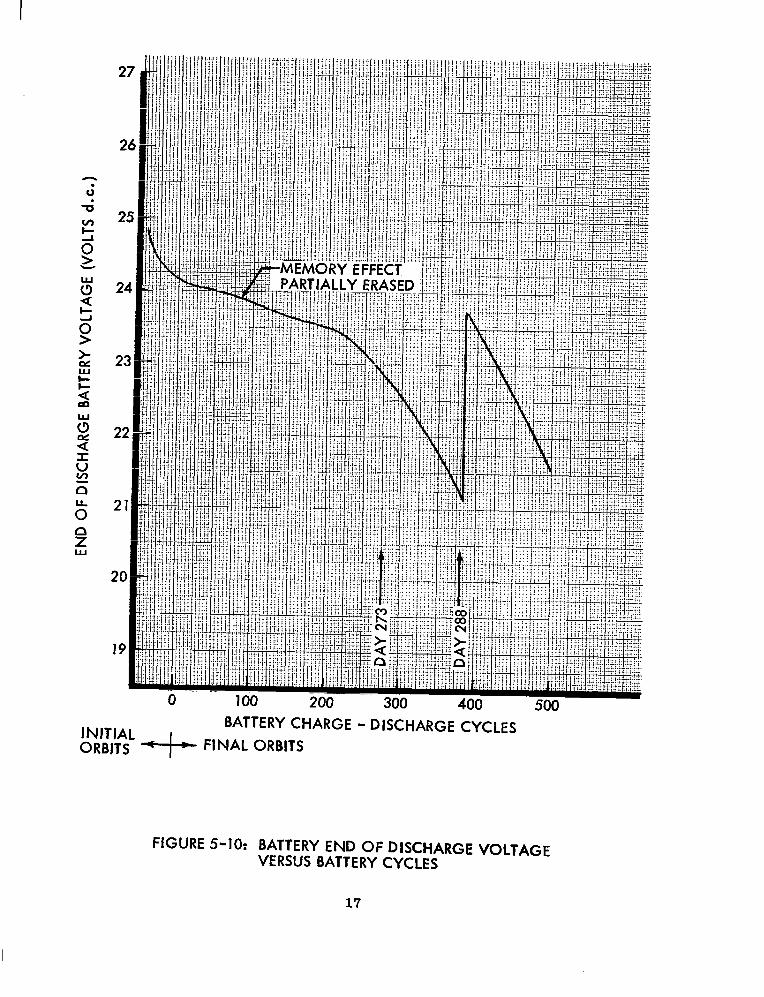
The Lunar Orbiter nickel+admium cells have a memory effect characteristic that is encountered after many repetitive charge discharge cycles. At normal temperatures and a normal depth of discharge this phenomenon is not encountered until several thousand cycles have been experienced. Both elevated temperatures and increased depth of discharge bring on memory effect earlier. The byproduct of memory effect is a dropping off of battery end-of-discharge voltage. In the laboratory, memory effect can be completely erased by completely discharging and then slowly recharging the battery.
15
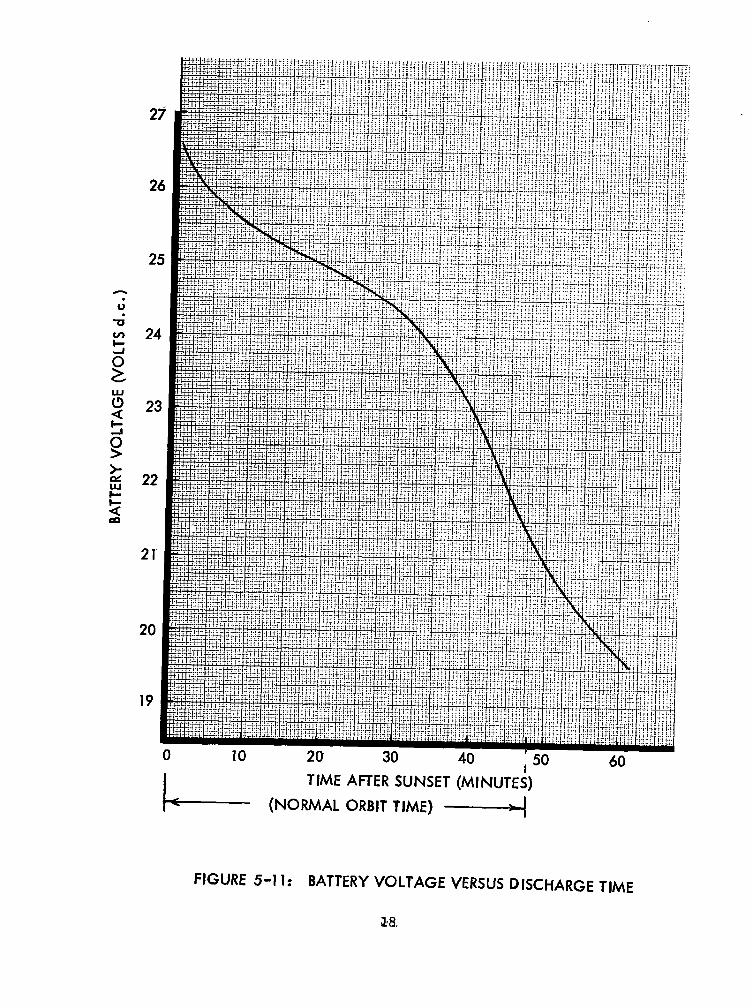
On September 30, 1966 (GMT-273), the battery voltage was beginning to drop off, showing a start of memory effect. Figure 5-10 is a record of the battery end-of- discharge voltage. To partially erase the memory effect the battery was inten- tionally discharged below its normal level during one orbit. This was accom- plished by pitching the spacecraft approximately 90 degrees off sun prior to sun- rise on Orbit 383, GMT Day 288. The average battery discharge current at night was 5.0 amps, which with an orbital nighttime period of 48 minutes, resulted in a discharge of 4.0 amp-hours. By remaining off-sun for 18 minutes after sun- rise it was planned to discharge the battery an additional 1.2 amp-hours, provld- ing the battery voltage did not fall below 20.0 volts. Figure 5-11 shows the resultant battery voltage versus time. When the battery voltage reached 19.7 volts, 12 minutes after sunrise, the spacecraft was commanded to pitch to +36 degrees so that the array was again illuminated. But before there was sufficient array current to recharge the battery, the battery voltage had fallen to 19.52 volts and telemetry data was terminated by earthset. Data received at earthrise indicated that everything was operating normally and it was decided to change the stored pitch maneuver from 30 degrees to 40 degrees to reduce spacecraft, and hence battery temperatures. Due to a bit error in the command message, an attempt to store this new pitch command resulted in a realtime pitch maneuver being commanded 23 times at l-minute intervals. This caused the spacecraft to maneuver off-sun and the programmer went into infinite jump. Subsequently the battery discharged through sunset and for about 13 minutes after sunrise for a total discharge time of approximately 87 minutes. Telemetry data terminated at earthset, 10 minutes after sunrise, at which time the bus voltage was 16.5 volts and the battery voltage was 17.0 volts. It was estimated, however, that the total amp-hours discharged were 7.3 and that the battery voltage fell below 16.5 volts before the Sun was reacquired and battery charging resumed.
As a result of this excessive discharge and loss of charging time, the battery did not fully recharge during Orbit 384 and in the next discharge period the battery voltage fell to 15. 8 volts, resulting in a bus voltage of 15.2 volts, at which time, 09:19 GMT, lock was lost. No further data was available until 18:22 GMT when the bus voltage was 30.56 volts with the battery at 27. 8 volts and being charged at 2.28 amps, tapered charge. The subsequent battery end of discharge voltage was 23. 8 volts, indicating some improvement in battery performance. Although the first intentional deep discharge was insufficient to appreciably effect battery performance, the subsequent unintentional excessive discharge improved the battery discharge characteristics. The continued high temperature and deep dis- charge on each orbit caused the battery to continue to show a decreasing end-of- discharge voltage. On Day 302 the end-of-discharge voltage reached 21.6 volts. With the battery operating at the high temperature and the additional load it was apparent that it could not carry the spacecraft for another 30 days while Mission II was flown. The extended mission was terminated on Day 302 (October 29, 1966). The battery had operated through the primary and extended mission a total of 547 charge-discharge cycles.
16
&y;;;sL a+--+ FINAL ORBITS
FIGURE 5-10: BATTERY END OF DISCHARGE VOLTAGE VERSUS BATTERY CYCLES
17
TIME AFTER SUNSET (MINUTE;)
F (NORMAL ORBIT TIME) -=
FIGURE 5-11: BATTERY VOLTAGE VERSUS DISCHARGE TIME
&8.
5.2.4 PHOTO SUBSYSTEM
The photo subsystem consists of two cameras for photography, a V/H sensor to compensate for spacecraft motion during photography, film processing equipment, readout equipment, and necessary electronic logic for operation of the photo sub: system equipment. One camera has a 610-mm telephoto lens with l-meter reso- lution capability; the other camera has an 80-mm wide-angle lens with 8-meter resolution. (The design altitude for the l- and 8-meter resolution is 46 km. ) Both cameras use the same type SO-243 film, have the same speed adjustments (l/25, l/50, or l/100 second), and are coupled to the V/H sensor for image motion compensation.
The film is developed by laminating it with a chemical-carrying Bimat (SO-111). After processing, the film and Bimat are delaminated. The film is then dried and stored in preparation for readout.
Readout is accomplished by illuminating the film with a focused light beam (6.5- micron diameter) emanating from a line scan tube. The resulting light variations, which are dependent on film density, are sensed by a photo-multiplier tube, the output of which is amplified and transmitted via the communications subsystem to the ground receiving stations.
The photo subsystem was used to accomplish the prime mission of photographing selected areas of the lunar surface, processing the exposed film, and reading out the photographs via the communications subsystem to the ground stations. Follow- ing the primary mission the photo subsystem was in a film-exhausted condition; therefore, at the start of extended mission it was commanded to the solar eclipse mode which resulted in minimum power consumption. Only the pressure and temperature data could be evaluated since the photo subsystem was not used during the extended mission, except for the special test reported in Section 5.2.~.
Pressure -The photo system internal pressure measurements indicated an extremely pressure-tight system in that pressure was within 1.461 and 1.546 psia (pressure variation due to variation in photo system temperature and tele- metering tolerance) for the entire extended mission. Thus, the pressure did not reach the minimum pressure of 1.15 =tO. 15 psia where it would start drawing from the photo system nitrogen storage bottle. This was verified by the photo system nitrogen bottle pressure in that it remained between 2178 and 2296 psia for the entire extended mission. Here again the pressure variation is attributed to the temperature variation and the telemetering tolerance.
Temperature -The photo system upper environmental temperature was observed to vary from 60.9 to 83.9”F during the extended mission. These temperatures were within the normal acceptable limits of 40 to 100°F for this measurement.
19
5.2.5 STRUCTURE AND MECHANISMS
The structure and mechanisms system consists of the support structure, ther- mal control coatings, thermal barrier, engine deck heat shield, solar panel and antenna deployment mechanisms, camera thermal door, rocket engine gimbal, bipropellant tank heaters, and the interconnecting electrical wiring.
With the exception of the camera thermal door (CTD) and the rocket engine gim- bal, the structure and mechanisms system was in a passive condition during the extended mission. Only the equipment mount deck (EMD) thermal control coating and the CTD performance is discussed in detail since the performance of the remainder of the system was as anticipated.
Equipment Mount Deck (EMD) Thermal Control Coating - For the extended mis - sion, the EMD thermal control coating degradation required that the spacecraft continue to be oriented “off-sun” to maintain the EMD temperature at a safe level.
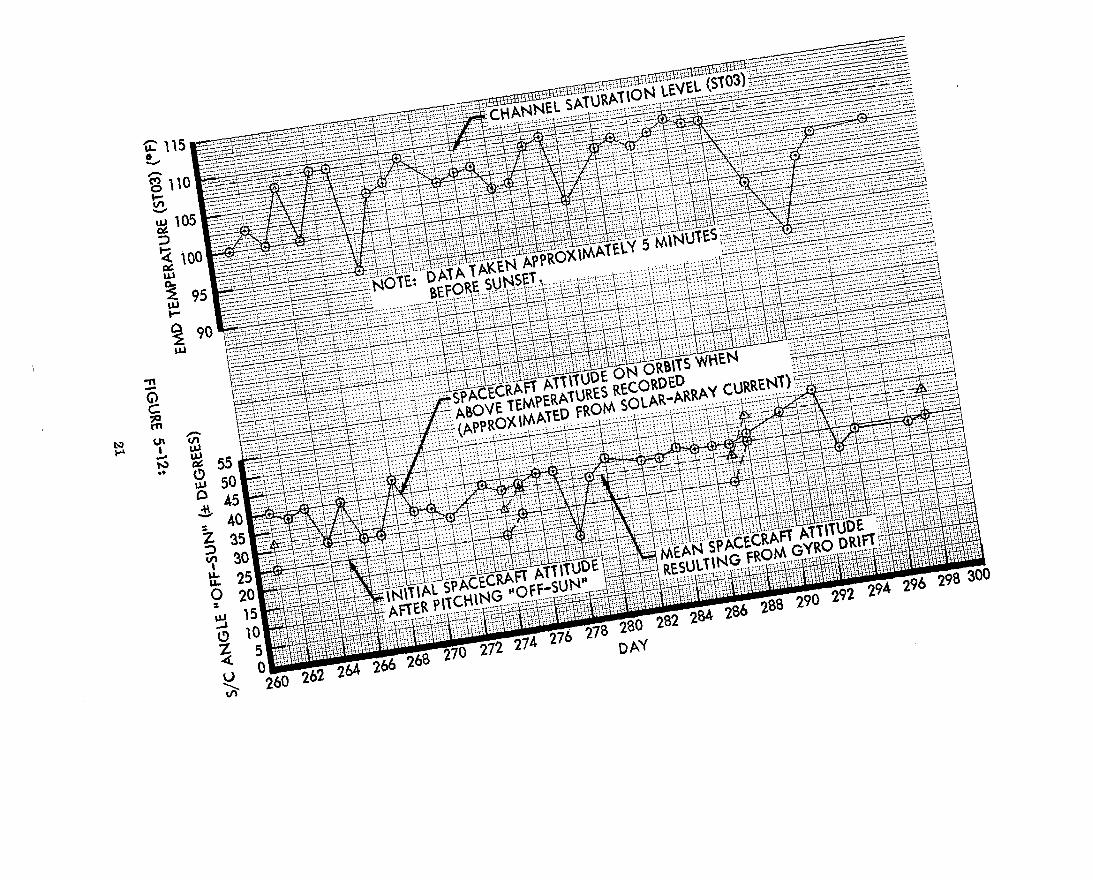
The spacecraft generally was pitched off-sun 25 degrees from Days 260 through 274, 30 degrees from Days 275 through 287, and 40 degrees from Day 288 until the end of the mission. Figure 5-12 shows the critical EMD temperature (ST03 - under the IRU) and the spacecraft attitude versus time. The anticipated rate of thermal control coating degradation during the extended mission was a 0.0055 increase in cy (absorptance value) per 100 equivalent sunhours (ESI-I). The actual rate of thermal control coating degradation was a 0.0085 increase per 100 ESH. This accelerated rate of degradation alone was not sufficient to create a problem. However, elevated spacecraft temperatures were experienced due to an excessive rate of thermal control coating degradation during the primary mission.
Camera Thermal Door (CTD) -An incorrect sequence of CTD commands was issued to the spacecraft, resulting in the CTD becoming inoperable. The correct sequence of commands for CTD operation is as follows.
Door Opening Commands
CTD Open
6.4-second wait time
CTD Control off
Door Closing Commands
CTD Close
6.4-second wait time
CTD Control off
20
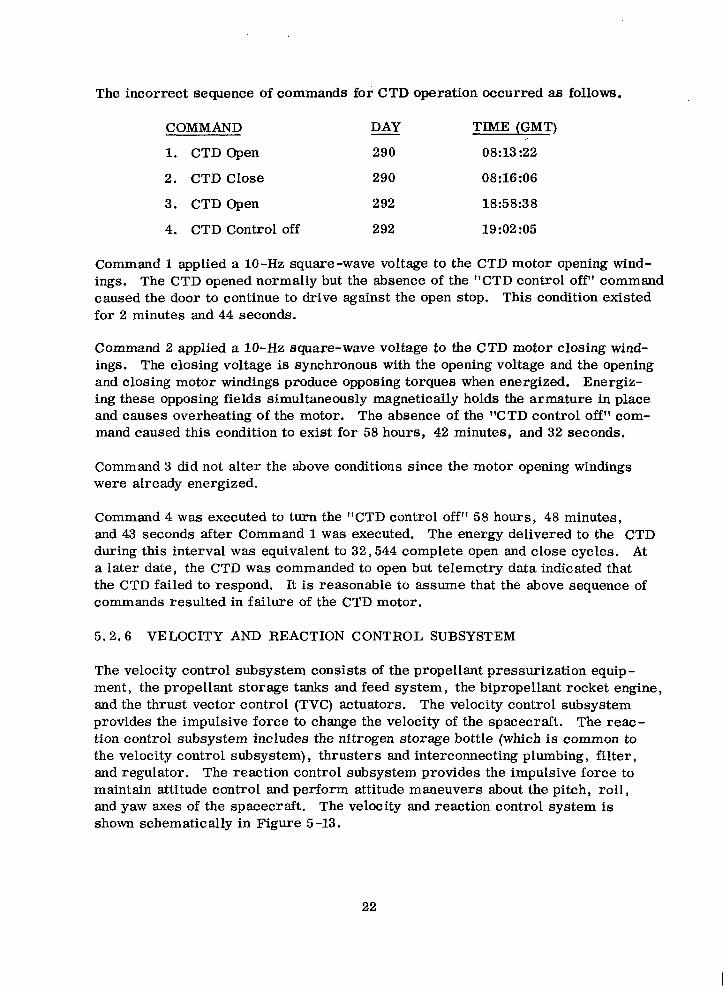
The incorrect sequence of commands for CTD operation occurred as follows.
COMMAND DAY TIME (GMT)
1. CTD Open 290 08:13 :22
2. CTD Close 290 08:16:06
3. CTD Open 292 18:58:38
4. CTD Control off 292 19:02 :05
Command 1 applied a lo-Hz square-wave voltage to the CTD motor opening wind- ings. The CTD opened normally but the absence of the “CTD control off” command caused the door to continue to drive against the open stop. This condition existed for 2 minutes and 44 seconds.
Command 2 applied a lo-Hz square-wave voltage to the CTD motor closing wind- ings. The closing voltage is synchronous with the opening voltage and the opening and closing motor windings produce opposing torques when energized. Energiz- ing these opposing fields simultaneously magnetically holds the armature in place and causes overheating of the motor. The absence of the “CTD control off” com- mand caused this condition to exist for 58 hours, 42 minutes, and 32 seconds.
Command 3 did not alter the above conditions since the motor opening windings were already energized.
Command 4 was executed to turn the “CTD control off” 58 hours, 48 minutes, and 43 seconds after Command 1 was executed. The energy delivered to the CTD during this interval was equivalent to 32,544 complete open and close cycles. At a later date, the CTD was commanded to open but telemetry data indicated that the CTD failed to respond. It is reasonable to assume that the above sequence of commands resulted in failure of the CTD motor.
5.2.6 VELOCITY AND REACTION CONTROL SUBSYSTEM
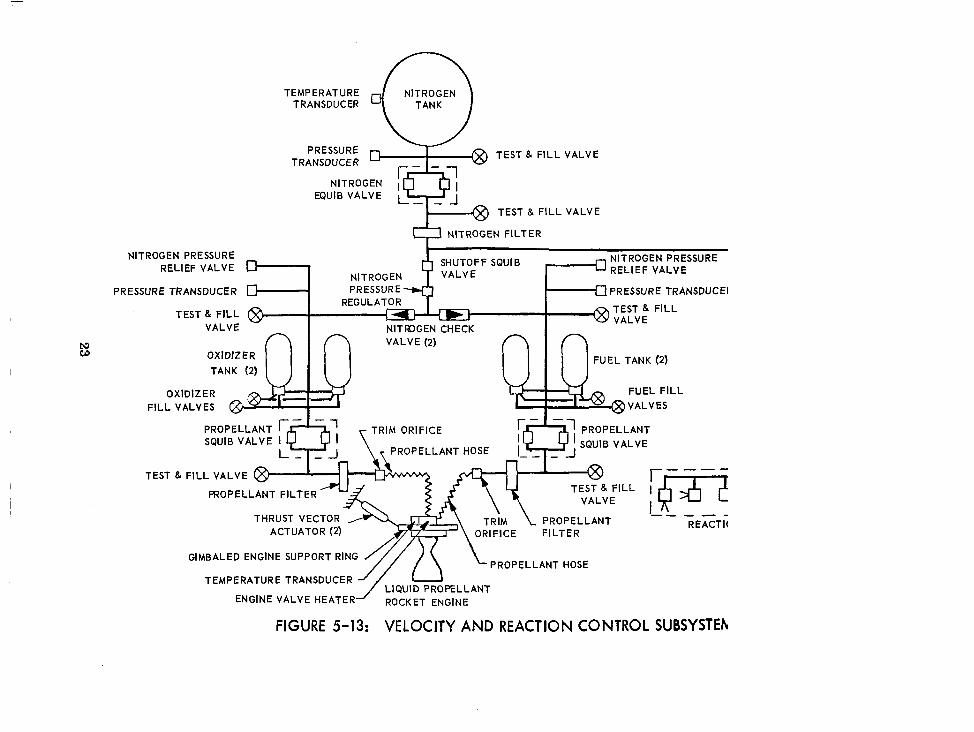
The velocity control subsystem consists of the propellant pressurization equip- ment, the propellant storage tanks and feed system, the bipropellant rocket engine, and the thrust vector control (TVC) actuators. The velocity control subsystem provides the impulsive force to change the velocity of the spacecraft. The reac- tion control subsystem includes the nitrogen storage bottle (which is common to the velocity control subsystem), thrusters and interconnecting plumbing, filter, and regulator. The reaction control subsystem provides the impulsive force to maintain attitude control and perform attitude maneuvers about the pitch, roll, and yaw axes of the spacecraft. The velocity and reaction control system is shown schematic ally in Figure 5 -13.
22
NITROGEN PRESSURE RELIEF VALVE
PRESSURE TRANSDUCER
TEST 8 FILL VALVE
TEMPERATURE TRANSDUCER
PRESSURE TRANSDUCER
NITROG EQUIB VAL
TEST 8. FILL VALVE
TEST 8. FILL VALVE
NITROGEN FILTER
PROPELLANT SQUIB VALVE 1
ROPELLANT HOSE SQUIB VALVE
TEST 8. FILL VALVE
PRESSURE TRANSDUCER
PROPELLANT
GIMBALED ENGINE SUPPORT RING PROPELLANT HOSE
TEMPERATURETRANSDUCER
ENGINE VALVE HEATER ROCKET ENGINE
FIGURE 5-13: VELOCITY AND REACTION CONTROL SUBSYSTEM
5.2.6.1 Reaction Control Subsystem Performance
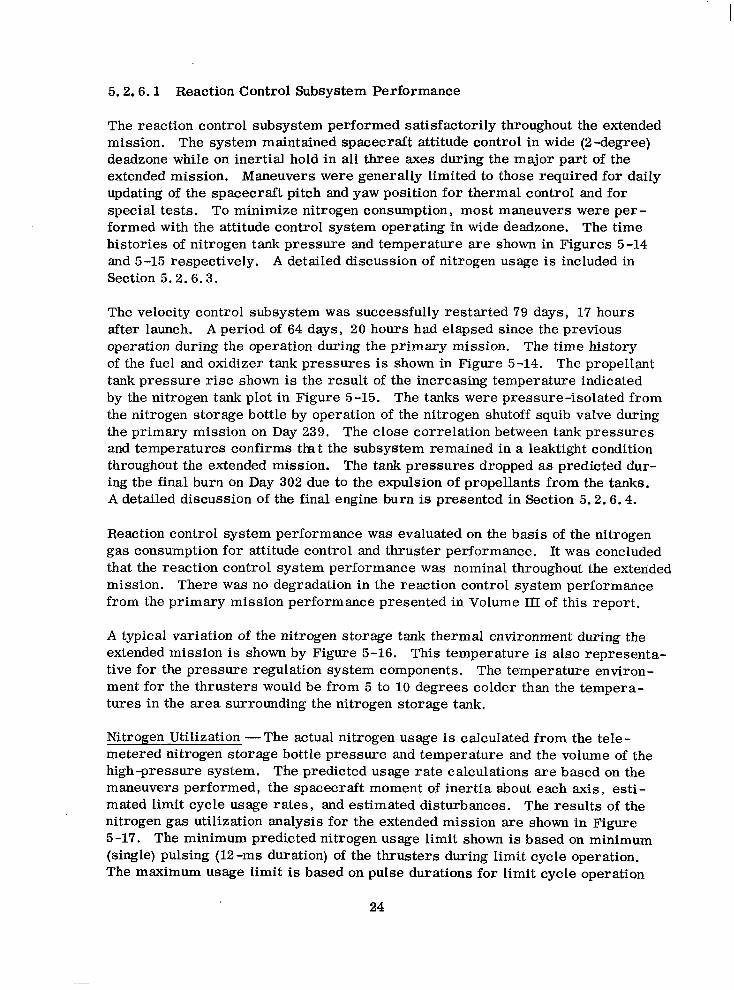
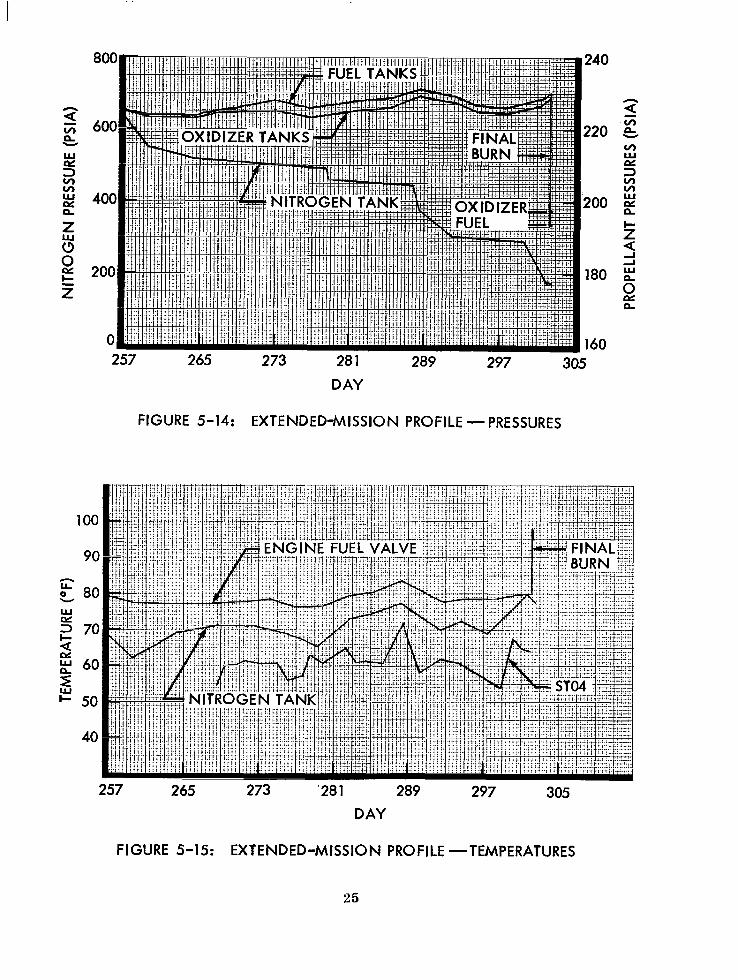
The reaction control subsystem performed satisfactorily throughout the extended mission. The system maintained spacecraft attitude control in wide (2-degree) deadzone while on inertial hold in all three axes during the major part of the extended mission. Maneuvers were generally limited to those required for daily updating of the spacecraft pitch and yaw position for thermal control and for special tests. To minimize nitrogen consumption, most maneuvers were per- formed with the attitude control system operating in wide deadzone. The time histories of nitrogen tank pressure and temperature are shown in Figures 5-14 and 5-15 respectively. A detailed discussion of nitrogen usage is included in Section 5.2.6.3.
The velocity control subsystem was successfully restarted 79 days, 17 hours after launch. A period of 64 days, 20 hours had elapsed since the previous operation during the operation during the primary mission. The time history of the fuel and oxidizer tank pressures is shown in Figure 5-14. The propellant tank pressure rise shown is the result of the increasing temperature indicated by the nitrogen tank plot in Figure 5-15. The tanks were pressure-isolated from the nitrogen storage bottle by operation of the nitrogen shutoff squib valve during the primary mission on Day 239. The close correlation between tank pressures and temperatures confirms tlat the subsystem remained in a leaktight condition throughout the extended mission. The tank pressures dropped as predicted dur- ing the final burn on Day 302 due to the expulsion of propellants from the tanks. A detailed discussion of the final engine burn is presented in Section 5.2.6.4.
Reaction control system performance was evaluated on the basis of the nitrogen gas consumption for attitude control and thruster performance. It was concluded that the reaction control system performance was nominal throughout the extended mission. There was no degradation in the reaction control system performance from the primary mission performance presented in Volume III of this report.
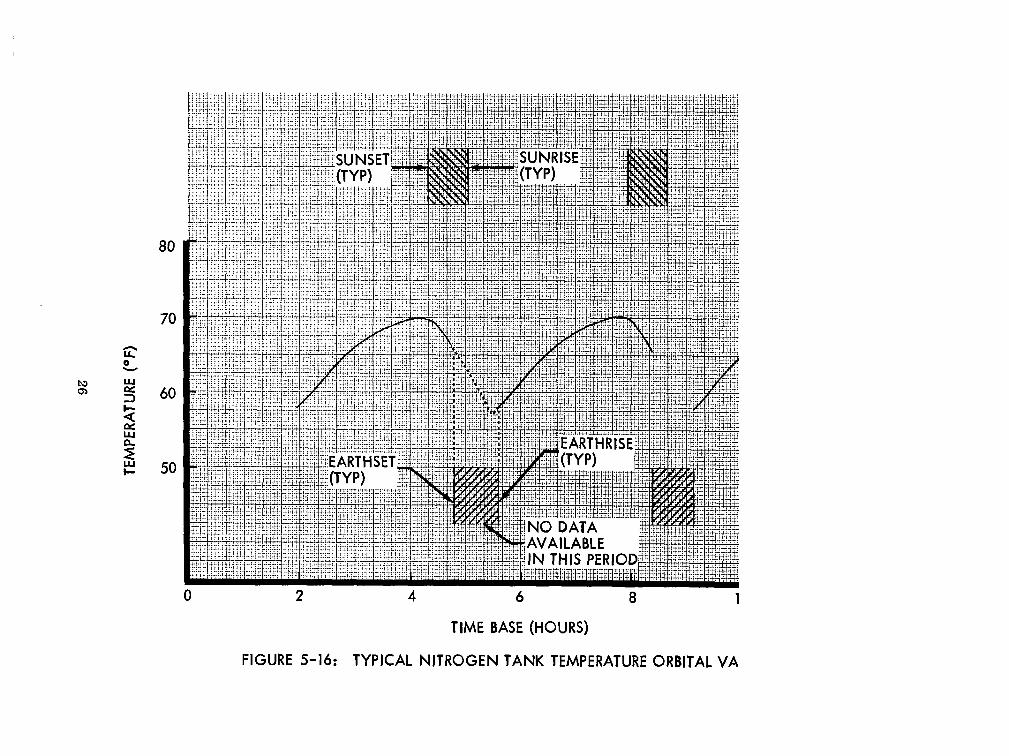
A typical variation of the nitrogen storage tank thermal environment during the extended mission is shown by Figure 5-16. This temperature is also representa- tive for the pressure regulation system components. The temperature envlron- ment for the thrusters would be from 5 to 10 degrees colder than the tempera- tures in the area surrounding the nitrogen storage tank.
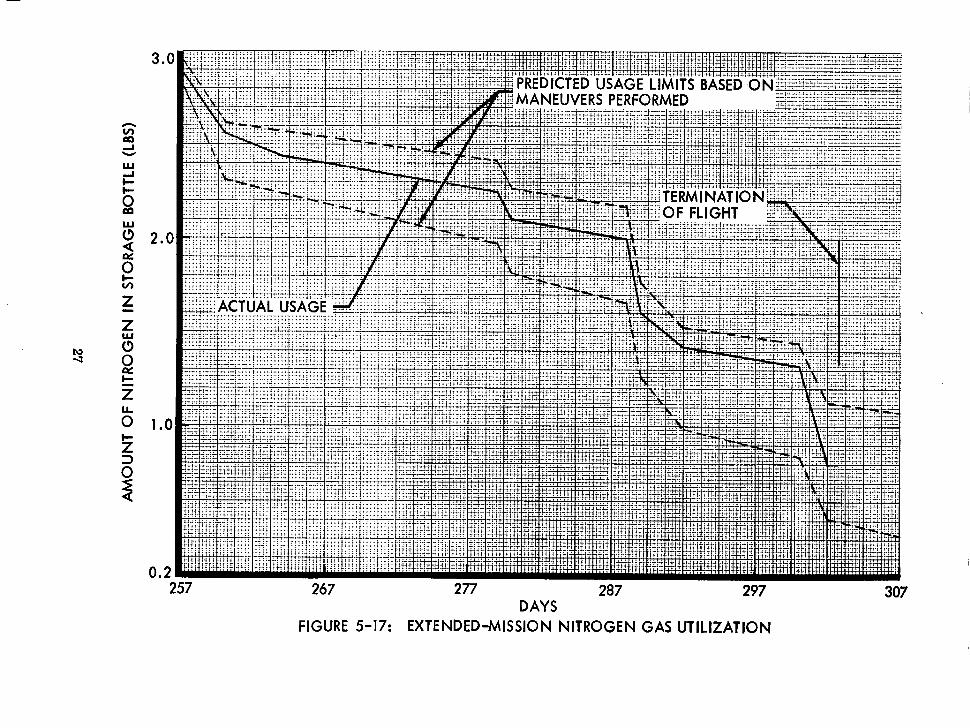
Nitrogen Utilization -The actual nitrogen usage is calculated from the tele- metered nitrogen storage bottle pressure and temperature and the volume of the high-pressure system. The predicted usage rate calculations are based on the maneuvers performed, the spacecraft moment of inertia about each axis, esti- mated limit cycle usage rates, and estimated disturbances. The results of the nitrogen gas utilization analysis for the extended mission are shown in Figure 5-17. The minimum predicted nitrogen usage limit shown is based on minimum (single) pulsing (12-ms duration) of the thrusters during limit cycle operation. The maximum usage limit is based on pulse durations for limit cycle operation
DAY
FIGURE 5-14: EXTENDED-MISSION PROFILE -PRESSURES
FIGURE S-15: EXTENDED-MISSION PROFILE -TEMPERATURES
25
80
70
60
50
TIME BASE (HOURS)
FIGURE 5-16: TYPICAL NITROGEN TANK TEMPERATURE ORBITAL VARIATION
z
0
3.0
2.0
1.0
0.2 231 267 277 287 297 307
DAYS FIGURE 5-17: EXTENDED-MISSION NITROGEN GAS UTILIZATION
that result in 0.0025 degree per second angular rates in each axis. The equiva- lent pulse duration would be 35 milliseconds in pitch and yaw and 65 milliseconds in roll. The predicted usage rates for maneuvers (including Sun and Canopus acquisitions) and disturbances are the same for the minimum and maximum limits shown.
The actual nitrogen usage falls within the predicted limits throughout the extended mission as shown by Figure 5-17. The major events that caused the higher usage rates are summarized in Table 5-2. The nitrogen used for the normal extended mission mode of operation averaged 0.013 pound per day. This usage rate was within the maximum and minimum predicted rates of 0. 018 and 0. 010 pound per day, respectively.
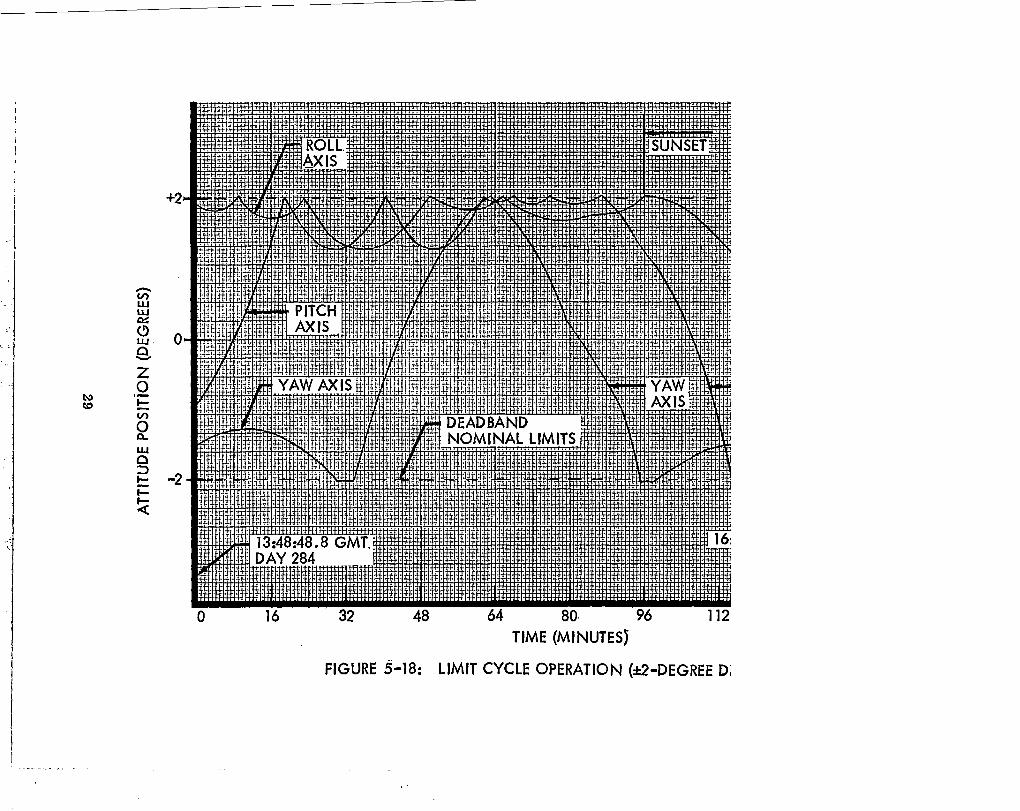
Thruster Performance -Typical variations in spacecraft attitude during the extended-mission mode of operation are shown in Figure 5-18. The effects of solar pressure disturbances are particularly noticeable on the pitch and roll axes. Gravity gradient disturbances can be seen on the pitch axis after sunset. The pulse duration to accomplish each of the attitude reversals was analyzed and found to range from 15 to 47 milliseconds in roll, 9 to 37 milliseconds in pitch, and 12 to 42 milliseconds in yaw. All the pulse durations evaluated were within the predicted limits when the disturbances were taken into account.
Table 5-2: MAJOR EVENTS USING NITROGEN GAS
Time Period (GMT Description of Events
257 to 260
260 to 279
Early postphoto mission special tests (operating in &to. 2-degree deadband)
Extended-mission mode of operation (k2. O-degree deadband inertial hold with thermal control pitch maneuvers at approximately 27-hour intervals).
279 Stanford Experiment
280 to 288 Extended-mission mode of operation
288 Programming error - 23 pitch commands transmitted to the spacecraft
289 to 292 Special V/H sensor tests
292 to 300 Extended-mission mode of operation
300 to 302 Maneuvers and special tests for Mission II training
Although thruster performance cannot be directly determined from flight data, the compatibility between predicted and actual thruster operating modes and nitrogen usage verifies that the specific impulse in flight is very close to pre- dicted values established from ground testing. The specific impulse used for predicting nitrogen usage was 68 seconds for limit cycle mode and 71 seconds for maneuvers.
28
+2
0
-2
TIME (MINUTESJ
FIGURE $18: LIMIT CYCLE OPERATION (*2=DEGREE DEADBAND)
5.2.6.2 Velocity Control Subsystem Performance
Velocity control subsystem performance was analyzed on the basis of telemetered propellant tank pressures, actuator position, and incremented velocity change. The velocity control system was operated to propellant exhaustion, with a final burn at the end of the extended mission, to modify the orbital trajectory so that the spacecraft would impact the Moon and terminate the mission. The subsys- tem performed as programmed throughout the extended mission. The total velocity change applied during flight operations indicated that the expenditure was within the predicted tolerance.
Final Velocity Maneuver - On October 29, 1966, at GMT 12:25:49.5, a velocity change maneuver was initiated to place Lunar Orbiter I on a trajectory that would impact the lunar surface. While only a minimal velocity change was required to achieve impact, the maneuver was programmed to allow the velocity control engine to operate to propellant exhaustion. Data was therefore obtained on the overall performance of the velocity control subsystem relative to total velocity change capability and expulsion efficiency, which could not otherwise have been obtained. The orbit transfer maneuver was arranged in such a manner as to be conducted at apolune with the spacecraft “locked” on the Sun reference; i. e. , no attitude maneuvers were performed. Subsequent to the initial programmed maneuver, the engine valves were reopened for 3 minutes to ascertain if any further velocity change could be achieved.
The maneuver was successfully conducted. At the time of engine ignition, a time interval of 79 days, 17 hours had elapsed since spacecraft launch, and 64 days, 20.3 hours had transpired since the previous engine operation. This is the longest known operational cycle to which a bipropellant propulsion system has been subjected in a deep-space environment.
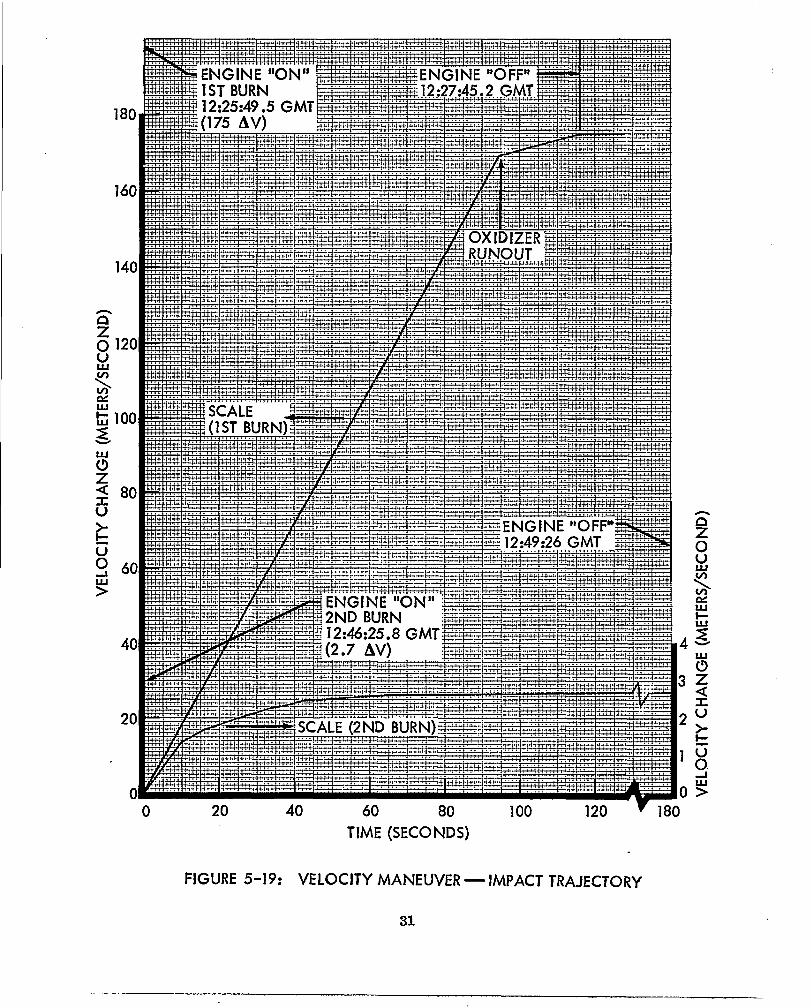
Spacecraft velocity change is plotted in Figure 5-19 as a function of the engine- on time for the two commands issued prior to impact. Observe that the velocity change incremented in a normal manner for 94 seconds during the first burn, imparting a velocity of 168. 8 mps. At that point, oxidizer runout occurred, and spacecraft acceleration was markedly reduced, the engine providing impulse due to fuel expulsion only until the engine valves were closed by command after a total “on” time of 115.7 seconds. Engine performance analysis results during the initial 94 seconds of operation are tabulated in Table 5-3.
The final 23.5 seconds of operation contributed an additional 6.4 meters per sec- ond of velocity incrementation. This impulse was provided predominantly by the expulsion and vaporization of residual fuel. There may also have been some low- level combustion with oxidizer droplets. During this phase of engine operation, the.delivered thrust is estimated to have been on the order of 15 pounds at a specific impulse of approximately 100 seconds.
30
0 20 40 60 80 100 120 v 180 TIME (SECONDS)
FIGURE 5-19: VELOCITY MANEUVER - IMPACT TRAJECTORY
31
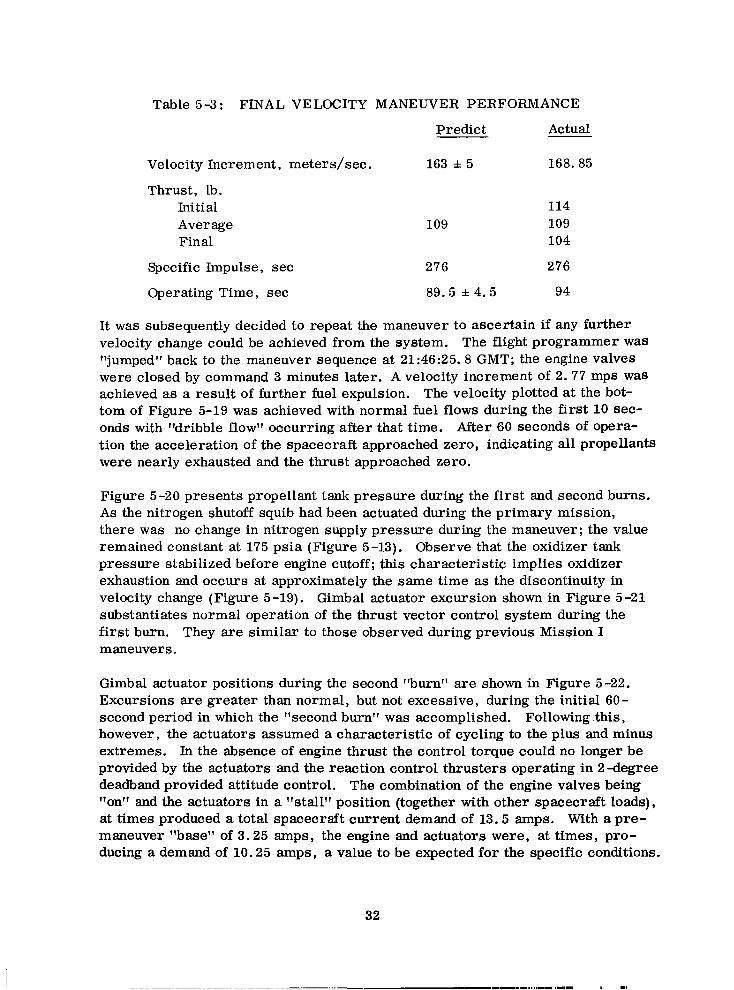
Table 5-3 : FINAL VELOCITY MANEUVER PERFORMANCE
Predict
Velocity Increment, meters/set.
Thrust, lb. Initial Aver age Final
Specific Impulse, set
Operating Time, set
163 f 5 168.85
114 109 109
104
276 276
89.5 z!c 4.5 94
It was subsequently decided to repeat the maneuver to ascertain if any further velocity change could be achieved from the system. The flight programmer was “jumped” back to the maneuver sequence at 21:46:25.8 GMT; the engine valves were closed by command 3 minutes later. A velocity increment of 2.77 mps was achieved as a result of further fuel expulsion. The velocity plotted at the bot- tom of Figure 5-19 was achieved with normal fuel flows during the first 10 sec- onds with “dribble flow” occurring after that time. After 60 seconds of opera- tion the acceleration of the spacecraft approached zero, indicating all propellants were nearly exhausted and the thrust approached zero.
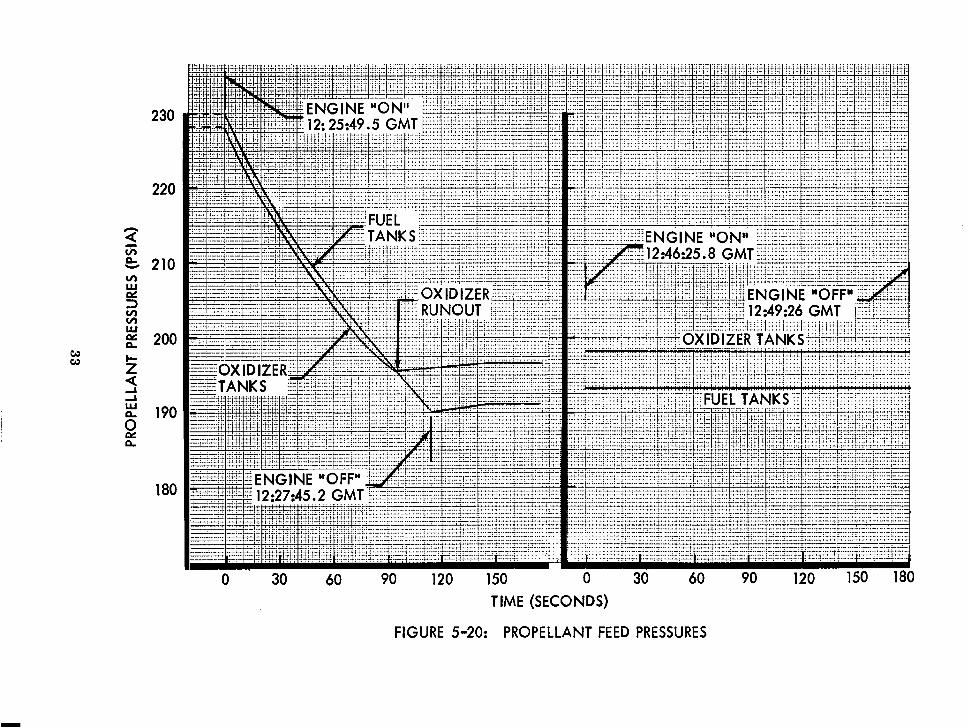
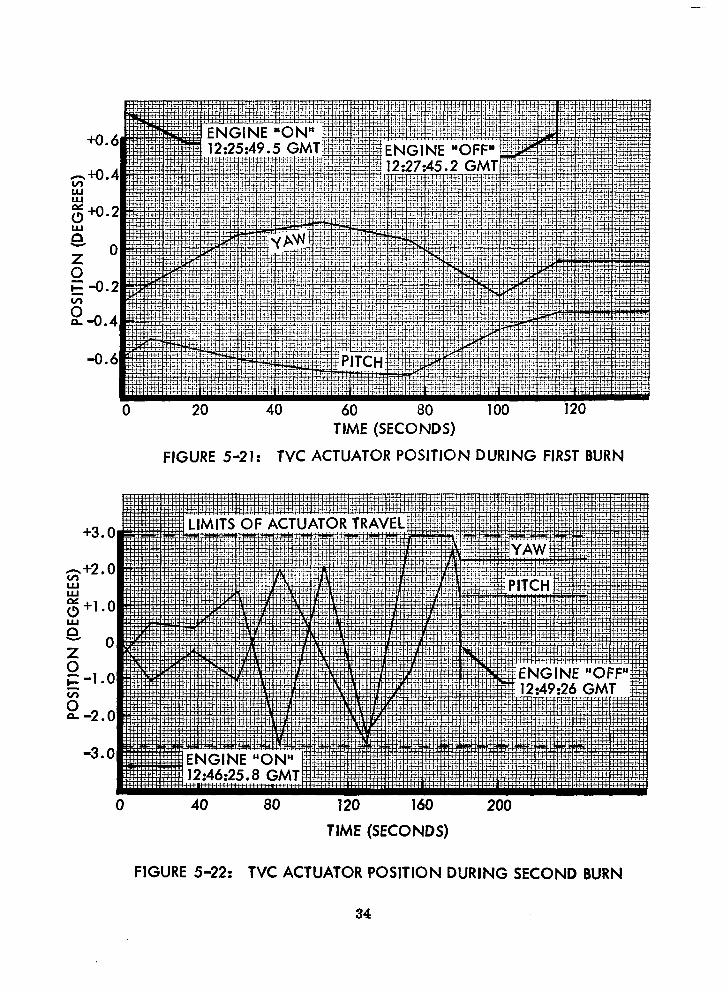
Figure 5-20 presents propellant tank pressure during the first and second burns. As the nitrogen shutoff squib had been actuated during the primary mission, there was no change in nitrogen supply pressure during the maneuver; the value remained constant at 175 psia (Figure 5-13). Observe that the oxidizer tank pressure stabilized before engine cutoff; this characteristic implies oxidizer exhaustion and occurs at approximately the same time as the discontinuity in velocity change (Figure 5-19). Gimbal actuator excursion shown in Figure 5-21 substantiates normal operation of the thrust vector control system during the first burn. They are similar to those observed during previous Mission I maneuvers.
Gimbal actuator positions during the second “burn” are shown in Figure 5-22. Excursions are greater than normal, but not excessive, during the initial 60- second period in which the “second burn” was accomplished. Following this, however, the actuators assumed a characteristic of cycling to the plus and minus extremes. In the absence of engine thrust the control torque could no longer be provided by the actuators and the reaction control thrusters operating in 2-degree deadband provided attitude control. The combination of the engine valves being “on” and the actuators in a “stall” position (together with other spacecraft loads), at times produced a total spacecraft current demand of 13.5 amps. With a pre- maneuver “base” of 3.25 amps, the engine and actuators were, at times, pro- ducing a demand of 10.25 amps, a value to be expected for the specific conditions.
32
230
220
210
200
190
180 .-.
1-1,:
30 60 90 120 150 0 30 60 90 120 150 180
:.:.;-2 .._._ i.L . ..-..-.....
TIME (SECONDS)
FIGURE 5-20: PROPELLANT FEED PRESSURES
+0.6
-0.6
TIME (SECONDS)
FIGURE 5-2 1: TVC ACTUATOR POSITION DURING FIRST BURN
s+2.0 Y g+1.0
z
5
0
r-1.0 G 0 n -2.0
-3.0
0 40 80 120 160 200
TIME (SECONDS)
FIGURE 5-22: TVC ACTUATOR POSITION DURING SECOND BURN
34
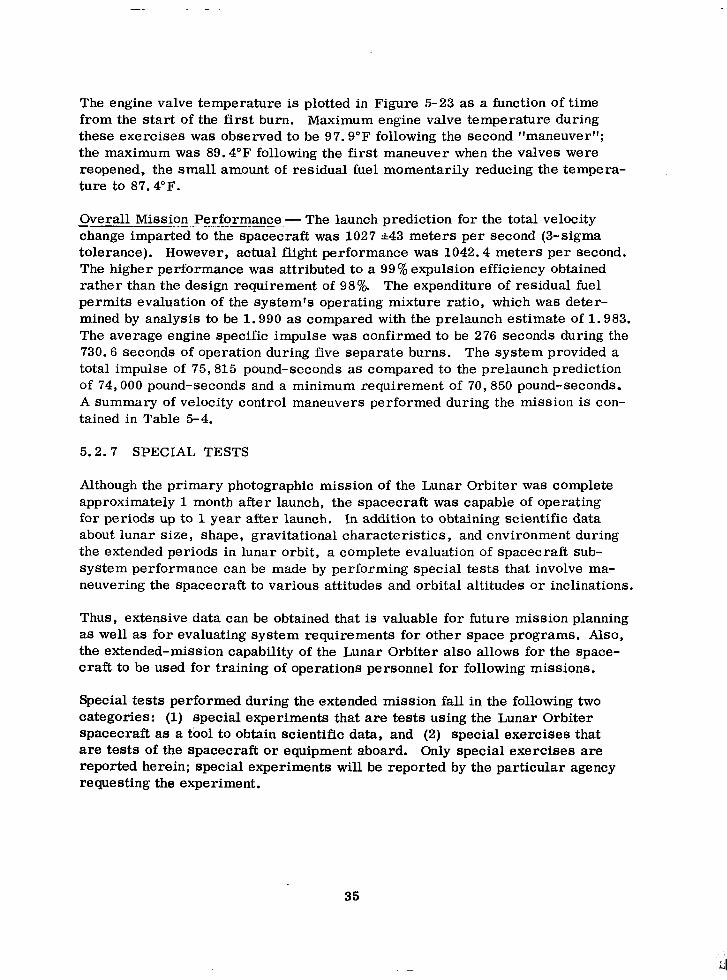
The engine valve temperature is plotted in Figure 5-23 as a function of time from the start of the first burn. Maximum engine valve temperature during these exercises was observed to be 97.9”F following the second “maneuver”; the maximum was 89.4”F following the first maneuver when the valves were reopened, the small amount of residual fuel momentarily reducing the tempera- ture to 87.4”F.
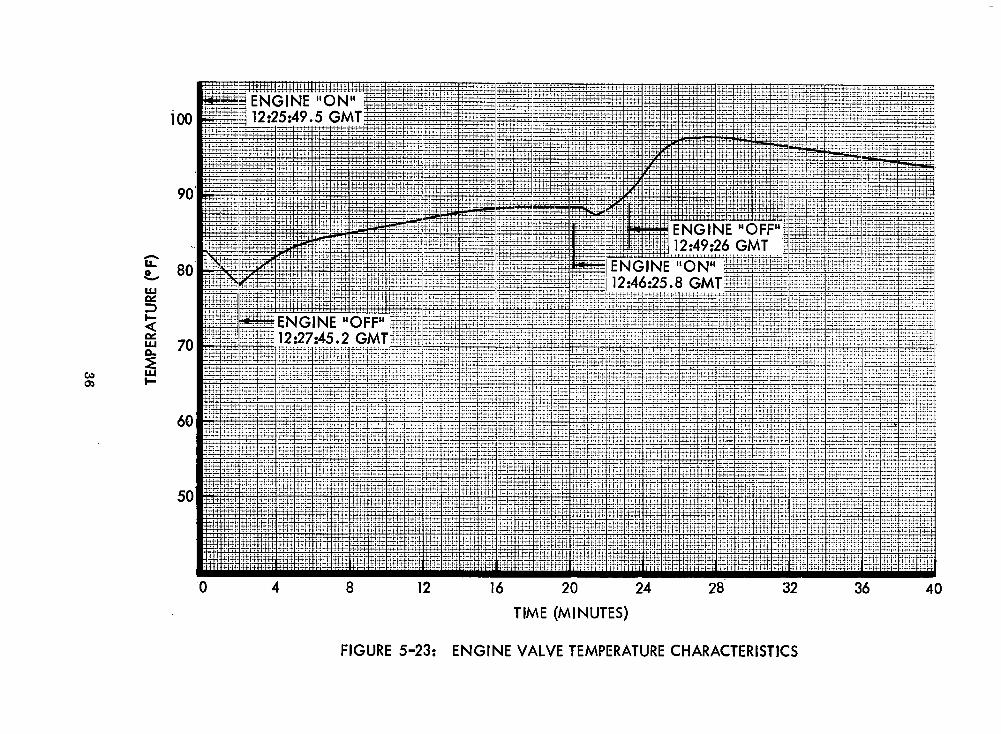
Overall Mission Performance - The launch prediction for the total velocity change imparted to the space&aft was 1027 *43 meters per second (3-sigma tolerance). However, actual flight performance was 1042.4 meters per second. The higher performance was attributed to a 99% expulsion efficiency obtained rather than the design requirement of 98% The expenditure of residual fuel permits evaluation of the system’s operating mixture ratio, which was deter- mined by analysis to be 1.990 as compared with the prelaunch estimate of 1.983. The average engine specific impulse was confirmed to be 276 seconds during the 730.6 seconds of operation during five separate burns. The system provided a total impulse of 75,815 pound-seconds as compared to the prelaunch prediction of 74,000 pound-seconds and a minimum requirement of 70,850 pound-seconds. A summary of velocity control maneuvers performed during the mission is con- tained in Table 5-4.
5.2.7 SPECIAL TESTS
Although the primary photographic mission of the Lunar Orbiter was complete approximately 1 month after launch, the spacecraft was capable of operating for periods up to 1 year after launch. In addition to obtaining scientific data about lunar size, shape, gravitational characteristics, and environment during the extended periods in lunar orbit, a complete evaluation of spacecraft sub- system performance can be made by performing special tests that involve ma- neuvering the spacecraft to various attitudes and orbital altitudes or inclinations.
Thus, extensive data can be obtained that is valuable for future mission planning as well as for evaluating system requirements for other space programs. Also, the extended-mission capability of the Lunar Orbiter also allows for the space- craft to be used for training of operations personnel for following missions.
Speoial tests performed during the extended mission fall in the following two categories: (1) special experiments that are tests using the Lunar Orbiter spacecraft as a tool to obtain scientific data, and (2) special exercises that are tests of the spacecraft or equipment aboard. Only special exercises are reported herein; special experiments will be reported by the particular agency requesting the experiment.
35
'0 4 8 12 16 20 24 28 32 36 40
TIME (MINUTES)
FIGURE 5-23: ENGINE VALVE TEMPERATURE CHARACTERISTICS
Table 5 -4: VELOCITY CONTROL MANEUVERS
Event
GMT Time Day
AV WSec)
Engine Burn Time (Set)
Est. Actual
Average Thrust Propellant (Lb) Used 1
Est. Actual [Lbs)
Launch 19: 26 222
Midcourse Burn 00: 00 224
Orbit Injection 15:44 226
Orbit Transfer 09:50 233
2nd Orbit Transfer 16: 01 237
Final Burn 12: 25 302
37.80 32.7&l 32.1 100. 101.6 11.72
790.02 588.3*10 578.7 101.5 101.3 212.18
40.20 22.7&l. 6 22.4 113.5 113.6 9.16
5.40 3*1 3.0 113.5 113.6 1.22
169.0 95.4*10 94.4 108.6 109.1 37.00 3.11 2
TOTAL 1042.4 730.6 274.39 3
1 Estimated by assuming a specific impulse of 276.
2 Fuel expelled after oxidizer was exhausted.
3 276.79 lbs. loaded on board.
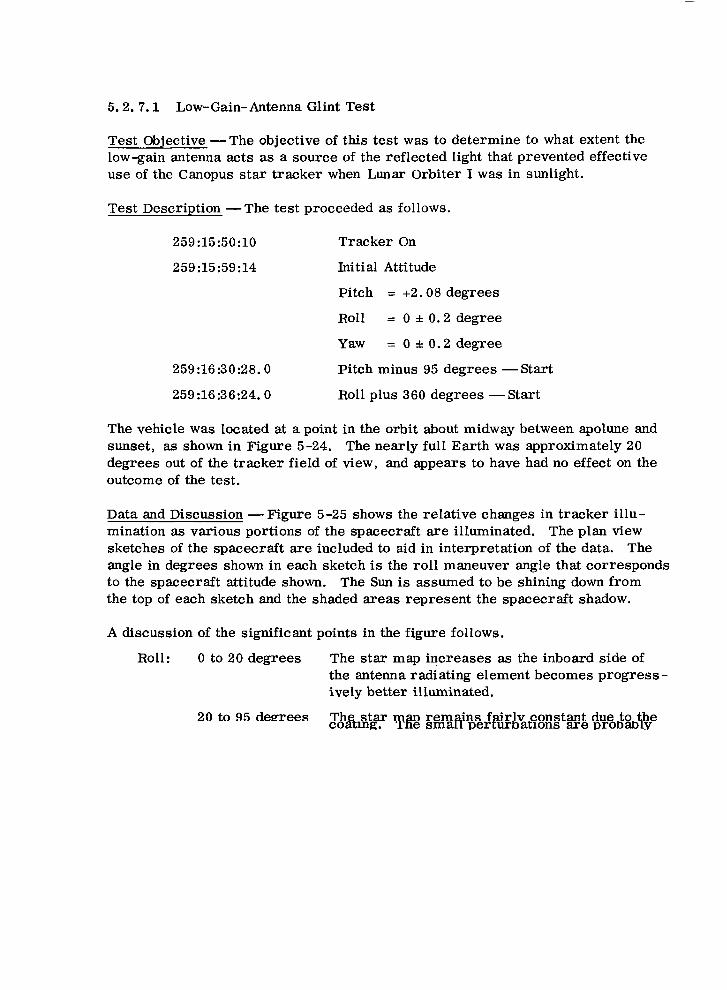
5.2. 7.1 Low-Gain-Antenna Glint Test
Test Objective -The objective of this test was to determine to what extent the low-gain antenna acts as a source of the reflected light that prevented effective use of the Canopus star tracker when Lunar Orbiter I was in sunlight.
Test Description -The test proceeded as follows.
259:15:50:10
259:15:59:14
259:16:30:28.0
259:16:36:24.0
Tracker On
Initial Attitude
Pitch = +2.08 degrees
Roll = 0 f 0.2 degree
Yaw = 0 *to.2 degree
Pitch minus 95 degrees -Start
Roll plus 360 degrees -Start
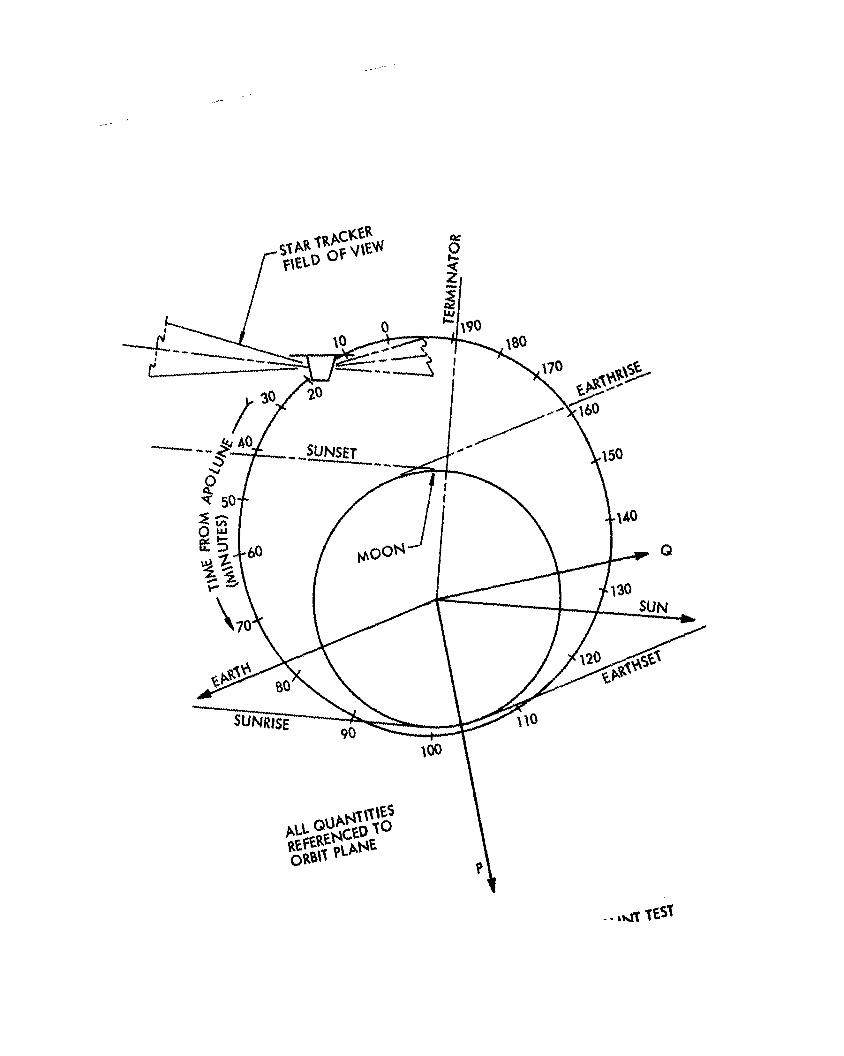
The vehicle was located at a point in the orbit about midway between apolune and sunset, as shown in Figure 5-24. The nearly full Earth was approximately 20 degrees out of the tracker field of view, and appears to have had no effect on the outcome of the test.
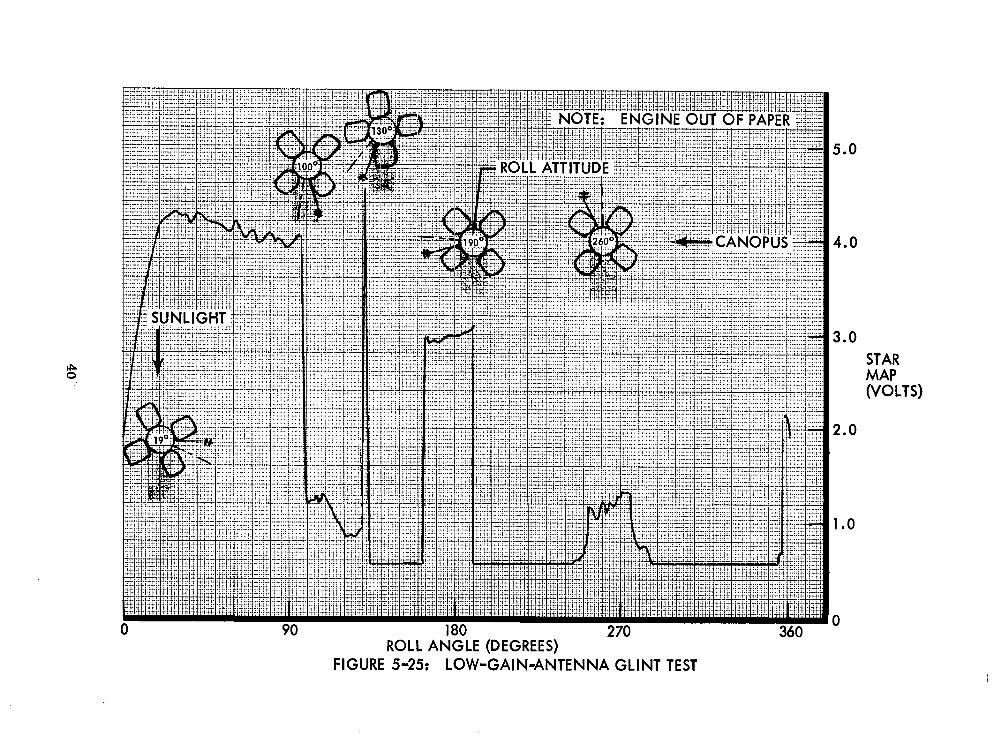
Data and Discussion -Figure 5-25 shows the relative changes in tracker illu- mination as various portions of the spacecraft are illuminated. The plan view sketches of the spacecraft are included to aid in interpretation of the data. The angle in degrees shown in each sketch is the roll maneuver angle that corresponds to the spacecraft attitude shown. The Sun is assumed to be shining down from the top of each sketch and the shaded areas represent the spacecraft shadow.
A discussion of the significant points in the figure follows.
Roll: 0 to 20 degrees The star map increases as the inboard side of the antenna radiating element becomes progress - ively better illuminated.
20 to 95 degrees The star map remains fairly constant due to the highly diffuse nature of the low-gain-antenna
5.0
4.0
ROLL ANGLE (DEGREES) -. - FIGURE 5-25: LOW-GAIN-ANTENNA GLINT TEST
3.0 STAR MAP (VOLTS)
2.0
1.0
-
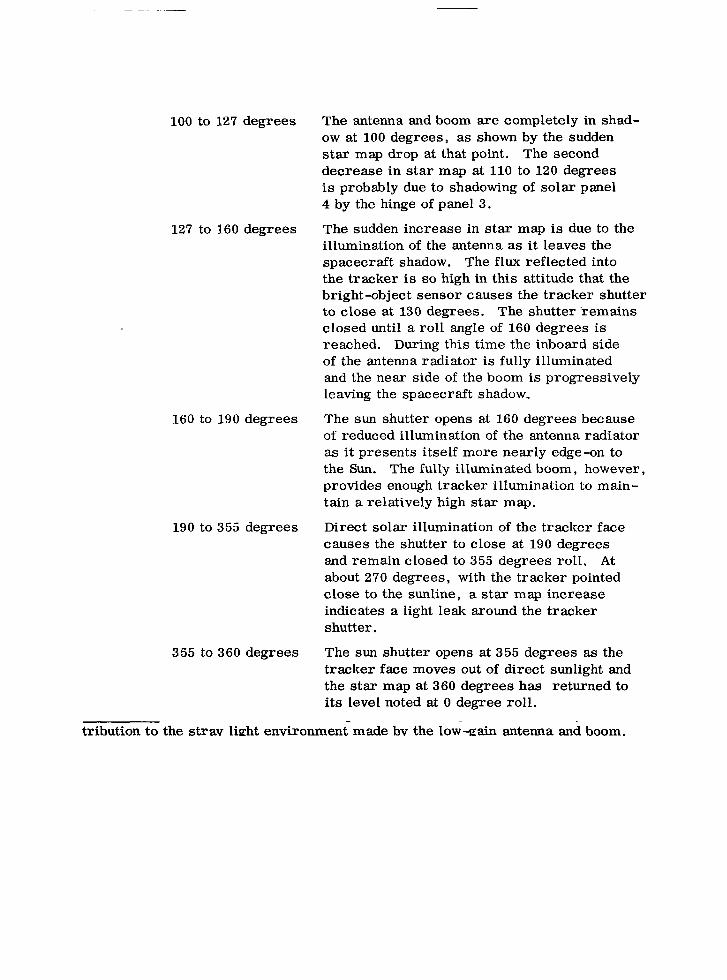
100 to 127 degrees The antenna and boom are completely in shad- ow at 100 degrees, as shown by the sudden star map drop at that point. The second decrease in star map at 110 to 120 degrees is probably due to shadowing of solar panel 4 by the hinge of panel 3.
127 to 160 degrees The sudden increase in star map is due to the illumination of the antenna as it leaves the spacecraft shadow. The flux reflected into the tracker is so high in this attitude that the bright-object sensor causes the tracker shutter to close at 130 degrees. The shutter ‘remains closed until a roll angle of 160 degrees is reached. During this time the inboard side of the antenna radiator is fully illuminated and the near side of the boom is progressively leaving the spacecraft shadow,
160 to 190 degrees The sun shutter opens at 160 degrees because of reduced illumination of the antenna radiator as it presents itself more nearly edge-on to the Sun. The fully illuminated boom, however, provides enough tracker illumination to main- tain a relatively high star map.
190 to 355 degrees Direct solar illumination of the tracker face causes the shutter to close at 190 degrees and remain closed to 355 degrees roll. At about 270 degrees, with the tracker pointed close to the sunline, a star map increase indicates a light leak around the tracker shutter.
355 to 360 degrees The sun shutter opens at 355 degrees as the tracker face moves out of direct sunlight and the star map at 360 degrees has returned to its level noted at 0 degree roll.
Conclusions -The data obtained during this maneuver points out the major con-
the antenna is not the only stray light source, the replacement of its highly reflec- tive diffuse coating by a material with much lower diffuse reflectance would mate- rially decrease the scattered light seen by the tracker.
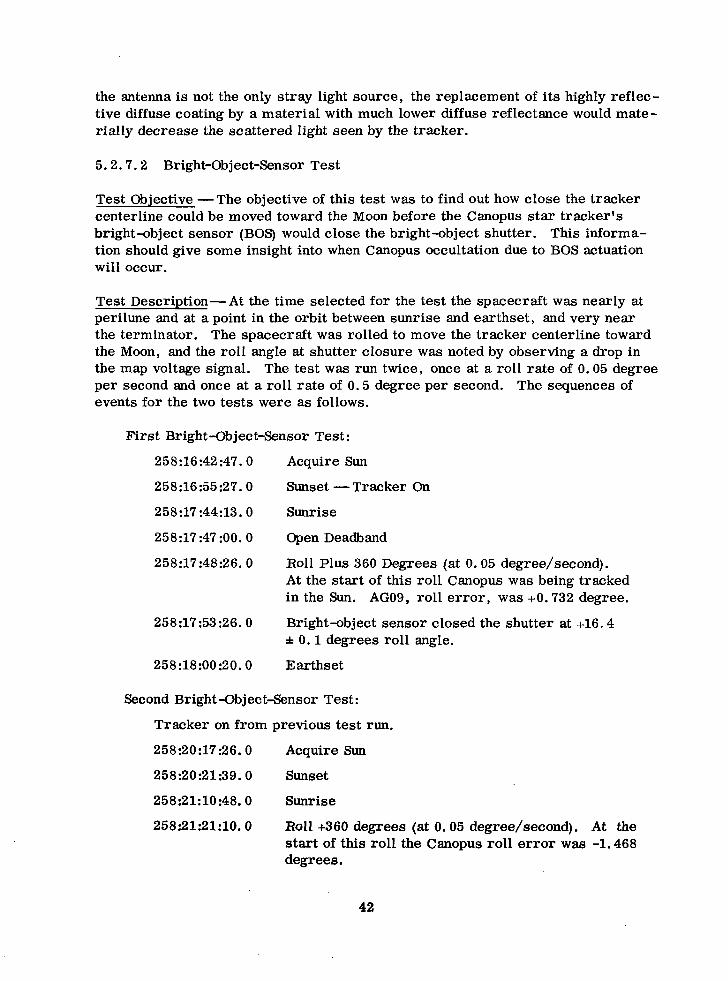
5.2.7.2 Bright-Object-Sensor Test
Test Objective -The objective of this test was to find out how close the tracker centerline could be moved toward the Moon before the Canopus star tracker’s bright-object sensor (BOS) would close the bright-object shutter. This informa- tion should give some insight into when Canopus occultation due to BOS actuation will occur.
Test Description -At the time selected for the test the spacecraft was nearly at perilune and at a point in the orbit between sunrise and earthset, and very near the terminator. The spacecraft was rolled to move the tracker centerline toward the Moon, and the roll angle at shutter closure was noted by observing a drop in the map voltage signal. The test was run twice, once at a roll rate of 0.05 degree per second and once at a roll rate of 0.5 degree per second. The sequences of events for the two tests were as follows.
First Bright-Object-Sensor Test:
258:16:42:47.0 Acquire Sun
258:16:55:27.0 Sunset -Tracker On
258:17 :44:13.0 Sunrise
258:17:47:00.0 Open Deadband
258:17:48:26. 0 Roll Plus 360 Degrees (at 0.05 degree/second). At the start of this roll Canopus was being tracked in the Sun. AG09, roll error, was +O. 732 degree.
258:17:53:26.0 Bright-object sensor closed the shutter at +16.4 f 0.1 degrees roll angle.
258:18:00:20.0 Earthset
Second Bright-Object-Sensor Test:
Tracker on from previous test run.
258:20:17:26.0 Acquire Sun
258:20:21:39.0 Sunset
258:21:10:48.0
258:21:21:10.0
Sunrise
Roll +360 degrees (at 0.05 degree/second). At the start of this roll the Canopus roll error was -1.468 degrees.
42
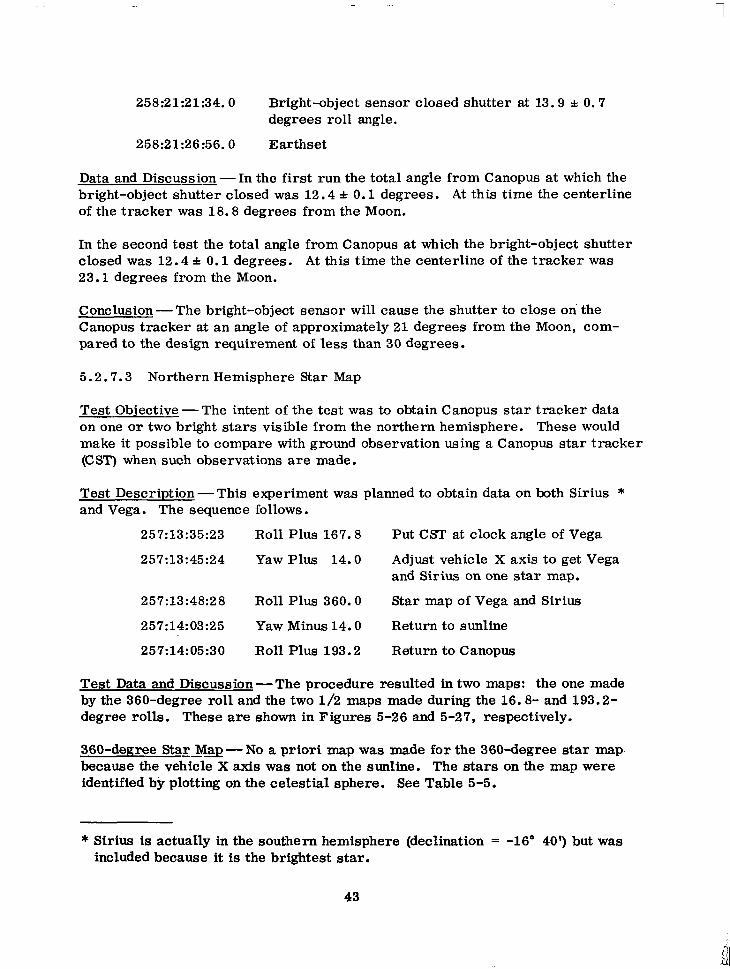
258:21:21:34.0
258:21:26:56.0
Bright-object sensor closed shutter at 13.9 & 0.7 degrees roll angle.
Earthset
Data and Discussion -In the first run the total angle from Canopus at which the bright-object shutter closed was 12.4 * 0.1 degrees. At this time the centerline of the tracker was 18.8 degrees from the Moon.
In the second test the total angle from Canopus at which the bright-object shutter closed was 12.4 i 0.1 degrees. At this time the centerline of the tracker was 23.1 degrees from the Moon.
C one lusion -The bright-object sensor will cause the shutter to close on the Canopus tracker at an angle of approximately 21 degrees from the Moon, com- pared to the design requirement of less than 30 degrees.
5.2.7.3 Northern Hemisphere Star Map
Test Objective -The intent of the test was to obtain Canopus star tracker data on one or two bright stars visible from the northern hemisphere. These would make it possible to compare with ground observation using a Canopus star tracker (CST) when such observations are made.
Test Description -This experiment was planned to obtain data on both Sirius * and Vega. The sequence follows.
257:13:35:23 Roll Plus 167.8 Put CST at clock angle of Vega
257:13:45:24 Yaw Plus 14.0 Adjust vehicle X axis to get Vega and Sirius on one star map.
257:13:48:28 Roll Plus 360.0 Star map of Vega and Sirius
257:14:03:25 Yaw Minus 14.0 Return to sunline
257:14:05:30 Roll Plus 193.2 Return to Canopus
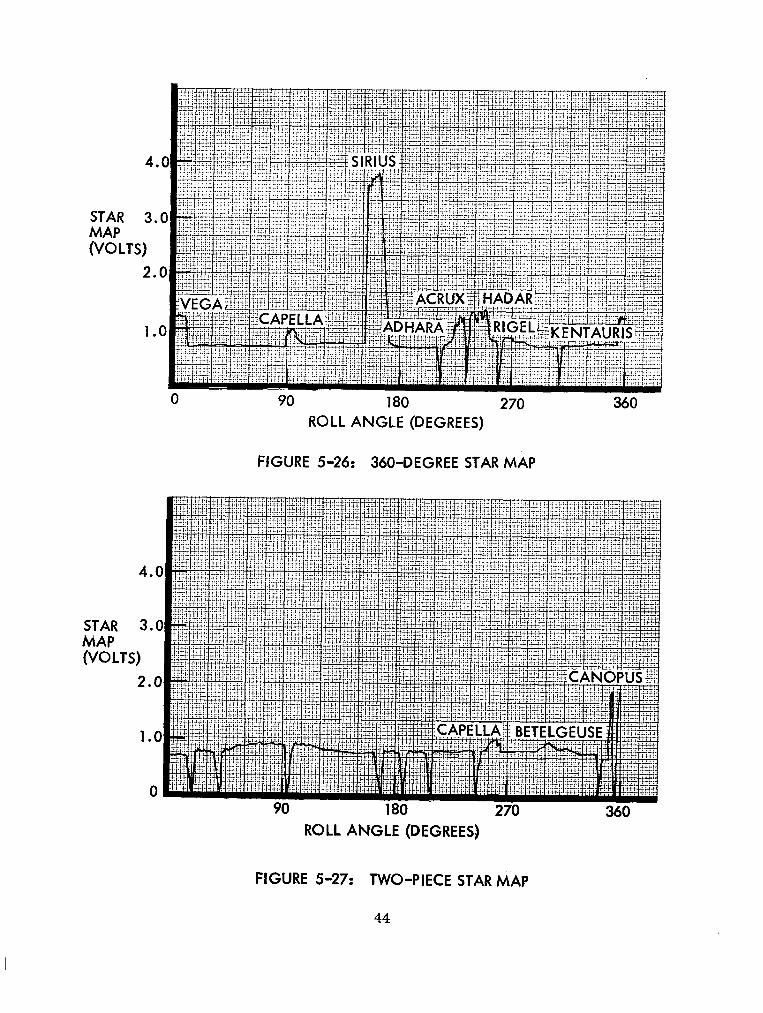
Test Data and Discussion -The procedure resulted in two maps: the one made by the 360-degree roll and the two l/2 maps made during the 16.8- and 193.2- degree rolls. These are shown in Figures 5-26 and 5-27, respectively.
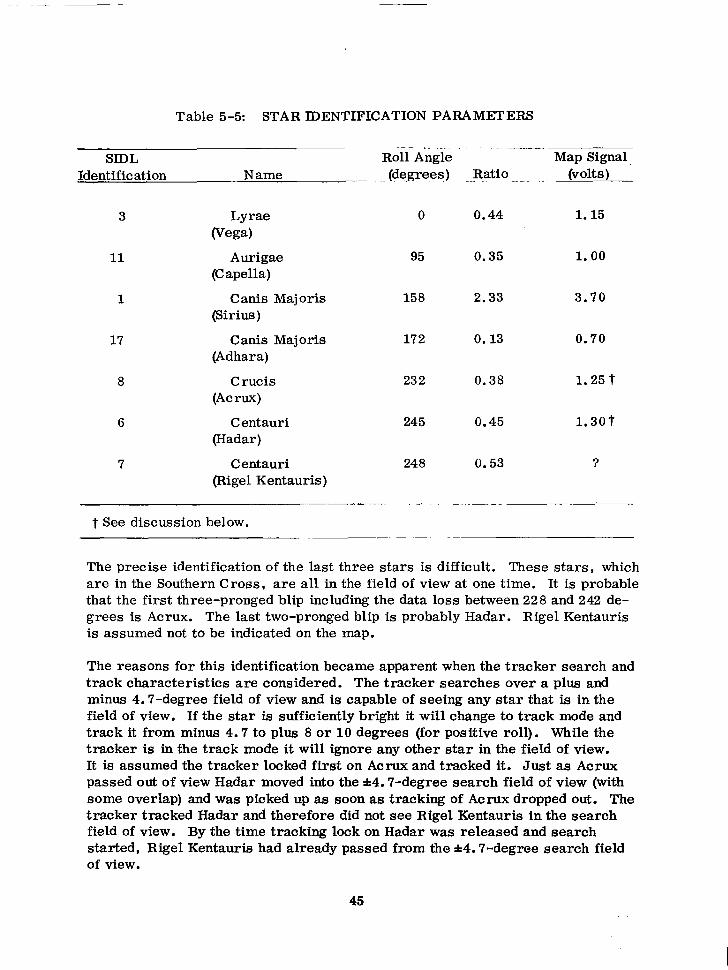
360-degree Star Map-No a priori map was made for the 360-degree star map because the vehicle X axis was not on the sunline. The stars on the map were identified by plotting on the celestial sphere. See Table 5-5.
* Sirius is actually in the southern hemisphere (declination = -16” 40’) but was included because it is the brightest star.
43
4.
STAR MAP (VOL
3,
W 2.
1.
FIGURE 5-26: 360-DEGREE STAR MAP
STAR MAP (VOL
ROLL ANGLE (DEGREES)
FIGURE 5-27: TWO-PIECE STAR MAP
44
-
Table 5-5: STAR IDENTIFICATION PARAMETERS
SIDL Identification Name
Roll Angle Map Signal --.. (de.grees) Ratio _._ _ ~_ (volts)
Lyrae (Vega)
Aurigae (Capella)
C anis Maj oris (Sirius)
Canis Majoris (Adhara)
C rucis (AC rux)
Centauri (Hadar)
Centauri (Rigel Kentauris)
0 0.44 1.15
95 0.35 1.00
158 2.33 3.70
172 0.13 0.70
232 0.38 1.25 t
245 0.45 1.30t
248 0.53 ?
t See discussion below.
The precise identification of the last three stars is difficult. These stars, which are in the Southern Cross, are all in the field of view at one time. It is probable that the first three-pronged blip including the data loss between 228 and 242 de- grees is Acrux. The last two-pronged blip is probably Hadar. Rigel Kentauris is assumed not to be indicated on the map.
The reasons for this identification became apparent when the tracker search and track characteristics are considered. The tracker searches over a plus and minus 4.7-degree field of view and is capable of seeing any star that is in the field of view. If the star is sufficiently bright it will change to track mode and track it from minus 4.7 to plus 8 or 10 degrees (for positive roll). While the tracker is in the track mode it will ignore any other star in the field of view. It is assumed the tracker locked first on Acrux and tracked it. Just as Acrux passed out of view Hadar moved into the *4.7-degree search field of view (with some overlap) and was picked up as soon as tracking of Acrux dropped out. The tracker tracked Hadar and therefore did not see Rigel Kentauris in the search field of view. By the time tracking lock on Hadar was released and search started, Rigel Kentauris had already passed from the *4.7-degree search field of view.
45
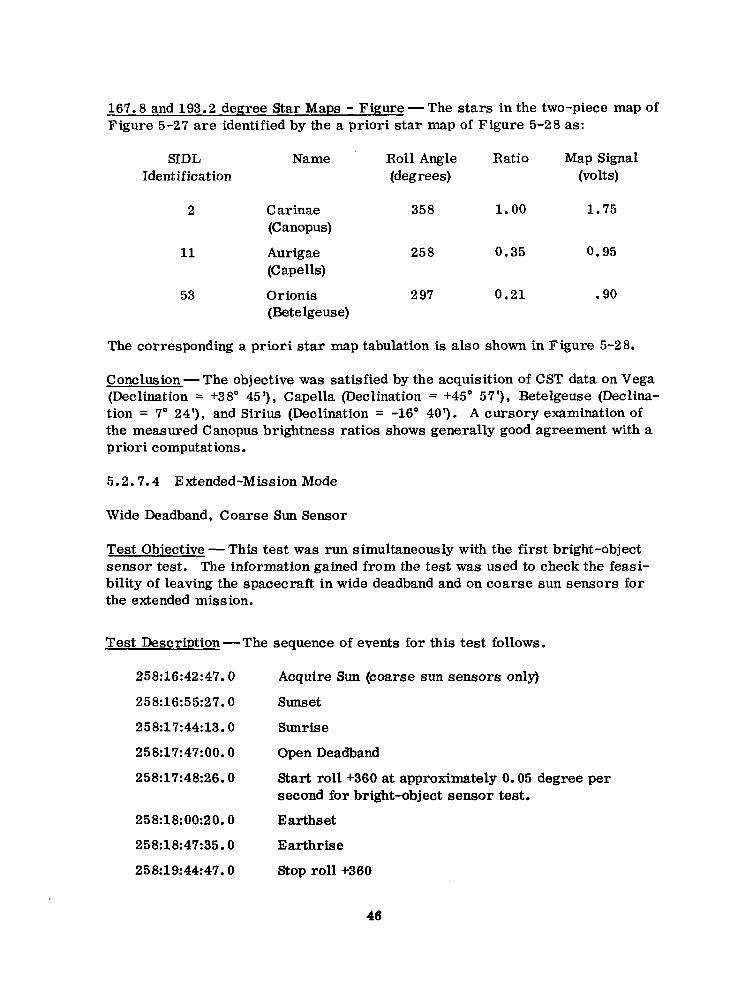
167.8 and 193.2 degree Star Maps - Figure -The stars in the two-piece map of Figure 5-27 are identified by the a priori star map of Figure 5-28 as:
SIDL Identification
Name Roll Angle (degrees)
Ratio Map Signal (volts)
2
11
53
C arinae (Canopus)
Aurigae (C apells)
Orionis (Retelgeuse)
358 1.00 1.75
258 0.35 0.95
297 0.21 .90
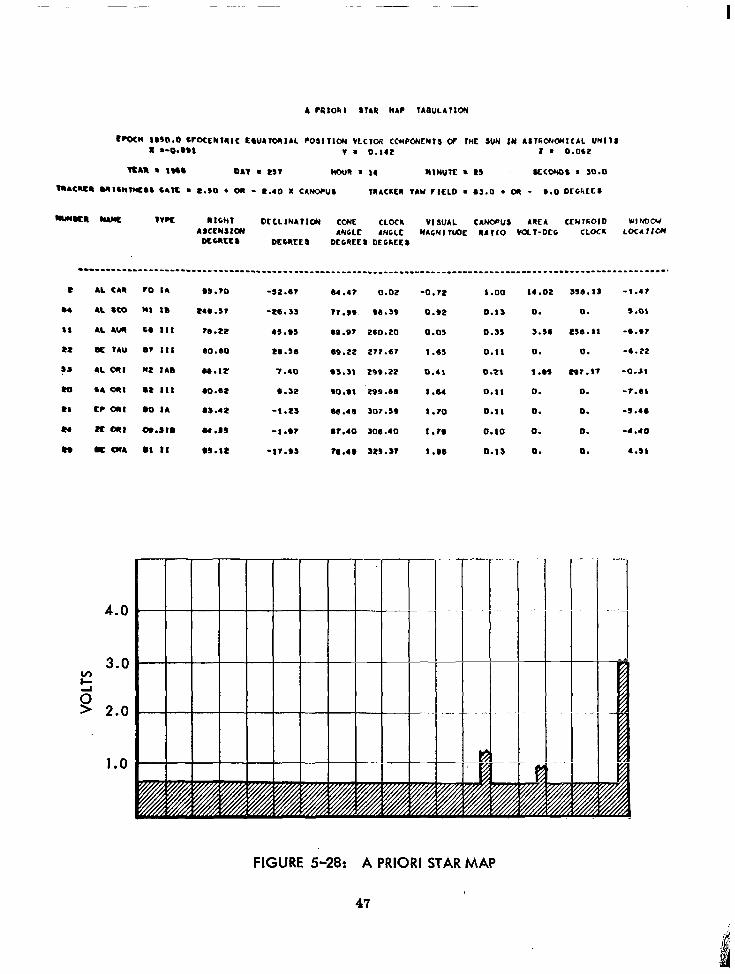
The corresponding a priori star map tabulation is also shown in Figure 5-28.
Conclusion -The objective was satisfied by the acquisition of CST data on Vega (Declination = +38” 45 ‘), Capella (Declination = +45’ 57’), Retelgeuse (Declina- tion = 7” 24’), and Sirius (Declination = -16” 40’). A cursory examination of the measured Canopus brightness ratios shows generally good agreement with a priori computations.
5.2.7.4 Extended-Mission Mode
Wide Deadband, Coarse Sun Sensor
Test Objective -This test was run simultaneously with the first bright-object sensor test. The information gained from the test was used to check the feasi- bility of leaving the spacecraft in wide deadband and on coarse sun sensors for the extended mission.
Test Description- The sequence of events for this test follows.
258:16:42:47.0
258:16:55:27.0
258:17:44:13.0
258:17:47:00.0
258:17:48:26.0
258:18:00:20.0
258:18:47:35.0
258:19:44:47.0
Acquire Sun (coarse sun sensors only)
Sunset
Sunrise
Open Deadband
Start roll +360 at approximately 0.05 degree per second for bright-object sensor test.
E arthset
Earthrise
Stop roll +360
46
I
4 mlolcl 8741 HAP 14euL4lIow
r%‘l 1UQ.O l ~~CNII(IC tW41ORlAL l OSlllW WC106 CCYPONENIS W IWE SUN IN ALT4’3tWlCAL WI14 8 m-0.*,1 v m 0.14t t a 0.062
vtm 6 lW6 041 . L5? Noun a I4 NINUK 8 I5 IrCwo8 . 10.0
**a*cn Ml6rnvuE66 64K . e.50 . 06 - l .,0 x c4wy. 1RACRLR TAY ~ICLD . 43.0 l o(I - a.0 DCC4EC4
*uun IlAW lwt Rlbhf DCCLINATIOI COIlE CLOCR VI SUIL CANWUS AlEA QUTEOID WIM)Cd ASCPNSlCII ANGLE ANCLC NACNlf(lOE 14110 VOLI-occ CLOCU LOCl lltw
Dccntc8 Dtcntt8 DfCRLLI OtCELcs
--------------------------------------------------------------------------------------------------------------.
AL cm co I4 U.?O -52.6? 64.A? 0.02 -0.72 1.00 14.02
4L 8co Ml I8 l 46.57 -m.aa 17.99 *a .a9 0.92 Q.13 0.
AL Aun co Ill I6.M 45.s5 69.97 260.20 0.05 0.55 5.56
u TAU 07 Ill 60.00 20.5a OS.22 217.6? 1.65 0.11 0.
4L a1 NZ IA6 66.1+ 7.40 65.51 299.22 0.41 0.21 1.69
CA a1 l Z Ill 0O.W 6.32 -0.81 ‘299.66 1.64 0.11 0.
CC aI l O IA 65.42 -1.25 66.46 ao7.5) 1.70 0.11 0.
zc al oI.5lB 64.55 -1 .w 61.40 JO6.40 l.T6 0.10 0.
It cm4 l l II l 5.12 -II.,5 78.4, 525. a? 1.06 0.13 0.
4.0
3.0 2 0’ > 2.0
1.0
556.15
0.
L56. I1
0.
co7 .I7
0.
0.
0.
0.
-1.4?
5.01
-6.97
-6.22
-O-J8
-7.61
-5.46
-4.40
a.51
FIGURE 5-28: A PRIORI STAR MAP
47
258:19:50:10.0 Close deadband and pitch minus 40 degrees.
258:20:21:39.0 Sunset
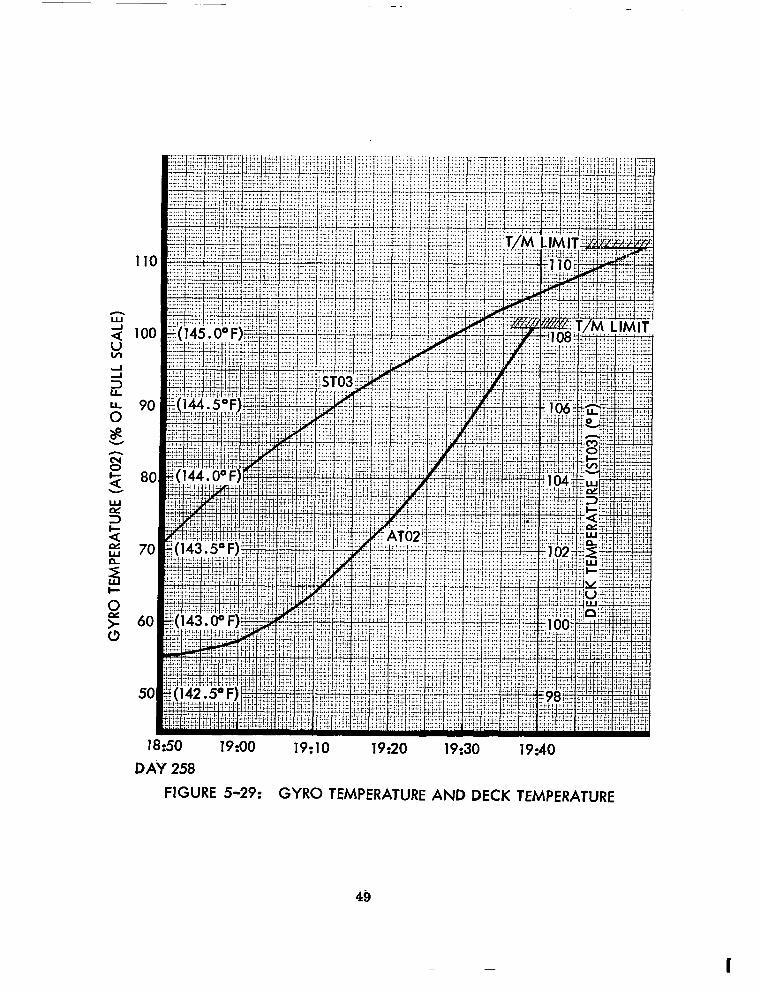
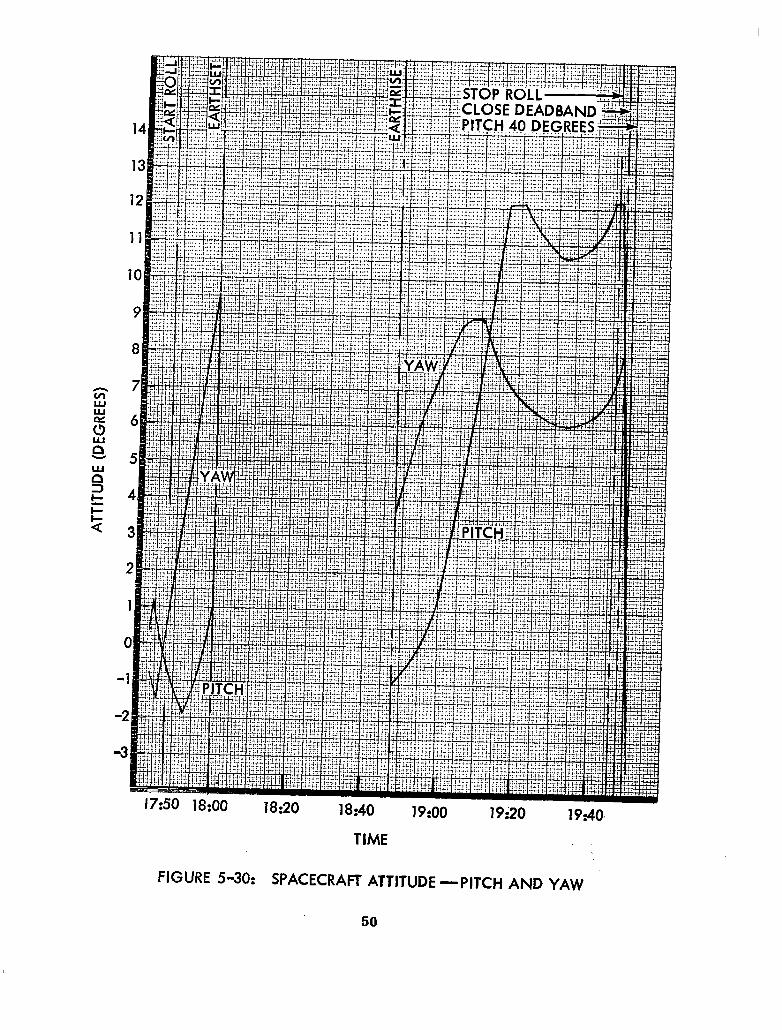
Test Data and Discussion-Figure 5-29 shows AT02, Gyro Temperature, and ST03, Equipment Mount Deck Temperature, variations as functions of time between earthrise and pitch off. ST03 reached a peak value of 110°F (based on extrapolated temperature calibration) a full 30 minutes before sunset. Figure 5-30 shows the spacecraft attitude in pitch and yaw for the same period of time based upon the coarse sun sensor readings.
From this data it is clear that the deck temperature was excessive just prior to pitch off even though both pitch and yaw attitudes were near the edge of the 12- degree deadband. In all probability thermal control of the gyro package was lost as indicated by the slope of 0.8-degree gyro temperature per degree of deck temperature.
Conclusions -The mode of control for the extended mission must not be to lock on to the Sun in wide deadband with the coarse sun sensors. Serious overheating would result.
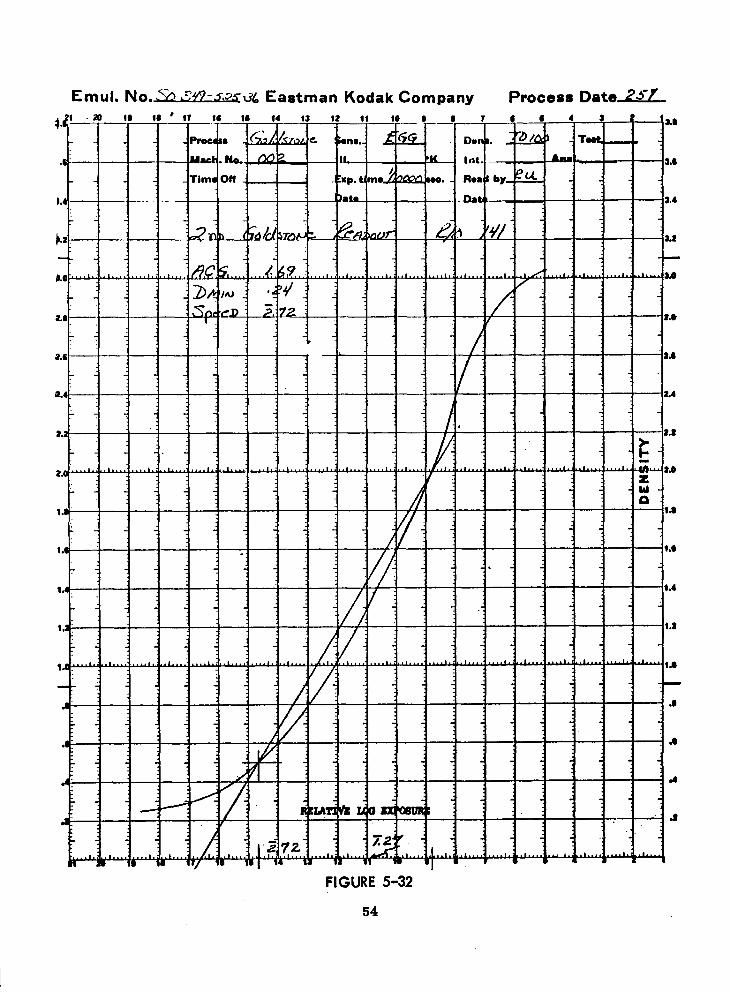
5.2.7.5 Second Goldstone Test Film Readout
Test Objectives - A second readout (141) of the Goldstone test target was per- formed at the end of primary mission for comparison with readout (001) of the same photos early in initial orbit. The purpose was to determine what degrada- tion had occurred to the photo-video chain (PVC) during the primary mission. The second readout was normalized to the first to eliminate film processing and ground reconstruction electronics (GRE) exposure calibration variations.
Test Procedure -To determine the exact gain setting during the second readout (141), a series of gain commands were sent to the spacecraft. After two com- mands were executed, the readout electronics reset to the first step at a white level of 2.5 volts. Thirteen more gain commands were required for a white level of 5.0 volts in focus stop as viewed on the GRE monitor oscilliscope. Readout commenced at 257:19:16:39.
Data and Discussion -To determine the.degradation that occurred during the primary mission, the data from the last readout was normalized to the data from the first. This procedure minimized variations due to GRE film processing and exposure calibrations.
Table 5-6 is a summary of the data as collected for readouts 001 and 141. It contains the sensitometric data from the film process, tribar resolution from the edge data and the tribar charts in the target, edge data densities, and the focus and gain settings for the readout.
48
I
1750 18:OO i8:20 18:40 19:oo l9i20 19:40.
TIME
FIGURE 5-30: SPACECRAFT ATTITUDE -PITCH AND YAW
50
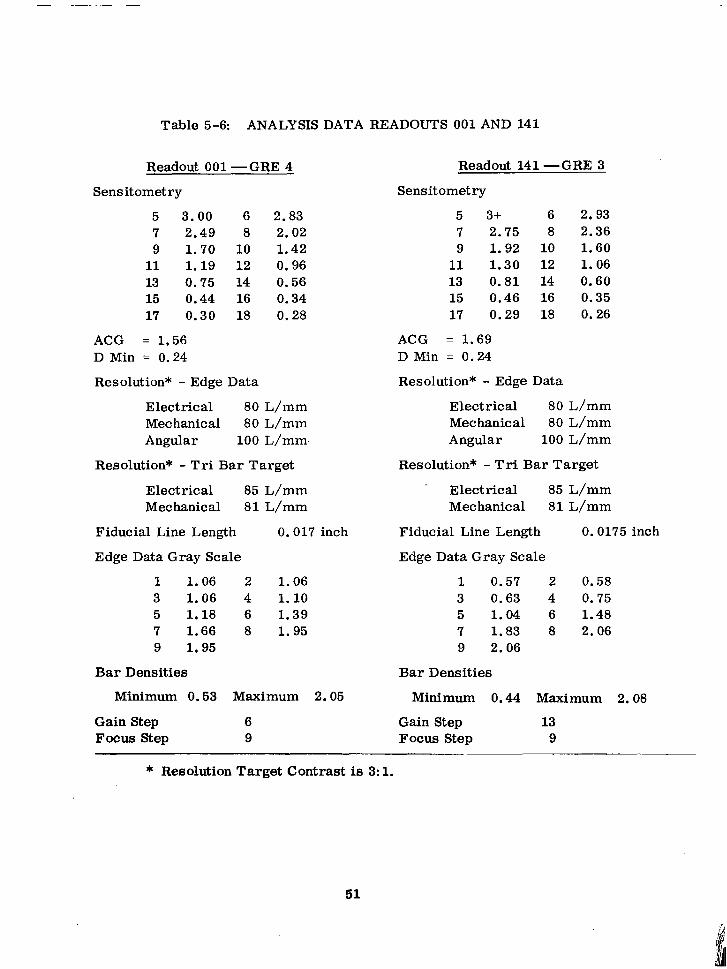
Table 5-6: ANALYSIS DATA READOUTS 001 AND 141
Readout 001 -GRE 4 Readout 141 -GRE 3
Sensitometry
5 3.00 6 2.83 7 2.49 8 2.02 9 1.70 10 1.42
11 1.19 12 0.96 13 0.75 14 0.56 15 0.44 16 0.34 17 0.30 18 0.28
ACG = 1.56 D Min = 0.24
Resolution* - Edge Data
Electrical 80 L/mm Met hanical 80 L/mm Angular 100 L/mm.
Resolution* - Tri Bar Target
Electrical 85 L/mm Mechanical 81 L/mm
Fiducial Line Length 0.017 inch
Edge Data Gray Scale
1 1.06 2 1.06 3 1.06 4 1.10 5 1.18 6 1.39 7 1.66 8 1.95 9 1.95
Bar Densities
Minimum 0.53 Maximum 2.05
Sensitometry
5 3+ 6 2.93 7 2.75 8 2.36 9 1.92 10 1.60
11 1.30 12 1.06 13 0.81 14 0.60 15 0.46 16 0.35 17 0.29 18 0.26
ACG = 1.69 D Min = 0.24
Resolution* - Edge Data
Electrical 80 L/mm Met hanic al 80 L/mm Angular 100 L/mm
Resolution* - Tri Bar Target
Electrical 85 L/mm Met hanical 81 L/mm
Fiducial Line Length 0.0175 inch
Edge Data Gray Scale
1 0.57 2 0.58 3 0.63 4 0.75 5 1.04 6 1.48 7 1.83 8 2.06 9 2.06
Bar Densities
Gain Step 6 Focus Step 9
Minimum 0.44 Maximum 2.08
Gain Step 13 Focus Step 9
* Resolution Target Contrast is 3: 1.
51
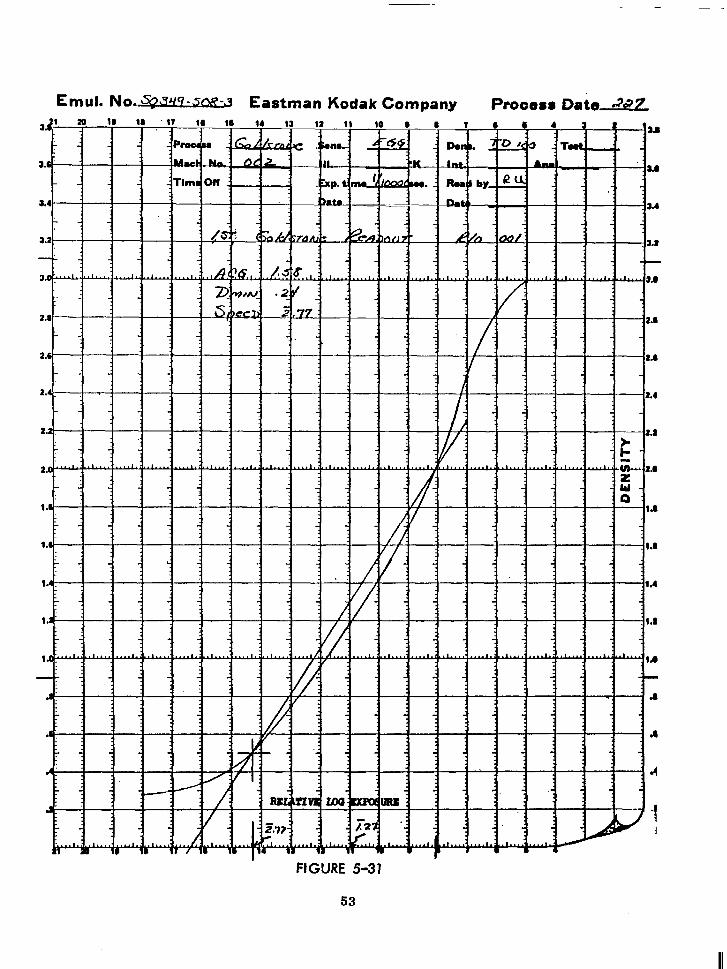
To eliminate processing variation, the sensitometric processing curves were drawn for each readout (Figures 5-31 and 5-32). The edge data step wedge densities for the last readout were located on the curve for that process and their associated log exposure values found. The same log exposure values were located on the sensitometric curve for the first readout process. The densities corres- ponding to these values were read off that curve. This set of densities then represents what the edge data densities would have looked like had there been no differences between the two readouts due to the GRE film processing.
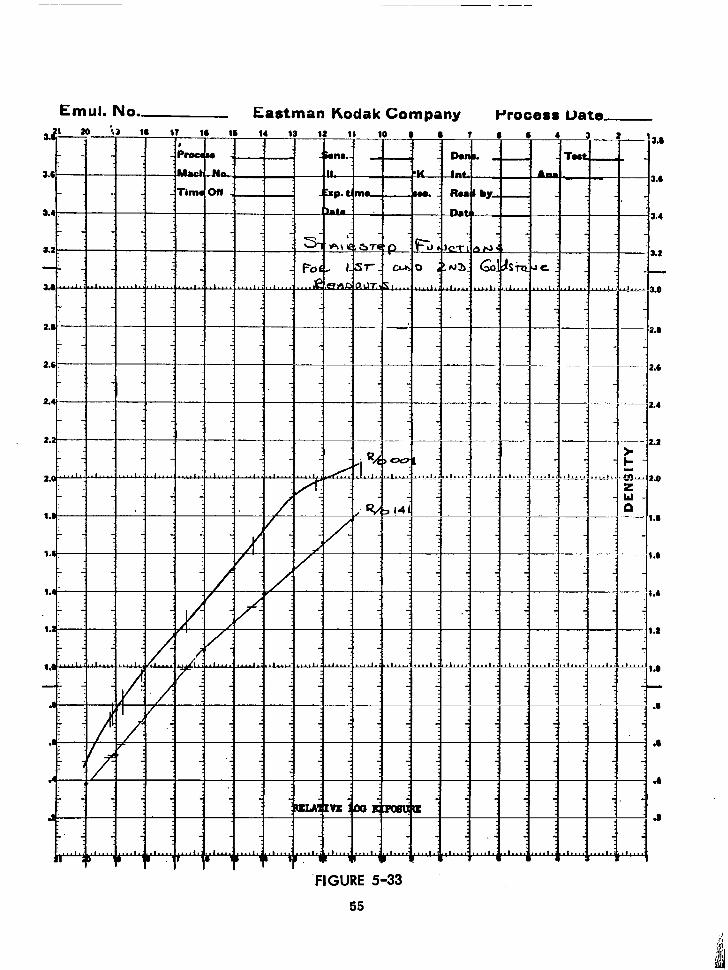
The other variable to be removed was the variations due to the GRE’ exposure calibrations. This was performed using the stairstep function in the test signal signature.
The curves for the two stairstep functions were drawn (Figure 5-33). The same procedure was used in this step that was used to eliminate processing variations. The resulting set of edge data densities shows the variation due to degradation of the PVC. The values are included in Table 5-6 for each step of the normali- zation procedure.
A third variable, which was not operating in the last readout, was present during the first readout. This effect, commonly called “halo, ” is a characteristic of many of the kinescope tubes presently in use in the GRE ‘s. It could not be re- moved from the first set of edge data densities as no accurate description of the effect exists. A detailed description of halo can be found in the mission opera- tions report for DSS-12, No. 2-1565-00-178.
Conclusions
The halo problem affecting the densities from the first readout (001) makes it difficult to make valid comparisons between the two readouts. Additional other unaccountable factors are influencing the data and make absolute com- parison difficult. These are primarily in the area of data collection tech- nique.
No focus adjustments were required for the entire mission. Resolution values remained constant.
There was considerable degradation in the PVC regarding light output, as can be seen by the two different gain settings required to produce 5.0 volts in the focus stop position. This could be due to aging of the line scan tube anode or to degradation of the electronics associated with the photo multi- plier.
There was no apparent change in the rotational velocity of the line scan tube anode. Fiducial line measurements show no differences between readouts 001 and 141.
52
Emui. NO. \sbt7q9-Sm-3 Eastman Kodak Company Process Date2
J.8
, L
1.8
2.4.
2.
2. ~
FIGURE 5-31
Emul. No. .% ~TJ/r-~~<ti6 Eastman Kodak Company Process Date=
2.
2. .iI.Ld
I
1.
1.
L L-l 2.0
z
FIGURE 5-32
Emul. No. Eastman Kodak Company Process Date
Y 1. -I 1 a.2
.FlGURE 5-33
55
5.2. ‘7.6 Investigations Related to Cyclic Doppler Residuals Near Perilune
Test Obiective - The FPAC orbit determination program results indicated un- expectedly large doppler residuals near perilune in the low-altitude perilune portions of Lunar Orbiter I prime mission. Tests 19, 24, and 25 were performed to determine if these cyclic doppler residuals resulted from rf power reflections from the lunar surface.
Test Description - Test 19 consisted of reducing the DSIF transmitted power by 3 db to reduce up-link signal reflections from the lunar surface.
Test 24 consisted of orienting the spacecraft such that the major null was pointed toward the lunar surface to minimize both up- and down-link reflections received by spacecraft.
Test 25 consisted of performing two-way doppler tracking using the high-gain antenna. Since the high-gain antenna has a lo-degree beam width, down-link reflections from the lunar surface should be minimal.
Tests 19 and 24 were performed on Orbit 184, Test 25 was performed on Orbit 185, and Orbits 182 and 183 were used as reference data to determine the effects of the experimental parameter changes.
Test Results -Residual plots from the orbit determination program show that the cyclic doppler residuals were present for Orbits 184 and 185 and, except for some skewing of the .plot for Orbit 184, they were nearly identical to the plots obtained from Orbits 182 and 183.
C onclus ions - From these tests it has been concluded that lunar reflection of rf power is not the cause of the cyclic doppler residuals.
5.2.7.7 Downlink Modulation Index Test
Test Objective -The ground-received signal strength was observed to change significantly (1Odb) with no changes in telemetered rf power indications. It is the objective of this test to determine if the signal level change results from a change in modulation index.
Test Description - The modulation index test was set up to compare data on sidebands and carrier power for normal and low signal level conditions to deter- mine if the ground received signal level variations were the result of modulation index changes.
The procedures consisted of connecting a precision spectrum analyzer to the DSIF phase lock receiver output and measuring and comparing relative carrier and sideband power levels for normal- and low-signal-level conditions.
56
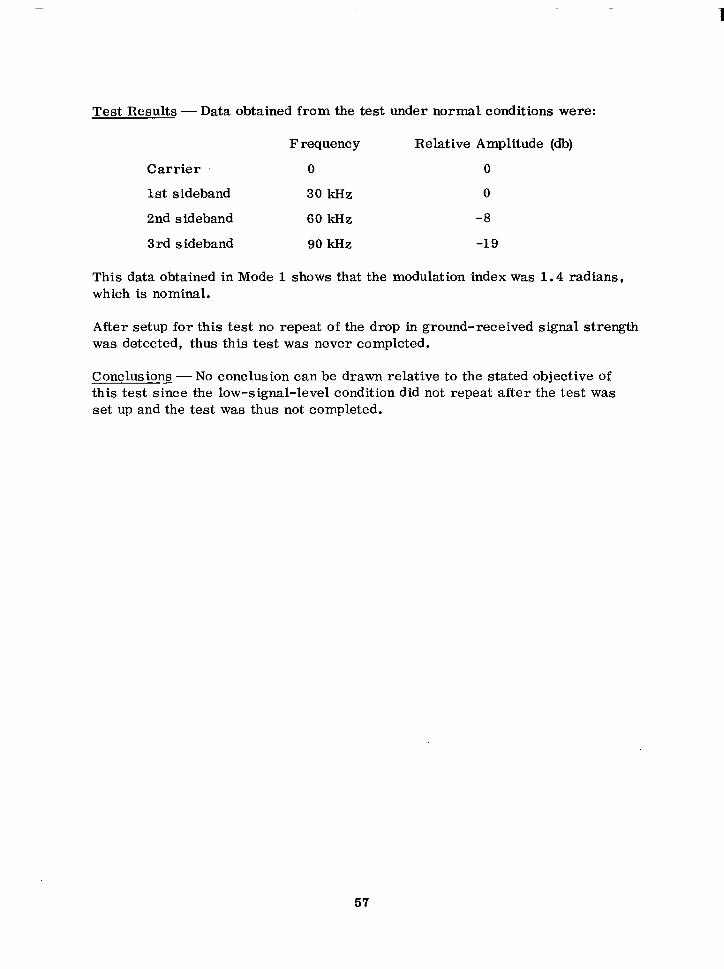
Test Results -Data obtained from the test under normal conditions were:
Carrier
1st sideband
2nd sideband
3 rd sideband
Frequency Relative Amplitude (db)
0 0
30 kHz 0
60 kHz -8
90 kHz -19
This data obtained in Mode 1 shows that the modulation index was 1.4 radians, which is nominal.
After setup for this test no repeat of the drop in ground-received signal strength was detected, thus this test was never completed.
Conclusions - No conclusion can be drawn relative to the stated objective of this test since the low-signal-level condition did not repeat after the test was set up and the test was thus not completed.
57
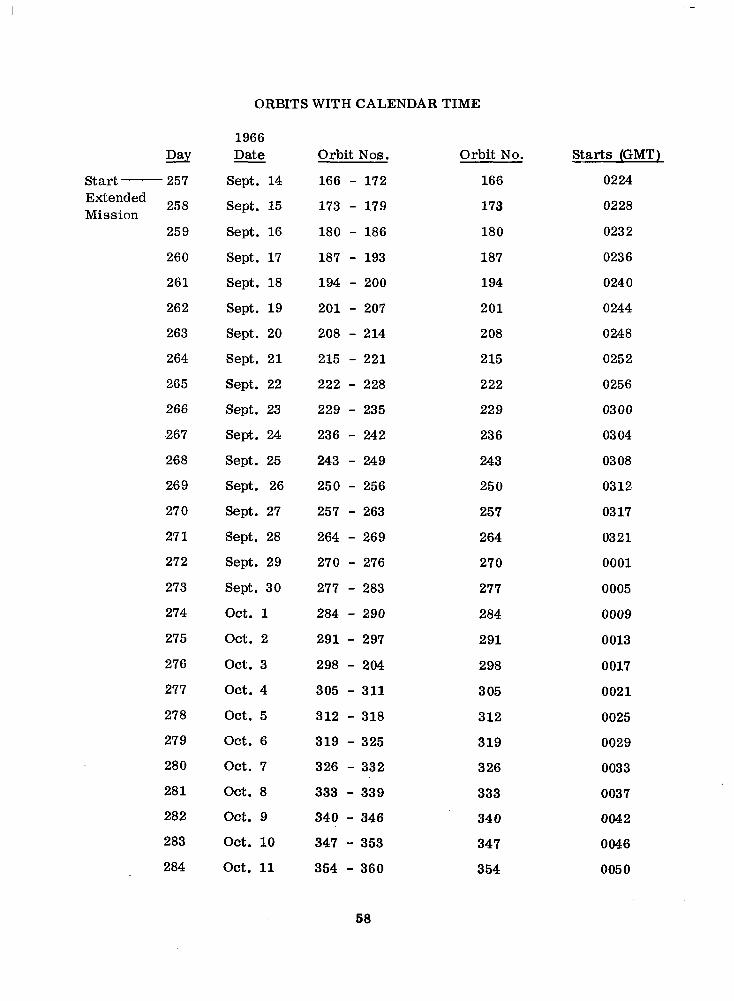
ORBITS WITH CALENDAR TIME
Day Start - 257 Extended Mission
258
259
260
261
262
263
264
265
266
,267
268
269
270
271
272
273
274
275
276
277
278
279
280
281
282
283
284
1966 Date
Sept. 14
Sept. 15
Sept. 16
Sept. 17
Sept. 18
Sept. 19
Sept. 20
Sept. 21
Sept. 22
Sept. 23
Sept. 24
Sept. 25
Sept. 26
Sept. 27
Sept. 28
Sept. 29
Sept. 30
Oct. 1
Oct. 2
Oct. 3
Oct. 4
Oct. 5
Oct. 6
Oct. 7
Oct. 8
Oct. 9
Oct. 10
Oct. 11
Orbit Nos.
166 - 172
173 - 179
180 - 186
187 - 193
194 - 200
201 - 207
208 - 214
215 - 221
222 - 228
229 - 235
236 - 242
243 - 249
250 - 256
257 - 263
264 - 269
270 - 276
277 - 283
284 - 290
291 - 297
298 - 204
305 - 311
312 - 318
319 - 325
326 - 332
333 - 339
340 - 346
347 - 353
354 - 360
58
Orbit No. Starts (GMT)
166 0224
173 0228
180 0232
187 0236
194 0240
201 0244
208 0248
215 0252
222 0256
229 0300
236 03 04
243 0308
250 0312
257 0317
264 0321
270 0001
277 0005
284 0009
291 0013
298 0017
305 0021
312 0025
319 0029
326 0033
333 0037
340 0042
347 0046
354 0050
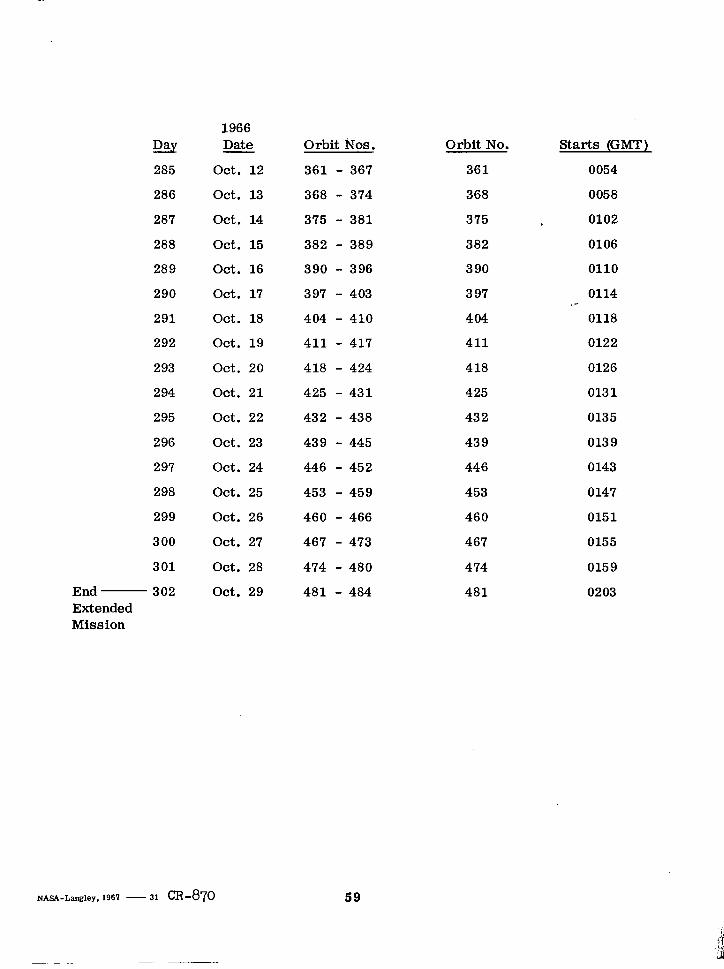
Day 285
286
287
289
290
291
292
293
294
295
296
297
299
300
301
End- 302 Extended Mission
1966 Date
Oct. 12
Oct. 13
Oct. 14
act. 15
Oct. 16
Oct. 17
Oct. 18
Oct. 19
Oct. 20
Oct. 21
Oct. 22
Oct. 23
Oct. 24
Oct. 25
Oct. 26
Oct. 27
Oct. 28
Oct. 29
Orbit Nos.
361 - 367
368 - 374
375 - 381
382 - 389
390 - 396
397 - 403
404 - 410
411 - 417
418 - 424
425 - 431
432 - 438
439 - 445
446 - 452
453 - 459
460 - 466
467 - 473
474 - 480
481 - 484
Orbit No.
361
368
375 ,
382
390
397
404
411
418
425
432
439
446
453
460
467
474
481
Starts (GMT)
0054
0058
0102
0106
0110
0114 .* 0118
0122
0126
0131
0135
0139
0143
0147
0151
0155
0159
0203
NASA-Langley, 1961 - 31 ~~-870 59
I ‘1 i ; ‘i 4 r
“The aeronautical and space activities of the United States shall be conducted so as to contribute . . . to the expansion of human knowl- edge of phenomena in the atmosphere and space. The Admhistration shall provide for the widest practicable and appropriate dissemination of information concerning its activities and the results thereof.”
-NATIONAL AERONAUTXS AND SPACE Am OF 1950
NASA SCIENTIFIC AND TECHNICAL PUBLICATIONS
TECHNICAL REPORTS: Scientific and technical information considered important, complete, and a lasting contribution to existing knowledge.
TECHNICAL NOTES: Information less broad in scope but nevertheless of importance as a contribution to existing knowledge.
TECHNICAL MEMORANDUMS: Information receiving limited distribu- tion because of preliminary data, security classification, or other reasons.
CONTRACTOR REPORTS: Scientic and technical information generated under a NASA contract or grant and considered an important contribution to existing knowledge.
TECHNICAL TRANSLATIONS: Information published in a foreign language considered to merit NASA distribution in English.
SPECIAL PUBLICATIONS: Information derived from or of value to NASA activities. Publications include conference proceedings, monographs, data compilations, handbooks, sourcebooks, and special bibliographies.
TECHNOLOGY UTILIZATION PUBLICATIONS: Information on tech- nology used by NASA that may be of particular interest in commercial and other non-aerospace applications. Publications include Tech Briefs, Technology Utilization Reports and Notes, and Technology Surveys.
Details on the availabilify of these publications may be obtained from:
SCIENTIFIC AND TECHNICAL INFORMATION DIVISION
NATIONAL AERONAUTICS AND SPACE ADMINISTRATION
Washington, D.C. 40546


![, NASA Contractor Report ]72 8](https://img.pdfslide.net/doc/110x75/61f5f30f5bdb351c3b2be492/-nasa-contractor-report-72-8.jpg)