Embed Size (px)
Citation preview
Nasopharyngeal carcinoma: past, present and future
directions
by
Zahra Taheri-Kadkhoda
Department of Oncology
Institute of Clinical Sciences
Göteborg University
SWEDEN
2007
2
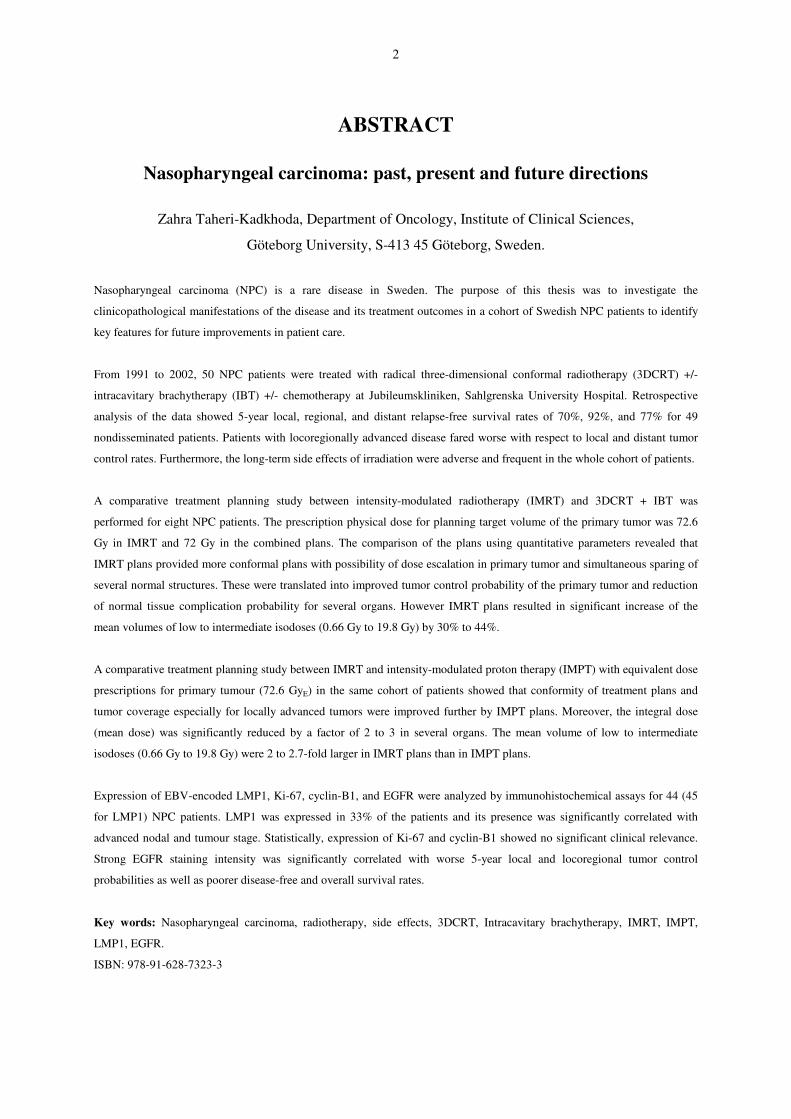
ABSTRACT
Nasopharyngeal carcinoma: past, present and future directions
Zahra Taheri-Kadkhoda, Department of Oncology, Institute of Clinical Sciences,
Göteborg University, S-413 45 Göteborg, Sweden.
Nasopharyngeal carcinoma (NPC) is a rare disease in Sweden. The purpose of this thesis was to investigate the
clinicopathological manifestations of the disease and its treatment outcomes in a cohort of Swedish NPC patients to identify
key features for future improvements in patient care.
From 1991 to 2002, 50 NPC patients were treated with radical three-dimensional conformal radiotherapy (3DCRT) +/-
intracavitary brachytherapy (IBT) +/- chemotherapy at Jubileumskliniken, Sahlgrenska University Hospital. Retrospective
analysis of the data showed 5-year local, regional, and distant relapse-free survival rates of 70%, 92%, and 77% for 49
nondisseminated patients. Patients with locoregionally advanced disease fared worse with respect to local and distant tumor
control rates. Furthermore, the long-term side effects of irradiation were adverse and frequent in the whole cohort of patients.
A comparative treatment planning study between intensity-modulated radiotherapy (IMRT) and 3DCRT + IBT was
performed for eight NPC patients. The prescription physical dose for planning target volume of the primary tumor was 72.6
Gy in IMRT and 72 Gy in the combined plans. The comparison of the plans using quantitative parameters revealed that
IMRT plans provided more conformal plans with possibility of dose escalation in primary tumor and simultaneous sparing of
several normal structures. These were translated into improved tumor control probability of the primary tumor and reduction
of normal tissue complication probability for several organs. However IMRT plans resulted in significant increase of the
mean volumes of low to intermediate isodoses (0.66 Gy to 19.8 Gy) by 30% to 44%.
A comparative treatment planning study between IMRT and intensity-modulated proton therapy (IMPT) with equivalent dose
prescriptions for primary tumour (72.6 GyE) in the same cohort of patients showed that conformity of treatment plans and
tumor coverage especially for locally advanced tumors were improved further by IMPT plans. Moreover, the integral dose
(mean dose) was significantly reduced by a factor of 2 to 3 in several organs. The mean volume of low to intermediate
isodoses (0.66 Gy to 19.8 Gy) were 2 to 2.7-fold larger in IMRT plans than in IMPT plans.
Expression of EBV-encoded LMP1, Ki-67, cyclin-B1, and EGFR were analyzed by immunohistochemical assays for 44 (45
for LMP1) NPC patients. LMP1 was expressed in 33% of the patients and its presence was significantly correlated with
advanced nodal and tumour stage. Statistically, expression of Ki-67 and cyclin-B1 showed no significant clinical relevance.
Strong EGFR staining intensity was significantly correlated with worse 5-year local and locoregional tumor control
probabilities as well as poorer disease-free and overall survival rates.
Key words: Nasopharyngeal carcinoma, radiotherapy, side effects, 3DCRT, Intracavitary brachytherapy, IMRT, IMPT,
LMP1, EGFR.
ISBN: 978-91-628-7323-3

3
Share your knowledge,
it is a way to achieve immortality!
Dalai Lama
To my beloved parents
sister and brothers
4
LIST OF PUBLICATIONS
This thesis is based on the following papers, which will be referred to in the text by their
Roman numerals:
I Taheri-Kadkhoda Z, Björk-Eriksson T, Johansson K-A, and Mercke C. Long-term
treatment results for nasopharyngeal carcinoma: The Sahlgrenska University Hospital
experience. Acta Oncol. 2007;46(6):817-827.
II Taheri-Kadkhoda Z, Pettersson N, Björk-Eriksson T, and Johansson K-A. Superiority of
intensity-modulated radiotherapy over three-dimensional conformal radiotherapy
combined with brachytherapy in nasopharyngeal carcinoma: a planning study. Accepted
by The British Journal of Radiology on August 14th,2007.
III Taheri-Kadkhoda Z, Björk-Eriksson T, Nill S, Wilkens JJ, Oelfke U, Johansson K-A,
Huber PE, and M� nter MW. Intensity-modulated radiotherapy of nasopharyngeal
carcinoma: a comparative treatment planning study of photons and protons. Submitted.
IV Taheri-Kadkhoda Z, Magnusson B, Svensson M, Mercke C, and Björk-Eriksson T.
Expression modes and clinical manifestations of LMP1, Ki-67, cyclin-B1, and
epidermal growth factor receptor in non-endemic nasopharyngeal carcinoma. In
manuscript.
5
CONTENTS page
Abstract ...................................................................................................................................... 2
Dedication .................................................................................................................................. 3
List of publications..................................................................................................................... 4
Contents...................................................................................................................................... 5
Abbreviations ............................................................................................................................. 7
Aims of the study ....................................................................................................................... 9
Introduction .............................................................................................................................. 10
Background.….......................................................................................................................... 10
Epidemiology and Aetiology………………………………………….…………..... 10
Anatomy………………………..……………………………………………….. ..... 11
Histopathology…..………………………………………………………….. ........... 13
Natural history………………………………………………...……………………..13
Diagnosis………….……………………………………………………………....... 14
Classification and prognostic factors........................................................................ . 14
Treatment……………………..…………………………………………………….. 16
Surgery….…………………………………………………………………….… 16
Chemotherapy………………………………………………………………….... 16
Radiotherapy…………………………………………………………………….. 17
Two-dimensional external radiotherapy…………………………………....... 18
Three-dimensional external radiotherapy…………………………………..... 19
Intensity-modulated radiotherapy…………………………………………..…22
Radiotherapy with proton beams……………………………………….......... 27
Intracavitary brachytherapy………………………………………………….. 31
Side effects…........................................................................................ ........... 32
Follow-up…………………………………………………..…………………......... 32
Comparative treatment planning studies in 3D radiotherapy; why they are needed,
and what parameters to consider?............................................................................. . 33
Materials and methods……………………………………………………………………….. 37
Paper I & IV…………………………………………………………..………......... 37
Study population………………………………………………………………… 37
6
Patient workup……………………………………………………….......……. . 38
Treatment policy…………………………………………………………............ 38
Chemotherapy…………………………………………………………………38
Radiotherapy…………………………………………………………............. 39
Patient follow-up…………………………………………………………………42
Data collection and evaluation…………………………………………………...43
Tumour staging…………………………………………………………......... 43
Histology……………………………………………………………………... 44
Treatment-related toxicity………………………………………………......... 44
Immunohistochemistry of biomarkers (paper IV)………………………………. 46
Paper II & III………………………………………………………………….......... 48
Study population………………………………………………………………… 48
Definition of target volumes and OARs………………………………………….48
Dose prescriptions, dose-volume constraints, and treatment plannings………….49
Quantitative comparison of the plans…………………………………………….52
Statistical analysis………………………………………………………………..54
Results and discussion………………………………………………………………………...55
Paper I………………………………………………………………………………. 55
Paper II……………………………………………………………………… ........... 58
Paper III…………………………………………………………………………….. 62
Paper IV…………………………………………………………………………….. 65
Future perspectives and general discussion.................................................................. ………68
Conclusions…………………………………………………………………………….......... 70
Acknowledgements…………………………………………………………………….......... 71
References…………………………………………………………………………………….73
7
ABBREVIATIONS
2DRT Two-dimensional radiotherapy
3DCRT Three-dimensional conformal radiotherapy
AJCC American joint committee on cancer
CHT Chemotherapy
CI Conformity index
CRT Conventional radiotherapy
CT Computed tomography
CTCAE Common terminology criteria for adverse events
CTV Clinical target volume
Cyclin-B1 Phase specific protein of the cell cycle expressed in G2 + M phase
DFS Disease-free survival
DRFS Distant relapse-free survival
DVH Dose volume histogram
EBV Epstein-Barr virus
EGFR Epidermal growth factor receptor
EQD2 Equivalent dose in 2 Gy fractions
EUD Equivalent uniform dose
GTV Gross tumour volume
H & N Head and neck
HART Hyperfractionated accelerated radiotherapy
HDR High dose rate
IBT Intracavitary brachytherapy
IC Inhomogeneity coefficient
ICRU International commission on radiation units and measurements
IHC Immunohistochemistry
IMPT Intensity-modulated proton therapy
IMRT Intensity-modulated radiotherapy
JK Jubileumskliniken
Ki-67 Nuclear antigen expressed only by proliferating cells
8
LDR Low dose rate
LENT/SOMA Late effects of radiotherapy in normal tissues/subjective, objective,
management, and analytical scoring system
LET Linear energy transfer
LKB model Lyman-Kutcher-Burman model
LMP1 Latent membrane protein 1 encoded by Epstein-Barr virus
LRFS Local relapse-free survival
LRRFS Locoregional relapse-free survival
MLC Multi-leaf collimator
MLI Mean luminescence intensity
MRI Magnetic resonance imaging
NPC Nasopharyngeal carcinoma
NTCP Normal tissue complication probability
OAR Organs at risk
OC Oncology Center
OS Overall survival
OTT Overall treatment time
PFS Progression-free survival
PET Positron emission tomography
PTV Planning target volume
RBE Relative biological effectiveness
RT Radiotherapy
SCC Squamous cell carcinoma
SF Surviving fraction
SIB Simultaneous integrated boost
SOBP Spread out bragg peak
TCP Tumour control probability
TM Temporomandibular
UICC International union against cancer
WHO World health organization
9
AIMS OF THE STUDY
The aims of the studies included in this thesis are as follows;
� To assess whether the traditional treatment strategies for nasopharyngeal carcinoma (NPC)
patients in our institution have resulted in satisfactory survival outcomes and acceptable
side-effect profiles and to identify key features for future improvements (Paper I).
� To assess whether currently available intensity-modulated radiotherapy technique has the
potential to provide better clinical outcomes for NPC patients than conventional
radiotherapy techniques (Paper II).
� To assess whether proton therapy can potentially be beneficial for primary treatment of
NPC patients in future (Paper III).
� To assess whether there are biomarkers with prognostic and therapeutic values in
nonendemic NPC (Paper IV).
10
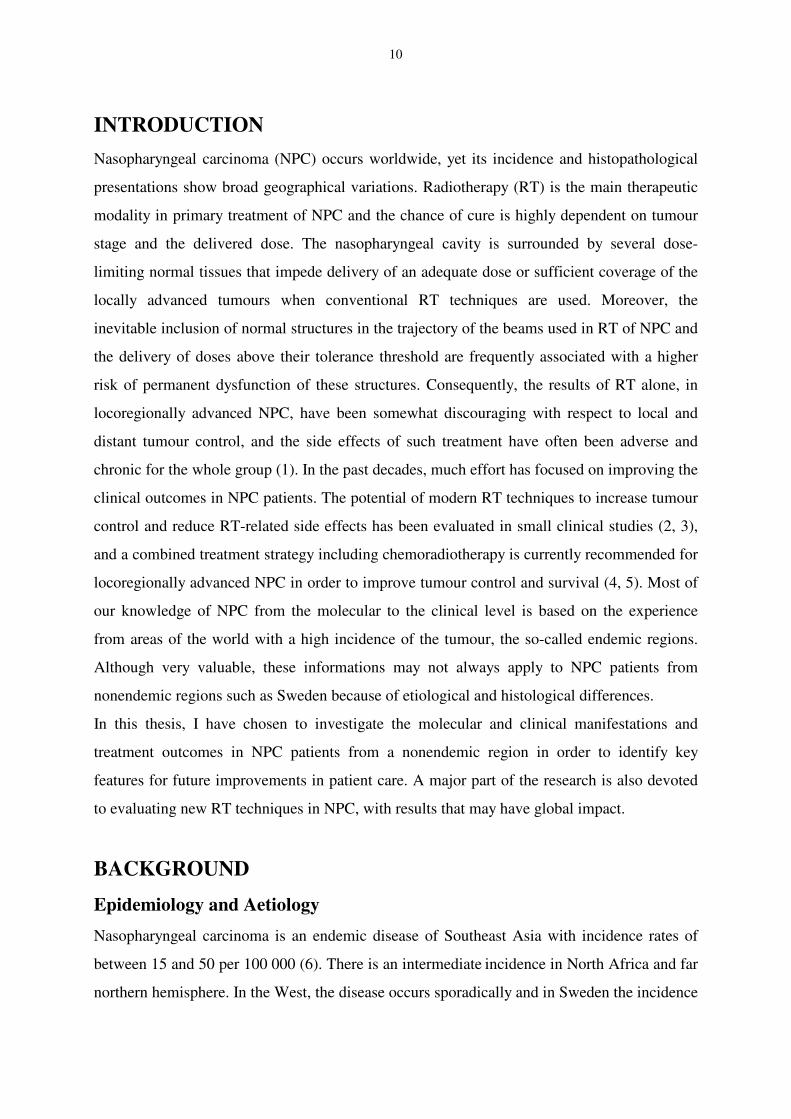
INTRODUCTION
Nasopharyngeal carcinoma (NPC) occurs worldwide, yet its incidence and histopathological
presentations show broad geographical variations. Radiotherapy (RT) is the main therapeutic
modality in primary treatment of NPC and the chance of cure is highly dependent on tumour
stage and the delivered dose. The nasopharyngeal cavity is surrounded by several dose-
limiting normal tissues that impede delivery of an adequate dose or sufficient coverage of the
locally advanced tumours when conventional RT techniques are used. Moreover, the
inevitable inclusion of normal structures in the trajectory of the beams used in RT of NPC and
the delivery of doses above their tolerance threshold are frequently associated with a higher
risk of permanent dysfunction of these structures. Consequently, the results of RT alone, in
locoregionally advanced NPC, have been somewhat discouraging with respect to local and
distant tumour control, and the side effects of such treatment have often been adverse and
chronic for the whole group (1). In the past decades, much effort has focused on improving the
clinical outcomes in NPC patients. The potential of modern RT techniques to increase tumour
control and reduce RT-related side effects has been evaluated in small clinical studies (2, 3),
and a combined treatment strategy including chemoradiotherapy is currently recommended for
locoregionally advanced NPC in order to improve tumour control and survival (4, 5). Most of
our knowledge of NPC from the molecular to the clinical level is based on the experience
from areas of the world with a high incidence of the tumour, the so-called endemic regions.
Although very valuable, these informations may not always apply to NPC patients from
nonendemic regions such as Sweden because of etiological and histological differences.
In this thesis, I have chosen to investigate the molecular and clinical manifestations and
treatment outcomes in NPC patients from a nonendemic region in order to identify key
features for future improvements in patient care. A major part of the research is also devoted
to evaluating new RT techniques in NPC, with results that may have global impact.
BACKGROUND
Epidemiology and Aetiology
Nasopharyngeal carcinoma is an endemic disease of Southeast Asia with incidence rates of
between 15 and 50 per 100 000 (6). There is an intermediate incidence in North Africa and far
northern hemisphere. In the West, the disease occurs sporadically and in Sweden the incidence
11
rate is very low, varying between 0.3 and 0.4 per 100 000 (7). In this country, NPC constitutes
only 0.1% of all new cancer cases each year (7). Globally, NPC shows a bimodal age
distribution. A small peak is observed in late childhood and a second peak occurs in people
aged 50-60 years (8). The disease is more common in males than females by a ratio of 2-3:1
(1, 9, 10).
Unlike other squamous cell cancers (SCCs) of the head and neck (H & N) region, NPC does
not appear to be linked to excessive use of tobacco and alcohol. The proposed predisposing
factors include diet, viral agents such as Epstein-Barr virus (EBV), and genetic susceptibility
(6). It has been suggested that chronic exposure to volatile nitrosamines released during the
cooking of salted food items such as fish may irritate the nasopharyngeal mucosa. This
irritation, with or without genetic predispositions can lead to development of patchy low-grade
dysplasias in the nasopharyngeal mucosa. At this stage, latent EBV infection may aggravate
the dysplatic status of the mucosa and together with further chromosomal aberrations may
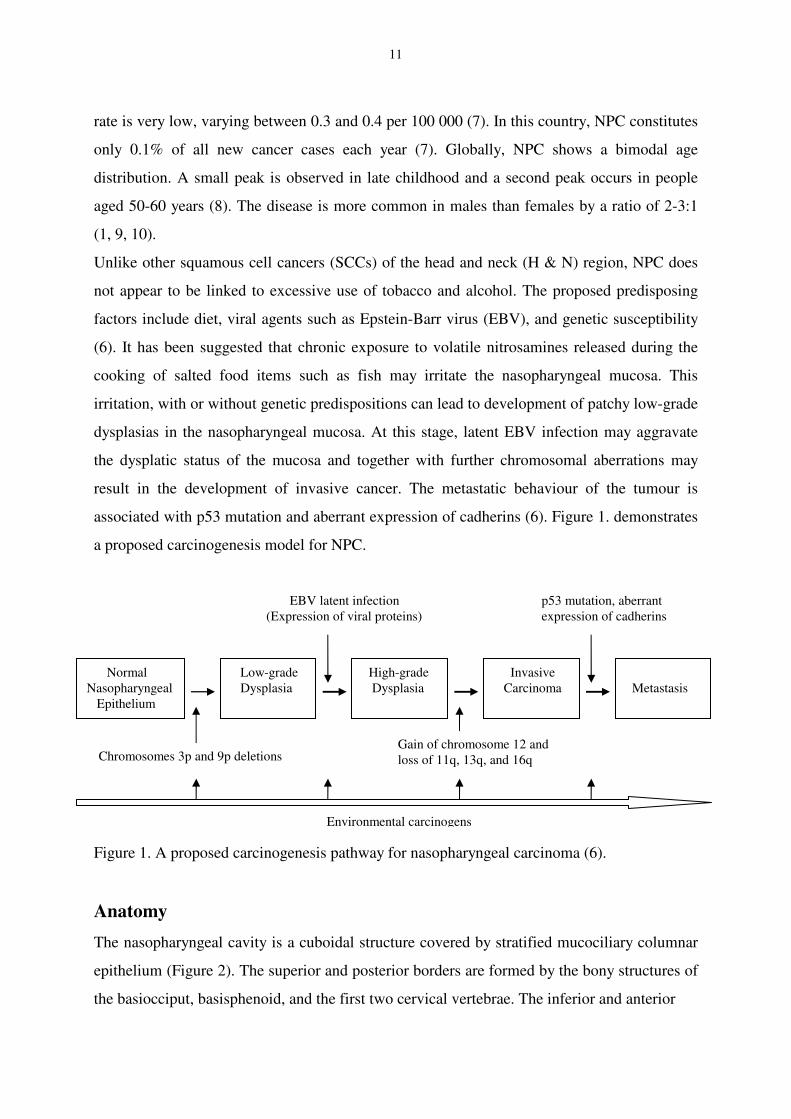
result in the development of invasive cancer. The metastatic behaviour of the tumour is
associated with p53 mutation and aberrant expression of cadherins (6). Figure 1. demonstrates
a proposed carcinogenesis model for NPC.
Figure 1. A proposed carcinogenesis pathway for nasopharyngeal carcinoma (6).
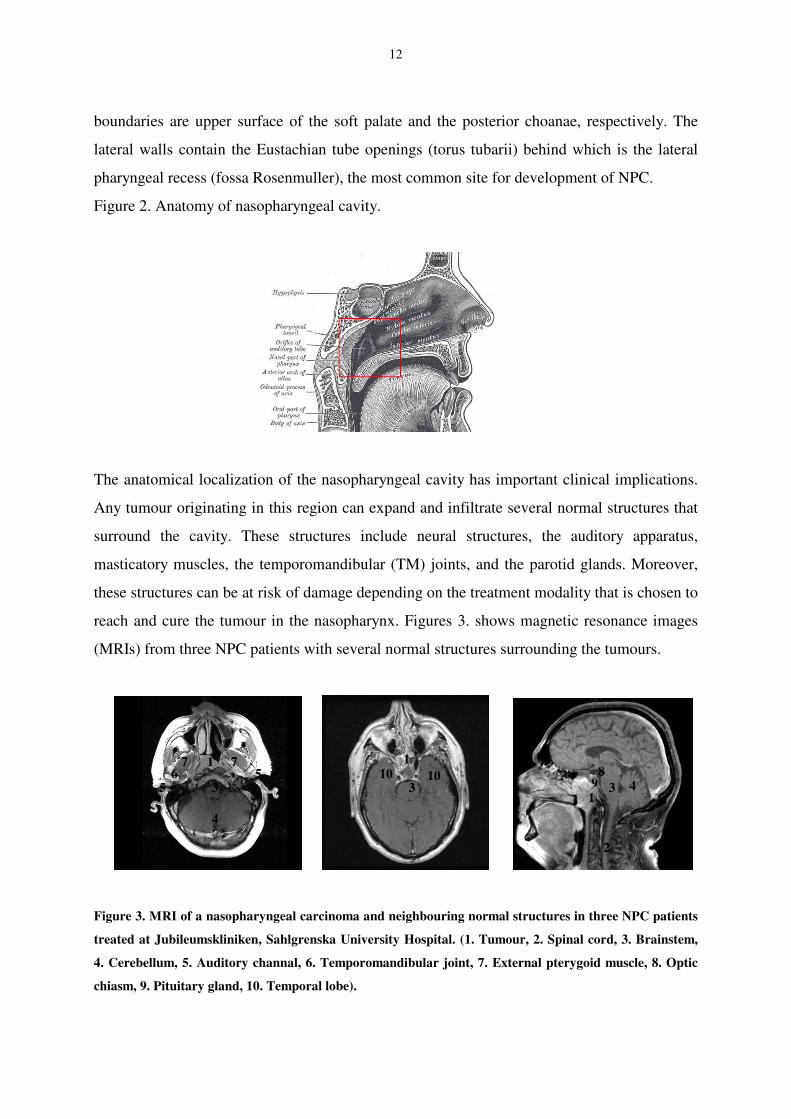
Anatomy
The nasopharyngeal cavity is a cuboidal structure covered by stratified mucociliary columnar
epithelium (Figure 2). The superior and posterior borders are formed by the bony structures of
the basiocciput, basisphenoid, and the first two cervical vertebrae. The inferior and anterior
Low-grade Dysplasia
Normal Nasopharyngeal Epithelium
High-grade Dysplasia
Invasive Carcinoma
Metastasis
EBV latent infection (Expression of viral proteins)
Chromosomes 3p and 9p deletions Gain of chromosome 12 and loss of 11q, 13q, and 16q
p53 mutation, aberrant expression of cadherins
Environmental carcinogens
12
boundaries are upper surface of the soft palate and the posterior choanae, respectively. The
lateral walls contain the Eustachian tube openings (torus tubarii) behind which is the lateral
pharyngeal recess (fossa Rosenmuller), the most common site for development of NPC.
Figure 2. Anatomy of nasopharyngeal cavity.
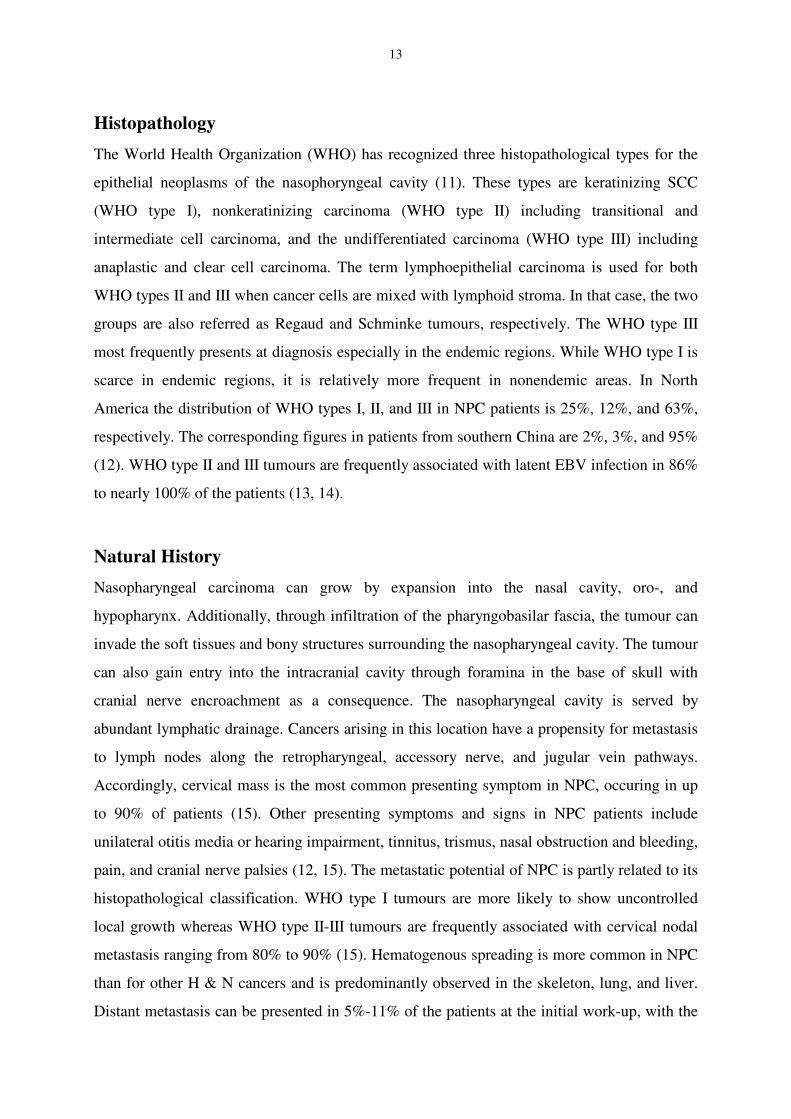
The anatomical localization of the nasopharyngeal cavity has important clinical implications.
Any tumour originating in this region can expand and infiltrate several normal structures that
surround the cavity. These structures include neural structures, the auditory apparatus,
masticatory muscles, the temporomandibular (TM) joints, and the parotid glands. Moreover,
these structures can be at risk of damage depending on the treatment modality that is chosen to
reach and cure the tumour in the nasopharynx. Figures 3. shows magnetic resonance images
(MRIs) from three NPC patients with several normal structures surrounding the tumours.
Figure 3. MRI of a nasopharyngeal carcinoma and neighbouring normal structures in three NPC patients
treated at Jubileumskliniken, Sahlgrenska University Hospital. (1. Tumour, 2. Spinal cord, 3. Brainstem,
4. Cerebellum, 5. Auditory channal, 6. Temporomandibular joint, 7. External pterygoid muscle, 8. Optic
chiasm, 9. Pituitary gland, 10. Temporal lobe).
1
1
1
2
3 3
4
7 5
7
5 6 8
9 10 10 3 4
13
Histopathology
The World Health Organization (WHO) has recognized three histopathological types for the
epithelial neoplasms of the nasophoryngeal cavity (11). These types are keratinizing SCC
(WHO type I), nonkeratinizing carcinoma (WHO type II) including transitional and
intermediate cell carcinoma, and the undifferentiated carcinoma (WHO type III) including
anaplastic and clear cell carcinoma. The term lymphoepithelial carcinoma is used for both
WHO types II and III when cancer cells are mixed with lymphoid stroma. In that case, the two
groups are also referred as Regaud and Schminke tumours, respectively. The WHO type III
most frequently presents at diagnosis especially in the endemic regions. While WHO type I is
scarce in endemic regions, it is relatively more frequent in nonendemic areas. In North
America the distribution of WHO types I, II, and III in NPC patients is 25%, 12%, and 63%,
respectively. The corresponding figures in patients from southern China are 2%, 3%, and 95%
(12). WHO type II and III tumours are frequently associated with latent EBV infection in 86%
to nearly 100% of the patients (13, 14).
Natural History
Nasopharyngeal carcinoma can grow by expansion into the nasal cavity, oro-, and
hypopharynx. Additionally, through infiltration of the pharyngobasilar fascia, the tumour can
invade the soft tissues and bony structures surrounding the nasopharyngeal cavity. The tumour
can also gain entry into the intracranial cavity through foramina in the base of skull with
cranial nerve encroachment as a consequence. The nasopharyngeal cavity is served by
abundant lymphatic drainage. Cancers arising in this location have a propensity for metastasis
to lymph nodes along the retropharyngeal, accessory nerve, and jugular vein pathways.
Accordingly, cervical mass is the most common presenting symptom in NPC, occuring in up
to 90% of patients (15). Other presenting symptoms and signs in NPC patients include
unilateral otitis media or hearing impairment, tinnitus, trismus, nasal obstruction and bleeding,
pain, and cranial nerve palsies (12, 15). The metastatic potential of NPC is partly related to its
histopathological classification. WHO type I tumours are more likely to show uncontrolled
local growth whereas WHO type II-III tumours are frequently associated with cervical nodal
metastasis ranging from 80% to 90% (15). Hematogenous spreading is more common in NPC
than for other H & N cancers and is predominantly observed in the skeleton, lung, and liver.
Distant metastasis can be presented in 5%-11% of the patients at the initial work-up, with the
3
14
highest risk for patients with bulky and fixed lymph nodes, bilateral cervical or lower neck
disease (15).
Diagnosis
The diagnosis of NPC is etablished by clinical examination and histological confirmation. The
latter is performed by taking biopsies from the nasopharyngeal mass, which is best visualized
using a fibreoptic nasopharyngoscope. If a cervical mass presents, fine needle aspirations or
extirpation of the node is needed for diagnosis. In order to detect the local and regional
extension of the tumour accurately, both a computed tomography (CT) scan and an MRI of the
nasopharynx, base of the skull, and neck are recommended. MRI is more sensitive than CT
scans for detection of the primary tumour, its parapharyngeal and/or intracranial extension,
and bone marrow infiltration (12). However, bony erosions are better detected by CT scans.
The role of positron emission tomography (PET) scanning in NPC is still unsettled, although
there are indications for using PET in detecting local failures after therapy or distant
metastasis(12). Chest X-rays are routinely used for detecting pulmonary metastasis.
Radiographic screening of other sites of the body including the abdomen and skeleton is
usually done when the results of clinical and laboratory work-up of the patient suggest distant
metastasis (12, 16).
Classification and prognostic factors
Several systems for NPC stage classification have been developed. The Ho classification
(17) has been widely used in Asia. This system differs from most staging systems in that it
comprises three T stages and five overall stages. In 1997, the International Union Against
Cancer (UICC) and the American Joint Committee on Cancer (AJCC) jointly formulated a
new stage classification for NPC. This classification incorporates major tumour parameters
that are prognostically significant (Table 1) (18, 19).
Major prognostic factors adversely influencing the outcome of treatment in NPC patients
include tumour size, disease extent as measured by staging systems, and the type of histology
(6). Based on the difference in failure patterns, four prognostic categories can be defined
across the NPC stages. These are; T1-T2N0-N1 tumours with relatively good treatment
outcome; T3-T4N0-N1 tumours with mainly local failure; T1-T2N2-N3 with mainly regional
and distant failure; and T3-T4N2-N3 with local, regional, and distant failure.
15
Table 1. Staging criteria for nasopharyngeal carcinoma according to UICC/AJCC 1997 system (18, 19).
Histopathologically, WHO type III tumours are associated with a better prognosis showing 5-
year OS rate of 60% depending on the tumour stage, compared with an OS rate as low as 15%
in WHO type I tumours (15). Other factors linked to tumour control and survival rates that
were present in some, but not all, studies include age, the total RT dose, latent EBV infection,
and overexpression of biomarkers such as epidermal growth factor receptor (EGFR) in the
tumour specimens (1, 14, 20, 21). In some studies, the presence of latent membrane protein 1
(LMP1), an EBV-encoded oncoprotein, and increased expression of the proliferation marker
Ki-67 in NPC patients have been correlated to advanced nodal and tumour stage (22, 23).
Among phase specific proteins of the cell cycle (cyclins), the prognostic value of cyclin-B1
expression has been on focus in recent years. Although it has been demonstrated that
overexpression of this molecule in H & N cancers is correlated to poorer tumour control rates
(24, 25), there are no reports on patterns of expression or clinical manifestations of this marker
in NPC patients.
Nasopharynx (T) T1 Nasopharynx T2 Soft tissue of oropharynx and/or nasal fossa T2a Without parapharyngeal extension T2b With parapharyngeal extension T3 Invasion of bony structure and/or paranasal sinuses T4 Intracranial extension, involvement of cranial nerves, infratemporal fossa,
hypopharynx, orbit Regional lymph node (N) N1 Unilateral metastasis in lymph node(s), 6 cm in greatest dimension, above
supraclavicular fossa N2 Bilateral metastasis in lymph node(s), 6 cm in greatest dimension, above
supraclavicular fossa N3 Metastasis in lymph node(s), >6 cm in dimension, in the supraclavicular fossa Distant metastasis (M) M0 No distant metastasis M1 Distant metastasis Stage grouping
Stage 0 Tis N0 M0 Stage I T1 N0 M0 Stage IIa T2a N0 M0 Stage IIb T2b N0 M0, T1-T2 N1 M0 Stage III T3 N0-N3 M0, T1-T2 N2 M0 Stage IVa T4 N0-N2 M0 Stage IVb Any T N3 M0 Stage IVc Any T Any N M1
16
Treatment
Surgery
Due to the location of the primary tumour in NPC and the faint chances of achieving clean
resection margins, surgery is usually not feasible in primary treatment of the lesions and is
reserved for highly selected patients with residual disease or recurrence of the disease (12). In
these cases, 5-year tumour control rate of 65% is reported when tumour is adequately resected
(12). However, surgery in the form of nasopharyngectomy is associated with considerable
morbidity, including risk of injuries to the cranial nerves, cerebral fluid leaks, and
haemorrhage secondary to vessel injury (15). Surgery is also not advocated in primary
treatment of cervical lymph node metastases. These metastases are mostly radiosensitive and
radiocurable, and are often bulky and bilateral. In addition, those located in the nodes of
Rouviere are not accessible for surgery. The risk of isolated regional failure in the neck is less
than 5% in NPC patients after combined chemoradiation (12). For those patients where failure
occurs, radical neck dissection is recommended, sometimes in combination with
brachytherapy.
Chemotherapy
Chemotherapy (CHT) is frequently combined with RT in locoregionally advanced NPC. There
are three basic approaches: neoadjuvant, concomitant, or adjuvant treatment. The most
common combination of CHT agents used for NPC patients is cisplatin and 5-fluorouracil (5-
FU). More than ten randomized trials have been performed to evaluate the benefits of
chemoradiotherapy over RT alone in NPC patients (12). The 1997 intergroup study from the
nonendemic region was the first to show significant benefits in terms of progression-free
(PFS) and OS rates in locoregionally advanced NPC patients who received concomitant and
adjuvant CHT plus RT (69% and 76%) compared with those received RT only (24% and
46%) (26). This study has been criticized for the inferior results in the RT arm compared with
historical results from the endemic regions. The applicability of results of this study in
endemic regions has also been questioned because of the relative high rate of WHO type I
presentation in the accrued patients. Two meta-analyses of randomized trials involving NPC
patients with locoregionally advanced disease have revealed an absolute 5-year OS benefits of
4% and 6% for chemoradiotherapy (4, 5). In both studies, the benefit was essentially observed
when concomitant CHT was administered. While one of these studies (5) demonstrated
17
significant benefits of both neoadjuvant and concomitant CHT in reduction of locoregional
and distant failures, no correlation between the timing of CHT and event-free survival (tumour
recurrence or death) rates was found in the other analysis (4). Currently, the standard treatment
for locoregionally advanced NPC (stages IIb-IVb) is RT concomitantly with cisplatin. Because
of the high risk of distant failure in these patients, protocol-based addition of neoadjuvant
CHT is also recommended. For Stages I-IIa NPC tumours, only RT is administered.
Radiotherapy
Radiotherapy involves the use of high-energy photon and/or particle beams (electrons,
protons, heavy ion) to ionize molecules and destroy their function in the targeted tissue that
they penetrate. This can be done by several approaches but for most clinical purposes such as
in NPC, irradiation is done with external radiation sources using high-energy photon and/or
electron beams that in modern RT centres are produced and delivered to patients by linear
accelerators.
The probability of success rate with RT is highly dependent on the radiosensitivity of the
tumour tissue, the delivered dose, and the precision with which it is administered.
Radiotherapy is the most important treatment modality in NPC due to its anatomical
localization and propensity to bilateral cervical lymph node metastasis. Yet while the
eradication of NPC lesions demands high absorbed doses, the ultimate tolerable dose is
limited by both acute and late side effects of RT in vital structures surrounding the tumour.
Moreover, it is estimated that 70% to 90% of NPC patients have occult and macroscopic
cervical lymph node metastasis independent of their T stages (27). Radiotherapy in NPC
patients is thus directed to both the primary lesion and the bilateral cervical lymph node
stations, including the supraclavicular fossae. Consequently, NPC patients are often treated
with large RT beams that inevitably affect normal structures around and below the
nasopharyngeal cavity. As a consequence, surviving NPC patients are at higher risk of
suffering adverse acute and late side effects of RT than other H & N cancer patients (28).
During the last decades, the accumulation of knowledge in importance of time, dose, and
fractionation of RT on tumour response and normal tissue reactions and technical advances in
RT have been accompanied by encouraging improvements in 4 to 5-year OS rates of NPC
patients from 25% in 1960s to 88% in modern times (2, 9, 29). In the following, a brief
description of the technical transitions in irradiation of NPC patients will be presented.
18
Two-dimensional external radiotherapy Until the early 1990s, radical external RT for NPC was delivered using two-dimensional RT
(2DRT) techniques delivering tumouricidal absorbed doses of 60-70 Gy (2-2.5 Gy/fraction in
6-7 weeks) to anatomical structures with a high suspicion of tumour infiltration (6, 27). A
lower dose of 46-50 Gy was delivered to bilateral cervical lymph node stations at risk of
tumour invasion (27). This technique involved manual projection of tumour volumes on
orthogonal simulation films and employment of nonconformal shielding blocks for critical
normal structures. In general, photon beams were used for irradiation, but electron beams were
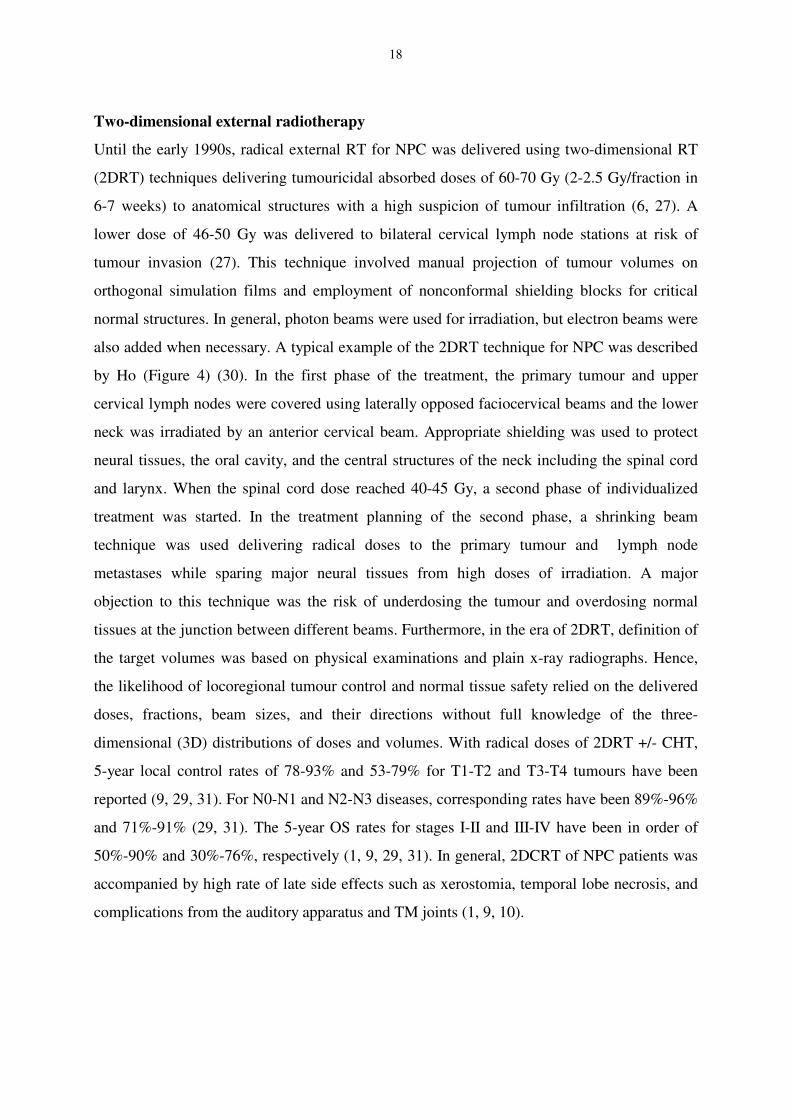
also added when necessary. A typical example of the 2DRT technique for NPC was described
by Ho (Figure 4) (30). In the first phase of the treatment, the primary tumour and upper
cervical lymph nodes were covered using laterally opposed faciocervical beams and the lower
neck was irradiated by an anterior cervical beam. Appropriate shielding was used to protect
neural tissues, the oral cavity, and the central structures of the neck including the spinal cord
and larynx. When the spinal cord dose reached 40-45 Gy, a second phase of individualized
treatment was started. In the treatment planning of the second phase, a shrinking beam
technique was used delivering radical doses to the primary tumour and lymph node
metastases while sparing major neural tissues from high doses of irradiation. A major
objection to this technique was the risk of underdosing the tumour and overdosing normal
tissues at the junction between different beams. Furthermore, in the era of 2DRT, definition of
the target volumes was based on physical examinations and plain x-ray radiographs. Hence,
the likelihood of locoregional tumour control and normal tissue safety relied on the delivered
doses, fractions, beam sizes, and their directions without full knowledge of the three-
dimensional (3D) distributions of doses and volumes. With radical doses of 2DRT +/- CHT,
5-year local control rates of 78-93% and 53-79% for T1-T2 and T3-T4 tumours have been
reported (9, 29, 31). For N0-N1 and N2-N3 diseases, corresponding rates have been 89%-96%
and 71%-91% (29, 31). The 5-year OS rates for stages I-II and III-IV have been in order of
50%-90% and 30%-76%, respectively (1, 9, 29, 31). In general, 2DCRT of NPC patients was
accompanied by high rate of late side effects such as xerostomia, temporal lobe necrosis, and
complications from the auditory apparatus and TM joints (1, 9, 10).
19
Figure 4. Demonstration of faciocervical beam (right) in the first phase and facial beam (left)
in the second phase of Ho irradiation technique for a patient with nasopharyngeal carcinoma
(10).
Three-dimensional external radiotherapy
Three-dimensional (3D) treatment planning based on CT scans acquired in the treatment
position has been a major breakthrough in RT. Computer tomography of the anatomical
regions intended for treatment can provide data for better definition of target and non-target
volumes, and accurate estimation of the tissue heterogeneities. Based on these data, number of
the beams, their orientations, and shapes can be optimally selected to favor better dose
distributions within the target volumes and normal tissues. This is called 3D conformal RT
(3DCRT) and its ultimate goal is to increase the tumour control probability (TCP) and
decrease the normal tissue complication probability (NTCP) (widening of therapeutic ratio)
when irradiating malignant lesions. The principle of 3DCRT is also applied in particle
therapy.
According to the recommendations of the International Commission on Radiation Units and
measurements, ICRU (32), certain volumes for the tumour and normal tissues must be
identified and delineated on the acquired CT slices before the actual treatment planning is
performed in 3DCRT. Gross tumour volume (GTV) is the term used for the macroscopic
manifestation of the tumour presented as primary lesion and regional lymph node metastasis.
Information from the diagnostic assessments, including physical examinations, as well as CT
and MRI or functional imagings, can be used by clinicians to accurately define GTVs. Based
on clinical experience, a certain margin is added to GTV to account for the undetectable
microscopic extensions of the tumour. This encompassing volume is labeled clinical target
20
volume (CTV). An additional margin is also added to CTV in order to account for the internal
organ motions and daily patient set-up error. This volume, which includes both GTV and
CTV, is called planning target volume (PTV) and represents the target that should optimally
be covered by the prescribed absorbed dose in the final version of the treatment plan. The
addition of these margins around the GTV yields 3DCRT less liable to geographic miss.
The normal structures that are identified on CT slices are usually more radiosensitive than the
tumour and are called organs at risk (OAR). Depending on the scale of their vital functionality
and radiosensitivity, one to several OARs are often identified for each patient and the extent of
their conformal avoidance is balanced against the conformal coverage of the tumour. After
defining dose-volume constraints for PTVs and OARs (which can be the same as in 2DRT),
forward treatment planning is performed. This involves manual selection and alterations of the
number and configurations of the beams, beam weights, and wedges until a relatively
homogenous dose distribution in the target is achieved. The selection of the beam orientation
is the key issue and is dictated by localization of critical OARs. In 3DCRT, each major beam
encompasses the entire PTV and the aperture of each beam is adapted to the projected shape
of PTV by using multileaf collimators (MLC). Simple modifications of the intensity profile of
each beam can be accomplished by using dynamic or static wedges and compensation filters.
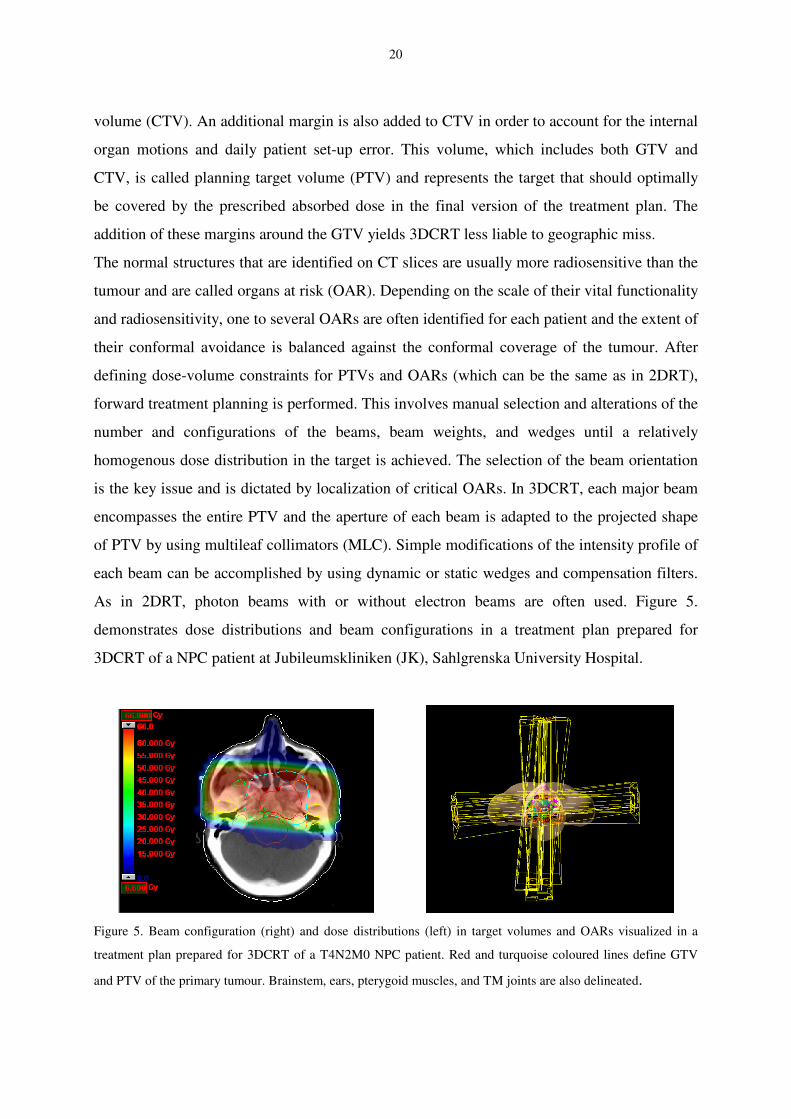
As in 2DRT, photon beams with or without electron beams are often used. Figure 5.
demonstrates dose distributions and beam configurations in a treatment plan prepared for
3DCRT of a NPC patient at Jubileumskliniken (JK), Sahlgrenska University Hospital.
Figure 5. Beam configuration (right) and dose distributions (left) in target volumes and OARs visualized in a
treatment plan prepared for 3DCRT of a T4N2M0 NPC patient. Red and turquoise coloured lines define GTV
and PTV of the primary tumour. Brainstem, ears, pterygoid muscles, and TM joints are also delineated.
21
The major benefit of 3DCRT over 2DRT is that 3D treatment planning provides quantitative
parameters for evaluation of dose distributions in target volumes and OARs. The quantitative
parameters can be extracted from the available background data or dose-volume histograms
(DVH), which are 1D graph presentations of the 3D dose distributions in each target or OAR.
However, DVHs cannot represent spatial information, and thus visual inspection of the plans
is still mandatory. The acquired parameters can be used to evaluate and optimize a single
treatment plan or to compare various treatment plans prepared for the same patient. Treatment
plans can thus be individualized to accommodate variations in the patient´s antomy and
tumour extension. Furthermore, the extracted dose-volume data for target volumes and OARs
in a cohort of patients with the same type of tumour can be correlated with treatment outcomes
in terms of tumour control and RT-related side effects. Results of such correlative studies
provide valuable baseline information for TCP and NTCP analysis of a particular tumour type
or OAR.
It must be emphasized that in complex cases 3DCRT can run into the same limitations as
2DRT. In locoregionally advanced NPC, delivery of radical dose to the whole PTV of primary
tumour is often hampered in both techniques by the radiosensitivity of surrounding critical
OARs. These structures must be shielded in the boost phase of the treatment by shrinking the
size of the beams or by selecting other beam orientations and qualities. Consequently, there
are risks for underdosing a significant volume of the target or overdosing other OARs.
Theoretically, it should be possible to come up with highly optimized treatment plans in
3DCRT for NPC patients with respect to tumour coverage and simultaneous sparing of several
OARs. However, the preparation of such plans is very labor-intensive and time-consuming
and involves the application of an unacceptable number of beams, making the whole process
inefficient for clinical practice.
No randomized trials have compared 2DRT and 3DCRT in NPC patients. Leibel et al. (33)
were the first to demonstrate that the use of 3DCRT plans in the boost phase or in tumour
recurrence treatment could actually increase the mean dose to the target by 13% for the same
prescribed dose compared with whole course 2DRT plans, while simultaneously decreasing
the dose to the parotid glands and mandible. However, 3DCRT boost treatment of 68
nondisseminated NPC patients to a mean total dose of 70 Gy, did not improve the 5-year local
control or OS rates (77% and 58%, respectively) compared with historical results using 2DRT
(34). Nevertheless, reports of whole course 3DCRT of stages II-IV NPC patients who received
22
doses of 60-70 Gy have been promising with respect to 3 to 4-year locoregional tumour
control (77%) and OS (71-90%) rates (35, 36), although the application of concurrent
chemotherapy +/- accelerated irradiation in these studies might have had improving impacts.
Intensity-modulated radiotherapy
Intensity-modulated radiotherapy (IMRT) is a further development of 3DCRT. With this
technique, radiation intensity in each subunit of a beam is 2D modulated so that each part of
the tumour receives a unique intensity, thus making it possible to adjust the dose in OARs
located in the trajectory of the beam. The sum of the non-uniform intensities from several
beam orientations can then deliver more conformal dose distributions in the target and achieve
better conformal avoidance of OARs. The latter increases the possibility of dose escalation
within the target. Such procedures redistribute the dose within the patient so that a larger
volume receives a lower dose in order to maintain a lower dose to some OARs while at the
same time delivering a high dose to the target. This is called dose sharing.
The orientation of the beams in IMRT may not be as critical as in 3DCRT since the dose
intensity in the regions of the beams where OARs surround the target can be lowered. Since
the whole target does not need to be irradiated by each beam, the number of feasible beam
orientations increases which is required in many IMRT plans in order to achieve the desired
dose distribution. Another concept associated with IMRT is inverse treatment planning, in
which a set of dose-volume constraints (objectives) and penalty factors for target volumes and
OARs are decided on at the outset. Based on these data, a computerized optimization program
calculates fluence profiles for all the beams simultaneously in order to meet the dose-volume
criteria and deliver an optimized plan. Typically, dose constraints can be given for the whole
volume of a target or OAR as minimum and maximum doses. By using DVHs, minimum and
maximum doses can also be defined for partial volumes of targets and/or OARs. The
optimization algorithm that is used for many IMRT plans is based on a least-squares objective
function and an iterative Newton gradient technique.
While a major part of the planning work is automated in IMRT, clinicians and dose planners
still have to decide on the appropriate dose-volume constraints. Sometimes the dose planner
must “trick” the optimization system in order to get or avoid some dose in a particular region
of the plan, especially when the system comes up with unexpected or unacceptable solutions.
Such situations require iterative adjustment of the prescribed parameters using trial and error,
23
which can be time-consuming. After an optimized plan has been obtained, the intensity profile
for each beam is translated into a set of leaf positions (step-and-shoot technique) or into a set
of dynamic leaf motions (sliding-window technique) for an MLC incorporated in a linear
accelerator. It must be remembered that, as with 3DCRT, the principles of IMRT planning, are
not limited to photon therapy, but can be applied to particle treatments with electron, proton,
or light ion beams (37, 38).
In general, IMRT planning is suitable for targets of complex shape located in the vicinity of
vital and radiosensitive OARs, as is the case with NPC. While IMRT can be delivered as a
boost treatment after 3DCRT or can be used as the sole technique in multiple phases, it has
become more routine to deliver whole course IMRT with the simultaneous integrated boost
(SIB) technique (39). In this technique, different targets receive different doses per fraction in
the same total treatment time. By increasing the dose per fraction to higher than 2 Gy for
regions expected to harbour more clonogenic cells (such as GTV), or for areas with
radioresistant cells (hypoxic regions), the total delivered dose can be increased in a moderately
shorter overall treatment time (OTT). Radiobiologically, the SIB technique is close to the
concomitant boost technique, a form of accelerated RT that counteracts the accelerated
repopulation of tumour clonogens by shortening the OTT, with beneficial effects on tumour
control (40). In H & N region, it has been demonstrated that the SIB-IMRT can provide more
conformal plans and better sparing of parotids than multi-phase IMRT (41). Technically, using
the SIB-IMRT is preferable since only one plan has to be prepared for the whole course of
treatment, thus saving time and effort in plan preparation, verification, and quality assurance.
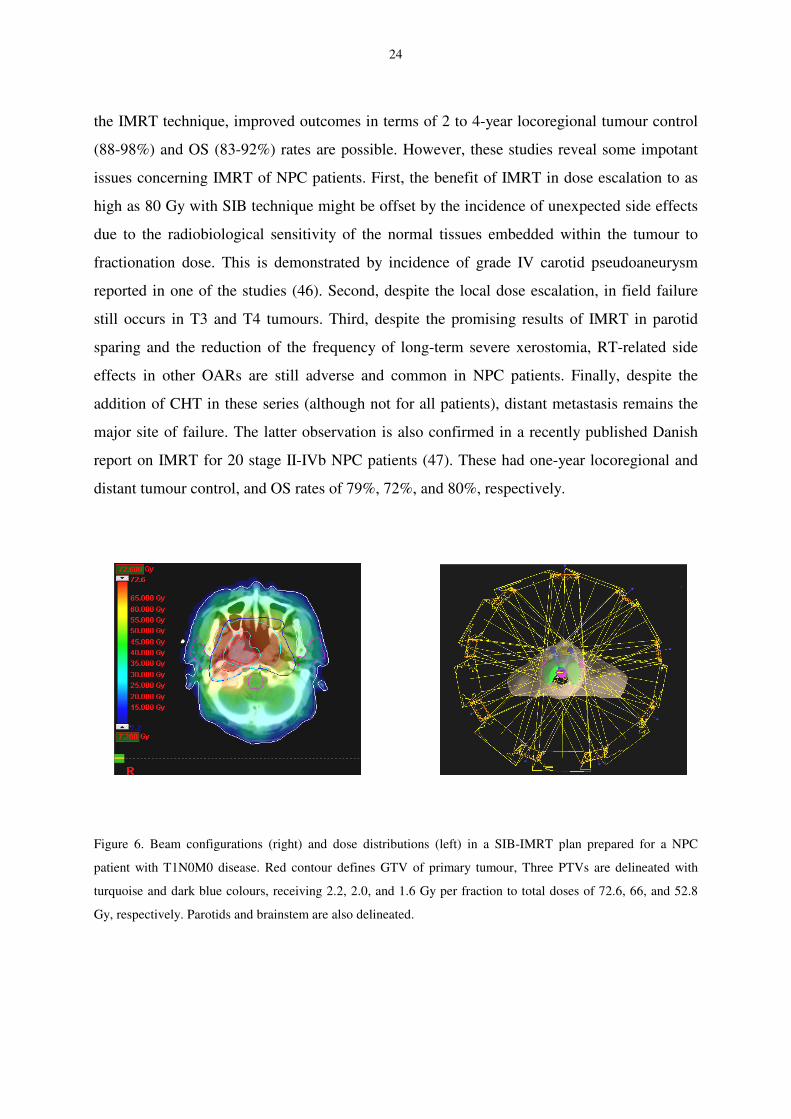
Figure 6. shows beam configurations and dose distributions in a SIB-IMRT plan prepared for
a NPC patient at JK.
There are some concerns about the radiobiological effects of the SIB technique on the normal
tissues embedded within the target volume, when they receive fractional doses higher than 2
Gy (42). This issue is especially critical for locally advanced NPC with tumour extension into
the temporal lobes, which show clear sensitivity to high fractional doses (43).
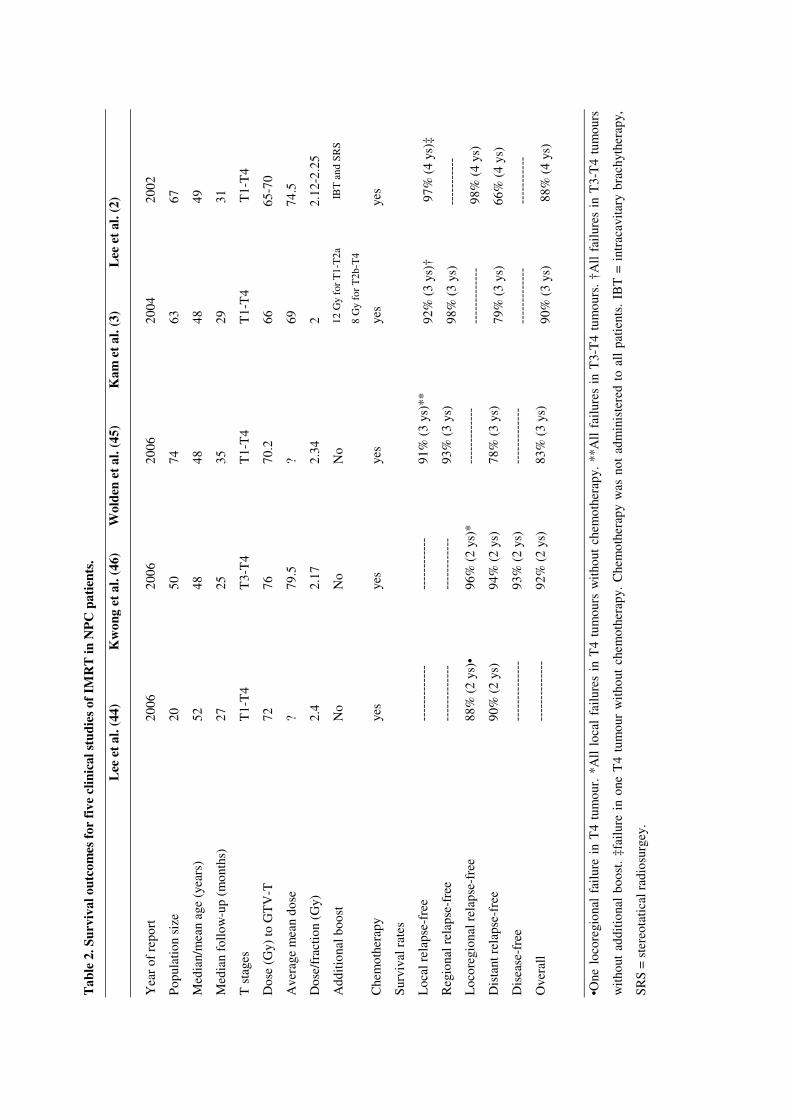
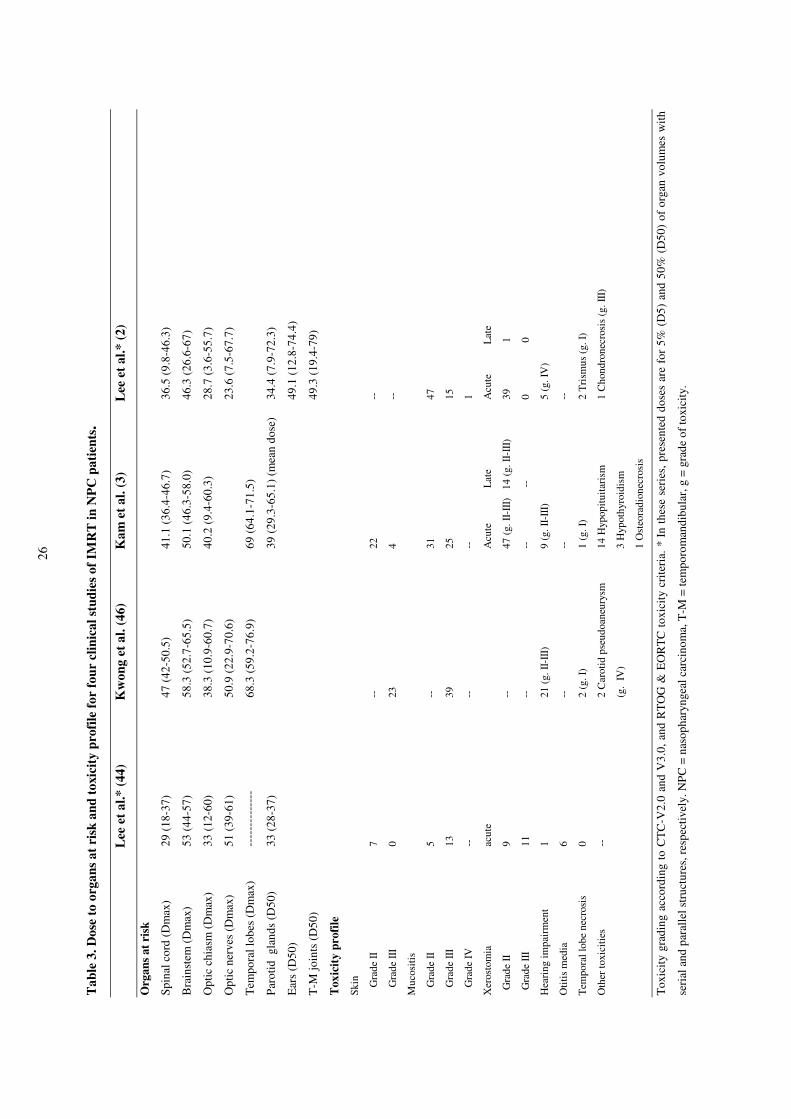
Since mid-1990s, IMRT has been used clinically in primary treatment of NPC (2, 3, 44-46).
Tables 2 and 3. summarize the published results from some of the nonrandomized
retrospective studies of using IMRT +/- SIB technique in NPC patients. The results of these
studies have been very encouraging, showing that when doses above 70 Gy are delivered by
24
the IMRT technique, improved outcomes in terms of 2 to 4-year locoregional tumour control
(88-98%) and OS (83-92%) rates are possible. However, these studies reveal some impotant
issues concerning IMRT of NPC patients. First, the benefit of IMRT in dose escalation to as
high as 80 Gy with SIB technique might be offset by the incidence of unexpected side effects
due to the radiobiological sensitivity of the normal tissues embedded within the tumour to
fractionation dose. This is demonstrated by incidence of grade IV carotid pseudoaneurysm
reported in one of the studies (46). Second, despite the local dose escalation, in field failure
still occurs in T3 and T4 tumours. Third, despite the promising results of IMRT in parotid
sparing and the reduction of the frequency of long-term severe xerostomia, RT-related side
effects in other OARs are still adverse and common in NPC patients. Finally, despite the
addition of CHT in these series (although not for all patients), distant metastasis remains the
major site of failure. The latter observation is also confirmed in a recently published Danish
report on IMRT for 20 stage II-IVb NPC patients (47). These had one-year locoregional and
distant tumour control, and OS rates of 79%, 72%, and 80%, respectively.
Figure 6. Beam configurations (right) and dose distributions (left) in a SIB-IMRT plan prepared for a NPC
patient with T1N0M0 disease. Red contour defines GTV of primary tumour, Three PTVs are delineated with
turquoise and dark blue colours, receiving 2.2, 2.0, and 1.6 Gy per fraction to total doses of 72.6, 66, and 52.8
Gy, respectively. Parotids and brainstem are also delineated.
Tab
le 2
. Sur
viva
l out
com
es fo
r fiv
e cl
inic
al s
tudi
es of
IMR
T in
NP
C p
atie
nts.
Le
e et
al.
(44)
K
won
g et
al.
(46)
W
olde
n et
al.
(45)
K
am e
t al.
(3)
Le
e et
al.
(2)
•One
loc
oreg
iona
l fa
ilure
in
T4
tum
our.
*A
ll lo
cal failu
res
in T
4 tu
mou
rs w
ithou
t ch
emot
hera
py.
**A
ll failu
res
in T
3-T
4 tu
mou
rs.
†All
failu
res
in T
3-T
4 t
umou
rs
with
out
addi
tiona
l bo
ost.
‡fai
lure
in
one
T4
tum
our
with
out
chem
othe
rapy
. C
hem
othe
rapy
was
not
adm
inis
tere
d to
all
patie
nts.
IB
T =
int
raca
vita
ry b
rach
yth
erap
y,
SR
S =
ste
reot
atic
al r
adio
surg
ey.
Yea
r of
rep
ort
Pop
ulat
ion
size
Med
ian/
mea
n ag
e (y
ears
)
Med
ian
follo
w-u
p (m
onth
s)
T s
tage
s
2006
20
52
27
T1-
T4
2006
50
48
25
T3-
T4
2006
74
48
35
T1-
T4
2004
2
002
63
6
7
48
4
9
29
3
1
T1-
T4
T1-
T4
Dos
e (G
y) to
GT
V-T
Ave
rage
mea
n do
se
72
?
76
79.5
70.2
?
66
6
5-70
69
7
4.5
Dos
e/fr
actio
n (G
y)
Add
ition
al b
oost
2.4
No
2.17
No
2.34
No
2
2
.12-
2.25
12 G
y fo
r T
1-T
2a
IB
T a
nd S
RS
8 G
y fo
r T
2b-T
4
Che
mot
hera
py
yes
yes
yes
yes
yes
Sur
viva
l rat
es
Loca
l rel
apse
-fre
e
Reg
iona
l rel
apse
-fre
e
Loco
regi
onal
rel
apse
-fre
e
Dis
tant
rel
apse
-fre
e
Dis
ease
-fre
e
Ove
rall
----
----
----
-
----
----
----
-
88%
(2
ys)•
90%
(2
ys)
----
----
----
--
----
----
----
--
----
----
----
----
----
----
96%
(2
ys)*
94%
(2
ys)
93%
(2
ys)
92%
(2
ys)
91%
(3
ys)*
*
93%
(3
ys)
----
----
----
-
78%
(3
ys)
----
----
----
-
83%
(3
ys)
92%
(3
ys)†
9
7% (
4 ys
)‡
98%
(3
ys)
-
----
----
--
----
----
----
-
98
% (
4 ys
)
79%
(3
ys)
6
6% (
4 ys
)
----
----
----
-
--
----
----
-
90%
(3
ys)
88%
(4
ys)
26
Tab
le 3
. Dos
e to
org
ans
at r
isk
and
toxi
city
pro
file fo
r fo
ur c
linic
al s
tudi
es o
f IM
RT
in N
PC
pat
ient
s.
Lee
et
al.*
(44
)
K
won
g et
al.
(46)
Kam
et a
l. (3
)
L
ee e
t a
l.* (
2)
Org
ans
at r
isk
Spi
nal c
ord
(Dm
ax)
29 (
18-3
7)
47 (
42-5
0.5)
41.1
(36
.4-4
6.7)
36.5
(9.
8-46
.3)
Bra
inst
em (
Dm
ax)
53 (
44-5
7)
58.3
(52
.7-6
5.5)
50
.1 (4
6.3-
58.0
) 46
.3 (
26.6
-67)
Opt
ic c
hias
m (
Dm
ax)
33 (
12-6
0)
38.3
(10
.9-6
0.7)
40
.2 (
9.4-
60.3
) 28
.7 (
3.6-
55.7
)
Opt
ic n
erve
s (D
max
) 51
(39
-61)
50
.9 (
22.9
-70.
6)
23
.6 (
7.5-
67.7
)
Tem
pora
l lob
es (
Dm
ax)
Par
otid
gla
nds
(D50
)
----
----
----
--
33 (
28-3
7)
68.3
(59
.2-7
6.9)
69
(64
.1-7
1.5)
39 (
29.3
-65.
1) (
mea
n do
se) 34
.4 (
7.9-
72.3
)
Ear
s (D
50)
49
.1 (
12.8
-74.
4)
T-M
join
ts (
D50
)
49.3
(19
.4-7
9)
Tox
icity
pro
file
Ski
n
Gra
de II
Gra
de II
I
Muc
ositi
s
Gra
de II
Gra
de II
I
Gra
de IV
Xer
osto
mia
Gra
de II
Gra
de II
I
Hea
ring
impa
irmen
t
Otit
is m
edia
Tem
pora
l lob
e ne
cros
is
Oth
er to
xici
ties
7 0 5
13
--
acut
e
9 11
1 6 0 --
--
23
--
39
--
--
--
21 (
g. II
-III)
--
2 (g
. I)
2 C
arot
id p
seud
oane
urys
m
(g.
IV)
22
4 31
25
--
Acu
te
L
ate
47 (
g. II
-III)
14
(g. I
I-III)
--
-
-
9 (g
. II-I
II)
--
1 (g
. I)
14 H
ypop
ituita
rism
3 H
ypot
hyro
idis
m
1 O
steo
radi
onec
rosi
s
--
--
47
15
1 Acu
te
Lat
e
39
1
0
0
5 (g
. IV
)
--
2 T
rism
us (
g. I)
1 C
hond
rone
cros
is (
g. II
I)
Tox
icity
gra
ding
acc
ordi
ng t
o C
TC
-V2.
0 an
d V
3.0,
an
d R
TO
G &
EO
RT
C t
oxic
ity c
riter
ia.
* In
the
se s
erie
s,
pres
ente
d do
ses
are
for
5% (
D5)
and
50%
(D
50)
of
orga
n vo
lum
es w
ith
seria
l and
par
alle
l str
uctu
res,
res
pect
ivel
y. N
PC
= n
asop
hary
ngea
l car
cino
ma,
T-M
= te
mpo
rom
andi
bula
r, g
= g
rade
of t
oxic
ity.
Radiotherapy with proton beams
The idea of using proton beams for medical treatments goes back to 1946 (48), and it was in 1954
that the first patient was treated with proton therapy at the Lawrence Berkeley Laboratory in
California, USA.
The physical characteristics of proton beams differ from those of photon beams. When proton
beams pass through tissue, they lose energy in atomic or nuclear interactions and slow down.
Because of the energy loss, their interaction with atomic electrons increases. Dose deposition in
the tissue takes place gradually until the end of the proton range, where the maximum interaction
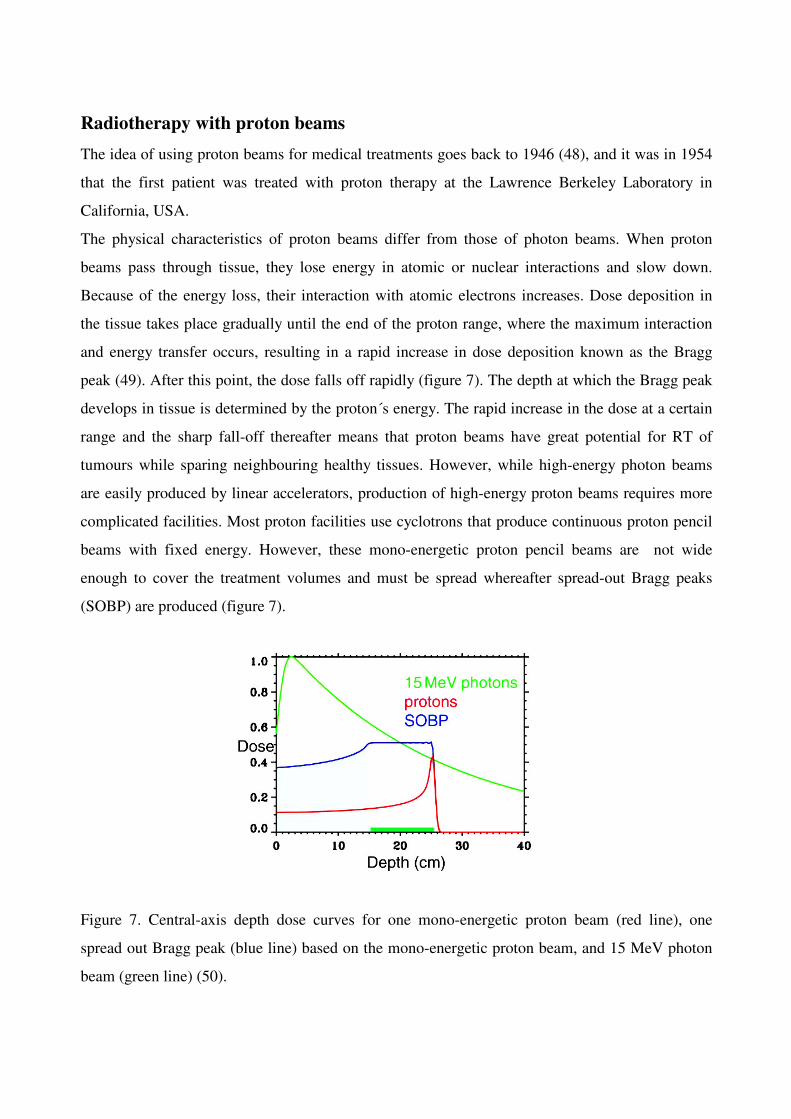
and energy transfer occurs, resulting in a rapid increase in dose deposition known as the Bragg
peak (49). After this point, the dose falls off rapidly (figure 7). The depth at which the Bragg peak
develops in tissue is determined by the proton´s energy. The rapid increase in the dose at a certain
range and the sharp fall-off thereafter means that proton beams have great potential for RT of
tumours while sparing neighbouring healthy tissues. However, while high-energy photon beams
are easily produced by linear accelerators, production of high-energy proton beams requires more
complicated facilities. Most proton facilities use cyclotrons that produce continuous proton pencil
beams with fixed energy. However, these mono-energetic proton pencil beams are not wide
enough to cover the treatment volumes and must be spread whereafter spread-out Bragg peaks
(SOBP) are produced (figure 7).
Figure 7. Central-axis depth dose curves for one mono-energetic proton beam (red line), one
spread out Bragg peak (blue line) based on the mono-energetic proton beam, and 15 MeV photon
beam (green line) (50).
28
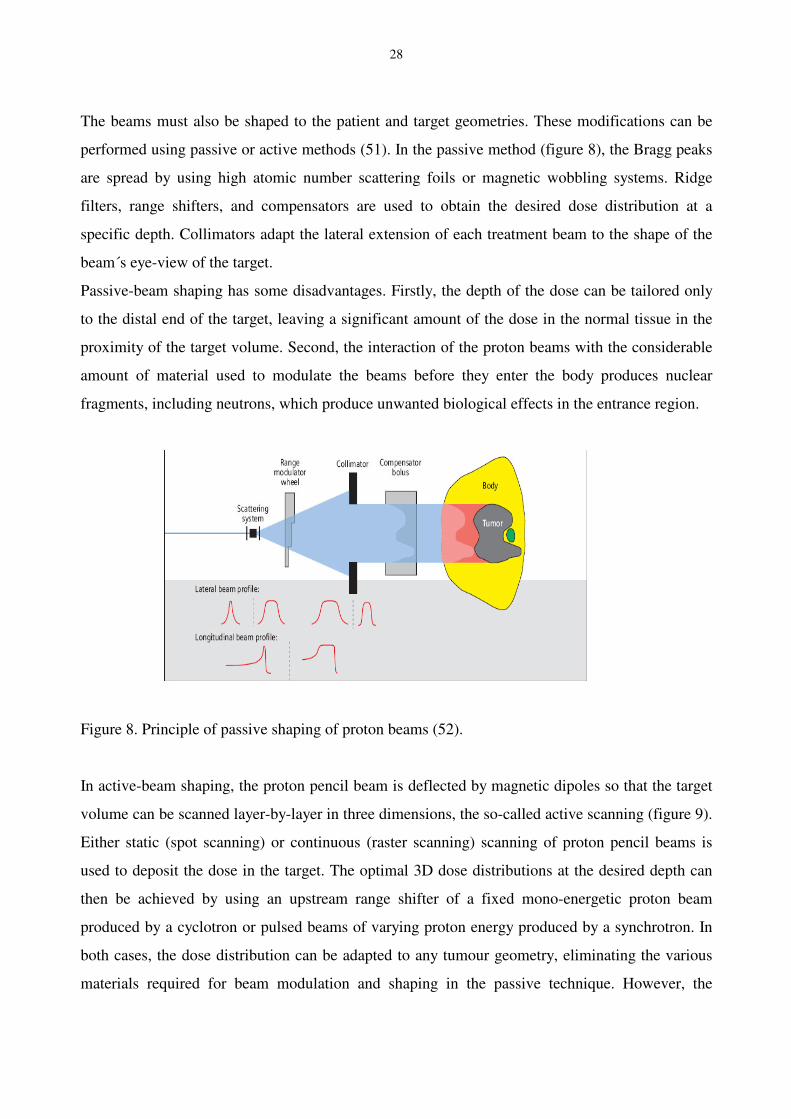
The beams must also be shaped to the patient and target geometries. These modifications can be
performed using passive or active methods (51). In the passive method (figure 8), the Bragg peaks
are spread by using high atomic number scattering foils or magnetic wobbling systems. Ridge
filters, range shifters, and compensators are used to obtain the desired dose distribution at a
specific depth. Collimators adapt the lateral extension of each treatment beam to the shape of the
beam´s eye-view of the target.
Passive-beam shaping has some disadvantages. Firstly, the depth of the dose can be tailored only
to the distal end of the target, leaving a significant amount of the dose in the normal tissue in the
proximity of the target volume. Second, the interaction of the proton beams with the considerable
amount of material used to modulate the beams before they enter the body produces nuclear
fragments, including neutrons, which produce unwanted biological effects in the entrance region.
Figure 8. Principle of passive shaping of proton beams (52).
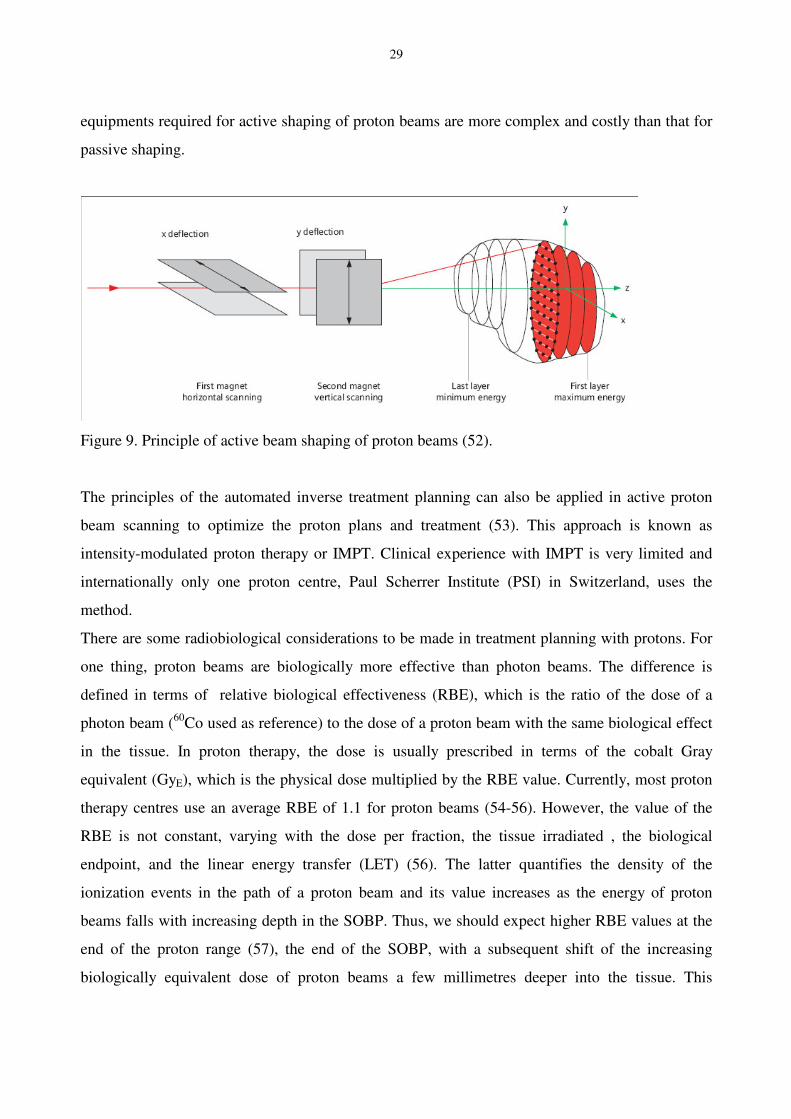
In active-beam shaping, the proton pencil beam is deflected by magnetic dipoles so that the target
volume can be scanned layer-by-layer in three dimensions, the so-called active scanning (figure 9).
Either static (spot scanning) or continuous (raster scanning) scanning of proton pencil beams is
used to deposit the dose in the target. The optimal 3D dose distributions at the desired depth can
then be achieved by using an upstream range shifter of a fixed mono-energetic proton beam
produced by a cyclotron or pulsed beams of varying proton energy produced by a synchrotron. In
both cases, the dose distribution can be adapted to any tumour geometry, eliminating the various
materials required for beam modulation and shaping in the passive technique. However, the
29
equipments required for active shaping of proton beams are more complex and costly than that for
passive shaping.
Figure 9. Principle of active beam shaping of proton beams (52).
The principles of the automated inverse treatment planning can also be applied in active proton
beam scanning to optimize the proton plans and treatment (53). This approach is known as
intensity-modulated proton therapy or IMPT. Clinical experience with IMPT is very limited and
internationally only one proton centre, Paul Scherrer Institute (PSI) in Switzerland, uses the
method.
There are some radiobiological considerations to be made in treatment planning with protons. For
one thing, proton beams are biologically more effective than photon beams. The difference is
defined in terms of relative biological effectiveness (RBE), which is the ratio of the dose of a
photon beam (60Co used as reference) to the dose of a proton beam with the same biological effect
in the tissue. In proton therapy, the dose is usually prescribed in terms of the cobalt Gray
equivalent (GyE), which is the physical dose multiplied by the RBE value. Currently, most proton
therapy centres use an average RBE of 1.1 for proton beams (54-56). However, the value of the
RBE is not constant, varying with the dose per fraction, the tissue irradiated , the biological
endpoint, and the linear energy transfer (LET) (56). The latter quantifies the density of the
ionization events in the path of a proton beam and its value increases as the energy of proton
beams falls with increasing depth in the SOBP. Thus, we should expect higher RBE values at the
end of the proton range (57), the end of the SOBP, with a subsequent shift of the increasing
biologically equivalent dose of proton beams a few millimetres deeper into the tissue. This
30
phenomenon demands cautious treatment planning with proton beams when radiosensitive OARs
are located in the close vicinity of target volumes receiving high absorbed doses. In these
situations, the beam directions are usually chosen in such a way as to avoid the distal edge of the
SOBP abutting critical OARs. For OARs that are located further away from the distal edge of
SOBP, the effect of rising RBE is balanced by the steep dose fall-off of the proton beams.
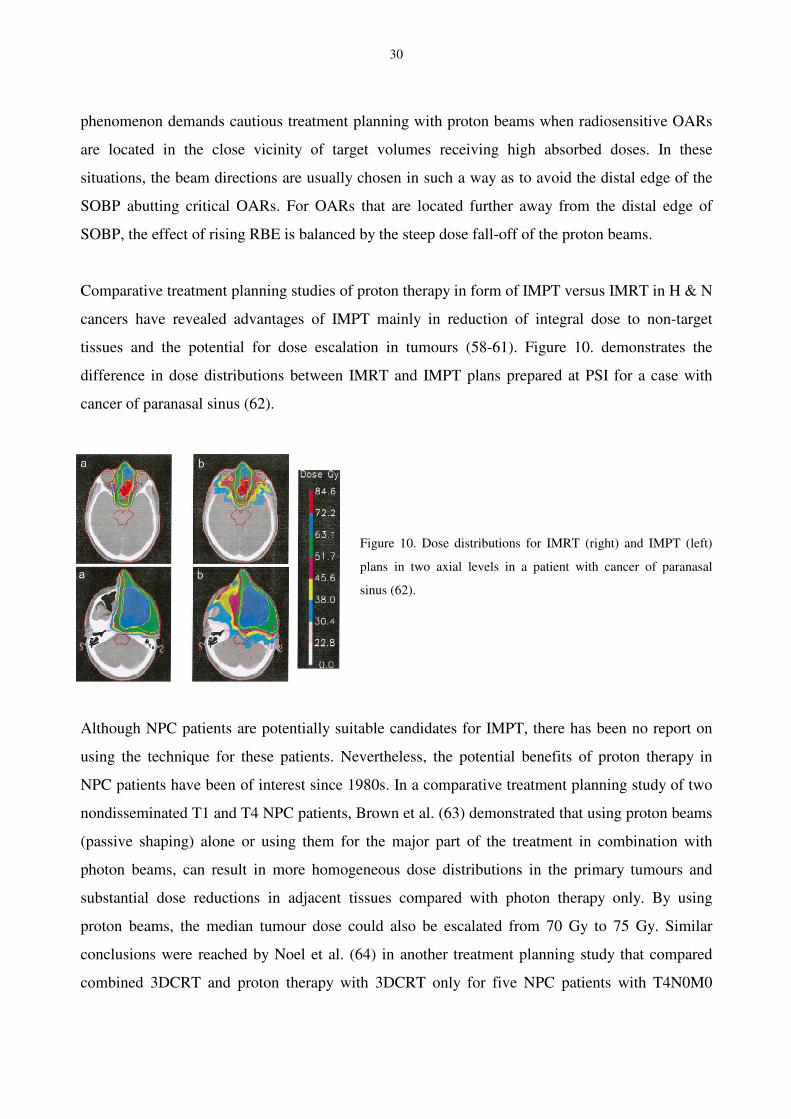
Comparative treatment planning studies of proton therapy in form of IMPT versus IMRT in H & N
cancers have revealed advantages of IMPT mainly in reduction of integral dose to non-target
tissues and the potential for dose escalation in tumours (58-61). Figure 10. demonstrates the
difference in dose distributions between IMRT and IMPT plans prepared at PSI for a case with
cancer of paranasal sinus (62).
Figure 10. Dose distributions for IMRT (right) and IMPT (left)
plans in two axial levels in a patient with cancer of paranasal
sinus (62).
Although NPC patients are potentially suitable candidates for IMPT, there has been no report on
using the technique for these patients. Nevertheless, the potential benefits of proton therapy in
NPC patients have been of interest since 1980s. In a comparative treatment planning study of two
nondisseminated T1 and T4 NPC patients, Brown et al. (63) demonstrated that using proton beams
(passive shaping) alone or using them for the major part of the treatment in combination with
photon beams, can result in more homogeneous dose distributions in the primary tumours and
substantial dose reductions in adjacent tissues compared with photon therapy only. By using
proton beams, the median tumour dose could also be escalated from 70 Gy to 75 Gy. Similar
conclusions were reached by Noel et al. (64) in another treatment planning study that compared
combined 3DCRT and proton therapy with 3DCRT only for five NPC patients with T4N0M0
31
tumours. Clinically, proton therapy has been used only for boost treatment of primary lesions or
local recurrence in NPC patients (63-65).
Intracavitary brachytherapy
In contrast to external irradiation with photon or proton beams, with intracavitary brachytherapy
(IBT) a radioactive source is positioned in the nasopharyngeal cavity. In this technique, the
radiation dose falls off rapidly from the radioactive source, delivering an intended dose to the
tumour but a much smaller dose to the surrounding tissue. Since position of the radioactive source
is dictated by the anatomy of the nasopharyngeal cavity and because of the rapid dose fall-off from
the source, IBT is not suitable for tumours of large volumes extending far beyond the
nasopharyngeal cavity.
There are different methods for positioning the radioactive source in the nasopharynx. Under local
or general anaesthesia, the source can be permanently implanted in the form of radioactive gold
grains, 198Au, or it can be placed in a custom-made mould before insertion into the nasopharynx.
With these techniques, radiation is delivered with a continuous low dose rate (LDR). The
disadvantages of these techniques are the necessary surgical intervention, the inconvenience for
the patient of having a mould in place for several days, and the inferior radiation safety for the
personnel.
Since the introduction of standardized applicators, it has become more common to use an
afterloading techniqe in which a radioactive source is automatically positioned in the applicator
after the latter has been put in place in the nasopharynx. With this technique, a higher dose is
delivered during a very short time, leading to it being known as the high dose rate (HDR)
technique. Delivery of the total dose can be divided into several sessions. Besides offering better
radiation protection for the personnel, this technique is more convenient for the patients since the
applicator can be removed between the irradiation sessions.
The role of IBT is only adjunctive to external RT for NPC patients and it is mainly used for dose
escalation in primary treatment of early stages of the disease. This can be done as upfront
treatment with a time break of 2-3 weeks after external irradiation in patients with complete
response or residual tumour. When HDR-IBT with doses of 18-24 Gy was added to mean external
RT dose of 61.2 Gy (2.5 Gy/fr) in T1-T2 NPC patients, Teo et al. found significant improvement
in 5-year local tumour control rates from 90% to 95% compared with patients who received
32
external RT only (20). However, the incidence of ulceration or necrosis in the nasopharynx for the
patients who received the combined treatment was also higher. In patients with persistent tumour
after external RT, complementary IBT can be an option for all T stages depending on the volume
of the residual tumour. In locally recurrent tumours, IBT has been used as the sole treatment or in
combination with external RT (27).
Side effects of radiotherapy
Survivors of NPC have impaired health-related quality of life (66). In addition to the acute side
effects of RT such as mucositis, many patients can suffer from permanent and long-term
complications due to the radiosensitivity of organs adjacent to the nasopharynx and neck nodes.
Moreover, combination of CHT with RT contributes further to the side effects which include
ototoxicity associated with ciplatin (67). The most frequently observed late complications after RT
is xerostomia reported in 90-100% of NPC patients treated with non-IMRT techniques (1, 9, 10,
68). Other common side effects include endocrinological dysfunctions, sensorineural and
conductive hearing impairment, chronic otitis of middle and external ears, tinnitus, trismus,
cervical soft tissue fibrosis, dysphagia, temporal lobe necrosis, cranial nerve palsies, and carotid
artery stenosis (1, 9, 10, 12, 68).
Follow-up
Follow-up for NPC patients includes routine periodic examination of the original tumour site and
neck, chest x-rays, MRI or CT scans, and blood work. Documentation of complete remission in
the nasopharynx and cervical lymphatics is important. It is often difficult to draw the line between
a slowly regressing tumour and a persistent tumour in the nasopharynx, but in most cases salvage
therapy should not be delayed more than 10 weeks after completion of primary treatment (12).
After documentation of complete remission, regular monitoring of the patients every 4 to 6 months
for up to 5 years is recommended (12, 69). These controls are focused on detection of locoregional
or distant relapse of the tumour and on RT-related side effects.
33
Comparative treatment planning studies in 3D radiotherapy; why they are
needed, and what parameters to consider?
The introduction of intensity-modulated irradiation with photon, proton, or other particle beam
therapies has been a major evolution in RT. Despite the global demand for implementation of new
irradiation techniques such as IMRT and IMPT, clinical experience of using them is very narrow
and their actual benefit for many tumour sites remains to be explored. The treatment planning
phase in RT provides an opportunity to partially investigate the clinical potentials of these
techniques without actually treating any patients.
Treatment planning studies provide information about the feasibility of certain RT techniques
when certain doses are prescribed for certain tumour sites. Evaluation of the dosimetric parameters
extracted from plans prepared for different RT techniques and incorporation of these data into
dose-response models of TCP and NTCP can give a radiobiological platform for ranking different
plans and techniques for any tumour site. It must be emphasized that the dosimetric or biological
superiority of any RT technique in a treatment planning study does not necessarily mean that it
will ultimately be feasible given the technical obstacles that may present during the actual delivery,
quality assurance, and verification of the treatment. Nor do these results necessarily translate into
any actual benefit for patients in terms of improved quality of life or survival. Nevertheless, a
treatment planning study can be of value when it comes to estimating the number of patients
eligible for a new RT technique and its expected costs. Comparative treatment planning studies
also provide an opportunity to optimize older RT techniques by comparing them with new ones
showing that good RT plans can still be prepared and delivered even when new RT techniques are
not available.
The first step in comparing RT plans is visual inspection. However, in order to quantify the quality
of each plan, certain physical or biological parameters must be used. For target volumes, the most
useful dose parameters are the mean (Dmean), minimum (Dmin) and maximum (Dmax) doses.
The average dose in the target volume is defined by Dmean, which optimally is the same as the
prescribed dose. Dose distributions within the target volumes are usually not homogeneous. Dmin
and Dmax are used to identify the dose in subvolumes of the target that receive much lower or
higher doses than the prescribed dose (the so-called cold or hot spots). Although Dmin and Dmax
can be defined as the absolute (single voxel) minimum and maximum doses in the target, it is
more common to define a clinically relevant volume for these parameters. In most studies, Dmin is
34
defined as the dose that is received by 95% or 99% of the target volume, and is thus sometimes
called D95 or D99. Similarly, Dmax is defined as the dose that is received by 5% or 1% of the
target volume, and can thus be presented as D5 or D1. The ratio of the difference between Dmax
and Dmin to Dmin (or Dmean) is called the inhomogeneity coefficient (IC) and reflects the
homogeneity of dose distribution within a target. Ideally, the desired ratio should be zero,
indicating that the whole target is covered by the prescribed dose with no cold or hot spots. In
practice, the IC values should be kept as low as possible. Treatment plans can also be evaluated
based on volume parameters such as V95 and V105, presenting the relative volumes of the target
that are covered by � 95% and � 105% of the prescribed dose. In a perfect plan, these values should
be 100% and 0%. The conformity index (CI) is used to evaluate the conformity of a plan. In the
basic concept, CI is the ratio of the absolute volume of the prescribed isodose in the whole body to
the volume of the PTV. Ideally, the value of CI should be unity. In many cases, the prescribed
isodose does not cover the target totally, and the value of the above equation can be misleading. To
circumvent this problem, one can use the absolute volume of the PTV that is covered by the
prescribed isodose instead of the PTV in the equation.
The degree of conformal avoidance in treatment plans for OARs can be measured by calculating
Dmean and Dmax for the organs. Commonly, Dmean is used for OARs with mainly parallel
structures (70), and Dmax is used for OARs with mainly serial structures (71).
The significance of the physical parameters derived for target volumes and OARs in any plan is
clearer if they can be translated into certain radiobiological effects such as TCP and NTCP.
Currently, these endpoints can be estimated using radiobiological models that incorporate the
available clinical data regarding the dose-volume characteristics of different tissues. Although
these are only statistical models that fit observed clinical data and their predictive reliability is yet
to be proven, they can be used to complement clinical experience in radiobiological ranking of
treatment plans.
The poisson model is most frequently used in calculating TCP (72). Generally, TCP models
assume that local control is achieved if all clonogenic cells are destroyed by radiation (71). With
Poisson statistics, the probability of that there are no surviving clonogens can be predicted by
knowing the initial number of clonogenic cells and the surviving fractions (SF) of these cells after
receiving a certain uniform dose. The surviving fraction for any tumour can be calculated from
linear-quadratic models if it´s radiobiological parameters of � and � , and � /� , are known. These
35
parameters can replace SF in TCP calculations. In a population with variable radiosensitivity, a
mean � value and its standard deviation (� ) are also needed. In order to calculate the TCP with
poisson statistics for non-uniform dose distribution in a tumour (as in clinical practice), the tumour
is approximated by many subvolumes that are small enough to receive a uniform dose but large
enough for the poisson statistics to be valid. This can be done by using differential DVHs that can
be extracted from treatment plans. Since the biological effect of variations in dose per fraction
within the tumour with high values of � /� is small, the � -term can be neglected in calculations. In
summary, by knowing the values of the mean � , � , � /� , and the initial clonogenic cell density and
by using differential DVHs, the TCP for the target volumes can be calculated and compared for
different plans. If required, the effect of accelerated tumour repopulation can also be incorporated
into these TCP calculations.
Due to the conceptual uncertainties in TCP modeling and their computational demands, a new
concept, the Equivalent uniform dose (EUD) has been introduced (73). The EUD is defined as the
dose that, when distributed uniformly across the target volume, can lead to the same biological
effect as the given non-uniform dose distribution. It has been shown that the EUD value is
bounded above by the Dmean and below by the Dmin. In highly homogeneous plans, the EUD
value is closer to the Dmean and in more heterogeneous plans, it is closer to the Dmin. The basic
parameters that are required for calculating the EUD for a specific tumour are volume fractions at
various dose levels (derived from DVHs) and SF at 2 Gy (SF2). In a way, the EUD is an
intermediate quantity between purely biological endpoints and physical parameters. The concept of
EUD is not limited to tumours and it can also be applied to normal tissues, in the so-called
generalized EUD (70).
Among radiobiological models for NTCP calculations, the Lyman-Kutcher-Burman (LKB) model
is commonly used (74-76). This model describes the sigmoidal dose-response curve of normal
tissues and predicts the probability of complications in a partially uniformly irradiated organ. Since
in most situations organs are irradiated nonuniformly, a reduction scheme is incorporated in this
model to reduce a DVH to a reference dose delivered to an effective fractional volume (75). This
can be done by using differential DVHs. The LKB model has three parameters: D50, m, and n. D50
represents the dose at which there is a 50% chance of complication when the whole organ is
uniformly irradiated; m controls the slope of the dose-response curve at D50, the steepest part of
the curve; and n determines the dose-volume dependence of a tissue and thus accounts for

36
differences in tissue architecture (higher values correspond to a more parallel architecture). These
three parameters are tabulated for different organs and specific endpoints, originally based on the
clinical tolerance data published by Emami et al. (77). However for some organs, recent studies of
3D dose distribution and best-fit analysis of clinical data have given different values for these
parameters (78, 79).
37
MATERIALS AND METHODS
The description of materials and methods for papers I and IV is done separately from papers II and
III due to major differences in their constructions.
Paper I and IV:
Study population
From 1991-2002, a total number of 81 patients diagnosed with NPC were registered at the JK,
Sahlgrenska University Hospital and the Oncology Centre (OC) for the Västra Götaland health
region. Twelve of these patients had tumour histologies other than SCCs. These included 4
rhabdomyosarcoma, 3 plasmocytoma, 2 malignant melanoma, and 3 others. Seven patients had
been referred to JK from other regions for IBT in primary treatment of the disease or because of
local relapse. Five patients from the southern part of the Västra Götaland health region were
referred to the Department of Oncology in Lund for therapy. Three patients established contacts
with JK only for consultation or check-ups. During this period, one patient who had been treated at
JK before 1991 required re-treatment for a local relapse. No data could be found for a patient who
was registered at OC only. In total, 52 patients with a diagnosis of SCC of NPC were referred to
JK for primary treatment during the chosen period and were included in the first study. Of these,
two patients were excluded from treatment and outcome analysis due to refusal of treatment or
early interruption of treatment. One of the remaining 50 patients had M+ disease at diagnosis, but
received neoadjuvant CHT and radical dose of external RT locoregionally. This patient lived 17
months after treatment and was therefore included for evaluation of therapy-related side effects.
However, he was excluded from the survival analysis. We chose 1991 as the starting year for the
study since from this year on, 3DCRT was introduced for all NPC patients at JK. We intended to
allow for a minimum of two years for follow-up of the patients. Since data collection and
registration started in 2004, the end of 2002 was set as the final date for the patients to be included.
For the research reported in paper IV, an attempt was made to retrieve original biopsy materials for
all SCC NPC patients registered at JK during this period. Forty-five patients had both adequate
material for analysis of biomarkers (45 for LMP1 and 44 for Ki-67, cyclin-B1, and EGFR) and had
received therapy with curative intent, and so these were selected. All but three of these patients
were also included in the first study.
38
Patient workup
In the Västra Götaland health region, it is recommended that all newly diagnosed patients with H
& N cancers be referred to a multidisciplinary conference held weekly at Sahlgrenska University
Hospital. At these conferences, patients are evaluated by oncologists, H & N-, dental-, and plastic
surgeons, radiologists, pathologists, and nutritionists in order to decide on the optimal treatment
strategy. The baseline workup of the patients for tumour staging and therapy recommendations
includes a complete medical history, physical examination, review of biopsy materials, fibreoptic
endoscopy of the upper aerodigestive tract, CT and/or MRI of whole H & N region, chest x-rays
and blood profiles. Complementary examinations such as bone scintography or chest and
abdominal CT scans are only performed when clinically indicated. Recently, detection of the EBV
genome in biopsy materials is also recommended.
Treatment policy
The principal modality in primary treatment of all nondessiminated NPC patients at the JK is
radical external RT. Prior to the introduction of IMRT, all NPC patients were also offered IBT
after termination of the external RT in order to enhance the dose to at least some part of the
primary tumour. Chemotherapy is reserved for patients with locoregionally advanced tumours.
Chemotherapy
Paper I:
Chemotherapy was delivered to 36 patients, all with stages � IIb. Neoadjuvant CHT, mainly with a
combination of cisplatin and 5FU, was delivered in one to three courses every third week to 33
patients. The objectives for using neoadjuvant CHT were to reduce the risk of distant metastasis
and to shrink the primary tumour before external RT, thereby increasing the safety margin between
the bulk of the tumour and the intended target volume. The latter could theoretically improve the
probability of local tumour control. Three patients were accrued in the phase I trial involving
administration of Tegafur-Uracil (UFT) and leucovorin concomitant with hyperfractionated
accelerated RT (HART) in advanced H & N cancer, and so they did not receive neoadjuvant CHT.
Chemotherapy was avoided in nine patients with stage II-IV disease due to advanced age,
compromised performance status, and pretreatment noise-induced hearing loss. The dose or type
of CHT agent, or the number of planned courses, was modified in 17 patients who received
39
neoadjuvant CHT due to the side effects or pretreatment conditions such as advanced age, hearing
impairment, and cardiac morbidity.
Paper IV:
Chemotherapy was delivered to 32 patients mainly with neoadjuvant approach (29 patients).
Majority of the patients received combination of cisplatin and 5FU delivered in one to three
courses every third week. Three patients received UFT/leucovorin concomitant with RT.
Radiotherapy
Before treatment planning for external RT, the craniocervical part of each patient was immobilized
with perspex shells or thermoplastic masks and headrests. Then, planning CT scans of the H & N
region were acquired in treatment position. After delineation of the GTV of the primary tumour
(GTV-T) and lymph node metastases (GTV-N), a margin of 1.5-2 cm with some modifications
was added to these GTVs to construct PTV-Ts. PTV-N was delineated for the adjuvant volume of
cervical lymph node stations and included bilateral lymph node levels of II to V, including medial
parts of supraclavicular fossae.
External RT was planned and delivered in 2 to 3 phases with 3DCRT technique. For the first
phase, two lateral opposed photon beams were used for the nasopharynx and upper neck. In cases
where the nasal cavity was also involved, one or two heavy fluenced anterior beams were also
added. At the level of the upper larynx, the above fields were matched to one anterior or two AP-
PA photon beams covering the lower neck. In most cases, the spinal cord and larynx were
shielded. The subsequent phases were off-cord treatments and were planned individually for each
patient using photon and electron beams covering PTV-Ts. The doses for PTVs were prescribed at
the reference point recommended by ICRU-50/62 (32), aiming for dose homogeneity within -5%
and +7% of the prescribed dose.
Paper I:
For 32 patients, external irradiation was delivered as a split course HART, 1.7 Gy/fr twice a day
(with minimum of 6-hour interval), five days a week. PTV-T of the primary tumour and lymph
node metastases received a median dose of 61.2 Gy (range, 35.7-64.9 Gy) and 64.6 Gy (range,
35.7-68 Gy), respectively and PTV-N received 40.8 Gy. The median OTT was 33 days (range, 30-
40
38 days) including a mid-course break of 5-12 days (median, 9 days) planned at 34 Gy. Two
patients received a subtotal treatment of 56.1 Gy and 35.7 Gy due to previous RT of H & N region
and treatment refusal, respectively.
For 18 patients, external RT was given conventionally (CRT) with 2 Gy/fr, once a day, and 5 days
a week. The prescribed doses for PTV-Ts of primary tumour and lymph node metastases were 54-
68 Gy (median, 66 Gy) and 58-68 Gy (median, 66 Gy), respectively. PTV-N received 50 Gy. The
median OTT for these patients was 46 days (range, 37-62 days). In four patients, CRT was
converted to hyperfractionated treatment of 2 Gy x 2 for the PTV-T of the primary tumour in the
last phase of the treatment.
The rationale behind using HART was to reduce the time for accelerated repopulation of tumours
by reducing the OTT. This approach has been shown to be beneficial for local control of H & N
cancers (80-82). The splitting of the daily dose by the hyperfractionation scheme in HART, gives a
lower dose per fraction to normal tissues, which are more sensitive than tumour cells to the
fractionation dose. The minimum 6-hour interval between the daily fractions also allows for repair
of sublethal damage in normal tissues. The time break in the split course schedule is intended for
the recovery of acute reactions in mucosa (83). Since HART is associated with higher rates of
acute side effects (82), the treatment is usually avoided in elderly. In the cohort of patients in paper
I, the median ages in the HART and CRT groups were 54 and 70 years, respectively. In the early
1990s and early 2000s, relatively more patients were treated by CRT. The reason was the general
implementation of HART for H & N cancer patients at JK between these two periods. However,
reports of the increased risk of side effects with HART, and especially temporal lobe necrosis in
NPC patients (10), led to CRT again being recommended for these patients.
Forty patients received IBT, with a median gap of 15 days after termination of external RT. The
distribution of T stages among these patients was as follows; T1 in 13, T2a in four, T2b in seven,
T3 in eight and T4 in another eight patients. Advanced age, technical difficulties, patient refusal,
inadequate dose, or early death after external RT and M+ disease were among the reasons that IBT
was not delivered in remaining 10 patients. Up to 1994, this treatment was delivered to eight
patients using the LDR technique. Thereafter, IBT was delivered to the remaining 32 patients
using HDR technique with a standard applicator. In both techniques, 192Ir was used as the
irradiation source. For delivery of IBT with the LDR technique, a custom-made mould or
commercial applicator (Nucletron®) was used. The prescribed dose ranged between 7-12 Gy. In
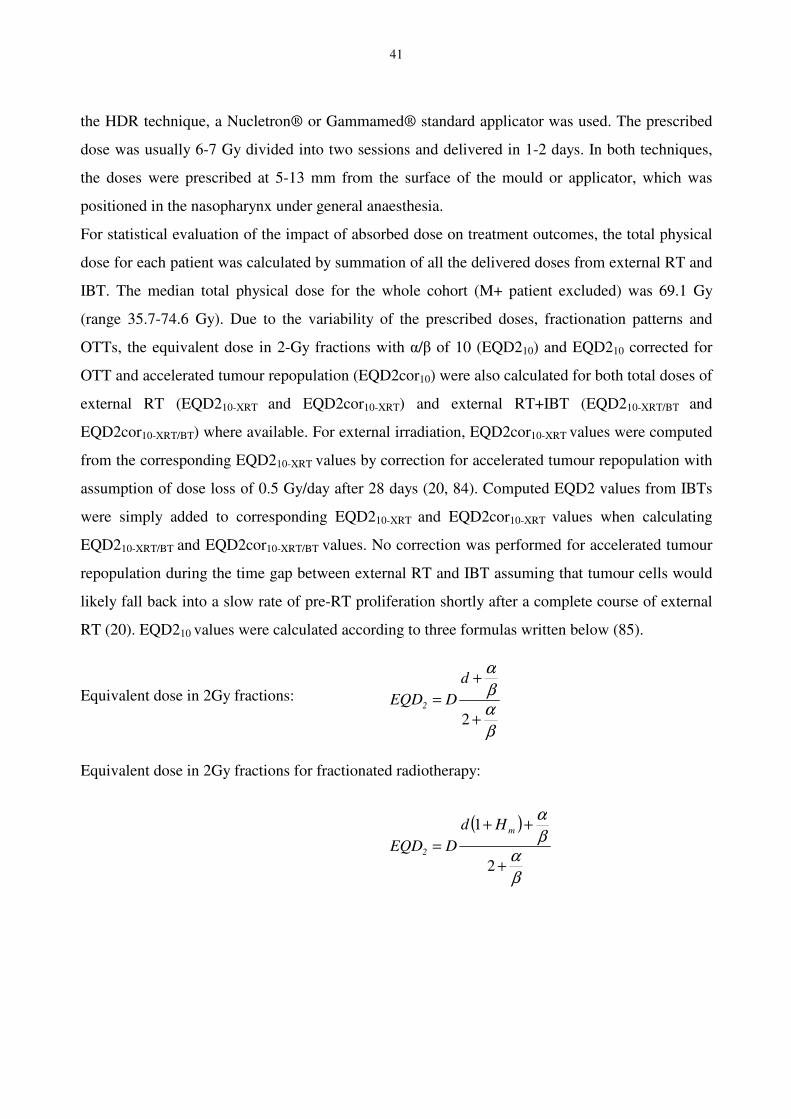
41
the HDR technique, a Nucletron® or Gammamed® standard applicator was used. The prescribed
dose was usually 6-7 Gy divided into two sessions and delivered in 1-2 days. In both techniques,
the doses were prescribed at 5-13 mm from the surface of the mould or applicator, which was
positioned in the nasopharynx under general anaesthesia.
For statistical evaluation of the impact of absorbed dose on treatment outcomes, the total physical
dose for each patient was calculated by summation of all the delivered doses from external RT and
IBT. The median total physical dose for the whole cohort (M+ patient excluded) was 69.1 Gy
(range 35.7-74.6 Gy). Due to the variability of the prescribed doses, fractionation patterns and
OTTs, the equivalent dose in 2-Gy fractions with � /� of 10 (EQD210) and EQD210 corrected for
OTT and accelerated tumour repopulation (EQD2cor10) were also calculated for both total doses of
external RT (EQD210-XRT and EQD2cor10-XRT) and external RT+IBT (EQD210-XRT/BT and
EQD2cor10-XRT/BT) where available. For external irradiation, EQD2cor10-XRT values were computed
from the corresponding EQD210-XRT values by correction for accelerated tumour repopulation with
assumption of dose loss of 0.5 Gy/day after 28 days (20, 84). Computed EQD2 values from IBTs
were simply added to corresponding EQD210-XRT and EQD2cor10-XRT values when calculating
EQD210-XRT/BT and EQD2cor10-XRT/BT values. No correction was performed for accelerated tumour
repopulation during the time gap between external RT and IBT assuming that tumour cells would
likely fall back into a slow rate of pre-RT proliferation shortly after a complete course of external
RT (20). EQD210 values were calculated according to three formulas written below (85).
Equivalent dose in 2Gy fractions:
Equivalent dose in 2Gy fractions for fractionated radiotherapy:
baba
+
+=
2
dDEQD2
( )
ba
ba
+
++=
2
1 m
2
HdDEQD
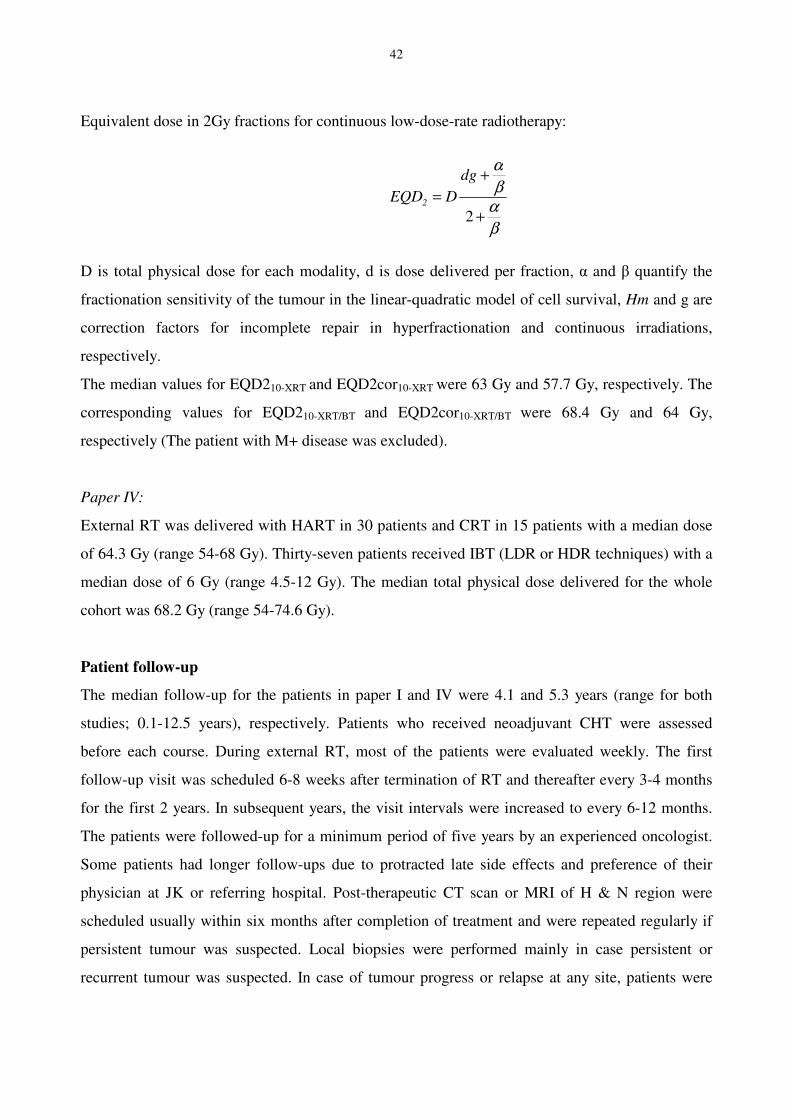
42
Equivalent dose in 2Gy fractions for continuous low-dose-rate radiotherapy:
D is total physical dose for each modality, d is dose delivered per fraction, � and � quantify the
fractionation sensitivity of the tumour in the linear-quadratic model of cell survival, Hm and g are
correction factors for incomplete repair in hyperfractionation and continuous irradiations,
respectively.
The median values for EQD210-XRT and EQD2cor10-XRT were 63 Gy and 57.7 Gy, respectively. The
corresponding values for EQD210-XRT/BT and EQD2cor10-XRT/BT were 68.4 Gy and 64 Gy,
respectively (The patient with M+ disease was excluded).
Paper IV:
External RT was delivered with HART in 30 patients and CRT in 15 patients with a median dose
of 64.3 Gy (range 54-68 Gy). Thirty-seven patients received IBT (LDR or HDR techniques) with a
median dose of 6 Gy (range 4.5-12 Gy). The median total physical dose delivered for the whole
cohort was 68.2 Gy (range 54-74.6 Gy).
Patient follow-up
The median follow-up for the patients in paper I and IV were 4.1 and 5.3 years (range for both
studies; 0.1-12.5 years), respectively. Patients who received neoadjuvant CHT were assessed
before each course. During external RT, most of the patients were evaluated weekly. The first
follow-up visit was scheduled 6-8 weeks after termination of RT and thereafter every 3-4 months
for the first 2 years. In subsequent years, the visit intervals were increased to every 6-12 months.
The patients were followed-up for a minimum period of five years by an experienced oncologist.
Some patients had longer follow-ups due to protracted late side effects and preference of their
physician at JK or referring hospital. Post-therapeutic CT scan or MRI of H & N region were
scheduled usually within six months after completion of treatment and were repeated regularly if
persistent tumour was suspected. Local biopsies were performed mainly in case persistent or
recurrent tumour was suspected. In case of tumour progress or relapse at any site, patients were
baba
+
+=
2
dgDEQD2
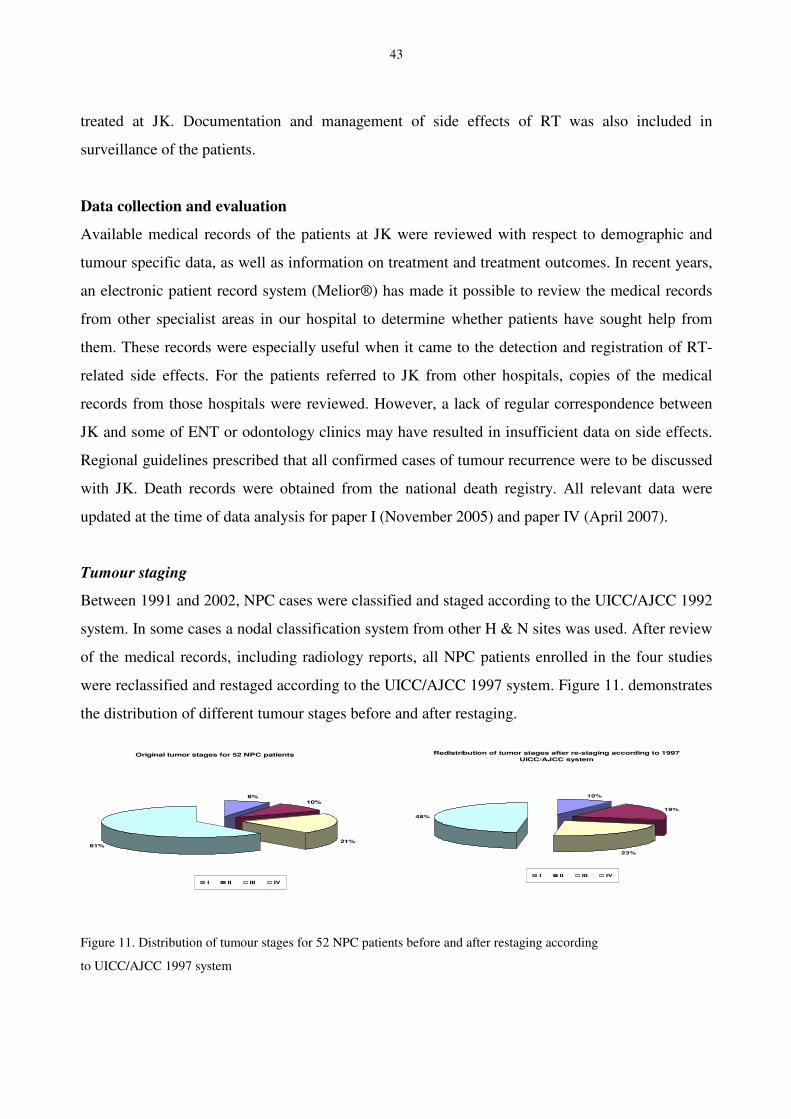
43
treated at JK. Documentation and management of side effects of RT was also included in
surveillance of the patients.
Data collection and evaluation
Available medical records of the patients at JK were reviewed with respect to demographic and
tumour specific data, as well as information on treatment and treatment outcomes. In recent years,
an electronic patient record system (Melior®) has made it possible to review the medical records
from other specialist areas in our hospital to determine whether patients have sought help from
them. These records were especially useful when it came to the detection and registration of RT-
related side effects. For the patients referred to JK from other hospitals, copies of the medical
records from those hospitals were reviewed. However, a lack of regular correspondence between
JK and some of ENT or odontology clinics may have resulted in insufficient data on side effects.
Regional guidelines prescribed that all confirmed cases of tumour recurrence were to be discussed
with JK. Death records were obtained from the national death registry. All relevant data were
updated at the time of data analysis for paper I (November 2005) and paper IV (April 2007).
Tumour staging
Between 1991 and 2002, NPC cases were classified and staged according to the UICC/AJCC 1992
system. In some cases a nodal classification system from other H & N sites was used. After review
of the medical records, including radiology reports, all NPC patients enrolled in the four studies
were reclassified and restaged according to the UICC/AJCC 1997 system. Figure 11. demonstrates
the distribution of different tumour stages before and after restaging.
Figure 11. Distribution of tumour stages for 52 NPC patients before and after restaging according
to UICC/AJCC 1997 system
Original tumor stages for 52 NPC patients
8%10%
21%61%
I II III IV
Redistribution of tumor stages after re-staging acc ording to 1997 UICC/AJCC system
10%
19%
23%
48%
I II III IV
44
Histology
Histologically, tumours were also reclassified in terms of the three WHO types (11). In paper I,
this reclassification was based on pathology reports. Well- and moderately well-differentiated
SCCs were regarded as WHO type I, and poorly differentiated SCCs (including transitional cell
carcinomas) and undifferentiated carcinomas (including spindle cell carcinomas) were categorized
as WHO type II and III, respectively. For statistical analysis, tumours were divided into two
groups, WHO type I and WHO types II-III. In paper IV, all tumour biopsies were re-evaluated by
an experienced pathologist (B.M.) partly for a precise histopathological classification of these
according to WHO, and partly for verification of the quality of the samples for
immunohistochemical (IHC) analysis. In this study, only two patients had a WHO type I tumour.
Hence, for statistical analysis, we decided to divide the patients into two groups of WHO type I-II
and WHO type III tumours.
Treatment-related toxicity
The treatment-related toxicities reported in paper I, were based on the available data in medical
records of the whole cohort, and telephone interviews with the living patients. Maximum grade of
toxicity was documented for each patient and site. Grade of xerostomia was also recorded from the
last follow-up visits or telephone interviews with patients. All acute and late toxicities were graded
according to Common Terminology Criteria For Adverse Events, version 3.0 (CTCAE v3.0) (86)
except for xerostomia, trismus and tinnitus, which were graded according to LENT-SOMA
grading scale (87). Tables 4 and 5 show the grading scales for majority of the side effects
according to the two systems. Because of the missing data for some patients or sites, the results
reported in paper I should be considered as minimum crude toxicity rates.
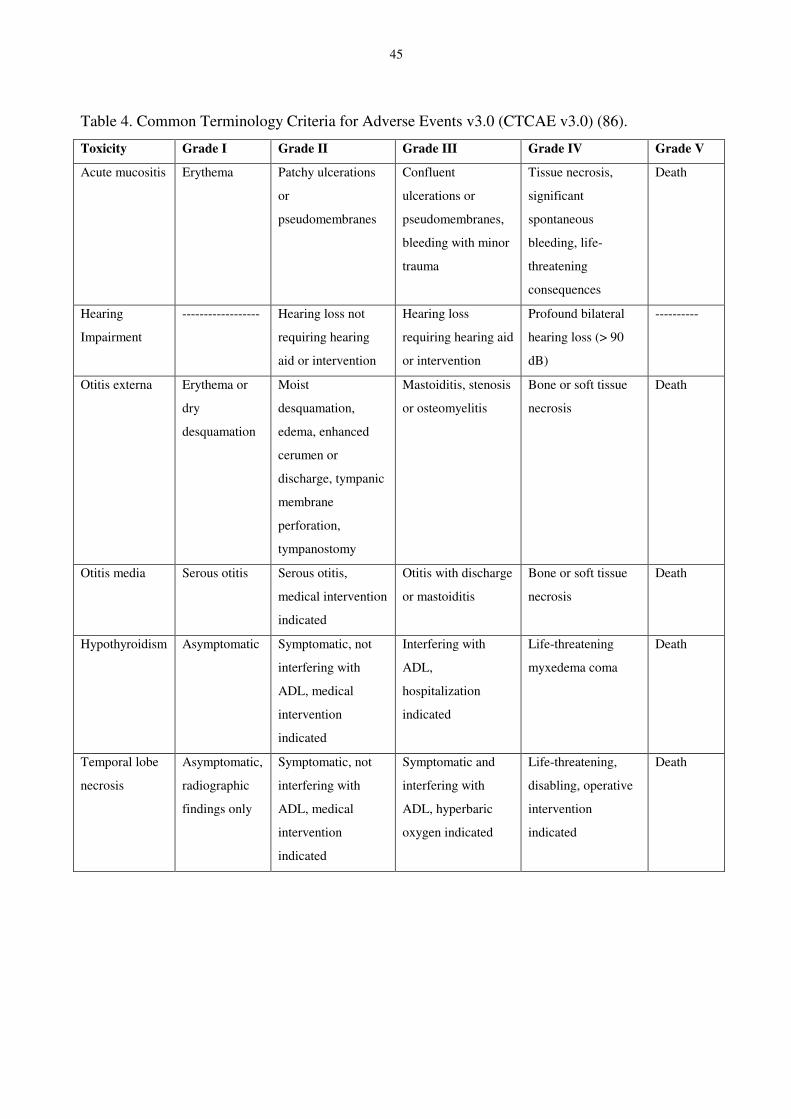
45
Table 4. Common Terminology Criteria for Adverse Events v3.0 (CTCAE v3.0) (86).
Toxicity Grade I Grade II Grade III Grade IV Grade V
Acute mucositis Erythema Patchy ulcerations
or
pseudomembranes
Confluent
ulcerations or
pseudomembranes,
bleeding with minor
trauma
Tissue necrosis,
significant
spontaneous
bleeding, life-
threatening
consequences
Death
Hearing
Impairment
------------------ Hearing loss not
requiring hearing
aid or intervention
Hearing loss
requiring hearing aid
or intervention
Profound bilateral
hearing loss (> 90
dB)
----------
Otitis externa Erythema or
dry
desquamation
Moist
desquamation,
edema, enhanced
cerumen or
discharge, tympanic
membrane
perforation,
tympanostomy
Mastoiditis, stenosis
or osteomyelitis
Bone or soft tissue
necrosis
Death
Otitis media Serous otitis Serous otitis,
medical intervention
indicated
Otitis with discharge
or mastoiditis
Bone or soft tissue
necrosis
Death
Hypothyroidism Asymptomatic Symptomatic, not
interfering with
ADL, medical
intervention
indicated
Interfering with
ADL,
hospitalization
indicated
Life-threatening
myxedema coma
Death
Temporal lobe
necrosis
Asymptomatic,
radiographic
findings only
Symptomatic, not
interfering with
ADL, medical
intervention
indicated
Symptomatic and
interfering with
ADL, hyperbaric
oxygen indicated
Life-threatening,
disabling, operative
intervention
indicated
Death
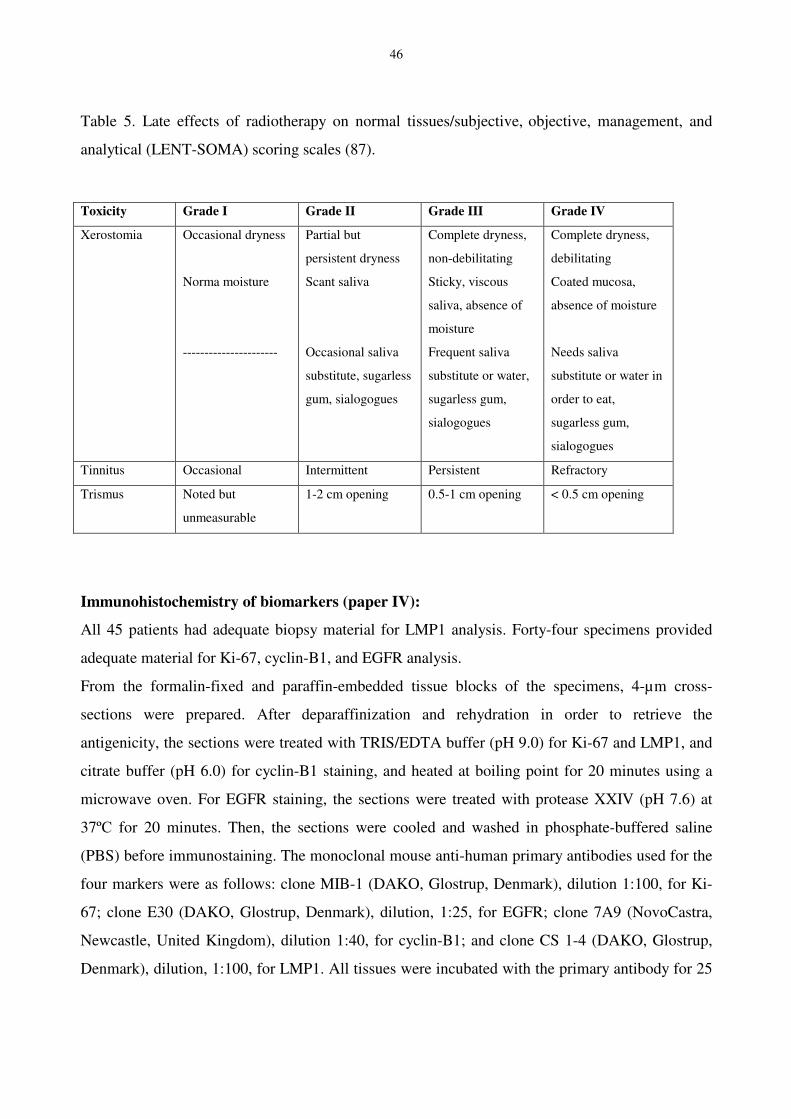
46
Table 5. Late effects of radiotherapy on normal tissues/subjective, objective, management, and
analytical (LENT-SOMA) scoring scales (87).
Immunohistochemistry of biomarkers (paper IV):
All 45 patients had adequate biopsy material for LMP1 analysis. Forty-four specimens provided
adequate material for Ki-67, cyclin-B1, and EGFR analysis.
From the formalin-fixed and paraffin-embedded tissue blocks of the specimens, 4-µm cross-
sections were prepared. After deparaffinization and rehydration in order to retrieve the
antigenicity, the sections were treated with TRIS/EDTA buffer (pH 9.0) for Ki-67 and LMP1, and
citrate buffer (pH 6.0) for cyclin-B1 staining, and heated at boiling point for 20 minutes using a
microwave oven. For EGFR staining, the sections were treated with protease XXIV (pH 7.6) at
37º� for 20 minutes. Then, the sections were cooled and washed in phosphate-buffered saline
(PBS) before immunostaining. The monoclonal mouse anti-human primary antibodies used for the
four markers were as follows: clone MIB-1 (DAKO, Glostrup, Denmark), dilution 1:100, for Ki-
67; clone E30 (DAKO, Glostrup, Denmark), dilution, 1:25, for EGFR; clone 7A9 (NovoCastra,
Newcastle, United Kingdom), dilution 1:40, for cyclin-B1; and clone CS 1-4 (DAKO, Glostrup,
Denmark), dilution, 1:100, for LMP1. All tissues were incubated with the primary antibody for 25
Toxicity Grade I Grade II Grade III Grade IV
Xerostomia Occasional dryness
Norma moisture
----------------------
Partial but
persistent dryness
Scant saliva
Occasional saliva
substitute, sugarless
gum, sialogogues
Complete dryness,
non-debilitating
Sticky, viscous
saliva, absence of
moisture
Frequent saliva
substitute or water,
sugarless gum,
sialogogues
Complete dryness,
debilitating
Coated mucosa,
absence of moisture
Needs saliva
substitute or water in
order to eat,
sugarless gum,
sialogogues
Tinnitus Occasional Intermittent Persistent Refractory
Trismus Noted but
unmeasurable
1-2 cm opening 0.5-1 cm opening < 0.5 cm opening
47
minutes at room temperature. Endogenous peroxidase was blocked with PBS and nitrogen
peroxide, whereafter a dextran secondary antibody-peroxidase complex kit (DAKO En Vision)
employing the capillary gap staining technique with the automated TechMate 500 immunostaining
system was used. Diaminobenzidine was used to visualize the stained tissues. The sections were
counterstained with hematoxylin. The positive controls with known positive immunoreactivity
were tonsil cancer specimens for Ki-67 and cyclin-B1, basal cells of a dermal tissue for EGFR, and
EBV-infected human tissue for LMP1. Stainings without primary antibodies were used as negative
controls.
After IHC staining, the representative areas of the tumour tissue in each section were scanned by a
pathologist (B.M.) under low-power light microscopy (x 100). They were then scanned at x 250
magnification whereafter they were photographed with a digital camera (Leica DC 100; Leica,
Heerbrugg, Switzerland) for analysis on a computer screen. For most of the patients, at least two
separate fields were photographed and each field corresponded to an area of one mm2. In two
patients, only one field was available for evaluation due to a limited amount of tumour tissue. All
slides were scored based on the tumour population only. For more accurate analysis of the staining
of the cytoplasm or nucleus, all digital images of the fields were also transferred to Microsoft Paint
program and viewed with inverted colours. The analysis of the slides was performed independently
by two researchers (B.M. and Z.T.K.), both blinded to the clinical features and treatment
outcomes.
The Ki-67, cyclin-B1 and EGFR labeling indices (LIs) were defined as the percentage of tumour
cells expressing nuclear, nuclear/cytoplasmic, and membrane immunoreactivity, respectively.
Overexpression of Ki-67 was defined as a value greater than or equal to the median LI of the
population. A cutoff value of � 15% was set for cyclin-B1 overexpression, which almost
corresponded to its median LI in the whole series. For EGFR immunoractivity, both the extent and
the intensity of the staining were evaluated. EGFR overexpression was defined as EGFR
expression with an LI � 50%. The EGFR staining intensity was graded semi-quantitatively in four
groups, of none (0), weak (1), moderate (2), and strong (3), based on the intensity of the majority
of the stained cells. Due to nonhomogeneous staining in some specimens, and for more accurate
quantification of the EGFR staining, the digital images were also processed using Adobe
Photoshop 7.0 histograms (Adobe Systems, Inc., San Jose, CA, USA) whereafter mean
luminescence intensity (MLI) scores were determined for each image and patient. The
48
luminescence intensity scores could vary from 0 and 255 for each pixel of an image. Lower MLI
scores corresponded to more intensely stained specimens and higher scores were related to lighter
shades of staining.
LPM1 positivity was considered when immunoreactivity was displayed in the membrane,
cytoplasm, or, in some cases, the nuclear components of the tumour cells.
Paper II and III:
Study population
For these two comparative treatment planning studies, we chose eight NPC patients randomly
from the historical material, independent of the time for their actual treatment. The only clinical
criteria for selection of these patients were equal presentation of every T stage, variation of the
nodal stage from N0 to N3b in the whole cohort, and that they had adequate radiological
examinations in the initial workup. The original therapeutic CT scans of the patients were used for
all treatment plannings. Therapeutic CT scans for RT planning at JK were 7 mm in thickness.
However, after 2002, JK decided to acquire CT scans with 5 mm thickness for H & N cancer
patients. Since the geometric information and thus dose calculation is more accurate when CT
slices are thinner, we decided to include NPC patients with 5 mm CT slices when available.
Hence, three of the patients in these two studies were registered at JK after 2002. The TNM stages
for the cohort were; T1N0M0; T1N1M0; T2aN3aM0; T2bN3bM0; T3N2M0; T3N3bM0; T4N1M0;
T4N2M0.
Definition of target volumes and OARs
All volumes in paper II and III were delineated by the same radiation oncologist (Z.T.K.). In paper
II, Varian´s Eclipse™ treatment planning system was used for both delineation of volumes and
preparing all treatment plans. Gross tumour volumes of primary tumour (GTV-T) and all
macroscopic nodal metastases (GTV-N) were re-delineated on the original therapeutic CT slices
after reviewing the available clinical data including diagnostic CT and/or MRI. Three sets of CTVs
were defined for each patient. CTV-T comprised GTV-T without any margin. CTV-TN was
defined as the volume encompassing both GTV-T and GTV-N (when macroscopic nodal
metastases was presented), with a 10 mm margin in all directions; the whole of the nasopharynx
cavity was also included in this volume. CTV-N consisted of the volume of bilateral cervical
49
lymph node stations in levels Ib to V, medial supraclavicular fossae, retro/parapharyngeal spaces,
the posterior third of the nasal cavity and maxillary sinuses, inferior sphenoidal body, clivus, and
pterygoid fossae. The central volume of the neck from the level of the vocal cords caudally could
be excluded from any target volume since there was no evidence of tumour extension in this
region in any of the patients. In order to account for setup errors and patient movements, three sets
of PTVs (PTV-T, PTV-TN, and PTV-N) were also defined by adding a 5mm margin to each
corresponding CTV. All PTVs and CTV-TN were modified wherever they encountered neural
tissues or bony structures without evidence of tumour infiltration. Besides the standard OARs
(spinal cord, brainstem, temporal lobes, the optic apparatus and parotid glands), the inner and
middle/external ears, TM joints, pituitary and thyroid glands, larynx and mandible were all
delineated for each case.
For the purposes of study III, the treatment planning system, VIRTUOS, available at the German
Cancer Research Center (DKFZ), Heidelberg, Germany was used. Due to technical
incompatibilities between Eclipse and VIRTUOS, only original CT data sets with no structure
included could be transferred between the two systems. Hence, all the previously mentioned
volumes had to be re-delineated for each patient. Principally, all target volumes were defined the
same as in paper II. However, some modifications were introduced in paper III. PTV-T was
omitted in this study with assumption of stereotactical delivery of both IMRT and IMPT plans and
thereby reduced risk of set-up errors. The mean volumes for GTV-T, PTV-TN, and PTV-N in
paper III were 24.4 cc, 287.8 cc, and 450.3 cc, respectively. The mean values for the same targets
in paper II were, 23.5 cc, 322.6 cc, and 466.3 cc, respectively.
In delineation of OARs in paper III, oral cavity, skin, and cerebellum/posterior brain tissue up to
the level of the clinoids were also added for evaluation of dose distributions only. As hypopharynx
and upper esophagus are located in the close vicinity of larynx, these structures were delineated
altogether and named larynx/esophagus.
Dose prescriptions, dose-volume constraints, and treatment plannings:
In paper II, two sets of plans were prepared for each patient. One with SIB-IMRT technique
(referred as simultaneous integrated multi-target, SIMT-IMRT in the paper) and the other with
highly-optimised 3DCRT combined with IBT. In the IMRT plans, the prescribed mean doses for
PTV-T, PTV-TN, and PTV-N were 72.6 Gy, 66 Gy, and 52.8 Gy delivered simultaneously in 33
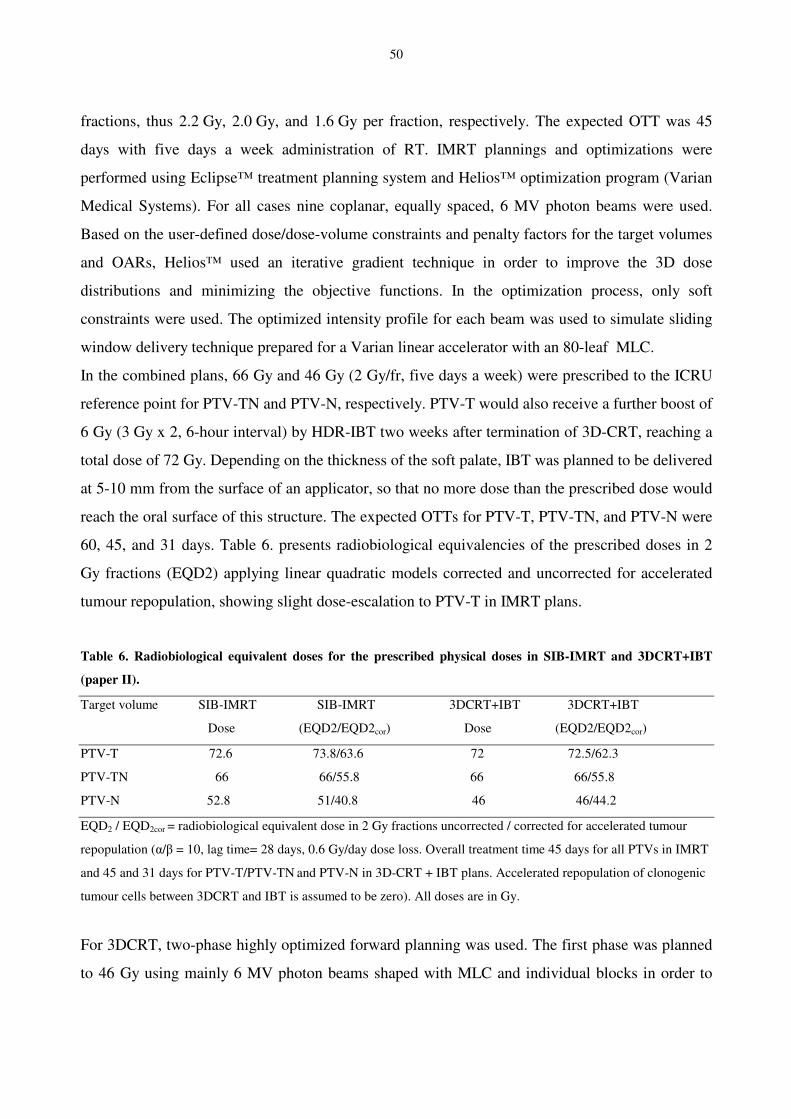
50
fractions, thus 2.2 Gy, 2.0 Gy, and 1.6 Gy per fraction, respectively. The expected OTT was 45
days with five days a week administration of RT. IMRT plannings and optimizations were
performed using Eclipse™ treatment planning system and Helios™ optimization program (Varian
Medical Systems). For all cases nine coplanar, equally spaced, 6 MV photon beams were used.
Based on the user-defined dose/dose-volume constraints and penalty factors for the target volumes
and OARs, Helios™ used an iterative gradient technique in order to improve the 3D dose
distributions and minimizing the objective functions. In the optimization process, only soft
constraints were used. The optimized intensity profile for each beam was used to simulate sliding
window delivery technique prepared for a Varian linear accelerator with an 80-leaf MLC.
In the combined plans, 66 Gy and 46 Gy (2 Gy/fr, five days a week) were prescribed to the ICRU
reference point for PTV-TN and PTV-N, respectively. PTV-T would also receive a further boost of
6 Gy (3 Gy x 2, 6-hour interval) by HDR-IBT two weeks after termination of 3D-CRT, reaching a
total dose of 72 Gy. Depending on the thickness of the soft palate, IBT was planned to be delivered
at 5-10 mm from the surface of an applicator, so that no more dose than the prescribed dose would
reach the oral surface of this structure. The expected OTTs for PTV-T, PTV-TN, and PTV-N were
60, 45, and 31 days. Table 6. presents radiobiological equivalencies of the prescribed doses in 2
Gy fractions (EQD2) applying linear quadratic models corrected and uncorrected for accelerated
tumour repopulation, showing slight dose-escalation to PTV-T in IMRT plans.
Table 6. Radiobiological equivalent doses for the prescribed physical doses in SIB-IMRT and 3DCRT+IBT
(paper II).
Target volume SIB-IMRT SIB-IMRT 3DCRT+IBT 3DCRT+IBT
Dose (EQD2/EQD2cor) Dose (EQD2/EQD2cor)
PTV-T 72.6 73.8/63.6 72 72.5/62.3
PTV-TN 66 66/55.8 66 66/55.8
PTV-N 52.8 51/40.8 46 46/44.2
EQD2 / EQD2cor = radiobiological equivalent dose in 2 Gy fractions uncorrected / corrected for accelerated tumour
repopulation (� /� = 10, lag time= 28 days, 0.6 Gy/day dose loss. Overall treatment time 45 days for all PTVs in IMRT
and 45 and 31 days for PTV-T/PTV-TN and PTV-N in 3D-CRT + IBT plans. Accelerated repopulation of clonogenic
tumour cells between 3DCRT and IBT is assumed to be zero). All doses are in Gy.
For 3DCRT, two-phase highly optimized forward planning was used. The first phase was planned
to 46 Gy using mainly 6 MV photon beams shaped with MLC and individual blocks in order to
51
obtain good dose conformity. In general, two laterally opposed beams covered the nasopharynx
and upper neck. The mid to lower neck was covered with two to four AP-PA beams with central
shielding from the level of the vocal cords extending caudally. Low fluenced beams with suitable
shapes were also added for plan optimization. The second phase was planned to 66 Gy, applying a
complex configuration of photon and electron beams. On average, 13 beams were used for each
3D-CRT plan in order to comply with the same dose-volume constraints as for IMRT plans.
The dose distributions from IBT sources were reconstructed on the same CT slices as used in
3DCRT treatment planning. Firstly, the actual IBT treatment data including source stopping
positions, dwell times, and orthogonal X-ray images were reviewed. Then, various distances from
source stopping positions to the bony structures surrounding nasopharynx cavity were measured on
the X-ray images that were used as reference for positioning the virtual applicators in CT slices.
The sum of calculated dose distributions from 3DCRT and IBT plans were then used for
comparison with IMRT plans.
In paper III, both SIB-IMRT and SIB-IMPT plans were prepared for each patient. Dose
prescriptions in cobalt Gray equivalent (GyE) to GTV-T, PTV-TN and PTV-N were 72.6 GyE, 66
GyE, and 52.8 GyE, respectively, to be delivered in 33 fractions, five days a week. In dose
prescriptions to the target volumes and OARs, an RBE of 1.1 to Co60 was assumed for the proton
beams. The prescribed doses were normalized to the median dose of the target volumes according
to the local guidelines at DKFZ. For preparation of IMRT and IMPT plans, the research version of
the inverse treatment planning system KonRad (DKFZ) integrated into the VIRTUOS planning
system was used. Optimisations of the plans were based on the same principles as described
earlier.
In IMRT plans, nine coplanar, equally spaced, 6 MV photon beams were used. The optimized
intensity profile for each beam was used to simulate a step-and-shoot delivery technique with a
Siemens linear accelerator equipped with MLC. For definition of the fluence map, five non-zero
intensity levels were chosen. On average, 132 segments were used for each IMRT plan.
In IMPT plans, three coplanar proton beams (0º, 45º, 315º or 0º, 60º, 300º) simulating 3D spot-
scanning technique were used. The lateral separation and depth modulation of proton pencil beams
were 5 and 3 mm, respectively. The initial Full Width at Half Maximum of the proton pencil
beams at the patient surface was set to 6 mm. On average, 24,734 spots (range; 15,812 – 39,156)
were used for each beam. During the inverse treatment planning, optimization of the relative
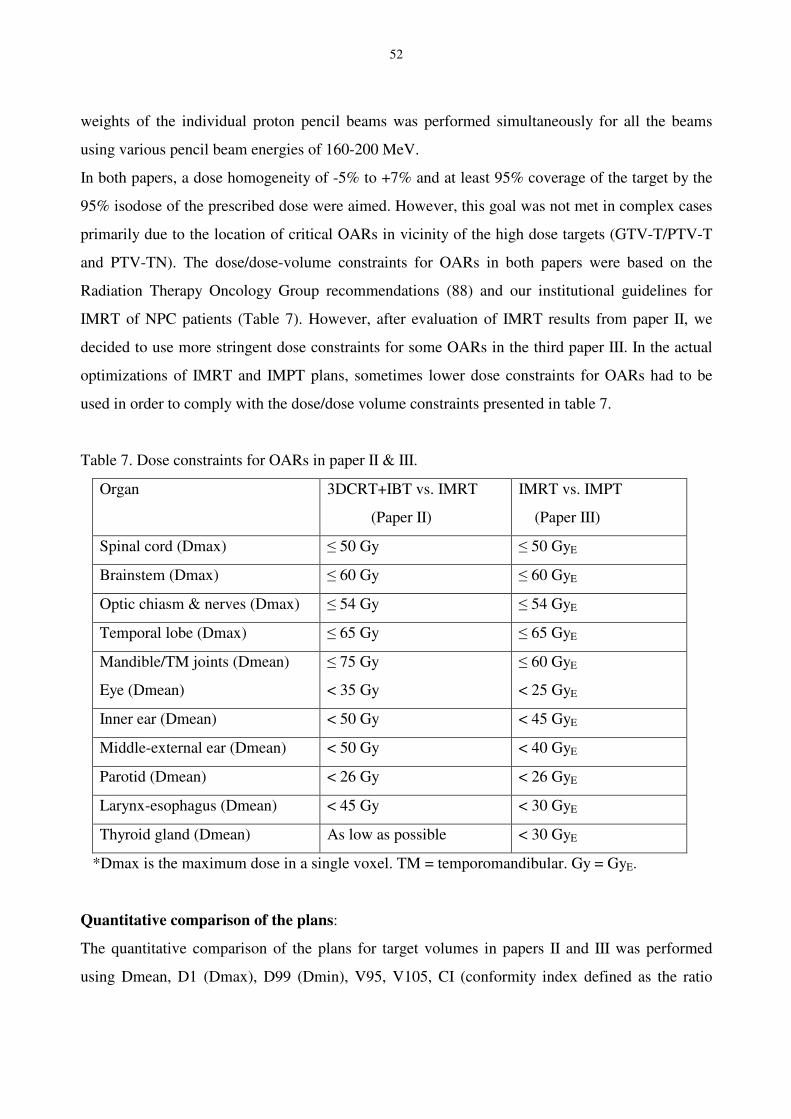
52
weights of the individual proton pencil beams was performed simultaneously for all the beams
using various pencil beam energies of 160-200 MeV.
In both papers, a dose homogeneity of -5% to +7% and at least 95% coverage of the target by the
95% isodose of the prescribed dose were aimed. However, this goal was not met in complex cases
primarily due to the location of critical OARs in vicinity of the high dose targets (GTV-T/PTV-T
and PTV-TN). The dose/dose-volume constraints for OARs in both papers were based on the
Radiation Therapy Oncology Group recommendations (88) and our institutional guidelines for
IMRT of NPC patients (Table 7). However, after evaluation of IMRT results from paper II, we
decided to use more stringent dose constraints for some OARs in the third paper III. In the actual
optimizations of IMRT and IMPT plans, sometimes lower dose constraints for OARs had to be
used in order to comply with the dose/dose volume constraints presented in table 7.
Table 7. Dose constraints for OARs in paper II & III.
Organ 3DCRT+IBT vs. IMRT
(Paper II)
IMRT vs. IMPT
(Paper III)
Spinal cord (Dmax) � 50 Gy � 50 GyE
Brainstem (Dmax) � 60 Gy � 60 GyE
Optic chiasm & nerves (Dmax) � 54 Gy � 54 GyE
Temporal lobe (Dmax) � 65 Gy � 65 GyE
Mandible/TM joints (Dmean)
Eye (Dmean)
� 75 Gy
< 35 Gy
� 60 GyE
< 25 GyE
Inner ear (Dmean) < 50 Gy < 45 GyE
Middle-external ear (Dmean) < 50 Gy < 40 GyE
Parotid (Dmean) < 26 Gy < 26 GyE
Larynx-esophagus (Dmean) < 45 Gy < 30 GyE
Thyroid gland (Dmean) As low as possible < 30 GyE
*Dmax is the maximum dose in a single voxel. TM = temporomandibular. Gy = GyE.
Quantitative comparison of the plans:
The quantitative comparison of the plans for target volumes in papers II and III was performed
using Dmean, D1 (Dmax), D99 (Dmin), V95, V105, CI (conformity index defined as the ratio
53
between the absolute values for V95 of the body and the V95 of the target). Since application of
IBT by itself introduced inhomogeneous dose distributions in the combined plans, we did not use
any inhomogeneity index for plan evaluations in paper II. In paper III, inhomogeneity coefficient
(IC) was defined as Dmax-Dmin/Dmin. In this study, all parameters for PTV-TN and PTV-N were
calculated for inclusive volumes of the targets due to the limitations of the VIRTUOS planning
system in calculating exclusive volumes.
Radiobiological comparison of the plans was performed only in paper II by using TCP, NTCP, and
EUD parameters. The extracted differential DVHs from the plans were used for estimation of TCP
and NTCP, using the Bioplan software package (72). TCP of primary tumour was estimated using
the volume of GTV-T and differential DVH of PTV-T. The rationale for selecting DVH of PTV-T
instead of GTV-T was the expected movement of GTV-T in the volume of PTV-T during the
external RT, due to patient movements and setup errors. The assumptions used for TCP
calculations were: a = 0.4 Gy-1, s = 0.09 Gy-1, a/b = 10 Gy, and homogenous clonogenic cell
density of 107 cells per cm3. Two parameters, TCP1 and TCP2, were used to denote estimates
uncorrected and corrected for the accelerated repopulation of the tumour cells after 28 days and
dose loss of 0.6 Gy/day (89). Compared with paper I, we chose to increase the daily compensating
dose for the accelerated repopulation of tumour cells in paper II. In paper I, we assumed an average
compensating dose of 0.5 Gy/day for a population of NPC patients with variable WHO type
histologies. This value was adapted from two previous reports on combined external irradiation
and IBT in NPC patients (20, 84). In the biological model that we used for TCP calculations in
paper II, tumour histology could not be incorporated as an independent variable. Therefore, we
adapted a compensating dose of 0.6 Gy/day as it has been suggested for H & N cancers in general
(89). For EUD calculations of PTV-T, SF2 value of 0.38 was computed based on the assumed
biological parameters and formula below.
SFd = exp (�� d � � d2)
For OAR comparisons, we used Dmax (single voxel) and Dmean for organs with mainly parallel
structures, and Dmax (single voxel) for those with mainly serial structures. The LKB model (74,
75) was used for prediction of NTCP values using parameters shown in table 8.
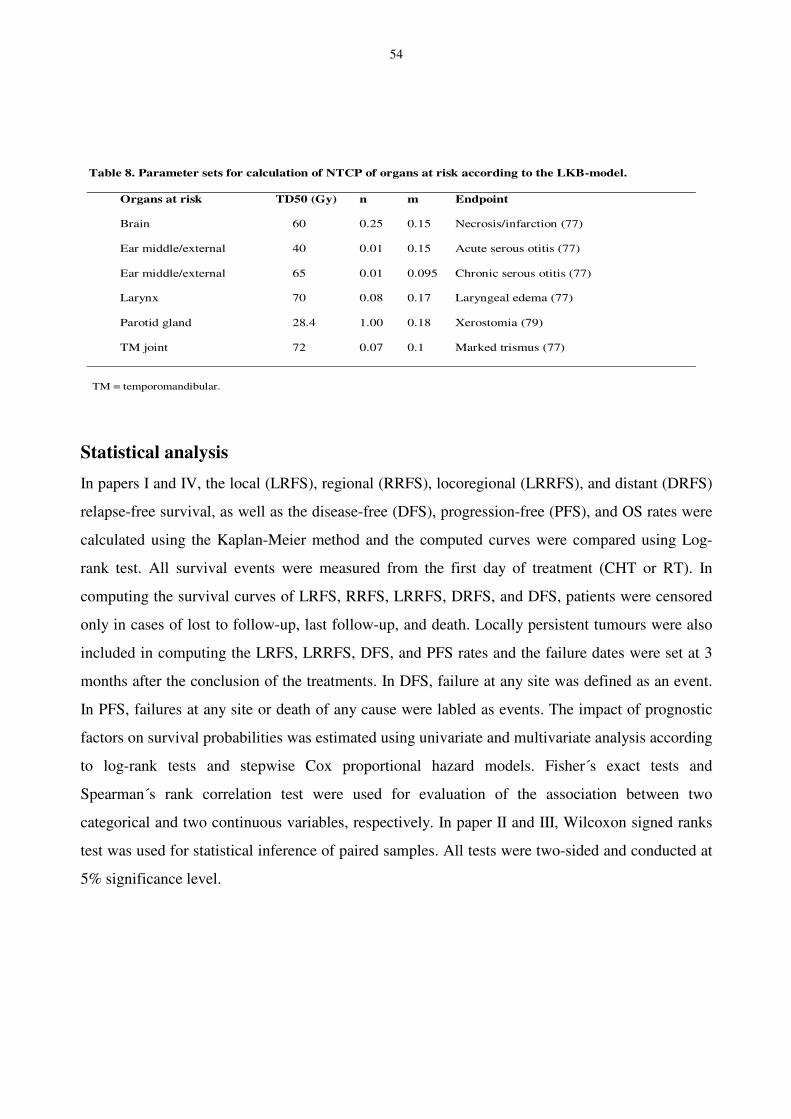
54
Statistical analysis
In papers I and IV, the local (LRFS), regional (RRFS), locoregional (LRRFS), and distant (DRFS)
relapse-free survival, as well as the disease-free (DFS), progression-free (PFS), and OS rates were
calculated using the Kaplan-Meier method and the computed curves were compared using Log-
rank test. All survival events were measured from the first day of treatment (CHT or RT). In
computing the survival curves of LRFS, RRFS, LRRFS, DRFS, and DFS, patients were censored
only in cases of lost to follow-up, last follow-up, and death. Locally persistent tumours were also
included in computing the LRFS, LRRFS, DFS, and PFS rates and the failure dates were set at 3
months after the conclusion of the treatments. In DFS, failure at any site was defined as an event.
In PFS, failures at any site or death of any cause were labled as events. The impact of prognostic
factors on survival probabilities was estimated using univariate and multivariate analysis according
to log-rank tests and stepwise Cox proportional hazard models. Fisher´s exact tests and
Spearman´s rank correlation test were used for evaluation of the association between two
categorical and two continuous variables, respectively. In paper II and III, Wilcoxon signed ranks
test was used for statistical inference of paired samples. All tests were two-sided and conducted at
5% significance level.
Table 8. Parameter sets for calculation of NTCP of organs at risk according to the LKB-model.
Organs at risk TD50 (Gy) n m Endpoint
Brain 60 0.25 0.15 Necrosis/infarction (77)
Ear middle/external 40 0.01 0.15 Acute serous otitis (77)
Ear middle/external 65 0.01 0.095 Chronic serous otitis (77)
Larynx 70 0.08 0.17 Laryngeal edema (77)
Parotid gland 28.4 1.00 0.18 Xerostomia (79)
TM joint 72 0.07 0.1 Marked trismus (77)
TM = temporomandibular.
55
RESULTS AND DISCUSSION
Paper I:
The purpose of this study was to investigate the clinical manifestations and treatment outcomes in
a cohort of Swedish NPC patients and to identify the key aspects for future improvements.
Out of 52 NPC patients initially enrolled in the study, 71% of the patients had stages III-IV at
presentation. Majority of the patients (87%) had tumours with WHO type II-III histology. The
most common clinical manifestations at diagnosis were neck mass (54%), auditory disturbances
(50%), head or neck pain (44%), nasal obstruction and discharge (42% and 31%), weight loss
(21%), and cranial nerve involvement (19%).
Survival analysis for 49 nondisseminated patients revealed 5-year DFS, PFS, and OS rates of 61%,
48%, and 55% respectively (Figure 12). The 5-year LRFS, RRFS, and DRFS rates were 70%,
92%, and 77% (Figure 12). Univariate analysis revealed the significant influence of T stage on
local tumour control (HR 1.53, 95% CI=1.02-2.29), and tumour stage on distant tumor control
rates (HR 3.11, 95% CI=1.29-7.48). The 5-year LRFS rate in T3-T4 tumours was significantly
lower than T1-T2 tumours (51% vs. 85%, p<0.05). All distant failures were correlated with Stage
IVa-b disease. The median times to local and distant failures were 42.7 and 17.6 months,
respectively. The results of multivariate analysis demonstrated that WHO type I histology,
absorbed dose expressed in EQD210-XRT/BT below 66 Gy, and long-standing symptoms before
diagnosis had significantly negative impact on LRFS rates. Increasing tumour stage and cranial
nerve involvement were significantly associated with inferior DRFS rates. Tumour response
within six months after treatment was a significant prognosticator of DFS and PFS rates both when
starting point for the analysis was set at the first day of treatment or six months after conclusion of
the treatment.
Evaluation of CHT-related toxicities revealed that these were generally mild. Non-hematological
side effects of grade III-IV were observed in five patients out 36 who had received CHT. Acute
side effects of RT included mucositis (grade II-III) which developed in all patients. As expected,
HART was associated with earlier induction of maximum mucositis compared with CRT (median
time 17 vs. 35 days). The most common late side effect of irradiation was xerostomia. Grade II and
III chronic xerostomia was observed in 80% of the patients. Subjective hearing deterioration was
observed in 64% of the patients and 44% were in need of hearing aid. Grade II-III otitis media or
externa and grade II hypothyroidism were observed in 66% and 24% of the patients, respectively.
56
Asymptomatic and symptomatic temporal lobe necroses were observed in 8% and 4% of the
patients, respectively. The median time to diagnosis of this side effect was 3.9 years (range 2.1-5.8
years). Other common side effects included trismus, tinnitus, and nasal/nasopharyngeal adhesions.
The clinical manifestations of NPC in our patients have been in line with historical reports (1, 31)
including the rate of locoregionally advanced disease (stage III-IV) which was reported in 50% to
90% of NPC patients by previous studies (1, 9, 29, 47, 84). The 13% presence of WHO type I
tumours in our study is also expected being a nonendemic patient material. This histology type was
reported in 5% and 19% of the NPC patients included in two recent studies from nonendemic
regions (35, 90). Although some surveys have demonstrated correlation of nonlymphoepithelioma
tumours with worse LRFS and disease-specific survival rates (31, 91), this has not been confirmed
by all studies (90). The limited number of the patients included in these studies and the inter-
institutional variations in treatment strategies can result in such controversies.
The tumour control and OS rates for our NPC population are seemingly closer to the reports from
studies which used radical 2DRT only (1, 31). This observation is somewhat surprising since
majority of our patients (71%) had received CHT and all irradiations were delivered with 3DCRT.
However, the age of our population was relatively higher compared with many other reports on
NPC patients (median 60 vs. 43-49 years) (9, 10, 35, 68). Subsequent compromised constitutional
status of the patients by itself or through necessitating treatment modifications could be among
factors affecting the outcomes. The results of published reports on the benefits of neoadjuvant and
concomitant CHT with RT on LRRFS and DRFS rates in locoregionally advanced NPC (5) was
not confirmed for the subgroup of our patients who received CHT with curative intension. The
small magnitude of the study population, modifications in dose, timing, or number of delivered
cycles in almost half of the patients, and the fact that concomitant cisplatin-based CHT was not
delivered to any of our patients are among factors obscuring the expected benefits. Nevertheless,
the overall 3 to 5-year DRFS rates of 77-80% in our study is comparable with most other studies
including those using IMRT (2, 9, 90). The 5-year LRFS rate of 70% in our NPC patients (51% for
T3-T4 tumors) is however disappointingly low which in part is explained by presentation of WHO
type I tumours. Baseline diagnostic MRI was lacking in three out of twelve patients with local
failure including two patients with T4 disease. Inadequate pre-therapeutic radiologic data or
limitations in adequate coverage of the primary tumour by 3DCRT in some of these patients could
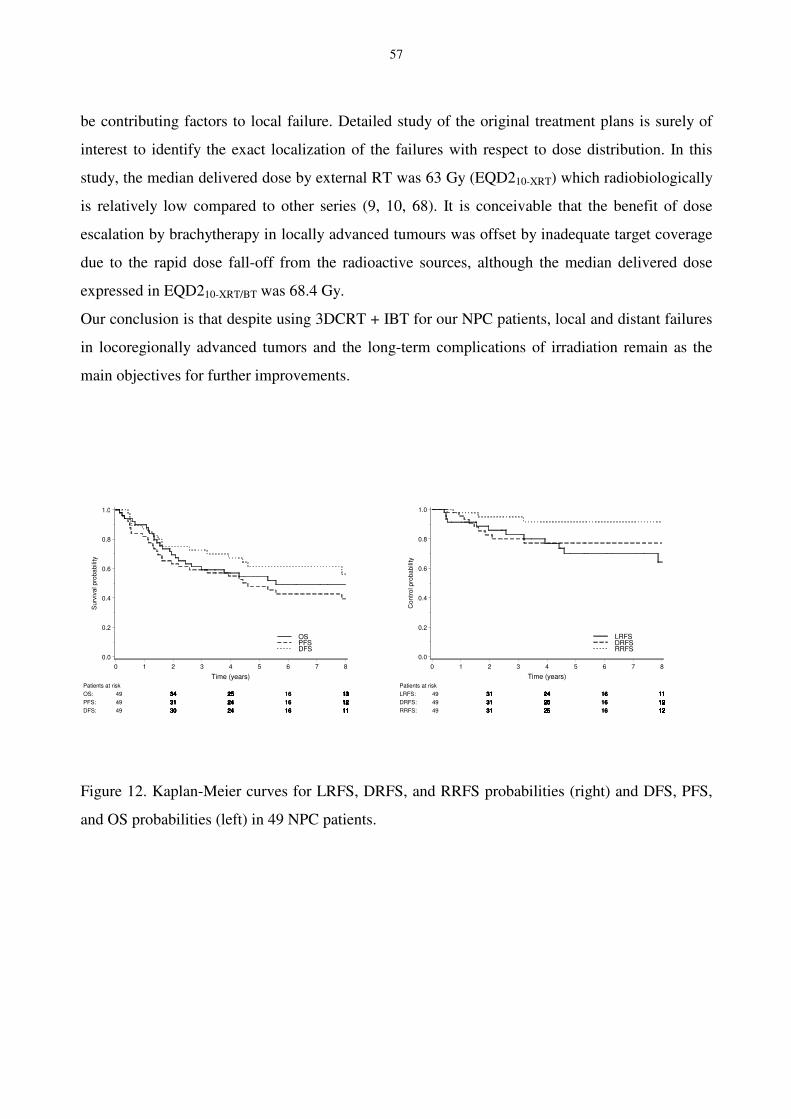
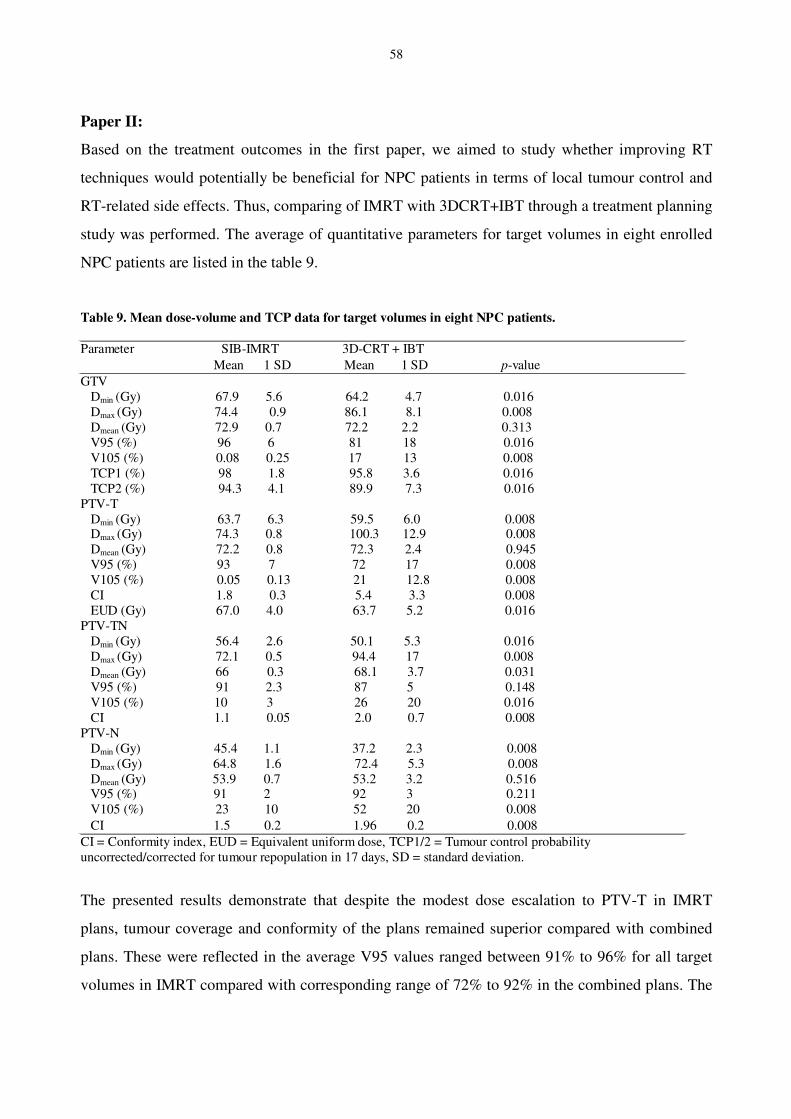
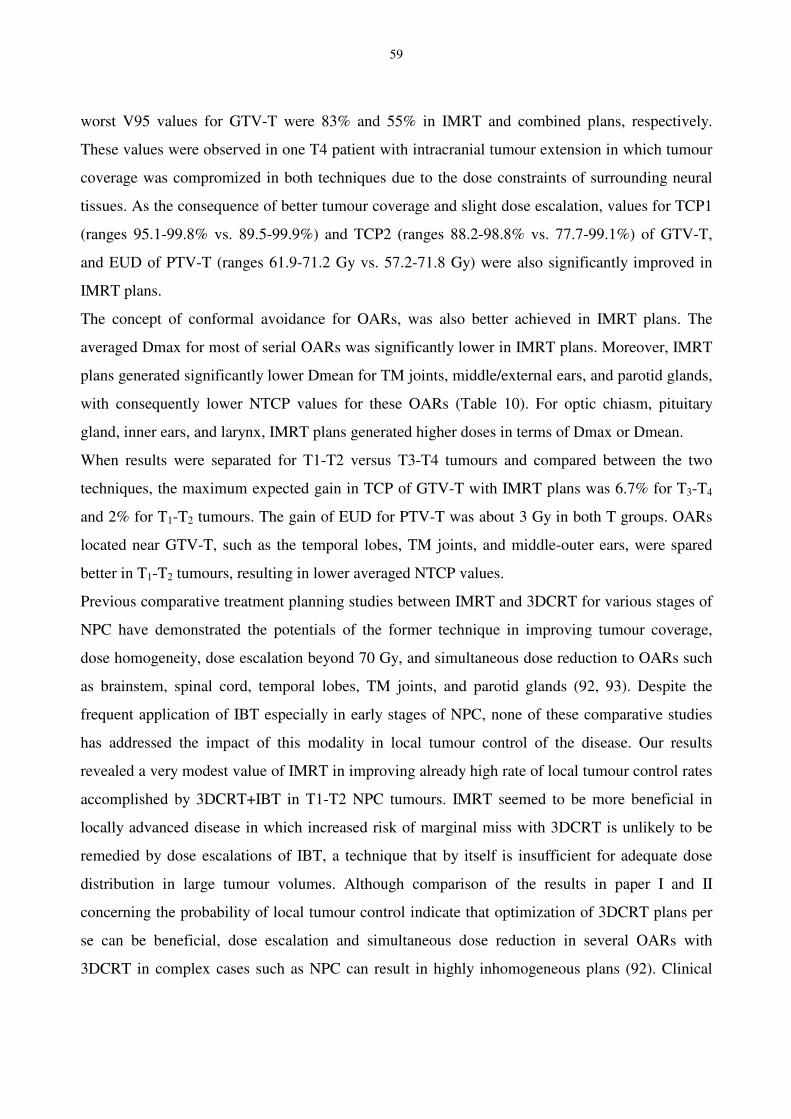
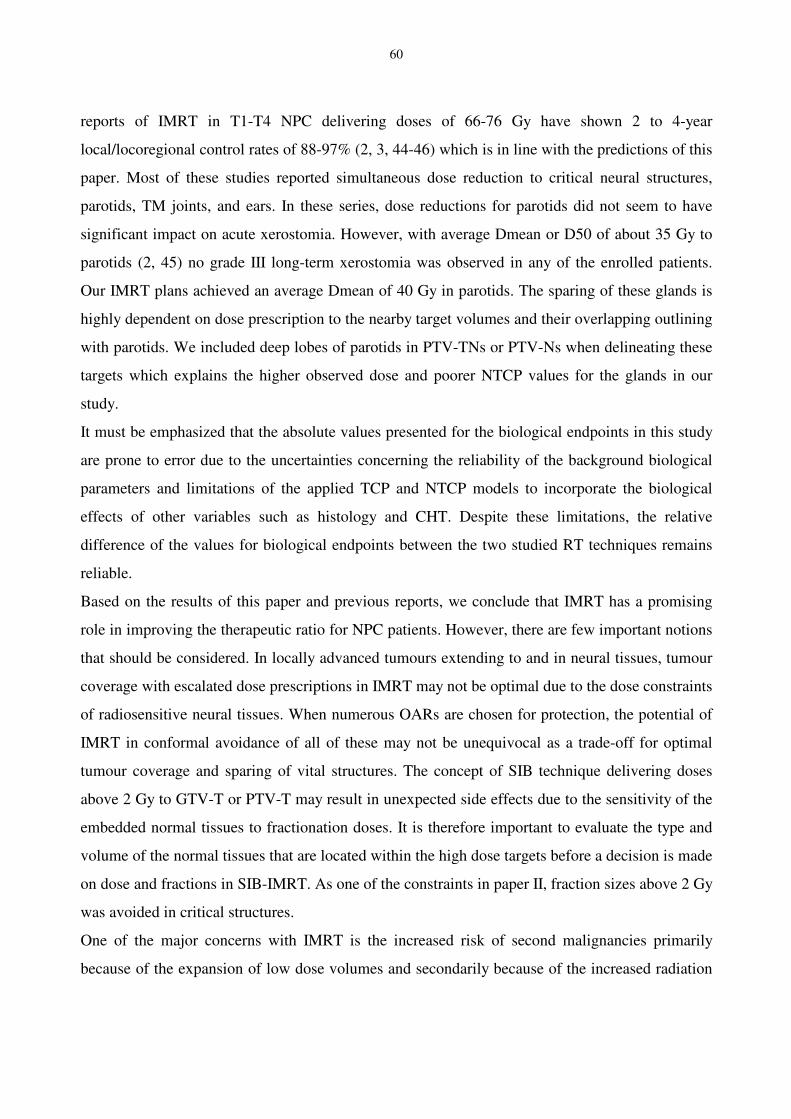
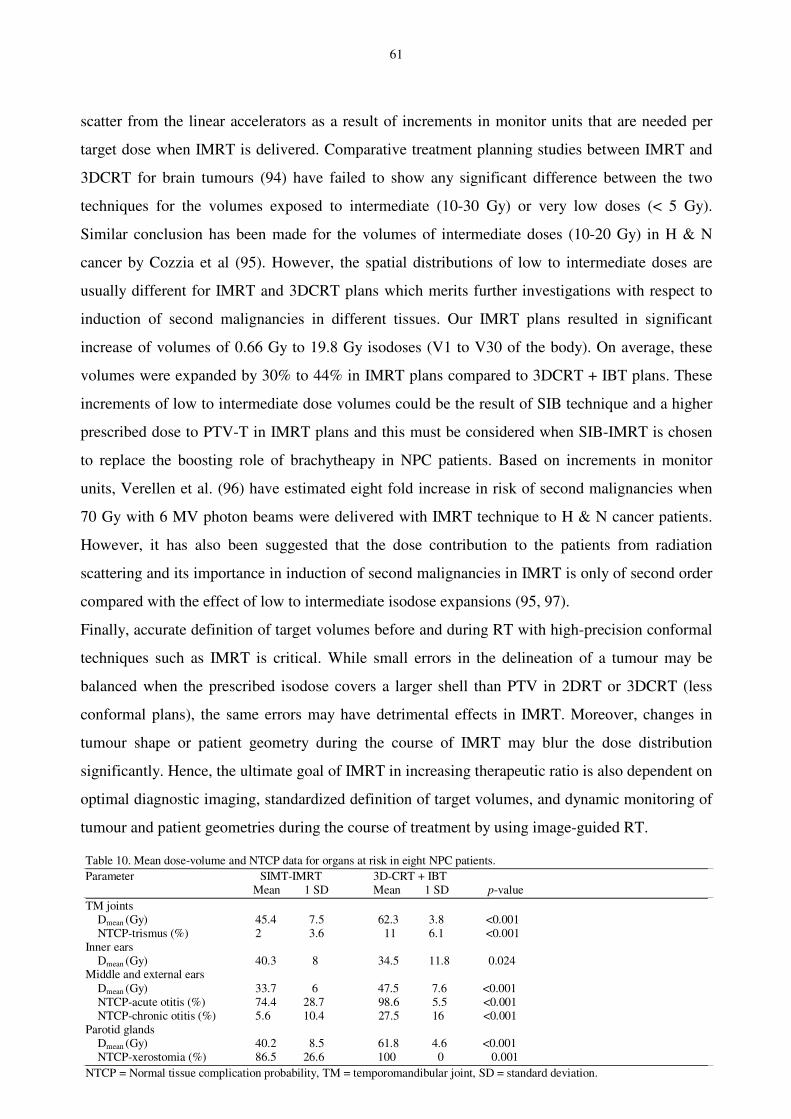
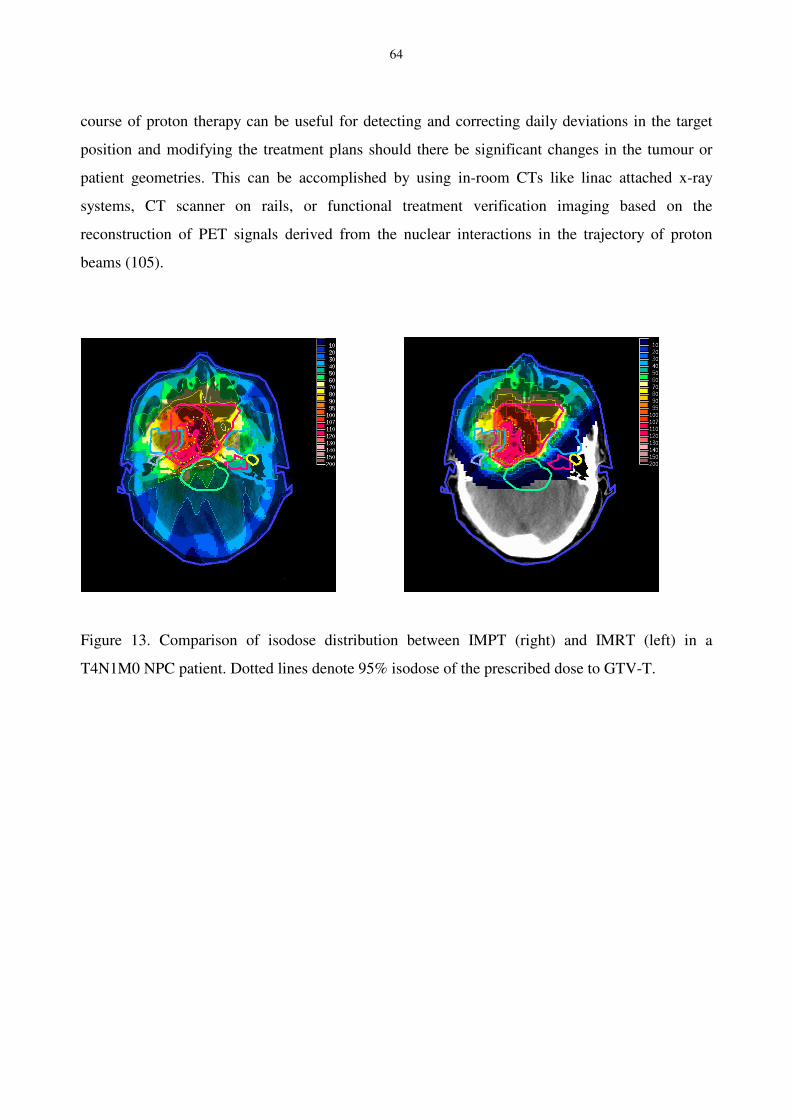


![Nasopharyngeal Carcinoma [Ind] - Fix 19](https://img.pdfslide.net/doc/110x75/55cf9043550346703ba47221/nasopharyngeal-carcinoma-ind-fix-19.jpg)