Embed Size (px)
Citation preview
NatioNal accouNts statistics2013
National Statistics BureauRoyal Government of Bhutan
Thimphu : Bhutan
དཔལ་ལྡན་འབྲུག་གཞུང་།
རྒྱལ་ཡོངས་རྩིས་དཔྱད་བཀོད་འཛིན།

i
National Accounts Statistics, 2013
National Statistics Bureau (NSB) is pleased to bring out the National Accounts Statistics, 2013. It presents Gross Domestic Product (GDP) estimates and other
macro-economic aggregates such as final consumption of the households and the government, gross capital formation and saving for the period ending December 2012. This is the 25th publication in the series of National Accounts Statistics (NAS) published by Economics Statistics Division, NSB.
GDP estimates are compiled and presented in line with internationally accepted concepts, definitions and standards in order to enable international comparisons and assist decision makers and analysts in policy formulation, evaluation and monitoring of various development plans and programs.
Many individuals and agencies both in the government and private sector have assisted NSB in the publication of this report. We would like to sincerely offer our utmost thanks and acknowledge their continued support and cooperation. Any feedback or comments for further improvement will be greatly appreciated.
September 2013 National Statistics Bureau Thimphu: Bhutan
FOREWORD
ii
National Accounts Statistics, 2013
PageChapter 1- Overview 11.1 Introduction 11.2 Measurement 11.3 Objectives 11.4 GDP Revision 11.5 Reporting Basis 2
Chapter 2-Economic Performance 32.1 Real GDP 32.2 Nominal GDP 32.3 GDP in USD and Per Capita Income 32.4 Gross National Income (GNI) 42.5 Inflation 42.6 Gross Capital Formation/Investment 42.7 Savings 4
Chapter 3 – GDP by Broad Economic Sectors 53.1 Primary Sector 53.2 Secondary Sector 53.3 Tertiary Sector 53.4 Sub-Sectoral Contribution 6
Chapter 4 – GDP by Industrial Origin- Sectoral Performance 64.1 Agriculture Livestock & Forestry 7
4.1.1 Crops 74.1.2 Livestock 84.1.3 Forestry & Logging 8
4.2 Mining & Quarrying 94.3 Manufacturing 94.4 Electricity and Water Supply 104.5 Construction 114.6 Wholesale and Retail Trade 12
Contents
iii
National Accounts Statistics, 2013
4.7 Hotels & Restaurants 124.8 Transport, Storage and Communications 134.9 Finance, Insurance, Real Estates and Business Services 134.10 Community and Social Services (General Government) 144.11 Private, Social and Recreational Services 15
Chapter 5 - GDP by Expenditure 165.1 GDP by Expenditure 165.2 Final Consumption Expenditure 16
5.2.1 Final Consumption Expenditure of Households 165.2.2 General Government Consumption Expenditure 17
5.3 Gross Capital Formation 175.4 Net Exports 18
Chapter 6 - Sources of Information and Methodology 196.1 Agriculture, livestock & Forestry 19
6.1.1 Crops 196.1.2 Livestock 196.1.3 Forestry 19
6.2 Mining and Quarrying 196.3 Manufacturing 196.4 Electricity and Water Supply 196.5 Construction 206.6 Wholesale & Retail Trade 206.7 Hotels & Restaurants 206.8 Transport, Storage & Communications 206.9 Finance, Insurance, Real Estates & Business Services 206.10 Community and Social Services 206.11 Private, Social & Recreational Services 206.12 Final Consumption 216.13 Capital Formation 216.14 Net Exports 21Statistical Tables 22Definitions & Terminologies 39Data Sources 42
iv
National Accounts Statistics, 2013
Statistical Abbreviations
p : provisionalr : revised estimates( ) : figure is negative_ : figure is zero or negligible
Tables in the Text Table 1 : Key Economic Indicators Table 2 : Share of Major Economic Sectors Table 3 : Gross Value of Output of Major Crops in Current Prices Table 4 : Growth in Livestock Population Table 5 : Mineral production Table 6 : Electricity Generation by Generating PlantsTable 7 : Gross Value Added by Various Construction Categories Graphs
Graph 1 : GDP growth in current and constant prices Graph 2 : CPI & Implicit GDP Deflator Change Graph 3 : Annual Growth Trend of Major Economic SectorsGraph 4 : Percent Share of the SectorsGraph 5 : Growth of Crops, Livestock and Forestry Graph 6 : Production of Timber, Briquette & Firewood Graph 7 : Growth of Timber, Briquette & Firewood Graph 8 : Contributions by Major Industry Graph 9 : Contribution of Electricity Generating Firms Graph 10 : Growth of Construction Sector in Current and Constant Prices Graph 11 : Growth of Trading Activity Graph 12 : Types of Visitor ArrivalsGraph 13 : Share of Different Transportation Activities
Graph 14 : Share of Different Financial Activities Graph 15 : Growth of Finance, Insurance & Real Estate
Graph 16 : Growth Trend of Community, Social & Personal Service
v
National Accounts Statistics, 2013
Graph 17 : Growth Trend of Intermediate Inputs, Compensation and Depreciation Graph 18 : Consumption Pattern Graph 19 : Growth Trend of GCF, Construction and Machinery & Equipment
Abbreviations & Acronyms BLSS : Bhutan Living Standard SurveyCFC : Consumption of Fixed CapitalCIF : Cost Insurance and FreightCoE : Compensation of EmployeesCPI : Consumer Price IndexDRC : Department of Revenue & CustomsDBA : Department of National BudgetDPA : Department of Public AccountsDGM : Department of Geology & Mines FoB : Free on BoardFISIM : Financial Intermediation Services Indirectly Measured FC : Final ConsumptionGDCF : Gross Domestic Capital FormationGDFCF : Gross Domestic Fixed Capital FormationGDP : Gross Domestic ProductGDE : Gross Domestic ExpenditureGNI : Gross National IncomeGO : Gross OutputGVA : Gross Value AddedGVAR : Gross Value Added RatioGGFCE : General Government Final Consumption ExpenditureGCE : Government Consumption ExpenditureHIES : Household Income and Expenditure SurveyIC : Intermediate ConsumptionISIC : International Standard Industrial Classification of All
Economic ActivitiesPHCB : Population and Housing Census of Bhutan PFCE : Private Final Consumption Expenditure
vi
National Accounts Statistics, 2013
PCE : Private Consumption Expenditure MoF : Ministry of FinanceMoAF : Ministry of Agriculture & ForestsMoEA : Ministry of Economic AffairsNNI : Net National IncomeNPISH : Non-Profit Institutions Serving HouseholdsNSB : National Statistic BureauRMA : Royal Monetary Authority of BhutanROW : Rest of the WorldSNA : System of National Accounts
vii
National Accounts Statistics, 2013
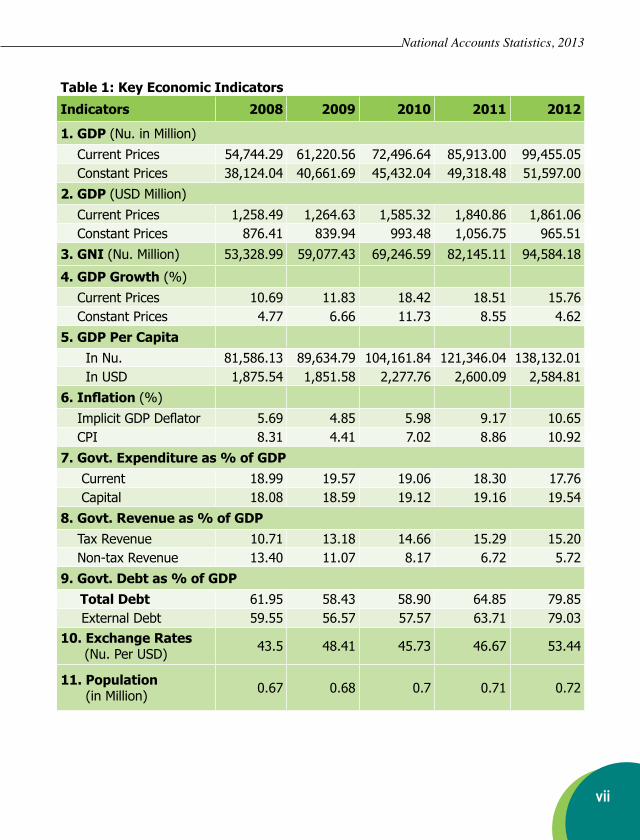
Table 1: Key Economic Indicators
Indicators 2008 2009 2010 2011 2012
1. GDP (Nu. in Million) Current Prices 54,744.29 61,220.56 72,496.64 85,913.00 99,455.05 Constant Prices 38,124.04 40,661.69 45,432.04 49,318.48 51,597.002. GDP (USD Million) Current Prices 1,258.49 1,264.63 1,585.32 1,840.86 1,861.06 Constant Prices 876.41 839.94 993.48 1,056.75 965.513. GNI (Nu. Million) 53,328.99 59,077.43 69,246.59 82,145.11 94,584.18
4. GDP Growth (%) Current Prices 10.69 11.83 18.42 18.51 15.76 Constant Prices 4.77 6.66 11.73 8.55 4.625. GDP Per Capita In Nu. 81,586.13 89,634.79 104,161.84 121,346.04 138,132.01 In USD 1,875.54 1,851.58 2,277.76 2,600.09 2,584.816. Inflation (%) Implicit GDP Deflator 5.69 4.85 5.98 9.17 10.65 CPI 8.31 4.41 7.02 8.86 10.927. Govt. Expenditure as % of GDP Current 18.99 19.57 19.06 18.30 17.76 Capital 18.08 18.59 19.12 19.16 19.548. Govt. Revenue as % of GDP Tax Revenue 10.71 13.18 14.66 15.29 15.20 Non-tax Revenue 13.40 11.07 8.17 6.72 5.729. Govt. Debt as % of GDP Total Debt 61.95 58.43 58.90 64.85 79.85 External Debt 59.55 56.57 57.57 63.71 79.0310. Exchange Rates
(Nu. Per USD) 43.5 48.41 45.73 46.67 53.44
11. Population (in Million) 0.67 0.68 0.7 0.71 0.72

viii
National Accounts Statistics, 2013
1
National Accounts Statistics, 2013
1.1 Introduction The System of National Accounts (SNA) is a systematic framework of accounts that measures the level of economic development and the rate of economic growth over time. It gives a macroeconomic depiction of how the economy as a whole functions and its relationship with the rest of the world. This is measured conventionally through Gross Domestic Product (GDP).
GDP represents the end result of all economic activities that take place in the economy. It is the sum total of value of all goods and services produced within the economic boundary of the country, which are available for final uses such as consumption, investment and exports.
1.2 MeasurementGDP is measured both in current and constant prices. The base year for GDP estimation in Bhutan is the year 2000. The current price estimates reflect the monetary value of all goods and services produced in the economy at prices prevailing in the year of reporting, while the constant price estimates reflect the monetary value of all goods and services at the base year prices. The estimation and compilation methodology is as per
Chapter 1Overview
the United Nations System of National Accounts. GDP in Bhutan is estimated using production and expenditure approach.
1.3 ObjectivesThe objective of the National Accounts Statistics is to provide comprehensive and reliable description of the condition and performance of the economy. This is done through measurement of GDP, Gross National Income (GNI), and Final Consumption Expenditure (FCE), Gross Capital Formation (GCF), Saving and Net Exports. These aggregates serve as useful and critical information to politicians, policy makers, planners, academicians, researchers and other users in the overall socio-economic planning and policy formulation, monitoring, analysis, and evaluation of the performance of the economy.
1.4 GDP Revision As a standard practice, the past published figures are revised when more recent and up-to-date information become available. However, such revisions, as a matter of internal policy, are limited to only one year and users are accordingly informed. The birth of new business establishments is captured in the GDP estimates in the year the units are
2
National Accounts Statistics, 2013
established.
Readers will notice minor revisions in the published figures of 2011 under the agriculture sector. This is because agriculture sector data, unlike other sectors, are compiled and produced with a time lag of at least one year. As a result, incorporating new data this year has resulted in 0.04 percentage points change in the overall GDP growth rate from 8.51 percent to 8.55 percent.
Gross Value Added (GVA) for the agriculture sector for 2012 is also based on projected production figures provided by the PPD, Ministry of Agriculture and Forests (MoAF). They are expected to undergo certain revision next year when MoAF comes up with final RNR data.
1.5 Reporting BasisThe National Accounts Statistics is reported on a calendar year basis, while biannual or annual reports of the Ministry of Finance, Royal Monetary Authority, and National Pension and Provident Fund Ltd. are reported on a fiscal year basis.
Hence information received from the above agencies on a fiscal year basis are converted to calendar year for national accounts statistics purposes. All users must take note of this fact and exercise due care and diligence while referring or quoting figures from the report.

3
National Accounts Statistics, 2013
2.1 Real GDPGDP in constant prices recorded Nu. 51,597.00 million in 2012, posting a growth rate of 4.62 percent from Nu. 49,318.48 million in 2011. The economy growth slowed down by about 4 percentage points in 2012 from 8.55 percent in the previous year. The average economic growth in the last five years (2008-2012) however recorded 7.26 percent.
The decline in the growth can be attributed to negative growth of Community, Social and Personal services (General Government) by 6.43 percent; Finance, Insurance, Real Estates and Business Services by 2.86 percent; Mining and Quarrying by 2.24 percent; and Electricity & Water Supply by 0.57 percent.
On the other hand, the sectors which performed relatively better and contributed to the overall growth in 2012 were Hotels and Restaurants with 27.81 percent, followed by Wholesale and Retail Trade with 24.17 percent; manufacturing with 8.94 percent: Construction with 4.18 percent; and Agriculture with 3.44 percent.
Chapter 2Economic Performance
2.2 Nominal GDPIn nominal terms, the level of GDP reached Nu. 99,455.05 million in 2012 compared to Nu. 85,913.00 million in 2011. This was an increase of 15.76 percent over the previous year.
2.3 GDP in USD and Per Capita Income
At an annual average exchange rate of Nu.53.44 in 2012, GDP in USD is estimated at 1,861.06 million, noting an increase of 1.10 percent in 2012 from USD 1,840.86 million in 2011.
In terms of the Ngultrums, per capita GDP is estimated at Nu. 138,132.01, taking into account the country’s projected population of 0.72 million in 2012.
4
National Accounts Statistics, 2013
2.4 Gross National Income (GNI)Gross National Income (GNI) at current prices recorded Nu. 94,584.18 million in 2012 as compared to Nu. 82,145.11 million in 2011, showing a growth of 15.14 percent.
GNI is the adjustment of net primary income receipts from abroad to GDP at market prices.
Primary income payments increased by 25.75 percent from Nu. 4,582.53 million in 2011 to Nu. 5,762.44 million in 2012. On the other hand, primary income receipts showed around 10 percent increase (Nu. 891.58 million) in 2012, which is a slight improvement from 7.46 percent in 2011.
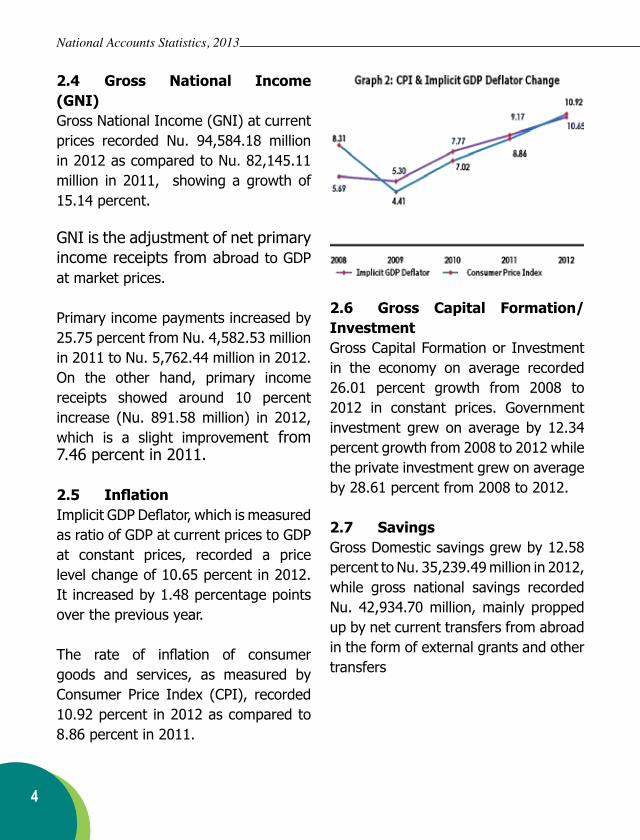
2.5 InflationImplicit GDP Deflator, which is measured as ratio of GDP at current prices to GDP at constant prices, recorded a price level change of 10.65 percent in 2012. It increased by 1.48 percentage points over the previous year.
The rate of inflation of consumer goods and services, as measured by Consumer Price Index (CPI), recorded 10.92 percent in 2012 as compared to 8.86 percent in 2011.
2.6 Gross Capital Formation/InvestmentGross Capital Formation or Investment in the economy on average recorded 26.01 percent growth from 2008 to 2012 in constant prices. Government investment grew on average by 12.34 percent growth from 2008 to 2012 while the private investment grew on average by 28.61 percent from 2008 to 2012.
2.7 Savings Gross Domestic savings grew by 12.58 percent to Nu. 35,239.49 million in 2012, while gross national savings recorded Nu. 42,934.70 million, mainly propped up by net current transfers from abroad in the form of external grants and other transfers
5
National Accounts Statistics, 2013
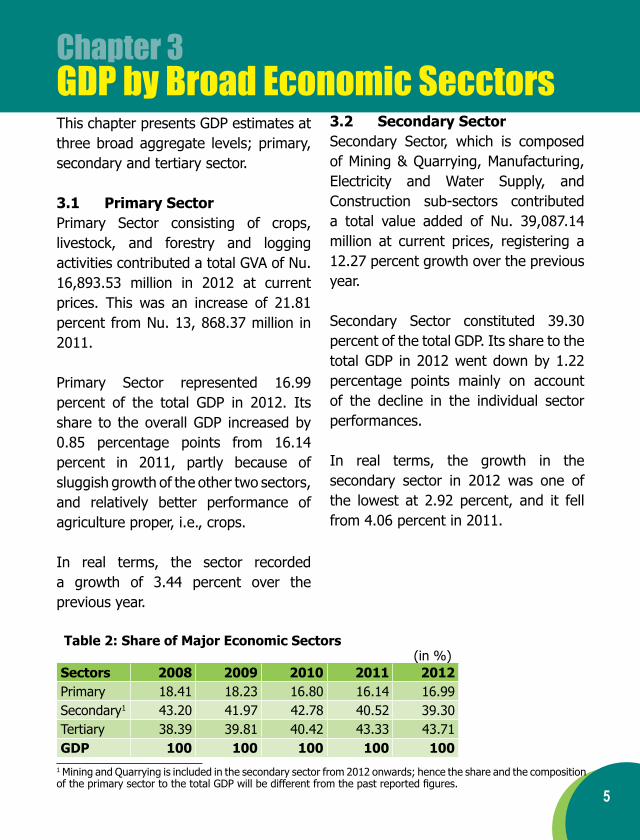
This chapter presents GDP estimates at three broad aggregate levels; primary, secondary and tertiary sector.
3.1 Primary SectorPrimary Sector consisting of crops, livestock, and forestry and logging activities contributed a total GVA of Nu. 16,893.53 million in 2012 at current prices. This was an increase of 21.81 percent from Nu. 13, 868.37 million in 2011.
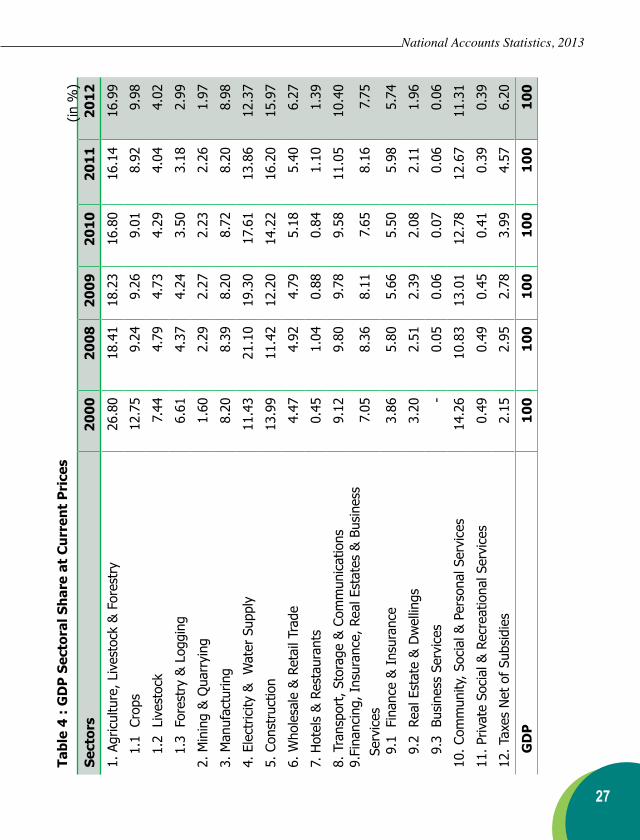
Primary Sector represented 16.99 percent of the total GDP in 2012. Its share to the overall GDP increased by 0.85 percentage points from 16.14 percent in 2011, partly because of sluggish growth of the other two sectors, and relatively better performance of agriculture proper, i.e., crops.
In real terms, the sector recorded a growth of 3.44 percent over the previous year.
Table 2: Share of Major Economic Sectors (in %)Sectors 2008 2009 2010 2011 2012Primary 18.41 18.23 16.80 16.14 16.99Secondary1 43.20 41.97 42.78 40.52 39.30Tertiary 38.39 39.81 40.42 43.33 43.71GDP 100 100 100 100 100
Chapter 3GDP by Broad Economic Secctors
3.2 Secondary SectorSecondary Sector, which is composed of Mining & Quarrying, Manufacturing, Electricity and Water Supply, and Construction sub-sectors contributed a total value added of Nu. 39,087.14 million at current prices, registering a 12.27 percent growth over the previous year. Secondary Sector constituted 39.30 percent of the total GDP. Its share to the total GDP in 2012 went down by 1.22 percentage points mainly on account of the decline in the individual sector performances.
In real terms, the growth in the secondary sector in 2012 was one of the lowest at 2.92 percent, and it fell from 4.06 percent in 2011.
1 Mining and Quarrying is included in the secondary sector from 2012 onwards; hence the share and the composition of the primary sector to the total GDP will be different from the past reported figures.
6
National Accounts Statistics, 2013
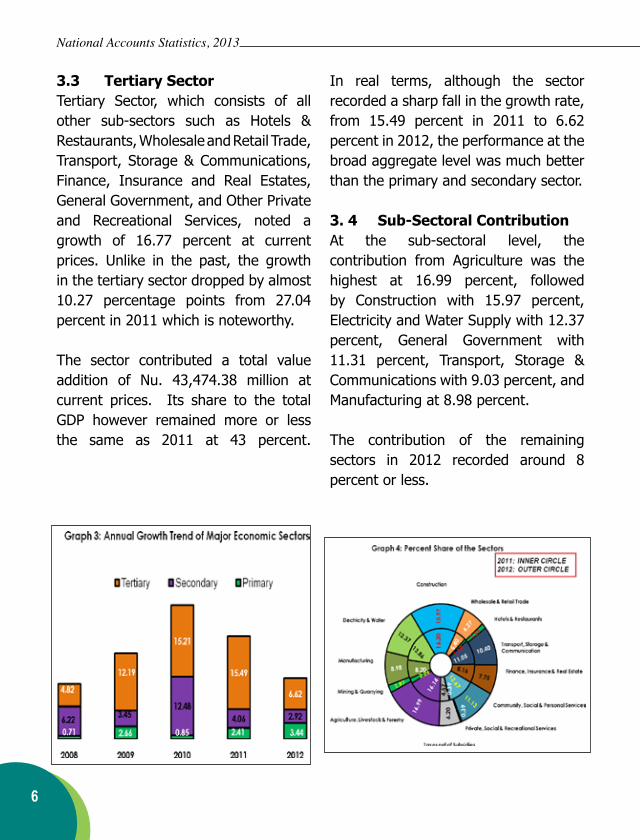
3.3 Tertiary SectorTertiary Sector, which consists of all other sub-sectors such as Hotels & Restaurants, Wholesale and Retail Trade, Transport, Storage & Communications, Finance, Insurance and Real Estates, General Government, and Other Private and Recreational Services, noted a growth of 16.77 percent at current prices. Unlike in the past, the growth in the tertiary sector dropped by almost 10.27 percentage points from 27.04 percent in 2011 which is noteworthy.
The sector contributed a total value addition of Nu. 43,474.38 million at current prices. Its share to the total GDP however remained more or less the same as 2011 at 43 percent.
In real terms, although the sector recorded a sharp fall in the growth rate, from 15.49 percent in 2011 to 6.62 percent in 2012, the performance at the broad aggregate level was much better than the primary and secondary sector.
3. 4 Sub-Sectoral ContributionAt the sub-sectoral level, the contribution from Agriculture was the highest at 16.99 percent, followed by Construction with 15.97 percent, Electricity and Water Supply with 12.37 percent, General Government with 11.31 percent, Transport, Storage & Communications with 9.03 percent, and Manufacturing at 8.98 percent.
The contribution of the remaining sectors in 2012 recorded around 8 percent or less.
7
National Accounts Statistics, 2013
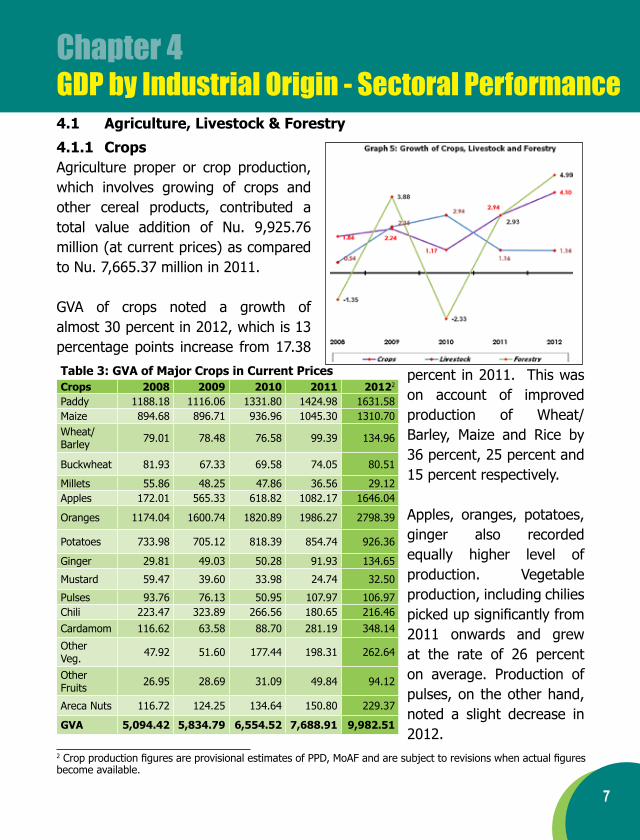
4.1.1 CropsAgriculture proper or crop production, which involves growing of crops and other cereal products, contributed a total value addition of Nu. 9,925.76 million (at current prices) as compared to Nu. 7,665.37 million in 2011.
GVA of crops noted a growth of almost 30 percent in 2012, which is 13 percentage points increase from 17.38
Chapter 4GDP by Industrial Origin - Sectoral Performance
Table 3: GVA of Major Crops in Current PricesCrops 2008 2009 2010 2011 20122
Paddy 1188.18 1116.06 1331.80 1424.98 1631.58Maize 894.68 896.71 936.96 1045.30 1310.70Wheat/Barley 79.01 78.48 76.58 99.39 134.96
Buckwheat 81.93 67.33 69.58 74.05 80.51
Millets 55.86 48.25 47.86 36.56 29.12Apples 172.01 565.33 618.82 1082.17 1646.04
Oranges 1174.04 1600.74 1820.89 1986.27 2798.39
Potatoes 733.98 705.12 818.39 854.74 926.36
Ginger 29.81 49.03 50.28 91.93 134.65
Mustard 59.47 39.60 33.98 24.74 32.50
Pulses 93.76 76.13 50.95 107.97 106.97Chili 223.47 323.89 266.56 180.65 216.46Cardamom 116.62 63.58 88.70 281.19 348.14
OtherVeg. 47.92 51.60 177.44 198.31 262.64
OtherFruits 26.95 28.69 31.09 49.84 94.12
Areca Nuts 116.72 124.25 134.64 150.80 229.37
GVA 5,094.42 5,834.79 6,554.52 7,688.91 9,982.51
percent in 2011. This was on account of improved production of Wheat/Barley, Maize and Rice by 36 percent, 25 percent and 15 percent respectively.
Apples, oranges, potatoes, ginger also recorded equally higher level of production. Vegetable production, including chilies picked up significantly from 2011 onwards and grew at the rate of 26 percent on average. Production of pulses, on the other hand, noted a slight decrease in 2012.
2 Crop production figures are provisional estimates of PPD, MoAF and are subject to revisions when actual figures become available.
4.1 Agriculture, Livestock & Forestry
8
National Accounts Statistics, 2013
In real terms, crops achieved 4.10 percent growth in 2012 and it is one of the highest growth rates recorded so far in the five years period since 2008.
4.1.2 LivestockTotal livestock population as of December 2012 recorded 978,993 with 11 percent increase over 2011. Of these, 56 percent constituted poultry, 23 percent local cattle, about 8 percent improved cattle breed, and the remaining 13 percent were other categories.
Table 4: Growth in Livestock Population
(in %)Livestock 2008 2009 2010 2011 2012
Local cattle 1.25 -6.85 -0.65 -2.68 -4.13
Improved cattle 5.78 3.00 0.47 5.18 3.59
Yak -6.02 -6.40 -10.87 6.86 -11.90
Buffalo -5.68 -34.72 -2.83 -8.30 -13.04
Horses 30.03 -14.74 0.77 -0.34 -3.19
Pigs 1.98 -19.33 -11.15 7.40 -9.35
Sheep 6.99 -7.43 3.28 -1.89 -13.45
Goats 38.16 -1.23 11.69 1.39 -10.78
Poultry 3.78 19.17 40.66 24.52 26.50
Source: PPD, MoAF
Except for improved cattle breed and poultry, all other species and categories viz. local cattle, yaks, buffaloes, horses, pigs, sheep and goats showed a decline in population in 2012.
GVA for livestock sub-sector, estimated based on livestock population by different species and categories, amounted to Nu. 3,993.83 million at current prices, showing 15 percent growth over the previous year. Increased production of poultry and dairy products helped sustain the growth in 2012.
However in real terms, it noted a slight decline from 1.16 percent to 1.14 percent 2012. The share of livestock to the overall GDP remained more or less the same as the previous year at around 4 percent.
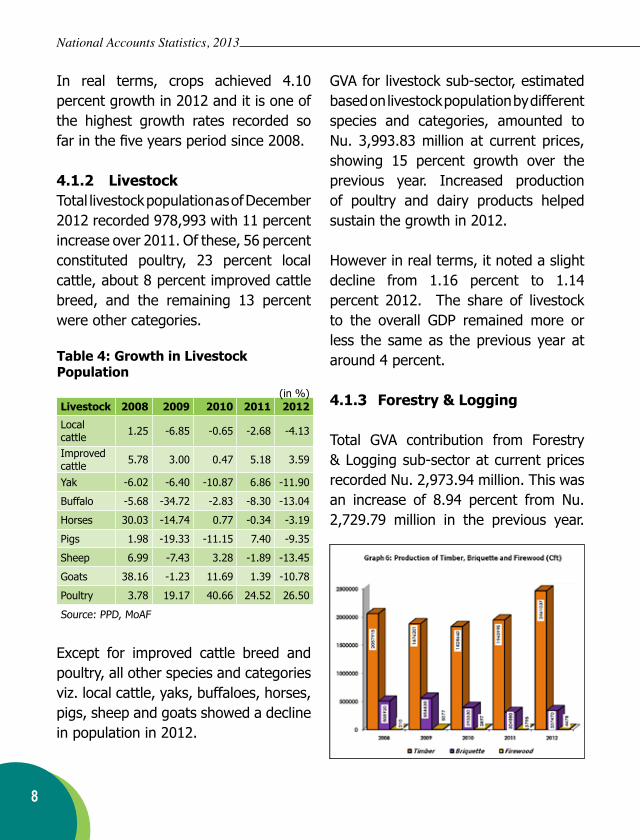
4.1.3 Forestry & Logging
Total GVA contribution from Forestry & Logging sub-sector at current prices recorded Nu. 2,973.94 million. This was an increase of 8.94 percent from Nu. 2,729.79 million in the previous year.
9
National Accounts Statistics, 2013
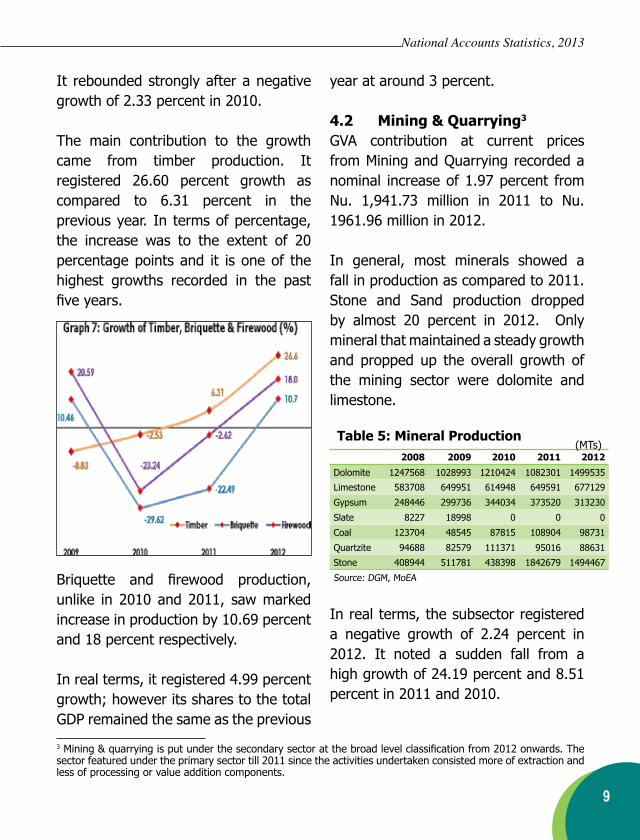
It rebounded strongly after a negative growth of 2.33 percent in 2010.
The main contribution to the growth came from timber production. It registered 26.60 percent growth as compared to 6.31 percent in the previous year. In terms of percentage, the increase was to the extent of 20 percentage points and it is one of the highest growths recorded in the past five years.
Briquette and firewood production, unlike in 2010 and 2011, saw marked increase in production by 10.69 percent and 18 percent respectively.
In real terms, it registered 4.99 percent growth; however its shares to the total GDP remained the same as the previous
year at around 3 percent.
4.2 Mining & Quarrying3
GVA contribution at current prices from Mining and Quarrying recorded a nominal increase of 1.97 percent from Nu. 1,941.73 million in 2011 to Nu. 1961.96 million in 2012.
In general, most minerals showed a fall in production as compared to 2011. Stone and Sand production dropped by almost 20 percent in 2012. Only mineral that maintained a steady growth and propped up the overall growth of the mining sector were dolomite and limestone.
Table 5: Mineral Production(MTs)
2008 2009 2010 2011 2012
Dolomite 1247568 1028993 1210424 1082301 1499535
Limestone 583708 649951 614948 649591 677129
Gypsum 248446 299736 344034 373520 313230
Slate 8227 18998 0 0 0
Coal 123704 48545 87815 108904 98731
Quartzite 94688 82579 111371 95016 88631
Stone 408944 511781 438398 1842679 1494467
Source: DGM, MoEA
In real terms, the subsector registered a negative growth of 2.24 percent in 2012. It noted a sudden fall from a high growth of 24.19 percent and 8.51 percent in 2011 and 2010.
3 Mining & quarrying is put under the secondary sector at the broad level classification from 2012 onwards. The sector featured under the primary sector till 2011 since the activities undertaken consisted more of extraction and less of processing or value addition components.
10
National Accounts Statistics, 2013
The contribution of mining and quarrying to the overall GDP also dropped from 2.26 percent in 2011 to 1.97 percent in 2012.
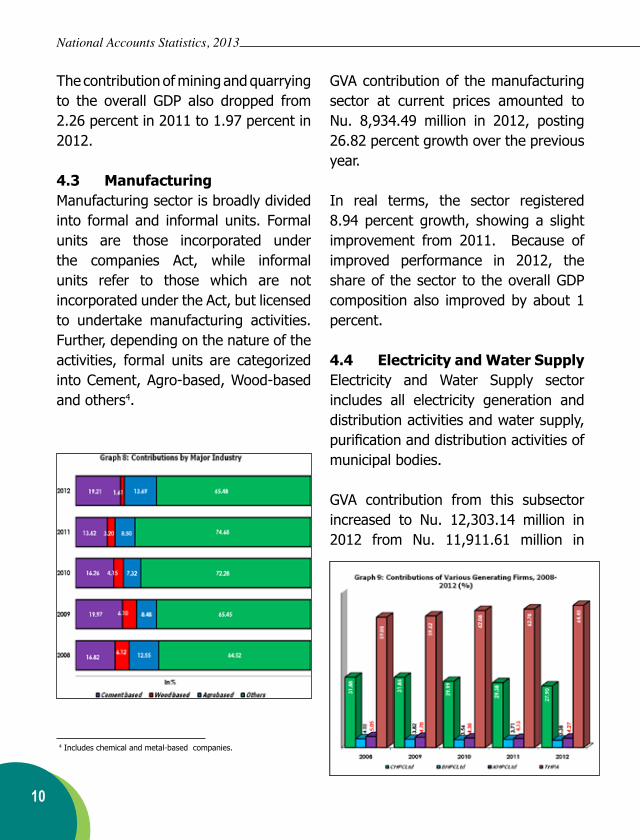
4.3 ManufacturingManufacturing sector is broadly divided into formal and informal units. Formal units are those incorporated under the companies Act, while informal units refer to those which are not incorporated under the Act, but licensed to undertake manufacturing activities. Further, depending on the nature of the activities, formal units are categorized into Cement, Agro-based, Wood-based and others4.
4 Includes chemical and metal-based companies.
GVA contribution of the manufacturing sector at current prices amounted to Nu. 8,934.49 million in 2012, posting 26.82 percent growth over the previous year.
In real terms, the sector registered 8.94 percent growth, showing a slight improvement from 2011. Because of improved performance in 2012, the share of the sector to the overall GDP composition also improved by about 1 percent.
4.4 Electricity and Water SupplyElectricity and Water Supply sector includes all electricity generation and distribution activities and water supply, purification and distribution activities of municipal bodies.
GVA contribution from this subsector increased to Nu. 12,303.14 million in 2012 from Nu. 11,911.61 million in
11
National Accounts Statistics, 2013
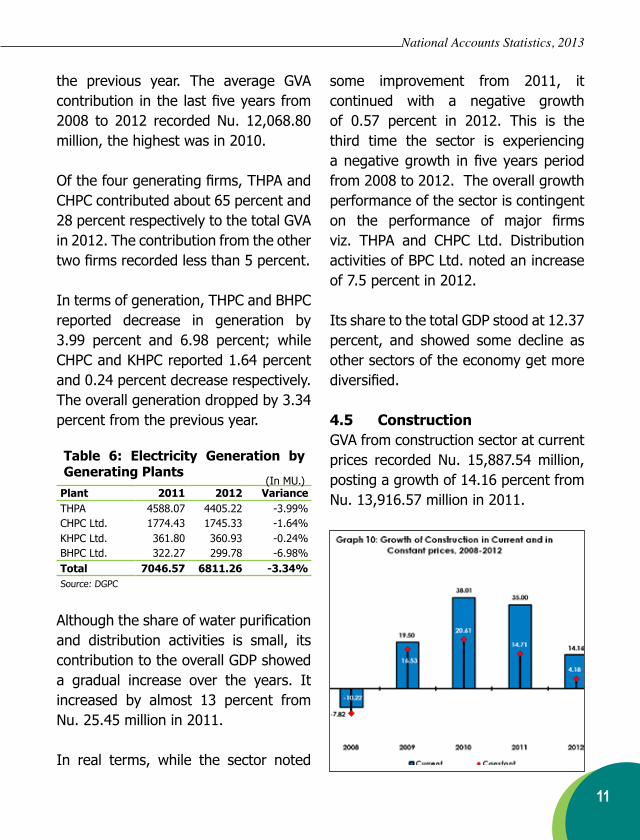
the previous year. The average GVA contribution in the last five years from 2008 to 2012 recorded Nu. 12,068.80 million, the highest was in 2010.
Of the four generating firms, THPA and CHPC contributed about 65 percent and 28 percent respectively to the total GVA in 2012. The contribution from the other two firms recorded less than 5 percent.
In terms of generation, THPC and BHPC reported decrease in generation by 3.99 percent and 6.98 percent; while CHPC and KHPC reported 1.64 percent and 0.24 percent decrease respectively. The overall generation dropped by 3.34 percent from the previous year.
Table 6: Electricity Generation by Generating Plants
(In MU.)Plant 2011 2012 VarianceTHPA 4588.07 4405.22 -3.99%CHPC Ltd. 1774.43 1745.33 -1.64%KHPC Ltd. 361.80 360.93 -0.24%BHPC Ltd. 322.27 299.78 -6.98%Total 7046.57 6811.26 -3.34%Source: DGPC
Although the share of water purification and distribution activities is small, its contribution to the overall GDP showed a gradual increase over the years. It increased by almost 13 percent from Nu. 25.45 million in 2011.
In real terms, while the sector noted
some improvement from 2011, it continued with a negative growth of 0.57 percent in 2012. This is the third time the sector is experiencing a negative growth in five years period from 2008 to 2012. The overall growth performance of the sector is contingent on the performance of major firms viz. THPA and CHPC Ltd. Distribution activities of BPC Ltd. noted an increase of 7.5 percent in 2012.
Its share to the total GDP stood at 12.37 percent, and showed some decline as other sectors of the economy get more diversified.
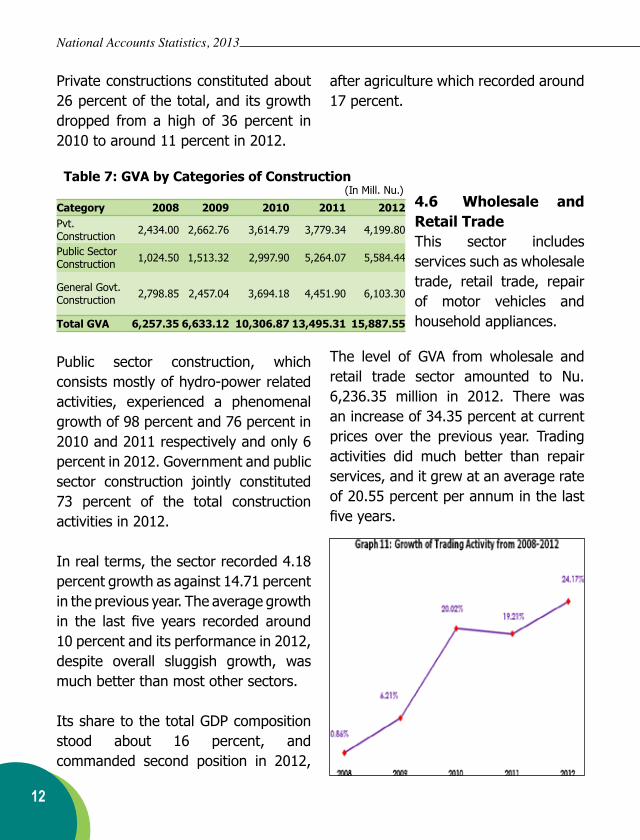
4.5 ConstructionGVA from construction sector at current prices recorded Nu. 15,887.54 million, posting a growth of 14.16 percent from Nu. 13,916.57 million in 2011.
12
National Accounts Statistics, 2013
Private constructions constituted about 26 percent of the total, and its growth dropped from a high of 36 percent in 2010 to around 11 percent in 2012.
Table 7: GVA by Categories of Construction (In Mill. Nu.)
Category 2008 2009 2010 2011 2012Pvt. Construction 2,434.00 2,662.76 3,614.79 3,779.34 4,199.80
Public Sector Construction 1,024.50 1,513.32 2,997.90 5,264.07 5,584.44
General Govt. Construction 2,798.85 2,457.04 3,694.18 4,451.90 6,103.30
Total GVA 6,257.35 6,633.12 10,306.87 13,495.31 15,887.55
Public sector construction, which consists mostly of hydro-power related activities, experienced a phenomenal growth of 98 percent and 76 percent in 2010 and 2011 respectively and only 6 percent in 2012. Government and public sector construction jointly constituted 73 percent of the total construction activities in 2012.
In real terms, the sector recorded 4.18 percent growth as against 14.71 percent in the previous year. The average growth in the last five years recorded around 10 percent and its performance in 2012, despite overall sluggish growth, was much better than most other sectors. Its share to the total GDP composition stood about 16 percent, and commanded second position in 2012,
after agriculture which recorded around 17 percent.
4.6 Wholesale and Retail TradeThis sector includes services such as wholesale trade, retail trade, repair of motor vehicles and household appliances.
The level of GVA from wholesale and retail trade sector amounted to Nu. 6,236.35 million in 2012. There was an increase of 34.35 percent at current prices over the previous year. Trading activities did much better than repair services, and it grew at an average rate of 20.55 percent per annum in the last five years.
13
National Accounts Statistics, 2013
In real terms, it recorded a growth of 24.17 percent as compared to 19.21 percent in the previous year. However, in terms of share it comprised only 6.27 percent of the total GDP.
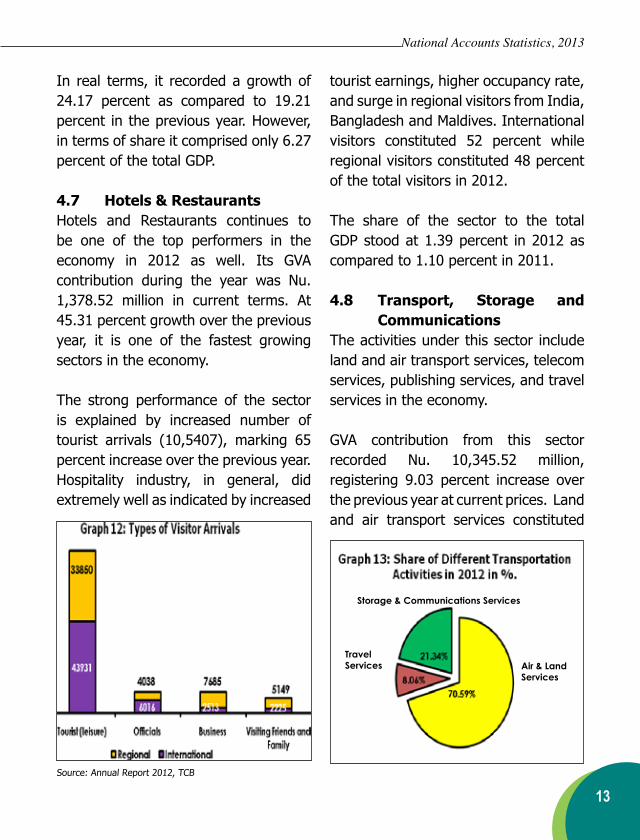
4.7 Hotels & RestaurantsHotels and Restaurants continues to be one of the top performers in the economy in 2012 as well. Its GVA contribution during the year was Nu. 1,378.52 million in current terms. At 45.31 percent growth over the previous year, it is one of the fastest growing sectors in the economy.
The strong performance of the sector is explained by increased number of tourist arrivals (10,5407), marking 65 percent increase over the previous year. Hospitality industry, in general, did extremely well as indicated by increased
Source: Annual Report 2012, TCB
tourist earnings, higher occupancy rate, and surge in regional visitors from India, Bangladesh and Maldives. International visitors constituted 52 percent while regional visitors constituted 48 percent of the total visitors in 2012.
The share of the sector to the total GDP stood at 1.39 percent in 2012 as compared to 1.10 percent in 2011.
4.8 Transport, Storage and Communications
The activities under this sector include land and air transport services, telecom services, publishing services, and travel services in the economy.
GVA contribution from this sector recorded Nu. 10,345.52 million, registering 9.03 percent increase over the previous year at current prices. Land and air transport services constituted
Air & Land Services
Travel Services
Storage & Communications Services
14
National Accounts Statistics, 2013
70.59 percent of the total contribution, storage & communications with 21.34 percent and travel services with 8.06 percent.
In real terms, it registered a growth of 1.09 percent which was contributed and sustained by improved performance of the tourism and hospitality industries.
In terms of its share to the total GDP, it accounted for 10.40 percent in 2012.
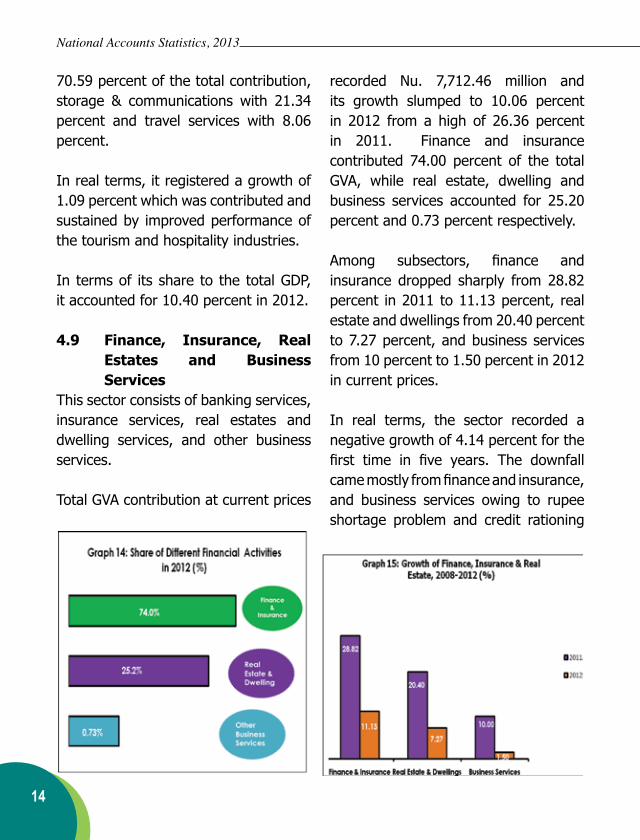
4.9 Finance, Insurance, Real Estates and Business Services
This sector consists of banking services, insurance services, real estates and dwelling services, and other business services.
Total GVA contribution at current prices
recorded Nu. 7,712.46 million and its growth slumped to 10.06 percent in 2012 from a high of 26.36 percent in 2011. Finance and insurance contributed 74.00 percent of the total GVA, while real estate, dwelling and business services accounted for 25.20 percent and 0.73 percent respectively.
Among subsectors, finance and insurance dropped sharply from 28.82 percent in 2011 to 11.13 percent, real estate and dwellings from 20.40 percent to 7.27 percent, and business services from 10 percent to 1.50 percent in 2012 in current prices.
In real terms, the sector recorded a negative growth of 4.14 percent for the first time in five years. The downfall came mostly from finance and insurance, and business services owing to rupee shortage problem and credit rationing
15
National Accounts Statistics, 2013
in the banking sector. However, real estate and dwelling showed a positive growth of 3.28 percent.
In terms of GDP share, the sector constituted about 8 percent of the total GDP, which is a decrease of almost 1 percent from the previous year. Finance and insurance constituted about 6 percent of the total GDP composition.
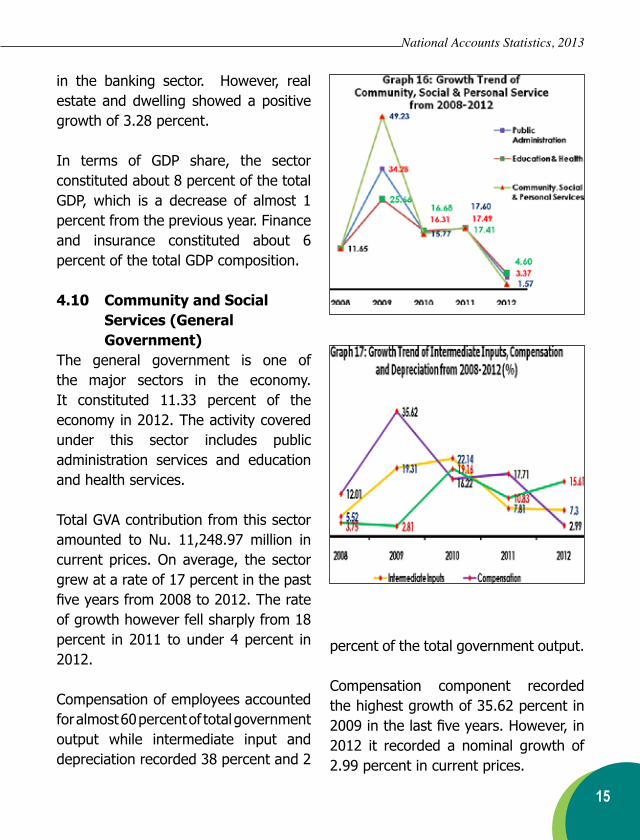
4.10 Community and Social Services (General Government)
The general government is one of the major sectors in the economy. It constituted 11.33 percent of the economy in 2012. The activity covered under this sector includes public administration services and education and health services.
Total GVA contribution from this sector amounted to Nu. 11,248.97 million in current prices. On average, the sector grew at a rate of 17 percent in the past five years from 2008 to 2012. The rate of growth however fell sharply from 18 percent in 2011 to under 4 percent in 2012.
Compensation of employees accounted for almost 60 percent of total government output while intermediate input and depreciation recorded 38 percent and 2
percent of the total government output.
Compensation component recorded the highest growth of 35.62 percent in 2009 in the last five years. However, in 2012 it recorded a nominal growth of 2.99 percent in current prices.

16
National Accounts Statistics, 2013
On the other hand, depreciation and intermediate inputs showed an upward trend indicating increased incurrence of expenditure for repairs and maintenance, and general consumption component.
In real terms, the sector noted a negative growth 6.43 percent in 2012, with health and education component recording around 8 percent fall in the growth.
4.11 Private, Social and Recreational Services
The share of this sector to the total GDP constituted less than 1 percent.
It includes activities such as social, recreational and sporting services.
GVA contribution from this sector recorded Nu. 390.05 million. The sector showed an increase from 13.44 percent in 2011 to 15.39 percent in current prices in 2012.
In real terms, it registered 2.66 percent growth, which is more or less the same as the previous year (2.75 percent).
17
National Accounts Statistics, 2013
5.1 GDP by Expenditure
GDP by expenditure approach measures how final goods and services produced during the year is used for consumption, saving, and investment purposes.
GDP estimates by expenditure approach takes into account three main aggregates viz. Final Consumption Expenditure, Gross Capital Formation, and Net Exports.
5.2 Final Consumption ExpenditureFinal Consumption Expenditure consists of private and government final consumption expenditure.
In 2012, the level of the consumption expenditure of private and government recorded Nu. 60,380.84 million, which is less than 1 percent increase from 2011. However in real terms it translated to a real growth of only 1.46 percent, dropping sharply from a high of 19 percent in 2009.
In terms of composition, 68 percent constituted private consumption component by households and NPISHs, and the other 32 percent pertained to the general government consumption.
Chapter 5GDP by Expenditure
5.2.1 Final Consumption Expenditure of Households
Final Consumption Expenditure of Households takes into account expenditure incurred by private households and NPISHs on consumer goods and services.
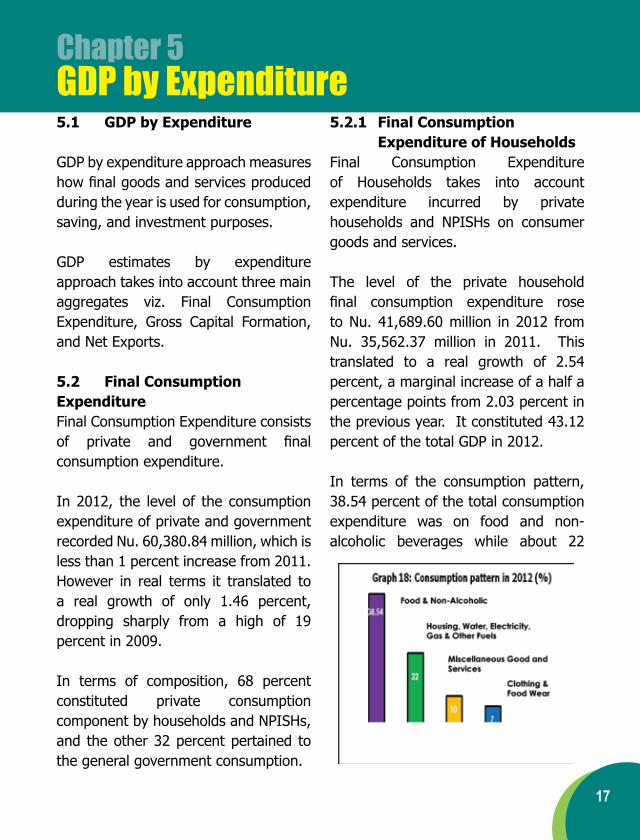
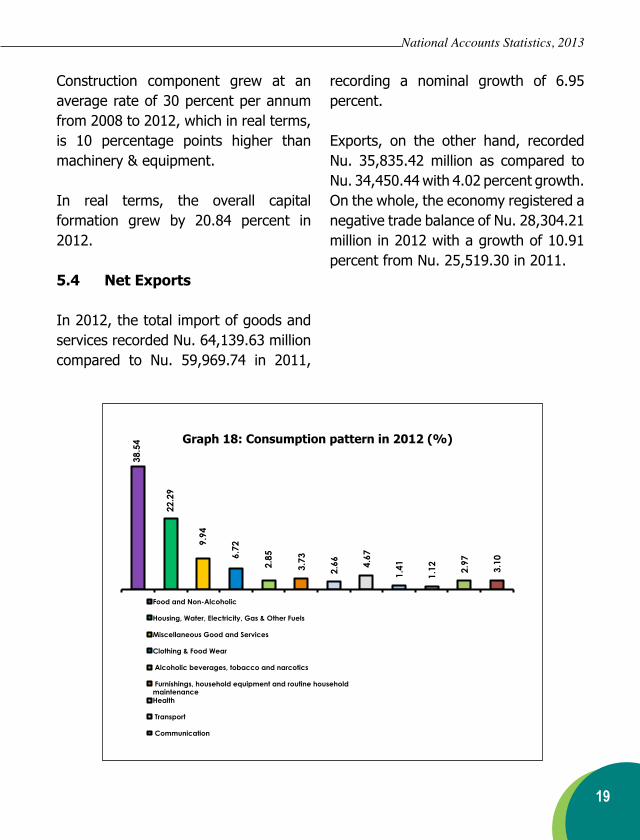
The level of the private household final consumption expenditure rose to Nu. 41,689.60 million in 2012 from Nu. 35,562.37 million in 2011. This translated to a real growth of 2.54 percent, a marginal increase of a half a percentage points from 2.03 percent in the previous year. It constituted 43.12 percent of the total GDP in 2012.
In terms of the consumption pattern, 38.54 percent of the total consumption expenditure was on food and non-alcoholic beverages while about 22
18
National Accounts Statistics, 2013
percent went for housing, water, electricity, gas and other fuels. Miscellaneous goods and services and clothing and footwear took about 10 percent and 7 percent of the total consumption expenditure respectively.
5.2.2 General Government Consumption Expenditure
The total final consumption expenditure of the government, on account of compensation on employees, consumption of fixed capital, and other intermediate consumption expenditures, recorded Nu. 18,691.15 million as compared to Nu. 17,047.84 million in 2011. After taking off the price effects, it translated to a real negative growth of 0.76 percent from 3.58 percent in the previous year.
Compensation of employees formed a major share of government expenditure and has been continuously on the rise in the past five years owing to factors such as annual salary increments and new entries into and exit from the civil service. This is followed by office consumables such as repairs and maintenance expenses, S&M expenses, travels, utilities, and other operating expenses.
Although consumption of fixed capital over the years is on the rise because
of increased current expenditures of the government, the increase recorded is far less than the increase in intermediate inputs and compensation of employees.
The sector constituted about 20 percent of the total GDP.
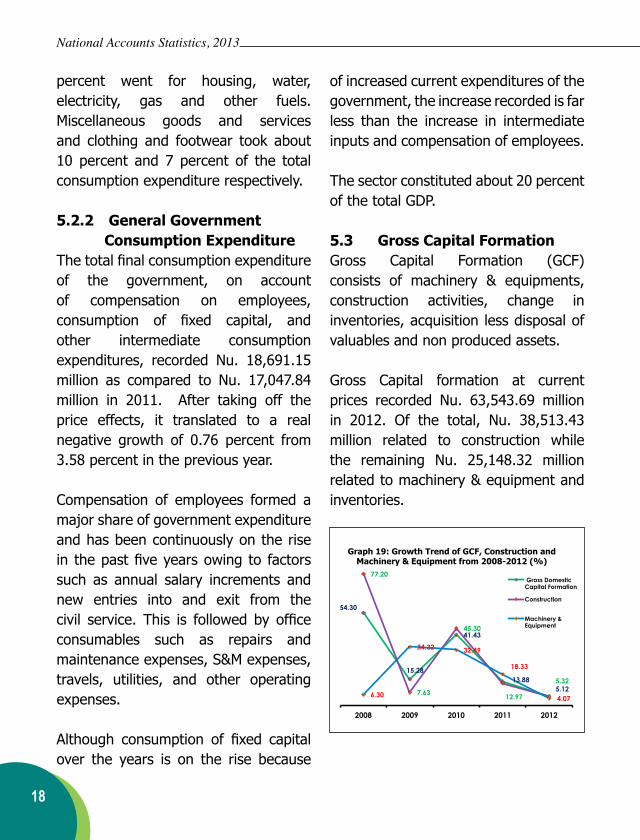
5.3 Gross Capital FormationGross Capital Formation (GCF) consists of machinery & equipments, construction activities, change in inventories, acquisition less disposal of valuables and non produced assets.
Gross Capital formation at current prices recorded Nu. 63,543.69 million in 2012. Of the total, Nu. 38,513.43 million related to construction while the remaining Nu. 25,148.32 million related to machinery & equipment and inventories.
54.30
15.28
41.43
13.88 5.12
77.20
7.63
45.30
12.97
5.32
6.30
34.32 32.49
18.33
4.07
2008 2009 2010 2011 2012
Graph 19: Growth Trend of GCF, Construction and Machinery & Equipment from 2008-2012 (%)
Gross Domestic Capital Formation
Construction
Machinery & Equipment
38.5
4
22.
29
9.9
4
6.7
2
2.8
5
3.73
2.66
4.67
1.41
1.12
2.97
3.10
Graph 18: Consumption pattern in 2012 (%)
Food and Non-Alcoholic
Housing, Water, Electricity, Gas & Other Fuels
Miscellaneous Good and Services
Clothing & Food Wear
Alcoholic beverages, tobacco and narcotics
Furnishings, household equipment and routine household maintenance Health
Transport
Communication
19
National Accounts Statistics, 2013
Construction component grew at an average rate of 30 percent per annum from 2008 to 2012, which in real terms, is 10 percentage points higher than machinery & equipment.
In real terms, the overall capital formation grew by 20.84 percent in 2012.
5.4 Net Exports
In 2012, the total import of goods and services recorded Nu. 64,139.63 million compared to Nu. 59,969.74 in 2011,
recording a nominal growth of 6.95 percent.
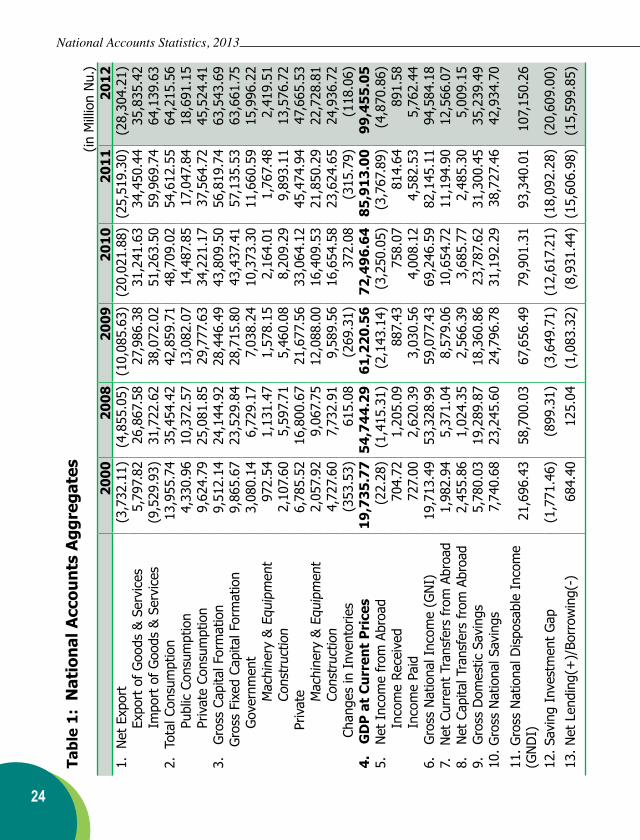
Exports, on the other hand, recorded Nu. 35,835.42 million as compared to Nu. 34,450.44 with 4.02 percent growth. On the whole, the economy registered a negative trade balance of Nu. 28,304.21 million in 2012 with a growth of 10.91 percent from Nu. 25,519.30 in 2011.
54.30
15.28
41.43
13.88 5.12
77.20
7.63
45.30
12.97
5.32
6.30
34.32 32.49
18.33
4.07
2008 2009 2010 2011 2012
Graph 19: Growth Trend of GCF, Construction and Machinery & Equipment from 2008-2012 (%)
Gross Domestic Capital Formation
Construction
Machinery & Equipment
38.5
4
22.
29
9.9
4
6.7
2
2.8
5
3.73
2.66
4.67
1.41
1.12
2.97
3.10
Graph 18: Consumption pattern in 2012 (%)
Food and Non-Alcoholic
Housing, Water, Electricity, Gas & Other Fuels
Miscellaneous Good and Services
Clothing & Food Wear
Alcoholic beverages, tobacco and narcotics
Furnishings, household equipment and routine household maintenance Health
Transport
Communication
20
National Accounts Statistics, 2013
6.1 Agriculture, Livestock and Forestry6.1.1 CropsGVA for agricultural crops is estimated based on agricultural census and survey data produced by MoAF from time to time. For 2012 estimates, provisional figures supplied by PPD, MoAF were used. 6.1.2 LivestockThe estimate for this sub-sector is based on livestock population supplied by MoAF. GVA is estimated separately for each livestock species and products and consolidated at the sub-sectoral level. 6.1.3 ForestryInformation from Natural Resources Development Corporation (NRDC Ltd.) and RNR data are used for estimating GVA from forestry and logging activities. NRDC Ltd. covers almost 80 percent of the total forestry activities in the country.
Production of firewood is estimated in terms of number of backloads (rural) and truck loads (urban). In cases where the information is not available, GVA estimation is approximated using population growth rate.
Chapter 6Source of Information and Methodology
6.2 Mining and QuarryingGVA from mining and quarrying is estimated based on information provided by the Department of Geology and Mines, MoEA.
6.3 ManufacturingContribution from manufacturing activities is estimated from the audited annual reports of companies. In the absence of the audited annual reports, the GVARs of the similar companies/activities are accordingly applied.
6.4 Electricity and Water SupplyGross value added from this sub-sector is estimated from the audited annual reports of all electricity generating, transmission and distributing companies.
Gross value added for water and sewerage is based on annual revenue collection figures of the municipal bodies.
6.5 ConstructionCommodity flow approach is used to estimate GVA from construction activities. It includes construction of all infrastructures such as buildings, roads, bridges, thatched and non-thatched
21
National Accounts Statistics, 2013
houses, orchard developments etc undertaken by the government and private sector during an accounting period.
The information on total cement utilized is obtained from the cement manufacturing firms while wood supply and utilization is obtained from NRDC Ltd.
6.6 Wholesale & Retail TradeThe estimate for this sector is based on the sales turnover of business firms. It is estimated using the total sales tax collection figures supplied by DRC, MoF.
6.7 Hotels & RestaurantsThis is also based on sales turnover figures of hotels and restaurants provided by DRC, MoF.
6.8 Transport, Storage & Communications
GVA for air transportation is estimated from the audited annual report of Druk Air Corporation Ltd., while surface transport services such as buses, trucks and taxis are estimated from information provided by RSTA, MoIC.
GVA for storage activities is computed from information provided by Food Corporation of Bhutan Ltd.
6.9 Finance, Insurance, Real Estates and Business Services
GVA contribution from this sector is based on annual audited reports of the financial institutions, investment companies and real estate developers. The gross output of the government dwellings is based on the annual budget report of the Department of National Budget and the BLSS report for private dwellings.
6.10 Community and Social ServicesThe source of information for this sector is the Annual Budget Report of the government. 6.11 Private, Social &
Recreational ServicesEstimation is based on findings and results of BLSS conducted by NSB every five years.
6.12 Final ConsumptionGovernment consumption is estimated based on the Annual Budget Document, while household consumption is estimated from BLSS report.
6.13 Capital FormationCapital formation from machinery & equipment is obtained from the Annual
22
National Accounts Statistics, 2013
Trade Statistics Report published by DRC, MoF. Construction outputs are estimated after making adjustments for minor repairs and maintenance. The change in stocks is estimated from the annual returns of the firms/establishments.
6.14 Net ExportThe balance of payment report of Royal Monetary Authority of Bhutan is the main source of information for net export.
23
National Accounts Statistics, 2013
Statistical Tables>>
24
National Accounts Statistics, 2013
Tabl
e 1:
Nat
iona
l Acc
ount
s A
ggre
gate
s(in
Mill
ion
Nu.
)
2000
2008
2009
2010
2011
2012
1. N
et E
xpor
t (
3,73
2.11
) (
4,85
5.05
)(1
0,08
5.63
)(2
0,02
1.88
)(2
5,51
9.30
)(2
8,30
4.21
)Ex
port
of
Goo
ds &
Ser
vice
s
5,
797.
82
26
,867
.58
2
7,98
6.38
31,2
41.6
3
34,4
50.4
4
35,
835.
42
Impo
rt o
f G
oods
& S
ervi
ces
(9,
529.
93)
31
,722
.62
3
8,07
2.02
51,2
63.5
0
59,9
69.7
4
64
,139
.63
2. To
tal C
onsu
mpt
ion
13
,955
.74
35
,454
.42
4
2,85
9.71
48,7
09.0
2
54,6
12.5
5
64
,215
.56
Publ
ic C
onsu
mpt
ion
4
,330
.96
10
,372
.57
1
3,08
2.07
14,
487.
85
1
7,04
7.84
18,6
91.1
5 Pr
ivat
e Co
nsum
ptio
n
9,
624.
79
25,
081.
85
2
9,77
7.63
34,2
21.1
7
37,
564.
72
4
5,52
4.41
3.
G
ross
Cap
ital F
orm
atio
n
9,5
12.1
4
24,1
44.9
2
28,
446.
49
43
,809
.50
56
,819
.74
6
3,54
3.69
G
ross
Fix
ed C
apita
l For
mat
ion
9
,865
.67
23
,529
.84
2
8,71
5.80
43,
437.
41
57
,135
.53
63,6
61.7
5 G
over
nmen
t
3,0
80.1
4
6,7
29.1
7
7
,038
.24
1
0,37
3.30
1
1,66
0.59
15,9
96.2
2 M
achi
nery
& E
quip
men
t
972.
54
1,
131.
47
1,57
8.15
2,1
64.0
1
1,
767.
48
2,4
19.5
1 Co
nstr
uctio
n
2,
107.
60
5,59
7.71
5,
460.
08
8,20
9.29
9,
893.
11
1
3,57
6.72
Pr
ivat
e
6,7
85.5
2
16,8
00.6
7
21,
677.
56
33
,064
.12
45
,474
.94
47,6
65.5
3 M
achi
nery
& E
quip
men
t
2,
057.
92
9,06
7.75
12,0
88.0
0
16,
409.
53
21
,850
.29
22,7
28.8
1 Co
nstr
uctio
n
4,
727.
60
7,73
2.91
9,
589.
56
16
,654
.58
23
,624
.65
24,9
36.7
2 C
hang
es in
Inv
ento
ries
(353
.53)
61
5.08
(2
69.3
1)
372
.08
(
315.
79)
(118
.06)
4.
GD
P a
t C
urre
nt P
rice
s19
,735
.77
54,7
44.2
9 6
1,22
0.56
72
,496
.64
85,
913.
00
99,
455.
05
5. N
et I
ncom
e fr
om A
broa
d(2
2.28
) (
1,41
5.31
)
(2,1
43.1
4)
(3,2
50.0
5)
(3,7
67.8
9)
(4,
870.
86)
Inco
me
Rece
ived
704.
72
1,
205.
09
8
87.4
3
758
.07
8
14.6
4
89
1.58
In
com
e Pa
id
7
27.0
0
2,6
20.3
9
3,
030.
56
4
,008
.12
4,58
2.53
5
,762
.44
6. G
ross
Nat
iona
l Inc
ome
(GN
I)
19,7
13.4
9
53,3
28.9
9
59,
077.
43
69
,246
.59
82
,145
.11
94,5
84.1
8 7.
N
et C
urre
nt T
rans
fers
fro
m A
broa
d
1,9
82.9
4
5,3
71.0
4
8,
579.
06
10
,654
.72
11
,194
.90
1
2,56
6.07
8.
N
et C
apita
l Tra
nsfe
rs f
rom
Abr
oad
2
,455
.86
1
,024
.35
2,56
6.39
3,6
85.7
7
2,
485.
30
5,0
09.1
5 9.
G
ross
Dom
estic
Sav
ings
5
,780
.03
19
,289
.87
1
8,36
0.86
23,
787.
62
31,
300.
45
35
,239
.49
10. G
ross
Nat
iona
l Sav
ings
7,74
0.68
2
3,24
5.60
24,
796.
78
31
,192
.29
3
8,72
7.46
42,
934.
70
11. G
ross
Nat
iona
l Dis
posa
ble
Inco
me
(GN
DI)
21
,696
.43
58
,700
.03
6
7,65
6.49
79,9
01.3
1
93,3
40.0
1
107,
150.
26
12. S
avin
g In
vest
men
t G
ap (
1,77
1.46
)
(8
99.3
1)
(3,6
49.7
1) (
12,6
17.2
1)(1
8,09
2.28
) (
20,6
09.0
0)13
. Net
Len
ding
(+)/
Borr
owin
g(-)
68
4.40
125.
04
(1
,083
.32)
(8
,931
.44)
(15,
606.
98)
(15
,599
.85)

25
National Accounts Statistics, 2013Ta
ble
2: G
DP
by
Econ
omic
Act
ivit
y at
Cur
rent
Pri
ces
(in M
illio
n N
u.)
Sect
ors
2000
2008
2009
2010
2011
2012
1. A
gric
ultu
re, L
ives
tock
& F
ores
try
5,28
9.42
10,0
78.2
811
,158
.67
12,1
77.8
313
,868
.37r
16,8
93.5
3p
1.1
Cro
ps2,
515.
985,
060.
595,
668.
246,
530.
147,
665.
379,
925.
761.
2 L
ives
tock
1,
468.
382,
624.
542,
894.
923,
109.
683,
473.
203,
993.
831.
3 F
ores
try
& L
oggi
ng1,
305.
072,
393.
152,
595.
512,
538.
012,
729.
792,
973.
942.
Min
ing
& Q
uarr
ying
314.
911,
251.
991,
392.
031,
616.
891,
941.
731,
961.
963.
Man
ufac
turin
g1,
618.
854,
593.
445,
017.
236,
324.
157,
044.
828,
934.
494.
Ele
ctric
ity &
W
ater
Sup
ply
2,25
5.30
11,5
52.2
211
,813
.45
12,7
63.6
011
,911
.61
12,3
03.1
45.
Con
stru
ctio
n2,
761.
416,
250.
987,
469.
6810
,308
.86
13,9
16.5
715
,887
.54
6. W
hole
sale
& R
etai
l Tra
de88
2.11
2,69
4.65
2,93
5.27
3,75
2.55
4,64
1.79
6,23
6.35
7. H
otel
s &
Res
taur
ants
88.1
456
9.15
537.
6160
8.01
948.
651,
378.
52
8. T
rans
port
, Sto
rage
&
Com
mun
icat
ions
1,79
9.67
5,36
5.77
5,98
9.87
6,94
3.32
9,48
9.10
10,3
45.5
2
9. F
inan
cing
, Ins
uran
ce, R
eal
Esta
tes
& Bu
sine
ss S
ervi
ces
1,39
2.03
4,57
6.55
4,96
2.11
5,54
5.89
7,00
7.73
7,71
2.46
9.1
Fin
ance
& I
nsur
ance
760.
963,
174.
353,
466.
213,
987.
665,
136.
845,
708.
779.
2 R
eal E
stat
e &
Dw
ellin
gs63
1.07
1,37
4.00
1,46
0.30
1,50
7.70
1,81
5.30
1,94
7.27
9.3
Bus
ines
s Se
rvic
es28
.20
35.6
050
.53
55.5
956
.42
10.C
omm
unity
, Soc
ial &
Per
sona
l Se
rvic
es2,
813.
845,
930.
427,
963.
339,
262.
5010
,882
.24
11,2
48.9
7
10.1
Pub
lic A
dmin
istr
atio
n1,
779.
243,
762.
714,
728.
375,
517.
286,
478.
036,
775.
7410
.2 E
duca
tion
& H
ealth
1,03
4.60
2,16
7.71
3,23
4.96
3,74
5.21
4,40
4.22
4,47
3.23
11. P
rivat
e So
cial
& R
ecre
atio
nal
Serv
ices
96.2
426
7.73
276.
4229
7.97
338.
0339
0.05
12. T
axes
Net
of
Subs
idie
s42
3.85
1,61
3.12
1,70
4.90
2,89
5.07
3,92
2.37
6,16
2.52
G
DP
19,7
35.7
754
,744
.29
61,2
20.5
672
,496
.64
85,9
13.0
099
,455
.05

26
National Accounts Statistics, 2013
Tabl
e 3
: G
DP
Gro
wth
by
Econ
omic
Act
ivit
y at
Cur
rent
Pri
ces
(in %
)Se
ctor
s20
00
2007
20
08
2009
20
10
2011
20
12
1. A
gric
ultu
re, L
ives
tock
& F
ores
try
11.3
26.
059.
1410
.72
9.13
13.8
821
.81
1.1
Cro
ps9.
8411
.50
15.6
212
.01
15.2
117
.38
29.4
9
1.2
Liv
esto
ck
11.9
92.
613.
7010
.30
7.42
11.6
914
.99
1.3
For
estr
y &
Log
ging
13.5
20.
492.
888.
46(2
.22)
7.56
8.94
2. M
inin
g &
Qua
rryi
ng(1
5.51
)1.
4440
.60
11.1
916
.15
20.0
91.
04
3. M
anuf
actu
ring
3.98
30.1
913
.89
9.23
26.0
511
.40
26.8
2
4. E
lect
ricity
& W
ater
Sup
ply
(2.4
9)88
.81
14.5
82.
268.
04(6
.68)
3.29
5. C
onst
ruct
ion
40.3
312
.65
(7.8
2)19
.50
38.0
135
.00
14.1
6
6. W
hole
sale
& R
etai
l Tra
de24
.64
7.77
7.91
8.93
27.8
423
.70
34.3
5
7. H
otel
s &
Res
taur
ants
0.76
22.2
954
.61
(5.5
4)13
.10
56.0
345
.31
8. T
rans
port
, Sto
rage
& C
omm
unic
atio
ns9.
969.
1320
.07
11.6
315
.92
36.6
79.
039.
Fin
anci
ng, I
nsur
ance
, Rea
l Est
ates
&
Busi
ness
Ser
vice
s15
.44
18.2
311
.48
8.42
11.7
626
.36
10.0
69.
1 F
inan
ce &
Ins
uran
ce22
.45
22.1
313
.31
9.19
15.0
428
.82
11.1
3
9.2
Rea
l Est
ate
& D
wel
lings
7.99
10.0
75.
906.
283.
2520
.40
7.27
9.3
Bus
ines
s Se
rvic
es33
6.04
26.2
441
.94
10.0
01.
50
10. C
omm
unity
, Soc
ial &
Per
sona
l Ser
vice
s1.
738.
5211
.65
34.2
816
.31
17.4
93.
37
10.1
Pub
lic A
dmin
istr
atio
n4.
6411
.65
25.6
616
.68
17.4
14.
60
10.2
Edu
catio
n &
Hea
lth15
.98
11.6
549
.23
15.7
717
.60
1.57
11. P
rivat
e So
cial
& R
ecre
atio
nal S
ervi
ces
13
.79
10.6
83.
247.
8013
.44
15.3
9
12. T
axes
Net
of
Subs
idie
s(3
1.75
)7.
8511
.83
5.69
69.8
135
.48
57.1
1
GD
P10
.91
21.5
910
.69
11.8
318
.42
18.5
115
.76
27
National Accounts Statistics, 2013Ta
ble
4 :
GD
P S
ecto
ral S
hare
at
Cur
rent
Pri
ces
(in %
)Se
ctor
s20
0020
0820
0920
1020
1120
12
1. A
gric
ultu
re, L
ives
tock
& F
ores
try
26.8
018
.41
18.2
316
.80
16.1
416
.99
1.1
Cro
ps12
.75
9.24
9.26
9.01
8.92
9.98
1.2
Liv
esto
ck7.
444.
794.
734.
294.
044.
02
1.3
For
estr
y &
Log
ging
6.61
4.37
4.24
3.50
3.18
2.99
2. M
inin
g &
Qua
rryi
ng1.
602.
292.
272.
232.
261.
97
3. M
anuf
actu
ring
8.20
8.39
8.20
8.72
8.20
8.98
4. E
lect
ricity
& W
ater
Sup
ply
11.4
321
.10
19.3
017
.61
13.8
612
.37
5. C
onst
ruct
ion
13.9
911
.42
12.2
014
.22
16.2
015
.97
6. W
hole
sale
& R
etai
l Tra
de4.
474.
924.
795.
185.
406.
27
7. H
otel
s &
Res
taur
ants
0.45
1.04
0.88
0.84
1.10
1.39
8. T
rans
port
, Sto
rage
& C
omm
unic
atio
ns9.
129.
809.
789.
5811
.05
10.4
09.
Fina
ncin
g, I
nsur
ance
, Rea
l Est
ates
& B
usin
ess
Serv
ices
7.05
8.36
8.11
7.65
8.16
7.75
9.1
Fin
ance
& I
nsur
ance
3.86
5.80
5.66
5.50
5.98
5.74
9.2
Rea
l Est
ate
& D
wel
lings
3.20
2.51
2.39
2.08
2.11
1.96
9.3
Bus
ines
s Se
rvic
es-
0.05
0.06
0.07
0.06
0.06
10. C
omm
unity
, Soc
ial &
Per
sona
l Ser
vice
s14
.26
10.8
313
.01
12.7
812
.67
11.3
1
11. P
rivat
e So
cial
& R
ecre
atio
nal S
ervi
ces
0.49
0.49
0.45
0.41
0.39
0.39
12. T
axes
Net
of
Subs
idie
s2.
152.
952.
783.
994.
576.
20
GD
P10
010
010
010
010
010
0
28
National Accounts Statistics, 2013
Tabl
e 5:
GD
P b
y Ec
onom
ic A
ctiv
ity
at C
onst
ant
Pri
ces
(i
n M
illio
n N
u.)
Sect
ors
2000
2008
2009
2010
2011
2012
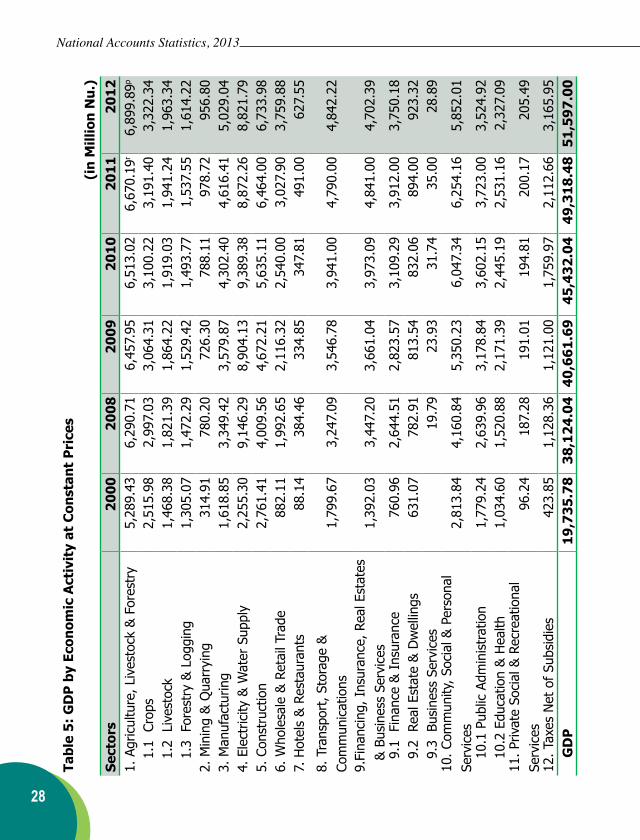
1. A
gric
ultu
re, L
ives
tock
& F
ores
try
5,28
9.43
6,29
0.71
6,45
7.95
6,51
3.02
6,67
0.19
r6,
899.
89p
1.1
Cro
ps2,
515.
982,
997.
033,
064.
313,
100.
223,
191.
403,
322.
341.
2 L
ives
tock
1,46
8.38
1,82
1.39
1,86
4.22
1,91
9.03
1,94
1.24
1,96
3.34
1.3
For
estr
y &
Log
ging
1,30
5.07
1,47
2.29
1,52
9.42
1,49
3.77
1,53
7.55
1,61
4.22
2. M
inin
g &
Qua
rryi
ng31
4.91
780.
2072
6.30
788.
1197
8.72
956.
803.
Man
ufac
turin
g1,
618.
853,
349.
423,
579.
874,
302.
404,
616.
415,
029.
044.
Ele
ctric
ity &
Wat
er S
uppl
y2,
255.
309,
146.
298,
904.
139,
389.
388,
872.
268,
821.
795.
Con
stru
ctio
n2,
761.
414,
009.
564,
672.
215,
635.
116,
464.
006,
733.
986.
Who
lesa
le &
Ret
ail T
rade
882.
111,
992.
652,
116.
322,
540.
003,
027.
903,
759.
887.
Hot
els
& R
esta
uran
ts88
.14
384.
4633
4.85
347.
8149
1.00
627.
55
8. T
rans
port
, Sto
rage
&
Com
mun
icat
ions
1,79
9.67
3,24
7.09
3,54
6.78
3,94
1.00
4,79
0.00
4,84
2.22
9.Fi
nanc
ing,
Ins
uran
ce, R
eal E
stat
es
& B
usin
ess
Serv
ices
1,39
2.03
3,44
7.20
3,66
1.04
3,97
3.09
4,84
1.00
4,70
2.39
9.1
Fin
ance
& I
nsur
ance
760.
962,
644.
512,
823.
573,
109.
293,
912.
003,
750.
189.
2 R
eal E
stat
e &
Dw
ellin
gs63
1.07
782.
9181
3.54
832.
0689
4.00
923.
329.
3 B
usin
ess
Serv
ices
19.7
923
.93
31.7
435
.00
28.8
910
. Com
mun
ity, S
ocia
l & P
erso
nal
Serv
ices
2,81
3.84
4,16
0.84
5,35
0.23
6,04
7.34
6,25
4.16
5,85
2.01
10.1
Pub
lic A
dmin
istr
atio
n1,
779.
242,
639.
963,
178.
843,
602.
153,
723.
003,
524.
9210
.2 E
duca
tion
& H
ealth
1,03
4.60
1,52
0.88
2,17
1.39
2,44
5.19
2,53
1.16
2,32
7.09
11. P
rivat
e So
cial
& R
ecre
atio
nal
Serv
ices
96.2
418
7.28
191.
0119
4.81
200.
1720
5.49
12. T
axes
Net
of
Subs
idie
s42
3.85
1,12
8.36
1,12
1.00
1,75
9.97
2,11
2.66
3,16
5.95
GD
P19
,735
.78
38,1
24.0
440
,661
.69
45,4
32.0
449
,318
.48
51,5
97.0
0
29
National Accounts Statistics, 2013
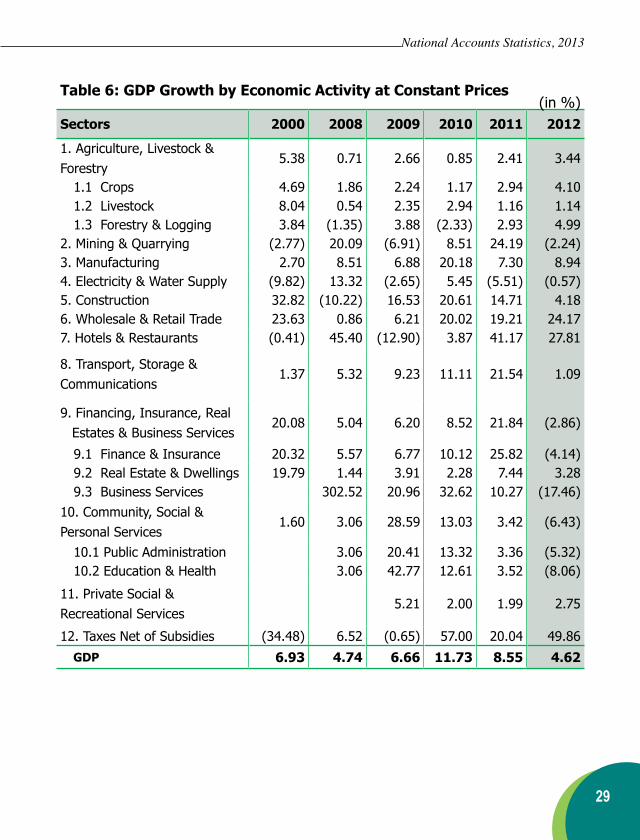
Table 6: GDP Growth by Economic Activity at Constant Prices(in %)
Sectors 2000 2008 2009 2010 2011 2012
1. Agriculture, Livestock & Forestry
5.38 0.71 2.66 0.85 2.41 3.44
1.1 Crops 4.69 1.86 2.24 1.17 2.94 4.101.2 Livestock 8.04 0.54 2.35 2.94 1.16 1.141.3 Forestry & Logging 3.84 (1.35) 3.88 (2.33) 2.93 4.99
2. Mining & Quarrying (2.77) 20.09 (6.91) 8.51 24.19 (2.24)3. Manufacturing 2.70 8.51 6.88 20.18 7.30 8.944. Electricity & Water Supply (9.82) 13.32 (2.65) 5.45 (5.51) (0.57)5. Construction 32.82 (10.22) 16.53 20.61 14.71 4.186. Wholesale & Retail Trade 23.63 0.86 6.21 20.02 19.21 24.177. Hotels & Restaurants (0.41) 45.40 (12.90) 3.87 41.17 27.81
8. Transport, Storage & Communications
1.37 5.32 9.23 11.11 21.54 1.09
9. Financing, Insurance, Real Estates & Business Services
20.08 5.04 6.20 8.52 21.84 (2.86)
9.1 Finance & Insurance 20.32 5.57 6.77 10.12 25.82 (4.14)9.2 Real Estate & Dwellings 19.79 1.44 3.91 2.28 7.44 3.289.3 Business Services 302.52 20.96 32.62 10.27 (17.46)
10. Community, Social & Personal Services
1.60 3.06 28.59 13.03 3.42 (6.43)
10.1 Public Administration 3.06 20.41 13.32 3.36 (5.32)10.2 Education & Health 3.06 42.77 12.61 3.52 (8.06)
11. Private Social & Recreational Services
5.21 2.00 1.99 2.75
12. Taxes Net of Subsidies (34.48) 6.52 (0.65) 57.00 20.04 49.86GDP 6.93 4.74 6.66 11.73 8.55 4.62
30
National Accounts Statistics, 2013
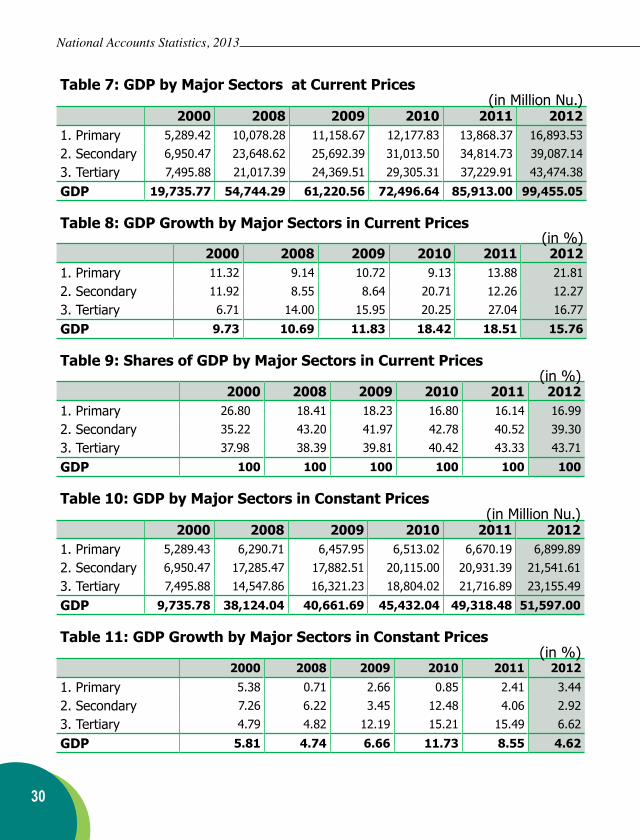
Table 7: GDP by Major Sectors at Current Prices (in Million Nu.)
2000 2008 2009 2010 2011 20121. Primary 5,289.42 10,078.28 11,158.67 12,177.83 13,868.37 16,893.53
2. Secondary 6,950.47 23,648.62 25,692.39 31,013.50 34,814.73 39,087.14
3. Tertiary 7,495.88 21,017.39 24,369.51 29,305.31 37,229.91 43,474.38
GDP 19,735.77 54,744.29 61,220.56 72,496.64 85,913.00 99,455.05
Table 8: GDP Growth by Major Sectors in Current Prices (in %) 2000 2008 2009 2010 2011 20121. Primary 11.32 9.14 10.72 9.13 13.88 21.81
2. Secondary 11.92 8.55 8.64 20.71 12.26 12.27
3. Tertiary 6.71 14.00 15.95 20.25 27.04 16.77
GDP 9.73 10.69 11.83 18.42 18.51 15.76
Table 9: Shares of GDP by Major Sectors in Current Prices(in %)
2000 2008 2009 2010 2011 20121. Primary 26.80 18.41 18.23 16.80 16.14 16.99
2. Secondary 35.22 43.20 41.97 42.78 40.52 39.30
3. Tertiary 37.98 38.39 39.81 40.42 43.33 43.71
GDP 100 100 100 100 100 100
Table 10: GDP by Major Sectors in Constant Prices(in Million Nu.)
2000 2008 2009 2010 2011 20121. Primary 5,289.43 6,290.71 6,457.95 6,513.02 6,670.19 6,899.89
2. Secondary 6,950.47 17,285.47 17,882.51 20,115.00 20,931.39 21,541.61
3. Tertiary 7,495.88 14,547.86 16,321.23 18,804.02 21,716.89 23,155.49
GDP 9,735.78 38,124.04 40,661.69 45,432.04 49,318.48 51,597.00
Table 11: GDP Growth by Major Sectors in Constant Prices (in %)
2000 2008 2009 2010 2011 2012
1. Primary 5.38 0.71 2.66 0.85 2.41 3.44
2. Secondary 7.26 6.22 3.45 12.48 4.06 2.92
3. Tertiary 4.79 4.82 12.19 15.21 15.49 6.62
GDP 5.81 4.74 6.66 11.73 8.55 4.62
31
National Accounts Statistics, 2013
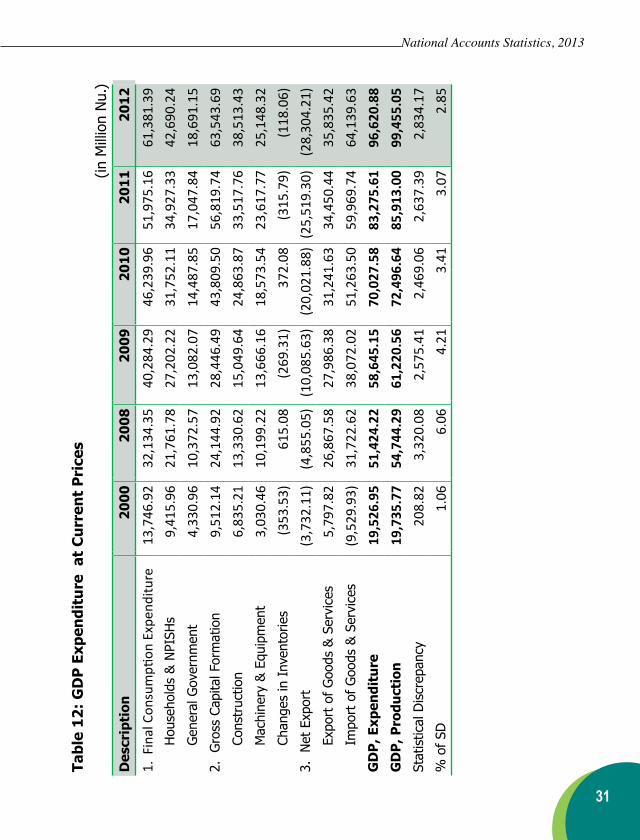
Tabl
e 12
: G
DP
Exp
endi
ture
at
Cur
rent
Pri
ces
(in
Mill
ion
Nu.
)
Des
crip
tion
2000
2008
2009
2010
2011
2012
1. F
inal
Con
sum
ption
Exp
endi
ture
13,7
46.9
232
,134
.35
40,2
84.2
946
,239
.96
51,9
75.1
661
,381
.39
Hou
seho
lds
& N
PISH
s9,
415.
9621
,761
.78
27,2
02.2
231
,752
.11
34,9
27.3
342
,690
.24
Gen
eral
Gov
ernm
ent
4,33
0.96
10,3
72.5
713
,082
.07
14,4
87.8
517
,047
.84
18,6
91.1
5
2.
Gro
ss C
apita
l For
mat
ion
9,51
2.14
24,1
44.9
228
,446
.49
43,8
09.5
056
,819
.74
63,5
43.6
9
Cons
truc
tion
6,83
5.21
13,3
30.6
215
,049
.64
24,8
63.8
733
,517
.76
38,5
13.4
3
Mac
hine
ry &
Equ
ipm
ent
3,03
0.46
10,1
99.2
213
,666
.16
18,5
73.5
423
,617
.77
25,1
48.3
2
Chan
ges
in I
nven
torie
s(3
53.5
3)61
5.08
(269
.31)
372.
08(3
15.7
9)(1
18.0
6)
3.
Net
Exp
ort
(3,7
32.1
1)(4
,855
.05)
(10,
085.
63)
(20,
021.
88)
(25,
519.
30)
(28,
304.
21)
Expo
rt o
f G
oods
& S
ervi
ces
5,79
7.82
26,8
67.5
827
,986
.38
31,2
41.6
334
,450
.44
35,8
35.4
2
Impo
rt o
f G
oods
& S
ervi
ces
(9,5
29.9
3)31
,722
.62
38,0
72.0
251
,263
.50
59,9
69.7
464
,139
.63
GD
P, E
xpen
ditu
re19
,526
.95
51,4
24.2
258
,645
.15
70,0
27.5
883
,275
.61
96,6
20.8
8
GD
P, P
rodu
ctio
n19
,735
.77
54,7
44.2
961
,220
.56
72,4
96.6
485
,913
.00
99,4
55.0
5
Stat
istic
al D
iscr
epan
cy20
8.82
3,32
0.08
2,57
5.41
2,46
9.06
2,63
7.39
2,83
4.17
% o
f SD
1.06
6.06
4.21
3.41
3.07
2.85
32
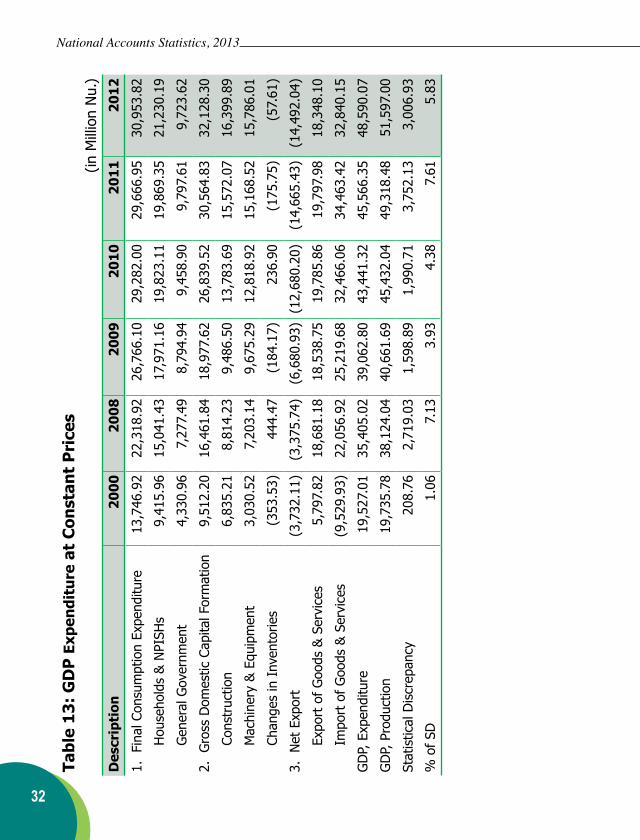
National Accounts Statistics, 2013
Tabl
e 13
: G
DP
Exp
endi
ture
at
Con
stan
t P
rice
s (in
Mill
ion
Nu.
)D
escr
ipti
on20
0020
0820
0920
1020
1120
12
1.
Fina
l Con
sum
ptio
n Ex
pend
iture
13,7
46.9
222
,318
.92
26,7
66.1
029
,282
.00
29,6
66.9
530
,953
.82
Hou
seho
lds
& N
PISH
s9,
415.
9615
,041
.43
17,9
71.1
619
,823
.11
19,8
69.3
521
,230
.19
Gen
eral
Gov
ernm
ent
4,33
0.96
7,27
7.49
8,79
4.94
9,45
8.90
9,79
7.61
9,72
3.62
2.
Gro
ss D
omes
tic C
apita
l For
mat
ion
9,51
2.20
16,4
61.8
418
,977
.62
26,8
39.5
230
,564
.83
32,1
28.3
0
Cons
truc
tion
6,83
5.21
8,81
4.23
9,48
6.50
13,7
83.6
915
,572
.07
16,3
99.8
9
Mac
hine
ry &
Equ
ipm
ent
3,03
0.52
7,20
3.14
9,67
5.29
12,8
18.9
215
,168
.52
15,7
86.0
1
Chan
ges
in I
nven
torie
s(3
53.5
3)44
4.47
(184
.17)
236.
90(1
75.7
5)(5
7.61
)
3.
Net
Exp
ort
(3,7
32.1
1)(3
,375
.74)
(6,6
80.9
3)(1
2,68
0.20
)(1
4,66
5.43
)(1
4,49
2.04
)
Expo
rt o
f G
oods
& S
ervi
ces
5,79
7.82
18,6
81.1
818
,538
.75
19,7
85.8
619
,797
.98
18,3
48.1
0
Impo
rt o
f G
oods
& S
ervi
ces
(9,5
29.9
3)22
,056
.92
25,2
19.6
832
,466
.06
34,4
63.4
232
,840
.15
GD
P, E
xpen
ditu
re19
,527
.01
35,4
05.0
239
,062
.80
43,4
41.3
245
,566
.35
48,5
90.0
7
GD
P, P
rodu
ctio
n19
,735
.78
38,1
24.0
440
,661
.69
45,4
32.0
449
,318
.48
51,5
97.0
0
Stat
istic
al D
iscr
epan
cy20
8.76
2,71
9.03
1,59
8.89
1,99
0.71
3,75
2.13
3,00
6.93
% o
f SD
1.
067.
133.
934.
387.
615.
83

33
National Accounts Statistics, 2013
Tabl
e 13
: G
DP
Exp
endi
ture
at
Con
stan
t P
rice
s (in
Mill
ion
Nu.
)D
escr
ipti
on20
0020
0820
0920
1020
1120
12
1.
Fina
l Con
sum
ptio
n Ex
pend
iture
13,7
46.9
222
,318
.92
26,7
66.1
029
,282
.00
29,6
66.9
530
,953
.82
Hou
seho
lds
& N
PISH
s9,
415.
9615
,041
.43
17,9
71.1
619
,823
.11
19,8
69.3
521
,230
.19
Gen
eral
Gov
ernm
ent
4,33
0.96
7,27
7.49
8,79
4.94
9,45
8.90
9,79
7.61
9,72
3.62
2.
Gro
ss D
omes
tic C
apita
l For
mat
ion
9,51
2.20
16,4
61.8
418
,977
.62
26,8
39.5
230
,564
.83
32,1
28.3
0
Cons
truc
tion
6,83
5.21
8,81
4.23
9,48
6.50
13,7
83.6
915
,572
.07
16,3
99.8
9
Mac
hine
ry &
Equ
ipm
ent
3,03
0.52
7,20
3.14
9,67
5.29
12,8
18.9
215
,168
.52
15,7
86.0
1
Chan
ges
in I
nven
torie
s(3
53.5
3)44
4.47
(184
.17)
236.
90(1
75.7
5)(5
7.61
)
3.
Net
Exp
ort
(3,7
32.1
1)(3
,375
.74)
(6,6
80.9
3)(1
2,68
0.20
)(1
4,66
5.43
)(1
4,49
2.04
)
Expo
rt o
f G
oods
& S
ervi
ces
5,79
7.82
18,6
81.1
818
,538
.75
19,7
85.8
619
,797
.98
18,3
48.1
0
Impo
rt o
f G
oods
& S
ervi
ces
(9,5
29.9
3)22
,056
.92
25,2
19.6
832
,466
.06
34,4
63.4
232
,840
.15
GD
P, E
xpen
ditu
re19
,527
.01
35,4
05.0
239
,062
.80
43,4
41.3
245
,566
.35
48,5
90.0
7
GD
P, P
rodu
ctio
n19
,735
.78
38,1
24.0
440
,661
.69
45,4
32.0
449
,318
.48
51,5
97.0
0
Stat
istic
al D
iscr
epan
cy20
8.76
2,71
9.03
1,59
8.89
1,99
0.71
3,75
2.13
3,00
6.93
% o
f SD
1.
067.
133.
934.
387.
615.
83
Tabl
e 14
: P
riva
te F
inal
Con
sum
ptio
n Ex
pend
itur
e in
Cur
rent
Pri
ces
(in M
illio
n N
u.)
Sl. N
oD
escr
ipti
on20
0020
0820
0920
1020
1120
12To
tal C
onsu
mpt
ion
9,41
5.96
21,7
61.7
827
,202
.22
31,7
52.1
134
,927
.33
42,6
90.2
401
Food
& N
on-A
lcoh
olic
Bev
erag
es
4,20
7.95
7,51
2.93
9,39
1.16
11,2
69.3
912
,396
.33
16,4
53.6
1
02Al
coho
lic B
ever
ages
, Tob
acco
&
Nar
cotic
s 36
5.87
603.
6175
4.51
867.
6995
4.46
1,21
6.32
03Cl
othi
ng A
nd F
ootw
ear
814.
571,
732.
522,
165.
652,
490.
502,
739.
552,
867.
93
04H
ousi
ng, W
ater
, Ele
ctric
ity, G
as &
O
ther
Fue
ls
2,40
6.12
5,47
0.85
6,83
8.56
7,86
4.35
8,65
0.78
9,51
5.89
05Fu
rnis
hing
s, H
ouse
hold
Equ
ipm
ent
& R
outin
e H
ouse
hold
Mai
nten
ance
45
9.49
1,04
4.67
1,30
5.83
1,50
1.71
1,65
1.88
1,59
2.10
06H
ealth
54
.46
463.
2357
9.04
665.
8973
2.48
1,13
7.65
07Tr
ansp
ort
327.
421,
132.
371,
415.
461,
627.
781,
790.
561,
992.
6108
Com
mun
icat
ion
48.6
930
3.23
379.
0443
5.89
479.
4860
0.00
09Re
crea
tion
& C
ultu
re
117.
0528
0.28
350.
3540
2.90
443.
1947
8.68
10Ed
ucat
ion
54.1
829
5.53
369.
4142
4.83
467.
311,
267.
3011
Rest
aura
nts
& H
otel
s 8.
571,
295.
211,
619.
021,
861.
872,
048.
061,
324.
8012
Mis
cella
neou
s G
oods
& S
ervi
ces
551.
601,
627.
352,
034.
192,
339.
322,
573.
254,
243.
34
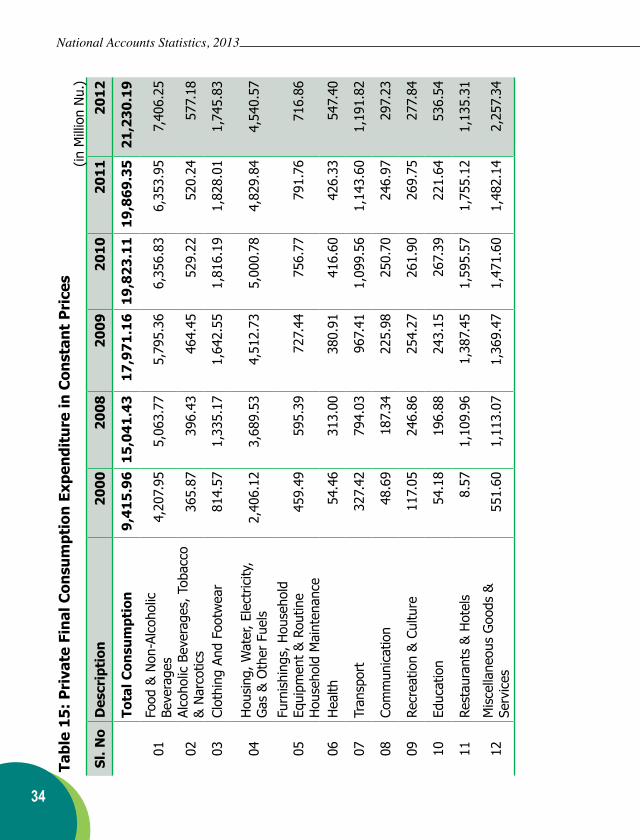
34
National Accounts Statistics, 2013
Tabl
e 15
: P
riva
te F
inal
Con
sum
ptio
n Ex
pend
itur
e in
Con
stan
t P
rice
s (in
Mill
ion
Nu.
)
Sl. N
oD
escr
ipti
on20
0020
0820
0920
1020
1120
12
Tota
l Con
sum
ptio
n 9,
415.
9615
,041
.43
17,9
71.1
619
,823
.11
19,8
69.3
521
,230
.19
01Fo
od &
Non
-Alc
ohol
ic
Beve
rage
s 4,
207.
955,
063.
775,
795.
366,
356.
836,
353.
957,
406.
25
02Al
coho
lic B
ever
ages
, Tob
acco
&
Nar
cotic
s 36
5.87
396.
4346
4.45
529.
2252
0.24
577.
18
03Cl
othi
ng A
nd F
ootw
ear
814.
571,
335.
171,
642.
551,
816.
191,
828.
011,
745.
83
04H
ousi
ng, W
ater
, Ele
ctric
ity,
Gas
& O
ther
Fue
ls
2,40
6.12
3,68
9.53
4,51
2.73
5,00
0.78
4,82
9.84
4,54
0.57
05Fu
rnis
hing
s, H
ouse
hold
Eq
uipm
ent
& R
outin
e H
ouse
hold
Mai
nten
ance
45
9.49
595.
3972
7.44
756.
7779
1.76
716.
86
06H
ealth
54
.46
313.
0038
0.91
416.
6042
6.33
547.
40
07Tr
ansp
ort
327.
4279
4.03
967.
411,
099.
561,
143.
601,
191.
82
08Co
mm
unic
atio
n 48
.69
187.
3422
5.98
250.
7024
6.97
297.
23
09Re
crea
tion
& C
ultu
re
117.
0524
6.86
254.
2726
1.90
269.
7527
7.84
10Ed
ucat
ion
54.1
819
6.88
243.
1526
7.39
221.
6453
6.54
11Re
stau
rant
s &
Hot
els
8.57
1,10
9.96
1,38
7.45
1,59
5.57
1,75
5.12
1,13
5.31
12M
isce
llane
ous
Goo
ds &
Se
rvic
es
551.
601,
113.
071,
369.
471,
471.
601,
482.
142,
257.
34
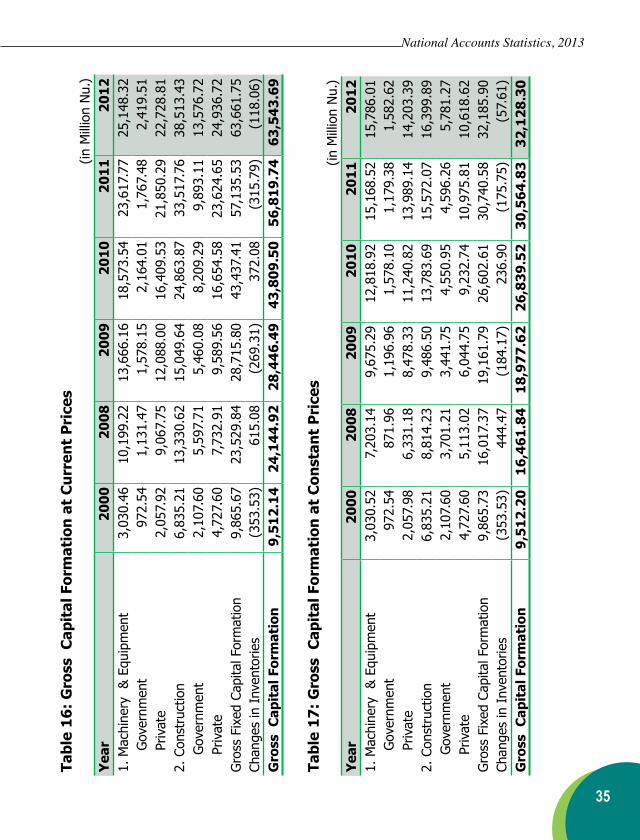
35
National Accounts Statistics, 2013
Tabl
e 16
: G
ross
Cap
ital
For
mat
ion
at C
urre
nt P
rice
s(in
Mill
ion
Nu.
) Y
ear
2000
2008
2009
2010
2011
2012
1. M
achi
nery
&
Equ
ipm
ent
3,03
0.46
10,1
99.2
213
,666
.16
18,5
73.5
423
,617
.77
25,1
48.3
2 G
over
nmen
t 97
2.54
1,13
1.47
1,57
8.15
2,16
4.01
1,76
7.48
2,41
9.51
Pr
ivat
e2,
057.
929,
067.
7512
,088
.00
16,4
09.5
321
,850
.29
22,7
28.8
12.
Con
stru
ctio
n6,
835.
2113
,330
.62
15,0
49.6
424
,863
.87
33,5
17.7
638
,513
.43
Gov
ernm
ent
2,10
7.60
5,59
7.71
5,46
0.08
8,20
9.29
9,89
3.11
13,5
76.7
2 P
rivat
e4,
727.
607,
732.
919,
589.
5616
,654
.58
23,6
24.6
524
,936
.72
Gro
ss F
ixed
Cap
ital F
orm
atio
n9,
865.
6723
,529
.84
28,7
15.8
043
,437
.41
57,1
35.5
363
,661
.75
Chan
ges
in I
nven
torie
s(3
53.5
3)61
5.08
(269
.31)
372.
08(3
15.7
9)(1
18.0
6)G
ross
Cap
ital
For
mat
ion
9,51
2.14
24,1
44.9
228
,446
.49
43,8
09.5
056
,819
.74
63,5
43.6
9
Tabl
e 17
: G
ross
Cap
ital
For
mat
ion
at C
onst
ant
Pri
ces
(in M
illio
n N
u.)
Yea
r20
0020
0820
0920
1020
1120
121.
Mac
hine
ry &
Equ
ipm
ent
3,03
0.52
7,20
3.14
9,67
5.29
12,8
18.9
215
,168
.52
15,7
86.0
1 G
over
nmen
t 97
2.54
871.
961,
196.
961,
578.
101,
179.
381,
582.
62 Pr
ivat
e2,
057.
986,
331.
188,
478.
3311
,240
.82
13,9
89.1
414
,203
.39
2. C
onst
ruct
ion
6,83
5.21
8,81
4.23
9,48
6.50
13,7
83.6
915
,572
.07
16,3
99.8
9 G
over
nmen
t 2,
107.
603,
701.
213,
441.
754,
550.
954,
596.
265,
781.
27 P
rivat
e4,
727.
605,
113.
026,
044.
759,
232.
7410
,975
.81
10,6
18.6
2G
ross
Fix
ed C
apita
l For
mat
ion
9,86
5.73
16,0
17.3
719
,161
.79
26,6
02.6
130
,740
.58
32,1
85.9
0Ch
ange
s in
Inv
ento
ries
(353
.53)
444.
47(1
84.1
7)23
6.90
(175
.75)
(57.
61)
Gro
ss C
apit
al F
orm
atio
n9,
512.
2016
,461
.84
18,9
77.6
226
,839
.52
30,5
64.8
332
,128
.30
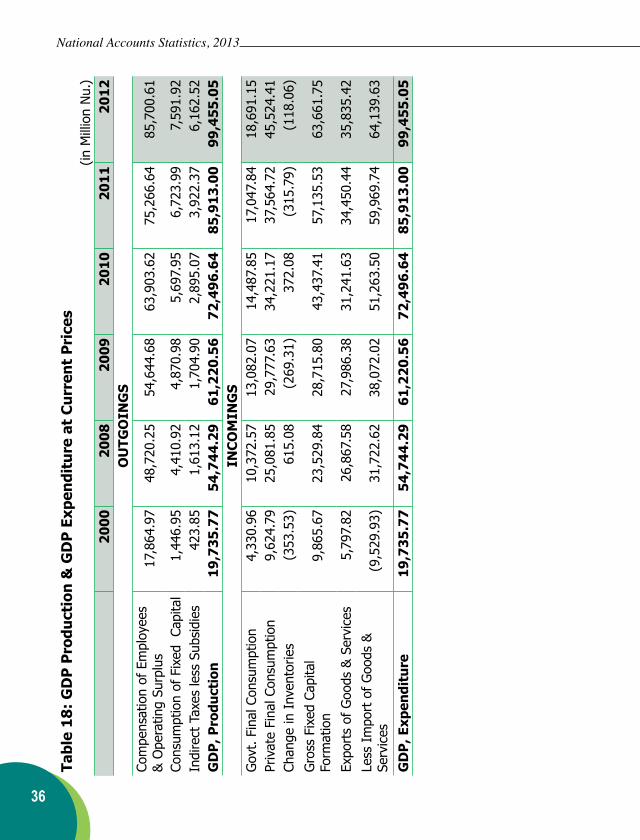
36
National Accounts Statistics, 2013
Tabl
e 18
: G
DP
Pro
duct
ion
& G
DP
Exp
endi
ture
at
Cur
rent
Pri
ces
(in M
illio
n N
u.)
2000
2008
2009
2010
2011
2012
OU
TGO
ING
SCo
mpe
nsat
ion
of E
mpl
oyee
s &
Ope
ratin
g Su
rplu
s17
,864
.97
48,7
20.2
5 54
,644
.68
63,9
03.6
2 75
,266
.64
85,7
00.6
1
Cons
umpt
ion
of F
ixed
Ca
pita
l1,
446.
95
4,41
0.92
4,
870.
98
5,69
7.95
6,
723.
99
7,59
1.92
In
dire
ct T
axes
less
Sub
sidi
es42
3.85
1,
613.
12
1,70
4.90
2,
895.
07
3,92
2.37
6,
162.
52
GD
P, P
rodu
ctio
n19
,735
.77
54,7
44.2
9 61
,220
.56
72,4
96.6
4 85
,913
.00
99,4
55.0
5 IN
CO
MIN
GS
Gov
t. F
inal
Con
sum
ptio
n4,
330.
9610
,372
.57
13,0
82.0
714
,487
.85
17,0
47.8
418
,691
.15
Priv
ate
Fina
l Con
sum
ptio
n9,
624.
7925
,081
.85
29,7
77.6
334
,221
.17
37,5
64.7
245
,524
.41
Chan
ge in
Inv
ento
ries
(353
.53)
615.
08(2
69.3
1)37
2.08
(315
.79)
(118
.06)
Gro
ss F
ixed
Cap
ital
Form
atio
n9,
865.
6723
,529
.84
28,7
15.8
043
,437
.41
57,1
35.5
363
,661
.75
Expo
rts
of G
oods
& S
ervi
ces
5,79
7.82
26,8
67.5
827
,986
.38
31,2
41.6
334
,450
.44
35,8
35.4
2Le
ss I
mpo
rt o
f G
oods
&
Serv
ices
(9,5
29.9
3)31
,722
.62
38,0
72.0
251
,263
.50
59,9
69.7
464
,139
.63
GD
P, E
xpen
ditu
re19
,735
.77
54,7
44.2
961
,220
.56
72,4
96.6
485
,913
.00
99,4
55.0
5
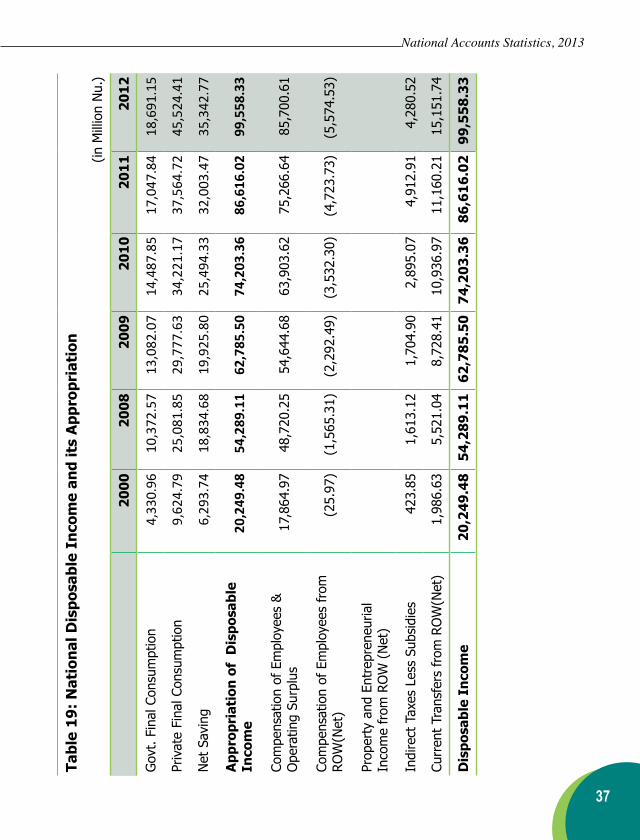
37
National Accounts Statistics, 2013
Tabl
e 19
: N
atio
nal D
ispo
sabl
e In
com
e an
d it
s A
ppro
pria
tion
(in
Mill
ion
Nu.
)
20
0020
0820
0920
1020
1120
12
Gov
t. F
inal
Con
sum
ptio
n4,
330.
9610
,372
.57
13,0
82.0
714
,487
.85
17,0
47.8
418
,691
.15
Priv
ate
Fina
l Con
sum
ptio
n9,
624.
7925
,081
.85
29,7
77.6
334
,221
.17
37,5
64.7
245
,524
.41
Net
Sav
ing
6,29
3.74
18,8
34.6
819
,925
.80
25,4
94.3
332
,003
.47
35,3
42.7
7
App
ropr
iati
on o
f D
ispo
sabl
e In
com
e20
,249
.48
54,2
89.1
162
,785
.50
74,2
03.3
686
,616
.02
99,5
58.3
3
Com
pens
atio
n of
Em
ploy
ees
&
Ope
ratin
g Su
rplu
s17
,864
.97
48,7
20.2
554
,644
.68
63,9
03.6
275
,266
.64
85,7
00.6
1
Com
pens
atio
n of
Em
ploy
ees
from
RO
W(N
et)
(25.
97)
(1,5
65.3
1)(2
,292
.49)
(3,5
32.3
0)(4
,723
.73)
(5,5
74.5
3)
Prop
erty
and
Ent
repr
eneu
rial
Inco
me
from
RO
W (
Net
)
Indi
rect
Tax
es L
ess
Subs
idie
s42
3.85
1,61
3.12
1,70
4.90
2,89
5.07
4,91
2.91
4,28
0.52
Curr
ent
Tran
sfer
s fr
om R
OW
(Net
)1,
986.
635,
521.
048,
728.
4110
,936
.97
11,1
60.2
115
,151
.74
Dis
posa
ble
Inco
me
20,2
49.4
854
,289
.11
62,7
85.5
074
,203
.36
86,6
16.0
299
,558
.33
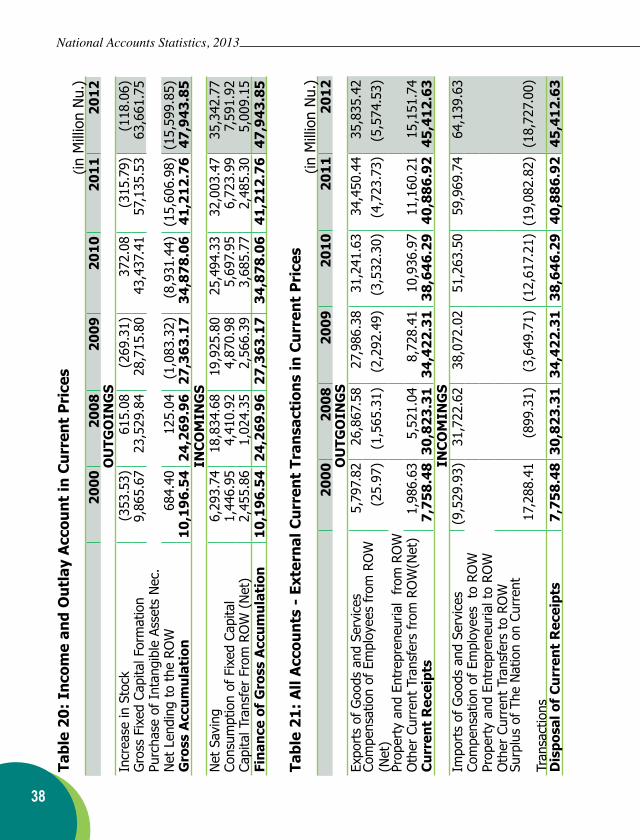
38
National Accounts Statistics, 2013Ta
ble
20:
Inco
me
and
Out
lay
Acc
ount
in C
urre
nt P
rice
s(in
Mill
ion
Nu.
)20
0020
0820
0920
1020
1120
12O
UTG
OIN
GS
Incr
ease
in S
tock
(353
.53)
615.
08(2
69.3
1)37
2.08
(315
.79)
(118
.06)
Gro
ss F
ixed
Cap
ital F
orm
atio
n9,
865.
6723
,529
.84
28,7
15.8
043
,437
.41
57,1
35.5
363
,661
.75
Purc
hase
of
Inta
ngib
le A
sset
s N
ec.
Net
Len
ding
to
the
ROW
68
4.40
125.
04(1
,083
.32)
(8,9
31.4
4)(1
5,60
6.98
)(1
5,59
9.85
)G
ross
Acc
umul
atio
n10
,196
.54
24,2
69.9
627
,363
.17
34,8
78.0
641
,212
.76
47,9
43.8
5IN
CO
MIN
GS
Net
Sav
ing
6,29
3.74
18,8
34.6
819
,925
.80
25,4
94.3
332
,003
.47
35,3
42.7
7Co
nsum
ptio
n of
Fix
ed C
apita
l1,
446.
954,
410.
924,
870.
985,
697.
956,
723.
997,
591.
92Ca
pita
l Tra
nsfe
r Fr
om R
OW
(N
et)
2,45
5.86
1,02
4.35
2,56
6.39
3,68
5.77
2,48
5.30
5,00
9.15
Fina
nce
of G
ross
Acc
umul
atio
n10
,196
.54
24,2
69.9
627
,363
.17
34,8
78.0
641
,212
.76
47,9
43.8
5
Tabl
e 21
: A
ll A
ccou
nts
- Ex
tern
al C
urre
nt T
rans
acti
ons
in C
urre
nt P
rice
s(in
Mill
ion
Nu.
)20
0020
0820
0920
1020
1120
12O
UTG
OIN
GS
Expo
rts
of G
oods
and
Ser
vice
s5,
797.
8226
,867
.58
27,9
86.3
831
,241
.63
34,4
50.4
435
,835
.42
Com
pens
atio
n of
Em
ploy
ees
from
RO
W
(Net
)(2
5.97
)(1
,565
.31)
(2,2
92.4
9)(3
,532
.30)
(4,7
23.7
3)(5
,574
.53)
Prop
erty
and
Ent
repr
eneu
rial
from
RO
WO
ther
Cur
rent
Tra
nsfe
rs f
rom
RO
W(N
et)
1,98
6.63
5,52
1.04
8,72
8.41
10,9
36.9
711
,160
.21
15,1
51.7
4C
urre
nt R
ecei
pts
7,75
8.48
30,8
23.3
134
,422
.31
38,6
46.2
940
,886
.92
45,4
12.6
3IN
CO
MIN
GS
Impo
rts
of G
oods
and
Ser
vice
s(9
,529
.93)
31,7
22.6
238
,072
.02
51,2
63.5
059
,969
.74
64,1
39.6
3Co
mpe
nsat
ion
of E
mpl
oyee
s t
o RO
WPr
oper
ty a
nd E
ntre
pren
euria
l to
ROW
Oth
er C
urre
nt T
rans
fers
to
ROW
Surp
lus
of T
he N
atio
n on
Cur
rent
Tran
sact
ions
17,2
88.4
1(8
99.3
1)(3
,649
.71)
(12,
617.
21)
(19,
082.
82)
(18,
727.
00)
Dis
posa
l of
Cur
rent
Rec
eipt
s7,
758.
4830
,823
.31
34,4
22.3
138
,646
.29
40,8
86.9
245
,412
.63
39
National Accounts Statistics, 2013
DEFINITIONS & TERMINOLOGIES OF THE SYSTEM OF NATIONAL ACCOUNTS (SNA)
UN SNA The United Nations System of National Accounts (SNA) is a complete description of the economic system. It consists of a coherent, consistent and integrated set of macroeconomic accounts and tables based on a set of internationally agreed concepts, definitions, classifications and accounting rules for the purposes of economic analysis and policy-making.
Aggregates Key aggregates of the System comprises of GDP, GNI, GNDI, GCF, Saving, Net Exports, Net Current Transfers, Net Lending/Borrowings, GDP Per capita which are used as key indicators of economic activity to measure the overall performance of an economy.
GDP GDP is a measure of production, income and expenditure. It broadly determines how much a country can produce, generate income, consume and save. It represents the aggregated final results of the production activities of all the economic institutions located within the economic boundary of a country in a year or in an accounting year.
Production Activities Production activities are normally those, which result in the production of goods and services for sale in the market and for own use. The Government activities related to public administration, defense and activities of non-profit institutions are also counted as economic activities even if their output is not sold in the market on a commercial basis. For instance, GDP includes the construction of buildings by households and enterprises for their own use, and the production of crops and livestock in the farms for self-consumption. This is simply because there are usually close market parallels for these activities.
GDP MeasurementGDP is measured at basic price and at market price. It is also measured in current and constant prices to determine the actual performance of the economy.
ClassificationThe classification of economic activity is done based on the ISIC Rev. 3.1. It is classified into eleven major economic activities depending on the nature of goods and services produced. These activities are further grouped into primary, secondary, and tertiary sectors to allow the measurement of performance at the broad structural level. The following are the major
40
National Accounts Statistics, 2013
economic activity groups.1. Agriculture, Hunting, Forestry and
Fishing.2. Mining and Quarrying.3. Manufacturing.4. Electricity and Water.5. Construction.6. Wholesale and Retail Trade.7. Hotels and Restaurants. 8. Transport, Storage and
Communications.9. Financing, Insurance, Real Estate
and Business Services.10. Community, Social and Personal
Services (General Govt.)11. Private, Social and Recreational
Services.
Approach Three approaches for measuring GDP are: production, income and expenditure approach.
Production Approach Production approach takes into account gross output and intermediate consumption of all economic activities. Gross Output (GO) minus the value of Intermediate Consumption (IC) is equal to gross value added or GDP. (GO - IC = GVA/GDP).
Income Approach Income approach takes into account the sum of incomes paid as compensation
to employees (CoE), interest on capital, rent, operating surplus (OS) and the consumption of the fixed capital (CFC), which is also known as depreciation. The sum total of all these elements which constitutes payments to the factors of production is also equal to gross value added at basic price. If taxes less subsidies on products are added, the measurement is at market price. (CoE + OS + CFC + (T-S) = GDP.)
Production approach and Income approach give the same results. Hence in an accounting year, value of product (total value added) is the same as the income earned by factors of production.
Expenditure Approach This is an aggregated approach, which takes into account private household final consumption; government final consumption; capital formation and net export during an accounting year. In other words, it is the sum of Final Consumption Expenditure (FCE) of private and government, Gross Capital Formation (GCF) or investment and Net export (export-import). FCE + GCF + Net Export= GDP.
Final Consumption Expenditure It refers to the final consumption of goods and services directly consumed by households, collectively by

41
National Accounts Statistics, 2013
Government, and by private non-profit institutions. An individual consumption of goods and services is one acquired by individual households for the exclusive use of those households, while a collective consumption refers to those goods and services consumed by the community as a whole or by a particular section of the community and which is acquired and used by all members of the community.
Gross Fixed Capital FormationGross Fixed Capital Formation includes the purchase of machinery and equipments for production of goods and services by industries, general government, Non-profit institutions serving households, and the output of construction.
Change in Stocks Change in stocks is measured as the difference between the stocks of in materials, semi-processed or finished products or supplies held by Stock producers pending their sale or for other use; work-in-progress in construction projects, livestock raised for slaughter, merchandise held by resident industries; stocks of strategic materials and emergency stocks of important products held by the government bodies, at the beginning and at the end of the accounting period, both valued at
approximate average prices ruling over the period.
Consumption of Fixed Capital It refers to the decline in value attributed by the deterioration in physical qualities of fixed capital in the course of production, due to passage of time, and normal obsolescence. It is recorded as the difference between flows recorded “gross” and flows recorded “net” in the system.
Net Export Net export is the difference between export and import. The export of goods and services consists of actual or imputed sales, of goods and services from resident to non-resident economic units and vice versa. The exports & imports of goods and services in balance of payments are related to movement of goods and services and other flows between custom frontiers or the territorial limits of the country.
Exports of services include the cost of transport and insurance services provided by the resident producers of the country. Merchandise exports are expressed in f.o.b. (free on board). Import of goods and services include the value of inward movement of merchandise across the custom frontier of a country and of other goods across
42
National Accounts Statistics, 2013
the boundaries of the domestic territory including direct purchases of the government services and the residents of the country abroad. Imports also include the charges of resident producers for transport and insurance services in respect of these imports. Merchandise imports are valued at C.I.F. (cost, insurance and freight).
43
National Accounts Statistics, 2013
Data Sources(I) Agriculture, Forestry & Logging
1 Department of Agriculture, MoAF2 Department of Livestock, MoAF3 Department of Forests, MoAF4 Natural Resource Development Corporation Ltd.
(II) Mining & Quarrying1 Department of Geology & Mines2 Druk Mining Pvt. Ltd.3 Druk Satair Corporation Ltd.4 Eastern Bhutan Coal Company Pvt. Ltd.5 Jigme Mining Pvt. Ltd.6 S.D Eastern Bhutan Coal Company
(III) Manufacturing1 Army Welfare Sawmill Ltd.2 Army Welfare Project Ltd.3 Bhutan Agro Industries Ltd.4 Bhutan Beverages Pvt. Ltd.5 Bhutan Bitumen Industries Pvt. Ltd.6 Bhutan Board Exports Ltd.7 Bhutan Board Products Ltd.8 Bhutan Brewery Pvt. Ltd.9 Bhutan Cables Industries Pvt. Ltd.11 Bhutan Carbide & Chemicals Ltd.12 Bhutan Concast Pvt. Ltd.13 Bhutan Diary & Agro Products Ltd.14 Bhutan Ferro Alloys Ltd.15 Bhutan Fruits Products Ltd.16 Bhutan Ferro Industries17 Bhutan Health Food Products Pvt. Ltd.18 Bhutan Marbles & Chemicals Pvt. Ltd.19 Bhutan Marbles & Minerals Pvt. Ltd.20 Bhutan Metals Pvt. Ltd.
44
National Accounts Statistics, 2013
21 Bhutan Polymers Company Ltd.22 Bhutan Polythene Company Ltd.23 Bhutan Rolling Mills Pvt. Ltd.24 Bhutan Steel Industries Ltd.25 Bumthang Brewery Pvt. Ltd.26 Bhutan Battery Pvt. Ltd.27 Department of Industries28 Druk Cement Pvt. Ltd.29 Druk Ferro Alloys Pvt. Ltd.30 Druk Plasters & Chemicals Pvt. Ltd.31 Druk Wang Alloys Pvt. Ltd.32 GreenWood Pvt. Ltd.33 H& K Company Pvt. Ltd.34 Jigme Industries Pvt. Ltd.35 Jigme Polytex Pvt. Ltd.36 K.K Steel Pvt. Ltd.37 Kenpa Pvt. Ltd.38 Kimpex Pvt. Ltd.39 K.L.S. Wires & Cables40. PCA41. Lhaki Cement Agency42. Tashi Beverages43. Omzin Manufacturing44. Gedu Wood Manufacturing45. Wood Craft Centre46. RSA Poly Products Pvt47. Dungsam Polymers Ltd48. Karma Steel Factory49. Ugyen Ferro Alloys50. Rangshar Industries51. Lhaki Steel and Rolling Pvt. Ltd52. Bhutan Steel Industries53. Yarab Pvt. Ltd54. Saint Gobain Ceramic Materials, Bhutan55. RSA Pvt. Ltd
45
National Accounts Statistics, 2013
56. Druk Iron and Steel Pvt. Ltd57. Sonam Wangchuk Pvt. Ltd58. Damchen Hollow Block Manufacturing
(IV) Electricity & Water Supply1 Basochu Hydro Power Corporation Ltd.2 Bhutan Power Corporation Ltd.3 Chukha Hydro Power Corporation Ltd. 4 Dagachhu Hydro Power Corporation Ltd.5 Druk Green Power Corporation Ltd.6 Kurichu Hydro Power Corporation7 Municipal/City Corporation8 Tala Hydro Power Corporation Ltd.
(V) Construction1 Alpine Builders Pvt. Ltd.2 Bhutan Engineering Power Pvt. Ltd.3 Bhutan Engineering Company Pvt. Ltd.4 Construction Development Board5 Punatsangchhu-1 & 2 Hydropower Project Authority
(VI) Wholesale & Retail Trade1 Damchen Gas Supply Depot2 Peljorkhang Pvt. Ltd.3 Singkhar Pvt. Ltd.4 State Trading Corporation of Bhutan5 Bhutan ECO Ventures Pvt. Ltd.6 Druk Petroleum Corporation Ltd.7 Department of Revenue & Customs, MoF8 Department of Trade, MoEA10 Damchen Gas Supply Depot
46
National Accounts Statistics, 2013
(VII) Hotels & Restaurants1 Bhutan Resort Pvt. Ltd.2 Wangchuk Group of Companies Pvt. Ltd.
(VIII) Transport, Storage & Communications1 Bhutan Broadcasting Corporation Ltd.2 Bhutan Observer Pvt. Ltd.3 Bhutan Postal Corporation Ltd.4 Bhutan Telecom Corporation Ltd.5 Bhutan Times Ltd.6 Bhutan Tourism Corporation Ltd.7 Druk Air Corporation Ltd.8 DSB Enterprises Pvt. Ltd.9 Food Corporation of Bhutan Ltd. 10 International Treks & Tours Pvt. Ltd.11 Kuensel Corporation Ltd.12 Mega Pvt. Ltd.13 Road Safety & Transport Authority
(IX) Finance, Insurance, Real Estate & Business Services1 BoB Ltd.2 Bhutan Business solutions Pvt. Ltd.3 BDB Ltd.4 BNB Ltd.5 DHI Ltd.6 G4S Security Services Pvt. Ltd.7 NPPF Ltd.8 RICB Ltd.9 RSEB Ltd.10 RMA11 T-Bank Ltd.12 BILtd.13 Tashi Dawa Consultancy Firm14 Zorig Consultancy15 Thimphu Tech-Park

47
National Accounts Statistics, 2013
16 NHDC Ltd.17 Druk PNB Ltd.
(X) Community, Social and Personal Services1 Department of Public Accounts, MoF2 Department of Budget, MoF3 Kelki HSS4 Royal Thimphu College5 Nima HSS6 Richen HSS7 Kuenga HSS8 Tenzin HSS9 Sonam Kuenphen HSSS10 Reldri HSS11 Thimphu PS12 Druk School13 Dr. Tobgay School14 Pelkil School15 Ugyen Acedamy16 Jigme Namgyel School

48
National Accounts Statistics, 2013