Embed Size (px)
Citation preview
Dear Friends,All of us at NAPE and the NAPE Education Foundation are proud to share our FY 2015 Annual Report. The report highlights some of our favorite successes and provides an overview of our activities. It has been another year of significant capacity building to implement NAPE’s four lines of business: professional development, technical assistance, research and evaluation, and public policy and advocacy.
During the year we were mindful of using our 2014-2016 Strategic Plan to set our course and provide us with guidance about priorities. Our leadership groups consist of volunteers who are committed to educational equity and to NAPE’s mission and include the Executive Committee, Education Foundation Board of Directors, STEM Equity Pipeline National Advisory Board, and Business Alliance Council. Without the dedication and commitment of these volunteers, NAPE would not have continued to experience significant growth throughout the year.
We are especially excited about the rebranding of our annual conference (formerly the Professional Development Institute, PDI) as the National Summit for Educational Equity. We look to build on this event’s reputation as a spectacular professional development opportunity and to expand its reach to bring
together a more diverse crowd of practitioners and researchers working to increase opportunities for every student. We continue to hear from the field that the NAPE PDI is the best conference ever—we expect the NSEE to exceed that expectation! Please join us in Alexandria, VA, on April 12-14, 2016.
Finally, we could not have experienced such success in 2015 without your involvement. Whether you are a funder, partner organization, participant, or just learning about NAPE, we welcome you to the family and encourage you to become or remain involved. As the saying goes—“many hands make light work”— we look forward to joining hands to make this a better world!
Through access, equity, and diversity,
Mimi Lufkin
Chief Executive Officer
Teresa Boyer
PresidentNAPE Executive Committee
Mary Wiberg
PresidentNAPE Education Foundation
FAST FACTS FOR 2015
7,213 Professional development participants1,326 Participating schools
110 Professional development events
32 State members
39 National/state presentations
84 Visits to Capitol Hill/White House
Letter from NAPE Leadership
NATIONAL ALLIANCE FOR PARTNERSHIPS IN EQUITY
Annual Report 2015

ACTIVITY
Cues and Messages
National Alliance for Partnerships in Equity
91 Newport Pike, Suite 302, Gap, PA 17527 I 717.407.5118 I www.napequity.org
ACTIVITY
A Closer LookThis activity provides a closer look into unintentional biases, or cues, in the classroom and
their connection to the messages received and internalized by students.
Instructions: Match the cue (left) with the message (right). The first is completed. There are
two sections for matching. CuesWhen we interact with others, we send small,
subtle, often unconscious and unintentional
micromessages that communicate value.
MessagesMicromessages are interpreted, often
unconsciously, and may not reflect intention.
Accumulation of these messages is powerful.
1 Using female references as negative labels or
insults, such as “You throw like a girl” or “You act
like a girly-man.”A The interrupting person (teacher or male student)
is considered to be more important or powerful.
2 Consistently interrupting or contradicting female
students.
B Females feel less valued than their male
classmates.
3 Waiting longer for males’ than for females’
answers.
C Eye contact is considered to be one of the most
powerful nonverbal cues and is often considered
an invitation to speak, ask questions, or lead.
4 Consistently using generic “he,” “man,” or “guys”
to represent both men and women. D Female students are invisible and unimportant.
5 Phrasing teaching examples so that professionals,
doctors, lawyers, scientists, are “he” and the
weak or irrational are “she.” E Females’ answers or ideas are unimportant, as
they are easily dismissed or ignored.
6 Responding more extensively to male students’
comments, and crediting opinion more frequently
when the student is a male. F Males’ intellectual participation and contribution
is more valued and trusted.
7 Avoiding eye contact with female students or only
looking at male students.G Males are more important and are expected to
answer more questions.
8 Folding arms, looking away, or doing other tasks
when a female is speaking.H Females are more suited for certain roles and
ill-suited for others, thus reinforcing gender
stereotypes.
9 Rolling eyes about ideas before they may be
discussed or even fully expressed. I Students have little of value to contribute and
are not part of the educator’s domain.
What We Did ...1: ENHANCED CURRICULUMMicromessaging to Reach and Teach Every Student™
www.napequity.org/mm
• Broadened curriculum to provide for an intersectional approachwith specific strategies related to race, class, and gender.
• Increased offerings to include customized sessions, virtualworkshops, improved professional learning communities, andonline courses for K-12 educators, counselors, and administrators.
• Expanded units that focus on student achievement such asgrowth mindset and self-efficacy.
• Delivered comprehensive 1-year Micromessaging Academies to747 educators in 7 states.
2: FOCUSED ON DATA NAPE’s Professional Development Suite
www.napequity.org/professional-development/
• Conducted professional development in 44 states with morethan 2,600 educators from more than 900 schools.
• Created more than 210 comprehensive CTE dashboards to helpstate and local teams to conduct a participation gap analysisfor special population students disaggregated by gender, race/ethnicity, disability status, and economic disadvantage as part ofthe PIPE Explore module.
• Created a national data dashboard of CTE concentratorsdisaggregated by gender by career cluster for every state.
3: EXPANDED PARTNERSHIPSPublic Policy
www.napequity.org/public-policy/
• Presented at the Conference on Attracting Minority and AfricanAmerican Girls to STEM hosted by the White House, Center forPoverty and Inequality, Georgetown University, and USDoE.
• Co-conducted a micromessaging presentation at the MarylandCultural Proficiency Conference.
• Established a partnership agreement with the Congressional BlackCaucus Foundation‘s Permanence Project.
National Alliance for Partnerships in Equity | 91 Newport Pike, Suite 302 | Gap, PA 17527 | 717.407.5118 | [email protected]
www.napequity.org NAPEquity @NAPEquity NAPEquityTV
Nontraditional Careers
DO YOU KNOW?
NAPE’s work with middle school teachers is featured in two Teaching Channel videos:
Micromessages in the STEM Classroom www.teachingchannel.org/videos/using-micromessages
Growth Mindsets for STEM Careers www.teachingchannel.org/videos/preparing- for-stem-careers
DATA DASHBOARDS
NAPE can develop data dashboards for education agencies to help them better understand equity gaps to support their process of program improvement.
www.napequity.org/dashboards
NEW! TOOLKIT
The Explore Nontraditional Careers toolkit and companion professional development workshops assist educators in transforming their practice to increase the participation and persistence of students in nontraditional occupational programs and pathways.
www.napequity.org/toolkits/
STEM EQUITY SUITE
Learn more about the STEM Equity suite of programs, which are included in the Change the Equation STEM-works database.
www.napequity.org/stem
36th Annual Professional Development Institute
https://youtu.be/dma0ohouDn4
This annual event brings together leaders in education equity to build capacity, knowledge, and skills to transform classrooms and improve student success.

+
=
SOLVING THEEDUCATION EQUATION
Sources:1. Philanthropy News Digest. 2015 (February 4). Closing achievement gap would boost economy report finds. Available at philanthropynewsdigest.org/news.
2. National Math and Science Initiative. n.d. Why STEM education matters. Available at nms.org/Portals/0/Docs/Why%20Stem%20Education%20Matters.pdf.
3. Lynch, R.G., and P. Oakford, 2014 (November). The Economic Benefits of Closing Educational Achievement Gaps: Promoting Growth and Strengthening the Nation by Improving the Educational Outcomes of Children of Color.
Available at americanprogress.org/issues/race/report/2014/11/10/100577/the-economic-benefits-of-closing-educational-achievement-gaps/.
4. Simmons, C. 2011 (November 8). U.S. faces critical shortage of STEM workers. Defense News and Career Advice. Available at news.clearancejobs.com/2011/11/08/u-s-faces-critical-shortage-of-stem-workers/.
5. Rothwell, J. 2015 (September 15). Short on STEM talent. U.S. News & World Report. Available at usnews.com/opinion/articles/2014/09/15/the-stem-worker-shortage-is-real.
6. National Science Foundation. 2014. Science and engineering labor force. Science and Engineering Indicators. Available at nsf.gov/statistics/seind14/content/chapter-3/chapter-3.pdf.
7. Change the Equation. 2015. Solving the Diversity Dilemma. Available at changetheequation.org/solving-diversity-dilemma.
8. National Center for Education Statistics. The Nation’s Report Card. Available at nationsreportcard.gov/reading_math_2013/#/achievement-gaps.
9. ACT. 2015. The Condition of STEM. Available at act.org/stemcondition/14/race-gender.html.
10. Oregon Department of Education, Office of Educational Improvement and Innovation. 2005 (August). Closing the Achievement Gap: Oregon’s Plan for Success for All Students. Available at www.cssia.org/pdf/20000022-Closingth
eAchievementGap-Oregon%E2%80%99sPlanforSuccessforAllStudents.pdf.
A new model for improving STEM workforce outcomes through academic equity.
*OVER NEXT 35 YEARS **OVER NEXT 80 YEARS
*OVER NEXT 35 YEARS
Women's participation in STEM jobshas plateaued since 2001 7 African Americans and Latinos are grossly underrepresented in U.S. STEM jobs 7
IF YOU DON’T SOLVE IT, THEN:IF YOU
DO SOLVE IT, THEN:
WORKFORCE GAP
AND:AND:
2001
13%
27%
10%
2014
12%
26%
10%
VS.Engineering
Computing
AdvancedManufacturing
U.S. Economy LOSES $14.7 TRILLION* 1
U.S. Government TAX REVENUE DECREASES BY $5.3 TRILLION* 1
U.S. Mathematics Sector gross domestic product (GDP) DECREASES BY $75 TRILLION** 2
$95 TRILLIONLOST $27.8 TRILLIONGAINED
D E V E L O P E D B Y :The Multi-stakeholder Coalition forBuilding a Diverse U.S. STEM Workforce
State and Local Governments GAIN $3.3 TRILLION IN TAX REVENUE* 3
U.S. Government TAX REVENUE INCREASES BY $4.1 TRILLION* 3
U.S. GDP INCREASES BY $20.4 TRILLION* 3
30%
20%
25%
15%
10%
20012008
2015
U.S. working-age population
African American/Latino Percentage of:
Advanced manufacturing workforce
Computing workforce
Engineering workforce
If there is no educational equity, then the STEM workforce shortage is absolute.
Workforce shortages begin in education
SOLVE FOR X:
Create an equitable learning environment by:
The equation for change
Increasing the number and percentage of women and underrepresented minorities who pursue STEM careers
Focusing on the interests and needs of underrepresented students to increase STEM literacy and strengthen college and career readiness for every student
Teacher content knowledge and pedagogical skills Accessibility to quality resources Meaningful student assessments
HIGH-QUALITY EDUCATION
X = anequitable learning environmentAn environment that includes multiple student perspectives, values, experiences, and beliefs.
1
2
Factors that equate to inequity
Although achievement scores in mathhave improved, gaps by race remain. 8 12th-grade students interested in STEMand college and career ready in math 9
Download the full report to read and share at napequity.org/solving-education-equation
DEMAND FOR STEM WORKERS EXCEEDS SUPPLY
The existing STEM workforce is aging; 46 percent of STEM jobs are held by those older than 45. When they retire, they take their knowledge with them. 7
Science and engineering are the fastest growing occupations 5U.S. scientists and engineers with a PhDEngineering Computing
Most cyber security and anti-terrorism jobs require U.S. citizenship and a PhD. In 2010, the number of U.S. scientists and engineers with a PhD was nearly half that of foreign-born. 6
Foreign-born66%
U.S. Citizen34%
-25%-15%
12%19%
Supply Demand
2014-2024WORKFORCE GAP2014-2024WORKFORCE GAP
CRITICAL DEFENSE LAPSES 4
ALTERED ECOSYSTEMSDECLINING COMPETITIVENESS
A SECURE NATIONA SUSTAINABLE ENVIRONMENTECONOMIC PROSPERITY
X
AmericanIndian
AfricanAmerican
FemaleMale
Asian Hispanic White
52%66%
30%
79%
44%65%25%
ACHIEVEMENT GAP INTEREST GAP
INEQ
UITY
Disproportionate student resourcesSchool and teacher attitudesStudent motivationSchool environmentFamily experience with educationCultural norms
Racism, prejudice, and segregationPoverty 10
1990 1996 2005 2013
280
300
260
2408TH-
GRAD
E NA
EP M
ATH
SCOR
E
White Hispanic African American www.vimeo.com/141947840
NAPE delivered its in-demand Micromessaging to Reach and Teach Every Student curriculum with Baltimore County Public Schools (BCPS) educators, who are dedicated to perfecting their pedagogical practice to increase underrepresented students’ access to STEM pathways that leads to high-wage, high-demand careers.
Through this partnership, 25 educators received Micromessaging professional development, and the BCPS district office developed a strategic plan predicated on many of the equity initiatives outlined in the curriculum.
Hear NAPE CEO Mimi Lufkin and NAPE mentor instructor Dr. Lisa Williams, who is the director of equity and cultural proficiency at BCPS, speak to the importance of creating equitable learning environments to increase student performance and outcomes.
How We Made an Impact ...
“The NAPE training helped our high school science educators identify possible sources of bias, recognize the unique gifts of others, and embrace cultural diversity. We examined the impact of micromessages on future career choices. Educators reported that this was ‘one of the best professional learning sessions they had ever attended.’”
—School District Director of Science
“With girls being underrepresented in STEM fields, NAPE is providing innovative training that helps teachers discover ways to more effectively engage their female students. The results speak for themselves. Not only do the girls perform better in these teachers’ classrooms, but so do the boys.”
—Texas Instruments Foundation Executive Director
Educators are responsive to the ways that diverse students may be marginalized.
Educators take seriously the multiple perspectives, values, experiences, and beliefs of their students and their families.
Classrooms are student centered.
“Professionally I was able to see my classroom environment in a new way, bringing an equity to my students that I was unaware they were not experiencing all of the time. The culture of our room was almost indescribable. Best professional development I have had in 30 years!”
—Middle School Intervention Specialist
4: RELEASED REPORT WITH JOHNS HOPKINS UNIVERSITY Solving the Education Equation
www.napequity.org/solving-education-equation
• Called for a national commitment to address the culturally based biases that exist in education, particularly in STEM.
• Built a coalition of corporations, educators, civil rights organizations, and organized labor to develop recommendations for policy and practice reform.
• Hosted a congressional staff briefing on Capitol Hill, with remarks by Congresswoman Donna Edwards, to launch the report.
Solve for X:
HIGH-QUALITY EDUCATION
Teacher content knowledge and pedagogical skills
Accessibility to quality resources
Meaningful student assessments
X = anequitable learning
environment
An environment thatincludes multiple student
perspectives, valuesexperiences,and beliefs.
THE EQUATION FOR CHANGEWhy We Did It ...The United States must address the culturally based explicit and implicit biases that exist in education to create inclusive, culturally responsive, equitable learning environments for every student.
An equitable learning environment is one where…
Executive Committee, 2014-2015
Terri Boyer President
Tasha Kawamata Ryan Past President
Jay Ramsey President Elect
Debra Huber Treasurer
Donna Dutcher Member at Large
Lakshmi Mahadevan Member at Large
Karen Showers Member at Large
Nancy Mitchell Member at Large
Monica Marsh CTEEC Representative
Terri Grusendorf CTEEC Representative
Education Foundation Board, 2014-2015
Mary Wiberg President
Jocelyn Riley Vice President
Lou Hargrave Treasurer
Dennis Harden Secretary
Judith D’AmicoPatricia ElizondoNorman FortenberryRob GiraFatima Goss GravesQuentin HartGretchen KochMonica McManusCherri MusserJane OatesRaelene SandersJeff WeldSandra Westlund-Deenihan
Support Access, Equity, and DiversityYour support is essential to our mission to build educators’ capacity to implement effective solutions for increasing student access, educational equity, and workforce diversity.
• Become a member, www.napequity.org/join
• Request professional development, www.napequity.org/request
• Donate to our Education Foundation, www.napequity.org/donate
• Donate with every purchase with Amazon Smile http://smile.amazon.com/ch/13-4249100
• Contact the NAPE office to learn about partnering opportunities, [email protected]
National Alliance for Partnerships in Equity91 Newport Pike, Suite 302, Gap, PA 17527 | 717.407.5118 | www.napequity.org
Connect www.facebook.com/NAPEquity
www.linkedin.com/company/national-alliance-for-partnerships-in-equity
www.twitter.com/napequity
www.youtube.com/user/NAPEquityTV
Pipeline Press e-newsletter, www.napequity.org/subscribe
Become involved, www.napequity.org/committees
Thanks to NAPE’s FundersNAPE recognizes that funders have many options for giving. We appreciate and value your support of the NAPE Education Foundation (a 501c3 organization). Together, we will continue the important work of ensuring access, equity, and diversity in the classroom and the workplace.
$25,000 or aboveNational Science FoundationTexas Instruments FoundationCommunities Foundation of Texas—High Tech High HeelsLockheed Martin FoundationFreescale FoundationBoone Family FoundationMotorola Solutions Foundation
$10,000-$24,999The Fluor Foundation
$5,000-$9,999Rockwell CollinsXeroxCisco
$2,500-$4,999 CompTIAAVID Center Oppasser Family Charitable Foundation
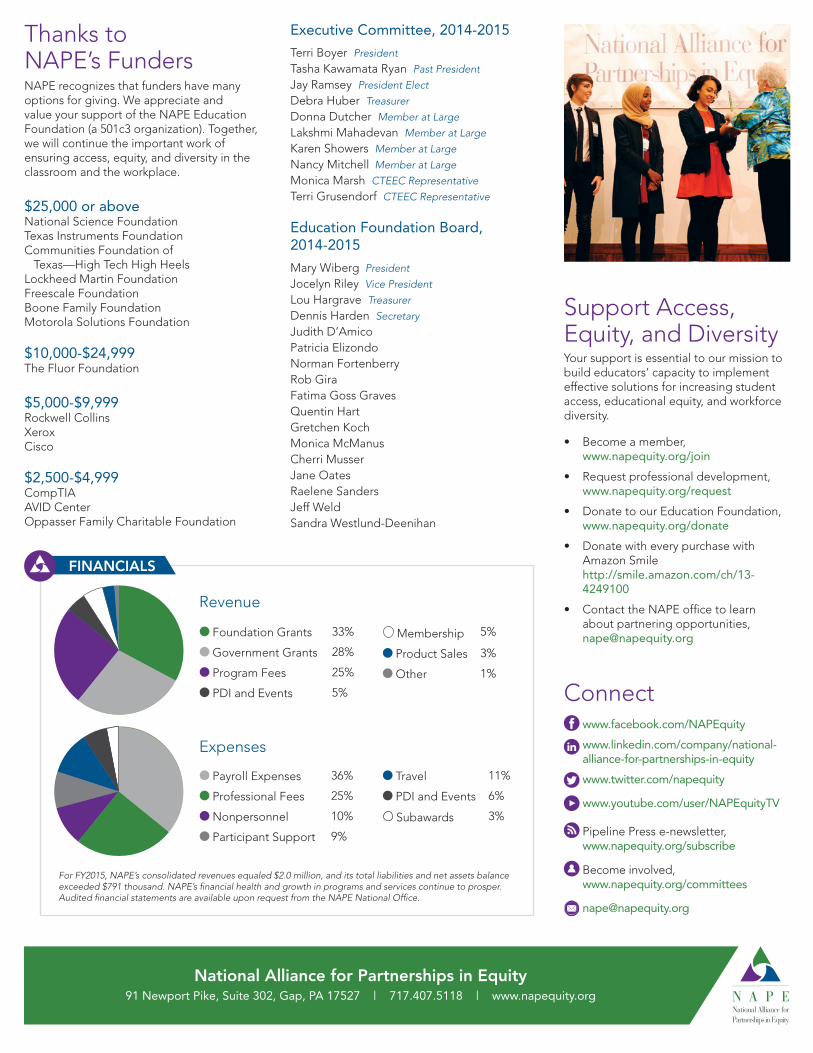
Foundation Grants 33%
Government Grants 28%
Program Fees 25%
PDI and Events 5%
Membership 5%
Product Sales 3%
Other 1%
Payroll Expenses 36%
Professional Fees 25%
Nonpersonnel 10%
Participant Support 9%
Travel 11%
PDI and Events 6%
Subawards 3%
For FY2015, NAPE’s consolidated revenues equaled $2.0 million, and its total liabilities and net assets balance exceeded $791 thousand. NAPE’s financial health and growth in programs and services continue to prosper. Audited financial statements are available upon request from the NAPE National Office.
FINANCIALS
Expenses
Revenue