Embed Size (px)
Citation preview
Proceedings of National Avian - Wind Power Planning Meeting III,
San Diego, California, May 1998
Sponsored by
Avian Subcommittee
of the
National Wind Coordinating Committee
Meeting Facilitated by
RESOLVE Inc.
Washington, DC
Proceedings Prepared by
LGL Ltd., environmental research associates
King City, Ontario Canada
June 2000
Suggested Citation Format:
This volume:
PNA WPPM-ITr. 2000. Proceedings of National Avian - Wind Power Planning Meeting ill, San Diego, California, May 1998. Prepared for the Avian Subcommittee of the National Wind Coordinating Committee by LGL Ltd., King City, Ont. 202 p.
Preceding volumes:
PNAWPPM-IT. 1996. Proceedings of National Avian - Wind Power Planning Meeting IT, Palm Springs, California, September 1995. Prepared for the Avian Subcommittee of the National Wind Coordinating Committee by RESOLVE Inc., Washington, D.C., and LGL Ltd., King City, Ont. 152 p.
PNAWPPM. 1995. Proceedings of National Avian - Wind Power Planning Meeting, Denver, Colorado, July 1994. Report DE95-004090. RESOLVE Inc., Washington, D.C., and LGL Ltd., King City, Ont. 145 p.
Ordering Information:
This volume is available, while the initial stock lasts, from
Avian Subcommittee of the National Wind Coordinating Committee, c/o RESOLVE Inc., 1255 23rd St. NW, Suite 275, Washington, D.C. 20037 (phone 202-944-2300; fax 202-338-1264).
Preceding volumes are available on the World Wide Web at www.nationalwind.org/pubs/default.htm
All three volumes are (or will be) available from
National Technical Information Service, 5285 Port Royal Rd., Springfield, Virginia 22161 (phone 703-487-4600; fax 703-321-8547)
11
d
TABLE OF CONTENTS
INTRODUCTION .................................................................................................................................... 1
REVIEW OF CURRENT AND PLANNED RESEARCH ............................................................. 3
Bird Risk Behaviors and Fatalities at the Altamont Wind Resource Area, by C. G. Thelander and L. Rugge ................................................. .............................................................................................. .5
A Population Study of Golden Eagles in the Altamont Pass Wind Resource Area: Population Trend Analysis 1994-1997-Executive Summary, by WG. Hunt et al. ......................................... 15
Avian Mitigation Plan: Kenetech Model Wind Turbines, Altamont Pass WRA, California, by R. C. Curry and P. Kerlinger ........................................................................................................ 18
The Role of Visual Acuity in Bird-Wind Turbine Interactions, by ML. Morrison ................................ 28 Avian Monitoring and Risk Assessment at Tehachapi Pass and San Gorgonio Pass Wind Resource
Areas, California: Phase 1 Preliminary Results, by R.L. Anderson et al. . ...................................... 31 Effects of Bird Deterrent Methods Applied to Wind Turbines at the CARES Wind Power
Site in Washington State, by MD. Strickland et al . ........................................................................ .47 Wildlife Monitoring Studies for the Sea West Wind Power Development, Carbon County, Wyoming,
by MD. Strickland et al. . ................................................................................................................. 55 Impacts of a Small Wind Power Facility in Weld County, Colorado on Breeding, Migrating,
and Wintering Birds: Preliminary Results and Conclusions, by P. Kerlinger and R. C. Curry ........ 64 Avian Use, Flight Behavior, and Mortality on the Buffalo Ridge, Minnesota, Wind Resource Area,
by MD. Strickland et al. . ................................................................................................................. 70 Avian Issues in the Development of Wind Energy in Western Minnesota, by J.M Hanowski and
R. Y. Hawrot ....................................................................................................................................... 80 WindlBird Interaction Studies in Wisconsin, by S. Ugoretz et al. . ........................................................ 88 An Assessment of the Impacts of Green Mountain Power Corporation's Searsburg, Vermont,
Wind Power Facility on Breeding and Migrating Birds, by P. Kerlinger ......................................... 90 Studies on Nocturnal Flight Paths and Altitudes of Waterbirds in Relation to Wind Turbines: A
Review of Current Research in The Netherlands, by S. Dirksen et al. . ........................................... 97 Bird Behavior In and Near a Wind Farm at Tarifa, Spain: Management Considerations,
by G. Janss ...................................................................................................................................... 110 The European Perspective: Some Lessons from Case Studies, by S. Lowther ....... ............................. 115 A Review of Recent Developments in Wind Energy and Bird Research in Western Europe,
by S. Dirksen et al . ......................................................................................................................... 124
TECHNOLOGY AND METHODS FOR THE FUTURE .......................................................... 125
Studying Wind EnergylBird Interactions: A Guidance Document-Executive Summary, by R.L. Anderson et al . ................................................................................................................... 126
Bird Migration and Wind Turbines: Migration Timing, Flight Behavior, and Collision Risk, by WJ. Richardson ......................................................................................................................... 132
Applications of Acoustic Bird Monitoring for the Wind Power Industry, by WR. Evans ................... 141 Radar, Remote Sensing and Risk Management, by T.A. Kelly .............................................................. 152 The Use of Radar in Evaluations of Avian-Wind Development Projects: Norris Hill Wind
Resource Area, Montana, by A.R. Harmata et al . .......................................................................... 162 Night Vision and Thermal Imaging Equipment, by B.A. Cooper and T.A. Kelly .............. .................... 164 Using GPS to Study Avian Interactions Associated with Wind Turbines, by M Dedon ...................... 166 Examples of Statistical Methods to Assess Risk of Impacts to Birds from Wind Plants,
by WP. Erickson et al. ................................................................................................................... 172 Development of a Practical Modeling Framework for Estimating the Impact of Wind
Technology on Bird Populations, by ML. Morrison and K.H Pollock .......................................... 183
iii

RESEARCH PRIORITIES AND DATA GAPS ..................................................................... 188
CONCLUSIONS ............................................................................................ : ........................... 194
APPENDICES ....................................................................................................................................... 195
Appendix 1. Meeting Participants ....................................................... '" .............................................. 195 Appendix 2. Meeting Agenda ......................................................................... : ..................................... 199
iv

r
INTRODUCTION Government regulators, scientists, and other stakeholders met in May 1998 to discuss research and
regulatory approaches that could be helpful in predicting, measuring, and reducing the numbers of birds killed by collisions with wind turbines. This meeting was the third in a series that the Avian Subcommittee of the National Wind Coordinating Committee (NWCC) has convened as part of the Subcommittee's efforts to address and build consensus on issues of public policy, scientific research, and stakeholder/ public involvement related to avian/wind power interactions. The Proceedings of the first two meetings, held in 1994 and 1995, were published in 1995 and 1996, respectively. They can be accessed on the NWCC's website, as described on page (ii) of this volume.
Meeting I: The first meeting, held in the Denver area in July 1994, occurred at a time when there was much controversy about bird/wind power interactions, especially in California. That meeting was convened to focus on the research aspects, particularly to (1) identify and prioritize key issues, (2) define a research agenda to resolve scientific and technical issues, while (3) insuring transferability of results, (4) avoiding duplication and inadequate science, and (5) building consensus on approaches to the research needed to address the issues. The meeting was organized by groups with many perspectives, including the National Renewable Energy Laboratory (NREL), the Department of Energy (DoE), American Wind Energy Association (A WEA), National Audubon Society (NAS) , Electric Power Research Institute (EPRI), and Union of Concerned Scientists (DCS). The first meeting was attended by about 57 individuals representing those and other groups, plus various independent scientists with relevant expertise. They reviewed the status of wind power in the U.S.A., developed lists of research questions, reviewed past and ongoing avian research at wind plants in the U.S.A. and Europe, discussed design concepts for this type of research (including Adaptive Resource Management), discussed desirable components of an integrated national research program, and identified a list of "next steps" that should be taken.
Parallel to this collaborative effort concerning the technical questions surrounding avian/wind power interactions, the National Wind Coordinating Committee and its Avian Subcommittee were formed to address broader issues associated with the sustainable commercialization of wind power in the U.S.A. The Proceedings of the first meeting were distributed under the auspices of the NWCC and its Avian Subcommittee, and those groups sponsored the second (1995) and third (1998) meetings.
Meeting II: The second meeting was held in Palm Springs, California, in September 1995. The purposes were (1) to provide information on avian/wind power interactions that will help meet the needs of regulators, researchers, and other stakeholders; (2) to create dialogue among those groups to help all parties understand the role that research can play in responsible development and permitting of wind plants, and to allow researchers to understand the relevance of their work to the process; and (3) to propose research and appropriate sponsorship. The meeting included presentation and discussion of nine White Papers on the theory and methods for studying and understanding bird/wind power interactions. These papers were organized into three groups: (1) stakeholder questions, interests, and concerns; (2) fundamental methodologies - study design, "metrics", models; and (3) observation protocols. The second part of the meeting consisted of four working group sessions, on (1) site evaluation and prepermit research and planning; (2) operational monitoring; (3) modeling and forecasting; and (4) avian behavior and mortality reduction. A final plenary session drew together the main recommendations, including (1) development ofa conceptual model (framework) of the principal causes of avian mortality at wind plants; (2) further definition of the most appropriate "metrics" or variables to be measured; and (3) further development of research protocols, data collection guidelines, and statistical analysis techniques.
1
2 National Avian - Wind Power Planning Meeting III
Subsequent to Meeting II, various research and monitoring projects were begun, and a "metrics group" began to write a document that would describe a "framework" and recommend appropriate "metrics" and research procedures. Considerable progress had been made on that document by the time of Meeting III, and the document was subsequently finalized and published by the NWCC and Avian Subcommittee.t
Meeting III: The third meeting in the series was held in San Diego on 27-29 May 1998. The presentations given at that meeting, and the results of the follow up discussions, are documented in this Proceedings volume. The purposes of the third meeting were as follows:
• to facilitate scientific interchange on avian/wind power interactions;
• to share information about the findings of studies of those interactions as study results are obtained;
• to share information about new and developing techniques for research and mitigation; and
• to identify data gaps and set priorities for future research.
Meeting ill was structured into four main sections: (1) An introduction, including a summary of Planning Meetings I and II, (2) a series of presentations reviewing current and planned research on the bird/wind power issue, (3) additional presentations discussing new and evolving technology and methods that deserve consideration for use in future studies, and (4) a discussion to identify data gaps and questions that need additional research.
All three meetings included presentations concerning both recommended research methodology and results of completed or ongoing studies. However, several specific field studies of birds at actual or planned wind plants had been started (and in some cases completed) between Meetings II and ill. Meeting III included a higher proportion of presentations concerning results of specific studies of actual or planned wind plants in the U.S.A. The discussions at Meeting ill were also notable because of the considerable geographic expansion of bird/wind power studies across the U.S. as compared with the emphasis on California during earlier Meetings.
The organization of this volume follows the organization of Meeting III. The majority of the Proceedings consists of edited versions of the presentations on current and planned research, and new and evolving technology and methods. When there were questions and discussion following a presentation, this exchange has been summarized at the end of the writeup under the heading "General Discussion". The concluding section consists of a summary of the data gaps and questions needing further research that were identified by meeting participants. The agenda and list of participants for Meeting ill are included as Appendices to these Proceedings.
The Proceedings were edited by W. John Richardson and Ross E. Harris of LGL Ltd., environmental research associates. Kathleen Hester and Anne Wright ofLGL produced the document.
t Anderson, R., M. Morrison, K. Sinclair and D. Strickland, with H. Davis and W. Kendall. 1999. Studying wind energylbird interactions: a guidance document. Nat. Wind Coord. Commit., c/o RESOL VB, 1255 23rd St., Suite 275, Washington, DC 20037. 87 p. Available at www.nationalwind.org/pubs/default.htm
REVIEW OF CURRENT AND PLANNED RESEARCH
This part of National Avian - Wind Power Planning Meeting III began on the morning of the first day, and continued well into the second day. It included 16 presentations on completed and ongoing research at existing and planned wind plants in several portions of the U.S.A. plus Europe. The sequence of presentations was largely as listed in the meeting agenda (see Appendix), with minor variations. For purposes of these Proceedings, the sequence has been further amended to a small extent in order to put the presentations into an approximate "geographic sequence". The presentations are organized from west (California and Washington) to east (Vermont) across the U.S.A., followed by four presentations concerning the bird/wind power situation in Europe. The presentations given in this section of the meeting and published (or summarized) in this part of the Proceedings are as follows:
California
Thelander, e.G. and L. Rugge: Bird risk behaviors and fatalities at the Altamont Wind Resource Area.
Hunt, W.G.: A population study of Golden Eagles in the Altamont Pass Wind Resource Area: population trend analysis 1994-1997-Executive Summary.
Curry, R.e. and P. Kerlinger: Avian mitigation plan: Kenetech model wind turbines, Altamont Pass WRA, California.
Morrison, M.L.: The role of visual acuity in bird-wind turbine interactions.
Anderson, R.L. and others: Avian monitoring and risk assessment at Tehachapi Pass and San Gorgonio Pass Wind Resource Areas, California: Phase 1 preliminary results.
Washington
Strickland, M.D. and others: Effects of bird deterrent methods applied to wind turbines at the CARES wind power site in Washington state.
Wyoming
Strickland, M.D. and others: Wildlife monitoring studies for the Sea West wind power development, Carbon County, Wyoming.
Colorado
Kerlinger, P. and R.C. Curry: Impacts of a small wind power facility in Weld County, Colorado, on breeding, migrating, and wintering birds: preliminary results and conclusions.
Minnesota
Strickland, M.D. and others: Avian use, flight behavior, and mortality on the Buffalo Ridge, Minnesota, Wind Resource Area.
Hanowski, J.M. and R.Y. Hawrot: Avian issues in the development of wind energy in western Minnesota.
3
4 National Avian - Wind Power Planning Meeting III
Wisconsin
Ugoretz, S. and others: Wind powerlbird interaction studies in Wisconsin.
Vermont
Kerlinger, P.: An assessment of the impacts of Green Mountain Power Corporation's Searsburg, Vermont, wind power facility on breeding and migrating birds.
Europe
Dirksen, S. and others: Studies on nocturnal flight paths and altitudes of waterbirds in relation to wind turbines: a review of current research in The Netherlands.
Janss, G.: Bird behavior in and near a windfarm at Tarija, Spain: management considerations.
Lowther, S.: The European perspective: some lessons from case studies.
Dirksen, S. and others: A review of recent developments in wind energy and bird research in Western Europe (Abstract).
--.r-.. ...... --.- ~~----------
'/
Introduction
Bird Risk Behaviors and Fatalities at
the Altamont Wind Resource Area
by
Carl G. Thelander and Lourdes Rugge
BioResource Consultants!
In March 1998, we initiated a research project to address a complex problem involving both wind energy development and wildlife conservation. Since about 1989, several research efforts in the Altamont Wind Resource Area (A WRA) have revealed large numbers of bird fatalities, especially among raptor species (Howell and DiDonato 1991; Orloff and Flannery 1992, 1996; Howell 1997). Researchers studying interactions between birds and turbines in the A WRA have mainly attempted to locate bird fatalities and to calculate mortality rates.
These previous research efforts have clearly defined the problem. Bird mortality is relatively high in the A WRA. For some species, this impact may have a significant effect on their regional populations. For example, recent studies show that Golden Eagles nest in extraordinary numbers throughout California's central Coast Ranges, a region that includes the A WRA. Also, numerous individual eagles pass through the area each year during the fall and winter months (Hunt 1994, 1997; Hunt et al. 1998). The California Department of Fish and Game has designated the Golden Eagle as a "Species of Special Concern" in California. In addition, they receive special protection under the federal Bald Eagle Protection Act. Despite their legal protection, Golden Eagles are one of the species most highly at risk in the A WRA.
Modifications to existing turbines and new turbine designs are two approaches being proposed as possible solutions to bird deaths. For the effects of these modifications to be correctly interpreted, we need to estimate two fimdamental and independent parameters. These are bird mortality and bird utilization, both of which are necessary to conduct a risk analysis. By quantifying risk, it may be possible to determine the effects of any facilities modifications, or the effects of siting new facilities. In the case of modifying existing turbine facilities, a risk analysis can help determine if any observed reductions in bird deaths are due to decreased risk, decreased utilization, or both.
Objectives
The objectives of this project are (1) to relate bird flight and perching behaviors to risk; and (2) to identify any relationships be~een bird flight and perching behaviors with turbine type, weather, topography, habitat features, and other factors that may predict high degrees of risk to birds.
In the present study, we are attempting to quantify bird utilization and bird deaths to estimate risk. Our basic approach is to observe, quantify, and characterize bird flight and perching behaviors in and around wind turbines, and to relate these behavioral (utilization) data to bird fatalities at these same turbines over the same time period.
This report is intended solely as a progress report. It includes our findings from March 1998 through February 1999 (phase I). The study was to continue for a second year (phase II), but the second year work is not addressed here. Therefore, these fmdings should be considered preliminary and subject to revision.
1 BioResource Consultants, P.o. Box 1539, Ojai, CA 93024-1539. Phone: 805-646-3932. E-mail: [email protected]
5
6 National Avian - Wind Power Planning Meeting III
Study Area
Altamont Pass is located approximately 90 km east of San Francisco, California. This is a relatively arid interior portion of the greater San Francisco Bay region. To the east of Altamont Pass are generally treeless foothills consisting mainly of annual grasslands. Hilltop elevations range from 230 to 470 m above the sea level. The lower valley elevations range from 78 to 188 m above sea level (Howell 1997). The primary land use in the Altamont Hills is livestock grazing and dry farming.
In the A WRA, approximately 5000 turbines are distributed over approximately 150 km2• Generally, turbines are arranged in groups under common ownership. Thirteen different companies manage the energy produced in the A WRA. Five main tower/turbine types are installed in the A WRA: lattice horizontal, lattice diagonal, guyed pipe, tubular, and vertical axis. These range in height from 12 to 60 m, with rotor diameters as large as 44 m. Outputs of individual turbines range from 40 to 750 kilowatts.
Methods
Our study design includes two fundamental field research tasks. Each requires a distinctly different set of methods and data collection procedures. The first task is characterizing and quantifying behavioral observations of birds in selected study plots. The second task is conducting intensive searches for dead birds in those same study plots.
We designed the behavioral observation methods to maximize the number of bird observations within each of the study plots. We used fatality search protocols that maximized the likelihood of discovering dead birds. The methods used follow the guidelines described in Anderson et al. (1996).
Bird Risk Behavior.-We began by establishing a standardized sampling protocol, designing field data collection forms, and selecting our study plots. We designed the field studies to detect individual birds within the study plots and to characterize their specific activities. Each of these elements was tested in the field and refined as necessary before formal data collection began. The protocol developed for the present study follows the guidelines developed by Morrison and Davis (1996), Anderson et al. (1996), and Gauthreaux (1996).
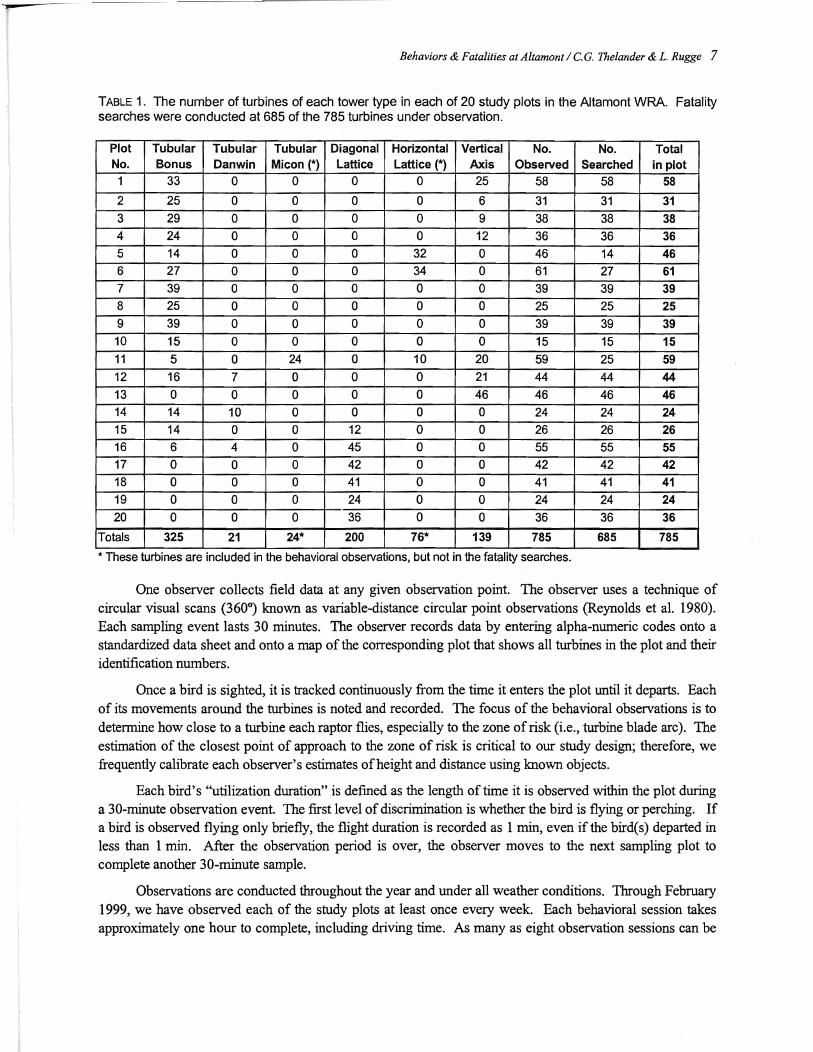
Study Plots: We began the study by establishing 17 study plots containing 514 towers/turbines. In February 1999, we increased this sample to 20 plots, for a new total of 685 turbines. Actually, the 20 sampling plots contain 785 turbines of six different types (Table 1). However, we were unable to incorporate 76 horizontal lattice tower turbines and 24 Micon tubular tower turbines into our fatality searches. Overall, our sample represents approximately 15% of the total turbines in the A WRA.
Each study plot has an area of approximately 1600 m2• The 785 turbines are arranged in 98 different strings. A turbine string is defmed as a group, or row, of adjacent turbines separated from other turbines by more than 200 m or by some prominent geographic feature. In our plots, string length varies from 2 to 18 turbines. We selected each of the study plots in a manner that would ensure that all turbine types, turbine string lengths, turbine sites, and general topography present were adequately represented in the total sample. We spaced the plots to minimize the likelihood of overlap between observations.
Observation Procedure: Each study plot has one observation point. This location was chosen to provide the observer with the best possible view of the turbines and surrounding terrain within the study plot. All turbines, and all comers of the plot, are easily viewed from this observation point to ensure accurate species identification and documentation of each bird activity.
--------------------- - ----
Behaviors & Fatalities at Altamont / c.o. Thelander & L. Rugge 7
TABLE 1. The number of turbines of each tower type in each of 20 study plots in the Altamont WRA. Fatality searches were conducted at 685 of the 785 turbines under observation.
Plot Tubular Tubular Tubular Diagonal Horizontal Vertical No. No. Total No. Bonus Danwin Micon (*) lattice lattice (*) Axis Observed Searched in plot 1 33 0 0 0 0 25 58 58 58
2 25 0 0 0 0 6 31 31 31
3 29 0 0 0 0 9 38 38 38 4 24 0 0 0 0 12 36 36 36
5 14 0 0 0 32 0 46 14 46 6 27 0 0 0 34 0 61 27 61 7 39 0 0 0 0 0 39 39 39 8 25 0 0 0 0 0 25 25 25
9 39 0 0 0 0 0 39 39 39
10 15 0 0 0 0 0 15 15 15
11 5 0 24 0 10 20 59 25 59
12 16 7 0 0 0 21 44 44 44 13 0 0 0 0 0 46 46 46 46
14 14 10 0 0 0 0 24 24 24 15 14 0 0 12 0 0 26 26 26
16 6 4 0 45 0 0 55 55 55
17 0 0 0 42 0 0 42 42 42 18 0 0 0 41 0 0 41 41 41
19 0 0 0 24 0 0 24 24 24
20 0 0 0 36 0 0 36 36 36
Totals 325 21 24* 200 76* 139 785 685 785
* These turbines are included in the behavioral observations, but not in the fatality searches.
One observer collects field data at any given observation point. The observer uses a technique of circular visual scans (360°) known as variable-distance circular point observations (Reynolds et al. 1980). Each sampling event lasts 30 minutes. The observer records data by entering alpha-numeric codes onto a standardized data sheet and onto a map of the corresponding plot that shows all turbines in the plot and their identification numbers.
Once a bird is sighted, it is tracked continuously from the time it enters the plot until it departs. Each of its movements around the turbines is noted and recorded. The focus of the behavioral observations is to determine how close to a turbine each raptor flies, especially to the zone of risk (i.e., turbine blade arc). The estimation of the closest point of approach to the zone of risk is critical to our study design; therefore, we frequently calibrate each observer's estimates of height and distance using known objects.
Each bird's "utilization duration" is defmed as the length of time it is observed within the plot during a 30-minute observation event. The first level of discrimination is whether the bird is flying or perching. If a bird is observed flying only briefly, the flight duration is recorded as 1 min, even if the bird(s) departed in less than 1 min. After the observation period is over, the observer moves to the next sampling plot to complete another 30-minute sample.
Observations are conducted throughout the year and under all weather conditions. Through February 1999, we have observed each of the study plots at least once every week. Each behavioral session takes approximately one hour to complete, including driving time. As many as eight observation sessions can be

8 National Avian - Wind Power Planning Meeting III
conducted per observer per day. We vary the order of sampling to ensure that all turbines are sampled equally during differing times and environmental conditions.
Observer Bias: To reduce the effects of observer bias, we began the field studies by conducting observations using pairs of observers. This helped to calibrate and eliminate any potential differences between observers, and allowed all observers to become familiar with the data sheets and the various bird behaviors. Once the observers' methods and observation skills were standardized, we began conducting separate observations. This calibration process is repeated once per month by conducting paired observations, comparing the observations, and adjusting any differences.
Prey Availability: Data on prey availability to raptors often provides insights into raptor flight activity, flight behavior, and distribution. For purposes of this study, we record a prey availability measurement during each of the behavioral observations. Before the start and at the end of each observation period, we conduct a 3600 visual scan of the study plot to count all visible ground squirrels and other small mammals. This information is not intended to yield an absolute count of the prey available to raptors; instead, it provides prey location data and an estimate of the relative prey availability at the time of the observations.
Bird Fatalities.-The 685 turbines where behavior data are collected are also searched for bird carcasses at least once per month. Because most of the turbines included in the present study are arranged in strings, they are most efficiently searched by walking a strip along both sides and around the ends of each string. The resulting path, therefore, is best described as a tight zig-zag pattern along the turbine string.
Two biologists search each turbine string simultaneously. At the beginning of each turbine string, the biologists walk parallel to the string some 50 m away from the first turbine. The two then walk in opposite directions from one another and perpendicular to the turbine string. Both biologists walk toward and away from the turbine string until the last turbine is reached.
We record all dead birds (or bird parts) found during each search within a 50 m radius of the turbine. Any evidence of a fatality that we fmd is carefully examined to determine the species involved and the probable cause of death. We estimate the length of time the animal has been dead. We record the general condition of the carcass, the presence/absence of maggots, if the carcass is complete or dismembered, the types of injuries evident, if scavenging is evident, and the distance to the nearest turbine.
Scavenging Activities: Failing to recognize and account for any effects of scavenging may result in an under estimation of the number of dead birds. Orloff and Flannery (1992) reported little evidence of raptor carcass removal by scavengers during their research at the A WRA. We are conducting carcass removal investigations to determine scavenging rates.
Each bird carcass we fmd is left in the field. The exact location is recorded and flagged. We then visit each carcass location at least every three days, or until the proper authorities collect the carcass. During the time the carcass is in the field, we record data on the condition of the carcass, amounts of decomposition over time, and any evidence of scavenging. This information will help us not only to evaluate the effectiveness of the frequency of our searches, but also to better estimate the approximate time of death for those carcasses we find with unknown dates of death.
Preliminary Findings
The findings presented in this progress report are preliminary and should not be quoted without the senior author's permission. Most data quoted in this preliminary account will be revised as additional data are collected and analyzed.
Behaviors & Fatalities at Altamont / C. G. Thelander & L. Rugge 9
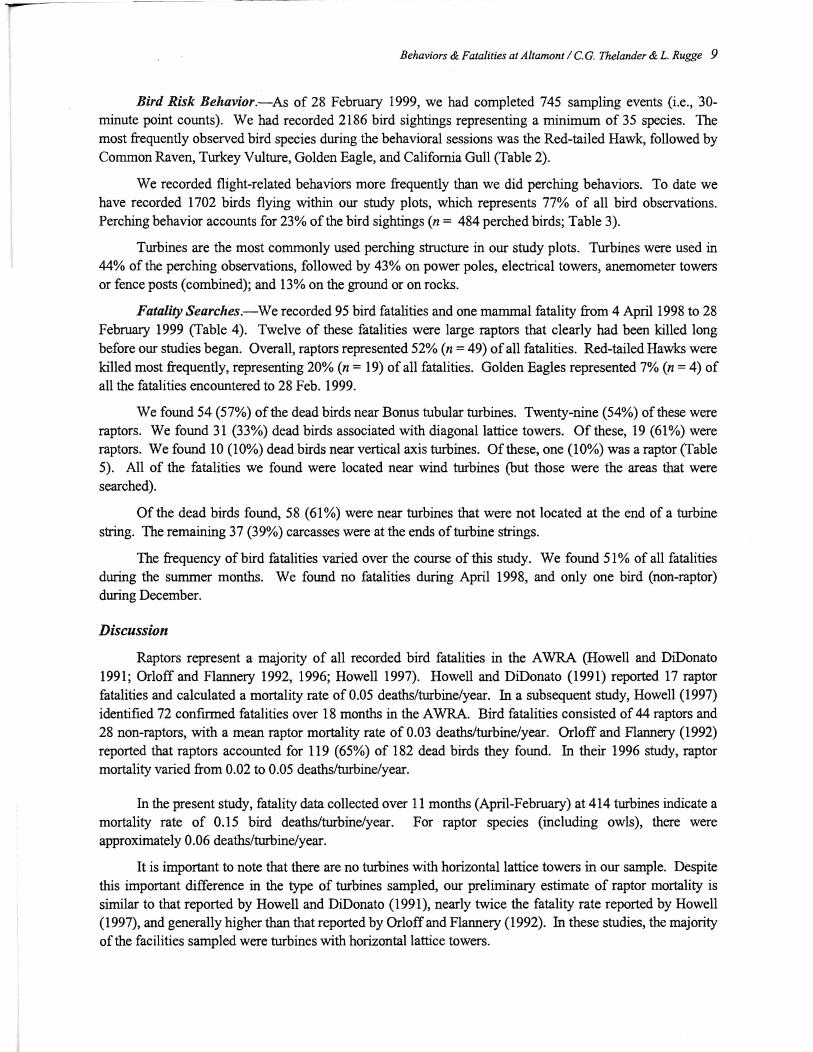
Bird Risk Behavior.-As of 28 February 1999, we had completed 745 sampling events (i.e., 30-minute point counts). We had recorded 2186 bird sightings representing a minimum of 35 species. The most frequently observed bird species during the behavioral ses!,ions was the Red-tailed Hawk, followed by Common Raven, Turkey Vulture, Golden Eagle, and California Gull (Table 2).
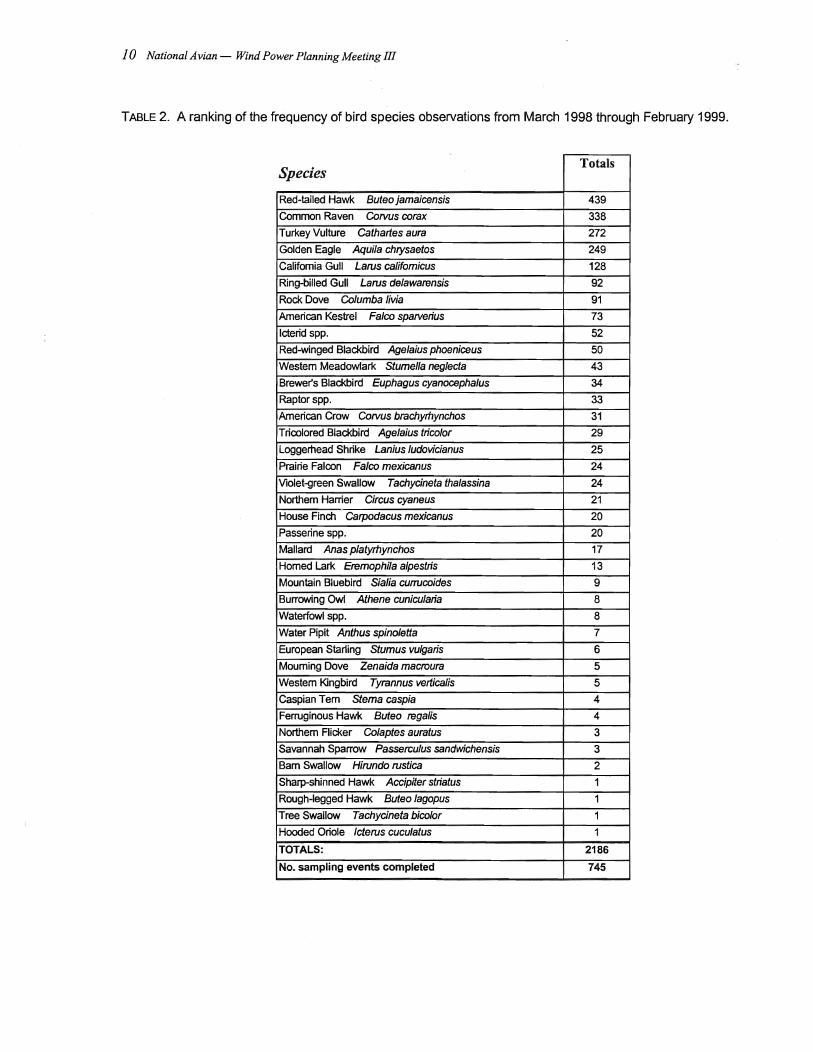
We recorded flight-related behaviors more frequently than we did perching behaviors. To date we have recorded 1702 birds flying within our study plots, which represents 77% of all bird observations. Perching behavior accounts for 23% of the bird sightings (n = 484 perched birds; Table 3).
Turbines are the most commonly used perching structure in our study plots. Turbines were used in 44% of the perching observations, followed by 43% on power poles, electrical towers, anemometer towers or fence posts (combined); and 13% on the ground or on rocks.
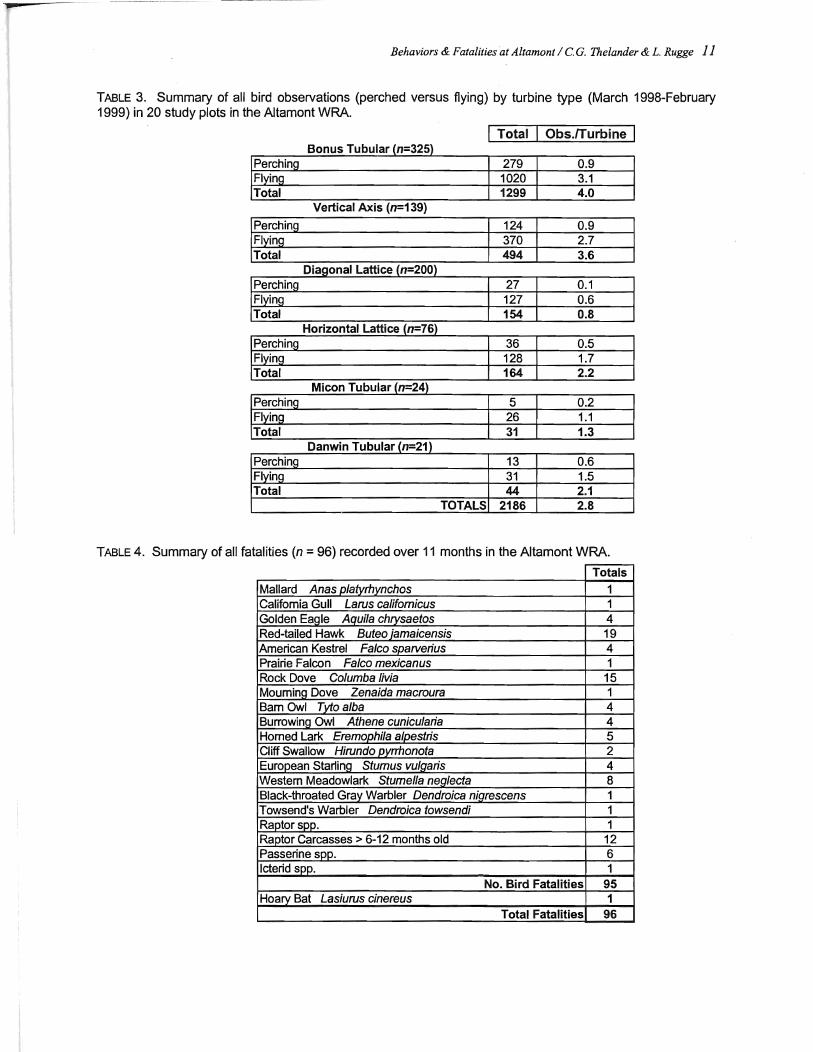
Fatality Searches.-We recorded 95 bird fatalities and one mammal fatality from 4 April 1998 to 28 February 1999 (Table 4). Twelve of these fatalities were large raptors that clearly had been killed long before our studies began. Overall, raptors represented 52% (n = 49) of all fatalities. Red-tailed Hawks were killed most frequently, representing 20% (n = 19) of all fatalities. Golden Eagles represented 7% (n = 4) of all the fatalities encountered to 28 Feb. 1999.
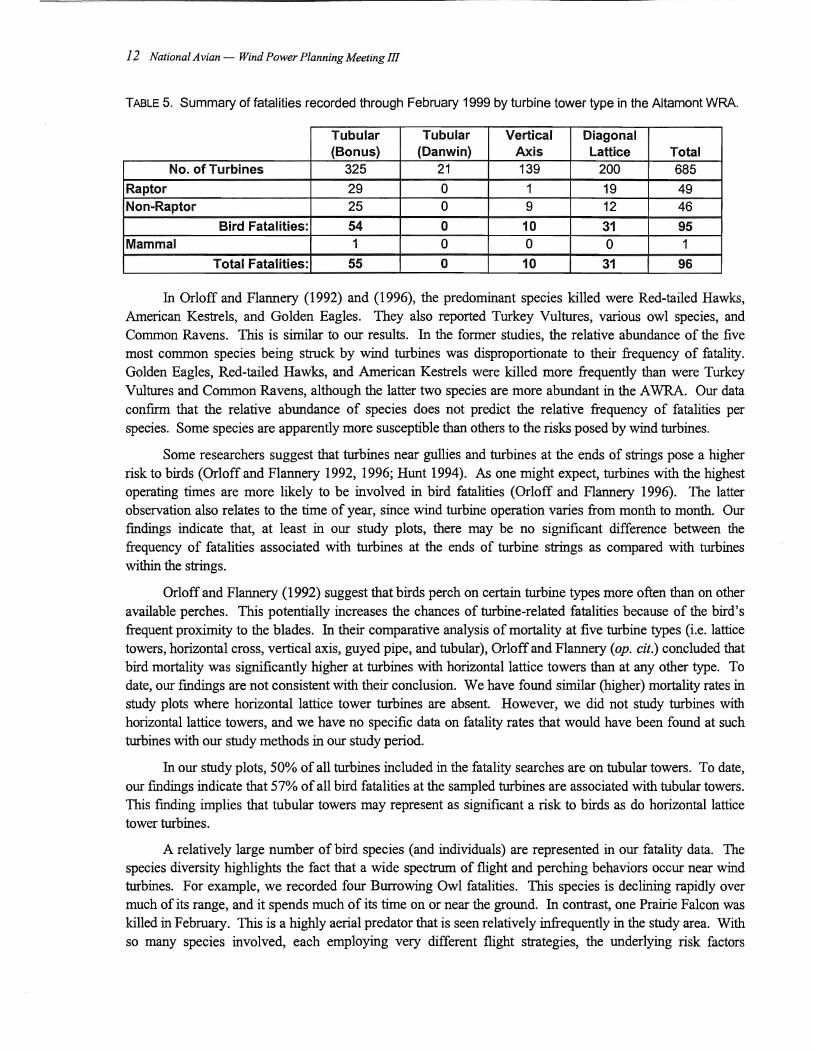
We found 54 (57%) of the dead birds near Bonus tubular turbines. Twenty-nine (54%) of these were raptors. We found 31 (33%) dead birds associated with diagonal lattice towers. Of these, 19 (61%) were raptors. We found 10 (10%) dead birds near vertical axis turbines. Of these, one (10%) was a raptor (Table 5). All of the fatalities we found were located near wind turbines (but those were the areas that were searched).
Of the dead birds found, 58 (61%)'were near turbines that were not located at the end of a turbine string. The remaining 37 (39%) carcasses were at the ends of turbine strings.
The frequency of bird fatalities varied over the course of this study. We found 51 % of all fatalities during the summer months. We found no fatalities during April 1998, and only one bird (non-raptor) during December.
Discussion
Raptors represent a majority of all recorded bird fatalities in the A WRA (Howell and DiDonato 1991; Orloff and Flannery 1992, 1996; Howell 1997). Howell and DiDonato (1991) reported 17 raptor fatalities and calculated a mortality rate of 0.05 deaths/turbine/year. In a subsequent study, Howell (1997) identified 72 confirmed fatalities over 18 months in the A WRA. Bird fatalities consisted of 44 raptors and 28 non-raptors, with a mean raptor mortality rate of 0.03 deaths/turbine/year. Orloff and Flannery (1992) reported that raptors accounted for 119 (65%) of 182 dead birds they found. In their 1996 study, raptor mortality varied from 0.02 to 0.05 deaths/turbine/year.
In the present study, fatality data collected over 11 months (April-February) at 414 turbines indicate a mortality rate of 0.15 bird deaths/turbine/year. For raptor species (including owls), there were approximately 0.06 deaths/turbine/year.
It is important to note that there are no turbines with horizontal lattice towers in our sample. Despite this important difference in the type of turbines sampled, our preliminary estimate of raptor mortality is similar to that reported by Howell and DiDonato (1991), nearly twice the fatality rate reported by Howell (1997), and generally higher than that reported by Orloff and Flannery (1992). In these studies, the majority of the facilities sampled were turbines with horizontal lattice towers.
10 National Avian - Wind Power Planning Meeting III
TABLE 2. A ranking of the frequency of bird species observations from March 1998 through February 1999.
Species Totals
Red-tailed Hawk Buteo jamaicensis 439 Common Raven Corvus corax 338 Turkey Vulture Cathartes aura 272 Golden Eagle Aquila chrysaetos 249 California Gull Larus califomicus 128 Ring-billed Gull Larus de/awarensis 92 Rock Dove Columba livia 91 American Kestrel Falco sparverius 73 Icterid spp. 52 Red-winged Blackbird Agelaius phoeniceus 50 Western Meadowlark stumel/a neglecta 43 Brewer's Blackbird Euphagus cyanocephalus 34
Raptorspp. 33 American Crow Corvus brachyrtlynchos 31 Tricolored Blackbird Agelaius tricolor 29 Loggerhead Shrike Lanius ludovicianus 25 Prairie Falcon Falco mexicanus 24 Violet~reen Swallow Tachycineta thalassina 24 Northern Harrier Circus cyaneus 21 House Finch Carpodacus mexicanus 20 Passerine spp. 20 Mallard Anas platyrhynchos 17 Homed Lark Eremophila alpestris 13 Mountain Bluebird Sialia currucoides 9 Burrowing Owl Athene cunicularia 8 Waterfowl spp. 8 Water Pipit Anthus spino/etta 7 European Starting stumus vulgaris 6
Mourning Dove Zenaida macroura 5 Western Kingbird Tyrannus verticalis 5 Caspian Tern stema caspia 4 Ferruginous Hawk Buteo regalis 4 Northern Flicker Colaptes auratus 3 Savannah Sparrow Passerculus sandwichensis 3 Bam Swallow Hirundo rustica 2 Sharp-shinned Hawk Accipiter striatus 1 Rough-legged Hawk Buteo lagopus 1 Tree Swallow Tachycineta bicolor 1 Hooded Oriole Icterus cuculatus 1
TOTALS: 2186
No. sampling events completed 745
Behaviors & Fatalities 'at Altamont / C. G. Thelander & L. Rugge 11
TABLE 3. Summary of all bird observations (perched versus flying) by turbine type (March 199B-February 1999) in 20 study plots in the Altamont WRA.
I Total I Obs.fTurbine I Bonus Tubular (n=325)
Perching 279 0.9 FlyinQ 1020 3.1 Total 1299 4.0
Vertical AxiS (n=139)
IPerehi"ll Flying
124 0.9 370 2.7
Total 494 36 Diagonal Lattice (n=200)
Perching 27 0.1 Flying 127 0.6 Total 154 0.8
Horizontal Lattice (n=76) Perching 36 0.5 Flying 128 1.7 Total 164 2.2
Micon Tubular (n=24) Perching 5 0.2 FlyinQ 26 1.1 Total 31 1.3
Danwin Tubular (n=21) Perching 13 0.6 Flying 31 1.5 Total 44 2.1
TOTALS 2186 2.8
TABLE 4. Summary of all fatalities (n = 96) recorded over 11 months in the Altamont WRA.
Totals
Mallard Anas platyrhynchos 1 California Gull Laros califomicus 1 Golden Eagle Aquila chrysaetos 4 Red-tailed Hawk Buteo jamaicensis 19 American Kestrel Falco sparverius 4 Prairie Falcon Falco mexicanus 1 Rock Dove Columba livia 15 Mourning Dove Zenaida macroura 1 Bam Owl Tytoalba 4 Burrowing Owl Athene cunicularia 4 Homed Lark Eremophila alpestris 5 Cliff Swallow Hirondo JJyr",onota 2 European Starling Stumus vulgaris 4 Western Meadowlark Stumefla neglecta 8 Black-throated Gray Warbler Dendroica nigrescens 1 Towsend's Warbler Dendroica towsendi 1 Raptorspp. 1 Raptor Carcasses> 6-12 months old 12 Passerine spp. 6 Icterid spp. 1
No. Bird Fatalities 95 Hoary Bat Lasiuros cinereus 1
Total Fatalities 96
12 National Avian - Wind Power Planning Meeting m
TABLE 5. Summary of fatalities recorded through February 1999 by turbine tower type in the Altamont WRA.
Tubular Tubular Vertical Diagonal (Bonus) (Danwin) Axis Lattice Total
No. of Turbines 325 21 139 200 685
Raptor 29 0 1 19 49 Non-Raptor 25 0 9 12 46
Bird Fatalities: 54 0 10 31 95 Mammal 1 0 0 0 1
Total Fatalities: 55 0 10 31 96
In Orloff and Flannery (1992) and (1996), the predominant species killed were Red-tailed Hawks, American Kestrels, and Golden Eagles. They also reported Turkey Vultures, various owl species, and Common Ravens. This is similar to our results. In the former studies, the relative abundance of the five most common species being struck by wind turbines was disproportionate to their frequency of fatality. Golden Eagles, Red-tailed Hawks, and American Kestrels were killed more frequently than were Turkey Vultures and Common Ravens, although the latter two species are more abundant in the A WRA. Our data confirm that the relative abundance of species does not predict the relative frequency of fatalities per species. Some species are apparently more susceptible than others to the risks posed by wind turbines.
Some researchers suggest that turbines near gullies and turbines at the ends of strings pose a higher risk to birds (Orloff and Flannery 1992, 1996; Hunt 1994). As one might expect, turbines with the highest operating times are more likely to be involved in bird fatalities (Orloff and Flannery 1996). The latter observation also relates to the time of year, since wind turbine operation varies from month to month. Our fmdings indicate that, at least in our study plots, there may be no significant difference between the frequency of fatalities associated with turbines at the ends of turbine strings as compared with turbines within the strings.
Orloff and Flannery (1992) suggest that birds perch on certain turbine types more often than on other available perches. This potentially increases the chances of turbine-related fatalities because of the bird's frequent proximity to the blades. In their comparative analysis of mortality at five turbine types (i.e. lattice towers, horizontal cross, vertical axis, guyed pipe, and tubular), Orloff and Flannery (op. cit.) concluded that bird mortality was significantly higher at turbines with horizontal lattice towers than at any other type. To date, our findings are not consistent with their conclusion. We have found similar (higher) mortality rates in study plots where horizontal lattice tower turbines are absent. However, we did not study turbines with horizontal lattice towers, and we have no specific data on fatality rates that would have been found at such turbines with our study methods in our study period.
In our study plots, 50% of all turbines included in the fatality searches are on tubular towers. To date, our fmdings indicate that 57% of all bird fatalities at the sampled turbines are associated with tubular towers. This fmding implies that tubular towers may represent as significant a risk to birds as do horizontal lattice tower turbines.
A relatively large number of bird species (and individuals) are represented in our fatality data. The species diversity highlights the fact that a wide spectrum of flight and perching behaviors occur near wind turbines. For example, we recorded four Burrowing Owl fatalities. This species is declining rapidly over much of its range, and it spends much of its time on or near the ground. In contrast, one Prairie Falcon was killed in February. This is a highly aerial predator that is seen relatively infrequently in the study area. With so many species involved, each employing very different flight strategies, the underlying risk factors
Behaviors & Fatalities at Altamont / CG. Thelander & L. Rugge 13
associated with wind turbines appear to vary greatly from species to species. Finding universal management solutions that will address the many bird species and flight strategies present in the Altamont WRA, and in other WRAs, continues to be a perplexing conservation objective.
Acknowledgements
This project is funded by the National Renewable Energy Laboratory (NREL) under the management of Karin Sinclair. Michael L. Morrison, Ph.D., has provided valuable insights and guidance in all phases of the project. Field biologists who have participated include Lourdes Rugge (Field Team Leader), Stacia Hoover, James Cain, Cherilyn Burton, and Elizabeth van Mantgen. We especially thank ENRON, FORAS, and Altamont Wind Power for providing access to the wind facilities they own and/or operate.
Literature Cited
Anderson, R.L., J. Torn, N. Neuman, J. Noone and D. Maul. 1996. Avian risk assessment methodology. p. 74-87 In: Proceedings of National Avian-Wind Power Planning Meeting II, Palm Springs, CA, Sept. 1995. Prepared for the Avian Subcommittee of the National Wind Coordinating Committee by RESOLVE Inc., Washington, DC, and LGL Ltd., King City, Ont. 152 p. Available at www.nationalwind.org/pubs/avian95/default.htm
Gauthreaux, S.A., Jr. 1996. Suggested practices for monitoring bird populations, movements and mortality in Wind Resource Areas. p. 88-110 In: Proceedings of National Avian-Wind Power Planning Meeting II, Palm Springs, CA, Sept. 1995. Prepared for the Avian Subcommittee of the National Wind Coordinating Committee by RESOLVE Inc., Washington, DC, and LGL Ltd., King City, Ont. 152 p. Available at www.nationalwind.org/pubs/avian95/default.htm
Howell, J.A. 1997. Avian mortality at rotor swept area equivalents, Altamont Pass and Montezuma Hills, California. Trans. Western Sect. Wild/. Soc. 33:24-29.
Howell, J.A. and J.E. DiDonato. 1991. Assessment of avian use and mortality related to wind turbine operations, Altamont Pass, Alameda and Contra Costa Counties, California, September 1988 through August 1989. Rep. for U.S. Windpower Inc., Livermore, CA. 168 p.
Hunt, G. 1994. A pilot Golden Eagle population project in the Altamont Pass Wind Resource Area, California. Rep. from Predatory Bird Res. Group, Univ. Calif., Santa Cruz, CA, for Nat. Renewable Energy Lab., Golden, CO. 212p.
Hunt, G. 1997. A population study of Golden Eagles in the Altamont Pass Wind Resource Area: population trend analysis 1997. Rep. from Predatory Bird Res. Group, Univ. Santa Cruz, CA, for Nat. Renewable Energy Lab., Golden, CO. 98 p.
Hunt, G., R.E. Jackman, T.L. Hunt, D.E. Driscoll and L. Culp. 1998. A population study of Golden Eagles in the Altamont Pass Wind Resource Area: population trend analysis for 1994-97. Rep. from Predatory Bird Res. Group, Univ. Calif., Santa Cruz, CA, for Nat. Renewable Energy Lab., Golden, CO. 42 P
Morrison, M.L. and K.C. Sinclair. 1997. Overview of the U.S. Department of EnergylNational Renewable Energy Laboratory Avian Research Program. Presented at conference "Windpower '97", Austin, TX, June 1997. 9 p.
Morrison, M.L. and H. Davis. 1996. Protocols for evaluation of existing wind developments and determination of bird mortality. p. 111-125 In: Proceedings of National Avian-Wind Power Planning Meeting II, Palm Springs, CA, Sept. 1995. Prepared for the Avian Subcommittee of the National Wind Coordinating Committee by RESOLVE Inc., Washington, DC, and LGL Ltd., King City, Ont. 152 p. Available at www.nationalwind.org/pubs/avian95/default.htm
14 National Avian - Wind Power Planning Meeting III
Orloff, S. and A. Flannery. 1992. Wind turbine effects on avian activity, habitat use, and mortality in Altamont Pass and Solano County Wind Resource Areas. P700-92-001. Rep. from BioSystems Analysis Inc., Tiburon, CA, for Planning Dep., Alameda, Contra Costa and Solano Counties, CA, and Calif. Energy Commis., Sacramento, CA. Var. pag.
Orloff, S. and A. Flannery. 1996. A continued examination of avian mortality in the Altamont Pass Wind Resource Area. P700-96-004CN. Rep. from Ibis Environ. Servo and BioSystems Analysis Inc., Santa Cruz, CA, for Calif. Energy Commis., Sacramento, CA. 55 p.
Reynolds, R.T., J.M. Scott and R.A. Nussbaum. 1980. A variable circular-plot method for estimating bird numbers. Condor 82(3):309-313.
General Discussion
An attendee asked whether once per month was sufficient for carcass searches. The answer was no, based on evidence from studies by R. Anderson, as summarized elsewhere in this volume. However, carcass searches are time-consuming. There is a need to identify an optimum balance between number of areas searched and frequency of searching.
A follow-up question concerned whether a 12-month study is sufficiently long. There is concern about year to year variability, so a longer study is desirable. Whether this is possible depends on funding.
A Population Study of Golden Eagles in the Altamont Pass Wind Resource Area: Population Trend Analysis 1994-1997-Executive Summaryl
by
W. Grainger Hunt
Predatory Bird Research Group, University of California Santa Cruz2
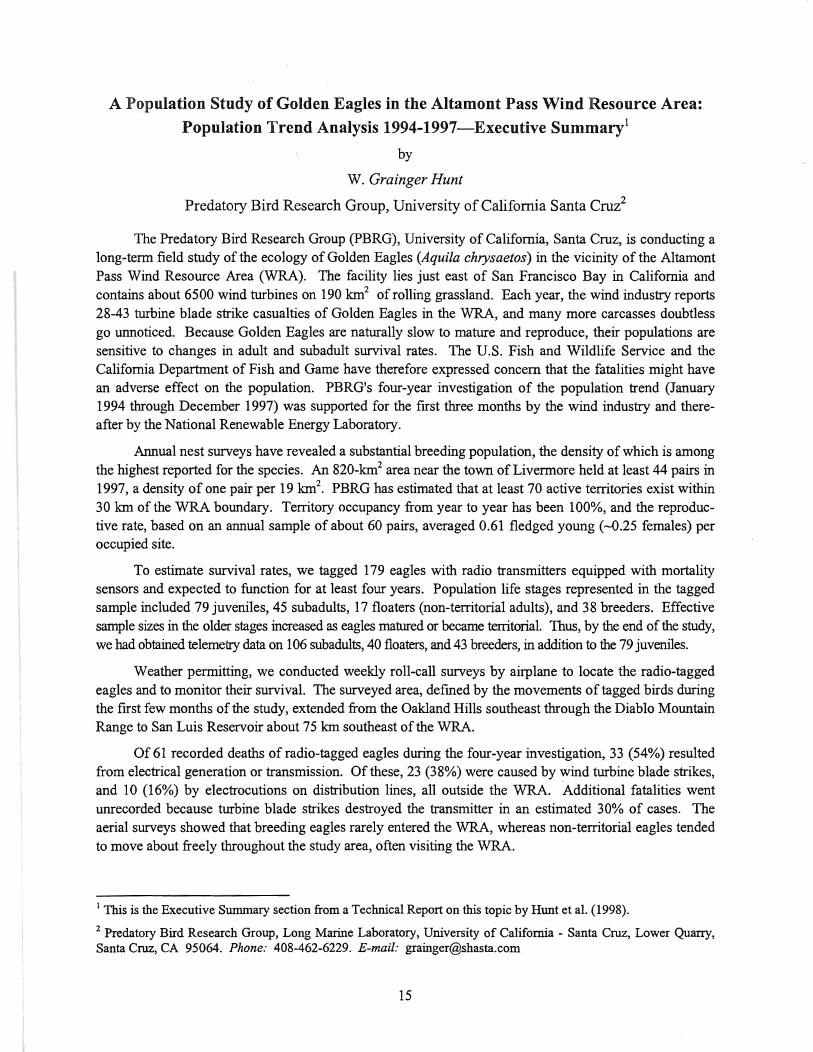
The Predatory Bird Research Group (PBRG), University of California, Santa Cruz, is conducting a long-term field study of the ecology of Golden Eagles (Aquila chrysaetos) in the vicinity of the Altamont Pass Wind Resource Area (WRA). The facility lies just east of San Francisco Bay in California and contains about 6500 wind turbines on 190 km2 of rolling grassland. Each year, the wind industry reports 28-43 turbine blade strike casualties of Golden Eagles in the WRA, and many more carcasses doubtless go unnoticed. Because Golden Eagles are naturally slow to mature and reproduce, their populations are sensitive to changes in adult and subadult survival rates. The U.S. Fish and Wildlife Service and the California Department of Fish and Game have therefore expressed concern that the fatalities might have an adverse effect on the population. PBRG's four-year investigation of the population trend (January 1994 through December 1997) was supported for the first three months by the wind industry and thereafter by the National Renewable Energy Laboratory.
Annual nest surveys have revealed a substantial breeding population, the density of which is among the highest reported for the species. An 820-km2 area near the town of Livermore held at least 44 pairs in 1997, a density of one pair per 19 km2. PBRG has estimated that at least 70 active territories exist within 30 km of the WRA boundary. Territory occupancy from year to year has been 100%, and the reproductive rate, based on an annual sample of about 60 pairs, averaged 0.61 fledged young (-0.25 females) per occupied site.
To estimate survival rates, we tagged 179 eagles with radio transmitters equipped with mortality sensors and expected to function for at least four years. Population life stages represented in the tagged sample included 79 juveniles, 45 subadults, 17 floaters (non-territorial adults), and 38 breeders. Effective sample sizes in the older stages increased as eagles matured or became territorial. Thus, by the end of the study, we had obtained telemetry data on 106 subadults, 40 floaters, and 43 breeders, in addition to the 79 juveniles.
Weather permitting, we conducted weekly roll-call surveys by airplane to locate the radio-tagged eagles and to monitor their survival. The surveyed area, defined by the movements of tagged birds during the first few months of the study, extended from the Oakland Hills southeast through the Diablo Mountain Range to San Luis Reservoir about 75 km southeast of the WRA.
Of 61 recorded deaths of radio-tagged eagles during the four-year investigation, 33 (54%) resulted from electrical generation or transmission. Of these, 23 (38%) were caused by wind turbine blade strikes, and 10 (16%) by electrocutions on distribution lines, all outside the WRA. Additional fatalities went unrecorded because turbine blade strikes destroyed the transmitter in an estimated 30% of cases. The aerial surveys showed that breeding eagles rarely entered the WRA, whereas non-territorial eagles tended to move about freely throughout the study area, often visiting the WRA.
1 This is the Executive Summary section from a Technical Report on this topic by Hunt et al. (1998).
2 Predatory Bird Research Group, Long Marine Laboratory, University of California - Santa Cruz, Lower Quarry, Santa Cruz, CA 95064. Phone: 408-462-6229. E-mail: [email protected]
15
16 National Avian - Wind Power Planning Meeting III
Computer analysis of survival data (program MARK.) by Alan Franklin, Tanya Shenk, and Ken Wilson (1998) from Colorado State University considered Kaplan-Meier survival estimates among the various groupings of life stages and sexes. Their most parsimonious solution was a pooling of data from juveniles, subadults, and floaters of both sexes to produce a single estimate of annual survival for nonterritorial eagles at 0.7867 (SE=0.0263). The estimate for the annual survival of territorial eagles (breeders) was 0.8964 (SE=0.0371).
Franklin, Wilson, and Shenk (1998) developed two Leslie matrix models to estimate the trend of the population. The ftrst, which incorporates the rate at which non-territorial eagles become breeders, estimated the annual rate of population change (A) at 0.9068 (SE=0.03). The 95% conftdence interval of
this estimate did not include 1.,= 1.0, the value for a stable population. This means that, if their model and its assumptions are valid, the population was in a state of decline during the period of our study.
The second model, conftgured at our request, estimated potential growth rate on the assumption that all maturing eagles enter the breeding segment. Part of our rationale was that, once a declining population loses its floating segment, the floater-to-breeder transition rate is moot and only adds variance to the trend estimate. This was of particular concern because the available floater-to-breeder transition rate estimate lacked precision (CV=66.7%). Moreover, the floater-to-breeder transition rate can be expected to change with population size and therefore cannot be modeled as a constant. Franklin, Wilson, and Shenk's (1998) estimate of A in the second (potential growth rate) model was 0.9880, a value statistically indistinguishable from unity. A Moffat life table model developed by Hunt (1998) yielded a virtually identical value for A. Sensitivity analyses for both the matrix and Moffat models found the population most responsive to changes in adult survival and least affected by variation in juvenile survival and reproduction.
Several biological considerations suggest that the potential growth rate of the population is actually lower than estimated. First, we are likely overoptimistic in assuming perfect efftciency by non-territorial eagles in ftlling breeding vacancies by the next breeding season. Second, eagles newly acquiring territories would be initially less fecund than those being replaced, reducing net population productivity. Third, true survival rates are likely lower than estimated because a proportion of transmitters were destroyed by turbine blades.
On the other hand, several factors may operate in favor of population persistence. If floaters immigrating from other subpopulations are available, they may buffer the breeding segment against decline. Moreover, average territory quality-and hence average per capita reproduction--can be expected to increase if the number of territories declines. Other points of optimism include the observed 100% annual territorial reoccupancy rate and the low incidence (3%) of subadults as members of breeding pairs, an indication that a reserve of floaters continues to exist.
The wind industry at Altamont Pass has recently initiated a number of measures that may reduce the rate of turbine blade strikes. These include modiftcation of existing turbines, the removal of turbines in "high-risk" areas, and the replacement of turbine models with others thought to be more benign. In the latter case, the replacements are more efftcient, the net result being far fewer turbines. To track the efftcacy of these and other possibly mitigating changes, PBRG will continue to radio-tag eagles, monitor eagle movements and survival, conduct an annual nest survey, and model the accruing data to reassess the population trend.
Literature Cited
Franklin, A.B., K.R. Wilson and T.M. Shenk. 1998. Estimated annual rate of change in a Golden Eagle population at the Altamont Pass Wind Resource Area, California. Rep. from Colorado State Univ., Fort Collins, CO, for Nat. Renewable Energy Lab., Golden, CO.
?; -~
~~
Golden Eagles in Altamont Pass / WG. Hunt et af. 17
Hunt, WG. 1998. Raptorfioaters at Moffat's equilibrium. Dikos 82:191-197.
Hunt, W.G., R.E. Jackman, T.L. Hunt, D.E. Driscoll and L. CUlp. 1998. A population study of Golden Eagles in the Altamont Pass Wind Resource Area: population trend analysis 1994-1997. NRELlSR-500-26092. Rep. from Predatory Bird Res. Group, Univ. Calif., Santa Cruz, CA, for Nat. Renewable Energy Lab., Golden, CO. 33 p. Available from Nat. Tech. Inform. Serv., Springfield, VA.
General Discussion
Two questions regarding ground squirrels followed this presentation. One participant wondered whether ground squirrel densities were higher near turbines. Dr. Hunt did not know, but his suspicion was yes. Another attendee raised a question about ground squirrel control. What impact would a drastic reduction in ground squirrel abundance, such as through a control program, have on Golden Eagle populations in the Altamont area? Hunt agreed that this was an important question. If a control program were implemented, he thought that a compensatory program might be needed off-site to increase ground squirrel populations there, such that a constant food source for Golden Eagles was maintained. Hunt noted, however, that no starving subadults or floaters had been found during his study.
Introduction
Avian Mitigation Plan: Kenetech Model Wind Turbines,
Altamont Pass WRA, California
by
Richard C. Curry and Paul Kerlinger
Curry & Kerlinger, L.L.c. 1
The objective of the avian mitigation plan is to take immediate action to reduce the number of avian fatalities associated with the operation of Kenetech-designed wind turbines in the Altamont Pass Wind Resource Area (A WRA). The plan, a group of treatments, was developed through analysis of past A WRA research, evaluation of current avian use patterns, identification of potential treatments, and implementation of actions based on these findings. The plan is being implemented in accordance with consultations between U.S. Fish and Wildlife Service (FWS) personnel in both the Portland and Sacramento offices, the current owners of the Kenetech-designed wind turbines, and their consultants. The implementation plan is being funded by a consortium of owners operating Kenetech-designed wind turbines in the A WRA.
The need to take immediate action was prompted by three factors. The first is the California Energy Commission (CEC) report of 1992. Estimates presented in this report of the number of raptors killed by windfarm-related injuries raised the issue to a high level of concern among the various stakeholders. This concern motivated concerned parties to put pressure on the FWS to take steps to stop these fatalities. Second, the high level of fatalities reported over the years by the wind plant operators to the FWS, and Alameda County has not declined. Third, regulatory agencies and many other stakeholders feel that enough study of the problem has taken place, and that there is sufficient information to proceed with specific remedial actions.
Review of Existing Research
This implementation plan was developed in part by synthesizing and analyzing the work of others, and by analysis of the Wildlife Response and Reporting System database. This database was developed by U.S. Windpower (later Kenetech Windpower) and has been continued by the present owners. The implementation plan assumes the validity of the research and fact-finding efforts discussed below. It employs a weight of evidence approach. That is, when observations are confirmed by multiple sources, we considered them to constitute an appropriate base of information upon which to develop a treatment. Although identical techniques were not employed in all the studies, each study employed accepted standard practices.
AWRA Research Base.--Concern about raptor fatalities in the Altamont was first identified by Anderson and Estep (1988). The ensuing CEC study conducted in 1989-91 (Orloff and Flannery 1992) was a primary reference point for the development of this avian mitigation plan. Although the methodology of that study was challenged by some, a variety of decision makers have continued to rely on it as the seminal analysis of avian mortality issues in the Altamont. That study was funded and administered by the CEC and was prepared by BioSystems Analysis, Inc. A report on a continuation of
1 Curry & Kerlinger, L.L.C., 1734 Susquehannock Dr., McLean, VA 22101. Phone: 703-821-1404. Fax: 703-821-1366. E-mail: [email protected]@aol.com
18
Avian Mitigation Plan / R.C. Curry & P. Kerlinger 19
the CEC study was released in August 1996 (Orloff and Flannery 1996). Richard L. Anderson of CEC was the project manager. References here to "the CEC report" refer to both the initial study (1992) and the follow-up study (1996).
In the late 1980s, prior to the CEC study, U.s. Windpower personnel were fmding bird carcasses in the wind plant. In an effort to determine what was happening, the company funded several studies by Judd Howell Associates; these are listed in the Literature Cited section.
After publication of the initial CEC report (1992), Kenetech responded by initiating an extensive research effort, which was developed and directed by an Avian Research Task Force (ARTF) under the chairmanship of Dr. Tom Cade of the Peregrine Fund. Other task force members included Dr. Mark Fuller, Director of the Raptor Research and Technical Assistance Center, a cooperative research unit with Boise State University and the U.S. Department of the Interior; the late Dr. Melvin Kreithen, Associate Professor, Department of Biological Sciences, University of Pittsburgh, a leading authority on the sensory physiology of pigeons (including sight, sound and smell); Dr. Vance Tucker, Professor of Zoology, Duke University, one of the world's foremost authorities on avian aerodynamics, particularly of raptors; and Dr. Charles Walcott, Professor of Neurobiology and Behavior and (at that time) Louis Agassiz Fuertes Director of The Laboratory of Ornithology, Cornell University, an authority on the navigation of homing pigeons. A multi-year research and development program was initiated by the ARTF in an effort to enhance the collision avoidance capabilities of birds, particularly raptors, that use the Altamont Pass WRA.
One phase of the research examined the sensory capacities of American Kestrels and Red-tailed Hawks-specifically, to determine what visual stimuli are most effective in improving their ability to avoid wind turbines. This work was cbnducted by Dr. Hugh McIsaac at Boise State University. Information gained in this research on the visual acuity of raptors was used to design avoidance cues such as patterns for painting blades. A painting design was created for the KVS-33 turbine model, and some controlled Red-tailed Hawk flights were conducted around the turbines both before and after the blades were painted.
A second phase documented avian behavior within the Kenetech segment of the Altamont. Observations were made of flight behavior of wild birds and of trained birds in controlled flights. These observations were obtained under a variety of ambient conditions and circumstances. The objective was to develop research-based modifications to wind turbines, and/or to the siting and operation of the turbines, to reduce avian fatalities. Flights were recorded by a specially designed tracking device that simultaneously measured the vertical angle, horizontal angle, and range of the bird as it maneuvered around the turbines.
Another related project was a radar study of bird movements near a windpower facility in Tarifa, Spain. That project was conducted by Brian Cooper of ABR Inc.
Unfortunately, the untimely bankruptcy of Kenetech Windpower stopped all ARTF work being done in the Altamont, the sensory perception research at Boise State University, and the radar work in Spain. Raw data acquired in these projects have not been analyzed or reported due to the sudden cessation of funding. Verbatim transcripts of periodic ARTF summary reports to Altamont WRA stakeholders are the only extant written record.
In addition to our experience in working with the Avian Research Task Force, we relied on the Wildlife Response and Reporting System (WRRS) developed by Kenetech Windpower. The WRRS is a database of reported fmds of dead birds on the properties where Kenetech model wind turbines are

20 National Avian - Wind Power Planning Meeting III
located. These finds have been recorded systematically since 1989. Finds come from a variety of sources, including incidental finds by field personnel of the operating companies; systematic searches by researchers (e.g., the CEC and Howell studies); and incidental finds reported by others. These records have been rejected by some due to the inclusion of dead birds found by incidental search methodology as well as some systematic studies. We elected to use these records as evidence of the locations where reported fatalities occurred. We have not used them as the basis for estimating the total number of incidents associated with the Kenetech model turbines deployed in the A WRA. The locations of these finds constitute a key element in developing our strategy for applying initial treatments in the Altamont, as we explain below.
Building upon a recommendation in the 1992 CEC report, Kenetech Windpower participated with the Electric Power Research Institute (EPR!) and the National Renewable Energy Laboratory (NREL) to fund the use of video cameras to record avian behavior around wind turbines. The system was later adapted to assess the effectiveness of newly installed perch guards in keeping raptors off the treated towers, and to photograph interactions between birds and perch guards. A composite tape of raptor perching behavior was utilized in this implementation plan.
Another key research effort from which the development of this mitigation plan has benefitted is the NREL-funded Golden Eagle Population Project at Altamont Pass. On 1-2 September 1993, Kenetech convened a conference that included representatives of the FWS, California Department of Fish and Game (CDF&G), the CEC (Anderson), NREL, Dr. Tom Cade, and raptor experts Grainger Hunt, Hans Peeters, and Pete Bloom. The meeting's purpose was to design a study of the local Golden Eagle population. NREL expressed an interest in funding the project and the work was conducted under the direction of Dr. G. Hunt of The Predatory Bird Research Group at the University of California, Santa Cruz. Kenetech funded the first several months of trapping and nesting surveys to avoid delaying the project for a year while the NREL contracts were being worked out. We used information gained from Hunt's radio telemetry tracking of Golden Eagles, and from his visual observations of raptor hunting and perching behavior in the Altamont (which were also a part of that study). We also consulted with him regarding the development of perch guard treatments.
Planning Assumptions Based on Prior AWRA Research.-From these varied sources and experiences the following picture emerges:
It Raptors are the species most at risk in the AWRA. Orloff found that mortality among the five most common raptor species was not related to the abundance of those species. She noted that American Kestrels, Red-tailed Hawks, and Golden Eagles were killed more often than she would have predicted from their abundance in the study area. The opposite was true for Turkey Vultures and Common Ravens.
It Raptors are abundant in the Altamont. Howell and Orloff reported similar levels of relative abundance per 10-minute scans during raptor surveys that they conducted in the Altamont (1.11 and 1.2 respectively). Hunt found that one of the highest concentrations of nesting Golden Eagles in the world is located adjacent to the A WRA .
., There is a substantial prey base in the AWRA. Hunt and Orloff both noted the abundance of the California ground squirrel in the Altamont and suggested that raptor foraging behaviors may make raptors susceptible to collision with wind turbines. Hunt observed foraging Golden Eagles frequently engaged in contour hunting (flying/gliding about a meter above the ground). They less frequently stooped for prey.
Avian Mitigation Plan / R.C. Curry & P. Kerlinger 21
• The Kenetech model wind turbines are the turbine type most associated with raptor deaths in the AWRA. Both the 1992 CEC study and the 1996 continuation report found that more fatalities were associated with horizontal axis turbines mounted on horizontal-lattice towers than all other types combined. Most of the Kenetech model turbines were mounted on 60', horizontal-lattice towers. At the time of the Orloff studies, turbines of this type constituted a majority of the turbines operating in the A WRA. Moreover, the availability rate of the fleet was in the 97-98% range; that is, when the wind was blowing 97-98% of the turbines were in operation.
• The horizontal-lattice tower structure of the Kenetech model turbines provides ideal perching platforms. Orloff and Hunt observed that, of all the wind turbine types, the horizontal-lattice type towers were the preferred perching platfonn. Howell identified the most-frequented perching locations on the Kenetech wind turbines. All three researchers observed that the raptors generally perched on inactive turbines, and rarely attempted to land on moving turbines. Howell reported birds leaving wind turbines when start up procedures were activated and before the blades began to rotate.
• The position of the turbine in a string, and its association with topographic features, are important factors in raptor fatalities. Orloff identified end-of-row turbines as having a higher number of avian fatalities. Howell identified mid-row depressions (swales) and ridge-ends (shoulders) as features associated with avian fatalities. Our analysis of the WRRS data indicates that 60% of the recorded fatalities are associated with these topographic features.
• Avoidance of wind turbines is the normal response of birds, including raptors, in the AWRA. Research efforts in the Altamont by the Kenetech Avian Task Force included observations of raptor flight behavior and observations of controlled releases of homing pigeons in varying situations in the wind plant. The pigeon tests called for at least half of the birds to be released at specific locations where they would have to negotiate the adjacent string of turbines in order to return to their loft. The birds demonstrated a pattern of avoidance of turbines, with flight strategies generally dictated by (1) how close the birds were released to the turbine strings, (2) wind speed, and (3) wind direction. Birds recognized operating versus inactive turbines, and used gaps in strings as flight corridors. Flight strategies based on energy conservation were also observed during these controlled pigeon flights.
• Providing a visual contrast between the turbine blade and the background is an important element in providing visual cues to birds flying around the rotating blades of the turbines. Visual acuity research by McIsaac was used to develop a high-contrast blade pattern. This research was undergoing testing in the Altamont when funding was interrupted. While funding was still available, raptor flight behavior around unpainted turbines was documented, and initial flights were conducted after blades painted with a highly contrasting pattern were installed. Because birds can see in the UV part of the spectrum (Kreithen and Eisner 1978), the team wanted to be sure that a contrast was presented to the birds across the full range of their vision. A special white paint was developed so that the contrast between the black and white portions of the design remained strong at the UV end of the spectrum. Initial indications suggest that flight behavior around the turbines may be influenced by the provision of visual cues but more research is needed. Additional research by McIsaac demonstrates that a Redtailed Hawk can distinguish, with a high degree of regularity, photographs that do and do not contain wind turbines. Unfortunately, McIsaac's proposals to study the effect of rotation and
22 National Avian - Wind Power Planning Meeting III
light on raptors' visual acuity, and to test differences in conspicuousness between the root and tip of the blade, remain unfunded.
Analysis of Wildlife Response and Recovery System (WRRS) Dataset.-The WRRS is the longest continuously-collected and most complete dataset documenting avian fatalities associated with wind plant operations, including locations and species. The WRRS only documents fatalities associated with Kenetech model wind turbines, plus other wind plant-related fatalities on properties where these turbines are operating. This dataset is not directly comparable with the standard carcass surveys generally used to monitor wind energy developments. The dataset is a nine year record including both incidental fmds by trained wind plant operating personnel, and finds during standard carcass surveys and other field studies (Orloff, Howell, Hunt, Kenetech Avian Research Task Force, etc.). As we discuss below, we will attempt to calibrate this survey method with the more traditional search techniques, at least with respect to a few raptor species.
As stated above, Orloff found that turbines mounted on horizontalllattice type towers (i.e., the Kenetech model 56-100 turbine with a 60' horizontalllattice tower structure) were associated with more avian fatalities than all other turbine types in the A WRA combined. However, when we examined the WRRS dataset, we found that factors other than turbine type may help explain raptor fatalities.
An analysis of several hundred Golden Eagle and Red-tailed Hawk fatalities in the WRRS dataset shows that collisions with turbines are rare events and are non-randomly distributed among turbines (Kerlinger and Curry 1997). Only 459 of more than 3400 Kenetech turbines (13%) were implicated in fatalities of these species. For Golden Eagles, only 4.8% of all turbines have been associated with fatalities, and 16 turbines (out of 3400+) account for 19.2% of all lrnown eagle fatalities. Those 16 turbines have killed either 2 or 3 eagles each over the nine-year period. For Red-tailed Hawks, 27 turbines have killed either 2 or 3 hawks, or one sixth (16.6%) of all Red-tailed Hawks documented in the dataset.
The locations of these fatalities in the wind plant are instructive in identifying the risk associated with individual turbines. Although end- and second-from-end turbines account for only one-third (34.1%) of all the Kenetech model turbines, they account for nearly one half (46.3%) of all Golden Eagles killed and 44.3% of all Red-tailed Hawks killed on this equipment. Although more than one half of all eagles and hawks were killed at mid-string turbines, those located in dips and notches (steep midstring valleys) and those with irregular spacing between turbines account for a good percentage of these fatalities. Overall, 67.9% of Golden Eagle and 60.3% of Red-tailed Hawk fatalities can be explained by position in string and topography.
As an example of the importance of topography, and how end-of-string turbines and topography are related, one high fatality area of the wind plant (a single ranch) was examined. At this site, the 65 turbines were associated with 18 Golden Eagle and Red-tailed Hawk kills-a much higher number than the overall plant average. These fatalities were related to steep nature of the slopes. Kills of these species were mostly confined to the lower two turbines in the strings. Of the 8 strings, no fatalities occurred at end-of-row turbines at the tops of hills, whereas 5 of the 8 end-of-string turbines (62.5%) that were lowest in the valley incurred fatalities. Eleven of the 18 kills (61.1 %) occurred at the bottom-end or second-from-end turbines, although those turbines accounted for only one-quarter of all turbines deployed in that area. The fatalities were associated with steepness of slope, with turbines lowest in the valleys (called canyons, dips, draws, or notches) being most dangerous.
The conclusion that we reached from these findings is that turbines situated on steep hillsides or in valleys, particularly those that are end-of-string turbines, are much more dangerous than turbines situated
Avian Mitigation Plan / R. C. Curry & P. Kerlinger 23
in mid-string and on fairly level topography. The data also strongly suggest that topography may be even more important than position in string, but that remains to be fully tested.
The non-random distribution of the fatalities reported in the WRRS provides direction for treatment of the problem. By focusing on those turbines or areas where fatalities were most frequent, a cost-effective and efficient means of treatment can be devised. Individual turbines in areas where fatalities are low or non-existent do not need to be treated with the same urgency as turbines and areas where multiple fatalities occur. By using the WRRS as a tool for guiding where treatments should be implemented, we stand a much greater chance of reducing kills than if a random strategy were used.
Plan Elements
The plan's objective is to reduce the number of fatalities as quickly as possible by implementing the following actions:
• Perching and/or roosting on the towers is a risky behavior. Therefore, eliminate the use of the Kenetech model wind turbines, especially the 60' horizontal lattice-type towers, for perching by Golden Eagles, Red-tailed Hawks, and other raptors.
• Availability of prey is an important factor in drawing raptors into the wind plant. Therefore, evaluate the effectiveness of an existing County-administered ground squirrel management program in reducing the number of raptors in the wind plant and the time spent foraging around the wind turbines.
• As few as 13% of the Kenetech model turbines in the A WRA are actually associated with known avian fatalities. TherefOi'e, focus initial treatments on the high risk towers. In addition, use the Green Ridge Power (GRP) repowering opportunity to maximize the removal of turbines or groups of turbines associated with reported raptor fatalities,
• 60% of the Kenetech model turbines at which Golden Eagle and Red-tailed Hawk fatalities were found are associated with specific topographic features. Therefore, utilize behavior observations at these sites to develop site specific treatments. In addition, use this information to develop siting criteria for the installation of new turbines.
• The WRRS database and current observations of flight behavior at selected locations identify specific flight paths that are used frequently by raptors. Therefore, develop techniques, including visual cues, to delineate obstructions.
Perch Guard Treatments.-Perch guards were designed based on a review of Howell (1995), "Perching prevention assessment at Kenetech 56-100 model wind turbine towers"; a review of videotapes of raptor behavior around a string of four treated towers; consultations with Grainger Hunt and Hans Peeters; and testing of various designs with a Golden Eagle and two Red-tailed Hawks provided by the Lindsay Museum, Walnut Creek, CA. Perch treatments applied to high-risk turbines included the following: cover nacelle platform area with screen; screen top bays in lattice tower; and apply deterrents to some horizontal structures within the rotor-swept area.
To determine whether the installation of these perch guards is an effective means of deterring avian predators from perching on the turbines, and whether perching is related to fatalities, we have established a series of field tests on three sites within the wind plant. The sites were chosen because they included sites where high numbers of kills have occurred, as recorded in nine years of data collected by the WRRS.
24 National Avian - Wind Power Planning Meeting III
On each study site, a pre-treatment observation period consisting of 24 observation sessions, each two hours in length, was established. During this pre-treatment observation period all raptors seen on the site were noted and their behaviors recorded. These included perching, location of perch on tower, duration of perching event, and behavior while perching.
Maps were made of flight paths and flight behavior observed on the site generally, and specifically in relation to turbines where kills have been recorded previously.
Following pre-treatment observation, perch guards were installed on 30 of the 90 - 140 turbines in each of the three areas. Perch guards were placed on turbines that were either the site ofa prior fatality, or on which frequent perching occurred during the pre-treatment observations.
After the perch guards were installed, a second round of observations of duration identical to the pre-treatment surveys was initiated. The purpose of this round of observations was to evaluate whether birds perched on treated towers; record their behavior around the treated towers; and detennine if the perching activity moved to towers previously not used for perching within the observation area. The same infonnation was gathered during this round of observations, with the addition of behavioral infonnation regarding perching attempts on treated turbines.
After this round of post treatment observations is completed, an analysis will be undertaken and another round of treatment and evaluation will be conducted as needed.
The approach is to begin treatments in high risk areas, as identified in the analysis of the WRRS data, and to use perching behavior at the study site as a method by which the birds can show us which additional towers need to be treated and which do not. It is assumed that the birds' perching behavior reliably indicates which towers have' little or no value to them as perch sites. Some night observations may be conducted to make sure that the untreated towers that do not appear to be used during the day are not used for roosting after dark. Some incidental observations of this behavior have been made in the Altamont. As discussed above, perched birds usually leave the towers when the turbines are activated. If the towers are also being used for night roosts, movement after dark in an operating wind plant could be highly problematic for a diurnal raptor.
The infonnation collected during these rounds of observations and treatment will also be used to determine whether perching behavior and/or flight behavior is correlated with fatalities. This will be accomplished via correlative analysis and by examining whether kills continue at the treated turbines as indicated by the WRRS.
Evaluation of Ground Squirrel Management.-The decision to evaluate the Alameda County ground squirrel management program developed because of observations made by Grainger Hunt in the A WRA. He observed changes in use patterns in the A WRA by Golden Eagles that he was tracking by radio telemetry. Hunt discussed these shifts with Karen Lougheed, who maintains the WRRS for Green Ridge Power et al. Ms. Lougheed noted that she was not getting reports of dead birds in the area Hunt identified as being vacated by the birds he was tracking. A quick driving survey indicated very low numbers of ground squirrels over a large section of the wind plant. Records showed that the property had been treated systematically according to county guidelines for the preceding three years.
Subsequent driving surveys were conducted on those properties upon which the Kenetech model turbines were installed. The areas were rated as low, medium or high density ground squirrel areas. Low-density areas were those where less than 3 ground squirrels per 0.3 miles were observed. Areas in which 12 or more ground squirrels were observed per 0.3 miles were designated as high-density areas.
Avian Mitigation Plan I R.C. Curry & P. Kerlinger 25
To test for a relationship between ground squirrel abundance and eagle distribution in the areas around the Kenetech model wind turbines, Hunt selected five "high density" ground squirrel areas and five "low density" areas. Working with GIS mapping software, he created circles with I.O-km diameters in five areas of high ground squirrel density and five areas of low ground squirrel density, avoiding overlap in all cases. He then overlaid the relocation points for all radio-tagged sub-adult and floater Golden Eagles located via airplane surveys from September 1996 to June 1997.
There was a statistically significant difference in the number of eagles located in areas with high vs. low levels of ground squirrel activity. For further details see Hunt and Culp (1997). Based on these findings, a decision was made to incorporate an evaluation of the Alameda County's ground squirrel management program into the implementation plan. A monitoring program was established to determine its effectiveness, and how the program impacts the behavior of Golden Eagles and other avian predators. Monitoring is done two times per month throughout the wind plant (areas where Kenetech model turbines are operating) in twenty I.O-km circles. The circles, which include more than 65% of the turbines in the wind plant, were chosen to maximize the area within the wind plant that is covered and to maximize the number of turbines included in the study. Furthermore, locations identified by the WRRS database and CEC studies as being the areas with the highest number of fatalities were included.
Within each circle the roads are driven slowly, via an established route, during which all ground squirrels and raptors are counted. In addition to the counts of the avian predators, their behaviors are also recorded (perching, soaring, high altitude flight, hunting behavior, direct flights through the study site, etc.). Because the areas within several circles are not currently treated for ground squirrels, these serve as "controls" or reference areas for comparison with areas that are treated. In addition, several circles that are being monitored were not treated by the county in 1998 but were scheduled for treatment in the near future.
Changes within these circles over time, and the differences among the circles with respect to the numbers of squirrels and avian predators, are expected to provide a robust indication of the efficacy of controlling ground squirrels and how eagles and other avian predators respond to such efforts. As of 1998, field work was scheduled to be conducted for a minimum of 18 months, although preliminary analyses were to be done to assess where ground squirrel and avian predator activity is highest. The results of these analyses will be used to design and implement additional mitigation measures, should they be necessary.
Repowering.-The objective is to test the hypothesis that replacement of the Kenetech model turbines with newer equipment will result in a reduction in the number of eagle and hawk fatalities in the repowered areas. The new turbines will have structural and operational attributes that are believed to be safer for raptors. These changes include lower blade rotation speed (24 vs. 72 rpm); tubular vs. lattice tower; taller structures, resulting in much more space between ground and bottom of blade arc. The sheer reduction in the number of turbines in the process of repowering should have a positive effect. Howell suggests, "It appears that mortality occurred on a per-turbine basis, that is each turbine simply represents an obstacle" (Howell, 1995b). If this is so, we can anticipate a reduction in fatalities approximating the replacement ratio of old to new turbines. In the case of the GRP-owned Kenetech model turbines, replacement will occur on approximately a 7:1 basis. The repowering program also provides an opportunity for the removal of problematic turbines and the avoidance of certain topographical situations when siting new turbines. At this point, we can only project the potential impact of repowering on the reduction of avian mortality.
26 National Avian - Wind Power Planning Meeting III
A monitoring program following the removal of old turbines and the installation of new turbines has been proposed to test the effectiveness of this change of equipment. Two monitoring protocols would be employed. The fIrst is the continuation of the WRRS. That dataset is the most comprehensive record of turbine-specifIc avian fatalities collected to date, and will serve as a pre-treatment dataset. Alameda County is specifying the WRRS for use by the other companies proposing to rep ower at this time. The second monitoring protocol will be specifIed by Alameda County and will closely approximate the standard carcass surveys employed in wind plants (Anderson et al. 1999).
By applying the two monitoring methods concurrently, we expect to be able to calibrate the difference between the two methods for detecting dead birds in the wind plant. The intensive studies would be conducted for a period of two years following commencement of operation of the repowered turbines. Observer effIciency and scavenger removal tests, employing carcasses of the species that have been struck by turbines on these sites, would be conducted. Once the WRRS has been calibrated, this method would be used to maintain a continuing monitoring program for the duration of the repowering pennits. These protocols are being developed by Jim Estep of Jones & Stokes, environmental consultant to Alameda and Contra Costa County.
Visual and Auditory Cues in High Risk Areas.-The WRRS data and the behavioral observations being recorded in both the perch-guarding site surveys and the 20 prey-base survey areas (discussed above) will be used to identify flight corridors and flight behavior around wind turbines, especially endof-row turbines. Treatments are being developed to provide visual cues to alert foraging raptors and other birds flying through frequently used corridors to the presence of a turbine. Auditory cues may also be appropriate in some situations, such as when a raptor is kiting while scanning a slope for prey with its back to the equipment, or when birds fly in certain light and/or weather conditions that hamper visibility. Coordination with wind plant operators may provide additional options for reducing risk on a site-specifIc and species-specifIc basis
Scope and Duration
The implementation plan is a multi-year project and, as ofmid-1998, was nearing completion of its fIrst year. The level of effort is substantial. In a year's time, at least one of the aforementioned activities will have been implemented in each area where the Kenetech model wind turbines are currently deployed.
Literature Cited
Anderson, R.L. and J.A. Estep. 1988. Wind energy development in California: impact, mitigation, monitoring, and planning. Calif. Energy Commis., Sacramento, CA.
Anderson, R., M. Morrison, K. Sinclair and D. Strickland, with H. Davis and W. Kendall. 1999. Studying wind energy/bird interactions: a guidance document. Nat. Wind Coord. Commit. clo RESOLVE, Washington, DC. 87 p. Available at www.nationalwind.org/pubs/default.htm
Howell, IA. and IE. DiDonato. 1991. Assessment of avian use and mortality related to wind turbine operations, Altamont Pass, Alameda and Contra Costa Counties, California, September 1988-August 1989. Final Report. Rep. for U.S. Windpower Inc., Livermore, CA.
Howell, J.A. 1995a. Perching prevention assessment at Kenetech 56-100 wind turbine towers. Rep. from Judd Howell & Assoc., Sausalito, CA, for Kenetech Windpower, San Francisco, CA.
Howell, J.A. 1995b. Avian mortality at rotor swept area equivalents, Altamont Pass and Montezuma Hills, California. Rep. for Kenetech Windpower, San Francisco, CA.
Howell, IA., I Noone and C. Wardner. 1991. Visual experiment to reduce avian mortality related to wind turbine operations, Altamont Pass, Alameda and Contra Costa Counties, California, April 1990 through March 1991, Final Report. Rep. for U.S. Windpower Inc., Livermore, CA.
Avian Mitigation Plan / R.C. Curry & P. Kerlinger 27
Hunt, G. 1994. A pilot Golden Eagle population project in the Altamont Pass Wind Resource Area, California. Rep. from Predatory Bird Research Group, Univ. Calif., Santa Cruz, for Nat. Renewable Energy Lab., Golden, CO.
Hunt, G. 1997. A population study of Golden Eagles in the Altamont Pass Wind Resource Area: population trend analysis, 1997. Rep. from Predatory Bird Research Group, Univ. Calif., Santa Cruz, for Nat. Renewable Energy Lab., Golden, CO.
Hunt, G. and L. Culp. 1997. The influence of high ground squirrel densities on the occurrence of Golden Eagles on Altamont Ownership Consortium property. Appendix C In: P. Kerlinger and R. Curry (1997, q.v.)
Kenetech Windpower, Inc. 1994. Avian research program update.
Kerlinger, P. and R. Curry. 1997. Altamont avian plan: status report to the US Fish and Wildlife Service. Rep. from Richard Curry Assoc., McLean, VA, for The Consortium of Altamont Owners.
Kreithen, M.L. and T. Eisner. 1978. Ultraviolet light detection by the homing pigeon. Nature 272 (5651): 347-348.
Orloff, S. and A. Flannery. 1992. Wind turbine effects on avian activity, habitat use, and mortality in Altamont Pass and Solano County Wind Resource Areas. P700-92-001. Rep. from BioSystems Analysis Inc., Tiburon, CA, for Planning Dep., Alameda, Contra Costa and Solano Counties, CA, and Calif. Energy Commis. [Sacramento, CAl Var. pag.
Orloff, S. and A. Flannery. 1996. A continued examination of avian mortality in the Altamont Pass Wind Resource Area. P700-96-004CN. Rep. from Ibis Environ. Servo and BioSystems Analysis Inc., Santa Cruz, CA, for Calif. Energy Commis. [Sacramento, CAl 55 P
Tucker, V.A. 1995a. A mathematical model of bird collisions with wind turbine rotors. J. Solar Energy & Engineer. 118: 253-262.
Tucker, V.A. 1995b. Using a collision model to design safer wind turbine rotors for birds. J. Solar Energy & Engineer. 118: 263-269.
General Discussion
Regarding the tests of pigeon flight behavior near turbines, one participant asked how late relative to sunset the tests were done. These tests continued up to Y2 hour after sunset. A follow-up question concerned whether, in low-light conditions, pigeons maneuvered around the turbines based on visual or auditory cues. This is uncertain, though it was noted that, as turbines start up, there are audible cues associated with changes in blade pitch.
Would decoy towers (without functioning rotors) positioned at the ends of turbine strings reduce the number of birds approaching turbine strings? This is not known, but is one idea under consideration as a potential risk-reduction treatment, especially in areas where no ground squirrel control is done. Although provision of these alternate perches would help keep birds off the turbines, it might also attract birds to the general area of the turbines, or encourage them to remain longer.
Regarding secondary toxicity of poisoned ground squirrels, the poison used is an anti-coagulant applied to grain. It was noted that affected ground squirrels generally go into their burrows and die there. Also, the bodies that are on the surface are picked up when found. Dr. G. Hunt noted that eagles tend not to eat the intestines of ground squirrels, where poison concentrates. He said that there were no indications that any of the dead radio-tagged eagles had been killed by poison. It was also suggested that the blue dye in the poison would be evident in dead eagles if they had ingested poisoned prey.
Regarding repowering, it was noted that perch guards are being installed on turbines that will remain operational for an extended period. Perch guards are not being installed on turbines scheduled to be replaced in the near future.
- ~_ ._L_4._
The Role of Visual Acuity in Bird-Wind Turbine Interactions by
Introduction
Michael L. Morrison
California State University, Sacramento1,2
Because studies have shown that birds collide with turbine blades, there is interest in determining means of increasing the conspicuousness of blades, and/or determining ways to deter birds from approaching the blades. However, the ability of birds to perceive wind turbines has received little attention by the scientific community. This report summarizes research conducted to determine visual acuity in raptors, and makes recommendations for further studies.
Boise State University
The Raptor Research Center, Boise State University, under the direction of Dr. Hugh McIsaac, conducted a series of primarily laboratory studies to determine visual acuity in raptors, including their ability to resolve painted blades. Funding for this research was provided initially by Kenetech Wind Power. When Kenetech funding expired, the National Renewable Energy Laboratory (NREL) provided funding to complete data analysis and report preparation. Currently, reports are in the peer-review stage.
Visual acuity estimates of American Kestrels were obtained using a two-alternative, forced-choice psychometric procedure. Kestrels were trained to discriminate black-and-white gratings (of several spatial frequencies) from stimuli that were uniformly gray. The kestrels were tested at several birdstimulus distances ranging from 50 to 160 cm.
McIsaac and coworkers showed visual acuity in kestrels to be lower than previously reported in the literature. However, comparisons between studies are tenuous because of differences in experimental procedures, intensity and type of illumination of the test objects, optical condition of the birds, size of the grating used, and sample size.
Regardless of differences in experimental designs, McIsaac estimated that kestrels should be able to resolve the blades of a large turbine at long distances. For example, turbines with an average blade width of 0.6 m should be visible at distances of at least 1000 m. Additionally, they thought that any pattern painted on the blades to increase conspicuousness and to attract the birds' attention should have components whose smallest dimensions are 2-3 cm if kestrels are to resolve the pattern at 25 m in bright daylight. These calculations assumed average acuity and stationary turbine blades in bright light.
They also concluded that kestrels (as for many raptors) have different acuity for viewing objects nearby versus objects at longer distances. Because the McIsaac work used relatively short bird-stimulus distances (160 cm), it is difficult to determine how their results will extrapolate to field situations. Nevertheless, their work provides an initial analysis of how raptors respond to various stimuli under laboratory conditions.
McIsaac also evaluated the influence of stimulus rotation on visual acuity in kestrels. Their laboratory analyses approximated a large blade rotating at 43 to 69 rpm. They concluded that a kestrel
I Department of Biological Sciences, California State University, Sacramento, CA 95819. E-mail [email protected]
2 In the absence of Dr. Hugh McIsaac, who has been studying the visual acuity of raptors as related to detectability of wind turbines, Dr. Morrison summarized some of this research, and commented on priorities for future related research.
28

Visual Acuity & Wind Turbines / M.L. Morrison 29
should be able to resolve these rotating blades at approximately 150 m. Thus, in conditions of bright light, kestrels should have time to maneuver around the rotating blades.
Research Priorities
The problem in bird-wind turbine interactions is not whether the blades are too small to be seen. This is unlikely, given the size of the blades and the results of McIsaac. Measures of visual acuity are excellent for determining what an animal can see, such as letters on a high-contrast background, but tell us little about the ability to see overall shapes or the coarser details that provide additional information about those shapes. Nor do visual acuity measures tell us what happens to vision when contrast drops. Once blades begin to rotate, especially at high speed, blurring occurs, and the contrast of a painted pattern drops.
Low, medium and high spatial frequencies provide information about different aspects of the object being viewed. The low spatial frequencies provide information about overall shape, such as the silhouettes of different objects. The intermediate spatial frequencies tell us about the coarse details of the object, such as whether the feather pattern of a bird is coarsely striped or uniform. The high spatial frequencies tell us about the finest details of visual patterns that the organism can detect.
Our ability to detect these various spatial frequencies depends upon the contrast between these images and their backgrounds. In general, we need high contrast to see either the high or the low spatial frequencies; the intermediate spatial frequencies can be detected at relatively low contrast. The curve that plots our sensitivity to contrast is called the contrast-sensitivity function (CSF). Thus, visual acuity is only one point on a CSF-the maximum spatial frequency that can be detected at .the highest contrast. The CSF has become the conventional way to study the ability of the visual system to detect various types of stimuli. Development of CSF curves for raptors under field (or simulated field) conditions should advance our understanding of how birds resolve rotating blades under different lighting conditions (i.e., contrast).
In order to be visible under conditions of low contrast, patterns need to contain intermediate spatial frequencies since only these can be detected at low contrast. As a bird flies toward a rotating blade, even though the blade rotation remains constant, the optical image of the blade sweeps faster and faster across the retina. A pattern that may be easy to see from far away becomes a blur or smear as the bird gets closer.
McIsaac's data suggest that rotation rate has little effect on visibility of coarse stimuli even at high rotation rates. McIsaac showed that, as rotation rate increased from 0 to 90 rpm, detectability by one kestrel decreased only from 93% to 87%. Detectability actually increased in another test subject. However, efforts to increase visibility may still be desirable, especially under dim and suboptimal lighting conditions.
The objective, in trying to optimize blade appearance to avoid collisions, is to take something that is already potentially visible and make it look threatening. What is required is a two-fold approach: visual and cognitive. The visual component should involve making the blades maximally visible, especially in dim light, rather than worrying about minimal visibility as an acuity-oriented approach does. Because the image of the outer tip of the blade is the fastest moving portion of the retinal image, the greatest need is to make that part of the moving blade visible to the raptor. Given the relatively high detectability of coarse gratings at even high rotation rates, at least under good lighting, the question becomes how to make these blades threatening to a raptor-the cognitive approach.
Thus, it seems that a two-fold research approach is indicated: (1) determine the contrast-sensitivity functions of rap tors under field conditions; and (2) evaluate techniques that increase blade contrast.
30 National Avian - Wind Power Planning Meeting III
General Discussion
This presentation stimulated numerous questions and comments. Most of the discussion concerned the perceptive abilities and behavior of hunting raptors, and techniques to enhance the detectability of wind turbines to birds.
It is apparent that at least raptors, and presumably many other groups of birds, have the visual acuity to detect the blades of a wind turbine. Dr. Morrison mentioned that European research has indicated that eagles may have higher visual acuity than the kestrels studied by Dr. McIsaac. However, raptors and other birds still strike turbine blades. There obviously are other factors that override the birds' physical abilities to detect obstacles. What is it that draws a bird's attention to look at the blades in the first place? This has not been investigated seriously. Similarly, there have been no studies of sensitivity to motion versus visual acuity.
One attendee with much experience in falconry noted that raptors tend to 'lock on' to a prey item. A falconry bird will keep its eyes focussed on the prey even as the handler moves the raptor's body, for example. In this state, raptors might not detect a turbine even though very capable of seeing it when not focussed on prey. When 'locked on', raptors appear to ignore objects in their peripheral vision, and possibly limit their depth of field as well. However, in the commenter's experience, before raptors initiate an attack, they select an attack path that will avoid obstacles.
Dr. Morrison noted that the 'locking-on' phenomenon in raptors has been recognized by bird -wind turbine researchers for some years. He also noted that Hugh McIsaac's research has shown that raptors have good depth of field, but that perception may limit the objects that actually are noticed by the bird. However, if sufficiently threatened, the 'locking on' phenomenon can be overcome. When there is a real threat to a raptor that is focussed on prey, e.g. when a large raptor pursues a smaller raptor, this may be sufficient to get the attention of the otherwise 'locked on' smaller raptor. It was suggested that studies of vision and perception in species adapted to open habitats (few obstacles) versus forested habitats (many obstacles) might be helpful.
There was some discussion of techniques (visual and acoustic) that could be used to enhance the conspicuousness of wind turbines, sufficient to attract the attention of raptors that are focussed closely on prey. It was pointed out that the effectiveness of visual approaches, such as painting and/or coloring of rotors, declines as light levels deteriorate and/or the speed of the blade tips increases. Consequently, visual techniques may be only a partial solution, limited in effectiveness to daytime. Dr. Morrison reiterated that it is important to consider the contrast-sensitivity function. One participant asked where on the blades birds tend to strike, and whether this information would be pertinent to the patterning of blades to avoid bird collisions. It was suggested that illuminating a blade with "black" (ultraviolet) light might reveal any points of impact up to several weeks later. This could provide a method for determining, after the fact, where on the turbine a bird had struck.
Several comments concerned whether noise is a possible tool to help make a wind turbine more detectable, especially during darkness. Would it be feasible and useful to mount noise makers on the ends of rotor blades? One participant noted that some waterbirds seem to avoid wind turbines during the dark - a reaction possibly related to the noise of the turbines. Dr. Morrison was not aware of any experiments that mounted noise-makers on rotor tips. However, he pointed out that turbines already are noisy yet birds continue to strike them. The inherent noise of the turbines does not warn all birds away. The comment was made that, nevertheless, research should not be restricted to visual approaches alone; noise deterrent devices still deserve investigation. Although birds are well known to habituate to noise deterrents, noises that startle birds and serve to draw their attention could be effective. It was noted that some laboratory work along related lines has been done by (the late) Dr. Mel Kreithen, and that Dr. Ron Larkin has tested the reactions of night-migrating birds to noise signals.
Avian Monitoring and Risk Assessment at Tehachapi Pass and San Gorgonio Pass Wind Resource Areas, California:
Phase 1 Preliminary Results
by
Richard L. AndersonI, Dale Stricklamf, Judith TomI, Natasha NeumannI, Wallace Erickson2,
John Cleckle/, Gabriel MayorgaI, Ginger NuhnI, Andie Leuder/, Julie SchneiderI, Leslie Backu/, Paula Beckel and Neil Flagl
Introduction
1 California Energy Commission 2 Western EcoSystems Technology, Inc.
3 Pacific Southwest Research Station
Awareness of avian fatalities at large scale wind energy developments first emerged in the late 1980s at the Altamont Pass Wind Resource Area (WRA) in Central California, U.S.A. Observations of dead raptors at the Altamont Pass WRA (Anderson and Estep 1988; Estep 1989) triggered concern on the part of regulatory agencies, environmental/conservation groups, resource agencies, and the wind and electric utility industries.
In addition to the results from the Altamont Pass WRA, other studies and observations have also established that birds die as a result of oollisions with wind turbines and related facilities within wind plants. Although fatalities of many bird species have been documented, raptors have received the most attention in California and also in Spain (Anderson and Estep 1988; Estep 1989; Howell and Noone 1992; Orloff and Flannery 1992; Hunt 1994; Luke and Watts 1994; Howell 1995; Marti 1995; Janss, this volume). Other WRA studies have documented deaths of songbirds (Orloff and Flannery 1992; Pearson 1992; Higgins et al. 1995; Winkelman 1995), water birds (pearson 1992; Winkelman 1995), and bats (Higgins et al. 1995). Generally, these "other birds" have been common species in those areas, not subject to the degree of concern associated with raptor fatalities.
This paper provides preliminary results for a cooperative research project undertaken by the California Energy Commission, the National Renewable Energy Laboratory (NREL), and Western EcoSystems Technology, Inc. (WEST). The project includes studies in the Tehachapi Pass and San Gorgonio Pass WRAs, California. The studies were designed to document bird behavior, bird use, bird fatalities, and bird risk. These were to be determined as a function of turbine size, turbine type, turbine density, wind plant characteristics, and environmental variables within the operating wind plants. These differences can be important in site selection and layout of a new wind plant. The results also provide information that can help developers and regulators estimate effects at new development sites.
1 California Energy Commission, 1516 Ninth Street, Sacramento, CA 95814. Phone: 916-654-4166. E-mail: [email protected]
2 Western EcoSystems Technology, Inc., 2003 Central Avenue, Cheyenne, WY 82001. Phone: 307-634-1756. E-mail: [email protected]
3 Pacific Southwest Research Station, 2400 Washington A venue, Redding, CA 96001
31
32 National Avian - Wind Power Planning Meeting III
Study Areas
Tehachapi Pass WRA.-The Tehachapi Pass WRA is located in south-central California at elevations of 1000-1600 meters (3300-5300 feet) above sea level. The natural communities are diverse and complex botanically. The study area was divided into three subareas: west ridge, middle ridge, and east slope. Approximately 5000 turbines were in operation at Tehachapi during this research project.
The west ridge is heavily influenced by Central Valley grasslands, the Sierra Nevada foothills, and Sierra Nevada forest ecosystems. This area occurs at the highest elevations, and consists primarily of annual grassland. Some of the annual grassland has a sub shrub component and there are wooded ravines and seasonal-stream riparian habitat in several locations. The middle ridge area also is located along a ridge, but at an elevation somewhat lower than the west ridge. The middle ridge area is a combination of annual and perennial grasslands with subshrubs as a common component. There are also small patches of Joshua trees (Yucca brevi/alia), junipers (Juniperus cali/ornicus), willows (Salix sp.), and oaks (Quercus sp.). The east slope is dominated by components of the desert province and is predominantly shrubland with a significant component of perennial grasslands. Patches of junipers, Joshua trees, and creosote bushes (Larrea tridentata) occur.
Over 200 bird species use the WRA during a portion of the year. Many of these are migratory species that pass through on their way north and south. Both diurnal and nocturnal resident and migrant species are present in the WRA.
San Gorgonio Pass WRA.-San Gorgonio Pass is a narrow, low elevation pass situated at approximately 180-850 m (600-2800 ft) in elevation. The pass is bordered on the north by Mt. San Gorgonio (3505 m or 11,499 ft) and on the south by Mt. San Jacinto (3293 m or 10,804 ft). The great differences in elevation and topography are a result of the San Andreas and San Jacinto fault systems, which over millions of years have created a wedge in the San Bernardino Mountains. This wedge is known as the San Gorgonio Pass. It is a windy area because of the natural tendency for air pressure to equalize between the Pacific coast and the interior deserts.
The vegetation in the San Gorgonio WRA includes components of both the Mojave and Colorado deserts. Vegetation types in the WRA include the following: creosote bush, creosote bush-white bursage (Ambrosia dumosa), brittlebush (Encelia jarinosa), and scalebroom (Lepidospartum squamatum) (Sawyer and Keeler-Wolf 1995). This area receives less than ten inches of rain annually, with most occurring during winter. Temperatures range from around freezing to 120oF.
The WRA at San Gorgonio Pass was developed during the early 1980s. During this project, approximately 3750 wind turbines were in operation. This WRA is the third-largest developed WRA in California and produces approximately 25 percent of the electricity produced annually from wind energy in California. The developed WRA was subdivided into four study subareas: the high elevation areas above 610 m (2000 ft) above sea level, the medium elevation areas at 305-610 m (1000-2000 ft.), and the low areas below 305 m (1000 ft). The low elevation area often includes hundreds of acres of surface water. This surface water is created by runoff from Whitewater Creek and by water diverted from other sources and pumped into recharge basins. This surface water often remains year-round in some of the basins. Permanent study sites were selected at the three elevations and from the watered area.
Geographic Information System.-Both study areas were mapped using a Geographic Information System (GIS). GIS coverages were created using ArclInfo, ArcView, and DIMPLE. Aerial
Monitoring & Risk, Tehachapi & San Gorgonio / R.L. Anderson et al. 33
photographs provided the base information for the GIS coverage. The GIS data included a layer showing topography.
Key Questions
The key questions in this study included the following: What influence does wind plant operation have upon birds? Do bird risk, bird use, and bird mortality vary within the operating wind plant due to physical or environmental parameters, or by bird species?
Parameters and factors to be studied included the following: • Lattice versus tubular tower turbines • Large versus small rotor swept areas • End-of-row versus mid-row turbine locations • Turbine height • Turbine operation time • Topography and location thereon • Vegetation type • Wildlife habitat attributes such as water • Bird behavior near turbines • Turbine and other structure density
Study Design
At Tehachapi, approximately 180 permanent sample sites were selected using a stratified random process. Approximately 50-60 sites were established per study sub-area (West Ridge, Middle Ridge, East Slope), all at turbines. The 180 sample sites include large and small turbines, tubular and lattice tower turbines, end-of-row turbines, and a variety of distinct natural and physical settings.
At San Gorgonio, there were also approximately 180 stratified random sample sites. These sites included 30 sites ~1 km from the nearest turbines, 30 sites 400-800 m from turbines, and 120 sites at turbines. The sites at turbines included large and small turbines, lattice and tubular tower turbines, endof-row turbines, water sites, and a variety of distinct natural and physical settings. Additionally, 40 remote observation sites were selected at random to include 20 sites near the water recharge basins and 20 sites at least 1 km from water. These sample sites were considered necessary to document waterbird usage of the recharge basins. The birds leave the water area as an observer approaches. Therefore, both remote and conventional bird utilization counts were conducted near the water basins.
Methods and Metrics
The protocol employed in these studies is a product of review and consensus by scientists representing a diverse stakeholder group. They included representatives from the wind energy industry, environmental organizations, utilities, federal and state agencies, and consulting scientists. Although each component of the methodology seems simple and straightforward, their details and execution are complex (California Energy Commission 1996; Anderson et al. 1996, 1997). The following are methods that were used to collect data on the study areas, and metrics that may be used in data analysis:
Bird Utilization Counts.-These are modified point counts conducted to document bird use at study sites. They are conducted in repeatable ways using standard methods, so that results can be compared with bird utilization counts from other studies. The Bird Utilization Counts are obtained
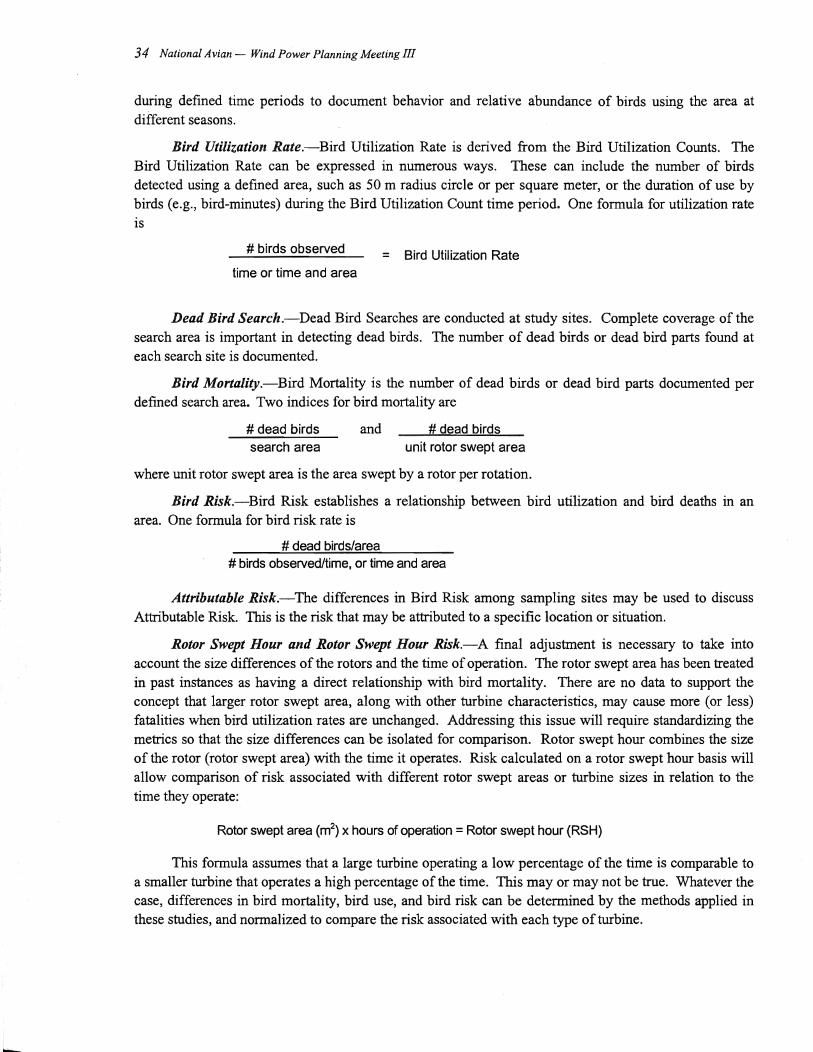
34 National Avian - Wind Power Planning Meeting III
during defined time periods to document behavior and relative abundance of birds using the area at different seasons.
Bird Utilization Rate.-Bird Utilization Rate is derived from the Bird Utilization Counts. The Bird Utilization Rate can be expressed in numerous ways. These can include the number of birds detected using a defined area, such as 50 m radius circle or per square meter, or the duration of use by birds (e.g., bird-minutes) during the Bird Utilization Count time period. One formula for utilization rate IS
# birds observed = Bird Utilization Rate time or time and area
Dead Bird Search.-Dead Bird Searches are conducted at study sites. Complete coverage of the search area is important in detecting dead birds. The number of dead birds or dead bird parts found at each search site is documented.
Bird Mortality.-Bird Mortality is the number of dead birds or dead bird parts documented per defined search area. Two indices for bird mortality are
# dead birds and # dead birds search area unit rotor swept area
where unit rotor swept area is the area swept by a rotor per rotation.
Bird Risk.-Bird Risk esta~lishes a relationship between bird utilization and bird deaths in an area. One formula for bird risk rate is
# dead birds/area # birds observedltime, or time and area
Attributable Risk.-The differences in Bird Risk among sampling sites may be used to discuss Attributable Risk This is the risk that may be attributed to a specific location or situation.
Rotor Swept Hour and Rotor Swept Hour Risk.-A fmal adjustment is necessary to take into account the size differences of the rotors and the time of operation. The rotor swept area has been treated in past instances as having a direct relationship with bird mortality. There are no data to support the concept that larger rotor swept area, along with other turbine characteristics, may cause more (or less) fatalities when bird utilization rates are unchanged. Addressing this issue will require standardizing the metrics so that the size differences can be isolated for comparison. Rotor swept hour combines the size of the rotor (rotor swept area) with the time it operates. Risk calculated on a rotor swept hour basis will allow comparison of risk associated with different rotor swept areas or turbine sizes in relation to the time they operate:
Rotor swept area (m2) x hours of operation = Rotor swept hour (RSH)
This formula assumes that a large turbine operating a low percentage of the time is comparable to a smaller turbine that operates a high percentage of the time. This mayor may not be true. Whatever the case, differences in bird mortality, bird use, and bird risk can be determined by the methods applied in these studies, and normalized to compare the risk associated with each type of turbine.
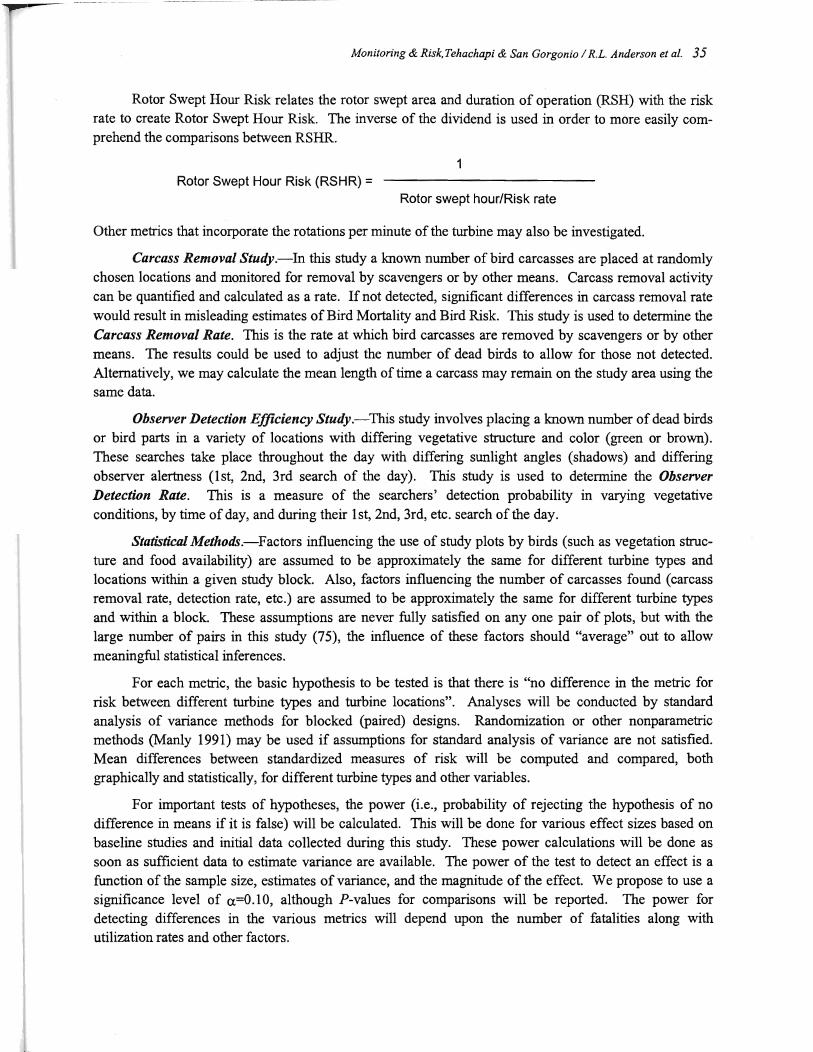
Monitoring & Risk,Tehachapi & San Gorgonio / RL Anderson et al. 35
Rotor Swept Hour Risk relates the rotor swept area and duration of operation (RSH) with the risk rate to create Rotor Swept Hour Risk. The inverse of the dividend is used in order to more easily comprehend the comparisons between RSHR.
1 Rotor Swept Hour Risk (RSHR) =
Rotor swept hour/Risk rate
Other metrics that incorporate the rotations per minute of the turbine may also be investigated.
Carcass Removal Study.-In this study a known number of bird carcasses are placed at randomly chosen locations and monitored for removal by scavengers or by other means. Carcass removal activity can be quantified and calculated as a rate. If not detected, significant differences in carcass removal rate would result in misleading estimates of Bird Mortality and Bird Risk. This study is used to determine the Carcass Removal Rate. This is the rate at which bird carcasses are removed by scavengers or by other means. The results could be used to adjust the number of dead birds to allow for those not detected. Alternatively, we may calculate the mean length of time a carcass may remain on the study area using the same data.
Observer Detection Efficiency Study.-This study involves placing a known number of dead birds or bird parts in a variety of locations with differing vegetative structure and color (green or brown). These searches take place throughout the day with differing sunlight angles (shadows) and differing observer alertness (1st, 2nd, 3rd search of the day). This study is used to determine the Observer Detection Rate. This is a measure of the searchers' detection probability in varying vegetative conditions, by time of day, and during their 1st, 2nd, 3rd, etc. search of the day.
Statistical Methods.-Factors influencing the use of study plots by birds (such as vegetation structure and food availability) are assumed to be approximately the same for different turbine types and locations within a given study block. Also, factors influencing the number of carcasses found (carcass removal rate, detection rate, etc.) are assumed to be approximately the same for different turbine types and within a block. These assumptions are never fully satisfied on anyone pair of plots, but with the large number of pairs in this study (75), the influence of these factors should "average" out to allow
meaningful statistical inferences.
For each metric, the basic hypothesis to be tested is that there is "no difference in the metric for risk between different turbine types and turbine locations". Analyses will be conducted by standard analysis of variance methods for blocked (paired) designs. Randomization or other nonparametric methods (Manly 1991) may be used if assumptions for standard analysis of variance are not satisfied. Mean differences between standardized measures of risk will be computed and compared, both graphically and statistically, for different turbine types and other variables.
For important tests of hypotheses, the power (i.e., probability of rejecting the hypothesis of no difference in means if it is false) will be calculated. This will be done for various effect sizes based on baseline studies and initial data collected during this study. These power calculations will be done as soon as sufficient data to estimate variance are available. The power of the test to detect an effect is a function of the sample size, estimates of variance, and the magnitude of the effect. We propose to use a significance level of a=O.lO, although P-values for comparisons will be reported. The power for detecting differences in the various metrics will depend upon the number of fatalities along with utilization rates and other factors.
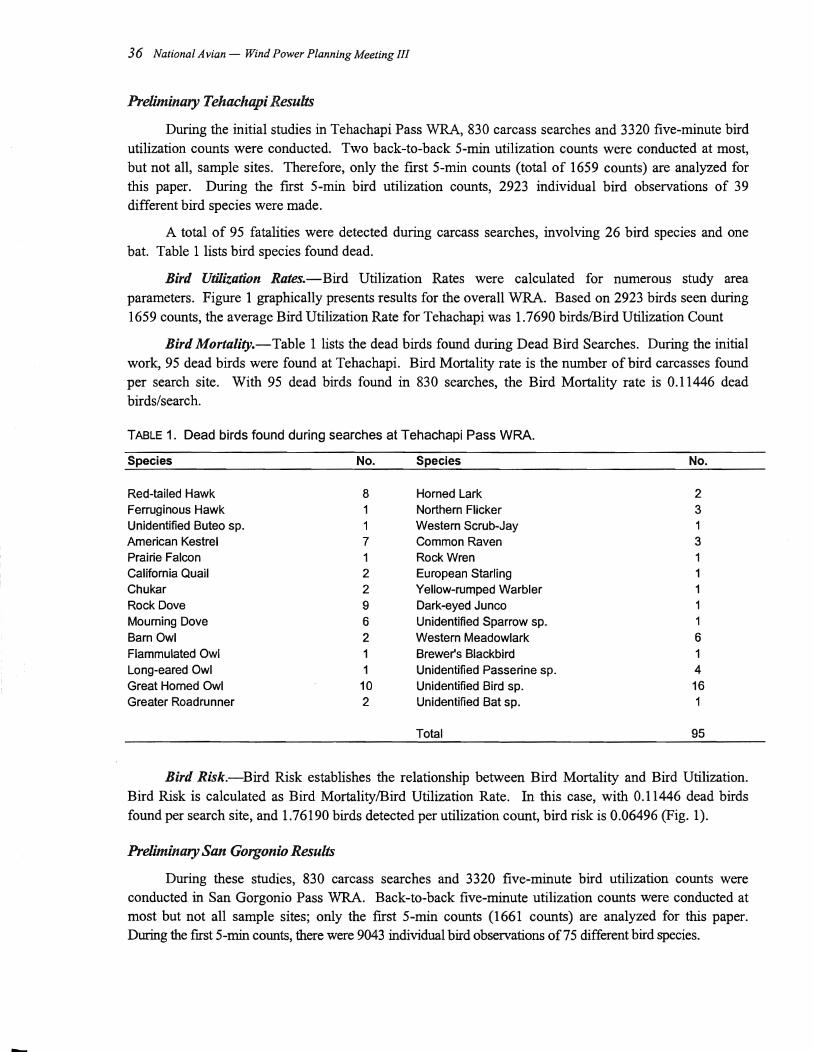
36 National Avian - Wind Power Planning Meeting III
Preliminary TehachapiResults
During the initial studies in Tehachapi Pass WRA, 830 carcass searches and 3320 five-minute bird utilization counts were conducted. Two back-to-back 5-min utilization counts were conducted at most, but not all, sample sites. Therefore, only the first 5-min counts (total of 1659 counts) are analyzed for this paper. During the first 5-min bird utilization counts, 2923 individual bird observations of 39 different bird species were made.
A total of 95 fatalities were detected during carcass searches, involving 26 bird species and one bat. Table 1 lists bird species found dead.
Bird Utilization Rates.-Bird Utilization Rates were calculated for numerous study area parameters. Figure 1 graphically presents results for the overall WRA. Based on 2923 birds seen during 1659 counts, the average Bird Utilization Rate for Tehachapi was 1.7690 birdslBird Utilization Count
Bird Mortality.-Table 1 lists the dead birds found during Dead Bird Searches. During the initial work, 95 dead birds were found at Tehachapi. Bird Mortality rate is the number of bird carcasses found per search site. With 95 dead birds found in 830 searches, the Bird Mortality rate is 0.11446 dead birds/search.
TABLE 1. Dead birds found during searches at Tehachapi Pass WRA.
Species No. Species No.
Red-tailed Hawk 8 Horned Lark 2 Ferruginous Hawk Northern Flicker 3 Unidentified Buteo sp. Western Scrub-Jay 1 American Kestrel 7 Common Raven 3 Prairie Falcon 1 Rock Wren California Quail 2 European Starling Chukar 2 Yellow-rumped Warbler 1 Rock Dove 9 Dark-eyed Junco 1 Mourning Dove 6 Unidentified Sparrow sp. Barn Owl 2 Western Meadowlark 6 Flammulated Owl 1 Brewers Blackbird 1 Long-eared Owl 1 Unidentified Passerine sp. 4 Great Horned Owl 10 Unidentified Bird sp. 16 Greater Roadrunner 2 Unidentified Bat sp. 1
Total 95
Bird Risk.-Bird Risk establishes the relationship between Bird Mortality and Bird Utilization. Bird Risk is calculated as Bird MortalitylBird Utilization Rate. In this case, with 0.11446 dead birds found per search site, and 1.76190 birds detected per utilization count, bird risk is 0.06496 (Fig. 1).
Preliminary San Gorgonio Results
During these studies, 830 carcass searches and 3320 five-minute bird utilization counts were conducted in San Gorgonio Pass WRA. Back-to-back five-minute utilization counts were conducted at most but not all sample sites; only the first 5-min counts (1661 counts) are analyzed for this paper. During the first 5-min counts, there were 9043 individual bird observations of75 different bird species.
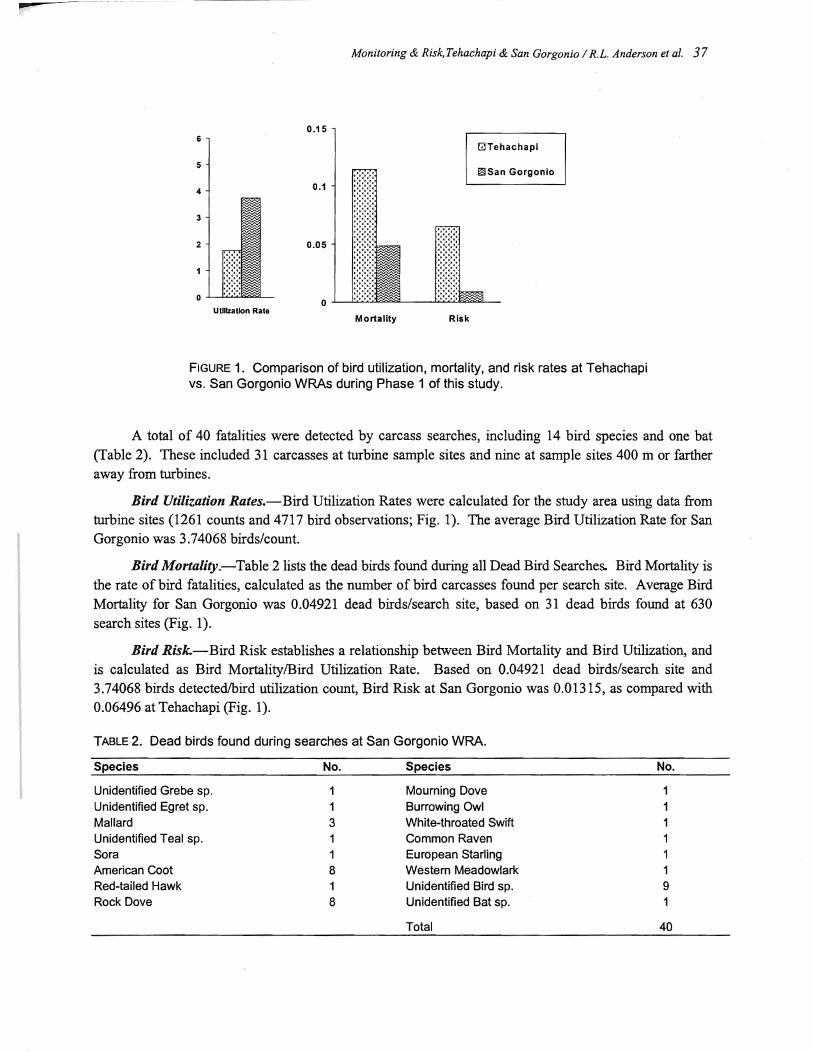
Monitoring & Risk, Tehachapi & San Gorgonio I R.L. Anderson et al. 37
0.15 6
QTehachapi
5 [llSan Gorgonio
4 0.1
3
2 0.05
Utilization Rat. Mortality Risk
FIGURE 1. Comparison of bird utilization, mortality, and risk rates at Tehachapi vs. San Gorgonio WRAs during Phase 1 of this study.
A total of 40 fatalities were detected by carcass searches, including 14 bird species and one bat (Table 2). These included 31 carcasses at turbine sample sites and nine at sample sites 400 m or farther away from turbines.
Bird Utilization Rates.-Bird Utilization Rates were calculated for the study area using data from turbine sites (1261 counts and 4717 bird observations; Fig. 1). The average Bird Utilization Rate for San Gorgonio was 3.74068 birds/count.
Bird Morlality.-Table 2 lists the dead birds found during all Dead Bird Searches. Bird Mortality is the rate of bird fatalities, calculated as the number of bird carcasses found per search site. Average Bird Mortality for San Gorgonio was 0.04921 dead birds/search site, based on 31 dead birds found at 630 search sites (Fig. 1).
Bird Risk.-Bird Risk establishes a relationship between Bird Mortality and Bird Utilization, and is calculated as Bird MortalitylBird Utilization Rate. Based on 0.04921 dead birds/search site and 3.74068 birds detectedlbird utilization count, Bird Risk at San Gorgonio was 0.01315, as compared with 0.06496 at Tehachapi (Fig. 1).
TABLE 2. Dead birds found during searches at San Gorgonio WRA.
Species
Unidentified Grebe sp. Unidentified Egret sp. Mallard Unidentified Teal sp. Sora American Coot Red-tailed Hawk Rock Dove
No.
3
1 8 1 8
Species
Mourning Dove Burrowing Owl White-throated Swift Common Raven European Starling Western Meadowlark Unidentified Bird sp. Unidentified Bat sp.
Total
No.
9 1
40
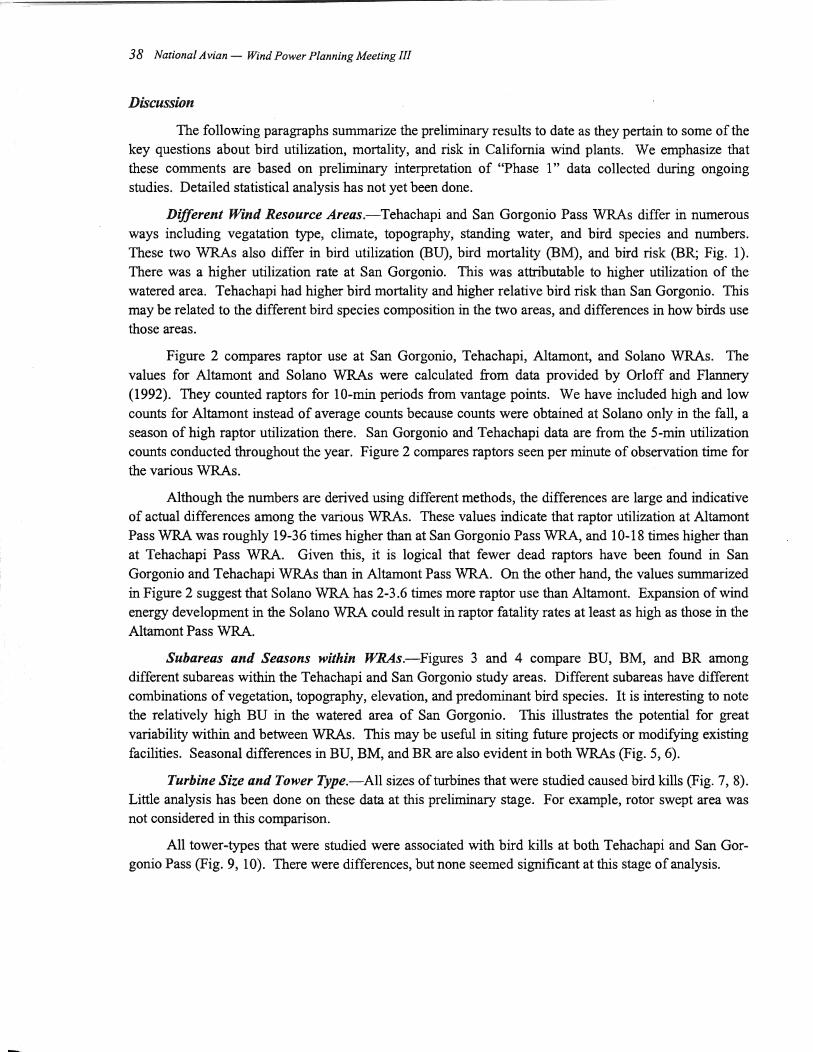
38 National Avian - Wind Power Planning Meeting III
Discussion
The following paragraphs summarize the preliminary results to date as they pertain to some of the key questions about bird utilization, mortality, and risk in California wind plants. We emphasize that these comments are based on preliminary interpretation of "Phase 1" data collected during ongoing studies. Detailed statistical analysis has not yet been done.
Different Wind Resource Areas.-Tehachapi and San Gorgonio Pass WRAs differ in numerous ways including vegatation type, climate, topography, standing water, and bird species and numbers. These two WRAs also differ in bird utilization (BU), bird mortality (BM), and bird risk (BR; Fig. 1). There was a higher utilization rate at San Gorgonio. This was attributable to higher utilization of the watered area. Tehachapi had higher bird mortality and higher relative bird risk than San Gorgonio. This may be related to the different bird species composition in the two areas, and differences in how birds use those areas.
Figure 2 compares raptor use at San Gorgonio, Tehachapi, Altamont, and Solano WRAs. The values for Altamont and Solano WRAs were calculated from data provided by Orloff and Flannery (1992). They counted raptors for lO-min periods from vantage points. We have included high and low counts for Altamont instead of average counts because counts were obtained at Solano only in the fall, a season of high raptor utilization there. San Gorgonio and Tehachapi data are from the 5-min utilization counts conducted throughout the year. Figure 2 compares raptors seen per minute of observation time for the various WRAs.
Although the numbers are derived using different methods, the differences are large and indicative of actual differences among the various WRAs. These values indicate that raptor utilization at Altamont Pass WRA was roughly 19-36 times higher than at San Gorgonio Pass WRA, and 10-18 times higher than at Tehachapi Pass WRA. Given this, it is logical that fewer dead raptors have been found in San Gorgonio and Tehachapi WRAs than in Altamont Pass WRA. On the other hand, the values summarized in Figure 2 suggest that Solano WRA has 2-3.6 times more raptor use than Altamont. Expansion of wind energy development in the Solano WRA could result in raptor fatality rates at least as high as those in the Altamont Pass WRA.
Subareas and Seasons within WRAs.-Figures 3 and 4 compare BU, BM, and BR among different subareas within the Tehachapi and San Gorgonio study areas. Different subareas have different combinations of vegetation, topography, elevation, and predominant bird species. It is interesting to note the relatively high BU in the watered area of San Gorgonio. This illustrates the potential for great variability within and between WRAs. This may be useful in siting future projects or modifying existing facilities. Seasonal differences in BU, BM, and BR are also evident in both WRAs (Fig. 5, 6).
Turbine Size and Tower Type.-All sizes of turbines that were studied caused bird kills (Fig. 7, 8). Little analysis has been done on these data at this preliminary stage. For example, rotor swept area was not considered in this comparison.
All tower-types that were studied were associated with bird kills at both Tehachapi and San Gorgonio Pass (Fig. 9, 10). There were differences, but none seemed significant at this stage of analysis.
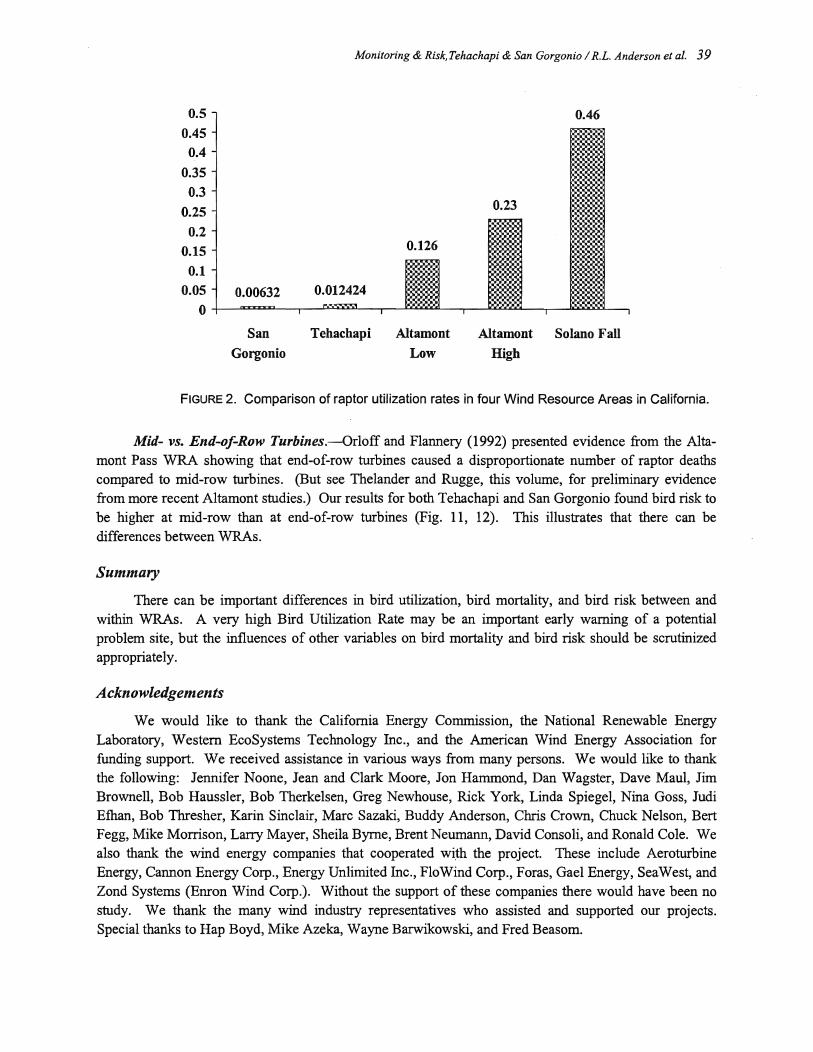
0.5
0.45
0.4
0.35
0.3
0.25
0.2
0.15
0.1
0.05 0.00632
Monitoring & Risk, Tehachapi & San Gorgonio / R.L. Anderson et al. 39
0.46
0.23
0.126
0.012424 o +--A~~--r-~~~-.--~~~-.--~~~~~~~--.
San
Gorgonio
Tehachapi Altamont
Low
Altamont Solano Fall
High
FIGURE 2. Comparison of raptor utilization rates in four Wind Resource Areas in California.
Mid- vs. End-of-Row Turbines.-Orloff and Flannery (1992) presented evidence from the Altamont Pass WRA showing that end-of-row turbines caused a disproportionate number of raptor deaths compared to mid-row turbines. (But see Thelander and Rugge, this volume, for preliminary evidence from more recent Altamont studies.) Our results for both Tehachapi and San Gorgonio found bird risk to be higher at mid-row than at end-of-row turbines (Fig. 11, 12). This illustrates that there can be differences between WRAs.
Summary
There can be important differences in bird utilization, bird mortality, and bird risk between and within WRAs. A very high Bird Utilization Rate may be an important early warning of a potential problem site, but the influences of other variables on bird mortality and bird risk should be scrutinized appropriately.
Acknowledgements
We would like to thank the California Energy Commission, the National Renewable Energy Laboratory, Western EcoSystems Technology Inc., and the American Wind Energy Association for funding support. We received assistance in various ways from many persons. We would like to thank the following: Jennifer Noone, Jean and Clark Moore, Jon Hammond, Dan Wagster, Dave Maul, Jim Brownell, Bob Haussler, Bob Therkelsen, Greg Newhouse, Rick York, Linda Spiegel, Nina Goss, Judi Ethan, Bob Thresher, Karin Sinclair, Marc Sazaki, Buddy Anderson, Chris Crown, Chuck Nelson, Bert Fegg, Mike Morrison, Larry Mayer, Sheila Byrne, Brent Neumann, David Consoli, and Ronald Cole. We also thank the wind energy companies that cooperated with the project. These include Aeroturbine Energy, Cannon Energy Corp., Energy Unlimited Inc., FloWind Corp., Foras, Gael Energy, SeaWest, and Zond Systems (Enron Wind Corp.). Without the support of these companies there would have been no study. We thank the many wind industry representatives who assisted and supported our projects. Special thanks to Hap Boyd, Mike Azeka, Wayne Barwikowski, and Fred Beasom.
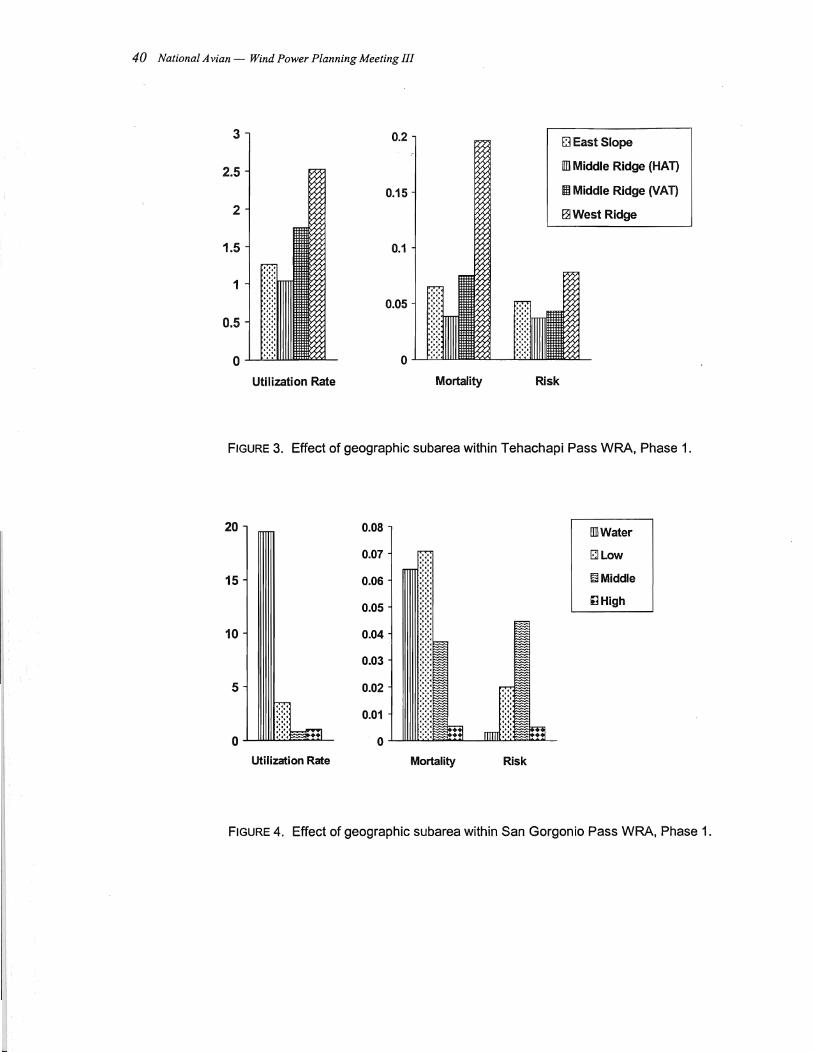
A
40 National Avian - Wind Power Planning Meeting III
3 0.2 f:3 East Slope
2.5 m Middle Ridge (HAT)
0.15 m Middle Ridge (VAT)
2 121 West Ridge
1.5 0.1
1 0.05
0.5
0 0
Utilization Rate Mortality Risk
FIGURE 3. Effect of geographic subarea within Tehachapi Pass WRA, Phase 1.
20 0.08 un Water
0.07 81 Low
15 0.06 fJilMiddle
0.05 ~High
10 0.04
0.03
5 0.02
0.01
0 0
Utilization Rate Mortality Risk
FIGURE 4. Effect of geographic subarea within San Gorgonio Pass WRA, Phase 1.
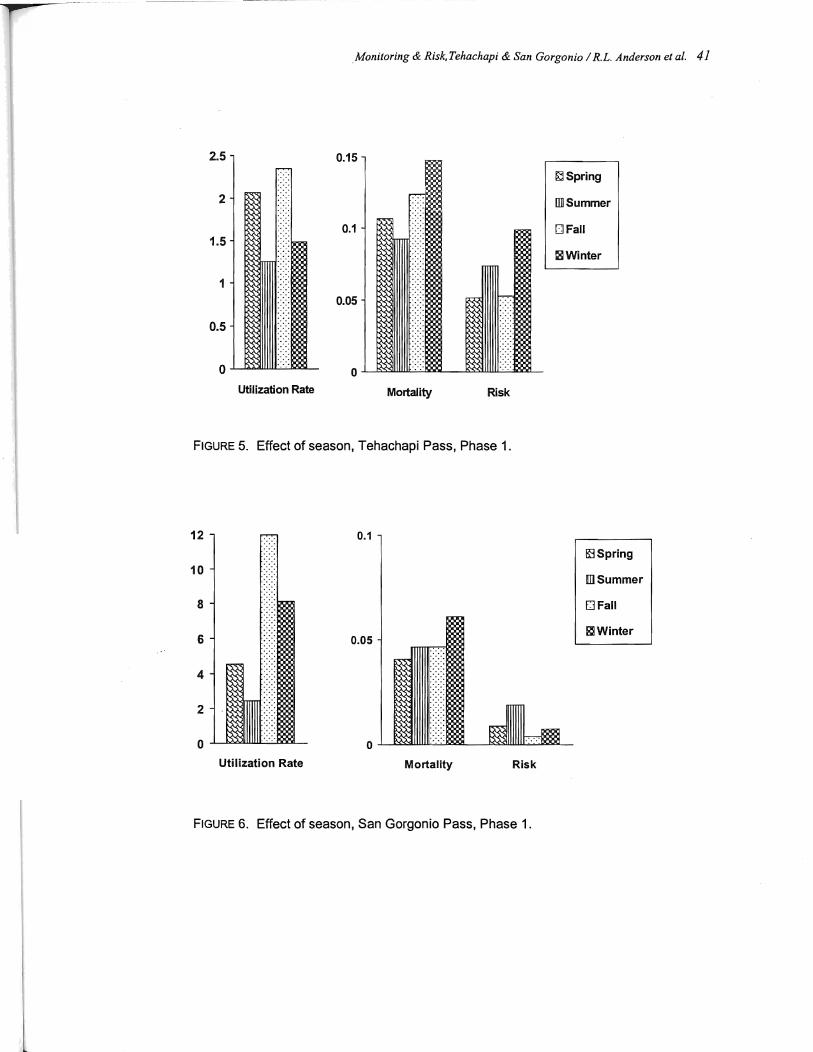
_ Monitoring & Risk, Tehachapi & San Gorgonio / R.L. Anderson et al. 41
2.5 0.15
~Spring
2 7- (]]Summer
0.1 o Fall 1.5
~Winter
1 0.05
0.5
•••••• 0 0
Utilization Rate Mortality Risk
FIGURE 5. Effect of season, Tehachapi Pass, Phase 1.
12 0.1
~Spring
10 [l]Summer
8 o Fall
6 gjWinter
0.05
4
2
0 a Utilization Rate Mortality Risk
FIGURE 6. Effect of season, San Gorgonio Pass, Phase 1.
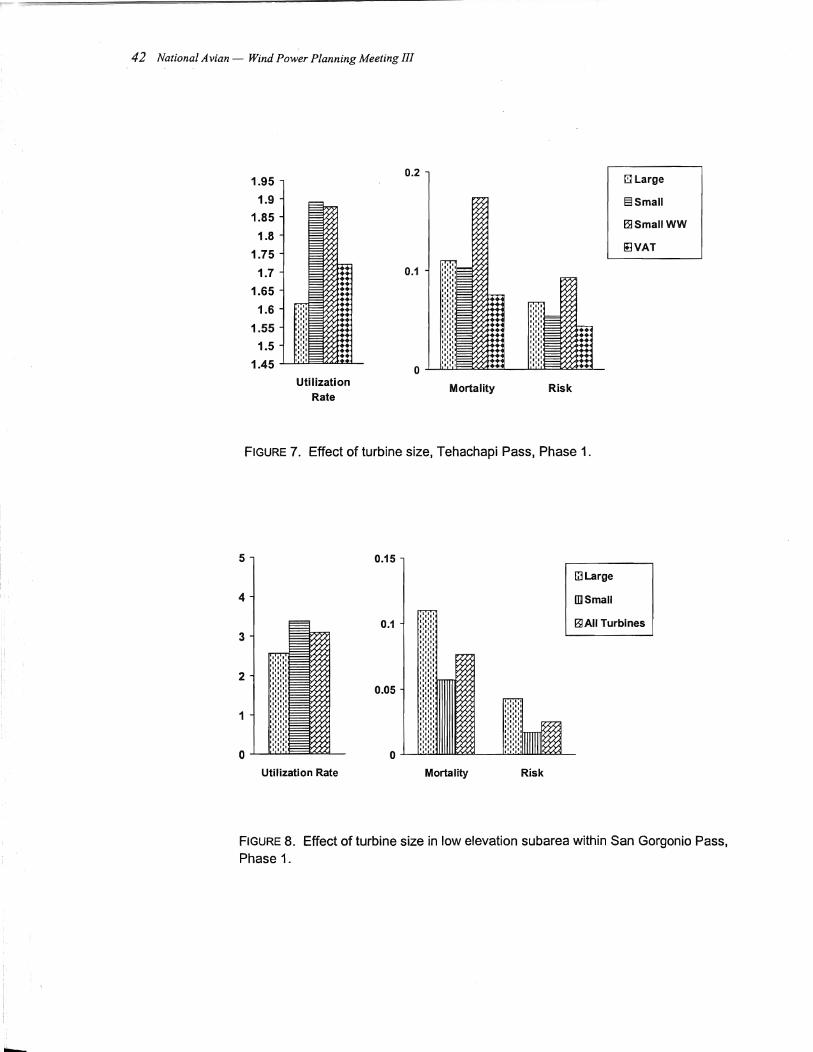
42 National Avian - Wind Power Planning Meeting III
0.2 [!;]Large 1.95
1.9 ElSmall
1.85 rnSmallWW
1.8
1.75 ItlVAT
1.7 0.1
1.65
1.6
1.55
1.5
1.45 0 Utilization Mortality Risk
Rate
FIGURE 7. Effect of turbine size, Tehachapi Pass, Phase 1.
5
4
3
2
1
o Utilization Rate
0.15
0.1
0.05
Mortality Risk
~Large
mSmali
~ All Turbines
FIGURE 8. Effect of turbine size in low elevation subarea within San Gorgonio Pass, Phase 1.

Monitoring & Risk. Tehachapi & San Gorgonio / R.L. Anderson et al. 43
2.5 0.4 f3Tube
2 mLattice
0.3 ~WtN Lattice
1.5 ~VAT
0.2
1
0.1 0.5
0 0
Utilization Rate Mortality Risk
FIGURE 9. Effect of type of tower, Tehachapi Pass, Phase 1.
6 0.1
!:lTube 5
mLattice
4 ~All
3 0.05 Turbines
2
1
0 0
Utilization Rate Mortality Risk
FIGURE 10. Effect of type of tower, San Gorgonio Pass, Phase 1.
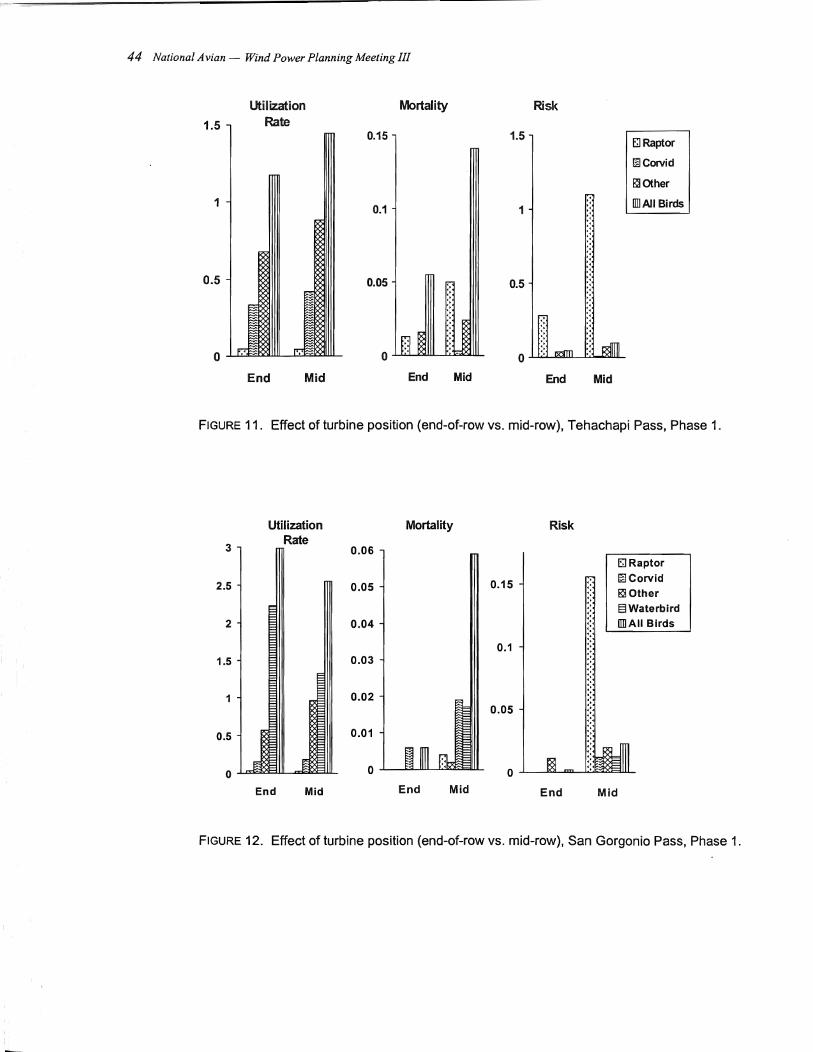
44 National Avian - Wind Power Planning Meeting III
1.5
1
0.5
o
Utilization Rate
End Mid
Mortality
End
Risk
Mid End Mid
EJ Raptor
iaCorvid
gjOther
ITIlAiI Birds
FIGURE 11. Effect of turbine position (end-at-row vs. mid-row), Tehachapi Pass, Phase 1.
Utilization Mortality Risk
3 Rate
0.06 E;] Raptor
2.5 0.15 IaCorvid 0.05 gjOther
ElWaterbird 2 0.04 UDAll Birds
0.1 1.5 0.03
1 0.02 0.05
0.5 0.01
0 0 0
End Mid End Mid End Mid
FIGURE 12. Effect of turbine position (end-of-row vs. mid-row), San Gorgonio Pass, Phase 1.
Monitoring & Risk, Tehachapi & San Gorgonio / RL Anderson et at. 45
Literature Cited
Anderson, R.L. and J.A. Estep. 1988. Wind energy development in California: impacts, mitigation, monitoring, and planning. Calif. Energy Commis., Sacramento, CA. 12 p.
Anderson, R.L., J. Tom, N. Neumann, J. Noone and D. Maul. 1996. Avian risk assessment methodology. p.74-87 In: Proc. Nat. Avian - Wind Power Plan. Meet. II, Palm Springs, CA, Sept. 1995. Prepared for the Avian Sub commit. of Nat. Wind Coord. Commit. by RESOLVE Inc., Washington, DC, and LGL Ltd., King City, Ont. 152 p. Available at www.nationalwind.org/pubs/avian95/default.htm
Anderson, R.L., H. Davis, W. Kendall, L.S. Mayer, M.L. Morrison, K. Sinclair, D. Strickland and S. Ugoretz. 1997. Standard metrics and methods for conducting avian/wind energy interaction studies. Proc. 1997 Wind Power Conf., Austin, TX. Am. Wind Energy Assoc., Washington, DC.
Anderson, R.L., J. Tom, N. Neumann and J. Cleckler. 1998. Avian monitoring and risk assessment at Tehachapi Pass Wind Resource Area, California: Tehachapi phase 1 (pilot study) results. Proc. 1998 Wind Power Conf., Bakersfield, CA. Am. Wind Energy Assoc., Washington, DC.
California Energy Commission. 1996. Avian monitoring and risk assessment at Tehachapi Pass Wind Resource Area, California. 1995 Progress Report. Staff Rep. P700-96-005. Calif. Energy Commis., Sacramento, CA. Prepared by R.L. Anderson, J. Tom, N. Neumann and J.A Cleckler.
Estep, J. 1989. Avian mortality at large wind energy facilities in California: identification of a problem. Staff Rep. P700-89-001. Calif. Energy Commis., Sacramento, CA.
Higgins, K.F., C.D. Dieter and R.E. Usgaard. 1995. Monitoring of seasonal bird activity and mortality on Unit 2 at the Buffalo Ridge Windplant, Minnesota. Preliminary progress report for the research period May 1 - December 31, 1994. Rep. from South Dakota Coop. Fish & Wildl. Res. Unit, Nat BioI. Serv., South Dakota State Univ.
Howell, J.A. 1995. Avian mortality at rotor swept area equivalents, Altamont Pass and Montezuma Hills, California. Rep. for Kenetech WindPower [formerly U.S. WindPower Inc.], San Francisco, CA.
Howell, J.A. and J. Noone. 1992. Examination of avian use and mortality at a U.S. WindPower wind energy development site, Montezuma Hills, Solano County, California. Final report. Rep. for Solano County Dep. Environ. Manage., Fairfield, CA.
Hunt, G. 1994. A pilot Golden Eagle population study in the Altamont Pass Wind Resource Area, California. Rep. from Predatory Bird Research Group, Univ. Calif., Santa Cruz, for Nat. Renewable Energy Lab., Golden, CO. 212 p.
Luke, A. and A. Watts. 1994. Bird deaths prompt rethink on wind farming in Spain. WindPower Mon. 10(2, Feb.):14-16.
Manly, B.F.J. 1991. Randomization and Monte Carlo methods in biology. Chapman & Hall, London, U.K.
Marti, R. 1995. Bird/wind turbine investigations in southern Spain. p. 48-52 In: Proc. Nat. Avian - Wind Power Plan. Meet., Denver, CO, July 1994. Rep. DE95-004090. RESOLVE Inc., Washington, DC, and LGL Ltd., King City, Ont. 145 p. Available at www.nationalwind.org/pubs/avian94/default.htm
Orloff, S. and A. Flannery. 1992. Wind turbine effects on avian activity, habitat use, and mortality in Altamont Pass and Solano County Wind Resource Areas. P700-92-001. Rep. from BioSystems Analysis Inc., Tiburon, CA, for Plan. Dep., Alameda, Contra Costa and Solano Counties, CA, and Calif. Energy Commis., Sacramento, CA. Var. pag.
Pearson, D. 1992. Unpublished summary of Southern California Edisons' 1985 bird monitoring studies in the San Gorgonio Pass and Coachella Valley. Presented at joint Pacific Gas & Electric Co./Calif. Energy Commis. workshop on wind energy and avian mortality. San Ramon, CA.
~."fi.i i
Ii i
I' 46 National Avian - Wind Power Planning Meeting III
Winkelman, J.E. 1995. Bird/wind turbine investigations in Europe. p. 43-47 In: Proc. Nat. Avian - Wind Power Plan. Meet., Denver, CO, July 1994. DE95-004090. RESOLVE Inc., Washington, DC, and LGL Ltd., King City,Ont. 145 p. Available at www.nationalwind.org/pubs/avian94/default.htm
General Discussion
There was no general discussion after this presentation. However, Mr. Anderson provided some recommendations for continued work at the Tehachapi and San Gorgonio WRAs. He noted that it would be desirable to (1) continue the projects for a longer period - at least 2 years; (2) continue the part of the San Gorgonio research associated with the water-covered area, which attracts larger numbers of birds than other subareas within the San Gorgonio WRA; and (3) use radar, acoustic or other suitable methods to conduct studies of nocturnal bird activity.
------ .~-------~~--- ----- -
Effects of Bird Deterrent Methods Applied to Wind Turbines at the CARES Wind Power Site in Washington State
by
M Dale Stricklandl , Wallace P. Erickson l , Karen Kronner and Sue Orloff
1 Western EcoSystems Technology Inc. 2 Northwest Wildlife Surveys 3 Ibis Environmental Services
Raptors are vulnerable to collisions with turbine structures and concern exists because of the potential for these species to be killed in wind plants (Orloff and Flannery 1992). The wind industry and its regulators are attempting to reduce the risk to avian species from wind power development. The following is a description of the study plan (experimental design and study methods) for evaluating the effects on avian risk of a potential treatment applied to wind turbines at the proposed Conservation and Renewable Energy Systems (CARES) wind energy development in Klickitat County, Washington. The treatment originally selected for the proposed turbine was the installation of bird flight diverters (diverters) installed on turbine guy wires. The plant was initially planned as a facility containing 91 Flo Wind A WT -26 turbines requiring guy wires. With the failure of Flo Wind, uncertainty existed regarding who would develop the project and what turbine will be selected. CARES was expected to issue a Request For Proposal (RFP) for wind project development proposals by the end of May 1998. CARES was no longer specifying that the A WT-26 turbine would be the one used for the wind plant. The selected developer had the option of proposing which turbine to use, as long as the turbine met the threshold performance criteria identified in the RFP. However, the study design we describe can be used for any potential treatment to individual turbines. The proposed wind plant will consist of approximately 90 turbines capable of generating 25 MW, situated in approximately 9 rows on a 975 acre site.
The goal of this research, as originally conceived, was to evaluate the reduction in risk to avian species, particularly raptors, due to installation of diverters on turbine guy wires. However, the proposed study can be used to evaluate the effectiveness of most treatments designed to reduce risk to birds. The study was designed for two phases. The fIrst year and phase were used to refme estimates of the power of statistical tests in detecting effects due to the treatment selected, identify possible strata useful in the design of Phase II, assist in the selection of a treatment to reduce the risk of bird collisions with wind turbines, and provide estimates of bird use at turbine locations before treatment. If a decision was made to proceed with Phase II, the selected treatment would be applied to half the turbines in the second year of study. In Phase II, the reduction in risk due to the treatment would be evaluated through the measurement of avian behavior, use, and mortality at turbines with and without the treatment.
Literature Review
In-depth studies of avian use and mortality at wind plants began in the mid 1980s. Earlier studies involved only a few turbines or focused on nocturnal migrants (waterfowl or passerines) (CEC 1996). In recent years there have been numerous studies in the United States and Europe that have intensively investigated the effects of wind turbine development on birds (CEC 1996), several specillcally dealing with raptors at larger wind plants.
1 Western EcoSystems Technology Inc., 2003 Central Avenue, Cheyenne, WY 82001. Phone: 307-634-1756. Fax: 307-637-6981. E-mail: [email protected]
2 Northwest Wildlife Surveys, 815 NW Fourth Street, Pendleton, OR 97801
3 IBIS Environmental Services, 340 Coleman Dr., San Rafael, CA 94901
47
48 National Avian - Wind Power Planning Meeting III
Early wind plant studies speculated that guy wires on turbines could pose a greater threat to birds than rotating blades (BPA 1987), particularly under conditions of poor visibility (Jones and Stokes 1987). However, the BioSystems study (Orloff and Flannery 1992) suggested that guy wires did not contribute noticeably to mortality. Of the five turbine types studied, the two with guy wires (vertical axis and guyed pipe) had the lowest rates of mortality.
The BioSystems study also reported that no bird deaths were recorded at the 48 meteorological towers studied, most of which had guy wires. Other wind plant studies, however, have reported avian deaths at meteorological towers with guy wires. A study in Wyoming documented several deaths, mostly passerines, associated with guy wires attached to a single meteorological tower (Bureau of Reclamation 1984). EPRI (1985) reported that two dead passerines were found under a single meteorological tower that had guy wires in Solano County, California. European studies have also recorded deaths likely caused by guy wires associated with meteorological towers (Winkelman 1992).
It is well documented that collision with wires from transmission lines is a common cause of avian mortality (Avery et al. 1980; CEC 1995). Bird flight diverters (BFDs) have been shown to be effective in reducing mortality at transmission lines (Bealaurier 1981; Faanes 1987; Koops 1987; Morkill and Anderson 1991; EPRI 1993; APLIC 1994; Brown and Drewien 1995). In several recent studies, BFDs have been shown to reduce collisions by 54 to 90 percent (Morkill and Anderson 1991; Brown 1993; Koops 1993). No studies to date have investigated the effectiveness of BFDs on turbine or meteorological tower guy wires.
Study Design
The proposed design is a standard before-after control-impact (BACI) design incorporating a matched pairs design. It is a randomized block design with 2 treatment levels (Skalski and Robson 1992). In Phase I, avian use and mortality are measured on plots without turbines. In Phase II, use and mortality are measured on the same plots containing turbines either with or without the selected treatment. In Phase II, each turbine string will be divided into two halves, with a randomly selected half receiving the BFDs and the other half left alone. All nine turbine strings are surveyed for avian use, behavior, and mortality, so a census in space within the CARES wind plant is achieved. Avian use and mortality surveys follow similar protocols to those used at the Buffalo Ridge Wind plant in Minnesota and the Wyoming Wind plant near Arlington, Wyoming (see two additional papers by Strickland et al. later in this volume).
In this study, we take the point of view that, if a bird comes into a defined critical zone surrounding the turbines, then the bird is at increased risk of injury. If the bird does not enter the critical zone, we take the point of view that the bird is not at risk of injury from collision with turbines or guy wires. Consequently, in this case we define risk to be bird occurrence within a certain distance of a turbine. We also measure mortality and will estimate mortality per unit of bird use. In this case, risk is defmed as a change in mortality per unit of bird use within the critical zone.
Components of the Study
Relative use of the wind plant by avian species will be measured through point count surveys conducted during daylight hours. Avoidance behaviors and other parameters related to the risk of birds near turbines will be recorded during the point count surveys. Mortality will be measured through carcass searches at turbines. Phase II mortality and avian use estimates will be related to Phase I estimates to evaluate the effectiveness of the treatment in reducing the risk to birds.
--~-------------- -------~-~~~-
Bird Deterrents in Washington I MD. Strickland et al. 49
Field Methods
Bird Use and Behavior.-The objective of the field observations is to determine which species are flying through the area, how much time they spend there, and their behavior relative to turbines and turbine types. Nine relatively large bird (RLB) observation stations will be located within the wind plant, with each plot centered within the turbine string (9 total strings in the wind plant). Each RLB observation station will be a circle of 0.3 km radius, centered on an observation point offset 25 m perpendicular to the turbine string facing the turbine blades. Observations at each station will be made on one day every two weeks throughout the year. Observation times will be rotated to cover all daylight hours. Data collected during each station visit will consist of continuous counts of birds and duration of observations during a 30-minute interval to establish use of stations by species.
Location of first sighting and path of flight will be mapped in the field on USGS 7.5-minute quadrangles. Estimates of flight height will be made to the nearest meter. Any birds flying within 50 m of a turbine blade both in a horizontal and vertical direction will be identified (by treatment), and the nearest distance to a turbine and turbine type (treatment versus no treatment) will be recorded. The number of passes within this area during the 30-min time interval will be recorded. Duration of time spent within 50 m of turbines (by treatment) as well as duration of time spent within the plot of 0.3 km radius will also be recorded for each observation. Any avoidance behavior will also be characterized and recorded (e.g., flaring). Number, location and time of perching attempts by treatment will be recorded. Any comments or unusual observations will be recorded in the comments section of the data form.
Carcass Searches.-The objective of the carcass searches is to compare mean number of carcasses per unit of avian use by species (and groups of species) between turbines with and without diverters (or other treatment). Biologists trained in proper search techniques will conduct the searches. The rectangular plots will be searched by walking parallel transects. Transects initially will be set 10m apart in the area to be searched (100 m in all directions from the turbine). A searcher will walk at a rate of approximately 45 m a minute along each transect searching both sides out to 5 m for casualties. Searches of all turbine strings will be conducted every two weeks to locate and collect any carcasses found under the turbines; however, casualties found at other times and places will also be recorded.
Mortality Estimates .-Mortality will be estimated based on the number of avian carcasses estimated to be in the wind plant area, based on carcass searches and estimates of carcasses missed by observers or removed by scavengers. All carcasses located within areas surveyed, regardless of species, will be recorded. A cause of death will be determined, if possible, based on field examination and/or blind necropsy results. For the purposes of evaluating the effects of diverters on mortality, observed number of carcasses whose death can be directly related to turbines and associated structures (e.g., guy wires) will be calculated and compared by treatment. Predator removal trials will be used to estimate the carcass removal rate. Knowledge of the carcass removal rate is not necessary for comparing the effects of diverters on mortality, but it does influence the power of the statistical tests for making such comparisons. If the interval between the carcass searches is much greater than the average length of time a carcass stays in the area before being removed from the area, then only a small percentage of the carcasses will be detected by observers. In this case, the power to detect differences between treatments will be low, especially if only a few carcasses are detected. Detectability trials will also be conducted to evaluate the effectiveness of the searches. Low detectability, like high scavenging rates, would have negative effects on power.
Data Analysis - Avian Use and Mortality
Phase I.-The objectives of the analyses of data to be collected in Phase I will be as follows: (1) Describe and compare the spatial and temporal features of bird use and mortality on the prospective wind
50 National Avian - Wind Power Planning Meeting III
plant and the reference area. (2) Approximate the power that statistical tests will achieve in Phase II in comparing mortality and avian use at turbines with and without a bird deterrent device. (3) Evaluate the feasibility, value, and direction of the Phase II study.
Species lists will be generated by study period. The number of raptors and other large birds seen during each point count survey will be standardized to a unit area and unit time surveyed. For example, if 3 raptor passes are made during a 30 minute interval at a station with a viewing area of ""'().28 km2, these data will be standardized to 3/0.28= 10 raptors/km2 during a 30-min survey. The duration of observation by species will also be tabulated and recorded as the number of minutes per unit area per unit effort. Similar calculations will be done for observations of birds within various distances of turbines. Number of passes, number of perching attempts, etc., will be calculated in a similar fashion.
Data will be tabulated and plotted to illustrate differences in avian use between (1) seasons, (2) times of day, and (3) stations. Standard statistical tests for two independent samples-t-tests if normality assumptions are met; otherwise permutation tests (Manly 1991) or Generalized Linear Modeling-will be applied to compare the effects of these factors on use, behavior, and mortality (number of carcasses).
Phase II.-The objectives of the analyses of data collected in Phase II will be to further describe and compare the changes in mortality, avian use and the ratio of the two on turbines with and without a bird deterrent device (or other treatment). Methods of analysis will be identical to those in Phase I. Data will be tabulated and plotted to illustrate differences in avian use between (1) seasons, (2) times of day, (3) stations, and (4) treatment (turbines with and without bird deterrent devices). In analyzing effects of deterrent devices, avian use, number of passes, number of perching attempts, etc., will (for each plot) be standardized to a unit area and unit effort, considering the volume within 50 m of the turbines.
Standard statistical tests for paired data-ANOVA techniques if normality and equality of variance assumptions met; otherwise permutation tests (Manly 1991) or Generalized Linear Modeling will be applied to the data for comparing the effects of the treatment on use, behavior, and mortality (# carcasses). If data are sufficient, further analysis will be conducted comparing the ratios of bird mortality to bird use at turbines with and without the treatment. The effectiveness of the treatment will be evaluated by testing the interaction between year and treatment. An analysis of a hypothetical data set is found below.
For important tests of hypotheses, the statistical power will be calculated for various effect sizes based on Phase I baseline studies and initial data collected as soon as data allow for estimates of variance. Power is the probability of rejecting the hypothesis of no difference in means if it is false. The power of the test to detect an effect is a function of sample size, the selected criterion for concluding that an observed difference is not a chance effect (a), estimates of variance, and the magnitude of the effect.
Example Data Analysis .-The following example illustrates statistical procedures that can be used in analyzing the data to be collected from this study. The example illustrates the comparison of mortality rates between the treated and non-treated turbines. Similar analysis will be conducted for mortality rates and avian use between both the treated and non-treated turbines.
Table 1 shows hypothetical avian use (# passes) and mortality data collected during Year 1 (pretreatment, = Phase I) and Year 2 (with treatment, = Phase II) at the point count stations and mortality plots on the paired sites within the WRA. In Phase II, half the turbines are assumed to be treated with the bird deterrent. The hypothetical data represent the mean number of passes of birds within 50 m of the turbines with and without the treatment, standardized to unit area and effort, number of carcasses detected per carcass search, and the ratio of the two.
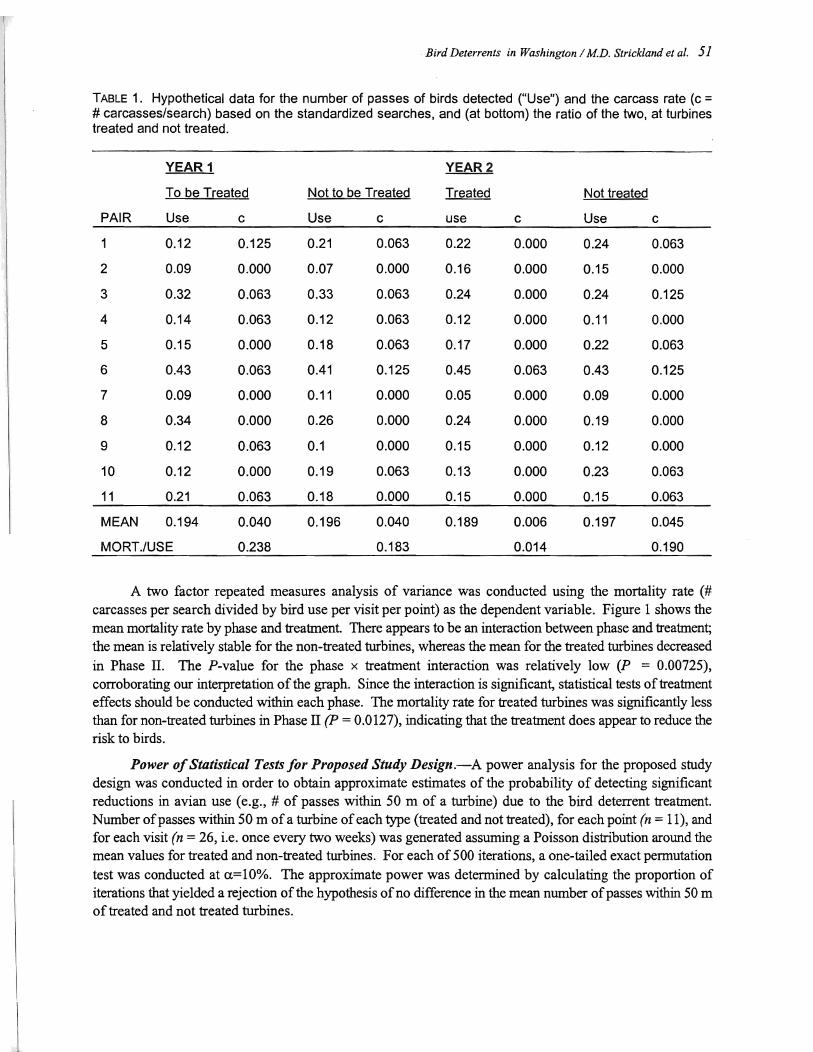
Bird Deterrents in Washington / MD. Strickland et al. 51
TABLE 1. Hypothetical data for the number of passes of birds detected ("Use") and the carcass rate (c = # carcasses/search) based on tlie standardized searches, and (at bottom) the ratio of the two, at turbines treated and not treated.
YEAR 1 YEAR 2
To be Treated Not to be Treated Treated Not treated
PAIR Use c Use c use c Use c
1 0.12 0.125 0.21 0.063 0.22 0.000 0.24 0.063
2 0.09 0.000 0.07 0.000 0.16 0.000 0.15 0.000
3 0.32 0.063 0.33 0.063 0.24 0.000 0.24 0.125
4 0.14 0.063 0.12 0.063 0.12 0.000 0.11 0.000
5 0.15 0.000 0.18 0.063 0.17 0.000 0.22 0.063
6 0.43 0.063 0.41 0.125 0.45 0.063 0.43 0.125
7 0.09 0.000 0.11 0.000 .0.05 0.000 0.09 0.000
8 0.34 0.000 0.26 0.000 0.24 0.000 0.19 0.000
9 0.12 0.063 0.1 0.000 0.15 0.000 0.12 0.000
10 0.12 0.000 0.19 0.063 0.13 0.000 0.23 0.063
11 0.21 0.063 0.18 0.000 0.15 0.000 0.15 0.063
MEAN 0.194 0.040 0.196 0.040 0.189 0.006 0.197 0.045
MORT.!USE 0.238 0.183 0.014 0.190
A two factor repeated measures analysis of variance was conducted using the mortality rate (# carcasses per search divided by bird use per visit per point) as the dependent variable. Figure 1 shows the mean mortality rate by phase and treatment. There appears to be an interaction between phase and treatment; the mean is relatively stable for the non-treated turbines, whereas the mean for the treated turbines decreased in Phase IT. The P-value for the phase x treatment interaction was relatively low (P = 0.00725), corroborating our interpretation of the graph. Since the interaction is significant, statistical tests of treatment effects should be conducted within each phase. The mortality rate for treated turbines was significantly less than for non-treated turbines in Phase IT (P = 0.0127), indicating that the treatment does appear to reduce the risk to birds.
Power of Statistical Tests for Proposed Study Design.-A power analysis for the proposed study design was conducted in order to obtain approximate estimates of the probability of detecting significant reductions in avian use (e.g., # of passes within 50 m of a turbine) due to the bird deterrent treatment. Number of passes within 50 m ofa turbine of each type (treated and not treated), for each point (n = 11), and for each visit (n = 26, i.e. once every two weeks) was generated assuming a Poisson distribution around the mean values for treated and non-treated turbines. For each of 500 iterations, a one-tailed exact permutation test was conducted at a=10%. The approximate power was determined by calculating the proportion of iterations that yielded a rejection of the hypothesis of no difference in the mean number of passes within 50 m of treated and not treated turbines.
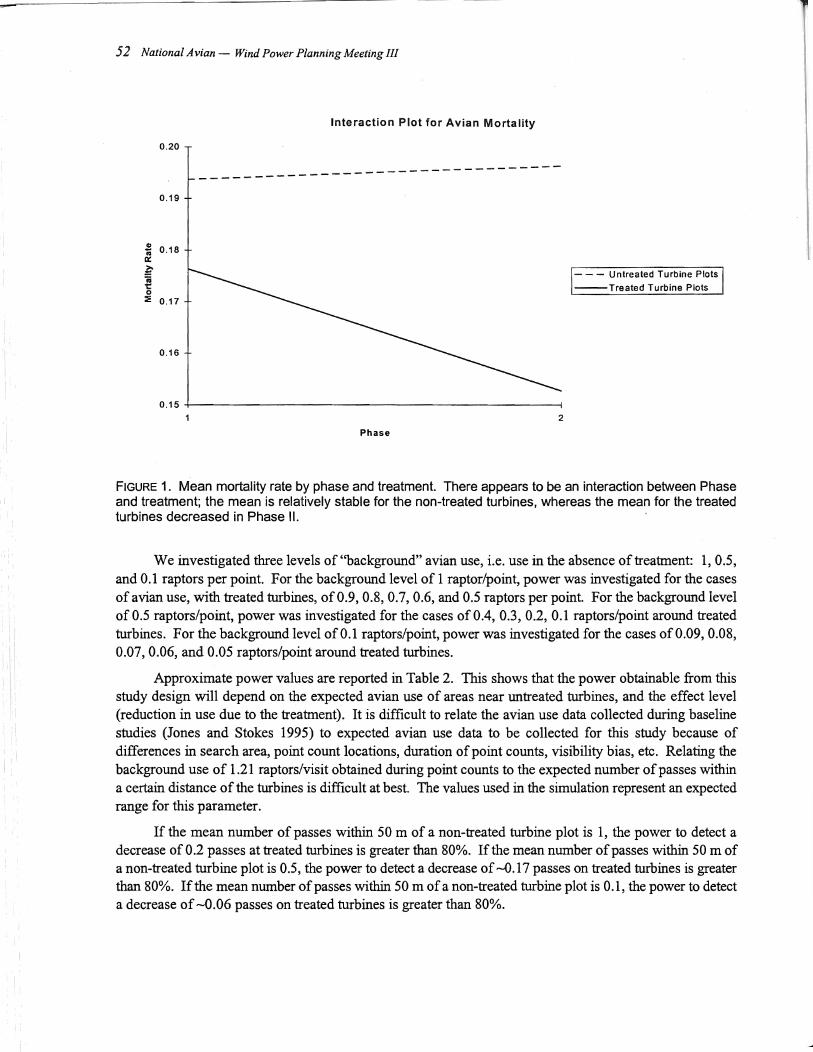
, ,~
52 National Avian - Wind Power Planning Meeting III
0.20
0.19
~ 0.18 II::
~ iU t:: o
:::; 0.17
0.16
Interaction Plot for Avian Mortality
------------------- ------------
0.15 +--------------------------i 2
Phase
- - - Untreated Turbine Plots
--Treated Turbine Plots
FIGURE 1. Mean mortality rate by phase and treatment. There appears to be an interaction between Phase and treatment; the mean is relatively stable for the non-treated turbines, whereas the mean for the treated turbines decreased in Phase II.
We investigated three levels of "background" avian use, i.e. use in the absence of treatment: 1,0.5, and 0.1 raptors per point. For the background level of 1 raptor/point, power was investigated for the cases of avian use, with treated turbines, of 0.9, 0.8, 0.7, 0.6, and 0.5 raptors per point. For the background level of 0.5 raptors/point, power was investigated for the cases of 0.4, 0.3, 0.2, 0.1 raptors/point around treated turbines. For the background level of 0.1 raptors/point, power was investigated for the cases of 0.09, 0.08, 0.07,0.06, and 0.05 raptors/point around treated turbines.
Approximate power values are reported in Table 2. This shows that the power obtainable from this study design will depend on the expected avian use of areas near untreated turbines, and the effect level (reduction in use due to the treatment). It is difficult to relate the avian use data collected during baseline studies (Jones and Stokes 1995) to expected avian use data to be collected for this study because of differences in search area, point count locations, duration of point counts, visibility bias, etc. Relating the background use of 1.21 raptors/visit obtained during point counts to the expected number of passes within a certain distance of the turbines is difficult at best. The values used in the simulation represent an expected range for this parameter.
If the mean number of passes within 50 m of a non-treated turbine plot is 1, the power to detect a decrease of 0.2 passes at treated turbines is greater than 80%. If the mean number of passes within 50 m of a non-treated turbine plot is 0.5, the power to detect a decrease of -0.17 passes on treated turbines is greater than 80%. If the mean number of passes within 50 m of a non-treated turbine plot is 0.1, the power to detect a decrease of -0.06 passes on treated turbines is greater than 80%.
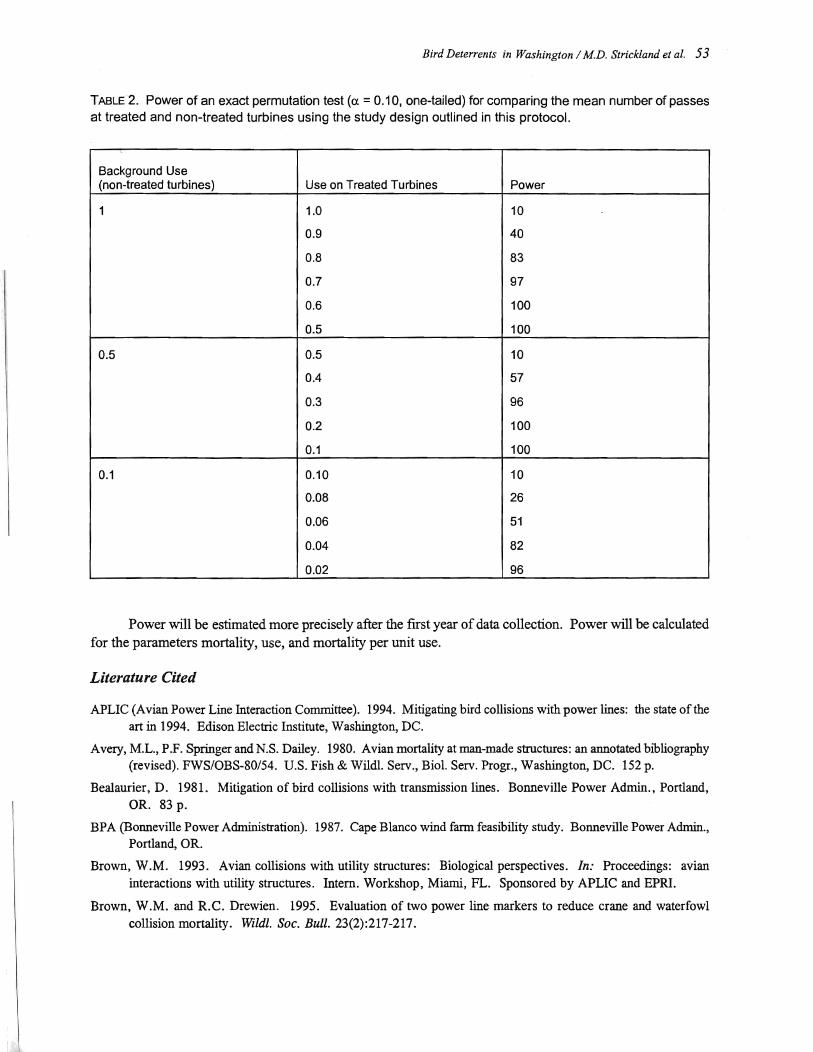
Bird Deterrents in Washington / M.D. Strickland et al. 53
TABLE2. Power of an exact permutation test (a = 0.10, one-tailed) for comparing the mean number of passes at treated and non-treated turbines using the study design outlined in this protocol.
Background Use (non-treated turbines) Use on Treated Turbines Power
1 1.0 10
0.9 40
0.8 83
0.7 97
0.6 100
0.5 100
0.5 0.5 10
0.4 57
0.3 96
0.2 100
0.1 100
0.1 0.10 10
0.08 26
0.06 51
0.04 82
0.02 96
Power will be estimated more precisely after the fIrst year of data collection. Power will be calculated
for the parameters mortality, use, and mortality per unit use.
Literature Cited
APLIC (Avian Power Line Interaction Committee). 1994. Mitigating bird collisions with power lines: the state of the art in 1994. Edison Electric Institute, Washington, DC.
Avery, M.L., P .F. Springer and N.S. Dailey. 1980. Avian mortality at man-made structures: an annotated bibliography (revised). FWS/OBS-80/54. U.S. Fish & WildI. Serv., BioI. Servo Progr., Washington, DC. 152 p.
Bealaurier, D. 1981. Mitigation of bird collisions with transmission lines. Bonneville Power Admin., Portland, OR. 83 p.
BPA (Bonneville Power Administration). 1987. Cape Blanco wind farm feasibility study. Bonneville Power Admin., Portland, OR.
Brown, W.M. 1993. Avian collisions with utility structures: Biological perspectives. In: Proceedings: avian interactions with utility structures. Intern. Workshop, Miami, FL. Sponsored by APLIC and EPRI.
Brown, W.M. and R.C. Drewien. 1995. Evaluation of two power line markers to reduce crane and waterfowl collision mortality. Wildi. Soc. Bull. 23(2):217-217.
-
"
54 National Avian - Wind Power Planning Meeting III
Bureau of Reclamation. 1984. Status report on system verification units: wind-hydroelectric energy project, Wyoming. Bureau of Reclamation, Wyoming.
CEC (California Energy Commission). 1995. Avian collision and electrocution: an annotated bibliography. Rep. P700-95-001. Calif. Energy Commis., Sacramento, CA. 114 p. Prepared by E. Hebert, E. Reese, L. Mark, R. Anderson and J.A. Brownell. 114 p.
CEC (California Energy Commission). 1996. Effects of wind energy development: an annotated bibliography. Calif. Energy Commis., Sacramento, CA. 75 p. Prepared by S. Orloff and A. Flannery, Ibis Environ. Serv., for BioSystems Analysis Inc., Santa Cruz, CA, and Calif. Energy Commis.
EPRI (Electric Power Research Institute). 1985. MOD-2 wind turbine field experience in Solano County, California. Rep. AP-4239. Rep. from Pacific Gas & Electric, San Ramon, CA, for Electric Power Res. Inst., Palo Alto, CA.
EPRI (Electric Power Research Institute). 1993. Proceedings: avian interactions with utility structures. Intern. Workshop at Miami, FL, 1992.
Faanes, C.A. 1987. Bird behavior and mortality in relation to power lines in prairie habitats. Tech. Rep. 7. U.S. Fish & Wildl. Serv., Washington, DC. 24 p.
Jones & Stokes Associates Inc. 1987. Bird abundance and movements at the Potrero Hills wind turbine site, Solano County, California. Rep. for Solano County Dep. Environ. Manage., Fairfield, CA.
Jones & Stokes Associates Inc. 1995. Avian use of proposed Kenetech and CARES wind farm sites in Klickitat County, Washington. Tech. Rep. JSA 93-303. Rep. from Jones & Stokes Assoc. Inc., Bellevue, WA, for R.W. Beck, Seattle, W A.
Koops, F.RI. 1987. Collision victims of high-tension lines in the Netherlands and effects of marking. KRMA Rep. 01282-MOB 86-3048.
Koops, F.B.J. 1993. Collision victims of high-tension lines in the Netherlands and effects of marking. N.V. KEMA, Arnhem, The Netherlands. 6 p.
Manly, RF.I. 1991. Randomization and Monte Carlo methods in biology. Chapman & Hall, New York, NY. 281 p.
Morkill, A.E. and S.H. Anderson. 1991. Effectiveness of marking powerlines to reduce Sandhill Crane collisions. Wi/dl. Soc. Bull. 19(4):442-449.
Orloff, S. and A. Flannery. 1992. Wind turbine effects on avian activity, habitat use, and mortality in Altamont Pass and Solano County Wind Resource Areas. P700-92-001. Rep. from BioSystems Analysis Inc., Tiburon, CA, for Plan. Dep., Alameda, Contra Costa and Solano Counties, CA, and Calif. Energy Commis., Sacramento, CA. Var.pag.
Skalski, J.R. and D.S. Robson. 1992. Techniques for wildlife investigations: design and analysis of capture data. Academic Press, New York, NY. 237 p.
Winkelman, J.E. 1992. [The impact of the Sep Wind Park near Oosterbierum (Fr.), The Netherlands, on birds, 1: Collision victims.]. RIN Rep. 92/2. Rijksinstituut voor Natuurbeheer, Arnhem, The Netherlands. (Dutch, Eng!. summ.)
General Discussion
Following this presentation, two questions were posed from the audience. (1) One attendee asked for a description of the bird flight diverters (BFDs). At the CARES site, the standard large balls and spirals as seen on many powerlines are proposed. (2) Another participant asked whether there would be sufficient statistical power if the project is rebid and proceeds with a smaller number oflarger turbines. Dr. Strickland replied that the two-phase approach would still be appropriate. The value of a Phase II study can be assessed based on the results of Phase I, before Phase II is funded. A Phase II study still may be useful, despite smaller sample size, if the BFDs have a pronounced effect.

~~ --- - -~--~~~------
Wildlife Monitoring Studies for the Sea West Wind Power Development,
Carbon County, Wyoming
Introduction
by
M Dale Strickland, David P. Young, Jr., Gregory D. Johnson, Clayton E. Derby, Wallace P. Erickson, and John W Kern
Western EcoSystems Technology, Inc.!
SeaWest Energy Corporation (SeaWest) was, as of 1998, constructing a 32 MW wind plant in Carbon County, Wyoming. The wind plant will consist of 69 wind turbines and related facilities, including transmission lines, communications systems, transformers, substations, roads, and operations, and maintenance facilities. In 1994, Western EcoSystems Technology (WEST, Inc.) was contracted by Sea West to develop a wildlife risk assessment and monitoring protocol for the wind resource area (WRA) and to implement the protocol beginning with the 1995 field season. This protocol was developed and peer-reviewed by numerous individuals representing the wind energy industry, U.S. Fish and Wildlife Service, Wyoming Game and Fish Department, and the USDI Bureau of Land Management prior to finalization. Objectives of the first two years of risk assessment and monitoring were to obtain quantifiable data on wildlife use, species composition, reproductive success, and distribution in areas proposed for wind power development, and in a comparable reference area. Monitoring includes data collection on the Wind Resource Area (WRA) and an offsite reference area. The WRA is divided into two study areas: Foote Creek Rim (FCR) located north and west of Arlington, and Simpson Ridge (SR) located south of Hanna (Fig. 1). The first phase of the development will occur on FCR. The off-site reference area is located near Morton Pass (MPR) approximately 60 km west-northwest of the WRA (Fig. 1). Here we describe methods outlined in the protocol and present selected results of avian monitoring studies conducted in 1995/96 and 1997/1998. Further details on the protocol and results of the first two years of monitoring studies are presented in Johnson et al. (1998).
Primary goals of monitoring wind power development are to evaluate impacts to wildlife from each phase of development and the cumulative impact to wildlife from all wind power development in the WRA. A secondary goal of monitoring is to provide information that can be used to reduce impacts to wildlife from subsequent developments. This monitoring study uses the before-after control-impact or BAC! design (Green 1979). This monitoring study also provides data compatible with numerous other wind power projects in operation or under development. Finally, this monitoring study assesses risk based on a weight of evidence approach. The BACI design includes collection of data before and after wind power development both on the wind power site and on a control or "reference" area. By sampling both reference and impact areas before and after wind power development, both temporal and spatial controls are used, optimizing impact assessment capabilities. The monitoring plan does not provide estimates of actual population sizes or other popUlation parameters. Although true population parameters are not estimated, this monitoring plan does provide indices that are correlated with actual population parameters. Data collected under the BACI design are intended to be used to monitor trends in indices of population parameters over time (i.e., before, during and after wind plant construction) on wind plant and reference study areas.
I Western EcoSystems Technology Inc., 2003 Central Avenue, Cheyenne, WY 82001. Phone: 307-634-1756. Fax: 307-637-6981. E-mail: [email protected]
55
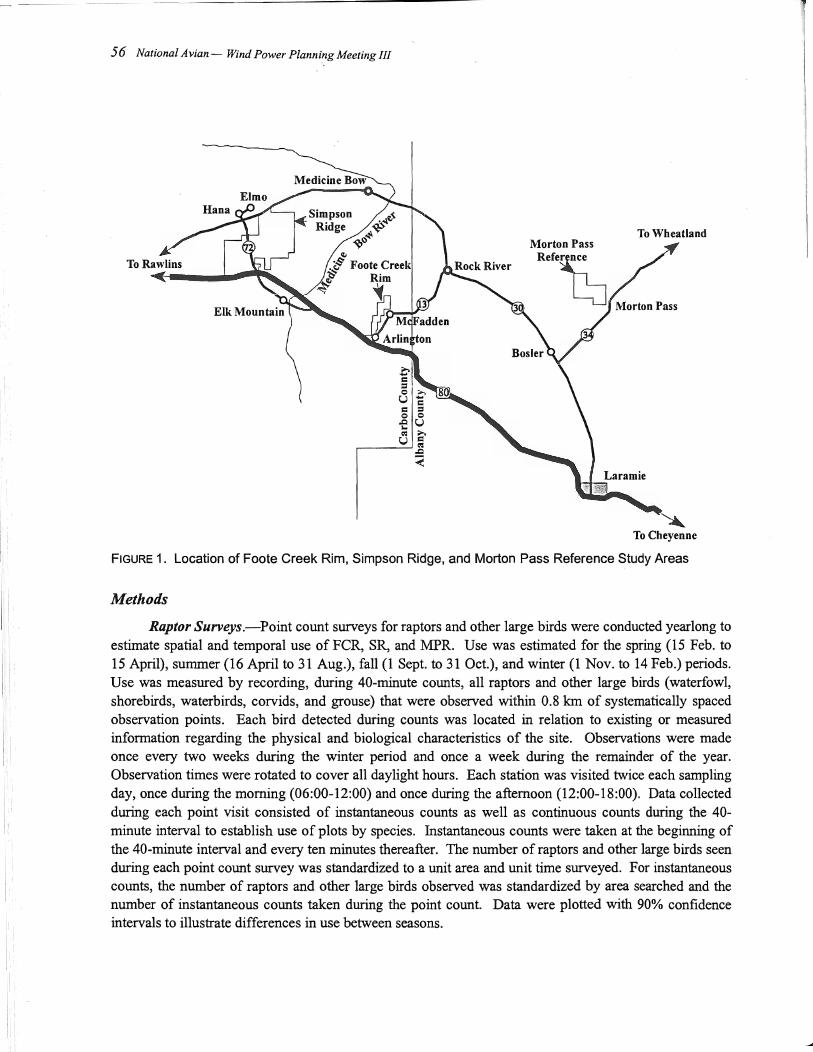
~-----~---
56 National Avian - Wind Power Planning Meeting III
Medicine Bow
Morton Pass
R'f'~
To Cheyenne
FIGURE 1. Location of Foote Creek Rim, Simpson Ridge, and Morton Pass Reference Study Areas
Methods
Raptor Surveys.-Point count surveys for raptors and other large birds were conducted yearlong to estimate spatial and temporal use of FeR, SR, and MPR. Use was estimated for the spring (15 Feb. to 15 April), summer (16 April to 31 Aug.), fall (1 Sept. to 31 Oct.), and winter (1 Nov. to 14 Feb.) periods. Use was measured by recording, during 40-minute counts, all raptors and other large birds (waterfowl, shorebirds, waterbirds, corvids, and grouse) that were observed within 0.8 km of systematically spaced observation points. Each bird detected during counts was located in relation to existing or measured information regarding the physical and biological characteristics of the site. Observations were made once every two weeks during the winter period and once a week during the remainder of the year. Observation times were rotated to cover all daylight hours. Each station was visited twice each sampling day, once during the morning (06:00-12:00) and once during the afternoon (12:00-18:00). Data collected during each point visit consisted of instantaneous counts as well as continuous counts during the 40-minute interval to establish use of plots by species. Instantaneous counts were taken at the beginning of the 40-minute interval and every ten minutes thereafter. The number of raptors and other large birds seen during each point count survey was standardized to a unit area and unit time surveyed. For instantaneous counts, the number of raptors and other large birds observed was standardized by area searched and the number of instantaneous counts taken during the point count. Data were plotted with 90% confidence intervals to illustrate differences in use between seasons.
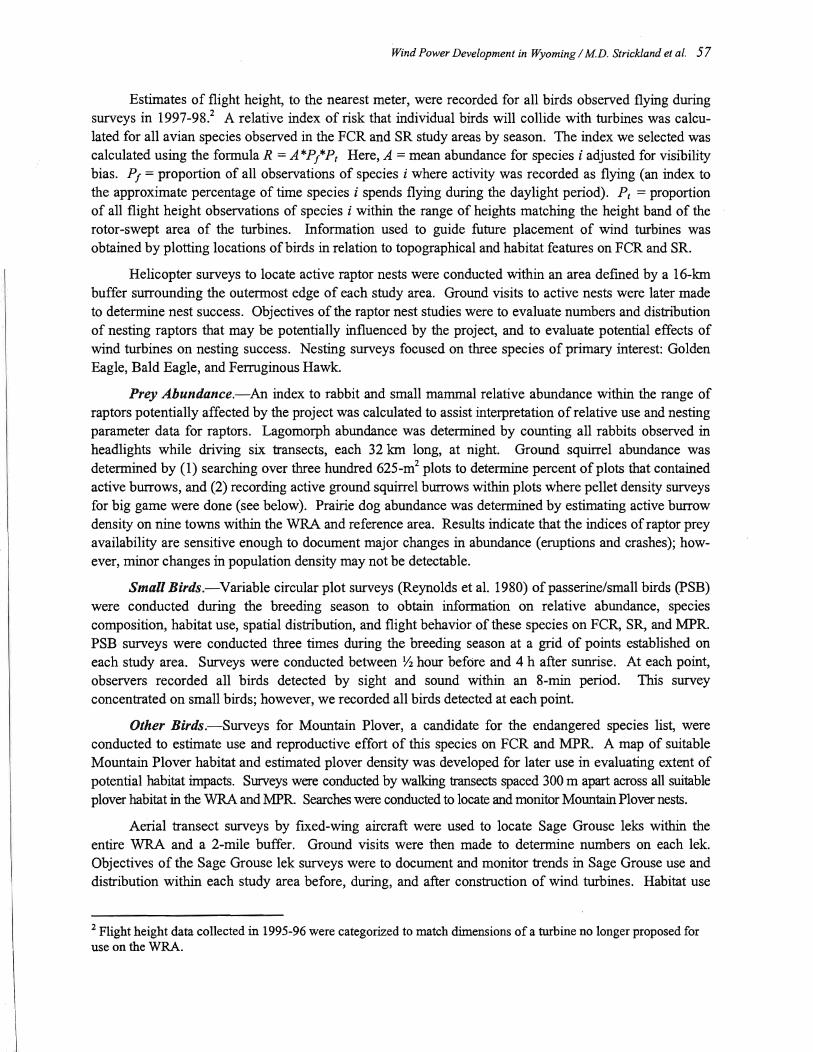
Wind Power Development in Wyoming / MD. Strickland et al. 57
Estimates of flight height, to the nearest meter, were recorded for all birds observed flying during surveys in 1997-98.2 A relative index of risk that individual birds will collide with turbines was calculated for all avian species observed in the FeR and SR study areas by season. The index we selected was calculated using the formula R = A *P/Pt Here, A = mean abundance for species i adjusted for visibility bias. Pf = proportion of all observations of species i where activity was recorded as flying (an index to the approximate percentage of time species i spends flying during the daylight period). P t = proportion of all flight height observations of species i within the range of heights matching the height band of the rotor-swept area of the turbines. Information used to guide future placement of wind turbines was obtained by plotting locations of birds in relation to topographical and habitat features on FeR and SR.
Helicopter surveys to locate active raptor nests were conducted within an area defined by a 16-km buffer surrounding the outermost edge of each study area. Ground visits to active nests were later made to determine nest success. Objectives of the raptor nest studies were to evaluate numbers and distribution of nesting raptors that may be potentially influenced by the project, and to evaluate potential effects of wind turbines on nesting success. Nesting surveys focused on three species of primary interest: Golden Eagle, Bald Eagle, and Ferruginous Hawk.
Prey Abundance.-An index to rabbit and small mammal relative abundance within the range of raptors potentially affected by the project was calculated to assist interpretation of relative use and nesting parameter data for raptors. Lagomorph abundance was determined by counting all rabbits observed in headlights while driving six transects, each 32 km long, at night. Ground squirrel abundance was determined by (1) searching over three hundred 625-m2 plots to determine percent of plots that contained active burrows, and (2) recording active ground squirrel burrows within plots where pellet density surveys for big game were done (see below). Prairie dog abundance was determined by estimating active burrow density on nine towns within the WRA and reference area. Results indicate that the indices of raptor prey availability are sensitive enough to document major changes in abundance (eruptions and crashes); however, minor changes in population density may not be detectable.
Small Birds.-Variable circular plot surveys (Reynolds et al. 1980) of passerine Ism all birds (PSB) were conducted during the breeding season to obtain information on relative abundance, species composition, habitat use, spatial distribution, and flight behavior of these species on FeR, SR, and MPR. PSB surveys were conducted three times during the breeding season at a grid of points established on each study area. Surveys were conducted between Yz hour before and 4 h after sunrise. At each point, observers recorded all birds detected by sight and sound within an 8-min period. This survey concentrated on small birds; however, we recorded all birds detected at each point.
Other Birds.-Surveys for Mountain Plover, a candidate for the endangered species list, were conducted to estimate use and reproductive effort of this species on FeR and MPR. A map of suitable Mountain Plover habitat and estimated plover density was developed for later use in evaluating extent of potential habitat impacts. Surveys were conducted by walking transects spaced 300 m apart across all suitable plover habitat in the WRA and MPR. Searches were conducted to locate and monitor Mountain Plover nests.
Aerial transect surveys by fixed-wing aircraft were used to locate Sage Grouse leks within the entire WRA and a 2-mile buffer. Ground visits were then made to determine numbers on each lek. Objectives of the Sage Grouse lek surveys were to document and monitor trends in Sage Grouse use and distribution within each study area before, during, and after construction of wind turbines. Habitat use
2 Flight height data collected in 1995-96 were categorized to match dimensions of a turbine no longer proposed for use on the WRA.

~- ------
58 National Avian - Wind Power Planning Meeting III
and distribution of Sage Grouse within areas where turbines will be constructed were estimated by recording Sage Grouse pellets within big game pellet plots (see below). Additional information on Sage Grouse distribution was acquired by recording this species while conducting other study activities.
Big Game.-It has been suggested that the wind power development may cause gross changes in distribution of big game, and possibly reduce use by and movement of big game near areas where turbines are constructed. Primary objectives of the big game studies are (1) to describe temporal and spatial distribution, use, and habitat selection of big game in and around FCR and SR before and after construction of turbines, and (2) to use these data to determine if turbines have a displacement effect.
Fixed-wing aerial transect surveys were conducted to obtain data on distribution and habitat use by big game in the WRA during the 1995/96 and 1997/98 sampling periods. A single survey was conducted during the parturition period (June) each year; surveys were also conducted once every two weeks during the winter period (November through April). Relative density corrected for visibility bias was estimated for pronghorn for each survey date. We used the program DISTANCE, which calculates density indices based on line-transect techniques. Akaike's Information Criterion was used to choose the best model for the probability of detecting an antelope group as a function of distance from observer. Group size bias also was estimated and included in density calculations. Spatial statistical analyses were conducted to produce maps of pronghorn density (numberIkm2). The spatial analyses allow prediction of pronghorn density throughout the entire study area based on groups observed during systematic transect surveys. The mapping technique known as kriging was used to construct maps of pronghorn density, and will be used to assess the statistical significance of any observed changes in use intensity throughout the study area after wind plant development.
Big game pellet density was estimated on FCR and SR in the spring and fall to determine seasonal use within areas close to turbine development. For this survey, a grid consisting of 24 transects, each with ten 2-m radius circular plots, was established on each study area.
Results and Discussion
Raptors and Other Large Birds.-Thirty-six species were documented during RLB surveys on FCR. These included observations of 1625 RLB groups involving 2275 observations of individual birds. RLB diversity was highest in the summer (1.39 species/plot!survey) followed by fall (1.20), spring (0.74), and winter (0.34). RLB use also was highest in the summer (2.4l1plot!survey), followed by fall (2.35), spring (1.33), and winter (0.50) (Table lA). RLB groups with highest use ofFCR, depending on season, were eagles, buteos, waterfowl, and corvids. Golden Eagle, Red-tailed Hawk, and American Kestrel had the highest use of any RLB species observed throughout the year.
Forty species were documented during RLB surveys on Simpson Ridge. These included 755 RLB groups involving 1559 observations of individual birds. RLB diversity was highest in the summer (0.74 species/plot! survey) followed by spring (0.45), fall (0.35), and winter (0.22). RLB use was highest in the summer (1.76/plot!survey), followed by fall (1.02), spring (0.81), and winter (0.52) (Table lA). RLB groups with the highest use of SR, depending on season, were eagles, waterfowl, buteos and corvids. Species with the highest use of SR were Golden Eagle, Canada Goose, and ducks.
Twenty-three species were documented during RLB surveys on MPR. These included 738 RLB groups involving 1014 observations of individual birds. RLB diversity was highest in the summer (0.76 species/plot! survey) followed by fall (0.46), spring (0.42), and winter (0.17). RLB use was highest in the
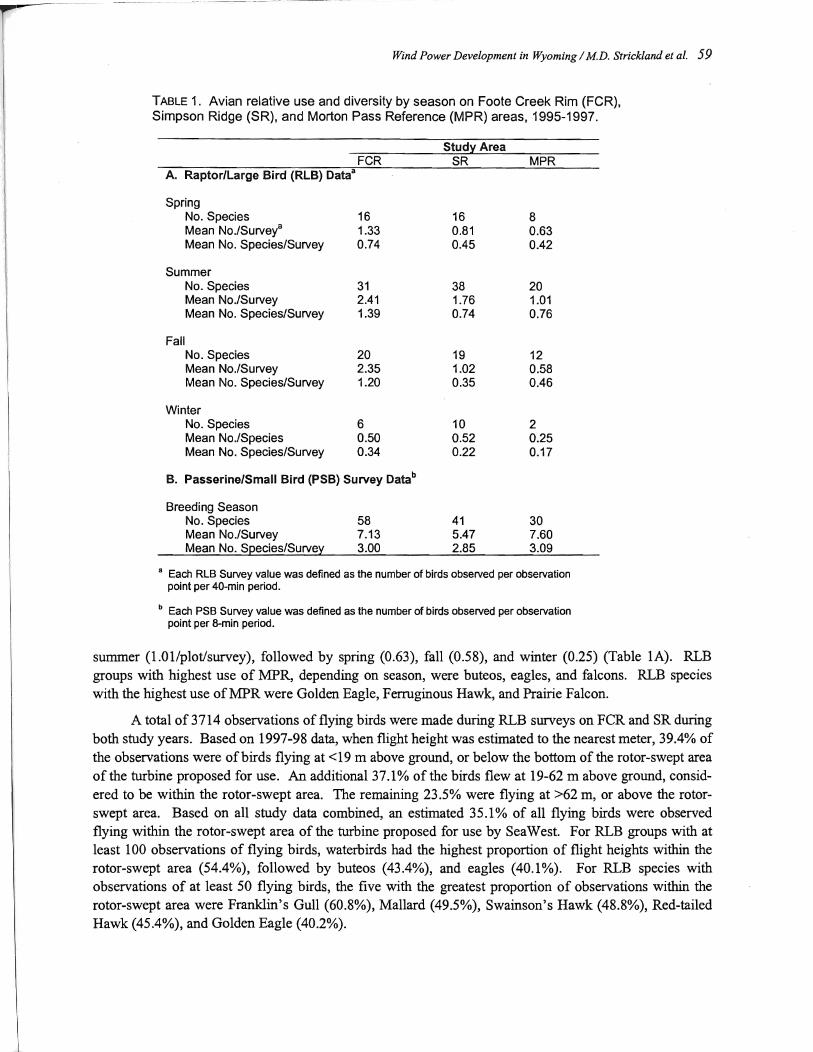
----~ ~- -----~-- ----- --,~---------
--~--~~----~ --- ------
-"- - ~- --~ ----~-.- - -~-~.=.--....---..=---"- ~-~.....--.-==--
Wind Power Development in Wyoming / MD. Strickland et al. 59
TABLE 1. Avian relative use and diversity by season on Foote Creek Rim (FCR). Simpson Ridge (SR), and Morton Pass Reference (MPR) areas, 1995-1997.
FeR A. Raptor/large Bird (RlB) Data"
Spring No. Species 16 Mean No.lSurvel 1.33 Mean No. Species/Survey 0.74
Summer No. Species 31 Mean No.lSurvey 2.41 Mean No. Species/Survey 1.39
Fall No. Species 20 Mean No.lSurvey 2.35 Mean No. Species/Survey 1.20
Winter No. Species 6 Mean No.lSpecies 0.50 Mean No. Species/Survey 0.34
B. Passerine/Small Bird (PSB) Survey Datab
Breeding Season No. Species Mean No.lSurvey Mean No. Species/Survey
58 7.13 3.00
Study Area SR
16 0.81 0.45
38 1.76 0.74
19 1.02 0.35
10 0.52 0.22
41 5.47 2.85
MPR
8 0.63 0.42
20 1.01 0.76
12 0.58 0.46
2 0.25 0.17
30 7.60 3.09
a Each RLB Survey value was defined as the number of birds observed per observation point per 40-min period.
bEach PSB Survey value was defined as the number of birds observed per observation point per 8-min period.
summer (l.Ollplot/survey), followed by spring (0.63), fall (0.58), and winter (0.25) (Table lA). RLB groups with highest use of MPR, depending on season, were buteos, eagles, and falcons. RLB species with the highest use ofMPR were Golden Eagle, Ferruginous Hawk, and Prairie Falcon.
A total of 3714 observations of flying birds were made during RLB surveys on FeR and SR during both study years. Based on 1997-98 data, when flight height was estimated to the nearest meter, 39.4% of the observations were of birds flying at <19 m above ground, or below the bottom of the rotor-swept area of the turbine proposed for use. An additional 37.1 % of the birds flew at 19-62 m above ground, considered to be within the rotor-swept area. The remaining 23.5% were flying at >62 m, or above the rotorswept area. Based on all study data combined, an estimated 35.1 % of all flying birds were observed flying within the rotor-swept area of the turbine proposed for use by SeaWest. For RLB groups with at least 100 observations of flying birds, waterbirds had the highest proportion of flight heights within the rotor-swept area (54.4%), followed by buteos (43.4%), and eagles (40.1%). For RLB species with observations of at least 50 flying birds, the five with the greatest proportion of observations within the rotor-swept area were Franklin's Gull (60.8%), Mallard (49.5%), Swainson's Hawk (48.8%), Red-tailed Hawk (45.4%), and Golden Eagle (40.2%).
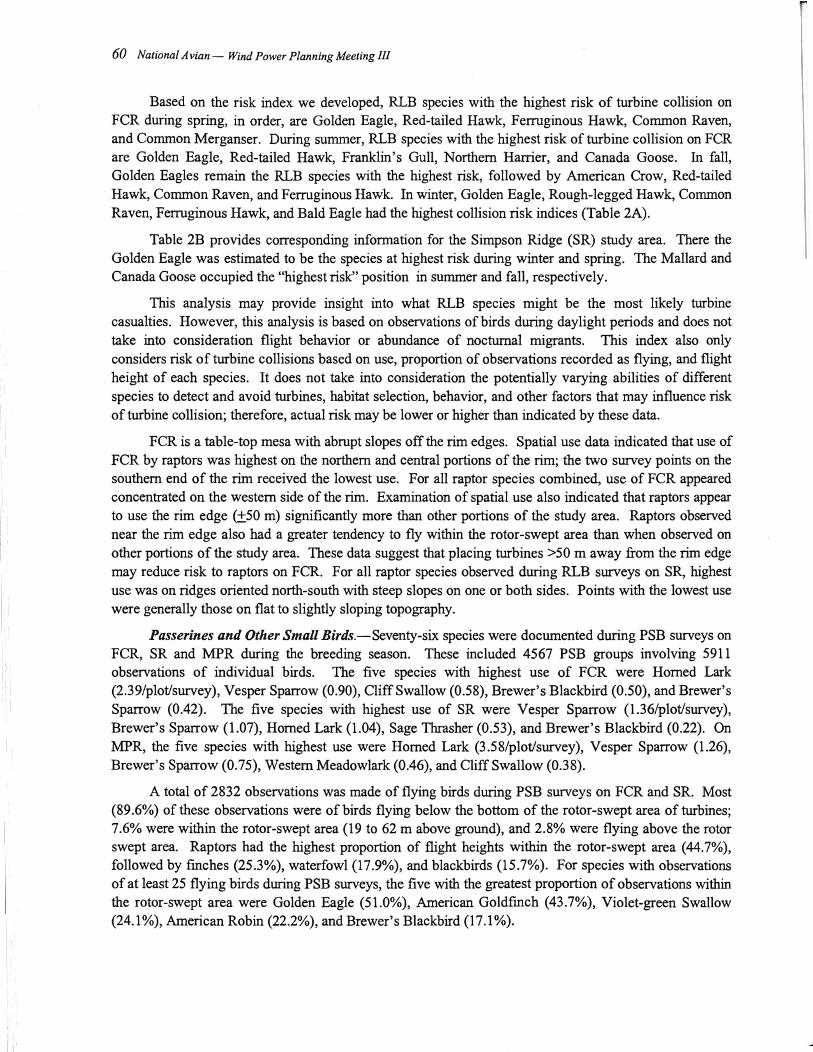
-
i I
I.
: I
60 Nat(onal Avian - Wind Power Planning Meeting III
Based on the risk index we developed, RLB species with the highest risk of turbine collision on FCR during spring, in order, are Golden Eagle, Red-tailed Hawk, Ferruginous Hawk, Common Raven, and Common Merganser. During summer, RLB species with the highest risk of turbine collision on FCR are Golden Eagle, Red-tailed Hawk, Franklin's Gull, Northern Harrier, and Canada Goose. In fall, Golden Eagles remain the RLB species with the highest risk, followed by American Crow, Red-tailed Hawk, Common Raven, and Ferruginous Hawk. In winter, Golden Eagle, Rough-legged Hawk, Common Raven, Ferruginous Hawk, and Bald Eagle had the highest collision risk indices (Table 2A).
Table 2B provides corresponding information for the Simpson Ridge (SR) study area. There the Golden Eagle was estimated to be the species at highest risk during winter and spring. The Mallard and Canada Goose occupied the "highest risk" position in summer and fall, respectively.
This analysis may provide insight into what RLB species might be the most likely turbine casualties. However, this analysis is based on observations of birds during daylight periods and does not take into consideration flight behavior or abundance of nocturnal migrants. This index also only considers risk of turbine collisions based on use, proportion of observations recorded as flying, and flight height of each species. It does not take into consideration the potentially varying abilities of different species to detect and avoid turbines, habitat selection, behavior, and other factors that may influence risk of turbine collision; therefore, actual risk may be lower or higher than indicated by these data.
FCR is a table-top mesa with abrupt slopes off the rim edges. Spatial use data indicated that use of FCR by raptors was highest on the northern and central portions of the rim; the two survey points on the southern end of the rim received the lowest use. For all raptor species combined, use of FCR appeared concentrated on the western side of the rim. Examination of spatial use also indicated that raptors appear to use the rim edge (±50 m) significantly more than other portions of the study area. Raptors observed near the rim edge also had a greater tendency to fly within the rotor-swept area than when observed on other portions of the study area. These data suggest that placing turbines >50 m away from the rim edge may reduce risk to raptors on FCR. For all raptor species observed during RLB surveys on SR, highest use was on ridges oriented north-south with steep slopes on one or both sides. Points with the lowest use were generally those on flat to slightly sloping topography.
Passerines and Other Small Birds.-Seventy-six species were documented during PSB surveys on FCR, SR and MPR during the breeding season. These included 4567 PSB groups involving 5911 observations of individual birds. The five species with highest use of FCR were Horned Lark (2.39/plotlsurvey), Vesper Sparrow (0.90), Cliff Swallow (0.58), Brewer's Blackbird (0.50), and Brewer's Sparrow (0.42). The five species with highest use of SR were Vesper Sparrow (1.36/plotlsurvey), Brewer's Sparrow (1.07), Horned Lark (1.04), Sage Thrasher (0.53), and Brewer's Blackbird (0.22). On MPR, the five species with highest use were Horned Lark (3.58/plotlsurvey), Vesper Sparrow (1.26), Brewer's Sparrow (0.75), Western Meadowlark (0.46), and Cliff Swallow (0.38).
A total of 2832 observations was made of flying birds during PSB surveys on FCR and SR. Most (89.6%) of these observations were of birds flying below the bottom of the rotor-swept area of turbines; 7.6% were within the rotor-swept area (19 to 62 m above ground), and 2.8% were flying above the rotor swept area. Raptors had the highest proportion of flight heights within the rotor-swept area (44.7%), followed by fmches (25.3%), waterfowl (17.9%), and blackbirds (15.7%). For species with observations of at least 25 flying birds during PSB surveys, the five with the greatest proportion of observations within the rotor-swept area were Golden Eagle (51.0%), American Goldfinch (43.7%), Violet-green Swallow (24.1 %), American Robin (22.2%), and Brewer's Blackbird (17.1 %).
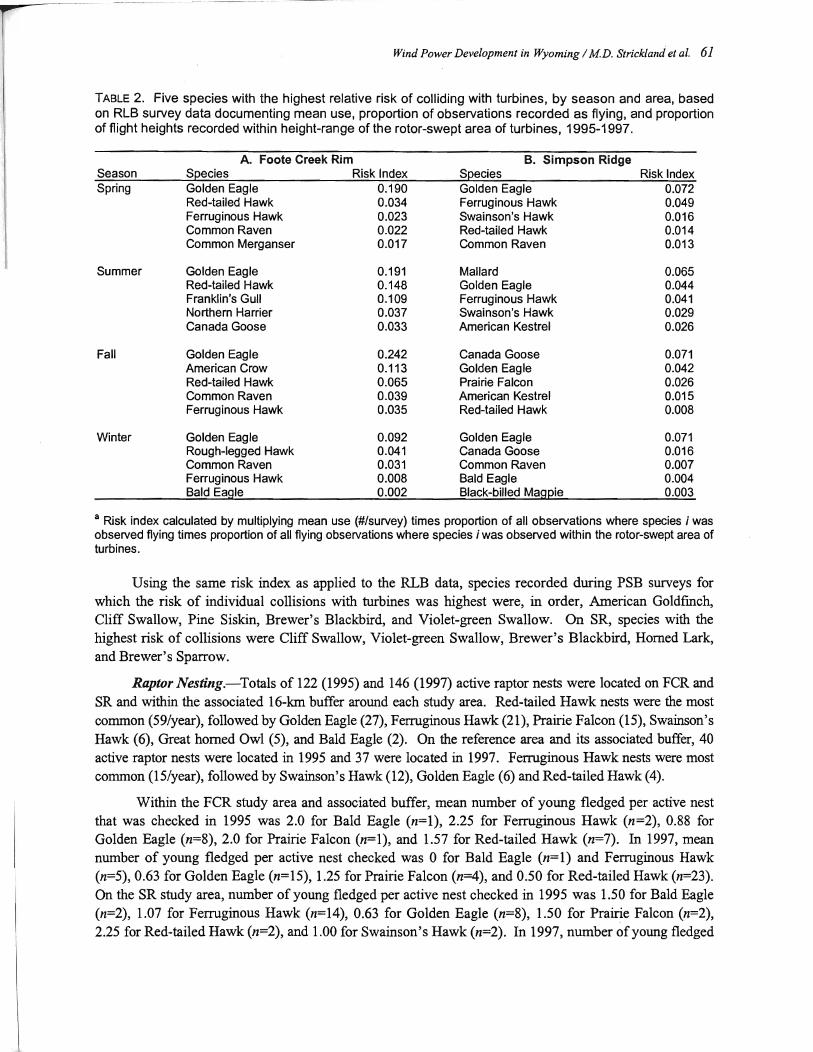
Wind Power Development in Wyoming / MD. Strickland et al. 61
TABLE 2. Five species with the highest relative risk of colliding with turbines, by season and area, based on RLB survey data documenting mean use, proportion of observations recorded as flying, and proportion of flight heights recorded within height-range of the rotor-swept area of turbines, 1995-1997.
A. Foote Creek Rim B. Simpson Ridge Season Sl2ecies Risk Index S~ecies Risk Index Spring Golden Eagle 0.190 Golden Eagle 0.072
Red-tailed Hawk 0.034 Ferruginous Hawk 0.049 Ferruginous Hawk 0.023 Swainson's Hawk 0.016 Common Raven 0.022 Red-tailed Hawk 0.014 Common Merganser 0.017 Common Raven 0.013
Summer Golden Eagle 0.191 Mallard 0.065 Red-tailed Hawk 0.148 Golden Eagle 0.044 Franklin's Gull 0.109 Ferruginous Hawk 0.041 Northern Harrier 0.037 Swainson's Hawk 0.029 Canada Goose 0.033 American Kestrel 0.026
Fall Golden Eagle 0.242 Canada Goose 0.071 American Crow 0.113 Golden Eagle 0.042 Red-tailed Hawk 0.065 Prairie Falcon 0.026 Common Raven 0.039 American Kestrel 0.015 Ferruginous Hawk 0.035 Red-tailed Hawk 0.008
Winter Golden Eagle 0.092 Golden Eagle 0.071 Rough-legged Hawk 0.041 Canada Goose 0.016 Common Raven 0.031 Common Raven 0.007 Ferruginous Hawk 0.008 Bald Eagle 0.004 Bald Eagle 0.002 Black-billed Mag~ie 0.003
a Risk index calculated by multiplying mean use (#/survey) times proportion of all observations where species i was observed flying times proportion of all flying observations where species i was observed within the rotor-swept area of turbines.
Using the same risk index as applied to the RLB data, species recorded during PSB surveys for which the risk of individual collisions with turbines was highest were, in order, American Goldfmch, Cliff Swallow, Pine Siskin, Brewer's Blackbird, and Violet-green Swallow. On SR, species with the highest risk of collisions were Cliff Swallow, Violet-green Swallow, Brewer's Blackbird, Homed Lark, and Brewer's Sparrow.
Raptor Nesting.-Totals of 122 (1995) and 146 (1997) active raptor nests were located on FCR and SR and within the associated 16-km buffer around each study area. Red-tailed Hawk nests were the most common (59/year), followed by Golden Eagle (27), Ferruginous Hawk (21), Prairie Falcon (15), Swainson's Hawk (6), Great homed Owl (5), and Bald Eagle (2). On the reference area and its associated buffer, 40 active raptor nests were located in 1995 and 37 were located in 1997. Ferruginous Hawk nests were most common (I5/year), followed by Swainson's Hawk (12), Golden Eagle (6) and Red-tailed Hawk (4).
Within the FCR study area and associated buffer, mean number of young fledged per active nest that was checked in 1995 was 2.0 for Bald Eagle (n=l), 2.25 for Ferruginous Hawk (n=2), 0.88 for Golden Eagle (n=8), 2.0 for Prairie Falcon (n=l), and 1.57 for Red-tailed Hawk (n=7). In 1997, mean number of young fledged per active nest checked was 0 for Bald Eagle (n=l) and Ferruginous Hawk (n=5), 0.63 for Golden Eagle (n=15), 1.25 for Prairie Falcon (n=4), and 0.50 for Red-tailed Hawk (n=23). On the SR study area, number of young fledged per active nest checked in 1995 was 1.50 for Bald Eagle (n=2), 1.07 for Ferruginous Hawk (n=14), 0.63 for Golden Eagle (n=8), 1.50 for Prairie Falcon (n=2), 2.25 for Red-tailed Hawk (n=2), and 1.00 for Swainson's Hawk (n=2). In 1997, number of young fledged
! ,
62 National Avian- Wind Power Planning Meeting III
per active nest was 0.50 for Bald Eagle (n=2), 0.41 for Ferruginous Hawk (n=17), 0.89 for Golden Eagle (n=22), 1.50 for Prairie Falcon (n=6), 0.38 for Red-tailed Hawk (n=21), and 0.66 for Swainson's Hawk (n=3). On MPR, number of young fledged per active nest checked in 1995 was 2.05 for Ferruginous Hawk (n=13) and 1.0 for Golden Eagle (n=2), Prairie Falcon (n=l), and Red-tailed Hawk (n=l). In 1997, number of young fledged per active nest was 1.59 for Ferruginous Hawk (n=l1), 0.83 for Golden Eagle (n=6), and 0.50 for Prairie Falcon (n=l) and Red-tailed Hawk (n=3).
Mountain Plover.-This species has not been observed on SR, and no suitable breeding habitat for this species has been found there. Mountain Plovers did occur in the other two study areas. For FeR, survey data indicate that most plovers arrive by mid April and leave in late July through August. Maximum Mountain Plover density on FCR adjusted for visibility bias was 4.911km2 in mid June 1995 and 3.411km2 in late July 1997. Assuming these density estimates represent the maximum breeding population on FCR, total estimated breeding population size for the 12-lan2 mesa on FCR was approximately 60 individuals in 1995 and 41 individuals in 1997. In 1995, plovers tended to be concentrated on the north end of the Foote Creek Rim, as 80% of all observations were on the northern 1/3 of the rim; this same pattern continued in 1997. For MPR, maximum Mountain Plover density, adjusted for visibility bias, was 2.0/km2 in 1995 and 7.361km2 in 1997. Assuming maximum density estimates represent the breeding population on MPR, then the total estimated breeding population size for the MPR area was approximately eight in 1995 and 30 in 1997. This may not indicate a large population increase on MPR, as surveys were initiated late in 1995 (June 12), and the peak of Mountain Plover activity on MPR may have been missed that year.
Two Mountain Plover nests were located on FCR in 1995 and eight were located in 1997. All nests were located during the period 1 June through 25 June. The two nests located in 1995 each contained three eggs, and produced a total of five chicks for an average of 2.5 chicks/nest. In 1997, at least seven of the eight nests located on FCR were successful, and produced an estimated total of 19 chicks for an average of 2.4 chicks/nest. Two Mountain Plover nests were located in the MPR reference area in 1995 and one was located in 1997. Nests on MPR were located during the period 2 June to 25 June. Both nests located in 1995 were successful and produced a total of three young; the one nest found in 1997 also was successful and produced two young.
Sage Grouse.-Twenty-two known historic lek sites for Sage Grouse were visited during the aerial and ground surveys in 1995 and 1997. All active leks were in the SR study area. Maximum counts for seven leks monitored in 1995 totaled 133 males (mean = 19.0Ilek) and 17 females (mean = 2.4llek). In 1997, maximum counts for nine leks monitored totaled 122 males (mean = 13.6Ilek) and 59 females (mean = 6.6Ilek). For the seven leks monitored in both 1995 and 1997, total number of males decreased from 133 to 114 (14%), whereas number of females increased from 17 to 52 (306%). Mean Sage Grouse pellet density on FCR was 68lha during the winter period 8lha during the summer period. On the SR study area, mean sage grouse pellet density was 125/ha during the winter period and 88lha during the summer period.
Pronghorn.-The maximum estimate of pronghorn numbers on the survey area was 10,796 during the 1995/1996 winter and 16,396 during the 1997/98 winter. Results of spatial analyses indicated that highest use of the survey area by pronghorn during all seasons was in the eastern portion of the survey area north of FCR; areas in the vicinity of FCR and SR received lower use. Density of all big game pellet groups on FCR was 370lha during winter and 141lha in summer. Corresponding figures for the SR area were 261lha in winter and 334lha in summer. Estimates of pellet group density appear sensitive enough to characterize level of use of each study area by big game and to detect shifts in use within each study area.
Wind Power Development in Wyoming / MD. Strickland et at. 63
Conclusions
Comparisons of raptor, waterfowl, waterbird, corvid and other passerine use among topographically similar portions of each study area indicated that the Simpson Ridge (SR) area appears to provide a suitable reference area for Foote Creek Rim (FCR) prior to development of SR. Likewise, the Morton Pass Reference area (MPR) appears to provide an adequate permanent reference area. Although some differences in avian diversity and use were detected among study areas for some seasons, overall avian use and diversity are fairly similar among the three study areas. These study areas appear adequate for comparing trends over time.
Overall results of the fIrst two years of monitoring indicate that the monitoring protocol used for this study is sufficient to provide data required to evaluate effects of wind power development on the wildlife resource. Data collected in future years will allow for even more accurate determinations of wildlife use and composition, reproductive success, habitat selection, and risk of individual birds colliding with turbines on the study areas.
Literature Cited
Green, RH. 1979. Sampling design and statistical methods for environmental biologists. Wiley, New York, NY. 257 p.
Jolmson, G.D., D.P. Young, Jr., C.E. Derby, W.P. Erickson, M.D. Strickland and IW. Kern. 1998. Wildlife monitoring studies, SeaWest wind power plant, Carbon County, Wyoming, 1995-1997. Rep. from WEST Inc., Cheyenne, WY, for SeaWest Energy Corp. and U.S. Bur. Land Manage. 184 p.
Reynolds, R.T., J.M. Scott and R.A. Nussbaum. 1980. A variable circular-plot method for estimating bird numbers. Condor 82(3): 309-313.
General Discussion
Dr. Strickland noted that, when raptor utilization was found to be high near the edge of the rim, Sea West selected turbine sites away from the edge. An attendee asked whether it had been diffIcult to restrict the turbine sites in this way. Mike Azeka of SeaWest indicated that it had been feasible at this location, but might not necessarily be feasible at all locations. Additional mitigation measures that were mentioned include reduction of perch sites via turbine design features and by burying power lines.
In response to a question about visibility limitations and biases from plots, Dr. Strickland said that this is indeed an issue, especially on downslopes. One criterion in selecting plots was that observers must be able to see at least a 270° portion of the circular plot from the observation site. This reduced but did not eliminate differences in observability among plots.
Another question concerned the aspects of Mountain Plover behavior that might affect risk to these birds. Two features of their behavior were mentioned: (1) in spring, they arrive during the night; (2) their breeding display is aerial. The rotors of the turbines originally planned for use extended downward suffIciently close to the ground to overlap with the heights of display flights. However, the turbines now planned for use are farther above ground, resulting in less likelihood of collisions during display flights. It was also noted that the Pawnee National Grassland, where Mountain Plovers have been studied in much detail, is not too distant, thus providing reference information relevant to the present study.
Concerning study duration, it was noted that the project had included two years of work up to the time of the meeting in 1998. Another two years of monitoring was expected to occur.
~--
i "
I,
i " i
Impacts of a Small Wind Power Facility in Weld County, Colorado, on Breeding, Migrating, and Wintering Birds: Preliminary Results and Conclusions
Introduction
by
Paul Kerlinger and Richard C. Curry
Curry & Kerlinger, L.L.C. 1
In June 1997 the first commercial wind energy station for the state of Colorado, the Ponnequin Wind Power site, was pennitted. During the permitting process, the issue of avian impacts was raised by several government agencies within whose jurisdiction the site is located. In addition, several public conservation organizations voiced concerns regarding the potential impacts of turbines in a prairie environment. Specifically, they were concerned about impacts on birds that nest, migrate, or winter on or near the site. The concerns of these groups are based on the perception that large numbers of birds collide with the revolving blades of wind turbines. Such concerns are a result of the experience in the Altamont Pass Wind Resource Area of California where large numbers of fatalities, primarily involving raptors, have been noted. In response to these concerns, a study was designed and is now being conducted at the Ponnequin site. The study methodology and preliminary results are reported here.
Project and Site Description
The project is a small-scale wind power facility that initially will consist of seven 750 NEG Micon turbines. More turbines may be erected in the future. The turbines will be mounted on tubular towers; the total height of each is expected to be somewhat in excess of 200 feet (60 m). Because of this height, the Federal Aviation Administration requires lighting for aircraft safety. The turbine site and one reference site are situated on the same hilltop in northern Weld County, Colorado, only a few meters south of the Wyoming border. A second reference site is located about 3 km to the north, in Wyoming. The two reference sites are similar to the turbine site in habitat, terrain, avian breeding communities, elevation, and topography. The project is being developed by Distributed Generation Inc. and Colorado Public Service Company. Studies of the reference sites are being funded by the US DOE National Renewable Energy Laboratory. .
The vegetation on turbine and reference sites is heavily grazed, short to mid-grass prairie. There are no trees or natural water sources on the sites. However, spillage from watering troughs, located on all cattle ranches in the area, is an avian attraction. No watering troughs are near turbine or reference sites. Within 200 m of the proposed turbines is a corral, several small farm buildings, and an old windmill. The Ponnequin Wind Power Site and adjoining ranches are heavily grazed by cattle; the reference sites are grazed by bison. Large numbers of pronghorn antelope share all grazing areas. There is minimal topographic relief on the wind power site and the reference areas, with most areas having less than a 10% grade (1:10).
1 Curry & Kerlinger L.L.C., P.O. Box 453, Cape May Point, NJ 08212. Phone: 609-884-2842. E-mail:
[email protected] [email protected]
64
Impacts in Colorado / P. Kerlinger & R. C. Cuny 65
Perch sites in the vicinity of the proposed turbines include fence posts around the property perimeter, a series of wooden power poles for a 115 kV transmission line just off-site to the east and, farther away steel, high-tension towers.
Methods
The study involves a BACI (Before - After, Control- Impact) research design in which avian use of the wind power site and two nearby reference sites are studied before and after the impact. Reference sites are analogous to "controls" in experimental research. In this case, the impact is defined as the installation and operation of seven wind turbines. Avian use parameters that are being studied include nesting of songbirds and raptors, foraging or roosting on the site, diurnal migration over the site, migratory stopovers by raptors and other species, and winter use by all birds. In addition to presence/ absence and abundance data, bird behavior is being observed so changes in behavior may be quantified. In addition to avian use of the site, the research plan includes carcass searches before and after construction, and a raptor nesting survey.
Studies commenced at the Ponnequin Wind Power Site in June 1997, and on the reference sites in January 1998. Surveys on the Ponnequin site consist of two main transects each about 1 km in length, divided into 120 m segments. These transects correspond to the linear axis of the original turbine layout. Three additional transects, each 400 m long and 100 m wide, were established perpendicular to each of the main transects, with the midpoint of each perpendicular transect being along one of the main transects. These perpendicular transects are flagged into eight 50 x 50 m squares. The purpose of sampling quadrats along transects perpendicular to the future turbine lines is to determine if use by songbirds changes after turbines are erected. If the area close to t]le turbines becomes less suitable for these species, trends will be obvious on the perpendicular transects. This question has arisen in other avian studies at wind plants, including a study of forest breeding songbirds in Vermont (K.erlinger 1998) where declines in abundance of some species were noted close to the turbines.
Each reference site included two main transects of the same length as those on the wind power site, and four perpendicular transects the same length as those on the wind power site.
Surveys of both main and perpendicular transects consist of walking the transects slowly while observing all birds within visual range. In addition, 5 min of observation are conducted from each of four fixed points spaced several hundred meters apart along each transect. Location and behavior of all birds observed, whether within or outside the transect area, is recorded. Information recorded includes whether the bird is perched or flying, type of perch, whether they cross the turbine string axis, height above ground when they cross, and whether they are judged to be hunting. Surveys are conducted once per month during winter, twice per month during migration periods, and weekly during the nesting season.
To quantify any impacts of turbine installation and operation on the abundance of primary raptor prey species, counts of ground squirrel and pocket gopher diggings are made along each transect. Each month, counts are conducted on one-third of all transects. Consequently the entire area is surveyed four times per year. Incidental observations of prey abundance are also noted during the regular bird surveys. If dramatic changes in prey abundance are noted, more intensive surveys can be initiated.
Pre- and post-construction searches for bird carcasses are required to document and compare baseline versus turbine-related mortality estimates. Because the vegetation cover is short and sparse, the carcasses and even feathers oflarge birds such as raptors and waterfowl are readily detectable in the study areas. On the Ponnequin site, casual carcass searches incidental to surveys for ground-breeding songbirds were conducted on more than a dozen occasions during 1997. These casual searches entailed walking
66 National Avian - Wind Power Planning Meeting III
transects and grids along the axis where turbines will be erected. Formal carcass searches began both there and on the reference sites early in 1998. Each month, carcass searches are made on one-third of all transect areas such that the entire area is searched four times per year. In addition, complete searches along the turbine string and along the main axes of the reference sites are being conducted four times per year. Carcass searches will be continued for one year following construction of the facility.
Observer efficiency and scavenging studies were to be conducted during summer 1998 using carcasses of the species of birds that breed on or near the study sites. The reason for using "real" birds, rather than game birds and poultry, has been established by Howell and DiDonato (1991), Howell and Noone (1992), Orloff and Flannery (1992), and Kerlinger (1998). The use of poultry or other non-native species seems to result in unrealistically high estimates of the scavenging rate.
Aerial surveys for raptor nests have been conducted by local biologists for several years. These surveys consist of helicopter flights at an altitude that allows spotting of nests and adult birds at a minimum distance of one-half mile. Aerial surveys were to be conducted again in 1998 to determine the distribution of raptor nests in the area. The area covered by the survey includes the study site and several hundred square kilometers of the surrounding countryside.
Preliminary Results
Songbirds .-After nearly a year of surveys prior to construction on the prospective turbine site, and nearly six months of studies on the reference sites, few species of birds have been detected. The breeding avifauna on and near the transects have included fewer than six species of grassland songbirds. Only three species breed on the three-quarter section on which the wind power facility is being constructed. The species are typical short and mid-grass prairie nesters such as Horned Lark, Lark Bunting, and Western Meadowlark. Species that nest nearby and use the site for foraging include Common Nighthawk, Grasshopper Sparrow, and a few others. Barn Swallows nest on the barns and house that are on-site, and Rock Wrens may also nest in the corrals or buildings. In 1998, breeding birds began to return to the site during March (Horned Larks), but the majority of species and individuals arrived during April. The highest densities of breeding songbirds were present during mid-late summer when birds formed post-breeding/premigratory flocks. However, the total number of birds involved was not high. Per hectare densities of nesting species will be provided in the final report.
In late autumn and winter, songbirds were extremely scarce on all study sites. The only species seen regularly was the Horned Lark. Along some transects, no birds were seen in winter.
Raptors.-Raptors seen on or near the site included only a handful of Golden Eagles, Northern Harriers, Swainson's Hawks, Ferruginous Hawks, Prairie Falcons, and a Rough-legged Hawk. The Northern Harrier may be the most numerous species using the site, especially during migration when they hunt songbirds along the fencerows. Harriers were seldom seen in the middle of the section where the turbines will be constructed. Only a small proportion of the raptors seen were on-transect or crossing the transects. Many perched on power poles off-site or on fence posts on the site border.
During winter, from December through early March, raptors were scarce or absent on and around the study sites. A single Golden Eagle was seen off-site in late February, but the species was largely absent during winter, as were most other hawks. Most raptors arrived in April and May.
A raptor nest survey of the future wind plant was conducted on foot during June 1997. It revealed no nests on the Ponnequin Wind Power Site property. The two closest raptor nests that were discovered
Impacts in Colorado / P. Kerlinger & R.C. Curry 67
were one apparently-active Swainson's Hawk nest about 2 Ian from the future turbine site and a nest about 8 Ian off site.
Prey.-In the first summer of observations, 13-lined ground squirrels and pocket gophers were noted at very low densities. A cotton-tailed rabbit was seen during one visit. The only other animals that could be considered prey for raptors were a single prairie rattlesnake, a house cat, and numerous pronghorn antelope (prey for Golden Eagles only).
Carcass Searches.-During the first formal carcass search, no dead birds were found. In addition, during the dozens of other site visits in 1997 and first half of 1998, no carcasses were found. If few or no carcasses are found during the remainder of the pre-construction period, it will be difficult or impossible to determine natural mortality rates in the study areas. Such determinations in natural and relatively undisturbed populations have been elusive to ecologists.
Discussion
Risk to Birds at Ponnequin Site.-The scarcity of raptors and other birds on site is largely a function of the type and quality of habitat, and the current use of the land for grazing by cattle and bison. These habitats lack perch sites and prey, and do not support large populations of raptors or other birds. While some raptors occasionally use the site, it seems to be only a small portion of their overall foraging range. The apparent reason for the low intensity of use by raptors is the low density of 13-lined ground squirrels and pocket gophers. Prey, while present in small numbers, are not readily available to raptors except during the limited amount of time the prey spends above ground. During some seasons they are not available at all.
During late autumn through early spring, the virtual absence of birds on the site will result in almost no risk to birds from wind turbines. This period includes mid-November through mid-March. During September and October, and again during March and April, use by songbirds and raptors was greater, but still the overall numbers of species and individuals that used the site was not great. Fewer still passed through the transects where the turbines will be situated.
A question that remains open is risk to birds that migrate at night at very low altitudes. Virtually no studies have been conducted, in any area, of night migration at altitudes below 200-250 feet. Hence, the potential for risk to nocturnal migrants flying at these altitudes is not known. Most previous studies using radar and ceilometer strongly suggest that only a small percentage of nocturnal migrants fly below 250 feet above ground, but those techniques usually have limited abilities to detect low-flying birds and to discriminate birds at different altitudes. Until technology allows researchers to quantify the low-altitude migration, risk cannot be assessed.
Complicating this unknown risk factor at night is the fact that some turbines will be lighted. Lighting on communications towers is known to kill migrating birds (Kerlinger 1995), but most kills are from towers in excess of 300-500 feet high. Again, there is no way to assess whether lighted turbines in the 200-240 foot range will impact migrants. Because wind turbines are not as tall as the known lethal towers, and because turbines are not guyed, it is likely that they will kill far fewer birds.
Concentrated diurnal migration was not observed, and indeed there were few observations of any migrants-diumal or nocturnal. There are few places near the prospective wind plant for night migrating songbirds or shorebirds to stop over. Hence, it is unlikely that birds descending to or ascending from stopover sites will come into.the range of turbine blades.
68 National Avian - Wind Power Planning Meeting III
Some species that have been killed in disproportionately high numbers at other wind plants, such as Golden Eagles and Red-tailed Hawks, do visit the Ponnequin site, but in relatively low numbers. As many as two Golden Eagles were seen within 2 km of the site, perching on high-tension electrical towers. There also were a few other sightings of individual birds on electrical poles within 100 m of the border of the site. Virtually no Red-tailed Hawks were seen using the site, although they undoubtedly pass through the area during migration and may nest within 10-15 km of the site.
Comparison of Risk to Raptors at Ponnequin vs. Altamont.-To determine the potential numbers of raptors that might be killed on the Ponnequin site, it is useful to compare the Colorado project with the portion of the Altamont Wind Resource Area (A WRA) on which Kenetech model 56 turbines are located. The effects of the KCS-56 turbines mounted on lattice towers have been studied by several researchers funded both by industry (Howell and DiDonato 1991) and by the California Energy Commission (Orloff and Flannery 1992, 1996). The latter studies concluded that the KCS-56 turbines, as compared to other turbines, are more dangerous to birds because KCS-56 turbines offer comfortable perch sites, their blades spin very rapidly (75 rpm), and they occupy steep hillsides. Furthermore, they are located in areas of the A WRA that have some of the highest densities of raptors in the world. The kill rate per turbine varies by species of interest and several other variables (middle vs. end of turbine string, topography, prey availability in the area; Kerlinger and Curry 1997). On average, Kenetech turbines in the A WRA kill about 0.0065 Golden Eagles and 0.013 Red-tailed Hawks per turbine per year. If these rates applied at the Ponnequin site, and if all else were equal, the seven turbines to be erected at Ponnequin would kill one Golden Eagle every 22 years and one Red-tailed Hawk every 11 years.
The above analysis is based on the assumption that the turbines planned for the Ponnequin site have the same risk factors as the KCS;-56 turbines in the A WRA. This assumption is unrealistic because the new turbines are far less risky. First, they have tubular towers that offer no perch sites to raptors or other birds. As compared with the KCS-56 turbines in the Altamont, this will discourage birds from coming into proximity with turbines. Second, blades of the new turbines revolve at less than 35 rpm vs. 75 rpm for the KCS-56 turbines, resulting in greater visibility of the turning blades. Third, the fact that so few turbines are to be erected at Ponnequin (7 in the first phase vs. 3400 KCS-56 turbines in the A WRA) makes it easier for birds to move through the area without encountering a turbine. Fourth, at Ponnequin none of the turbines will be situated on steep hillsides, where a majority of Golden Eagle and Red-tailed Hawk kills are found in the Altamont. Fifth, the density of rap tors at Ponnequin is far less than that in the Altamont. It is difficult to quantify these factors in calculating risk. However, it is obvious that the numbers of kills predicted above based on kill rates per turbine in the Altamont will greatly overestimate actual kill rates at Ponnequin unless other, as yet unknown, factors are involved.
Conclusions
The low abundances of songbirds and raptors in the Ponnequin study area strongly suggest that the construction and operation of seven wind turbines there poses a low risk to birds. During winter, birds are virtually absent. Thus, for several months of the year, almost no birds will be at risk. During spring, summer, and early autumn, more birds are on site, but the numbers are not exceptional. Other factors that suggest low risk to birds include a scarcity of prey that would attract raptors, an absence of perch sites, and an absence of the types of topography identified by previous studies as high-risk. Perhaps the most important concern at the Ponnequin site is the question of disturbance to groundnesting songbirds. The ongoing surveys along transects oriented perpendicular to turbine strings will
--- --- ~--- ------- ------------
Impacts in Colorado / P. Kerlinger & R.C. Curry 69
allow us to quantify and characterize this disturbance if it occurs. The use of perpendicular transects is a relatively new component in studies of wind turbine effects on birds.
Literature Cited
Kerlinger, P. 1995. How birds migrate. Stackpole Books, Mechanicsburg, PA. 228 p.
Kerlinger, P. 2000. An assessment of the impacts of Green Mountain Power Corporation's Searsburg, Vermont, Wind Power Facility on breeding and migrating birds. In: Proc. Nat. Avian - Wind Power Planning Meeting III, San Diego, CA, May 1998. LGL Ltd., King City, Ont. (This volume)
Kerlinger, P. and R. Curry. 1997. Analysis of Golden Eagle and Red-tailed Hawk fatalities on Altamont Ownership Consortium property within the Altamont Wind Resource Area (A WRA). Rep. for Kenetech Windpower and Altamont Ownership Consortium.
Howell, 1. and J. DiDonato. 1991. Assessment of avian use and mortality related to wind turbine operations, Altamont Pass, Alameda and Contra Costa Counties, California, September 1988 through August 1989. Rep. for U.S. WindPower, Livermore, CA.
Howell, 1., J. Noone and C. Wardner. 1991. Avian use and mortality study. U.S. WindPower, Montezuma Hills, Solano County, California. Post construction spring 1990 to spring 1991. Rep. for Solano County Planning Dep., Fairfield, CA.
Orloff, S. and A. Flannery. 1992. Wind turbine effects on avian activity, habitat use, and mortality in Altamont Pass and Solano County Wind Resource Areas 1989-1991. P700-92-001. Rep. from BioSysterns Analysis Inc., Tiburon, CA, for Planning Dep., Alameda, Contra Costa and Solano Counties, CA, and Calif. Energy Comm. [Sacramento, CA). Var. pag.
Orloff, S. and A. Flannery. 1996. A continued examination of avian mortality in the Altamont Pass Wind Resource Area. P700-96-004CN. Rep. from Ibis Environ. Servo and BioSysterns Analysis Inc., Santa Cruz, CA, for Calif. Energy Comm. [Sacramento, CAl 55 p.
Avian Use, Flight Behavior, and Mortality on the Buffalo Ridge, Minnesota, Wind Resource Area
Introduction
by
M Dale Stricklandl, Gregory D. Johnsonl, Wallace P. Ericksonl, Sharon A. Sarappo2 and Richard M Halet2
IWestem EcoSystems Technology Inc. 2Northem States Power Company
As of mid-1998, Northern States Power Company (NSP) was constructing the second phase of a large (up to 425 MW) wind plant within the Buffalo Ridge Wind Resource Area (WRA) in southwestern Minnesota. In 1996, Western EcoSystems Technology (WEST Inc.) was contracted by NSP to develop an avian monitoring protocol for the Buffalo Ridge WRA. and to implement the protocol beginning with the 1996 field season. This protocol (Strickland et al. 1996) was developed and peer-reviewed by numerous individuals representing the wind energy industry, u.S. Fish and Wildlife Service, Minnesota Department of Natural Resources, and the Audubon Society prior to fmalization.
The WRA. consists of a large portion of Buffalo Ridge located in Lincoln and Pipestone Counties in southwest Minnesota. The wind plant currently consists of three phases of development (Fig. 1). Phase I, constructed by Kenetech in 1994, consists of 73 Kenetech Model 33 M-VS turbines and related facilities sufficient to generate 25 MW of electricity. Phase II, consisting of 143 turbines and related facilities sufficient to generate 107.25 MW of electricity, was under construction by Zond Systems Inc. in early-mid 1998, and was expected to be on-line in mid 1998. Phase III facilities capable of generating an additional 100 MW were planned for the southeast portion of the WRA. by mid 1999. A permanent reference area not scheduled for wind power development was selected along Buffalo Ridge northwest of the WRA. in Brookings County, South Dakota.
The primary goals of monitoring wind power development are to evaluate risk to avian species from each phase of development, and the cumulative risk to avian species from all wind power development in the WRA.. The secondary goal of monitoring is to provide information that can be used to reduce the risk to avian species from subsequent developments (Strickland et al. 1996). Here we summarize the methods described in the protocol, and present selected results of avian monitoring studies conducted in 1996 and 1997. Further details on the protocol and results of the first two years of monitoring studies are presented in Johnson et al. (1998).
Methods
Experimental Design.-This monitoring study uses the before-after control-impact (BACI) design (Green 1979). The specific BACI design applied here is a modification of a protocol proposed by Richard Anderson (California Energy Commission, pers. comm.; Anderson et al. 1996), where avian use and mortality are measured on plots located at varying distances from turbines. Modifications to Ander-
I Western EcoSystems Technology Inc., 2003 Central Avenue, Cheyenne, WY 820001. Phone: 307-634-1756. Fax: 307-637-6981. E-mail: [email protected]
2 Northern States Power Company, 414 Nicollet Mall, Minneapolis, MN 55401-1927.
70
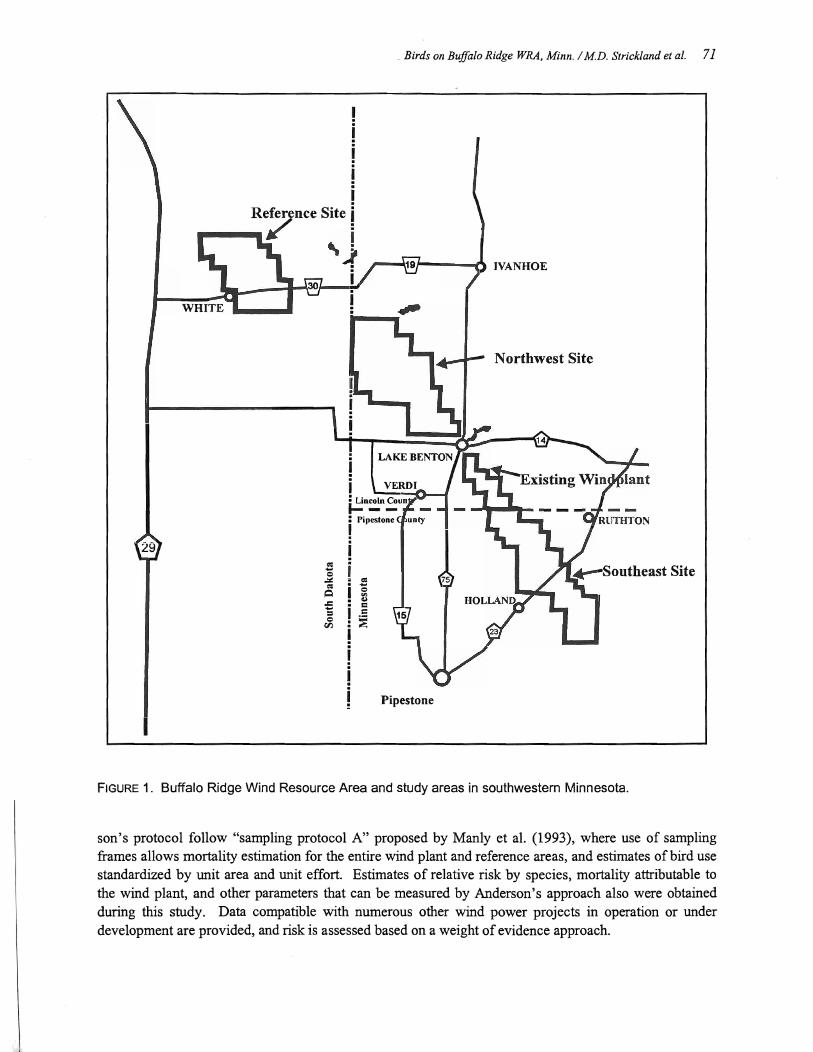
29
.. __ R./nee Site
,~
i
0: ..... = ~ 0: ~ .c ..... = = if.)
Birds on Buffalo Ridge WRA. Minn. / M.D. Strickland et at. 71
,.....--~ IVANHOE
0: ..... ~ 41 c: c:
:E
.Pipestone
FIGURE 1. Buffalo Ridge Wind Resource Area and study areas in southwestern Minnesota.
son's protocol follow "sampling protocol A" proposed by Manly et al. (1993), where use of sampling frames allows mortality estimation for the entire wind plant and reference areas, and estimates of bird use standardized by unit area and unit effort. Estimates of relative risk by species, mortality attributable to the wind plant, and other parameters that can be measured by Anderson's approach also were obtained during this study. Data compatible with numerous other wind power projects in operation or under development are provided, and risk is assessed based on a weight of evidence approach.
72 National Avian - Wind Power Planning Meeting III
The BACI design combines collection of data before and after the Phase II and III wind power developments, with collection of data from the existing Phase I development and multiple control areas. An attempt was made to find a permanent control area as similar as possible, both physically and biologically, to the current and proposed wind plant sites. Perfect control areas for the wind plant do not exist; therefore, control areas are termed reference areas. Four areas were initially studied: the existing wind plant (Phase I), denoted EW; the northwest development area (Phase II), denoted NW; the southeast development area (Phase III), denoted SE; and a permanent reference area denoted REF (Fig. 1). Data collected on the NW and SE sites will serve as reference data for EW prior to development of the NW and SE sites, and will also provide pre-construction data for the future developments. By sampling both reference and impact areas before and after wind power development, both temporal and spatial controls are used, optimizing impact assessment capabilities (Green 1979). BACI analyses will be used to compare the NW and SE sites, relative to the reference area(s); this will be possible because at least two years of preconstruction data will be available. There will always be one permanent reference area (i.e., not proposed for development) to compare to the development areas.
Monitoring activities combine relatively intensive surveys of species of primary concern (passerines and other non-raptor species) with relatively less intensive surveys of species of lesser concern (i.e., raptors). Passerines and shorebirds are of primary concern because of their abundance in the area and because of the presence of several species of concern (e.g., Loggerhead Shrike and Wilson's Phalarope). Raptors, with the exception of the Burrowing Owl, are of lesser concern, primarily because the most common breeding species is the ubiquitous Red-tailed Hawk. Depending on the avian resource of concern, evaluations of effects from wind energy development include effects on individuals (e.g., reduction or increase in use of the area occupied by the turbines) and population effects such as mortality (e.g., death due to collision with a turbine).
Several outcomes are possible from analyses of results from the avian studies. For example, a decline in avian use on the NW site after construction of turbines, without a similar decline on the reference area( s), may be interpreted as evidence of an effect of wind power development on individual birds. The presence of more carcasses near turbines than in reference plots increases the weight of evidence that a mortality effect can be attributed to wind power. A decline in use of both the reference area and an area with wind turbines, especially if this occurs in the absence of turbine-related mortality, may be interpreted as a population response unrelated to wind power.
Passerine/Smail Bird (PSB) Surveys.-Point count surveys within sample plots of 100-m radius were used to estimate relative density and use of all avian species on the study areas. The location of each bird detected during counts was recorded to allow linkage with existing or measured information regarding the physical and biological characteristics of the site. This survey concentrated on passerines and other small species; however, all species seen within plots were recorded.
A systematic sample of 21 turbine locations in the existing wind plant, and 40 proposed turbine locations in the NW site, were selected as point count stations for measuring avian use. A systematic sample of additional points was selected from an area within 100 m to 300 m of public road rights-ofway: 11 within the existing wind plant (EW), 31 in the Phase II development area (NW), 25 in the Phase III development area (SE), and 29 in the reference area (REF). Observations on each point were made once every two weeks from 15 April to 15 November 1996 and from 15 March to 15 November 1997. Surveys were conducted between Y2 hour before sunrise and 4 hours after sunrise. At each point, observers recorded all birds detected by sight or sound for a 5-min period. Data recorded for each bird observation included time, species, number, estimated distance from the observer, activity, habitat, flight
------ ------- -----------------------------~~~~~~~
Birds on Buffalo Ridge WRA, Minn. / M.D. Strickland et al. 73
direction, and estimated flight height to the nearest meter. For data analysis, these flight heights were categorized as below, within, or above the space swept by turbine blades.
RaptorlLarge Bird (RLB) Surveys.-The objective of the RLB surveys of bird use was to estimate spatial and temporal aspects of use, by large bird species of interest, on Buffalo Ridge and within each of the four study areas. Groups of birds recorded during RLB surveys included raptors, corvids (limited to crows), waterbirds (cormorants, pelicans, gulls, waders), waterfowl, and shorebirds. The resulting avian use data are considered to be indices of bird density (number of individuals per unit area) for species using the study areas. Use was measured by making counts of birds observed within sample plots, and keeping track of the duration of time spent within the boundaries of the plot. Six RLB observation stations were located within each of three of the four study areas (the NW site, SE site, and REF area). Due to its much smaller size, only two RLB observation stations were located within EW. Stations were selected using a systematic sampling procedure with a random starting point for the fIrst station within each area. When necessary, during a preliminary fIeld visit to each station, the observers adjusted location of the center to the nearest location with an unobstructed view out to 0.8 km in at least 270°.
Each RLB observation station consisted of a 0.8-km radius circle centered on an observation point. Observations were made at each sampling station once every two weeks during the same study periods as used for PSB surveys (15 Apr. to 15 Nov. 1996; 15 Mar. to 15 Nov. 1997). Observation times were rotated to cover all daylight hours. Each station was visited twice during the day of sampling, once during the morning (08:00-12:00) and once during the afternoon (12:00-16:00). Each station was surveyed about the same number of times during each period of the day each season. Data collected during each visit consisted of continuous counts of bird use during a 30-min interval. The location of fIrst sighting and direction of travel were mapped in the field. Flight pattern (including perching) and flight height were recorded at the time offrrst observation and every five minutes of the survey.
Avian Risk Index.-An index to risk (R) was calculated for all bird species observed by season using the following formula, where risk is defIned to be the probability of turbine collision:
R =A*P,Pt
where A = mean abundance for species i adjusted for visibility bias, Pf = proportion of all observations of species i where activity was recorded as flying (an index to the approximate percentage of time species i spends flying during the daylight period), and Pt = proportion of all flight height observations of species i within the rotor-swept area of the turbines. Pt was calculated for two turbine types either in use or proposed for use on Buffalo Ridge. Turbine A is installed on top of a 120-foot (36-m) tubular tower and has a blade diameter of 108 ft (33 m). Maximum height of the wind turbine at the tip of the blade is 174 ft (52.5 m). The rotor-swept area of Turbine A is 19.5 to 52.5 m above ground. Turbine B is installed on top of a 164-ft (50-m) tubular tower. Two blade diameters are proposed for use. One is 151 ft (46 m), and the other is 157.5 ft (48 m). Therefore, total turbine height will be either 239.5 ft (73 m) or 242.8 ft (74 m). The rotor-swept area of Turbine B will be either 26 to 74 m or 27 to 73 m above ground; the former range was used in all analyses of avian flight height involving Turbine B because this area encompasses both rotor diameters.
Carcass Searches.-Objectives of carcass searches were (1) to estimate the number of bird deaths attributable to wind turbine collisions for the entire Buffalo Ridge WRA, and (2) to relate the deaths by species to the relative abundance of each species, and to other parameters such as turbine characteristics and habitat. Mortality is measured by estimating the number of avian carcasses in the wind plant area whose death could be directly related to turbines. All carcasses located within areas surveyed are record-
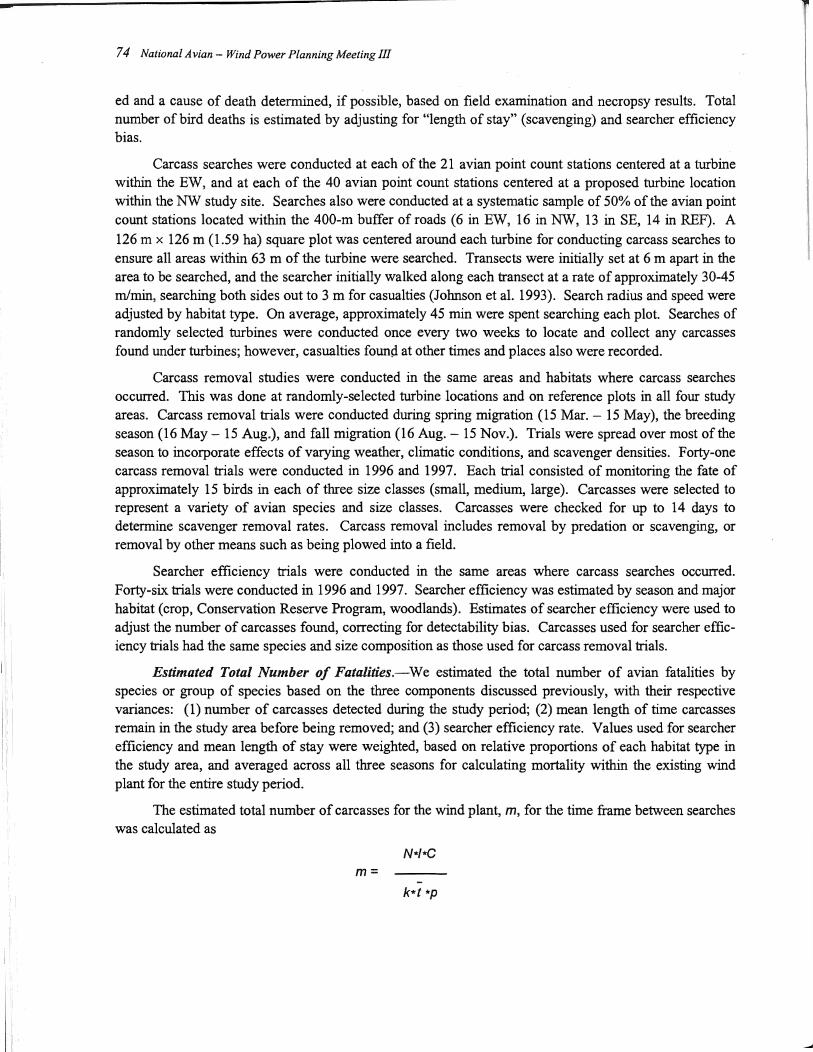
-74 National Avian - Wind Power Planning Meeting III
ed and a cause of death determined, if possible, based on field examination and necropsy results. Total number of bird deaths is estimated by adjusting for "length of stay" (scavenging) and searcher efficiency bias.
Carcass searches were conducted at each of the 21 avian point count stations centered at a turbine within the EW, and at each of the 40 avian point count stations centered at a proposed turbine location within the NW study site. Searches also were conducted at a systematic sample of 50% of the avian point count stations located within the 400-m buffer of roads (6 in EW, 16 in NW, 13 in SE, 14 in REF). A 126 m x 126 m (1.59 ha) square plot was centered around each turbine for conducting carcass searches to ensure all areas within 63 m of the turbine were searched. Transects were initially set at 6 m apart in the area to be searched, and the searcher initially walked along each transect at a rate of approximately 30-45 mlmin, searching both sides out to 3 m for casualties (Johnson et al. 1993). Search radius and speed were adjusted by habitat type. On average, approximately 45 min were spent searching each plot. Searches of randomly selected turbines were conducted once every two weeks to locate and collect any carcasses found under turbines; however, casualties found at other times and places also were recorded.
Carcass removal studies were conducted in the same areas and habitats where carcass searches occurred. This was done at randomly-selected turbine .locations and on reference plots in all four study areas. Carcass removal trials were conducted during spring migration (15 Mar. - 15 May), the breeding season (16 May - 15 Aug.), and fall migration (16 Aug. - 15 Nov.). Trials were spread over most of the season to incorporate effects of varying weather, climatic conditions, and scavenger densities. Forty-one carcass removal trials were conducted in 1996 and 1997. Each trial consisted of monitoring the fate of approximately 15 birds in each of three size classes (small, medium, large). Carcasses were selected to represent a variety of avian species and size classes. Carcasses were checked for up to 14 days to determine scavenger removal rates. Carcass removal includes removal by predation or scavenging, or removal by other means such as being plowed into a field.
Searcher efficiency trials were conducted in the same areas where carcass searches occurred. Forty-six trials were conducted in 1996 and 1997. Searcher efficiency was estimated by season and major habitat (crop, Conservation Reserve Program, woodlands). Estimates of searcher efficiency were used to adjust the number of carcasses found, correcting for detectability bias. Carcasses used for searcher efficiency trials had the same species and size composition as those used for carcass removal trials.
Estimated Total Number of Fatalities.-We estimated the total number of avian fatalities by species or group of species based on the three components discussed previously, with their respective variances: (1) number of carcasses detected during the study period; (2) mean length of time carcasses remain in the study area before being removed; and (3) searcher efficiency rate. Values used for searcher efficiency and mean length of stay were weighted, based on relative proportions of each habitat type in the study area, and averaged across all three seasons for calculating mortality within the existing wind plant for the entire study period.
The estimated total number of carcasses for the wind plant, m, for the time frame between searches was calculated as
m=
Birds on Buffalo Ridge WRA, Minn. / MD. Strickland et al. 75
where N is the total number of turbines, k is the number of turbines sampled, I is the interval between
searches in days, C is the total number of carcasses detected for the period of study, t is the mean length of time carcasses remain in the study area before being removed, and p is the searcher efficiency.
Results and Discussion
Bird Use.-A total of 188 species of birds were documented in the Buffalo Ridge study area from 15 March through 15 November 1996-1997 during avian surveys and general wildlife observations. Four species listed as threatened or endangered (T&E) by the State of Minnesota and/or U.S. Fish and Wildlife Service were observed in the study area during standardized surveys and general observations: Peregrine Falcon (n=5), Bald Eagle (n=23), Wilson's Phalarope (n=2), and Loggerhead Shrike (n=4). All observations of T &E species occurred during the spring or fall migration and were likely migrants through the study area; no evidence of breeding by any of these species was documented in the study area.
A total of 146 species were documented during 11,765 observations including 36,308 bird sightings while conducting PSB surveys on all four study areas on Buffalo Ridge in 1996 and 1997. For the entire Buffalo Ridge study area, avian diversity was highest in the summer (2.96 species/survey), followed by spring (1.88), and fall (l.40), whereas avian use was higher in the fall (9.36/survey) than in the spring (6.34/survey) or summer (5.63/survey) (Table 1). The three most numerous avian groups during the spring period were blackbirds, sparrows, and waterfowl. In summer, sparrows, blackbirds and swallows were most numerous, and during fall, sparrows, blackbirds, and waterbirds were the three most numerous groups.
Fifty species were identified during 1556 observations including 12,767 bird sightings while conducting RLB surveys in the Buffalo Ridge study area from 15 March through 15 November 1996-1997. Avian diversity was highest in the spring (2.3 species/survey) and lower but similar in the fall (1.7 species/survey) and summer (1.6 species/survey) (Table 1). Avian use was highest in fall (22.3/survey), followed by spring (16.7/survey) and summer (4.4/survey). The three most abundant bird groups during the spring period were waterfowl, waterbirds, and shorebirds. In summer, raptors were the most abundant group, followed by waterfowl and corvids. During fall surveys, waterbirds, waterfowl, and corvids were the three most abundant groups.
Flight Heights Relative to Turbines.-Observations were made of29,049 flying birds during PSB surveys on Buffalo Ridge in 1996 and 1997. Flight height data were examined separately for two different rotor-swept areas (Turbine A and Turbine B) due to different turbine heights and rotor-swept areas present in Phase I and proposed for Phase II. The rotor-swept area of Turbine A of 33 m diameter is 19.5 to 52.5 m above ground, while the rotor-swept area of the larger Turbine B of 48 m diameter is farther above ground (26 to 74 m). For Turbine A, 26% of all flying birds observed were within the height band corresponding to the rotor-swept area. For Turbine B, 16% were within the rotor-swept height band (Table 2). For all species combined, there was no significant difference (P"? 0.10) in the proportion of birds observed within the rotor-swept area of Turbine A and Turbine B. However, for rap tors and passerines, significantly higher proportions of flight heights were within the rotor swept area of Turbine A than of Turbine B. Bird groups most often observed flying within the rotor-swept area were waterbirds, waterfowl, corvids, raptors, and sparrows.
Observations were made of 8163 flying birds during RLB surveys on Buffalo Ridge in 1996 and 1997. Forty-seven percent of all birds were flying within the height band corresponding to the rotorswept area of Turbine A, and 36% were flying within the height band swept by Turbine B. For all species
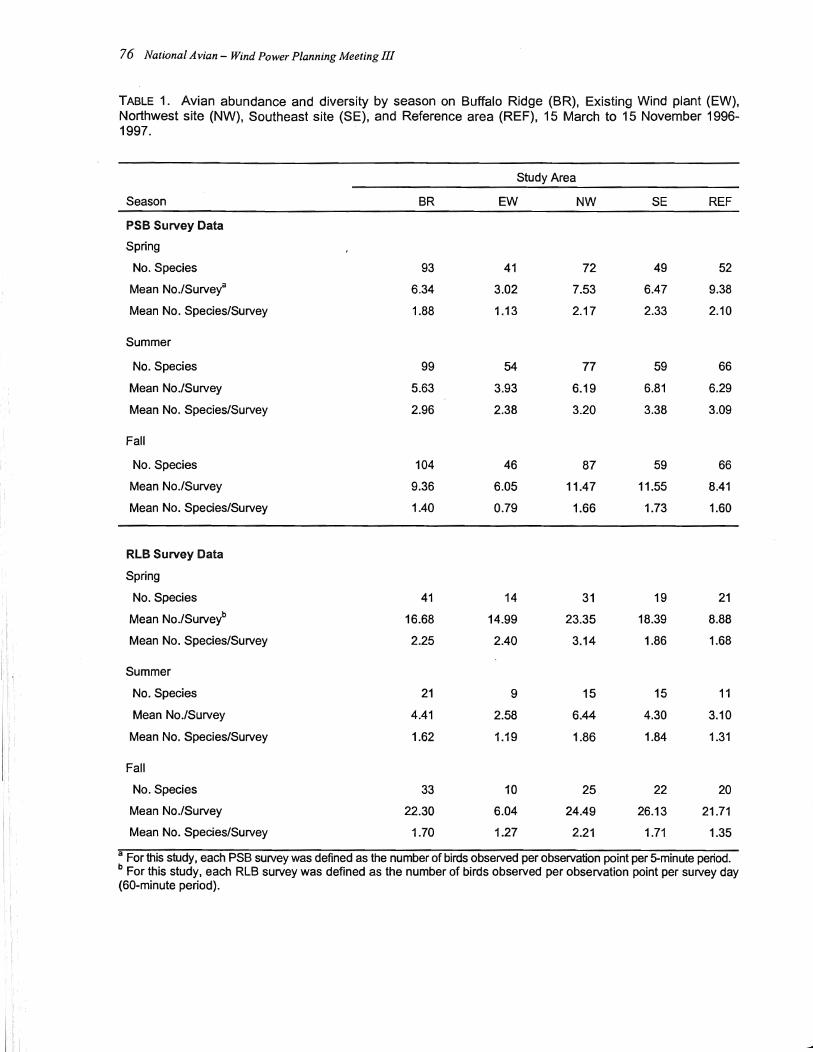
76 National Avian - Wind Power Planning Meeting III
TABLE 1. Avian abundance and diversity by season on Buffalo Ridge (BR), Existing Wind plant (EW), Northwest site (NW), Southeast site (SE), and Reference area (REF), 15 March to 15 November 1996-1997.
Study Area
Season BR EW NW SE REF
PSB Survey Data
Spring
No. Species 93 41 72 49 52
Mean No./Surveya 6.34 3.02 7.53 6.47 9.38
Mean No. Species/Survey 1.88 1.13 2.17 2.33 2.10
Summer
No. Species 99 54 77 59 66
Mean No./Survey 5.63 3.93 6.19 6.81 6.29
Mean No. Species/Survey 2.96 2.38 3.20 3.38 3.09
Fall
No. Species 104 46 87 59 66
Mean No./Survey 9.36 6.05 11.47 11.55 8.41
Mean No. Species/Survey 1.40 0.79 1.66 1.73 1.60
RLB Survey Data
Spring
No. Species 41 14 31 19 21
Mean No./Survet 16.68 14.99 23.35 18.39 8.88
Mean No. Species/Survey 2.25 2.40 3.14 1.86 1.68
Summer
No. Species 21 9 15 15 11
Mean No./Survey 4.41 2.58 6.44 4.30 3.10
Mean No. Species/Survey 1.62 1.19 1.86 1.84 1.31
Fall
No. Species 33 10 25 22 20
Mean No./Survey 22.30 6.04 24.49 26.13 21.71
Mean No. Species/Survey 1.70 1.27 2.21 1.71 1.35
a For this study, each PSB survey was defined as the number of birds observed per observation point per 5-minute period. b For this study, each RLB survey was defined as the number of birds observed per observation point per survey day (60-minute period).
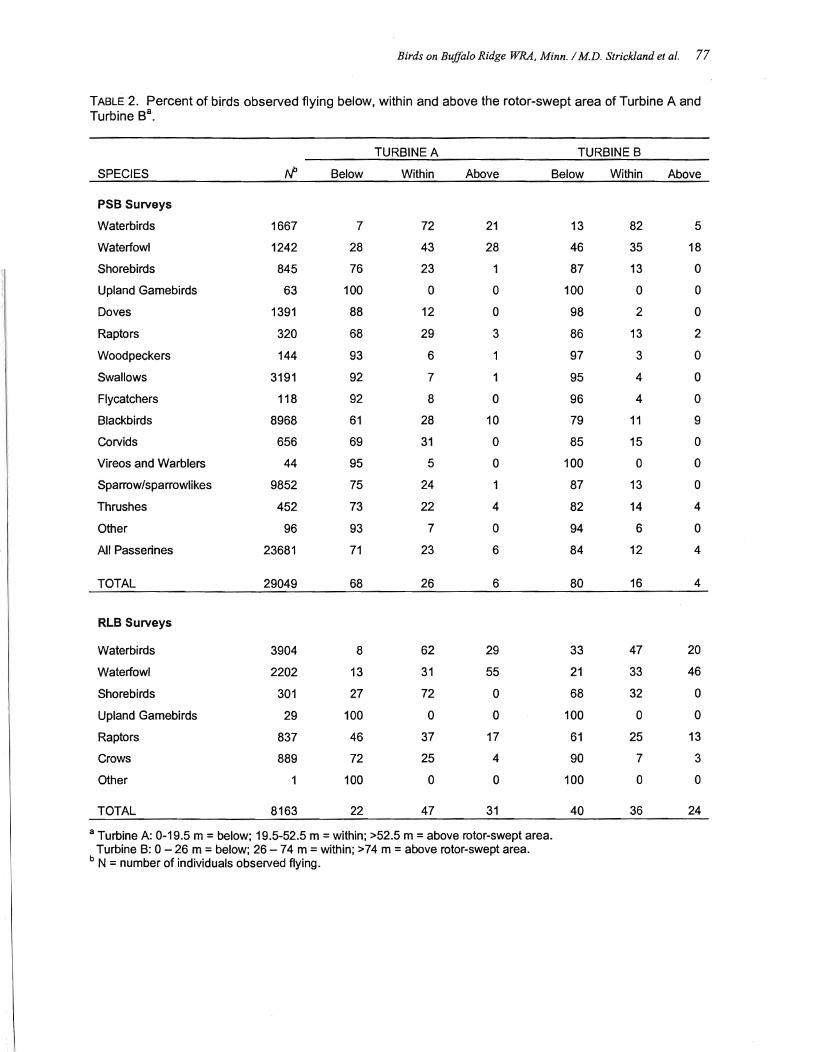
Birds on Buffalo Ridge WRA, Minn. I MD. Strickland et al. 77
TABLE 2. Percent of birds observed flying below, within and above the rotor-swept area of Turbine A and Turbine Sa.
TURBINE A TURBINE B
SPECIES Below Within Above Below Within Above
PSB Surveys
Waterbirds 1667 7 72 21 13 82 5
Waterfowl 1242 28 43 28 46 35 18
Shorebirds 845 76 23 1 87 13 0
Upland Gamebirds 63 100 0 0 100 0 0
Doves 1391 88 12 0 98 2 0
Raptors 320 68 29 3 86 13 2
Woodpeckers 144 93 6 97 3 0
Swallows 3191 92 7 95 4 0
Flycatchers 118 92 8 0 96 4 0
Blackbirds 8968 61 28 10 79 11 9
Corvids 656 69 31 0 85 15 0
Vireos and Warblers 44 95 5 0 100 0 0
Sparrow/sparrowlikes 9852 75 24 87 13 0
Thrushes 452 73 22 4 82 14 4
Other 96 93 7 0 94 6 0
All Passerines 23681 71 23 6 84 12 4
TOTAL 29049 68 26 6 80 16 4
RLB Surveys
Waterbirds 3904 8 62 29 33 47 20
Waterfowl 2202 13 31 55 21 33 46
Shorebirds 301 27 72 0 68 32 0
Upland Gamebirds 29 100 0 0 100 0 0
Raptors 837 46 37 17 61 25 13
Crows 889 72 25 4 90 7 3
Other 1 100 0 0 100 0 0
TOTAL 8163 22 47 31 40 36 24
a Turbine A: 0-19.5 m = below; 19.5-52.5 m = within; >52.5 m = above rotor-swept area. Turbine B: 0 -26 m = below; 26 -74 m = within; >74 m = above rotor-swept area.
b N = number of individuals observed flying.
78 National Avian - Wind Power Planning Meeting III
combined, significantly more (P < 0.10) birds were observed flying within the rotor-swept height band of Turbine A than of Turbine B. Avian groups that had a significantly higher proportion of flight heights within the rotor-swept zone of Turbine A than Turbine B were raptors, shorebirds and corvids; there were no differences between turbine types for waterbirds or waterfowl. Bird groups most often observed flying within the rotor-swept heights were shorebirds, waterbirds, raptors, and waterfowl. Based on preliminary data, it appears that the larger Turbine B may pose less risk to some groups of birds than the smaller Turbine A in this study area.
Relative Risk.-Indices of relative risk were calculated for different species and turbine types based on mean abundance adjusted for visibility bias, proportion of daily activity budget spent flying, and proportion of flights at rotor heights. Based on this index for PSB survey data, species most likely to collide with Turbine A during spring, in order, are Red-winged Blackbird, Lapland Longspur, Homed Lark, Common Grackle, and Yellow-headed Blackbird. Species at greatest risk from Turbine B in spring are Lapland Longspur, Red-winged Blackbird, Homed Lark, Greater White-fronted Goose, and Snow Goose. During the summer, species at greatest risk from Turbine A are Red-winged Blackbird, Cliff Swallow, Homed Lark, Common Grackle, and Barn Swallow, whereas those species at greatest risk from Turbine B are Red-winged Blackbird, Barn Swallow, ,Homed Lark, Common Grackle, and Bobolink. During the fall season, Homed Lark, Lapland Longspur, European Starling, Red-winged Blackbird, and Franklin's Gull are at greatest risk from Turbine A, and Homed Lark, Lapland Longspur, European Starling, Franklin's Gull and Double-crested Cormorant are at greatest risk from Turbine B. Using data collected during RLB surveys, species or groups most likely to collide with Turbine A in spring are Franklin's Gull, Canada Goose, sandpipers, Snow Goose and Mallard, while those species at greatest risk from Turbine B are Snow Goose, Canada Goose, Franklin's Gull, Double-crested Cormorant, and sandpipers. During the summer, Mallard, American Crow, Red-tailed Hawk, sandpipers, and Swainson's Hawk are at greatest risk from Turbine A, and Red-tailed Hawk, sandpipers, Mallard, Swainson's Hawk, and American Crow are at greatest risk from Turbine B. Species at greatest risk from Turbine A in fall are Franklin's Gull, Double-crested Cormorant, Canada Goose, American Crow, and Mallard; those species at greatest risk from Turbine B in fall are Franklin's Gull, Double-crested Cormorant, Canada Goose, Snow Goose, and Ring-billed Gull. This analysis is based on observations of birds during the daylight period and does not take into consideration flight behavior or abundance of nocturnal migrants or residents. This index also does not take into consideration varying ability among species to detect and avoid turbines, habitat selection, and other factors that may influence risk. Therefore, the actual risk may be lower or higher than indicated by this index.
Bird Fatalities.-Twenty-nine bird fatalities were found by WEST personnel in 1996 and 1997 during 1705 person-hours of searching, of which approximately 490.5 person-hours were spent searching plots in association with turbines in the EW. Of these 29 deaths, eight were intact carcasses, nine were scavenged carcasses, and 12 were feather spots. Six of the fatalities were associated with turbines within the existing wind plant and were considered turbine fatalities. Two fatalities in the NW area appeared to have involved collisions with guy wires on meteorological towers; the remaining 21 fatalities were not associated with turbines or other wind plant features and were treated as reference mortality. The six turbine fatalities included a Bam Swallow, Dickcissel, Lincoln's Sparrow, Herring Gull, Ruby-crowned Kinglet, and Pied-billed Grebe. For all four study areas, searcher efficiency averaged 35.3%, and mean length of stay for carcasses before being removed or consumed by scavengers was 6.43 days. Total avian fatalities in the existing wind plant were estimated to be 120 (90% CI=10-228) during the 1996 study period and 79 (90% CI = 3-164) during the 1997 study period. The resulting estimated fatality rate was 1.4 birds per turbine during the entire 7-month study period in 1996, and 1.1 birds per turbine during the
Birds on Buffalo Ridge WRA, Minn. / MD. Strickland et at. 79
entire 8-month study period in 1997. Based on data collected in 1996 and 1997, turbine-related avian mortality appears to be relatively low on Buffalo Ridge.
Results of the first two years of monitoring indicate that the monitoring protocol used for this study is sufficient to provide the data required to evaluate effects of wind power development on birds. Variability observed in the first year data was greatly reduced with the addition of 1997 data. Future data collection planned for the 1998 and 1999 field seasons will allow for even more accurate determinations of avian abundance and composition, habitat use, risk of turbine collisions, and turbine-related mortality on the Buffalo Ridge WRA.
Literature Cited
Anderson, R.L., J. Tom, N. Neumann, J. Noone and D. Maul. 1996. Avian risk assessment methodology. p.74-87 In: Proc. Nat. Avian - Wind Power Plan. Meet. II, Palm Springs, CA, Sept. 1995. Prepared for Avian Subcommit. of Nat. Wind Coord. Commit. by RESOLVE Inc., Washington, DC, and LGL Ltd., King City, Ont. 152 p. Available at www.nationalwind.org/pubs/avian95/default.htm
Green, R.H. 1979. Sampling design and statistical methods for environmental biologists. John Wiley & Sons, New York. 257 p.
Johnson, G.D., H.O. Krueger and R.T. Balcomb. 1993. Effects on wildlife of Brace lOG applications to com fields in south-central Iowa. Environ. Toxicol. Chern. 12: 1733-1739.
Johnson, G.D., W.P. Erickson, M.D. Strickland, M.F. Shepherd and D.A. Shepherd. 1998. Avian monitoring studies, Buffalo Ridge, Minnesota Wind Resource Area, 1996-1997. Rep. from WEST Inc., Cheyenne, WY, for Northern States Power Co., Minneapolis, MN. 178 p.
Manly, B.F.J., L. McDonald and D. Thomas. 1993. Resource selection by animals - statistical design and analysis for field studies. Chapman & Hall, London, U.K. 177 p.
Strickland, M.D., W.P. Erickson and L.L. McDonald. 1996. Final draft, avian monitoring studies, Buffalo Ridge Wind Resource Area, Minnesota. Rep. from WEST Inc., Cheyenne, WY, for Northern States Power Co., Minneapolis, MN. 27 p.
General Discussion
Questions about this presentation concerned methodological issues. An attendee asked whether the influence of ponds on bird activity and distribution was considered. Dr. Strickland noted that ponds were one of several vegetationlhabitat concerns. They decided to randomize rather than stratify the sampling design because ponds and crop types would change over the course of the study. Another participant asked about the accuracy of observers' visual estimates of distances and altitudes. The turbine and meteorological towers (of known height) were used as reference gauges. However, Strickland agreed that the height values were estimates subject to some error. Finally, there was a question as to whether the authors considered the study protocol adequate to address cumulative impacts. Dr. Strickland indicated that, because of the design and anticipated length of the study, the protocol was adequate.
Summary
Avian Issues in the Development of Wind Energy in Western Minnesota
by
JoAnn M Hanowski and Rita Y Hawrot
University of Minnesota-Duluth 1
Our objective was to assess avian populations and distributions in western Minnesota and to identify issues that should be considered in the development of wind energy in this region. The assessment was completed for three wind tiers that were identified based on their potential to develop wind energy. Tier 1 was identified to have the highest and Tier 3 the lowest potential for wind energy development. An annotated bibliography of national and international sources was compiled to identify factors that may affect avian activity relative to wind power development. Based on this information and other local concerns, we identified avian issues that we felt would be most important to consider when developing wind energy on a regional scale. We assessed (1) abundance and distribution of breeding and wintering birds, (2) occurrence of endangered and threatened species, and (3) migration patterns of birds.
Several sources of information document avian use of this region. Information on breeding bird populations was summarized from 10 sources in 43 counties within the three wind tiers. Breeding bird data were obtained from Breeding Bird Survey (BBS) routes, surveys of Conservation Reserve Program (CRP) habitats, and other regional studies. Data on breeding waterfowl distribution and species composition in this region were provided by the U.S. Fish and Wildlife Service. Nest records for colonial waterbirds (herons, egrets) were obtained from the Minnesota Natural Heritage program. Other information was gathered from The Loon, the journal of the Minnesota Ornithologists' Union, and from personal records of accomplished birders. The most recent breeding locations of endangered, threatened or special concern (ETS) bird species, as defined by federal or state authorities, were provided by staff of the Minnesota Natural Heritage and Nongame Research Program. Additional location data for rare bird species were found in the Minnesota Natural Heritage Information System, records of local amateur ornithologists, and seasonal summaries in The Loon. Patterns and timing of waterfowl and passerine migration were compiled from published reports as well as personal communication with several state and national organizations. Information on fall and spring raptor and passerine migration was available in The Loon. Winter distributions of raptors and passerines were compiled by county from Christmas Bird Counts.
Additional research was required to document migratory bird distribution in this region. We used a portable radar unit to document bird migration activity on 18 sites in the three wind tiers over four seasons. We found that migratory activity was quite variable and inconsistent over time across sites. This variation is likely due to several factors including weather and landscape features that vary daily, seasonally, and from year to year. For example, the amount and distribution of water from snowmelt affected spring migration activities. This landscape feature determines stopover and staging areas for shorebirds and waterfowl. In addition, local cropping patterns, in terms of species planted, harvest method and harvest timing, also affected daily and long-range movements of birds. Both snowmelt and cropping patterns affected migration patterns of birds in this region, and neither is easily predicted.
1 Center for Water and the Environment, Natural Resources Research Institute, University of Minnesota-Duluth, 5013 Miller Trunk Highway, Duluth, MN 55811. Phone: 218-720-4311. E-mail: [email protected]
80
I J
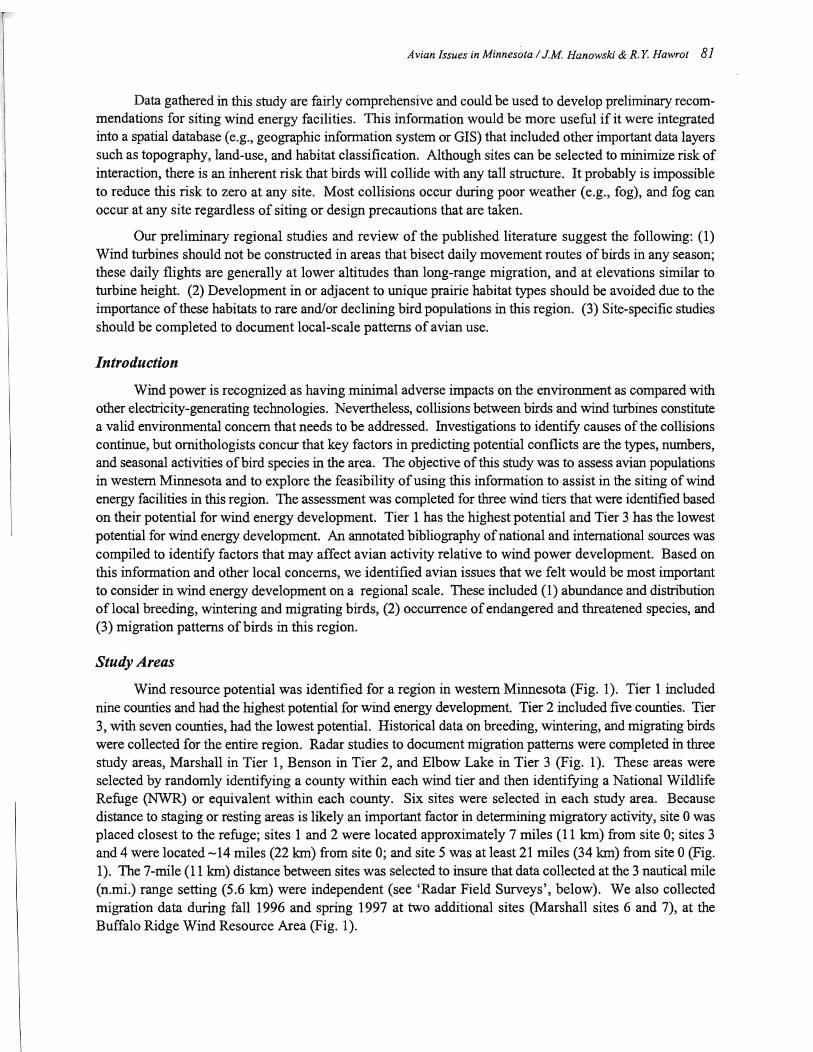
Avian Issues in Minnesota / J.M. Hanowski & R. Y. Hawrot 81
Data gathered in this study are fairly comprehensive and could be used to develop preliminary recommendations for siting wind energy facilities. This information would be more useful if it were integrated into a spatial database (e.g., geographic information system or GIS) that included other important data layers such as topography, land-use, and habitat classification. Although sites can be selected to minimize risk of interaction, there is an inherent risk that birds will collide with any tall structure. It probably is impossible to reduce this risk to zero at any site. Most collisions occur during poor weather (e.g., fog), and fog can occur at any site regardless of siting or design precautions that are taken.
Our preliminary regional studies and review of the published literature suggest the following: (1) Wind turbines should not be constructed in areas that bisect daily movement routes of birds in any season; these daily flights are generally at lower altitudes than long-range migration, and at elevations similar to turbine height. (2) Development in or adjacent to unique prairie habitat types should be avoided due to the importance of these habitats to rare and/or declining bird populations in this region. (3) Site-specific studies should be completed to document local-scale patterns of avian use.
Introduction
Wind power is recognized as having minimal adverse impacts on the environment as compared with other electricity-generating technologies. Nevertheless, collisions between birds and wind turbines constitute a valid environmental concern that needs to be addressed. Investigations to identify causes of the collisions continue, but ornithologists concur that key factors in predicting potential conflicts are the types, numbers, and seasonal activities of bird species in the area. The objective of this study was to assess avian popUlations in western Minnesota and to explore the feasibility of using this information to assist in the siting of wind energy facilities in this region. The assessment was completed for three wind tiers that were identified based on their potential for wind energy development. Tier 1 has the highest potential and Tier 3 has the lowest potential for wind energy development. An annotated bibliography of national and intemational sources was compiled to identify factors that may affect avian activity relative to wind power development. Based on this information and other local concerns, we identified avian issues that we felt would be most important to consider in wind energy development on a regional scale. These included (1) abundance and distribution of local breeding, wintering and migrating birds, (2) occurrence of endangered and threatened species, and (3) migration patterns of birds in this region.
Study Areas
Wind resource potential was identified for a region in western Minnesota (Fig. 1). Tier 1 included nine counties and had the highest potential for wind energy development. Tier 2 included five counties. Tier 3, with seven counties, had the lowest potential. Historical data on breeding, wintering, and migrating birds were collected for the entire region. Radar studies to document migration patterns were completed in three study areas, Marshall in Tier 1, Benson in Tier 2, and Elbow Lake in Tier 3 (Fig. 1). These areas were selected by randomly identifying a county within each wind tier and then identifying a National Wildlife Refuge (NWR) or equivalent within each county. Six sites were selected in each study area. Because distance to staging or resting areas is likely an important factor in determining migratory activity, site 0 was placed closest to the refuge; sites 1 and 2 were located approximately 7 miles (11 lan) from site 0; sites 3 and 4 were located -14 miles (22 lan) from site 0; and site 5 was at least 21 miles (34 km) from site 0 (Fig. 1). The 7-mile (11 km) distance between sites was selected to insure that data collected at the 3 nautical mile (n.mi.) range setting (5.6 lan) were independent (see 'Radar Field Surveys', below). We also collected migration data during fall 1996 and spring 1997 at two additional sites (Marshall sites 6 and 7), at the Buffalo Ridge Wind Resource Area (Fig. 1).
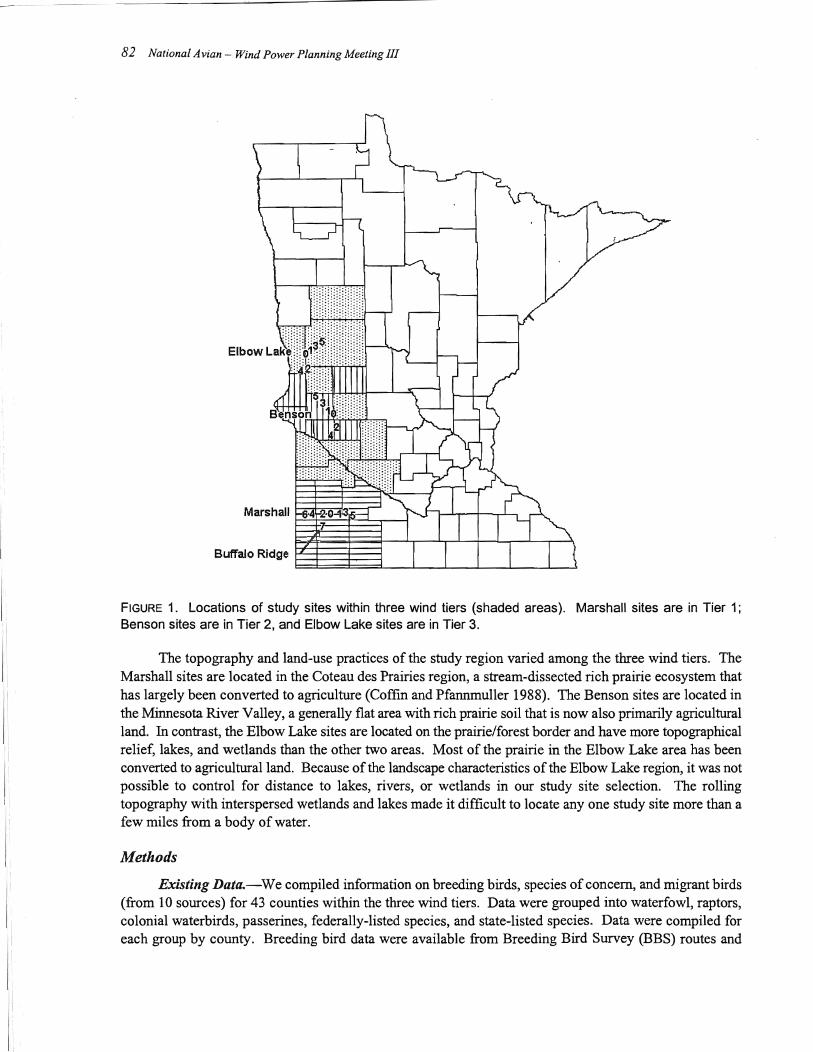
I' ,:
82 National Avian - Wind Power Planning Meeting III
Marshall §~~§~~~~it--.l..,---+--'--'--, Buffalo Ridge ;1;1;[=l=l~±~I~J=J
FIGURE 1. Locations of study sites within three wind tiers (shaded areas). Marshall sites are in Tier 1;
Benson sites are in Tier 2, and Elbow Lake sites are in Tier 3.
The topography and land-use practices of the study region varied among the three wind tiers. The Marshall sites are located in the Coteau des Prairies region, a stream-dissected rich prairie ecosystem that has largely been converted to agriculture (Coffin and Pfannmuller 1988). The Benson sites are located in the Minnesota River Valley, a generally flat area with rich prairie soil that is now also primarily agricultural land. In contrast, the Elbow Lake sites are located on the prairie/forest border and have more topographical relief, lakes, and wetlands than the other two areas. Most of the prairie in the Elbow Lake area has been converted to agricultural land. Because of the landscape characteristics of the Elbow Lake region, it was not possible to control for distance to lakes, rivers, or wetlands in our study site selection. The rolling topography with interspersed wetlands and lakes made it difficult to locate anyone study site more than a few miles from a body of water.
Methods
Existing Data.-We compiled information on breeding birds, species of concern, and migrant birds (from 10 sources) for 43 counties within the three wind tiers. Data were grouped into waterfowl, raptors, colonial waterbirds, passerines, federally-listed species, and state-listed species. Data were compiled for each group by county. Breeding bird data were available from Breeding Bird Survey (BBS) routes and
Avian Issues in Minnesota / J.M Hanowski & R. Y. Hawrot 83
surveys of Conservation Reserve Program (CRP) habitats. Information on birds in hybrid poplar plantations and other habitats in this region, as gathered by the senior author, were included with the breeding bird data. Information on breeding waterfowl and production in the Prairie Pothole Region within Minnesota was provided by the u.s. Fish and Wildlife Service and summarized by Wetland Management District. We also have records for colonial waterbird nest sites (herons, egrets) from the Minnesota Natural Heritage Information System. Additional breeding bird information was gathered from The Loon (the journal of the Minnesota Ornithologists' Union) and from personal records of accomplished birders.
We documented the most recent breeding locations of endangered, threatened, or special concern (ETS) bird species, as identified by federal or state authorities, based on data from the Minnesota Natural Heritage and Nongame Research Program. Additional location data for rare species were found in the Minnesota Natural Heritage Information System database, records of local amateur ornithologists, and seasonal summaries in The Loon.
Migration patterns and timing of waterfowl and passerines were compiled from published reports as well as personal communications with National Wildlife Refuge and Northern Prairie Science Center personnel. Seasonal counts of migratory waterfowl from 1990-1994 within National Wildlife Refuges, Wildlife Management Areas, and other wetland areas in Minnesota were obtained from Minnesota DNR personnel. Estimates of migratory bird numbers within Wetland Management Districts and other National Wildlife Refuges were provided by the U.S. Fish and Wildlife Service. In addition, summaries of fall and spring raptor and passerine migration were compiled from The Loon. We also have information on winter distributions of raptors and passerines by county from Christmas Bird Counts, but did not use this information here.
Radar Field Surveys.-Because detailed migration data were not available across the region, we collected supplemental data with a portable radar system. We used a marine surveillance radar (Furuno Model FR-7111, Furuno Electric Company, Nishinomiya, Japan) with the antenna in a fixed horizontal position and with range settings of 0.75 n.mi. (1.41an, short-range surveillance) and 3.0 n.mi. (5.61an, longrange surveillance). Targets were counted directly off the screen and information was entered on to a laptop computer. Radar field surveys were conducted during four 48-day periods (fall 1995, spring 1996, fa111996, and spring 1997). Dates were chosen to include peak migration dates for a variety of bird species (i.e., waterfowl, passerines, and raptors) based on spring and fall migration from Minnesota and South Dakota (Janssen 1987).
Adverse weather conditions such as rain, fog, and clouds affect migration activity and our design (daily sampling) did not allow us the flexibility to conduct radar surveys only under optimal weather conditions. We accounted for weather effects on migratory activity by collecting multiple samples at each site, including multiple days and time periods, and by using weather variables as covariates to adjust counts. We visited each site eight times in each of the four seasons of sampling. A sample was either 4 hours (fall 1995) or 3.5 hours (spring, fall 1996, and spring 1997) in duration. Data were collected within a 16-hour period that included optimal migration periods (crepuscular, nocturnal, and early diurnal hours). We controlled for observer differences in interpretation of radar screen images by training all field assistants in survey protocol prior to data collection.
Weather data for each study area were obtained from the Minnesota Climatology Office. Variables in this data set included daily precipitation, high and low temperatures, air temperature, dew point temperature, wind speed and direction, barometric pressure, and sky conditions. Weather data at each station were recorded every 20 minutes; therefore, we were able to match weather data and target observation to within 10 minutes.
.J
84 National Avian - Wind Power Planning Meeting III
Data Analyses.-To determine how weather affected migration rates, we used multiple regression models using all-subsets regression. A separate model was created for each season of sampling at both ranges (short and long) for all sampling sites combined. The dependent variable was the natural logarithm of the number oftargets/hr + 1 (i.e., log [#targets/hr + 1]). The number of targets per hour was determined by calculating the sum of targets per observation period, multiplying by 60 minutes/hr, and dividing by the duration of the observation period (expressed in minutes). The independent variables were time and weather variables. On average, weather and time variables explained about 40% of the variation in number of targets observed per hour. The weather and time variables from the regression models were then used as covariates
in subsequent analyses of variance.
We tested two null hypotheses: (1) there is no difference in number of targets among the three wind tiers, and (2) there is no difference in number of targets at a NWR or at three distances away from a NWR. Weather variables determined from the regression analyses were used as covariates in repeated measures analysis of covariance (RMANCOV A) tests for each season and range. Analysis of covariance (ANCOV A) tests a dependent variable for homogeneity of group means after they are adjusted for the effects of independent variables or covariates. This adjustment is carried out through linear regression procedures. ANCOV A requires that, for each covariate, the relationship between the dependent variable (number of bird targets in this analysis) and the covariate must be linear and have the same slope for each group, i.e. for each wind tier (Sokal and Rohlf 1981). An RMANCOV A was used since eight visits were made to each site per sampling period. The repeated measure in these analyses was site visit (n = 8), and the fIxed effect was wind tier (n = 3) or distance (n = 4). We found no significant difference in mean rates between sites (i.e., with distance from wildlife refuge), so sites were grouped together and the effect of wind tier was examined without site interaction.
Results
Breeding Birds.-Data collected at Buffalo Ridge, the site of a 25 MW wind power project, and at the Buffalo Ridge Wind Resource Area (Johnson et al. 1998), indicated that avian abundance was lowest in the summer for all species groups: passerines, shorebirds, other small birds, raptors, waterfowl, and other large birds. Avian groups predicted to be at greatest risk based on summer abundance data were sparrows, blackbirds, swallows, raptors, waterfowl, and corvids (Johnson et al. 1998). Six dead birds were found within the existing windplant area in 1996 and 1997, and these deaths were associated with turbines. Two of the deaths were during the breeding season: a Bam Swallow (Hirundo rustica) and a Dickcissel (Spiza americana). Other dead birds included a Lincoln's Sparrow (Melospiza lincolnii), Herring Gull (Larus argentatus), Ruby-crowned Kinglet (Regulus calendula), and Pied-billed Grebe (Podilymbus podiceps) (Johnson et al. 1998).
Data collected from 1987 through 1994 on 13 species of breeding waterfowl at Wildlife Management Districts (WMD) within our study areas indicated that Tier 3 had the highest number of breeding waterfowl per square mile and that Tier 1 had the lowest (US Fish and Wildlife Service 1995). Habitat-specific breeding bird studies conducted in this region suggest that prairie and conservation reserve lands have the most unique bird communities in comparison with other land-use types (Johnson and Schwartz 1993a,b; Hanowski 1995). In addition, several birds found in these habitats have populations that are declining on a national level (Thompson et al. 1993).
ETS Species.-Data from the Natural Heritage Program indicated that the distribution of endangered, threatened or special concern species was similar among counties within the three wind tiers. The Bald Eagle, a federally-listed threatened species, is the only listed bird species under the Federal Endangered Species Law that has a breeding distribution within the study areas. Two endangered species listed under
~T I i i
Avian Issues in Minnesota / J.M Hanowski & R. Y. Hawrot 85
the Minnesota Endangered Species Law have breeding distributions in the study areas - the Burrowing Owl (Athene cunicularia) is found in Tiers 1 and 2, and the Henslow's Sparrow (Ammodramus henslowii) in Tier I. The Loggerhead Shrike (Lanius ludovicianus) and Upland Sandpiper (Bartramia longicauda), two statelisted threatened species, are found in all three wind tiers. Two state-listed species of special concern, the American Bittern (Botaurus lentiginosus) and Marbled Godwit (Limosafedoa), have breeding distributions in Tiers 2 and 3. The Short-eared Owl (Asio flammeus), also a state species of special concern, breeds only within counties in Tier 2. Colonial nesting waterbirds have breeding colonies in all three tiers.
Regional Migration.-The total number of waterfowl observed during fall migration was highest at Lake Christina, found in Tier 3, and lowest at "Other SW" sampling areas within Tier 1. Canada Goose (Branta canadensis) was the most common goose observed and the Mallard (Anas platyrhynchos) was the most common dabbling duck. The most common diving ducks were Redhead (Aythya americana) in Tier 1, Ring-necked Duck (Aythya col/aris) in Tier 2, and scaup (Aythya spp.) in Tier 3 (MN Dep. Nat. Resour. unpubl. data, 1990).
Radar Data.-Our short-range sampling radius (0.75 n.mi.) primarily sampled single individuals of small-bodied birds such as Tree Swallows (Tachycineta bicolor) and large-bodied birds like the Northern Harrier (Circus cyaneus). The average target detection rate at this setting ranged from 41.8 targetslhr at Benson site 2 to 709.9 targetslhr at Elbow Lake site 2. The lowest average number oftargetslhr occurred during fall 1995, and the highest during fa111996. On a tier-by-tier basis, the average number oftargetslhr across sites ranged from 49.8 to 425.6 targetslhr for Tier 1; 41.8 to 695.7 targetslhr for Tier 2; and 54.6 to 709.9 targetslhr for Tier 3.
The long-range sampling radius (3.0 n.mi.) was selected to document medium- and large-bodied birds such as waterfowl and shorebirds, often in flocks. When the radar was set to survey this range, we were also able to detect flocks of small-bodied birds such as blackbirds. Comparing sites, the average number of targetslhr at this setting ranged from 24.2 at Benson site 4 to 312.9 targetslhr at Marshall site 1. The lowest average number of targets were detected in the fall 1995 survey, and the highest number in the spring 1997 survey. Comparing tiers, the average rates across sites ranged from 29.2 to 312.9 targetslhr for Tier 1; 24.2 to 300.2 targetslhr for Tier 2; and 37.3 to 294.3 targetslhr for Tier 3.
A total of 24 RMANCOV A tests were completed and only one indicated a significant (P < 0.05) difference among the three tiers. A significant tier effect was observed during the spring 1996 season at the 3.0 n.mi. range setting. Tier 3 sites (Elbow Lake) had significantly more targets within 3.0 n.mi. during the spring 1996 season than did Tier 1 or 2 sites. Overall, numbers of targets observed in all tiers were similar at both ranges for all other seasons.
We did not find a significant difference (P> 0.05) between number of targets observed and distance of the site from a NWR or its equivalent. However, during the fall 1995 season there was a non-significant trend for more targets to be observed at the NWR site at both ranges. Similarly, during spring 1996, the lowest numbers of targets observed within both ranges were 21 miles from the NWR site, but again the distance effect was not statistically significant. In other seasons and years, number of targets observed at each site was not related to distance from the NWR site.
Discussion
Identifying avian issues, and then assessing their relative importance on a regional scale, should be the first task completed in the siting of wind energy facilities. This process is complicated because several factors need to be documented and then considered simultaneously to address the key issues adequately. Researchers agree that the key factors that need to be documented to predict potential conflicts are the types,
-
I:'
86 National Avian - Wind Power Planning Meeting III
numbers, and seasonal activities of bird species in the area. A regional assessment should document these avian activities and then use this information to determine the relative risk associated with turbine construction. We discuss our results for this region in Minnesota as they relate to activities of breeding, migrating, and wintering birds, and to the potential risk associated with turbines. Breeding Birds.-Although breeding birds in this region of Minnesota remain specific areas for a longer period (up to two months) than do migrants or many winter residents, breeding birds are likely at low risk to turbine interactions for several reasons. First, they are more stationary than migrant birds because they defend small territories (most less than 1 ha). In addition, daily flights for most breeding species are done below the level of the turbine blades and adverse weather conditions are less likely to contribute to collisions of birds during this season. Finally, population densities are lowest during the breeding season and therefore the probability of bird interaction is also relatively low. Species of Concern and Special Habitats.-Species listed as threatened or endangered by the State of Minnesota and/or U.S. Fish and Wildlife Service are rare or occur at known locations in this part of Minnesota. The risk to ETS species appears to be minimal. ETS species were rarely observed at Buffalo Ridge, MN, study areas, and the ETS few species observed there (e.g., Peregrine Falcon) were recorded during spring migration (Johnson et al. 1998). Prairie and CRP habitats are unique bird habitats in this region and have populations of rare or declining species. Although there is likely not a great risk of these breeding species colliding with turbines, loss of these habitat types to turbine development probably would lead to future popUlation declines.
Migrating and Wintering Birds.-Most migrants fly at altitudes higher than turbines. However, altitude varies in response to changing weather and topography. For example, some night-migrating passerines fly as high as 1000-1500 m or more, but most are lower. Also, they often descend to lower altitudes when visibility is reduced, or when flying into opposing winds, or during the latter part of the night. Day-migrating passerines migrate mostly below 1000 m (Kerlinger and Moore 1989). Waterfowl migration flights can occur throughout the day and night, and vary in altitude from 1 m to greater than 3500 m. Soaring birds (i.e., hawks) rely on thermals and updrafts during the day, and tend to travel at higher altitudes than birds using flapping flight. Shorebirds migrate both during the daytime and at night, and usually travel at higher altitudes than most other species (Kerlinger and Moore 1989). Birds conducting long-range flights during migration likely would not be impacted by turbines except during weather conditions that induce them to fly low, or during takeoff and landing. Occasional lowaltitude flights with unfavorable weather can occur anywhere, and collisions with wind turbines during those flights could not be avoided or mitigated through site selection alone. Collision risk for migrating birds flying low just after takeoff and just before landing could be reduced by not placing tall structures near locations where migratory birds concentrate before migration or during migration. However, migratory birds conducting daily flights from overnight resting to daily feeding areas would likely be at more risk than birds that are actually migrating. For example, the probability of a collision would be high at a windpower facility located near staging areas where birds make frequent flights at low altitudes. Many species such as waders, cranes, and waterfowl show high site fidelity to staging areas and, depending on the species, food availability, and prevailing environmental conditions, may spend several weeks there (Berthold 1993). Wintering birds, especially waterfowl, may also be impacted by turbines if there is open water in the vicinity of the turbines that intersect daily movement routes.
Future Research.-Geographic Information System (GIS) analysis of the surveillance area surrounding individual study sites would provide information on relationships between migratory activity and landscape features (e.g., elevation, area of wetlands) within the study region. If migratory activity is related to landscape variables, a model could be developed to predict migratory activity in the study region.
.,
------------------------- -----------
Avian Issues in Minnesota / J.M_ Hanowski & R. Y. Hawrot 87
In addition, a fonnal risk analysis could be conducted with infonnation gathered in this project. This would be useful for identifying critical avian issues and areas of high wind potential and low avian concern.
Literature Cited
Berthold, P. 1993. Bird migrationiA general survey. Oxford Univ. Press, New York, NY. 239 p.
Coffm, B. and L. Pfannmuller. 1988. Minnesota's endangered flora and fauna. Univ. Minn. Press, Minneapolis, MN.
Hanowski, J.M. 1995. Breeding bird composition and species relative abundance patterns on Conservation Reserve Program (CRP) land in western Minnesota. The Loon 67:12-16.
Janssen, R.B. 1987. Birds in Minnesota. Univ. Minn. Press, Minneapolis, MN.
Johnson, D.H. and M.D. Schwartz. 1993a. The conservation reserve program: habitat for grassland birds. Great Plains Res. 3:273-295.
Johnson, D.H. and M.D. Schwartz. 1993b. The conservation reserve program and grassland birds. Conserv. BioI. 7:934-937.
Johnson, G.D., W.P. Erickson, M.D. Strickland, M. F. Shepherd and D.A. Shepherd. 1998. Draft Report: Avian monitoring studies Buffalo Ridge, Minnesota Wind Resource Area 1996-1997. Rep. from Western Ecosystems Technol. Inc., Cheyenne, WY, for Northern States Power, Minneapolis, MN.
Kerlinger, P. and F.R. Moore. 1989. Atmospheric structure and avian migration. Current Ornithol. 6:109-142.
Sokal, R.R. and F.J. Rohlf. 1981. Biometry. W.H. Freeman & Co., New York, NY.
Thompson, F.R., S.J. Lewis, J. Green and D. Ewert. 1993. Status ofneotropical migrant landbirds in the Midwest: identifying species of management concern. p. 145-158 In: D.M. Finch and P.W. Stangel (eds.), Status and management ofneotropical migratory birds. U.S.D.A. Forest Service Tech. Rep. RM-229.
US Fish and Wildlife Service. 1995. Migratory bird point count report 1994. Fergus Falls, MN.
General Discussion
There were two questions following JoAnn Hanowski's presentation: (1) An attendee asked whether radar scans had been conducted over water, and if these data were gathered particularly with regard for distance from the waterbody and size of the waterbody. Ms. Hanowski answered that, yes, these data were gathered. (2) Another commenter noted that there were only eight observations per site per season. Given the pulsed nature of migration, this person wondered whether there was sufficient statistical power to assess the sites. Ms. Hanowski agreed that this was a concern, but she considered the sampling adequate to assess each site but not the region.
-- ~-~I
I
.J
Wind PowerlBird Interaction Studies in Wisconsin by
Steve,n UgoretzI, Ryan Atwate?, William Fannucchi3 and Gerald BarteltI
lWisconsin Department of Natural Resources 2University of Wisconsin - Green Bay
3public Service Commission of Wisconsin
Up to this date studies of wind power vs. bird issues in Wisconsin have been mostly prospective. When commercial scale development occurs, it will probably look much like development at Buffalo Ridge, in southwestern Minnesota. As of 1998, there were only two large-scale wind turbines in operation in Wisconsin - part of the Low Speed Wind Turbine (LSWT) Verification development program sponsored by the National Renewable Energy Laboratory, EPRI, and the Wisconsin utilities.
Most of the projected wind resource development in Wisconsin is centered along the Niagaran Escarpment, which runs from the Door County peninsula in an arc through Dodge County, in east central Wisconsin. That escarpment is elevated up to 200 fee! above the landscape to the west. The LSWT project is located on the escarpment, near the City of Green Bay. An 11.25 MW "green power" project, to consist of 17 turbines, was proposed by Madison Gas and Electric Company. It considered two sites: one in Calumet County - east of Lake Winnebago, the other in Kewaunee County - at the base of the Door Peninsula. (Subsequently, the project was constructed at the Kewaunee County site. A second, slightly smaller, project sponsored by Wisconsin Public Service Corp., was also installed in a nearby township.)
Other resources that are relevant to bird and bat interactions with wind energy facilities are as follows: Green Bay, to the West of the Escarpment; Lake Michigan - forming the eastern boundary of the state; the Fox River Valley and Lake Winnebago - comprising a major water resource south of Green Bay; and the Horicon Marsh State and National Wildlife Refuges - paralleling the southernmost extension of the escarpment as a distinct landscape feature. There is a major bat hibernaculum, estimated to contain 300,000 bats, at an abandoned underground iron mine at Neda on the face of the escarpment. The last two resources are the ones we are most concerned about protecting.
With that context, what efforts are in place to address the interactions between wind/development and flying vertebrates? First of all, the "we" in this paper is a stakeholder team, mostly consisting of biologists from the Public Service Commission, Department of Natural Resources, U.S. Fish and Wildlife Service, the main investor owned utilities, and the Audubon Society. We are trying to address three issues: land use, aesthetics, and bird/bat mortality. This collaborative group is engaging in two main tasks:
• Gathering data on bird concentration areas, migration corridors and flight patterns, and developing a study of bird movements around the Horicon Marsh.
• Developing a GIS - based map of resource areas that may be relevant to siting decisions.
We have selected five counties in east-central Wisconsin as the focus of the GIS exercise. We use existing GIS layers such as land cover, wetlands, water features, parks, and wildlife areas, and have added information gathered in our survey of bird experts familiar with the area.
1 Wisconsin Department of Natural Resources Energy Team, P.O. Box 7921, 101 S Webster Street, Madison, WI 43707-7921. Phone: 608-266-6673. E-mail: [email protected]
2 University of Wisconsin - Green Bay, 510 Spinnaker Lane, #2, Green Bay, WI 54302. Phone: 920-468-3302. E-mail: [email protected]
3 Public Service Commission of Wisconsin, P.O. Box 7854, Madison, WI 53707.
88
Wind Power/Bird Studies in Wisconsin / Ugoretz et al. 89
The results are being used to delineate areas of higher or lower concern based on the presence of, and likely interactions between, these features and birds and bats. We will recommend that sites proposed within the areas of high concern be given a more thorough environmental review than sites located in low concern areas. This review may involve an Environmental Impact Statement for the former, and an Environmental Assessment or Categorical Exclusion for the latter. (Subsequently, the PSC's EIS rules were amended to require an EA for wind facilities more than 10 MW in size, and subject to PSC authority.) The information we have developed may also provide the basis for a generic EIS on wind energy facilities in the state.
Ryan Atwater, who was a graduate student at the University of Wisconsin - Green Bay, has conducted a study of bird activity around the Horicon Marsh Wildlife Area. The intent was to establish scientifically-based setback distances for wind energy development around such major wildlife aggregations. His results are the subject of another paper.
That study has established the distances from Horicon Marsh within which large numbers of waterfowl may be low enough to be within the rotor-swept area of turbines, and the directions that geese and other birds take in their daily feeding flights. This should be useful in evaluating the potential for future wind power proposals near Horicon Marsh or other such wildlife areas to interact with wildlife. In short, Atwater found that, beyond 8 km from the marsh, most species were well above blade height.
Pre-siting studies of bird activity were done at the 2-turbine facility in the Green Bay area. Carcass searches were done around tall broadcast towers in the area to sample for birds flying through, especially at night. This, in conjunction with the activity studies on the site itself, should give a good picture of the likelihood for significant bird interactions at Wisconsin sites. However, the broadcast towers themselves may be an influence on'bird behavior in the area, which will have to be accounted for in deciding how widely applicable these data really are.
Pre-siting avian data were also gathered in the two areas being considered for the utility project described earlier. Carcass searches were to be conducted during the frrst two years of their operation. [Results show very low levels of bird mortality, but a greater number of bats killed.]
Another, larger wind site has been proposed for western Washington County. That facility would consist of up to 33 large turbines on tubular towers. Activity studies are being conducted at that site, and carcass searches will begin if the facility is developed. The data from this site, and from the recently constructed Kewaunee County installations, should give a good picture of bird and bat interactions with wind turbines in this type oflandscape.
We hope that, with the careful approach we are taking, wind energy development in the state will occur in a manner that considers and minimizes the impacts to flying vertebrates - birds and bats. If development proceeds at a faster pace in the future, we feel that the groundwork we have established will reduce the likelihood of unacceptable levels of wildlife mortality.
General Discussion
Two questions were asked following Steve Ugoretz's presentation - one concerning funding sources, and the other regarding the studies around the radio towers that were near one of the turbine sites. Several agencies provided funding for the studies described above, including Partnerships for Wildlife, and the Wisconsin Departments of Administration, of Natural Resources, and of Renewable Energy. The studies around the radio towers were conducted in 1995, and are not ongoing now.
oJ
..
An Assessment of the Impacts of Green Mountain Power Corporation's Searsburg, Vermont, Wind Power Facility on Breeding and Migrating Birds
Introduction
by
Paul Kerlinger
Curry & Kerlinger, L.L.C. 1
Green Mountain Power Corporation's wind power facility at Searsburg, Vermont, is only the second commercial wind power development to go on-line in the eastern United States and the first in many years. It was permitted in 1995, constructed in 1996-1997, and began operations in 1997. Although there were few objections to its development, environmental organizations and the Vermont Agency of Natural Resources questioned whether the project would impact birds and other wildlife.
The conservation issues relating to birds and wind turbines in New England and elsewhere in the northeastern United States are as follows: destruction of sensitive high elevation forest habitat, forest fragmentation, disturbance of rare nesting forest species, and impacts on migrating hawks and songbirds. High elevation forest habitats are a primary concern because they are sensitive to disturbance, they host species that do not occur elsewhere in the northeast, and they occupy a limited area. Development in these forests can lead to the decline of some species. Forest fragmentation, in particular, has been implicated in the decline of various species of songbirds that migrate to the Neotropics. Many of these species nest in Vermont. By placing developments in large forested tracts, the potential for fragmentation arises. Such fragmentation can change the species composition and the abundance of species that depend on large forested tracts. In addition, there is concern for migrants that pass through the area because large concentrations of migrants are known to occur in some locations. Such concentrations are believed by some to be vulnerable to tall structures, but it is not known if wind turbines put these birds at risk.
A series of studies were conducted in the forests of Searsburg, Vermont, from 1993 to 1997 to predict and assess impacts to birds resulting from the development of a 6 megawatt wind power facility (Kerlinger 1998). The study described here compares pre- and post-construction behavior and abundance of birds that breed on the site, and birds that migrate over the site. Hawks and songbirds were the two primary groups of birds on which this study focused. Also studied was the incidence of bird deaths following construction of the wind plant.
A partial BACI (Before - After, Control - Impact) design was used. BACI methods were recommended in Anderson et al. (1999) - the methods and metrics guide recently released by the National Wind Coordinating Committee (NWCC). A BACI design includes pre- and post-construction studies to examine changes in behavior, abundance, and other ecological measures associated with an impact. A BACI design also includes pre- and post-construction studies on "reference" sites as well as the construction site. These "reference" sites are analogous to controls in true experimental design. In the Vermont project, off-site reference studies were not conducted, but parts of the survey transect for breeding songbirds were well away from the turbines and were not disturbed greatly.
In addition to data gathered during the course of this study, three other data sets from the site were used. These included a study of breeding songbirds and northern goshawks conducted in 1994 (Capen
I Curry & Kerlinger, L.L.C., P.O. Box 453, Cape May Point, NJ 08212. Phone: 609-884-2842. E-mail: [email protected]
90
Impacts on Vermont Birds / P. Kerlinger 91
and Coker 1994), studies of hawk migration in 1993 and 1994 (Martin 1993, 1994), and a study of spring songbird migration (Kerlinger 1995a). These studies were incorporated into the present study as preconstruction data. Identical methods and study sites were used in the 1996 and 1997 work.
The work described in this report was funded by the National Renewable Energy Laboratory STEP Program and Green Mountain Power Corporation. Other partners in the project were Vermont Environmental Research Associates (VERA) and Vermont Department of Public Service.
Project and Site Description
The Searsburg wind power facility consists of 11 Zond (now Enron Windpower) Z-40 turbines that were mounted on tubular towers. Total height to the top of the blade arc was 192 feet or 58.5 m. The site will generate about 7 megawatts of power and supply some 2000 homes with electricity. The turbines are situated in a roughly north to south array that extends for slightly more than 1 km. The turbines are placed at about 2700-2800 ft above sea level (a.s.l.) near the crests of rolling
mountains in the Green Mountain Range. Although some call them ridges, the short, north-south chains of the Green Mountain Range are not linear or long enough to be comparable to true ridges like those of the Appalachian Mountains of Pennsylvania, New York, arid farther south. Hillsides can be relatively steep in places, with slopes of 20% and greater. However, the 11 turbines are placed on the tops of hills, well back from steep hillsides in most cases. None of the peaks within a mile of the site exceed 3000 feet a.s.l., so they are not included in the sensitive, high altitude forest types that concern environmentalists.
The forests consist of typical northern hardwood trees with scattered patches of red spruce/balsam ftr. The latter are at the highest elevations, but occur only as small patches surrounded by hardwood forest. Hardwood trees include yellow birch, American beech, paper birch, red maple, sugar maple, mountain ash, and black cherry (with some hemlock at elevations below the turbines). The forest floor is dominated by Viburnum species, ferns, and saplings of other forest trees. The site is clear-cut on a 40+ year rotation and selectively logged, so it is not mature forest. The maximum height of trees on the hill tops is less than 12 m, whereas the maximum height at lower elevations is as great as 15-20+ m.
Methods
Breeding Birds.-Point counts at 21 sites along a transect were used to determine species composition and abundance. The transect and point counts were established in 1994 by Capen and Coker (1994) along an elevational gradient from the location ofa planned substation, up the mountain, and along the mountain top where turbines were eventually erected. An overgrown logging road/trail was used as the primary transect. Points were positioned such that the fIrst was on the trail, the second was 100 m up the trail and 100 m to the left (perpendicular) of the trail, the next was 100 m further up the trail, the next was 100 m further and to the right of the trail, etc. During each survey, an observer listened and observed at each point for 5 minutes, recording all species and numbers of individuals. Data were kept separate for areas within and outside of a 50 m radius around each point. This permitted estimates of both absolute and relative densities, and separate documentation of birds farther from disturbed areas along the trail.
Two surveys were conducted by Capen and Coker (1994) - one in early June and one in early July 1994. Four surveys were conducted in 1996 and four more in 1997 - two in early June and two in early July. From the four surveys available in 1996 and 1997, two per year were chosen at random for analysis (one from June and one from July). The other data are reported as a means of showing how efftciency at detecting species and individuals increases with the number of visits to a site. After construction, the turbine noise made hearing birds more difficult. Additional surveys were conducted to determine whether
....
92 National Avian- Wind Power Planning Meeting III
noise was important. After construction, songbird behavior near the turbines was recorded by an observer sitting quietly near the forest edge beneath the turbines.
To search for nesting raptors, particularly Northern Goshawks, Capen and Coker (1994) used a tape recording of a goshawk alarm call. This tape was used along transects over an area that included the turbine site and the surrounding hillsides.
Songbird Migration.-Songbird migration studies were conducted at night in spring 1995 (before construction), in autumn 1996 (during construction), and in spring and autumn 1997 (after construction). A ceilometer was used to count and determine flight directions of migrants on 14 nights during each of these migration seasons. Each night, one I-hr watch was conducted during the peak period for migration. Hawk Migration.-Field work consisted of counting and making behavioral observations of migrating hawks from a site down the hill from the wind turbines. This site offered the best view of migrating hawks as they passed the turbines and surrounding landscape. Observations were conducted for 6 hours (09:00-15:00) per day, 20 days per season, during the peak of autumn hawk migration (8 September through 4 November). Pre-construction hawk migration counts were done in autumn 1993 and 1994 (Martin 1993, 1994). Hawk migration counts and behavioral studies during construction were conducted in autumn 1996, and post-construction during autumn 1997. Behavioral observations were made for each migrant or flock. Included were measurements of altitude above the landscape, flight direction in one of 8 cardinal directions, type of flight, and sector over the ground. The viewing area was divided into four sectors including the hillside to the west of the turbines, the valley in which the observer was situated, the hillside on the east of the valley and just below the turbines, and the hilltop on which the turbines were located. This was done to assess the number and proportion of passing birds that flew in the highest risk area vs. other areas.
Carcass Searches.-Searches for dead birds were conducted during the spring, summer, and autumn of 1997 (post-construction). A total of 21 searches, including four turbines per search, were conducted on 15 days from 3 June to 18 October. A rotation sequence was used such that each of the 11 turbines was visited an equal number of times throughout this period. Surveys were more frequent during the autumn migration season, when they were done on approximately a once-weekly basis. This was when more fatalities were expected. During each survey around a turbine, the cleared area beneath the turbine (20 to 45 m in radius) was searched, along with the adjacent forested edge to a depth of 10 m. In some places the spruces were too thick for the observer to penetrate. Thirty minutes of searching time was spent per turbine per search, during which time an observer systematically walked slowly back and forth across the search area.
Observer Efficiency and Scavenging.-An efficiency study was conducted using 10 songbird carcasses (warblers, vireo, sparrows, woodcock, jay, robin, thrush, and kinglet spp.) scattered randomly around two groups of 4 turbines. Carcasses for this study were marked with a twist tie on a tarsus, to distinguish them from any turbine kills. Each of the two observers then conducted standard searches for the carcasses. The efficiency rate was determined by dividing the number of carcasses found by the number placed out.
The scavenging study was accomplished via tests in July and September. In each of those months, 20 carcasses, again marked with twist ties, were placed under four turbines. In both tests, 5 birds were placed randomly under each of four turbines. The 20 carcasses set out in July were checked on the two days after they were put out, then two months later, and then another month later. The second group of 20 carcasses were put out during September at a separate group of four turbines, and were checked weekly for more than one month.
,.
Impacts on Vermont Birds / P. Kerlinger 93
Results and Discussion
Breeding Birds.-A total of 42 species of birds, mostly songbirds, were detected during the three years of surveys. This includes species observed on third and fourth sampling days. The number of species observed within the 50 m radius was 22 before construction, and 25 during and after construction. This represents a minor overall increase; however, species richness increased at some point count sites and decreased at others. At the point count sites nearest the turbine sites, the numbers of species decreased. Also, the abundance of several species declined - for example, Swainson's Thrush, Red-eyed Vireo, Ovenbird, Black-throated Blue Warbler, and Canada Warbler. After construction, these species occasionally were heard deep in the forest, but not near turbine sites where they had been previous to construction activity. For the most part, these species are interior forest specialists, listed as species of concern in some areas of the northeastern United States, and watch-listed by the National Audubon Society.
At other points along the transect, increases in species richness were noted. Some of the increases were attributable to the presence of edge species, such as American Robin and Blue Jay. These species were recorded at higher elevations after clearing and construction than prior to construction. Interestingly, Brown-headed Cowbirds and American Crows did not increase in numbers and were rarely seen after construction. Bicknell's Thrush, a high-elevation species of concern throughout its range, was detected in very small numbers where spruce-fir habitat was densest. After construction, it was detected about 100 m off-site.
The most common species on post-construction surveys, in order of descending abundance, were Yellow-rumped Warbler, Slate-colored Junco, White-throated Sparrow, Blackpoll Warbler, and Magnolia Warbler. Most of these species are typical of northern or boreal forests that include a mixture of deciduous and coniferous vegetation. The abundance of these species in many parts of Vermont, according to the Vermont breeding bird atlas (Laughlin and Kibbe 1985), is similar to or less than the abundances measured in this study.
The 1994 survey for Northern Goshawks and other raptors revealed no hawk species nesting on the property. None was detected on adjacent properties either. No hawks were observed on site during the songbird surveys of 1996 and 1997, although a Turkey Vulture was observed after one survey. Sharpshinned Hawks were observed on two occasions during the nesting season in 1997 - one individual about 2 km from the turbines, and another individual about 5 km from the site. This species likely hunts on the site occasionally. The habitat on site could provide nest sites for the Sharp-shinned Hawk and, perhaps, the Broad-winged Hawk.
Concern for the decline of forest interior songbirds is an issue that is attracting increasing attention. If turbine construction reduces the amount of suitable nesting habitat, as suggested by some of the study data, mitigation may be necessary. Because the roadside edges and clearings around the turbines have attracted some edge species, even within only one year of clearing, it is important that these habitats be managed properly. Allowing roadside edges to revert to brush and small trees should be a very high priority. These areas will become less attractive to edge species, including parasitic and predatory species such as cowbirds, Blue Jays, and crows. Brush cutting can be done on a 3-5 year rotation. Green Mountain Power has agreed that these areas will be allowed to grow into a brushy forest type of vegetation to discourage edge species and to encourage foraging and/or nesting in the area adjacent to turbines by interior forest songbirds. These birds do not seem to be at risk with colliding with revolving blades because they seldom fly above the canopy, except during migration.
94 National Avian- Wind Power Planning Meeting III
Songbird Migration.-Birds migrating at night were detected and counted via the ceilometer method. Numbers counted per hour before construction were 1.89 during spring 1995 and 4.55 during autumn 1996. After construction, fewer migrants were observed. In spring 1997, only 0.36 birds per hour were observed, and in autumn 0.14 birds per hour. This represents a precipitous decline in the seasons after turbines were erected. Average direction of flight was to the east of north during spring and to the east of south during autumn; both average directions are seasonally appropriate. The numbers of migrants counted before construction are similar to the numbers of birds reported in other studies from inland New England (Northrop et al. 1995a,b). Inland in New England (and elsewhere), songbird migration seems to occur across a broad front, with few concentration locations (Kerlinger 1995b). The numbers of birds seen (via ceilometer) passing over any given site are generally small. This differs from locations farther south where numbers can be much higher. Along the Atlantic coast of New England and southward, concentrations can be much greater than at Searsburg. Two inferences can be made from the results presented above. First, Searsburg is not a concentra
tion point for migrating songbirds. Second, the smaller number of migrants seen after turbines were erected may be a behavioral response to the turbines. It is probable either that birds flew to higher altitudes to avoid the turbines or that they flew around the turbines. The latter is more likely. Flying around (rather than over) is the typical reaction when birds are brought near turbines for the first time (R. Curry, pers. comm.). An alternative explanation that cannot be ruled out is that the smaller numbers of songbird migrants seen after turbine construction resulted from daily or annual fluctuations in numbers of migrants flying over the general area, unconnected with turbine construction. Hawk Migration.-Thirteen species of hawks were counted over all years combined. Red-tailed, Sharp-shinned, and Broad-winged Hawks were the most numerous species. The species mix was the same as at most other inland hawk count stations in the northeastern United States. The only rare, threat
ened, and endangered species encountered were three Bald Eagles and one Peregrine Falcon. No Golden Eagles were observed.
The total numbers of migrating hawks recorded during 20 days within each autumn season ranged from fewer than 100 to more than 500. The highest total counts were made during 1993-94. In 1996, total numbers were about 20% lower than in either 1993 or 1994. During autumn 1996, construction was underway, with a few turbines up but not operational. In 1997, the total count was less than 100 hawks. Although annual variation in counts of migrating hawks is often large, the decline in 1997 was greater than expected. Without many more years of comparable data, there is no way to test whether the variation was random.
The overall numbers of migrating hawks observed during this study were very small in comparison to the tens of thousands counted at hawk migration concentration sites in the northeastern United States and reported annually in Hawk Migration Studies, the journal of the Hawk Migration Association of North America. However, the numbers counted at Searsburg are similar to those evident at most "nonconcentration" sites in Vermont (Kerlinger 1998) and elsewhere in New England and northern New York (pers. obs.; Kerlinger 1989).
Prior to construction, the majority of the migrating hawks flew at altitudes greater than 200 ft (61 m) above ground level (a.g.l.), i.e., higher than the turbines. These are typical altitudes for most species of migrating hawks in the northeastern United States (Kerlinger 1989). Sharp-shinned Hawks flew, on average, at somewhat lower altitudes than the other common species, as is typical elsewhere. Of those hawks that flew through the turbine sector prior to construction, 22% of Sharp-shins and 17% of other species were within 200 feet of the ground. Considering all sectors, a maximum of only 10% of all
Impacts on Vermont Birds / P. Kerlinger 95
Sharp-shinned Hawks, and fewer than 5% of all other hawks, flew through the risk area (turbine sector at <200 ft a.g.l.). After construction, too few hawks were observed migrating through the turbine sector for meaningful comparisons with the pre-construction data.
There was evidence that some hawks avoided the area of the turbines following construction. Before construction, about half of all observed hawks flew over the turbine sector. The other 50% were spread over the other observed sectors. After construction, less than 10% of the observed migrating hawks were counted over the turbine sector. This observation, and the decline in overall numbers from 1993-94 to 1996 and especially 1997, may indicate avoidance by migrating hawks. An analogous decline was noted for songbird migrants flying at night over the site (see above). During falconry trials around wind turbines, hawks with no previous experience around wind turbines avoided the turbines during initial trials (R. Curry, pers. obs.). It is likely that most migrant hawks observed during this study had never seen a wind turbine before. At least half of all migrants are young of the year, and ,there were no wind power facilities to the north of Searsburg in the eastern U.S. and Canada.
Carcass Searches and Scavenging Study.-Carcass searches revealed no dead birds. It is unlikely that the absence of dead birds was the result of wholescale scavenging, as scavenger studies revealed little scavenging. Two days following the June placement of 20' carcasses, three birds were missing (15%). Two months later, four of the original birds were still present. Others may not have been scavenged, but simply decayed to the point of not being visible. In the September trial, 20% of the birds disappeared within the frrst week and another 15% disappeared the second week. There was no scavenging thereafter. The average observer efficiency rate was 55% (70% and 40% for the two observers).
If many birds were killed by the turbines, the data suggest that a substantial fraction of the carcasses would have been found during the searches. Consequently, it appears that few, if any, birds were killed. It is possible that some smlill birds could fall into the forest, where it would be virtually impossible to find them. The problem of searching for carcasses in wooded areas must be resolved in future studies.
Summary and Conclusions
Overall, study results up to the first post-construction year indicate that the wind turbines had little negative impact on migrating and breeding birds at Searsburg. Very few hawks and songbirds migrate through the general area surrounding the wind turbines, and consequently the risk of fatalities is low. This low mortality was confIrmed by the negative results during carcass searches. The observation of fewer migrants in the area after than before construction suggests avoidance behavior by some birds. However, there has been only one year of post-construction observations. Random variation in migration counts could explain the smaller numbers of migrants in 1997, following construction.
Slight reductions in numbers and species of birds breeding in the turbine area were noted. This may be a result of the reduction of forested area on the hilltops. Habitat alteration and forest fragmentation are larger issues of concern in the forests of the northeast, especially at elevations above 3000 ft.
With respect to the four conservation issues stated in the introduction of this paper, several conclusions can be made regarding the Searsburg wind power development:
High Elevation Forests.-The Searsburg wind power facility is situated below 3000 ft altitude. The forests there contain only fragments of the spruce/fIr forest that is indicative of sensitive highelevation forests. A few high elevation avian species were detected, but not in high numbers. The development did not disturb high-elevation habitats and their inhabitants.
1
96 National Avian - Wind Power Planning Meeting III
Forest Fragmentation.-Breeding songbird studies demonstrated a reduction in some forest interior species, and increases in edge species, following construction. These changes are consistent with changes expected from fragmenting northern forests. This project has had, at minimum, short-term negative impacts on interior forest-breeding birds. Whether the impact will continue in the long-term cannot be determined for several years, when habitat regenerates. At that time, another round of breeding bird surveys would be required.
Rare and Sensitive Species.-The Northern Goshawk was the one species of concern to agencies or conservation organizations that might have been present in the area. However, no Goshawks, or other forest-nesting hawks, were found nesting on or near the site. Concern also should have been raised for Bicknell's TIrrush, which was found on or near the site both before and after construction. This species is a high-elevation forest specialist that is not expected to nest below 3000 ft a.s.l. Its presence was unexpected.
Hawk and Songbird Migration.-Few migrants pass over the wind power development. Given the nature of their flight paths and altitudes, there is not likely to be any measurable impact on populations. Most migrants seem to fly over or around the turbines, thereby avoiding risk. Overall, the most important conservation issue raised by this study is that of forest fragmentation and its effect on birds that require large, unbroken tracts of forest for nesting. In particular, if developments such as the one at Searsburg are proposed in high-elevation forests (above 3000 feet), fragmentation and habitat disturbance may be a more important issue than is the case with this project. Larger projects in high-elevation forests would be a greater concern. Long term monitoring of these forest populations following construction of ~d power sites is needed to clarify whether the impact is short in duration or irreversible.
Literature Cited
Anderson, R, M. Morrison, K. Sinclair and D. Strickland, with H. Davis and W. Kendall. 1999. Studying wind energylbird interactions: a guidance document Nat Wind Coord. Commit, c/o RESOL VB, Washington, DC. 87 p. Capen, D. E. and D. R Coker. 1994. Avian studies-proposed Green Mountain Power Corporation's wind turbine project Searsburg and Readsboro, Vennont, summer 1994. Rep. for Green Mountain Power Corp., Burlington, VT.
Kerlinger, P. 1989. Flight strategies of migrating hawks. Univ. Chicago Press, Chicago, IL. 375 p. Kerlinger, P. 1995a. A study of the nocturnal migration of songbirds at the Searsburg, Vermont, proposed wind energy facility: spring 1995. Rep. for Green Mountain Power Corp., Burlington, VT. Kerlinger, P. 1995b. How birds migrate. Stackpole Books, Mechanicsburg, PA. 228 p. Kerlinger, P. 1998. An assessment of the impacts of Green Mountain Power Corporation's Searsburg, Vermont, wind power facility on breeding and migrating birds. Rep. for Nat. Renewable Energy Lab., Golden, co. Laughlin, S.B. and D.P. Kibbe (eds.). 1985. The atlas of the breeding birds of Vermont., Hanover, NH. 456 p. Martin, N. 1993. Hawk migration at Searsburg, Vermont - 20 September to 29 October 1993. Rep. for Green Mountain Power Corp., Burlington, VT.
Martin, N. 1994. Hawk migration at Searsburg, Vermont - 1 to 20 September 1994. Rep. for Green Mountain Power Corp., Burlington, VT.
Northrop, Devine and Tarbell. 1995a. New England wind energy station: Spring 1994 nocturnal songbird migration study report, August 1995. Rep. for Kenetech Windpower, Portland, ME. Northrop, Devine and Tarbell. 1995b. New England wind energy station: autumn 1994 nocturnal songbird migration study report, January 1995. Rep. for Kenetech Windpower, Portland, ME.
----------
Studies on Nocturnal Flight Paths and Altitudes of Waterbirds in Relation to Wind Turbines: A Review of Current Research in The Netherlands
Abstract
by
Sjoerd Dirksen l , Arie L. Spaan~ and Jan van der Winden l
1 Bureau Waardenburg bv and 2 Alterra
Results of studies on nocturnal flight movements and altitudes of ducks and waders (shorebirds) in open landscapes without wind turbines are reported, along with the reactions of diving-ducks passing a semi-offshore wind farm when flying to and from their nocturnal feeding areas. Nocturnal flight movements are important because collision risks are highest during darkness. In all these studies, different types of radar have been used.
Waders feeding in tidal areas do not always use the same inland high tide roosts during darkness and daylight. Daily movements of waders in tidal areas and of diving-ducks in semi-offshore areas are generally below a height of 100 m, both during the day and at night. We believe that local movements of birds are predominantly at present-day wind turbine heights, irrespective of species and landscape. In contrast, flight altitudes of birds during seasonal migration may vary between one meter and several kilometers.
Evasive behavior is important. Diving-ducks either see or are otherwise aware of the turbines. A significantly lower proportion than might be expected crossed a line of turbines between two turbines; most flight movements were outside the line of turbines. The behavior of the ducks indicates, however, that a longer line of turbines can act as a flight path barrier for birds when the line is between the feeding and roosting areas. By interrupting long lines of turbines, the barrier effect probably can be diminished.
Introduction
Following the studies of Winkelman in the 1980s (Winkelman 1989, I 992a-d, 1995), in 1993 a "National research program on the impact of wind turbines on birds" was launched in The Netherlands. The program included both studies on nocturnal collision risks and research on disturbance effects. Research has so far focussed on the former. The studies mainly included research on flight movements and altitudes of ducks and waders in open landscapes without wind turbines. However, the reactions of diving-ducks passing a semi-offshore wind farm when flying to and from their nocturnal feeding areas also have been studied. In all these studies, different types of radar have been used.
One of the most important conclusions of Winkelman's studies was that collision risks are highest during darkness, in particular during very dark nights and during nights with bad weather. Therefore, our studies were concentrated on nocturnal movements of birds. Research was carried out in areas where conflicts between wind energy and nature protection are most intense. These are usually wetlands, often of international importance because of their high waterbird numbers. Habitat types included in the studies were large freshwater lakes, intertidal areas, and coastal areas.
1 Bureau Waardenburg bY, P.O. Box 365, NL-4100 AI Culemborg, The Netherlands. Phone: +31-345-512710. Fax: +31-345-519849. E-mail: [email protected] or [email protected]
2 Alterra, P.O. Box 47, NL-6700 AA Wageningen, The Netherlands. E-mail: [email protected]
97
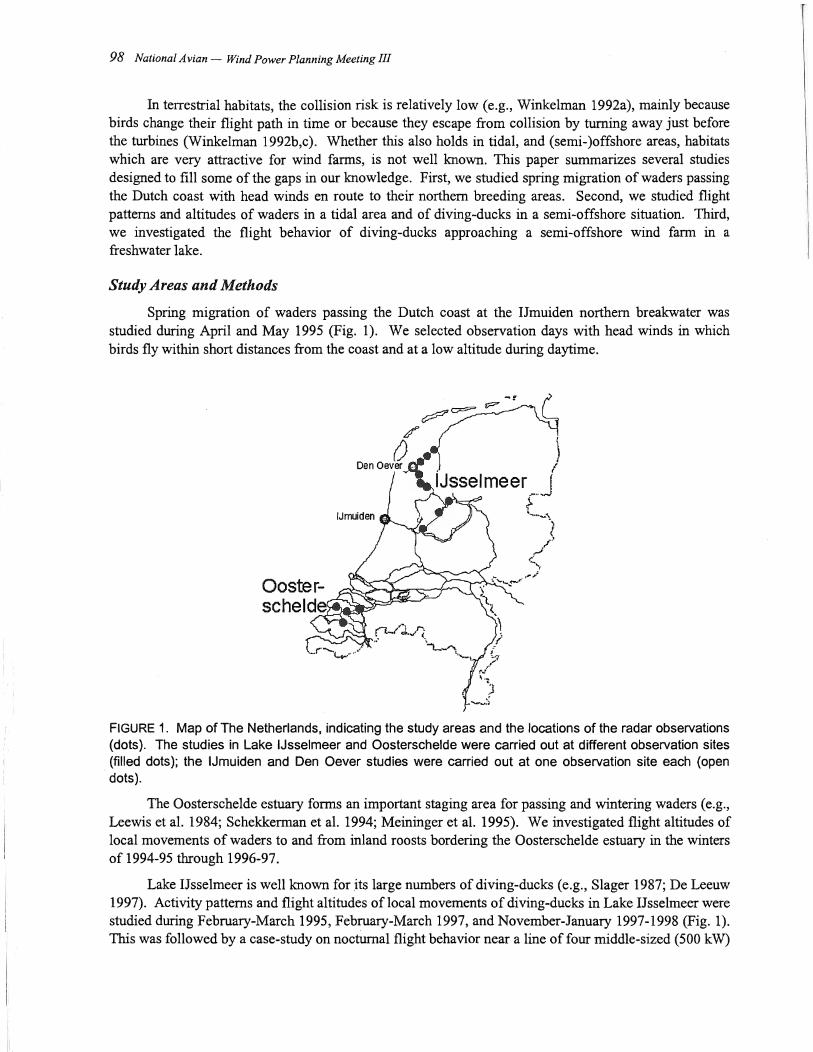
98 National Avian - Wind Power Planning Meeting III
In terrestrial habitats, the collision risk is relatively low (e.g., Winkelman 1992a), mainly because birds change their flight path in time or because they escape from collision by turning away just before the turbines (Winkelman 1992b,c). Whether this also holds in tidal, and (semi-)offshore areas, habitats which are very attractive for wind farms, is not well known. This paper summarizes several studies designed to fill some of the gaps in OUT knowledge. First, we studied spring migration of waders passing the Dutch coast with head winds en route to their northern breeding areas. Second, we studied flight patterns and altitudes of waders in a tidal area and of diving-ducks in a semi-offshore situation. Third, we investigated the flight behavior of diving-ducks approaching a semi-offshore wind farm in a freshwater lake.
Study Areas and Methods
Spring migration of waders passing the Dutch coast at the IJmuiden northern breakwater was studied during April and May 1995 (Fig. 1). We selected observation days with head winds in which birds fly within short distances from the coast and at a low altitude during daytime.
~=== r;:7
/ o Den Oever
FIGURE 1. Map of The Netherlands, indicating the study areas and the locations of the radar observations (dots). The studies in Lake IJsselmeer and Oosterschelde were carried out at different observation sites (filled dots); the IJmuiden and Den Oever stUdies were carried out at one observation site each (open dots).
The Oosterschelde estuary forms an important staging area for passing and wintering waders (e.g., Leewis et al. 1984; Schekkerman et al. 1994; Meininger et al. 1995). We investigated flight altitudes of local movements of waders to and from inland roosts bordering the Oosterschelde estuary in the winters of 1994-95 through 1996-97.
Lake IJsselmeer is well known for its large numbers of diving-ducks (e.g., Slager 1987; De Leeuw 1997). Activity patterns and flight altitudes oflocal movements of diving-ducks in Lake IJsselmeer were studied during February-March 1995, February-March 1997, and November-January 1997-1998 (Fig. 1). This was followed by a case-study on nocturnal flight behavior near a line offoUT middle-sized (500 kW)
1 I I
\
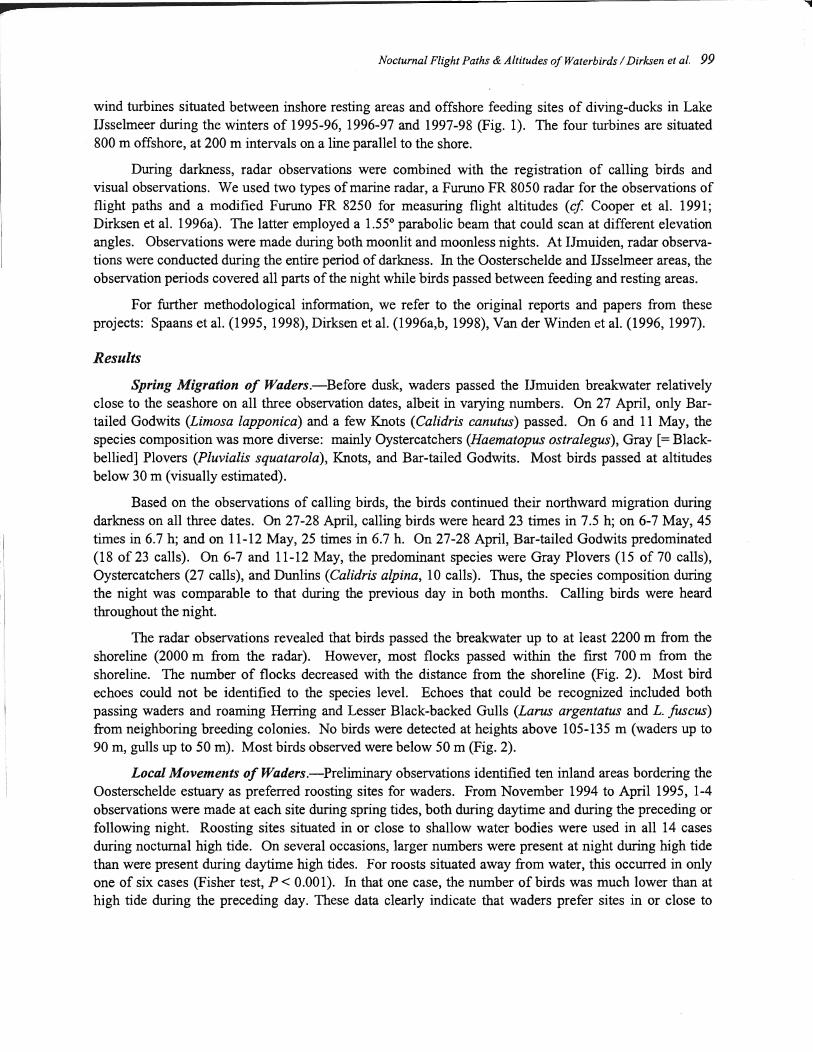
Nocturnal Flight Paths & Altitudes a/Waterbirds / Dirksen et al. 99
wind turbines situated between inshore resting areas and offshore feeding sites of diving-ducks in Lake Dsselmeer during the winters of 1995-96, 1996-97 and 1997-98 (Fig. 1). The four turbines are situated 800 m offshore, at 200 m intervals on a line parallel to the shore.
During darkness, radar observations were combined with the registration of calling birds and visual observations. We used two types of marine radar, a Furuno FR 8050 radar for the observations of flight paths and a modified Furuno FR 8250 for measuring flight altitudes (ef Cooper et al. 1991; Dirksen et al. 1996a). The latter employed a 1.550 parabolic beam that could scan at different elevation angles. Observations were made during both moonlit and moonless nights. At Dmuiden, radar observations were conducted during the entire period of darkness. In the Oosterschelde and IJsselmeer areas, the observation periods covered all parts of the night while birds passed between feeding and resting areas.
For further methodological information, we refer to the original reports and papers from these projects: Spaans et al. (1995, 1998), Dirksen et al. (1996a,b, 1998), Van der Winden et al. (1996, 1997).
Results
Spring Migration of Waders.-Before dusk, waders passed the Dmuiden breakwater relatively close to the seashore on all three observation dates, albeit in varying numbers. On 27 April, only Bartailed Godwits (Limosa Zapponiea) and a few Knots (Calidris eanutus) passed. On 6 and 11 May, the species composition was more diverse: mainly Oystercatchers (Haematopus ostralegus), Gray [= Blackbellied] Plovers (Pluvialis squatarola), Knots, and Bar-tailed Godwits. Most birds passed at altitudes below 30 m (visually estimated).
Based on the observations of calling birds, the birds continued their northward migration during darkness on all three dates. On 27-28 April, calling birds were heard 23 times in 7.5 h; on 6-7 May, 45 times in 6.7 h; and on 11-12 May, 25 times in 6.7 h. On 27-28 April, Bar-tailed Godwits predominated (18 of 23 calls). On 6-7 and 11-12 May, the predominant species were Gray Plovers (15 of 70 calls), Oystercatchers (27 calls), and Dunlins (Calidris alpina, 10 calls). Thus, the species composition during the night was comparable to that during the previous day in both months. Calling birds were heard throughout the night.
The radar observations revealed that birds passed the breakwater up to at least 2200 m from the shoreline (2000 m from the radar). However, most flocks passed within the first 700 m from the shoreline. The number of flocks decreased with the distance from the shoreline (Fig. 2). Most bird echoes could not be identified to the species level. Echoes that could be recognized included both passing waders and roaming Herring and Lesser Black-backed Gulls (Larus argentatus and L. fuseus) from neighboring breeding colonies. No birds were detected at heights above 105-135 m (waders up to 90 m, gulls up to 50 m). Most birds observed were below 50 m (Fig. 2).
Local Movements of Waders.-Preliminary observations identified ten inland areas bordering the Oosterschelde estuary as preferred roosting sites for waders. From November 1994 to April 1995, 1-4 observations were made at each site during spring tides, both during daytime and during the preceding or following night. Roosting sites situated in or close to shallow water bodies were used in all 14 cases during nocturnal high tide. On several occasions, larger numbers were present at night during high tide than were present during daytime high tides. For roosts situated away from water, this occurred in only one of six cases (Fisher test, P< 0.001). In that one case, the number of birds was much lower than at high tide during the preceding day. These data clearly indicate that waders prefer sites in or close to
100 National Avian - Wind Power Planning Meeting III
220
radar
220
200
180
160
140
all bird echoes
• waders o gulls
end pier
distance from radar (m)
5° 85 min.
120 30 100 150 min.
80 20 60 90 min.
40]~~ei~~~~~~~::~;:~~::~~==:d 1° ~ 1~~
o o
radar
220
200
180
160
140
120
100
80
60
250 500 750 1000 1250 1500 1750 2000
end pier
distance from radar (m)
echoes Ihr/10.000 m 2
5° 85 min.
3° 150 min.
40tJ.~i~~~~~=~ 1° 20 105 min.
o
0-500 500-1000 1000-1500 1500-2000
distance from radar (m)
FIGURE 2. Results of radar measurements during darkness at IJmuiden on one of the observation dates (6-7 May 1995, 22:17 - 05:00 h). Above: all echoes; middle: echoes of waders and gulls; below: echo density for each distance class (size of circle indicates number of echoes - values plotted: 0 - 154.4). Radar angles relative to horizontal plane and the total length of observations for each angle are given at right. Echoes are plotted on the central line of the radar beam; the diameter of the beam shows the range of altitudes sampled. Some echoes were confirmed as waders or gulls by outside observers, in radio contact, who saw or heard birds.
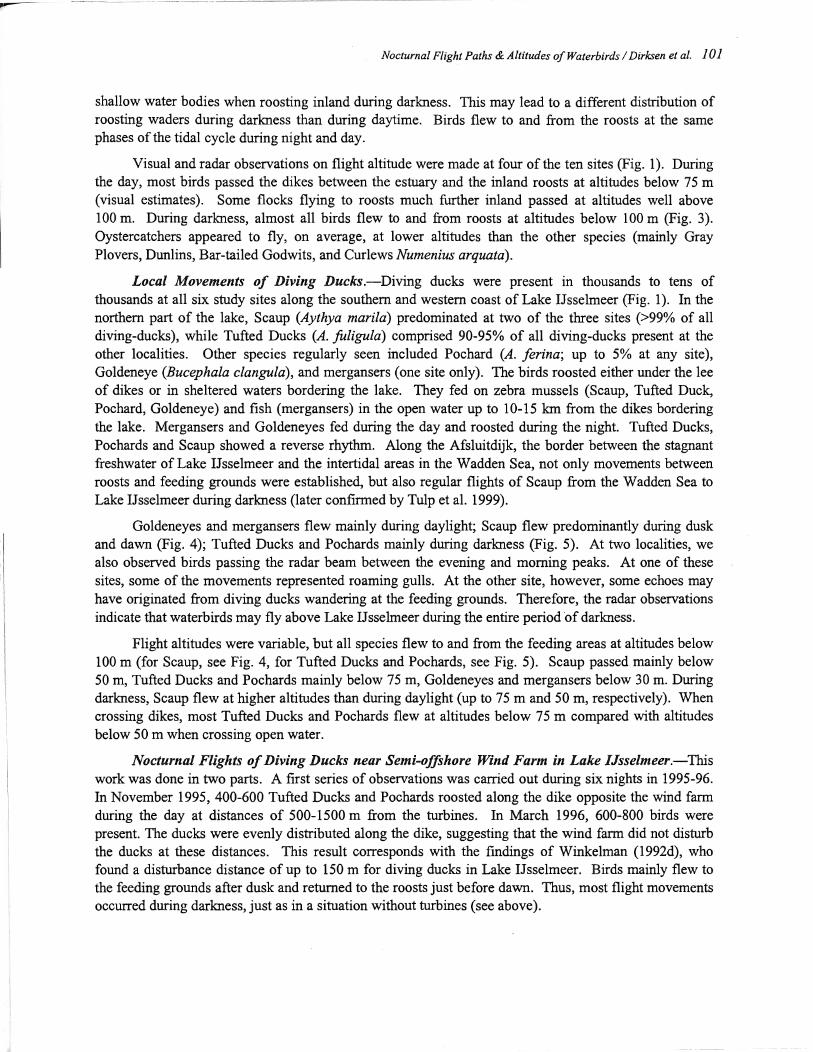
Nocturnal Flight Paths & Altitudes of Waterbirds / Dirksen et al. 101
shallow water bodies when roosting inland during darkness. This may lead to a different distribution of roosting waders during darkness than during daytime. Birds flew to and from the roosts at the same phases of the tidal cycle during night and day.
Visual and radar observations on flight altitude were made at four of the ten sites (Fig. 1). During the day, most birds passed the dikes between the estuary and the inland roosts at altitudes below 75 m (visual estimates). Some flocks flying to roosts much further inland passed at altitudes well above 100 m. During darkness, almost all birds flew to and from roosts at altitudes below 100 m (Fig. 3). Oystercatchers appeared to fly, on average, at lower altitudes than the other species (mainly Gray Plovers, Dunlins, Bar-tailed Godwits, and Curlews Numenius arquata).
Local Movements of Diving Ducks.-Diving ducks were present in thousands to tens of thousands at all six study sites along the southern and western coast of Lake Usselmeer (Fig. 1). In the northern part of the lake, Scaup (Aythya marila) predominated at two of the three sites (>99% of all diving-ducks), while Tufted Ducks (A. fuligula) comprised 90-95% of all diving-ducks present at the other localities. Other species regularly seen included Pochard (A. ferina; up to 5% at any site), Goldeneye (Bucephala clangula), and mergansers (one site only). The birds roosted either under the lee of dikes or in sheltered waters bordering the lake. They fed on zebra mussels (Scaup, Tufted Duck, Po chard, Goldeneye) and fish (mergansers) in the open water up to 10-15 km from the dikes bordering the lake. Mergansers and Goldeneyes fed during the day and roosted during the night. Tufted Ducks, Pochards and Scaup showed a reverse rhythm. Along the Afsluitdijk, the border between the stagnant freshwater of Lake Usselmeer and the intertidal areas in the Wadden Sea, not only movements between roosts and feeding grounds were established, but also regular flights of Scaup from the Wadden Sea to Lake Usselmeer during darkness (later confirmed by Tulp et al. 1999).
Goldeneyes and mergansers flew mainly during daylight; Scaup flew predominantly during dusk and dawn (Fig. 4); Tufted Ducks and Pochards mainly during darkness (Fig. 5). At two localities, we also observed birds passing the radar beam between the evening and morning peaks. At one of these sites, some of the movements represented roaming gulls. At the other site, however, some echoes may have originated from diving ducks wandering at the feeding grounds. Therefore, the radar observations indicate that waterbirds may fly above Lake Usselmeer during the entire period 'of darkness.
Flight altitudes were variable, but all species flew to and from the feeding areas at altitudes below 100 m (for Scaup, see Fig. 4, for Tufted Ducks and Pochards, see Fig. 5). Scaup passed mainly below 50 m, Tufted Ducks and Pochards mainly below 75 m, Goldeneyes and mergansers below 30 m. During darkness, Scaup flew at higher altitudes than during daylight (up to 75 m and 50 m, respectively). When crossing dikes, most Tufted Ducks and Pochards flew at altitudes below 75 m compared with altitudes below 50 m when crossing open water.
Nocturnal Flights of Diving Ducks near Semi-offshore Wind Farm in Lake IJsselmeer.-This work was done in two parts. A first series of observations was carried out during six nights in 1995-96. In November 1995,400-600 Tufted Ducks and Pochards roosted along the dike opposite the wind farm during the day at distances of 500-1500 m from the turbines. In March 1996, 600-800 birds were present. The ducks were evenly distributed along the dike, suggesting that the wind farm did not disturb the ducks at these distances. This result corresponds with the findings of Winkelman (1992d), who found a disturbance distance of up to 150 m for diving ducks in Lake Usselmeer. Birds mainly flew to the feeding grounds after dusk and returned to the roosts just before dawn. Thus, most flight movements occurred during darkness,just as in a situation without turbines (see above).
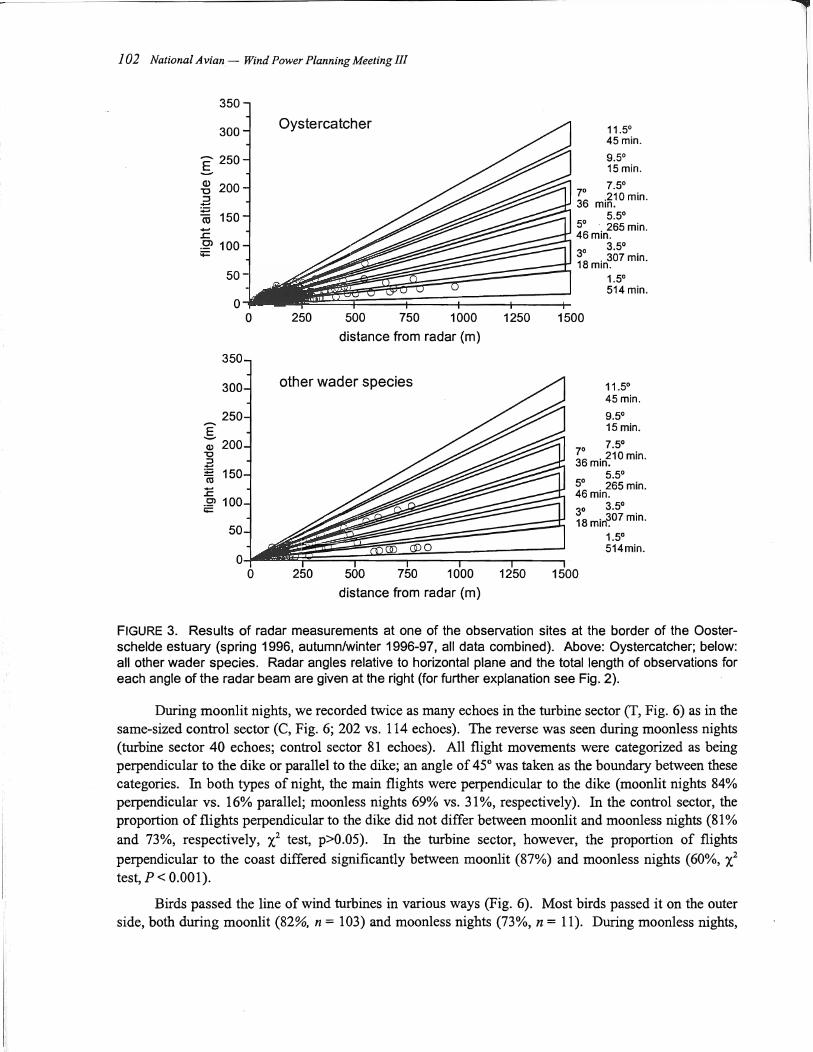
102 National Avian - Wind Power Planning Meeting III
350
300
- 250 E -~ 200 :J -:;::;
Oystercatcher 11.50
45 min.
9.50
15min.
70 7.50
36 .210 min. min.
5.50 co 150 -.r:. .2> 100 li=
50
o ~~~~~§~~s~~~~~~~ ~~ ~in~65 min.
30 3.50
18 .307 min. min.
1.50
514 min.
o 250 500 750 1000 1250 distance from radar (m)
other wader species
500 750 distance from radar (m)
1500
11.50
45 min.
9.50
15 min.
70 7.50
36 . 210 min. min.
o 5.50
5 265 min. 46 min. 30 3.50
18 min~07 min.
1.50
514min.
FIGURE 3. Results of radar measurements at one of the observation sites at the border of the Oosterschelde estuary (spring 1996, autumn/winter 1996-97, all data combined). Above: Oystercatcher; below: all other wader species. Radar angles relative to horizontal plane and the total length of observations for each angle of the radar beam are given at the right (for further explanation see Fig. 2).
During moonlit nights, we recorded twice as many echoes in the turbine sector (T, Fig. 6) as in the same-sized control sector (C, Fig. 6; 202 vs. 114 echoes). The reverse was seen during moonless nights (turbine sector 40 echoes; control sector 81 echoes). All flight movements were categorized as being perpendicular to the dike or parallel to the dike; an angle of 45° was taken as the boundary between these categories. In both types of night, the main flights were perpendicular to the dike (moonlit nights 84% perpendicular vs. 16% parallel; moonless nights 69% vs. 31%, respectively). In the control sector, the proportion of flights perpendicular to the dike did not differ between moonlit and moonless nights (81 % and 73%, respectively, X2 test, p>o.05). In the turbine sector, however, the proportion of flights perpendicular to the coast differed significantly between moonlit (87%) and moonless nights (60%, X2 test, P < 0.001).
Birds passed the line of wind turbines in various ways (Fig. 6). Most birds passed it on the outer side, both during moonlit (82%, n = 103) and moonless nights (73%, n = 11). During moonless nights,

Nocturnal Flight Paths & Altitudes of Waterbirds / Dirksen et al. 103
160 echoes during evening and morning flights
180 echoes in daylight, dusk and dawn S' ~ 160 S'
~ 140 (in darkness) 24 min. 34 min. .§. 120 .§. 140
-g100 " OJ 120
" 151 min. !l100 128 min.
"" 80 "" 'iij 2' 'iij 80 2' 60 89 min.
t, 40 39 min.
~ 60
" .~ 40
" ~ 20 263 min. "" 20 188 min
0 0 250 500 750 1000 1250 1500 0 250 500 750 1000 1250 1500 1750
160 2SO '00 SO 2S 10 160
~ 140 0 S' ~ 140 echoes ibr/IO,ooo m 2 S'
.§. 120 0 0 0 24 min. .§. 120
34 min.
~IOO 3' ~IOO 3' :J lSI min. :J 128 min. ~ 80 ~ 80
Cd 2' 60 2'
C 60 39 min. lij 89 min
Cd 40 40 OJ OJ
" E " E 20 263 min. 20 188 min.
0
0-250 500-750 1000-1250 0-250 500-750 1000-1250
distance from radar (m) distance from radar (m)
60 60,.--------,
50
40
30
20
10
16.35 18.05 19.35 21.05 22.35 4.35 6.05 7.35 daylight, I evening I night night I morning I daylight, dusk flight flight dawn
FIGURE 4. Results of radar measurements for Scaup at one of the observation sites in the IJsselmeer area (23-26 Feb. 1995). Above: all echoes during darkness (left) and during daylight, dusk and dawn (right); middle: as above but for echo density per distance class of 250 m (see sample circles in left middle graph for legend); below: distribution of flight activities over total observation period (echoes during night also include unknown species). Radar angles relative to horizontal plane and the total length of observations for each angle are given at the right (for further explanation see Fig. 2).
only 9% of the birds crossed the line by passing between the turbines (vs. 18% in moonlit nights), whilst 18% turned away from the turbines (0% in moonlit nights). The differences in flight distribution between moonless and moonlit nights are statistically significant (Kruskal-Wallis test, P < 0,001).
The second series of observations was carried out during eight nights in early 1997 and during the winter 1997-98. The general pattern of occurrence of resting groups and their flight behavior were comparable to previous results. Numbers of Tufted Ducks were high in Feb.lMarch 1997 (up to 3100), when they were accompanied by a maximum of 2500 Scaup. During Dec./Jan. 1997-98, numbers of Tufted Ducks were lower (max. 1340), with some tens of Pochards and without Scaup being present. Table 1 presents the data on the number of flight movements during darkness in the two sectors.
At full moon, more parallel than perpendicular flight movements were seen in both sectors (X2
test, both sectors P < 0.001). Table 2 presents a more detailed analysis of the flight behavior of groups flying within 500 m of the wind turbine line. On their way to the feeding grounds, the ducks had to cross this line, either between the turbines or outside the windfarm.
~~ , I

146 National Avian - Wind Power Planning Meeting III
600
~
t:. t:. t:.
t:. ~
6.
t:. t:. • 1::6. +. A
6. 'D.
6.'f~ ~~+ ~+~
t:. ~ ... f • +
cu -g100 -:;:; < a
-300 -200 -100 a
A
t:.
6. ~
100 200
L.l
D.
300 400
• warbler/sparrow 6. thrush
Ground displacement (meters) from center rl acoustic array
1 (XX)
900
iii 800 0
"E :c 700 .... 0 ~ 00) "6l ctI
~ 500 II) - 400 II)
.§. II) 300 "C :::I ....
200 ;;
< 100
!:J. !:J.
I:=anj~cml !:J. !:J. !:J. !:J. .tb /} !:J.
!:J. !:J.
!:J. 8 !:J. 8 !:J. %88 ~
8 8
8 !:J.
• 0 !:J.
: ~··i 8 . :. . •• 0 -300 -200 -100 0 100 200 300
Grou1d dsplacement (meters) from center d acoustic array
FIGure 4. Acoustically determined points of origin of two classes of avian night flight calls above a microphone array at Tug Hill, New York, on (A) 9 September 1994 and (8) 21 September 1994. Triangles indicate thrush-class call types and diamonds indicate warbler or sparrow notes.
,.. ,

Acoustic Monitoring / W.R. Evans 147
document the altitude differences between thrush-class species and smaller passerines (warblers and sparrows). It also provides an indication of the flight altitudes of migrants with respect to the turbines. Detailed species analyses on these data are in progress.
Discussion
Three applications of acoustic monitoring of night flight calls have been carried out. These have profiled the species composition of night migrants over a region, provided an index to their abundance, and demonstrated a capability to estimate flight altitudes for particular species.
Night Migration Near Existing Tall Structures.-The large number of alarm calls recorded in the Nebraska study suggests that calling by night-migrating birds may be elicited when they become aware of their unexpected close proximity to a tall structure. Certain weather conditions may obscure a structure such that migrating birds are startled and give distress calls when they do become aware of it. The hazard from an existing wind turbine structure for many species of night-migrating birds might therefore be evaluated acoustically by logging the frequency and species composition of alarm calls. Collisions with the turbine structure could be documented acoustically as well. Such a study could be performed on nights with light winds when turbines were not operating. Whether such acoustic monitoring could be performed during turbine operation would depend on the frequency band of the turbine noise and the audio frequency and intensity of the calls or collision sounds. For pre-construction assessment of proposed wind turbine sites, existing communications towers in the region could be monitored acoustically at night to evaluate collisions and near misses based on species alarm calls. Such towers are rapidly proliferating across the continent and are likely to occur near most proposed wind turbine sites. For example, Figure 5 illustrates the locations of communications towers in the 60-120 m height range across Nebraska. Companies constructing such communications towers may be interested in pooling birdkill research efforts with the wind power industry.
Lighting on wind turbines may, at times, help reduce collisions caused from lack of visibility. However, the primary threat for small passerines, which has been amply documented around the continent (Avery et al. 1980), occurs when inclement weather conditions (low ceiling, fog, and precipitation) lead night-migrating birds to congregate around lighted structures. These birds have lost access to some of their normal orientation cues for nocturnal migration (e.g., stars; view of horizon) due to weather conditions. In these conditions, they tend to approach lights, become disoriented, and fly about in the lighted area. Mortality occurs when they run into the structure or even other migrating birds as more and more birds fly around in the relatively small, lighted space. Therefore an important consideration regarding minimizing the collision risk at wind turbines for night-migrating passerines is the lighting of these structures. Wind turbines should not be strongly illuminated.
Recent advances in computers and signal processing techniques have allowed automated birdcall detection systems to be developed. Such systems might be applied to wind turbine farms to enable automated monitoring of calls and collisions at every turbine in the facility. This assumes that noise from the turbines proves not to cause serious interference with acoustic monitoring of bird calls. Researchers could access such data remotely and be alerted to nights when wind turbines are hazardous to migrating birds. In this way, the timing of ground searches for carcasses could be optimized. If necessary, realtime acoustic monitoring might be used to shut down turbines under especially high-risk conditions.
"~-------~

148 National Avian - Wind Power Planning Meeting III
. ... • I ...
•• 1 ••
• • • •
• •
• • •
• •
•
I I" II
•
• III
" .
• • ••• "I
• .. ~ •
• a I. • II·
I
•
I •
• •
I
•
• • III
" • .1
I • • &I ~.
• I .... I
I • III I • •
I
• '" • • • • OIl • •
• .... • I
• B ... • • I •
•
I • • , • • • • •
1M I I" I
•• •• II
• • • • III
1· : .... 1 .. ,: • • • • ej.
• • of.
I ~.
• • • • • ... ~ •
• I
I
" . I •
• o· ." •
• I • I I
". II
• I .. ••• • lit • II
\- I • • I •
•• I .~ • I • • w\ •
•• 1'.1 • .11 '" . . • • r \0.( • • III •
'II III • 'f • 'I.. I • • ". • • l-Illo, • I
• •• • ... .. , . , .. \ • •
FIGURE 5. Locations of Nebraska communications towers in the 60-120 meter height class as of April 1998 (source: FAA digital obstacle file).
Document Broad Front Density Gradients by Species at Night.-In the Nebraska acoustic study, a single recording station near Ainsworth was operated through the fall 1996 and spring 1997 migration seasons. However, on the night of 6-7 October 1996, a five-station recording transect was operated across the eastern half of Nebraska to illustrate the utility of such data for siting wind turbine
operations (Fig. 1). The data from this night revealed that a large wave of predominantly grassland sparrows passed over east-central Nebraska (Table 1). The sparrow calls have not yet been classified to species because they were from a group with similar call-types that have not yet been fully discriminated from one another: Nelson's Sharp-tailed Sparrow (Ammodramus ne!soni), LeConte's Sparrow (Ammodramus leconteii) and Savannah Sparrow (Passerculus sandwichensis). Figure 3 illustrates the higher density of sparrow calling (and presumed numbers of birds) over east-central Nebraska, with numbers diminishing toward the west end of the array. Note that Figure 3 illustrates the number of detected calls of birds, not the number of birds. Use of the MIP method to estimate the minimum number of individuals passing has not yet been carried out on these data because of the species identification problem. MIP is more accurate for assessing migration density because it accounts (at least in part) for variable calling rates of individual birds caused by weather, varying migration density, artificial lighting, etc.
MIP analysis was possible on the distinctive calls of the Dickcissel (Table 2). These data suggest that Dickcissel migration density was also larger in the east-central portion of the transect, but peak numbers appear to have occurred earlier in the evening than the large wave of grassland sparrows.

---------_. -.~.- --._.
Acoustic Monitoring / WR. Evans 149
Though the transect data are just from one evening, and therefore no turbine siting conclusions can be drawn, this type of information about broad front migration suggests that season-long monitoring
efforts with a transect of recording stations could elucidate migration density patterns for a region. Indeed, multiple years of transect recording across New York State strongly indicate that certain consistent calling patterns are due to migration patterns of different species, not simply to locally variable weather (Evans and Mellinger 1999; Evans and Rosenberg 1999). Such broad front information obviously could be valuable for siting wind turbines (especially a larger wind turbine operation) if the siting intention is to minimize risk to certain species of nocturnal migrants.
Besides the Nebraska study, acoustic assessment of the species composition of night migrants using recording station transects has been carried out in New York, Florida, and most recently in south Texas (Evans and Mellinger 1999; Evans and Rosenberg 1999; www.oldbird.org). One of the purposes of the south Texas study is to provide the United States Fish and Wildlife Service (USFWS) with information for making decisions on siting wind turbine operations and communication towers in southern Texas.
One suggestion often made when people see data from acoustic transects is that these density data should be correlated with radar data. There are a number of challenges in making such correlations. Due to horizon effects and the angle of surveillance radar beams (including NEXRAD), their minimum altitude of coverage rises as distance from the radar increases. This, along with problems from ground clutter, make correlation with broad-front acoustic data difficult. Using a transect of vertical beam radars could provide broad-front altitude data, but the cost of such monitoring would be roughly 20 times that of the acoustic method. Furthermore, vertical beam radars typically have problems in detecting targets at heights lower than 50 meters. One of the strong points of acoustic monitoring is that there is no lower height limit of bird detection. Acoustic monitoring does have upper altitude limits but these are well above the altitudes of interest regarding wind power impacts.
Radar and acoustic techniques are two different means for monitoring nocturnal bird migration, each with its own strengths and weaknesses. Radar is the only way to monitor every target flying but gives little species information. Acoustic methods give species information but do not provide information on birds that don't call. The best coverage for wind turbine studies would use both techniques. In cases where budgets limit coverage to one technique, the technique chosen would need to be determined depending on the monitoring priorities of the study. For example, in the NPPD study, the USFWS was specifically interested in the impact of the proposed wind turbines on Baird's Sparrow (Ammodramus bairdii), a threatened grassland bird. Clearly, radar would have been ineffective for this purpose.
Localization of Calling Night Migrants.--Characterizing the typical migratory altitude of different species in a region has obvious utility for assessing the impact of wind turbines, especially regarding their height. The study conducted in upstate New York was the first experiment with acoustic localization of night flight calls. Although the data have been analyzed only to species classes, they do reveal the exciting potential of this technique. The apparent difference in flight altitudes for warblers and sparrows as compared with species giving thrush-class calls is reliable only for the lower altitudes. Warbler and sparrow calls could have occurred at higher altitudes but their relatively faint calls may not have been picked up by the microphone system. However, because the altitude data from the vertical beam radar were closely correlated with the acoustically determined altitude data, it is probable that few warblers and sparrows were migrating above the reach of the acoustic system. Furthermore, the relatively strong calls of the thrush-class species certainly would have been detected if some of these

150 National Avian - Wind Power Planning Meeting III
birds had flown at lower altitudes. Thus, the results indicate that thrush-class speCIes were flying predominantly at higher altitudes than warblers and sparrows.
One caveat is necessary in assessing mortality hazard by evaluating mean flight heights of birds over a proposed or existing tall structure: For many species, collisions with tall structures occur mainly when birds are forced to fly lower than normal due to lowering cloud ceilings, when they are flying in conditions of poor visibility (e.g., fog), or when they remain near a tall structure because of disorientation caused by the structure's lighting. Relying on seasonal mean flight height data to evaluate collision hazard may therefore yield misleading information. In eastern North America, the mean height of migration over a region may be less important for assessing tall structure bird collision hazard than quantifying the number of nights of fog or low cloud ceiling at the site during the migration periods.
Acknowledgements
Thanks to Jim Jenniges, Stephanie Jones, and Nebraska Public Power District for supporting the Nebraska acoustic study, and to Edward Neuhauser and Niagara Mohawk Power Corporation for supporting the acoustic work in New York State. Special thanks to Christopher W. Clark, Charles Walcott, Ken Rosenberg, and the Cornell Laboratory of Ornithology for giving night flight call monitoring a home; and to Harold Mills, Steve Mitchell, Dave Mellinger, Kurt Fristrup, Greg Budney, Lang Elliott, Michael O'Brien, Rhonda Millikin, and Annette Finney for camaraderie and support along the way.
Literature Cited
Avery, M.L., P.F. Springer and N.S. Dailey. 1980. Avian mortality at man-made structures: an annotated bibliography (revised). FWS/OBS-80/54. U.S. Fish & Wildl. Serv., BioI. Servo Prog., Nat. Power Plant Team, Washington, DC. 152 p ..
Dierschke, V. 1989. Automatisch-akustische Erfassung des nachtlichen Vogelzuges bei Helgoland im Sommer 1987. Vogelwarte 35:115-131.
Evans, W.R. 1994. Nocturnal flight call of Bicknell's Thrush. Wilson Bull. 106(1):55-61.
Evans, W.R. and D.K. Mellinger. 1999. Monitoring grassland birds in nocturnal migration. Studies in Avian BioI. 19:219-229.
Evans, W.R. and K.V. Rosenberg. 1999. Acoustic monitoring of night-migrating birds: a progress report. In: R.E. Bonney. Jr., D.N. Pashley and R. Cooper (eds.), Strategies for bird conservation: the Partners in Flight planning process. Cornell Lab of Ornithology, Ithaca, NY. <http://birds.comell.edu/pifcapemay>
Graber, R.R. and W.W. Cochran. 1959. An audio technique for the study of nocturnal migration of birds. Wilson Bull. 71(3):220-236.
General Discussion
The post-presentation discussion focussed on details of the application of this technology, and its future. The initial question concerned noise interference at the turbines. Given that the turbine site will be windy, and the turbines themselves are noisy, do these noise sources interfere with the recording of bird vocalizations? Bill Evans admitted that this is a problem if the recordings are made right at the wind turbines. At the Tug Hill, New York site, for example, the array of microphones was placed about 250 m away from the turbines to reduce the noise interference. It may be possible for direct collisions to be picked up by a microphone at the turbine site, but probably not on a windy night. One attendee
i I

Acoustic Monitoring / W.R. Evans 151
commented that noise cancelling software IS capable of reducing environmental background noise somewhat, but is not yet perfected.
The suggestion was made that an array of microphones, set "downwind'~ from the turbines possibly could function as a "distant early warning" system. If a certain threshold level of calling was being recorded, the turbines could be shut down. Bill Evans agreed that this is a potential application of this technology.
How big an area can be monitored with this technology? The area varies with the species being monitored and the environmental conditions, but generally within about a mile of the microphones, Evans estimated.
One participant commented that there is weak correlation between the numbers of birds aloft as measured by call rates versus by radar. While the acoustic approach is admittedly good for identification of species, it may not provide a good index of numbers of birds aloft. Bill Evans thought that there may be ways around this shortcoming.
Are there species that do not call during nocturnal migration, and thus that would not be detected acoustically? Evans mentioned that vireos call infrequently.
Where do we go from here with this acoustic technology? How far off is species call-recognition software? Evans feels that automated call recognition is possible, given sufficient development funding, and would dramatically reduce the time and cost of data analysis. In the Nebraska study, computer callrecognition algorithms were used to detect probable calls and to copy them to a computer hard drive. Thus allowed remote access to call data without the intervening "quiet" periods. Acoustic technology could be applied to document migration paths. For example, a broad front array of recording stations could be established to determine nocturnal migration corridors by species.
It was pointed out by an attendee that acoustic (or other remote sensing) technology may not be necessary as an "early warning system". Weather forecasts could be used to predict those relatively few nights during which the majority of nocturnal migration occurs, especially those when nocturnal migrants may be flying low (at turbine height). On these nights, the wind turbines could be shut down in advance.

-- ~------------------------------~~.,~
Abstract
Radar, Remote Sensing and Risk Management
by
TAdamKelly
Geo-Marine Inc. l
Bird Aircraft Strike Hazards (BASH) and collisions with wind turbines, towers and masts have many parallels. The methods of quantifying and managing BASH risk are compared to risk management in the wind turbine industry. Mitigation options used for aircraft operations are considered as possible solutions for avian - wind power problems. A framework is provided for selecting and applying remote sensing to risk management in the avian - wind power field.
Introduction
The problem of birds colliding with wind turbines, towers and masts is similar, in some respects, to the problems that the aviation industry experiences as a result of collisions with birds. In both cases birds are killed. However, the higher impact forces associated with the high speeds of aircraft, along with the lightweight construction of aircraft, mean that the consequences of a collision can be more severe for aircraft than for wind turbines. Bird-aircraft collisions occasionally result in loss of human life or the destruction of an aircraft. Some of the lessons learned in managing BASH risk can be applied to the wind turbine industry. BASH problems differ between military low-level flying and flying (military and civil) at and near airfields. Bird - wind turbine problems have some similarities to both the military low-level flight hazard and to airfield bird hazards. On airfields, active harassment and habitat manipulation are commonly used to mitigate the hazard, and these methods may be applicable to some wind turbine sites. On military low level routes, these methods are not applicable and risk management using models, remote sensing, and operational changes are used. Common to both areas of aviation are engineering changes to the airframes that enhance impact resistance without compromising aerodynamic performance.
Risk Management
In military aviation, Operational Risk Management (ORM) is used to manage risk (AFP 91-214, 1997). This management process is used as a framework for identification and mitigation of hazards. The ORM process helps to select the most appropriate remote sensing methods and risk mitigation options. When applying risk management principles to BASH, the implementation is more an engineered solution than strictly scientific. The exact statistical relationship of each management decision may not be known. However, the cause and effect relationships are understood in a qualitative manner, so the consequences of mitigation are largely known. Ongoing evaluation of the management plan allows refinement until optimal risk reduction has been achieved.
First Law of BAS H.-A guiding principle in the BASH field is that you cannot avoid all bird strikes. Birds exist and are active everywhere, certainly within the United States. This also applies to almost every other region of the world. Using effective risk management, the probability of a collision with a bird can be reduced to a very small value, but over any extended time will always be greater than zero. Understanding this principle has a profound effect on management and mitigation. If you cannot,
I Geo-Marine Inc., 507 Hwy 2297, Panama City, FL 32404. Phone: 805-871-5657. E-mail: [email protected]
152
!
j

Radar, Remote Sensing & Risk Management I T.A. Kelly 153
even with the best and most exhaustive risk management program, reduce the probability of a collision with a bird to zero, then how should the mitigation efforts be targeted?
In the BASH situation, impact forces are governed by the equation 1/2 MV2, where M is the mass and V is the velocity. It is difficult to change the speed of an aircraft. Aircraft are constructed to operate within a limited range of speeds to achieve optimal lift and fuel consumption. Risk management has to be focused on reducing the mass (and number) of birds that an aircraft encounters. The impact resistance of the airframe is optimized through reinforced windshields, engines, and structures. This means that the threshold where damage occurs is raised, and the number of species and the mass of birds for which risk has to be managed is reduced. Table 1 shows a list of species that account for 95% of the risk of military aircraft loss during low level flight in the United States. The USAF works on the principle of finding where and when birds are active and avoiding those areas.
TABLE 1. Most hazardous bird species during low-level flight in the United States.
Rank 1. 2. 3. 4. 5. 6. 7. B. 9. 10.
Species Turkey Vulture Red-tailed Hawk Goose Duck Eagle Black Vulture Herring Gull Sandhill Crane White Pelican Swan
Species of Concern.-In a similar manner, it is suggested that the wind generation industry, along with Federal and State agencies, consultants, academics and environmental groups, needs to establish a set of criteria for determining which species are vulnerable to impacts with wind turbines and other structures. This will allow the industry to focus mitigation efforts. Consultants to industry can then select the most effective mitigation and remote sensing tools for use in risk management programs. Table 2 is a list of groups of birds that may rank highly in mitigation efforts. The table does not attempt to rank the relative vulnerabilities of these groups. For each situation of concern, relative vulnerabilities should be established for each species, rather than group, by a panel of the interested parties listed above. In this manner informed consensus can be achieved. This grouping includes large birds in the event that composite rotor technologies of the future are more fragile than current technology. If future turbines are less robust to achieve greater efficiency, then the types of birds struck may be of as much concern to industry as it is to those concerned with the vulnerable bird populations.
TABLE 2. Categories of birds to be considered.
Threatened and Endangered species Neo-tropical migrants Raptors Time periods with the most birds Large Birds

r------------------------------------------------------------~
I,.
154 National Avian- Wind Power Planning Meeting III
Species criteria could be established based only on the effects of turbine-inflicted deaths on the sustainability of the populations. This would be a purely scientific approach. However, society places other aesthetic values on certain species, and these values often cannot be accounted for by a strictly scientific approach. No parasite is listed under the Endangered Species Act, and society would see little value in protecting a species of tick or flea endangered by anthropogenic effects. Exotic species such as the Starling or House Sparrow do not receive legal protection in North America. The species criteria will have to address all of society's and industry's concerns.
Risk Management Timeline.-In addressing BASH concerns, it is useful to consider the timeline for risk management to place mitigation efforts in the correct context. Table 3 shows three types of risk management for low level flight: Strategic, Tactical, and Near Real Time. These three categories are based on the time line for mitigation measures. The tools used in risk management for each category are outlined, along with data sources.
TABLE 3. BASH risk management approaches for use in planning low-altitude military fI . 'lYing.
Risk Time Line for Risk Type of Risk Management Management Management Tool Data Source Measures Strategic Schedulers' Radar, remote Years, months or
BAM1 sensing study weeks Tactical US BAM, Historic data Months, days or (Mission Plan) Pilots' BAM (site sources, site hours
specific), and specific studies, Forecast NEXRAD
Near real time Hazard Warning NEXRAD, Minutes WXModel, Observations
1 BAM = Bird Avoidance Model, a spatial data model developed by the USAF for portraying the risk of an impact with a hazardous concentration of birds.
In Table 4, this timeline concept is adapted to outline a suggested risk management strategy for the wind turbine industry. The Strategic portion of risk management takes place before the wind plant is built, and involves an intensive study. Often this will be required in support of an Environmental Assessment (EA) or Environmental Impact Statement (EIS). Geographic Information Systems (GIS) are listed as these are powerful computer-based tools that can integrate spatial data from historical datasets, direct observations, radars, remote sensing systems, and other sources in the decision-making process. Eastman et al. (1993) provides examples of GIS in decision making. Years or months ahead of turbine operations, mitigation methods can be considered for integration into a Tactical Management Plan (TMP). The TMP will take data from the intensive study and outline how these observations can be turned into risk management decisions and mitigation measures. The last portion of this timeline is the Operational Management Plan (OMP). A subset of the TMP, the OMP outlines to staff operating the site the operational measures required to reduce the effects of turbines on critical wildlife species.
J

-----------------------------------------------------.-----
Radar, Remote Sensing & Risk Management / T.A. Kelly 155
TABLE 4. Suggested risk management approaches for the avian - wind turbine issue.
Risk Time Line for Risk Type of Risk Management Management Management Tool Data Source Measures Strategic Intensive study, Radar, remote Years, months or
EAlEIS, GIS sensing study weeks Tactical Bird Activity Data Historic Data Months, days or Management (Site specific) sources, site hours Plan specific study,
NEXRAD 1
Operational Hazard Warning NEXRAD, WX Minutes Management Model Plan
1 NEXRAD refers to the Doppler weather radar network deployed across the U.S.A., also useful in monitoring bird movements.
Data Required for Risk Management Decision.--Table 5 lists required data elements required for risk management decisions in both BASH and the wind turbine industry. No one sensor can measure all of these elements simultaneously. A variety of remote sensing techniques is required to collect these data. Metadata are additional observations needed to interpret the specific bird observations, including habitat and weather data (Fig. 1). For discussions of weather effects on bird activity see Elkins (1988) and Kerlinger (1989, 1995). One critical question in the decision-making process is whether the bird is migrating or is involved in normal daily activity in the local area. This has a profound effect on the mitigation required. Actively-migrating birds are rarely influenced by habitat management, perch guards, or other "local" techniques as they pass through the airspace. Operational changes such as temporarily suspending operations are more likely to be successful mitigation methods during migration.
TABLE 5. Data elements required for risk management in the BASH and avianwind turbine contexts.
Data Elements X,Y Z D
T Species
Metadata
Description Co-ordinates over the ground Altitude Density, number of birds in a volume of airspace Time observation made Bird species or group observed A set of additional observations made with the above elements, described in Figure 1.
---. -.~~- -- .~ --1. ! i , i
I

156 National Avian - Wind Power Planning Meeting III
Metadata I
I I Habitat WX Behavior
Activity
I I
Migration Daily Activity
FIGURE 1. Metadata structure as required for risk management in the BASH and avian - wind turbine contexts.
Remote Sensing
Table 6 outlines several remote-sensing methods applicable in studying bird hazards to aircraft, and also applicable in studying birds near wind turbines. The table indicates the types of data that can be collected with each of those systems.
Radar Limitations.-Radar is an effective method for detecting the presence of birds, day or night, and in some respects is much more reliable than visual observations. The major limitations of radar are the difficulty in distinguishing species, and the fact that the display can be swamped by ground clutter with antenna angles close to the horizon or by precipitation during adverse weather. Birds usually cannot be detected on the display amongst ground clutter or weather returns, although some specialized radars have signal processing capabilities that reduce these types of interference. Insects can also occasionally swamp displays when dense insect movements are underway. At short ranges, echoes from insects may sometimes be mistaken for echoes from birds. All marine radars suffer these limitations, but S-band radars (10 cm wavelength) are slightly less affected than the more widely used X-band radars (3 cm wavelength). The vertical scanning method is the least affected by ground clutter and the most able to detect birds to low altitudes.
Radar Data Collection Methods.-Data from modified marine radars are normally collected by one of two methods: (1) direct observations of the radar display by an observer, or (2) video recording for later analysis. Whichever method is used, the spatial data are recorded into a computer database. Bar code readers can significantly speed entry of coded observations into the database. They have the additional advantages of ensuring that entries are made consistently and reducing the numbers of typographic errors relative to typed data entry. Macros can be written, operated by bar code entries, to further enhance the data entry process.

------------------------------------------~
Radar, Remote Sensing & Risk Management / T.A. Kelly 157
TABLE 6. Remote sensing data collection methods.
Remote Sensing Spatial Data Technique Collected S-band marine X,Y,T,M, heading, surveillance speed radar X-band marine X,Y,T,M, heading, surveillance speed, estimate of radar target size. NEXRAD(WSR X,Y,T,M, reflec-88-0) tivity as used to
estimate target size. Velocity used to derive heading
X-band vertical- Z,D,T,M, estimate beam (modified of target size. marine radar) X-band conical- Z,D,T,M, heading, scan modified speed, estimate of marine radar target size. Vertical scan X,Z,D,T,M, modified marine estimate of target radar size.
VHF telemetry X,Y, more and data loggers sophisticated
systems can measure altitude, T,Sp.
Satellite-linked X,Y,Z,T,Sp, M telemetry Hybrid/Satellite X,Y,Z,D,T,Sp, M, transmitter heading, speed,
estimate of target size.
Acoustic X,Y,Z,T, Sp., M, monitoring heading, speed Thermal X,Y,Z,D,T,Sp(?), M imageryNideo when combined
with vertical beam radar
X,Y = Position over the ground. Z = Altitude above the ground.
Typical Max. Range (Terrest. Environment) 14 nm
3nm
124 nm
2400m
2400m
2400 m
4pt03 nm on the ground, 20 nm in the air
Unlimited range
Unlimited range
1000 m
2nm
D = Density (number of targets in a known volume of airspace). T = Time of observation. Sp. = Species identification. M = Metadata can be collected with the observation.
Spatial Normal Resolution Application Moderate Establishing ground
track, behavior, and habitat use of birds
High Establishing ground track, behavior, and habitat use of birds
Low Establishing ground track and habitat use of birds
High Establishing altitude of birds
, High Establishing altitude of birds
High Establishing altitude of birds, one axis of ground position can be measured
Moderate Daily activity patterns, mortality, habitat utilization.
Low Migration routes
Unlimited Migration routes, Variable daily activity
patterns, mortality, and habitat uti! ization. Species identification Species/type identification

158 National Avian - Wind Power Planning Meeting III
Radar Calibration.-Data collected by radar have to be converted to number of birds per unit area or volume to make them applicable to other studies and to calculate probabilities of a collision. The effective radar beam width is not precisely defined, as the edges of a radar beam are not sharp. The beam width quoted by the manufacturers is often an underestimate of the effective beam width. The radar can be calibrated by flying a target into the beam and measuring the angle to the target from the antenna with a theodolite or inclinometer. To calibrate to high altitudes, a small aircraft or helicopter will be required. At lower altitudes a model aircraft is an ideal target. Once the effective beamwidth has been obtained for a series of altitudes, the results can be plotted via a Computer Aided Drafting (CAD) system. The CAD system can be used to calculate the volume of the beam and confidence intervals for the measurement.
For optical or electro-optical methods (night-vision, thermal imagery, and low light video), field of view and depth of field measurements can be used in a similar manner to determine the volume of airspace being sampled.
Calculation of Collision Risk
Risk Management Definitions.-A series of definitions are required to interpret spatial data collected with remote sensing technologies and apply them to the risk management process. There is a distinct difference between the probability and the risk of a bird strike or collision. Probability is the frequency of occurrence of a bird collision or strike. The risk refers to the consequences of a bird strike/ collision. Exposure is the time interval during which critical species populations (or aircraft, in the BASH context) are potentially susceptible to collisions. Severity is the expected consequence of a collision on the critical species population (or aircraft). Gambling is making risk management decisions without reasonable or prudent assessment of the risks to wildlife.
Calculating Probability and Risk.-The probability of a bird strike is often described as the number of birds in a given volume of airspace through which an aircraft frontal area is swept. This same standard could been adopted by the wind turbine industry, where the aircraft frontal area is replaced by the rotor swept area. In the latter case, the volume factor would need to be estimated based on the ground speed of the birds. If there are no avoidance actions by the bird (or pilot, in the BASH context), this is a satisfactory measure for modeling purposes.
Accuracy of Simple Probability Calculations.-In practice the true frontal area to which a bird is exposed includes the tower structure. The omission of this area reduces the critical frontal area in the calculation of probability and results in some underestimation of the collision probability. On the other hand, the probability of a collision is normally overestimated by using the swept area of the rotor in slowspeed turbines, where some birds might pass unharmed between the turning blades. The effective critical area of the turbine will be a function of the speed, dimensions and flight direction of the bird, and the rotor speed. The effective critical area is difficult to calculate, as it will change in relation to all these variables. The calculation will be even more problematic with variable-speed turbines.
Probability of collision models for aircraft assume that the bird is frozen in space and makes no attempt to avoid the aircraft. For high-speed aircraft, this is a valid assumption, as the high closing speeds provide very little time for the bird to react to the aircraft. Applying this assumption to wind turbines is less reliable. Some birds are known to react to wind turbines and to avoid them. The frequency with which they will strike the turbine blades will be reduced as a function of the acoustic and visual detectability of the turbine. Species-specific factors such as visual acuity, behavior when confronted by a novel stimulus, and patience to navigate around a series of hazards. These are difficult parameters to measure and quantify, and to apply to a probability calculation.

r --- ~---- --~- -~~-
Radar, Remote Sensing & Risk Management / T.A. Kelly 159
The methodology above for a simple probability calculation may be useful in providing an indication of relative risk if we assume that birds respond consistently to danger. In this way, the simple model can indicate the relative probability of collisions under different circumstances, but will over estimate the true probability.
Risk is a function of probability, severity and exposure. It can be written as R=j{PSE), where P = probability (frequency of event), S = severity (a species-specific value related to species vulnerability, see discussion above), and E = exposure (time).
Types of Risk.-When presenting the findings of a risk management study, it is important to articulate the type of risk being referred to in the document. Risk as presented here varies in relation to species vulnerability and societal concern. Total risk is the sum of non-critical species + identified risk + unidentified risk.
Non-critical species are those that have been determined to have no risk value iflost to an impact.
Identified Risk is the hazard to critical species quantified through various analysis and remote sensing techniques.
Unidentified risk is the hazard to critical species not quantified in the analysis techniques or detected by remote sensing. The unidentified risk is critically important. A one-year study cannot identify all the species that pass through an area given the limitations of human observers and remote sensing equipment. A small probability will always exist, however long the study, that an unidentified species may be at risk from wind turbine development.
Acceptable risk is· the part of the Identified Risk that is allowed to persist without control or mitigation. This is risk that is acceptable by the decision-makers involved in granting permission for the development.
Unacceptable risk is the part of the Identified Risk that is controlled, managed or mitigated by the appropriate decision makers involved in granting permission for the development. In extreme cases of unacceptable risk for which no mitigation can be found, it may be determined that the development of a wind farm should not proceed.
Methods of Mitigation
The application of remote sensing to risk management should always be done in such a way as to collect data that assist in finding effective mitigation techniques and demonstrating to decision makers the level of risk to critical bird species. Using the timeline method (Table 4), mitigation methods can be categorized as Strategic, Tactical, and Operational methods.
Strategic Mitigation.-Strategic mitigation of avian - wind turbine interactions could involve a variety of different methods, including turbine placement, engineering, and habitat management.
Placement: The location of a wind turbine will have the highest effect on long-term risk management. Selecting sites with the lowest numbers of critical species will reduce risk and reduce the mitigation actions required to operate the site. Data on distribution of bird species can be integrated in a GIS during the planning stage and modeled, with wind data, to fmd optimum sites. Observations in Europe (S. Dirksen, this volume) show avoidance of turbines by birds, and suggest that specific positions of turbine strings relative to the flow of birds in the area will be critical mitigation methods. String length and turbine spacing will also be important. This is an area that requires further study, e.g. by radar observations.
..

160 National Avian - Wind Power Planning Meeting III
Engineering: Wind turbines can be engineered and designed for the minimum effect on wildlife. Eliminating or reducing perching opportunities is the easiest mitigation method to incorporate into a turbine design (Curry and Kerlinger, this volume). Reducing turbine frontal area through efficient rotor design, reducing rotation speed, and enhancing blade visibility may also be important mitigation methods. The height of the turbine above the ground could also be a critical-design factor that determines the number and types of birds colliding with the turbine.
Habitat Management: The way that the vegetation around a turbine is managed can significantly reduce the number and diversity of bird species (especially resident species) around a wind turbine site. This is a method successfully employed at airports worldwide. Essentially this is inverse conservation management. It requires identifying all features attractive to critical bird species and managing the habitat to eliminate those attractions. Ground cover can be grown higher to disrupt foraging. For example, Golden Eagles prefer open grassland to hunt ground prey. Managing for a taller shrub ground cover will reduce hunting efficiency by providing the prey with cover. In cases where the vegetation is a direct food source, it should be eliminated and a ground cover grown that is a poor food source for the types of birds in the area.
Reducing food sources, along with roosting, nesting and perching sites, plus bathing and loafing opportunities, can greatly reduce the numbers of resident birds near a wind turbine. These mitigation methods have to be balanced against the revenues generated from agriculture or grazing. Also, judgements must be made as to the balance between having unattractive habitat with few birds and few collisions, as compared with attractive habitat and more birds, but also more collisions. If it is decided that the objective should be unattractive habitat and few birds, then with careful management, agricultural crops can have numbers and diversity of bird species as low as those found in a desert environment for the majority of the year. High abundance of birds is normally associated with seeding, cultivation and harvesting. If these operations can be done at times of year when the turbines are inactive or when few resident birds are present, then effective mitigation may be achieved. Selecting native vegetation types can reduce fertilizer and water requirements.
Tactical Mitigation.-Harassment, disturbance or deterrence of birds is a commonly used approach on and around airports and in some agricultural settings. If properly applied, it can be very effective in reducing bird numbers. However, it is often expensive in terms of the man-hours required, and often has only a temporary effect. Active harassment methods have not yet been applied to wind turbines as a management technique, but should be considered as an interim measure when all else fails with resident birds. Pyrotechnics, bio-acoustics (playback of distress calls), and gas cannons can be effective methods of hazing birds and moving them out of an area. Potential hazing methods are described in many publications (see Cleary and Dolbeer 1999 as a recent example). Great care should be used in applying these techniques to prevent birds from being drawn into collisions with turbines by distress/ alarm calls or scared into turbines by sudden noises. A Section 7 consultation is required with the U.S. Fish & Wildlife Service before scaring eagles or threatened and endangered species. Habituation to these methods will occur if they are used routinely with little variation in application. These methods are not a solution to the problem of impacts to turbines, but may be of temporary value under certain conditions to mitigate acute risks.
Operational Mitigation.-Operational decisions can be made that can directly reduce risk. Temporarily stopping or reducing turbine use at times of high activity by critical species can greatly reduce risk. Seasonal exposure data collected by remote sensing can be modeled with wind data to demonstrate costlbenefit ratio of halting or reducing operations. Long-term management decisions could be made to

----- ----- -----------------
Radar, Remote Sensing & Risk Management / T.A. Kelly 161
suspend operations during weeks of intense migration, for example. This could be written into the operational management plan and proposed as a mitigation measure when applying for permits. A refmement of this methodology would be to use near-real-time migration forecasts/observations to make decisions regarding when to suspend turbine operations so as to avoid forecast or known periods of heavy migration. Near-real-time observations could be provided (for example) by the NEXRAD radar system. This type of near-real-time decision making could more accurately target mitigation and reduce the overall operational effect of shutting down turbines during bird migration.
Adaptive Management
The last phase of any risk management program is to monitor the success of the strategic and tactical decisions that have been made, in this case to mitigate the effects of turbines on birds. Collection and review of data on bird numbers, bird activities, and bird fatalities can provide a basis to assess and revise the risk management plan to achieve optimum mitigation. For each of the mitigation methods discussed above, remote sensing can collect some of the data needed to determine the applicability and potential success of the method in managing the problem of bird strikes to wind turbines.
Literature Cited
AFP 91-214. 1997. Operational Risk Management (ORM) implementation and execution. Air Force Pamphlet 91-214. HQ AFSC/SEP, U.S. Air Force, September 1997.
Cleary, E.C. and R.A. Dolbeer. 1999. Wildlife hazard management at airports. U.S. Fed. Aviat. Agency, Off. Airp. Safety Standards, Washington, DC, and U.S. Dep. Agric., Wildl. Serv., Sandusky, OH. 247 p.
Eastman, 1.R., P.A.K. Kyem, 1. Toledano and W. Jin. 1993. GIS and decision making. UNITAR Clark Labs for Cartogr. Techno!. & Geographic Analysis, Clark Univ., Worcester, MA.
Elkins, N. 1988. Weather and bird behaviour, 2nd ed. T. & A.D. Poyser, Berkhamsted, u.K. 240 p.
Kerlinger, P. 1989. Flight strategies of migrating hawks. Univ. Chicago Press, Chicago, IL. 375 p.
Kerlinger, P. 1995. How birds migrate. Stackpole Books, Mechanicsburg, PA. 288 p.
General Discussion
One attendee asked whether there were human health concerns associated with use of dedicated radars for bird studies. It is certainly necessary to follow OSHA rules concerning human exposure to microwaves. However, levels of incidental exposure were measured during the work described by T.A. Kelly. He reported that the results indicated that human exposure was not a problem in their projects.
Another question concerned the difference between "advertised" radar beamwidths and actual beamwidths, and whether use of a helicopter or other large target is meaningful in estimating effective beamwidth for birds. This was studied using balloon-borne spheres as well as the larger targets. Effective beamwidth was found to be similar across a wide range of target sizes.

The Use of Radar in Evaluations of Avian-Wind Development Projects:
Norris Hill Wind Resource Area, Montanal
by
Alan R. Harmata2, Kevin M Podruzny, James R. Zelenak! and Michael L. Morrison3
2Montana State University, Bozeman 3Califomia State University, Sacramento
Our presentation discusses a study of bird use in and near a proposed wind resource area in southwestern Montana, the Norris Hill Wind Resource Area (NHWRA). Bird use was investigated during the preconstruction phase using both radar and direct visual observation techniques. Because of the large nocturnal migration that occurs in many regions, we thought that using radar was necessary to obtain a thorough analysis of the potential for bird mortality to occur following construction of the WRA.
Our study included three major approaches: (1) determination of seasonal bird use and mortality as a basis for evaluating the potential impact of the NHWRA (Impact approach); (2) describing the spatio-temporal profile of bird use in the NHWRA and vicinity (Descriptive approach); and (3) evaluating the efficacy of radar and visual monitoring techniques for recording bird abundance and movements (Efficacy approach). Here we concentrate on the Efficacy approach. Efficacy analysis used coincident radar and visual monitoring. Data on migration collected when radar and visual observers were in communication were compared with those collected when observers did not communicate so detection rates and success for both methods could be evaluated. Efficacy monitoring occurred during all seasons. We worked from 12 August to 15 December 1995 (autumn migration), 20 February to 10 June 1996 (spring migration), and 15 March to 7 July 1995 and 1996 (breeding period).
Bird use was defined as the number of events detected per unit time and/or per unit area either visually or by monitoring of marine surveillance radars. An individual target, also known as an "echo", detected on the radar screen was considered an event. An echo sometimes represented a single bird, but at other times represented many birds (possibly of several species) grouped tightly enough to produce one echo on the display screen per antenna revolution. Bird echoes were easily distinguished from aircraft echoes.
Two identical X-band, lO-kW Raytheon 1210XX Marine Surveillance Radars were used to monitor seasonal bird migrations. One radar system, a scanning array with antenna rotating through 3600 in a horizontal plane, provided a map (Plan Position Indicator) display of targets plotted in terms of their distance and compass direction from the antenna. A second marine radar was used to determine the heights of birds flying through the NHWRA and vicinity. The plane of antenna rotation for this vertical array was perpendicular to the ground. This configuration created a vertical curtain of radar waves
I The abstract presented above is an edited version of the one prepared in advance of the San Diego meeting. Coauthor Dr. M. Morrison summarized the results of the study at the meeting. The results were subsequently published as Harmata, A.R., K.M. Podruzny, J.R. Zelenak and M.L. Morrison. 1999. Using marine surveillance radar to study bird movements and impact assessment. Wildlife Society Bulletin 27(1):44-52.
2 Fish and Wildlife Program, Biology Department, Montana State University, Bozeman, MT 59717-0346. Phone: 406-586-3747.
3 Department of Biological Sciences, California State University, Sacramento, CA 95819.
162

Use of Radar in Montana / A.R. Hamata et al. 163
extending east-west across the WRA and beyond. A bird penetrating the curtain created a radar echo that allowed measurement of distance above the radar antenna for up to 3.2 Ian.
Four types of observation schemes were used during migration periods. Solo Radar monitoring involved one observer monitoring both radar screens. Paired Radar monitoring used two observers, each monitoring a radar screen. Paired Verified and Paired Silent monitoring schemes were designed to test the efficacy of monitoring techniques (visual or scanning radar) while also gathering observational data. Verification schemes were used only during daylight hours because night vision equipment was not able to acquire moving targets effectively. Paired Verified involved two observers simultaneously and independently scanning, one using radar and the other visually, and communicating when they observed a target. Paired Silent involved simultaneous scanning by radar and visual observers who did not communicate.
Marine surveillance radars were valuable tools for detecting bird movements. Radar detected at least 12 times as many birds (about 109 eventslhour or 453 birdslhour) compared to strict visual monitoring of spring migration. In addition, radar allowed equally representative sampling at night. Passage rates were up to 5 times higher at night than during daylight 4uring both autumn and spring migration.
We will also discuss problems inherent in using radar, including observer fatigue, interference due to ground clutter and weather, data recording, equipment placement and maintenance, and related issues. However, we found that radar may be an essential component of pre- and post construction monitoring of wind power sites because visual observations capture only a small part of bird activity in many areas.
General Discussion
There was some discussion regarding the capabilities and limitations of marine surveillance radars following the presentation by Dr. Morrison. How well did the radars detect small birds that were flying low and close to the radar? Morrison replied that they felt the detectability was reasonably good, although there was some interference by ground clutter and, at very close range, by the minimum radar recovery time. A participant commented that birds at low altitude can often be detected by a horizontally-scanning radar at ranges just beyond the area of ground clutter. For future applications, the team plans to select the radar site more carefully to minimize clutter. It was noted that vertical-beam or vertically-scanning radars always have a blind spot at low altitude and close horizontal distances.
Were there difficulties distinguishing echoes from birds vs. swarms of insects, or bats? Insect swarms generally had radar echo characteristics that were recognizable, and Dr. Morrison felt that insect contamination could be recognized and excluded from the data. There was very little bat activity at this site, so echoes from bats were not a confounding factor.
Another participant noted that, in Scotland, the flight altitudes of migrating geese have been observed to vary with wind speed - altitudes decrease as wind speed increases. Such behavior may bias radar results ifbirds become less detectable during high winds because they fly below the radar detection zone.
What were the results of the Trumpeter Swan observations? Dr. Morrison replied that Trumpeter Swans did not fly over the proposed wind site very often. When seen, they tended to fly over the lower parts of the site.

L
Night Vision and Thermal Imaging Equipment
by
Brian A. Coope/ and T. Adam Kell/
lABRInc.
2Geo-Marine Inc.
A brief informal presentation was made by Brian Cooper, with assistance from Adam Kelly, describing the use of night vision and thermal imaging devices for bird studies. Each of these technologies can provide certain types of information under differing conditions.
Night Vision Devices
Night vision (NY) devices, such as binoculars, monoculars, and goggles, are image intensifiers or light amplifiers. The ambient light energy (photons) is converted into electronic energy (electrons) by a photocathode. The electrons then are passed through a disk that multiplies the number of electrons many times. The now-multiplied electrons then impact a phosphor which converts the electric energy back into light energy, producing a much brighter image. Consequently, NY devices are designed for use in very low light conditions and can be dangerous to eyesight when used in daylight, even under cloud. However, NY devices will perform better under a full moon than under a quarter moon or under overcast at night.
Two levels of technology presently are available. For observing birds at night, at least Generation 2 technology is required, and optical magnification of 4-5x. A suitable Generation 2 system would cost approximately U.S. $4000. Generation 3 optics are the best available technology, and would cost about twice the price of otherwise-similar Generation 2 optics. Some NY devices can be attached to cameras (including video).
Thermal Imaging Devices
Thermal imaging (Tn devices detect infrared radiation (IR), or heat. All objects emit infrared radiation; however, the amount of IR detected by a TI device is a function of the emittance/reflectance characteristics of the subject, and the transmittance of the medium (e.g., air, water, glass). Good emitters (e.g., people, animals, water) radiate IR as a function of their absolute temperature. Good reflectors (e.g., metals), on the other hand, reflect background radiation - i.e., their apparent temperatures are not related to their true temperatures. Good transmitters allow IR to pass or transmit through them. Water and glass do not transmit IR well and thus TI devices will not "see" through glass or into water. When using TI devices, the greater the temperature difference between subject and background, the easier it is to see the subject. Some TI devices are capable of detecting differences as small as 0.1 Celsius degree. The images produced by TI devices look very similar to those viewed with NY optics. Because TI devices are sensitive to infrared radiation and not the visible light spectrum, they can be effective during either the day or the night. (However, thermal contrasts between objects and their backgrounds are often altered in daytime by the effects of sunlight.) TI devices tend to be significantly more expensive than NY optics; some units cost well in excess of U.S. $100,000.
1 ABR Inc., P.O. Box 249, Forest Grove, OR 97116. Phone: 503-359-7525. E-mail: [email protected] 2 Geo-Marine Inc., 507 Hwy. 2297, Panama City, FL 32404. Phone: 850-871-5657. E-mail: [email protected]
164

--~------
Night Vision and Thermal Imaging / B.A. Cooper & T.A. Kelly 165
Brian Cooper provided the following list of companies that can supply night vision and thermal imaging equipment:
Aspect Technology and Equipment Inc., 811 East Plano Parkway #110, Plano, TX 75074, U.S.A. Phone: 972-423-6008. E-mail: [email protected]
FLIR Systems Inc., 16505 SW 72nd Avenue, Portland, OR 97224, U.S.A. Phone: 503-684-373l. Website: www.flir.com
Inframetrics, 16 Esquire Rd, North Billerca, MA 01862-2598, U.S.A. Phone: 978-670-5555. Website: www.inframetrics.com
Raytheon. Website: www.raytheon.comlnightsight
1

Using GPS to Study Avian Interactions Associated with Wind Turbines
by
Mark Dedon
Pacific Gas & Electric Co. 1,2
Outline of Presentation
(1) Why Use GPS?
(2) How GPS Works
A. How Positions are Obtained
B. System components
C. Accuracy issues
(3) Practical Guidelines For GPS Useage
(4) Types ofGPS Receivers
(5) Using GPS Data in a GIS
Why use GPS?
A. Can provide high geographic accuracy
B. Efficient in data capture in most conditions
C. Can interface with Geographic Information Systems (GIS)
1 Pacific Gas & Electric Co., Technical & Ecological Services, 3400 Crow Canyon Rd., San Ramon, CA 94583. Phone: 925-866-5829. Fax: 925-866-5915.
2 This summary was adapted by the editors from the PowerPoint presentation given by M. Dedon at the meeting.
166

Using GPS 1M Dedon 167
How GPS works
(i) Signals from one satellite can be used to locate the receiver on the surface of an imaginary sphere surrounding the GPS satellite.
(ii) Signals from two satellites can be used to locate the receiver on a circle that is the intersection of two spheres.
(iii) Data from three satellites can be used to locate the receiver at either of two points.

~ -----~-.-
-------- ----- ~~~~-------------- ------------------~-----~-
-------~------.
168 National Avian- Wind Power Planning Meeting III
Satellite Ranging
Distance information is derived by the GPS receiver based on the phase differences between signals.
Sat. code
Receiver code I I I I I I I I I I I I I I I I
"'E:«'-----~~: Time difference between same I I
part of code translates to distance
System Components
(i) Satellites
to sat.
• 27 operational NAVSTAR satellites (3 are deployed as spares)
• satellites orbit the earth every 12 hours
• satellites orbit at altitudes of 12,600 miles
• four satellites orbit each of six planes inclined at 55°
(ii) Ground Control
The U.S. Department of Defense (DoD) has four ground-based monitoring stations, three upload stations, and one master control station.
Peter H. Dana 5127195
Global Positioning System (GPS) Master Control and Monitor Station Network

(iii) Receivers (Users)
• wide variety of models
• some are specialized for mapping, navigating, research
eoEiplorer II ..,. .'tf' " .. : ~~
:. .-:~ .. ~;,&.; ". . ... _~ 'f ... .,-
..... : ...
Accuracy Issues
(i) Types of Errors in Civilian GPS Locations
Typical Error in Meters (per satellite) Autonomous
GPS Differential
GPS Satellite Clocks Orbit Errors Ionosphere Troposphere Receiver Noise Multipath SA Typical Position Accuracy Horizontal Vertical 3-D
(ii) Differential Correction of Civilian GPS Locations
1.5 2.5 5.0 0.5 0.3 0.6
30.0
50 78 93
• more precise positions can be obtained with this method
o o
0.4 0.2 0.3 0.6
o
1.3 2.0 2.8
Using GPS / M Dedon 169

170 National Avian - Wind Power Planning Meeting III
DIFFERENTIAL GPS POSITIONING
L.,..,..------EBASE KNOWN POSITION
REMOTE~------____ J CORRECTED POSITION
PH DANA 1O/S2
(c) Accuracy of Military GPS Systems
The GPS system was originally designed for U.S. military use. Military users have access to GPS receivers capable of higher-precision position-finding. On 2 May 2000, it was announced that civilian users would (effective immediately) have access to higher-precision signals via existing civil receivers.
Critical Settings for GPS Receivers
Setting
Logging intervals
Minimum positions
Position mode
Elevation mask
SNRmask
PDOPmask
Types of GPS Receivers
Recommended Value
1 or 5 seconds
3
Manual 3D
15° (rover); 10° (base station)
6 (rover); 4 (base)
6 (rover); 8 (base)
e.g., Trimble, Magellan, Ashtech, Garmen

Price category
$150 - $300
$500 - $2,000
$3,000 - $5,000
$7,000 - $15,000+
General Discussion
------- --- -~ -------
Features
Recreation-no differential, no attributes. Good nav.
Recreation-differential, some attribute capability
Mapping - differential, good attribute collection, possibly R IDC
Mapping/Survey - RIDC, good
Using GPS / M Dedon 171
attribute collection, carrier phase accuracy
An attendee noted that GPS accuracy is often overstated, and that one way to test the precision of any given unit is to leave it at a fixed location while recording the variation in indicated positions. He said that, in his experience, Differential GPS position accuracy based on U.S. Coast Guard correction signals can be in error by as much as 10m. Mark Dedon said that he had found differentially-corrected positions based on the USCG signals to have much better than 10 m accuracy.

Examples of Statistical Methods to Assess Risk of Impacts to Birds from Wind Plants
by
Wallace P. Erickson, M Dale Strickland, Gregory D. Johnson and John W Kern
Western EcoSystems Technology Inc. l
Introduction
This paper defines and illustrates some statistical methods useful in assessing risk of avian collision with turbines and other potential windplant-related wildlife impacts. We use examples from monitoring studies we have developed for the SeaWest wind plant near Arlington, Wyoming (Johnson et al. 1998b), and the Buffalo Ridge Wind Plant near Lake Benton, Minnesota (Johnson et al. 1998a). Basic experimental designs are discussed. Statistical methods are described and illustrated for estimation of risk indices using (1) simplistic formulas of bird use and flight behavior, (2) logistic regression, and (3) spatial statistics and Geographical Information Systems. Statistical methods to estimate wind-related mortality are also provided.
The basic experimental design used in the wind plant impact studies is a BACI or Before-After Control-Impact design (Green 1979), where data are collected prior to and after construction of the wind plant on both the wind plant area and a reference area(s). In these studies, bird use is measured through point count surveys located systematically throughout the wind plant and reference areas. Covariates such as habitat type, proximity to landscape features, and flight height are also measured. Fatalities are estimated through carcass searches on plots located at a systematically- or randomly-selected set of turbines. Reference fatalities are also estimated at reference plots in the Buffalo Ridge study.
The following examples illustrate some of the statistical methods we have used for assessing wildlife risk associated with turbines and other wind plant facilities. These examples are based on the two studies referenced above (Minnesota and Wyoming).
Simple Risk Indices
We developed a simple "relative" index to risk of turbine collisions by birds as a function of relative abundance (Le., bird use/unit area/unit time), and flight behavior. The index (1) is calculated using the following formula:
]=u*p *p f t'
where U = mean use by species i adjusted for visibility bias, Pf = proportion of all observations of species i where activity was recorded as flying, and P t = proportion of all flight height observations of species i within the height band swept by the turbines. Pf was used as an index to the approximate percentage of time species i spends flying during the daylight period.
As an example, the Red-winged Blackbird (RWBL) is one of the most abundant avian species observed during the passerine and other small bird point count surveys on the Buffalo Ridge wind plant in southeastern Minnesota. During the summer seasons of 1996 and 1997, an average of 0.646 observations of RWBL were recorded per 10 minute survey within plots of radius 100 m. Using the program
I Western EcoSystems Technology Inc., 2003 Central Avenue, Cheyenne, WY 82001. Phone: 307-634-1756. Fax: 307-637-698l. E-mail: [email protected]
172

Statistical Methods / w.P. Erickson et al. 173
DISTANCE, the average detection probability of RWBL is 0.45, indicating that approximately one-half of the R WBL present within a 100 m plot are actually observed. This yields an adjusted estimate of use of 0.646/0.45 or 1.436 "observations" per survey. Based on flight height observations, RWBL were observed flying 87% of the time, and when flying were observed in the height band swept by the rotor of the Kenetech 33 MVS turbine 25% of the time. Therefore, the risk index for RWBL in the summer is
1=1.436*0.87*0.25.
Table 1 contains the index and relevant data for the five species with the largest risk values for the summer seasons at the Buffalo Ridge wind plant
Risk Assessment Using Logistic Regression
Logistic regression (Hosmer and Lemeshow 1989) is a data analysis method that can be used with either binary or multi-category response variables, and with both discrete and continuous predictor variables. Logistic regression analyses result in a predicted probability of a response given the predictor variables. The form of the logistic model and the probability of a response is
where Xi, i = 1, ... ,n, are the independent measured variables (predictors), and 13h i = 1, ... ,n, are the logistic regression coefficients obtained using maximum likelihood estimation techniques. Positive coefficients indicate that the probability of response increases with increases in the corresponding predictor variable. We have used logistic regression in several analyses to assess risk of impacts to birds from wind
plants. As an example, we modeled the probability of presence or absence of a particular bird species at a plot as a function of vegetation types (e.g., wetlands, woodlots) and plot types (turbine plot versus nonturbine plot). In this analysis, a significant coefficient for plot type would provide some evidence that presence of a turbine was related to the probability of use by the species of interest. For example, the presence or absence of Red-winged Blackbirds at a plot as a function of season, habitat characteristics, and plot type (turbine versus non-turbine) was modeled using logistic regression. The variables that were statistically significant as predictors were plot type (1 if plot is centered on a
turbine, 0 if plot is not associated with a turbine), season (1 for fall, 0 for rest of year), wetland indicator (1 ifplot contains some wetland, 0 otherwise), and percent CRP (percent of plot containing Conservation Reserve Program habitat). The estimated coefficients are found in Table 2.
The negative coefficients for plot type and season indicate that the probability of RWBL presence at a plot is lower for turbine than non-turbine plots, and lower in the fall than the rest of the study period (includes spring and summer). The probability ofRWBL presence at a plot is higher for plots containing wetlands than for those that do not, and increases as the amount of CRP in the plot increases. The odds ratio is a measure of association and approximates how much more likely (or unlikely) it is for the response to happen with a one unit increase in the predictor variable. For example, RWBL are nearly twice as likely (1.95) to be present at plots containing wetlands than at plots not containing wetlands. It can easily be seen how other variables such as distance to landscape features could be used to predict presence of a particular bird species, or other responses such as presence of bird carcasses. In the present context, the logistic regression model is of particular value in assessing the contribution of

174
----~···l
National Avian - Wind Power Planning Meeting III
TABLE 1. Derivation of risk indices for the five species at "greatest risk" during the summer for the Buffalo Ridge wind plant. Note that the risk index does not take avoidance or other behaviors into account.
Risk Mean Detection % % flying in Rotor-SEecies Index Use adjustment fl;ying SweEt Area Red-winged Blackbird 0.310 0.646 0.45 87 25
Cliff Swallow 0.148 0.152 0.15 100 14
Horned Lark 0.139 0.106 0.23 93 32
Common Grackle 0.116 0.106 0.23 93 22
Barn Swallow 0.113 0.673 0.14 99 4
TABLE 2. Estimated logistic regression coefficients for predicting presence/absence of Red-winged Blackbirds at plots, given the season, habitat characteristics, and type of plot.
Intercept
0.214
odds ratios
Plot Type
-0.976
0.38
Season
-1.358
0.26
Wetland Indicator
0.665
1.95
CRP
0.004
1.04
turbine-related variables in explaining bird occurrence (or occurrence of fatalities) after allowing for the effects of other variables.
Utilizing Spatial Data and Corresponding Analyses
Geographical Information Systems (GIS) can be an important component of avian risk analyses for wind plants. Variables such as proximity to landscape features, proximity to turbines, habitats, etc., can be derived from GIS and incorporated into the modeling efforts described above. Spatial statistical procedures (e.g., kriging, contouring) can also be used to address specific questions related to risk of impacts. In the first example below, digitized locations of raptors on Foote Creek Rim, a table-top mesa and the site of the Sea West development area in Wyoming, were used to assess spatial use of the development area. In the second example, locations of pronghorn obtained from aerial surveys were used to assess spatial aspects of winter use of that area by antelope.
Spatial Use of Foote Creek Rim by Raptors.-Locations of raptors when first observed during surveys on Foote Creek Rim (FCR) were mapped and digitized off 7.5-minute USGS quadrangles. The distinct rim-edge was also digitized. A 50-m buffer was defined around the rim-edge. Locations of raptors that were detected at heights corresponding to the rotor swept area of the turbines were categorized as either within this buffer, outside it and on top of rim, or outside it and off the rim (Fig. 1). The data collected over a two-year period were then standardized to unit area and unit time for each of the three areas for purposes of comparing use (Fig. 2). Variances were calculated based on survey-to-survey variance. It appears, based on these two years' data, that the rim edge receives much higher use than the other two areas. As a result of our pre-construction analyses, SeaWest modified the locations of the turbines, moving them away from the rim-edge, to reduce the risk of rapt or collisions with turbines.
1

Statistical Methods / w.P. Erickson et al .
................ ; ................. r-.- ._. -·1 ~ J .
19 ~ 20 ( 21 ,
: . I : ........... .1
RimEdge ! M I
I _._._ . .i
31 33
. :T20N .----; ................. = ..... .
:T19N
4
._.1 ........ ; ................. ]
12 8
13
II Off Rim
I Rim Edge
On Rim 20
........... ~ .. ~. ~~'*"'~~ _ ................. . O Approximate Raptor Point + COI..nt Location
__ - Project Area Boundary 25 M N
. . . ...................................................... ~ Section Boundary
175
FIGURE 1. Location of observation circles along Foote Creek Rim for raptor/large bird observations, and associated strata used to characterize spatial use of the rim by raptors in relation to the rim edge.

176 National Avian - Wind Power Planning Meeting III
Spatial Use by Pronghorn Near the Wyoming Windplant.--Concern was expressed regarding the potential impacts of wind development in Wyoming on pronghorn. Because of these concerns, the monitoring plan for the Wyoming development area called for studies of potential impacts to pronghorn. Investigations consisted of 2 aerial surveys conducted each month from January through June for pronghorn in a region surrounding the proposed development area. Transects were flown two miles apart over most of the survey area, and 1 mile apart near the FCR development area. Locations of groups of pronghorn were obtained using GPS interfaced with a laptop computer. The aerial surveys resulted in count data associated with a particular point location. The counts during two successive surveys were aggregated into 400 x 800 m quadrats, and aggregated counts were expressed as density per square kilometer. Density measures were then transformed into a use intensity index, 1= In(1 +density), to reduce skewness in the data. Further analyses were conducted on the intensity index. The objective of this analysis is to develop maps of pronghorn use prior to and after wind power development to investigate any changes in the spatial patterns of use intensity by pronghorn. We applied a statistical procedure developed in the geosciences known as kriging (Krige 1951) to compare use intensity maps. The objective of the kriging procedure is to use a set of observations (possibly unevenly spaced) to predict intensity of pronghorn use at un-sampled locations within the general region. This is often considered an "interpolation" problem. There are a variety of interpolation algorithms available, but kriging has advantages: it allows easy incorporation of additional covariates through standard regression techniques, and also provides a measure of uncertainty associated with interpolated values. This allows development of confidence intervals and tests of hypothesis for change in use intensity over selected spatial regions.
Kriging is a modeling procedure composed of a two step process. In the first step we recognize the tendency for pronghorn use intensity to be spatially auto-correlated (i.e., if pronghorn groups are detected at one location, we are likely to fmd more groups nearby). We use these spatial correlations to predict use intensity at unsampled locations.
We used Moran's I (Moran 1950) to test for spatial correlation as a function of distance between sampling locations. We found weak (? < 0.3, P < 0.05) auto-correlations between pronghorn use at points up to 8 Ian apart. Application of kriging with weak auto-correlations results in smooth maps that do not interpolate between the observed densities at sampled locations but, instead, fit the observed data in a least squares sense, similar to a flexible regression model. This approach is consistent with antelope use. We expect that antelope range a great deal and we do not put a great deal of importance on the particular location at which a group was sighted. Rather, presence of a group at a given location is probably an indicator that surrounding habitats are desireable at some larger scale. This scale is reflected in the distances within which use is auto-correlated.
Figure 3 shows pronghorn distribution maps from the January and February surveys of 1998. The Foote Creek Rim study area does not appear to very important winter range based on this survey. Surveys conducted in 1995 and 1997 further substantiate this.
Fatality Estimates
Fatality estimates provide a direct measure of windplant impacts to birds. We review the design of study components (carcass searches, searcher efficiency trials, scavenger removal trials) related to estimating mortality. We illustrate the estimation formulas using hypothetical data based on expectations at the SeaWest Windplant in Wyoming.

Statistical Methods / WP. Erickson et al. 177
Eagles Buteos Use wli rsa
1.n,--.---,----,-----,
o o.
o o.
o o.
on'---- O.n<---
Falcons All Raptors Use w/irsa Use w/i rsa
1. 1.
0 O.
0 o.
0 o.
0 O.
0 O.
FIGURE 2. Raptor observations/km2 considering only those raptors flying at heights corresponding to the rotor swept area (RSA) VS. location at Foote Creeke Rim. See text for definition of off rim, rim edge (±50 m), and on rim. Vertical line associated with bar depicts ±2 standard errors (approximate 90% confidence interval).
Estimation of Observable Carcasses.-The estimated average number of carcasses detected per turbine is
k
Lc. __ I
C = i=1
k
where Cj is the number of carcasses detected at turbine i for the period of study and k is the number of
turbines searched. The variance, V ( c) is calculated using the usual formula for variance of a mean.

.....---- -
I I
178 National Avian - Wind Power Planning Meeting III
Estimated Pronghorn Use in January and February 1998 12
10 (/) 4. L- _."....J (J) __ 1 --' (J)
I 8 E 0 I 0 0 I 84. I 6 a
I ~
4
2
o
3.7 3.8 3.9 4 4.1 Pronghorn / km2
Easting 100,000 meters
FIGURE 3. Pronghorn distribution near the SeaWest wind plant in Wyoming (see text).
The total number of carcasses observed is calculated by -
C==k*c with variance
A
V(C) == k 2 *V(~). Estimation of Carcass Removal.-Estimates of carcass removal are used to adjust carcass counts for removal bias. Carcass removal includes removal by predation or scavenging or removal by non-study personnel. The length Of time a carcass remains in the study area before it is removed is denoted as ti . Mean carcass removal time is expressed as 1, the average length of time a carcass remains at the site before it is removed:
n
It. - I t - i=1 ---
n where n is the number of carcasses. The variance, V(t), is calculated using the usual formula for variance of a mean. If a significant number of bird carcasses remain in the study area at the end of the trial, then the average length of time, T, can be estimated by statistical methods appropriate for censored data (Shumway 1989). If habitats affect scavenging, then separate estimates by habitat should be made and combined appropriately.

F
Statistical Methods / w.P. Erickson et at. 179
Estimation of Searcher Efficiency.-Searcher efficiency is expressed as p, the estimated propor
tion of detectable carcasses found by searchers. The analyses are used to evaluate effectiveness of the carcass searching effort and to make adjustments in the final estimate of the total number of carcasses
present. The variance, V (p ), is calculated by the formula:
V( A) = A 2 *[V(f) + V(k) _ 2 * p* se(f) * Seek)] P p f2 e f*k
where k is the total number of carcasses placed, f is the number of carcasses found, and p is the correlation between k andfacross the trials. A different carcass detection rate is estimated for each habitat and carcass SIze.
Estimated Total Number of Fatalities.-To estimate the total number of avian fatalities by species or groups of species, we use the three components (and their associated variances) discussed previously: (1) number of carcasses detected during the study period, (2) mean length of time the carcass remains in the study area before it is removed by scavengers, and (3) observer detectability rate. Values used for the observer detection rate and mean length of stay may be weighted based on relative proportions of each habitat type in the study area, and averaged across seasons to calculate mortality within the existing wind plant for the entire study period.
The estimated total number of carcasses for the windplant, m, for the time frame between searches is calculated by
N*I*C m=-----,-
k*t* P
where N is the total number of turbines, k is the number of turbines sampled, I is the interval between -
searches in days, C is the total number of carcasses detected for the period of study, t is the mean length
of time the carcasses remains in the study area before it is removed, and p is the observer detection rate.
The variance is calculated using the variance of a product formula (Goodman 1960) and the -
variance ofa ratio formula (Cochran 1977). The variance ofthe product t and p is
A A A 2 A - -2 --
V(t*p)=t *V(p)+p *V(t)-V(t)*V(p).
From this, the variance of m is
A N 2*I2* c2 lV(t*;) V('C)] Vern) = A 2 A 2 +---.::-2 .
-2 -2 e *t * p t * P C
The standard error of rn is calculated by

ii,
"
i'
180 National Avian - Wind Power Planning Meeting III
An approximate 90% confidence interval around m is
m± 1.67 * SE(m).
Example.-Table 3 illustrates the calculation of total mortality using the above defined formulas. In this example, two carcasses were observed during searches conducted once every 28 days on all 69 turbines for a 12 month period. The average length of stay for the habitat of the turbines is 12 days (se=2.5) and the estimate of searcher efficiency is 0.90. The estimated total number of fatalities is calculated by:
69*28*2 m= = 5.2.
69 *12 *0.90
TABLE 3. Example calculations for estimating total mortality based on hypothetical data collected over a 12-month period.
Variable Description Notation
Total number of turbines N
Interval between searches
Total number of carcasses found C
Number of turbines sampled K
Average length of stay (days) t
Searcher detection probability p
- -Product of t and p t *p
Estimated total number of carcasses for the 12 month period m
Variance of m V(m)
Standard error of m SE(m)
90% Confidence limits
Lower limit II
Upper limit ul
1. Variance is 0 because all turbines were searched.
Value
69
28
2
69
12
0.90
11
5.2
1.26
1.12
3
7
Variance Estimate
6.25
0.01
5.48
Standard Error
0.00
2.50
0.05
...

Statistical Methods / WP. Erickson et al. 181
Literature Cited
Cochran, W.G. 1977. Sampling techniques, 3rd ed. John Wiley & Sons, New York, NY.
Cressie, N. 1991. Statistics for spatial data. John Wiley & Sons, Inc. New York, NY. 900 p.
Goodman, L.A. 1960. On the exact variance of products. J Am. Statist. Assoc. 55:708-713.
Green, R.H. 1979. Sampling design and statistical methods for environmental biologists. John Wiley & Sons, New York, NY. 257 p.
Guenzel, R.J. 1997. Estimating pronghorn abundance using aerial line transect surveys. Wyoming Game & Fish Dep., Cheyenne, WY. 174p.
Hosmer, D.W. and S. Lemeshow. 1989. Applied logistic regression. John Wiley & Sons, New York, NY.
Johnson, G.D., W.P. Erickson, M.D. Strickland, M.F. Shepherd and D.A. Shepherd. 1998a. Avian monitoring studies, Buffalo Ridge, Minnesota Wind Resource Area, 1996-1997. Rep. from WEST Inc., Cheyenne, WY, for Northern States Power Co., Minneapolis, MN. 178 p.
Johnson, G.D., D.P. Young, W.P. Erickson, M.D. Strickland, C.E. Derby and J.W. Kern. 1998b. 1995-1998 Wildlife monitoring studies, SeaWest Windpower Plant, Carbon County, Wyoming. Rep. from WEST Inc., Cheyenne, WY, for SeaWest Energy Corp., San Diego, CA, and U.S. Bur. Land Manage., Rawlins District Office, Rawlins, WY. 178 p.
Krige, D.G. 1951. A statistical approach to some mine valuation and allied problems at the Witwaterstrand. Masters thesis, Univ. ofWitwaterstrand, South Africa.
Moran, P.A.P. 1950. Notes on continuous stochastic phenomena. Biometrika 37:17-23.
Shumway, R.H. A.S. Azari and P. Johnson. 1989. Estimating mean concentrations under transformation for environmental data with detection limits. Technometrics 31(3):347-356.
General Discussion
Mr. Erickson's presentation was followed by a senes of short questions and discussions, as summarized below:
Crippling bias is an issue in at least some studies, and is not estimated in the approach discussed here. This occurs when a bird is struck and wounded, flies or glides beyond the search area, and then dies. Mr. Erickson agreed that crippling is not assessed well in .the present procedure. The search area could be increased, but how large an area would need to be searched?
Is there allowance for the density (spacing) of turbines when considering risk? No, not in the procedures described here. The exposure index is study specific; it is used to rank species with regard to risk within a given wind plant. This becomes an issue when comparing different wind plants. One attendee liked the idea of separating exposure index from turbine density effects. Erickson noted that confidence intervals (CIs) could be derived for the exposure index as it is the product of three random variables whose individual CIs have been estimated. However, it may be premature to combine these to derive the CI of the exposure index.
Is the low searcher efficiency for small birds (20%) a concern? Do searchers need to be better trained? If trained technicians dedicated to this task find so few of the carcasses, of what value are searches by industry personnel (windsmiths)? Mr. Erickson replied that, when designing the carcass search protocol, a balance is sought between searching each area more thoroughly vs. searching more areas. The missed birds are taken into account by correction factors derived from the missed-carcass studies, but low detection rates do decrease accuracy. Dr. Strickland did not consider training to be an issue; detection of carcasses is primarily a function of commitment, not training. Another attendee

,.......---~------ ~-- ----~ -----------
182 National Avian - Wind Power Planning Meeting III
commented that, in some studies of nocturnal kills by tall towers, 50% of carcasses are scavenged by daybreak. Perhaps some scavengers learn that the area near a tower is a good feeding area. In the U.K., according to Stewart Lowther, trained dogs are used to find carcasses.
J

Development of a Practical Modeling Framework for Estimating the Impact of Wind Technology on Bird Populations
Introduction
by
Michael L. Morrison i and Kenneth H PolloclC
I California State University, Sacramento 2 North Carolina State University, Raleigh
The goal of this project is to develop a useful, practical modeling framework for evaluating potential wind-farm impacts that can be generalized to most bird species. We accomplish this by (I) reviewing the major factors that can influence the persistence of a wild population; (2) briefly reviewing various models that can aid in estimating population status and trend, including methods of evaluating model structure and performance; (3) reviewing survivorship and population projections; and (4) developing a framework for using models to evaluate the potential impacts of wind development on birds. The complete development of this project was presented in Morrison and Pollock (1998) and Morrison et al. (1998). Below we briefly summarize the salient findings of our project.
Development of Conceptual Framework
We first reviewed the major factors that can influence the persistence of a population. These factors must be considered when developing a study plan for evaluating the potential impacts of developments. The major factors discussed were as follows:
Demography.-Demography is the study of population statistics, including births, deaths, immigration, and emigration. Conditions leading to extinction are most likely to occur in small populations because individuals do not survive for the same length of time, individuals vary in the number of offspring they bear, individuals often have low birth rates, and so forth. Such effects are sensitive to population size, and their influences decline as population size increases. Larger total sample sizes are needed to characterize a population if it is effectively divided into many local subpopulations (which is likely in the case of birds with regard to wind development). At low densities, a threshold or critical population size can exist below which extinction is probable. For example, limitations to juvenile dispersal can create an extinction threshold in territorial species (Lande 1987).
Adult survivorship is usually very high, especially in long-lived species such as raptors. Therefore, estimating adult survivorship tells one a lot about population status (Lande 1988). In addition, in most monogamous species, it is female survivorship that is most important to population persistence (e.g., Wootton and Bell 1992). At a minimum, then, quantifying adult survivorship provides a preliminary, basic indication of the status of the population.
Genetics.-Boyce (1992) concluded that, in evaluating population persistence, it is not likely to be as important to model genetics as to model demographic and ecological processes. He based this conclusion, in part, on the lack of sufficient understanding of genetics to use it as a basis for management.
I Department of Biological Sciences, California State University, Sacramento, CA 95819. Phone and Fax: 209-267-1840. E-mail: [email protected]
2 Department of Statistics, North Carolina State University, Raleigh, NC 27695.
183

184 National Avian - Wind Power Planning Meeting III
Thus, practical considerations were the overriding factor in his conclusion. Still, genetics may be a priority in small, isolated populations.
Environmental Stochasticity.-Random environmental events such as catastrophic fires, hurricanes, and disease can have pronounced effects on small populations. Such factors can also have pronounced effects on large populations that are spatially divided into subpopulations. Here, factors such as dispersal will determine the fate of a subpopulation driven to very low numbers, or even to extinction, by a catastrophic event. It is also important to understand the variance structure of the population; that is, the extent to which environmental stochasticity affects individuals differently. A major problem here, however, is that the difficulties involved in sampling and characterizing a variance adequately may overwhelm any attempts to decompose a variance into individual and environmental components. Thus, to assess the relative importance of environmental stochasticity, one must understand the spatial distribution of the population under study.
Life History.-The characteristics that we collectively call life-history parameters of animals include quantifiable longevity, lifetime reproductive output, the young produced per breeding attempt, the age of dispersal, survivorship, sex ratio, and the time between breeding attempts. Some of these characteristics vary with the age of the individual; thus, these parameters change during the lifetime of an animal. For example, young and old individuals tend to produce fewer viable young than do animals in their prime. In addition, these factors can interact in various ways that modify the expression of other factors. Life-history parameters are used in the development of population-projection models. For example, when particular parameter values are selected from the observed ranges of values, the specific values chosen can result in substantially different estimates of the rate of population change. Such analyses provide guidance on whether the population can be sustained under varying expressions of life history traits. Once such relationships are understood, researchers have the opportunity to monitor selected life history traits as part of an assessment of the status of a population. For example, if previous work shows that the timing of breeding is correlated with reproductive output, and thus with the population size for the year, monitoring the time of breeding can provide an early warning of potential population-level problems.
Ecological Factors.-Temple (1985) found that, of the birds currently endangered by extinction, 82% of the cases are associated with habitat loss, 44% with excessive take, 35% by introductions of exotics, and 12% by chemical pollution or the consequences of natural events. It is easier to quantify and model habitat parameters, and their influence on some index of population abundance and life-history traits, than it is to quantify and model demographic parameters adequately. However, it is difficult to evaluate the reliability or precision of these indices without some type of calibration based on measured values.
Survivorship and Population Projections
We reviewed major wildlife and ornithological journals (e.g., Journal of Wildlife Management, Condor, Auk, and Journal of Raptor Research) published during the past 20 years to determine if any commonality existed among species with regard to annual survivorship. Most data in the articles examined were based on either short-term (usually 1-3 years) telemetry studies, or analyses of band returns over an extended period of years. Most of the band-return data were obtained from waterfowl harvested by hunters.
In summary, only very broad generalizations can be drawn regarding "normal" survival rates of avian populations. Further, yearly variability in survivorship is large even in healthy populations, which makes short-term (1-2 year) evaluations of a population suspect.

r Modeling Framework I ML. Morrison & K.H. Pollock 185
Model Development: Examples for Wind-Power Applications
To aid in providing general guidelines concerning the potential impacts of wind developments on bird populations, we conducted sensitivity analyses to determine the effects of survival by age classes on population growth rates. Population growth rates are represented by lambda (A), the annual rate of population change. Lambda is 1.0 for a stable population, <1 for a declining population, and> 1 for an increasing population. We gathered data from the literature on passerines, ducks, geese, gulls, and eagles. These analyses provide a fIrst approximation of how populations of these types of birds respond to hypothetical changes in fecundity and survivorship. They can be used to help focus attention on species most likely to be adversely affected by changes in fecundity and survivorship.
For passerines, the curves show that lambda is much more sensitive to changes in the juvenile survival rate than to changes in the adult survival rate. Also, the juvenile survival rate curve has a very steep slope as juvenile survival becomes very small.
For ducks, the curves show that lambda is roughly equally sensitive to changes in the survival rates of juveniles and adults.
For gulls, the survival rates of non-adult age classes seem to have little impact on the value of lambda. For the adult age class, lambda is extremely sensitive to changes in the adult survival rate. Except for very small survival rates, changes in survival by the adult age class give the largest change in lambda. The other classes all have very similar curves.
For eagles, the situation is very similar to that for the gull, but even more extreme. There is great sensitivity of lambda to changes in adult survival rate.
Surrogates
One of our objectives was to evaluate the use of surrogates, or indices, of survival and population trends. Temple (1985) suggested that the causes of a popUlation decline might be readily identifIed by measuring productivity and comparing it with the values expected for the species of concern. If productivity seemed suffIciently high to balance the expected level of adult mortality, then the cause of the decline could be identifIed, by elimination, as low adult survival. Survival rates were considered by Temple to be too diffIcult to measure directly given the time and money that is usually available. Our review indicated that productivity may serve as at least a crude indicator of the trend in population abundance.
Based on our review, it seems that the appropriate hierarchical framework for evaluating population responses to perturbations is as follows:
1. empirical data 2. surrogates 3. model with available data (Leslie matrices).
Acknowledgements
We thank Holly Davis, Robert Thresher, and Karin Sinclair, National Renewable Energy Laboratory, for initiating and funding this study; William Kendall, Lawrence Mayer, Dale Strickland, and Kenneth Wilson for reviewing the text; and Ann Oberg for assisting with analyses.

186 National Avian - Wind Power Planning Meeting III
Literature Cited
Boyce, M.S. 1992. Population viability analysis. Annu. Rev. Ecol. Syst. 23:481-506. Lande, R. 1987. Extinction thresholds in demographic models of territorial populations. Am. Nat. 130:624-635. Lance, R. 1988. Demographic models of the Northern Spotted Owl (Strix oecidentalis eaurina). Oeeologia 75:601-607.
Morrison, M.L. and K.H. Pollock. 1998. Development of a practical modeling framework for estimating the impact of wind technology on bird populations. Nat. Renewable Energy Lab., Golden, CO. Morrison, M.L., K.H. Pollock, A.L. Oberg and K.C. Sinclair. 1998. Predicting the response of bird populations to wind-energy related deaths. p. 157-164 In: W. Musial and D. Berg (tech. eds.), 1998 ASME Wind Energy Sympos. Am. Inst. Aeronaut. & Astronaut., and Am. Soc. Mech. Engineers, New York, NY. Temple, S.A. 1985. The problem of avian extinctions. Current Ornithol. 3 :453-485. Wootton, IT. and D.A. Bell. 1992. A metapopulation model of the Peregrine Falcon in California: viability and management strategies. Eeol. Applie. 2(3):307-321.
General Discussion
There was a lengthy question and answer session after this paper, in some cases involving discussion among several meeting participants. The following paragraphs summarize the main topics addressed:
Do population parameters change as a function of population size, and is this allowed for in the modeling approach that is proposed? For example, are birds that are capable of producing and rearing two successive clutches in one year more likely to do so when the population size is lower? Or do they tend to lay more eggs per clutch when population size is lower? Dr. Morrison indicated that some bird species have been shown to have density-dependent reproduction rates, but the situation in various species is often uncertain, and the answer may depend on species and other factors. He noted that this model is a simple one, intended primarily to show the basic interactions of survival and fecundity in affecting population size. This model can only provide a first approximation when used to estimate population effects.
Dr. Mayer mentioned, and Dr. Morrison agreed, that these types of equilibrium models are designed to assess the effects of small perturbations; they are not suitable for modeling the consequences of drastic changes in population parameters.
How can the model be used to interpret and complement field studies of birds at wind power facilities? Dr. Morrison suggested that, as an example, the model could be useful in assessing the consequences if the field data show a skewed age structure amongst the fatalities. If the field study provides data on fecundity and survivorship, the model can be used to predict the consequences for population size.
Can we speculate as to whether bird mortality in wind plants is compensatory or additive? (Compensatory mortality refers to the situation where a change in the death rate attributable to one cause will be made up by a complementary change in the death rate attributable to another cause, resulting in no net change in overall death rate. Additive mortality refers to a situation where a change in the death rate from one cause has no effect on the death rate from other causes.) Dr. Morrison indicated that this may be largely an academic question. However, he noted that deaths due to collisions with turbines may have

r I I
Modeling Framework / ML. Morrison & K.H Pollock 187
a different age composition than deaths attributable to other causes, and that mortality in wind plants may not be compensatory.
How many years of population data are needed to obtain a reliable estimate of A? This depends on population structure and variability. A larger sample size is needed when survival is low than when it is high. Also, there are interactions between the sample size per year and required number of years. The confidence intervals around A are a function of the number of birds, the number of years, and survivorship. When data on population parameters are not available, or are based on inadequate sample sizes, it may be useful to look at the percentage of subadults that are breeding as a surrogate variable.
How can the cumulative impacts of multiple sources of mortality be dealt with in the models, and can the models be used to help assess cumulative impact? When mortality attributable to different sources is known, as for the Golden Eagles at Altamont Pass (see section of these Proceedings by G. Hunt et a1.), the model can be used to assess the effect of any given mortality source (measured or assumed) on A. For example, the model could be used to estimate the effect on A if deaths attributable to wind turbines were reduced to zero. One of the main values of these models is to assess the robustness of a population in response to changes in the various parameters. Dr. Morrison mentioned that there is a small section in the "Guidance Document" 3 concerning assessment of cumulative impacts.
If there is a year-to-year trend in the age/sex composition of bird fatalities at a wind plant, could one infer that there is a population effect? This would be a strong indicator that some change in the population was occurring, and would indicate the need for more detailed investigation. Also, if there were a difference in the composition of fatalities in the wind plant as compared with other nearby areas, this would also suggest a need for further investigation.
Would the type of model developed for the Golden Eagles in the Altamont Pass be suitable for raptors in general, or for other birds? Dr. Hunt indicated that an equilibrium model would apply to any territorial species, but not to non-territorial species.
Is the pool of floating, non-territorial Golden Eagles in the Altamont critical to maintaining the population? If juvenile or floating eagles are being killed disproportionately, due to their mobility or lack of experience in the wind plant, is that a problem? Dr. Hunt said that the floaters are critical to maintaining the breeding population, as the pool of floaters is the source of replacements for dead adults. However, adult survivorship is critical in a long-lived species like this; an adult is more critical to the population than a floater. One of the strengths of a radio-telemetry study like the one done on Golden Eagles in the Altamont is that it provides data on the status of the eagles killed, and often on the reason for the death.
3 Anderson, R., M. Morrison, K. Sinclair and D. Strickland, with H. Davis and W. Kendall. 1999. Studying wind energylbird interactions: a guidance document. Nat. Wind Coord. Commit., c/o RESOLVE, Washington, DC. 87 p. Available at www.nationalwind.org/pubs/default.htm
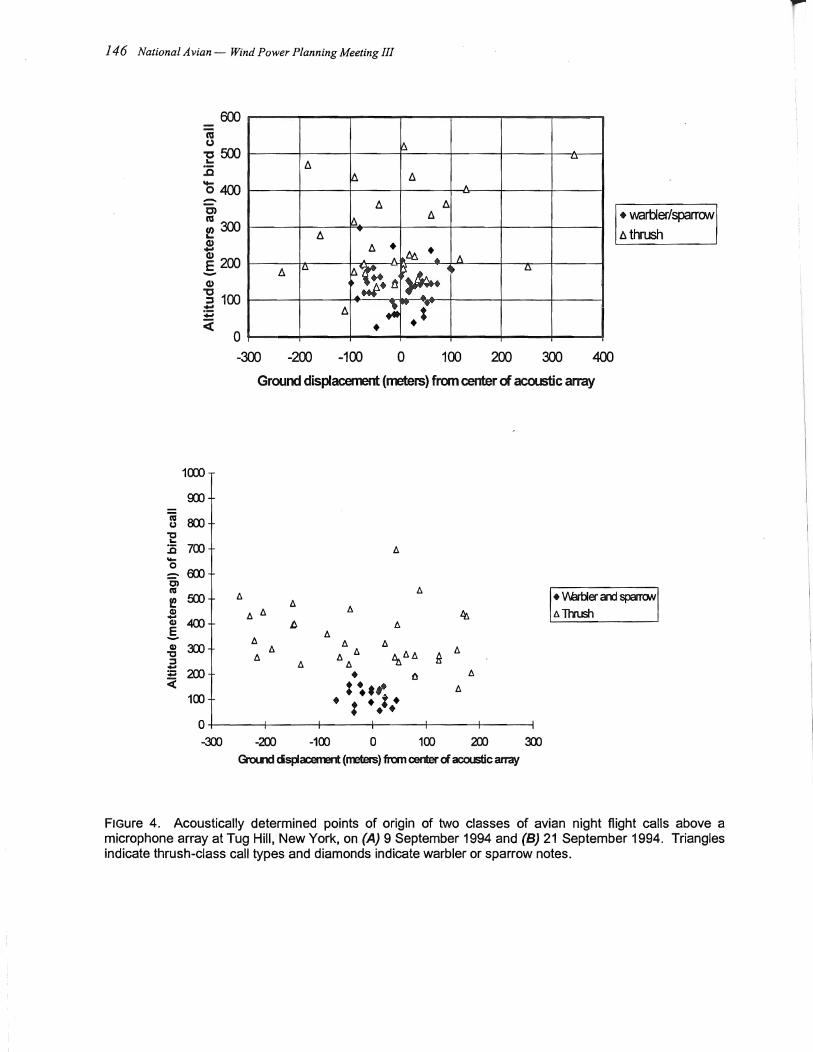
..-- --
RESEARCH PRIORITIES AND DATA GAPS
On the last day of the three-day meeting, after hearing presentations on current and proposed research, a roundtable discussion was held. The purpose of this discussion was to identify information gaps, research questions, and data needs that were not likely to be addressed adequately as part of the then-ongoing resarch. After an initial discussion, the facilitator led the group through a review of all ideas; the product is summarized below. The text in italics represents the facilitator's record of the group's intent. Additional notes concerning the discussion have been added by the facilitator and editors.
Gap: Nocturnal Migration and Other Nocturnal Activity In general the participants agreed that conducting nocturnal research was a High Priority. • Cost of available respective technologies. What is the most cost-effective method of addressing the data gap concerning nocturnal activity?
• Basic research on nocturnal migration. There is need for more fundamental research on key aspects of nocturnal migration, such as low-level nocturnal migration and species-specific data. • Much more information is needed on the altitude and horizontal distribution of nocturnal migrants. • Many studies at planned or operating wind plants have not gathered data on bird use of the area at night, especially nocturnal migration; such studies are a high priority.
• Need to continue designing and developing optimal nocturnal observation and recording techniques, and to develop more experience in their use, e.g. use of radar to determine bird altitudes; use of acoustical methods to identify species of birds migrating overhead at night. • We need to assess the benefits of employing combinations of complimentary techniques to document nocturnal migration. To avoid weaknesses with anyone technology, use a combination of technol
ogies. The available new techniques and/or combinations of techniques address gaps or weaknesses found in the past with nocturnal studies.
Gap: Risk Assessment
In general the participants agreed that developing a "universal approach" to risk assessment was a High Priority.
• Prioritize bird populations based on level of concern, which is a function both of potential risk and of legal mandates. We need a prioritized list of the species that are most important. Some species are very unlikely to be impacted by wind turbines, whereas others definitely will be susceptible. We need to focus on the latter group. Species at risk already are ranked by "Partners in Flight" insofar as risk to populations is concerned. However, the risks specifically associated with susceptibility to wind turbine collisions also need to be considered. In other words, there is need for a ranking of species with respect to their likelihood/susceptibility to be at risk from wind turbine collisions.
• What are the characteristics of a species that make it vulnerable to wind turbine collisions? What are the relationships between technology and biology that lead to vulnerability? • There is a need for a means to quantify and qualify risk, e.g. for ranking sites and species of concern. We need to identify what aspects of risk, relative risk, and impacts (direct and indirect) we can
188
r Research Priorities & Data Gaps 189
measure, and we need to agree on methods for defining and measuring risk. How do we connect what is being measured with the assessment of risk, relative risk, and direct and indirect impacts? The discussion of this data gap raised several points. How are data on seasonal use of a wind plant by birds (and other wildlife) used in assessing risk? What should researchers focus on to quantify risk?
II Need to continue to import more ideas from epidemiology - e.g., loss of expected days of life, cost/day/quality life saved, attributable risk, difference between mortality and fatality.
Gap: Behaviors that Lead to Collisions
In general the participants agreed that research into visual cues and behaviors that lead to collisions, as well as techniques to modify behavior in order to prevent collisions, is a High Priority.
II The behaviors that lead to bird collisions with wind turbines, and the sensory perceptions that cause birds to avoid collisions, are poorly understood and need to be studied.
II How can we modify the behavior of birds to avoid collisions with wind turbines?
Gap: Impact Reduction Techniques
In general the participants agreed that research into on- or off-site mitigation techniques directed at minimizing collisions is a High Priority. Some parties suggested expanding this to minimizing not only collisions, but also habitat disturbance.
II Mitigation studies. More information is needed regarding potential mitigation techniques, both onsite and off-site. The discussion of this data gap concerned how to define mitigation, on-site versus off-site mitigation, and compensation as a mitigation technique.
II Assess whether there are "preferred" turbine types - or at least certain turbine characteristics that result in reduced impacts. Are some turbines safer than others? If so, what are the features of relatively benign versus risky turbines? We need to know why a minority of turbines are responsible for a disproportionate number of bird fatalities in the Altamont WRA. More study is required of the visual cues that birds use in avoiding obstacles, and their application to turbine design. What is the significance of turbine blade tip speed and rpm?
• What can be done to mitigate impacts, given limited knowledge, time constraints, and the costlbenefit ratios of different technologies and impact-reduction strategies? What do we need to do and how does this relate to available budgets and time? We need more information on cost-benefit aspects of research and field trials. We need to recognize that there can be a difference between what we want to do and what we can do.
II It is important to document what is known about the mitigation aspects of turbine design, effects on habitat, etc., so the most appropriate approaches can be applied elsewhere.
II What are the species that are vulnerable? What are the characteristics of a species that make it vulnerable to wind turbine collisions? What are the relationships between technology and biology that lead to vulnerability? Can knowledge about bird biology (e.g., perception) help in designing a wind plant that has reduced impacts on birds?
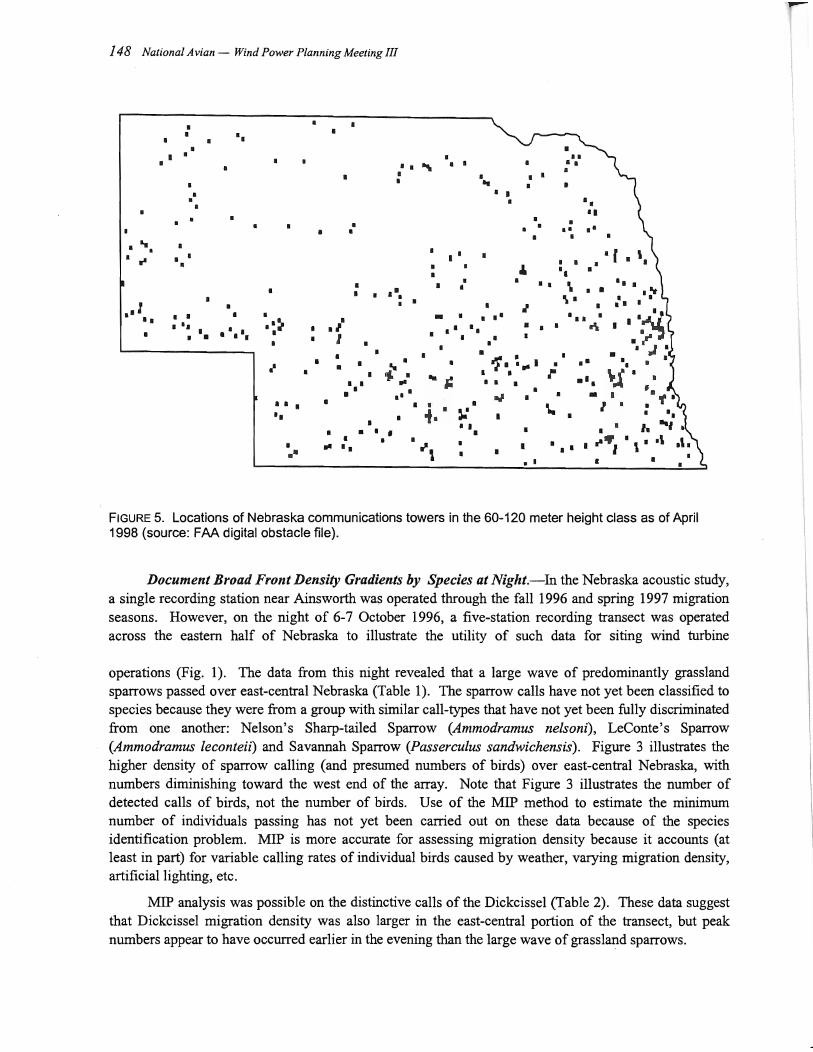
190 National Avian - Wind Power Planning Meeting III
Gap: Whether and How to Apply Adaptive Management to Avian - Wind Power Interactions In general the participants agreed that a High Priority would be to clarify· what adaptive management is, explore how adaptive management could be applied to avian - wind power interactions, and then decide whether and/or how it could be pursued.
• We need a "best management practices" vehicle, such as adaptive management, to synthesize recommended procedures for mitigating wind turbine impacts on birds. It is not easy for a State to develop this. It was agreed, following a lengthy discussion, that this was an important point requiring further investigation. Adaptive management has promise as a means of interfacing science and management, and in bringing stakeholders together. How can adaptive management be applied to address avian - wind energy interactions? Are there case studies that can be investigated?
Gap: Impact of Habitat ChangeiDisturbance on Particular Species • Much more attention has been paid to assessing collision risks than to assessing indirect impacts. We
need to look at indirect impacts more closely. These include disturbance, habitat alteration, and habitat loss. These may be more important than collision risks in some areas and habitats.
• Indirect impacts often are part of the EIS process and are addressed through that reporting requirement.
• Habitat issues were identified as a particularly important type of indirect impact. Habitat impacts are site-specific, depending on such particulars as the extent and placement of roads and turbine pads. • Although habitat may still be physjcally present after a wind plant is constructed (i.e., not destroyed
by construction activities), it may not be used by birds because of disturbance effects of the wind turbines.
• Should consider all aspects of the wind development, including infrastructure such as road and pad construction. We lack the tools to estimate the impacts on birds associated with features of a wind plant other than the turbines, such as meteorological towers, substations, and overhead and/or underground wires. Not all impacts are being considered.
• How can indirect impacts be minimized?
• What can be learned and applied from other related types of development? • What is the impact of habitat changes caused by wind plants in northeastern forests? Most avian -wind power research reported to date has been conducted in open habitats. There is a need for more
research on the impacts of wind energy installations in forested habitats (e.g., forest fragmentation effects).
Gap: Local Topographic/Geographic Influences on Bird Migration This was identified as High Priority.
• Some parties expressed an interest in increasing our understanding of how local topographic features affect migration routes and altitudes, especially with regard to concentrating night migrants.
Research Priorities & Data Gaps 191
Gap: ShortILong Term Impact Studies, and Studies of Scale and Impacts
• Study length. There is a need for long-term studies, especially to address indirect impacts. How long is a "long study"? How long do studies need to be? What is the relationship between costs, benefits, and study duration? The required length of a study depends on what you are studying. Perhaps a question to ask, when considering whether to continue a study, is "What is the marginal benefit of another year of study?" This was given a Low Priority ranking.
• Scale of impacts. Information is needed on the relationships between impacts and ¢e scale of a wind plant (e.g., number of turbines, turbine spacing). Are impacts related to the size of the project? Is the relationship linear, or exponential, or is there a threshold effect? Are there cumulative impacts with more and larger wind farms? Does the barrier effect of large wind farms increase in a linear or exponential manner? There is a need for tools to estimate the impact of increasing the size of a wind project. This was identified as a High Priority data gap.
Gap: Synthesis of Ongoing Studies
• Need for a rigorous synthesis of ongoing studies (meta-analysis) for the purposes of generalizing results to other wind plants, and comparing impacts of wind plants vs. other industries or human activities on birds.
• Need to think beyond current individual research projects; question how to draw together information from many individual projects and, through meta-analysis and development of validated models, identify and document approaches for reducing impact.
• Need to place bird - wind power impacts into perspective. We need to compare the number of fatalities caused by wind energy deVelopments with other sources of bird fatalities. Many human activities and facilities cause bird fatalities, but there is no comprehensive analysis of the relative impacts of those activities on birds. We need to increase communication with other researchers who study the issue of birds and tall, man-made structures (such as radio towers).
• Can we apply what has been learned (e.g., about the impacts of different turbine designs and habitat alterations), to predict and mitigate impacts at new sites? Do we need more tools and data to do this? This is important from the perspective of the regulator who wants to know how to deal with wind farms.
III We need systematic methods to better synthesize information across similar studies. 'Participants thought that the synthesis of study results has begun, but further synthesis should be encouraged.
• We need to reduce the need for lengthy and expensive studies at each new site by bringing together what we know now, perhaps with modeling approaches, and apply it to new sites. How can existing results from large studies conducted elsewhere be combined with limited site-specific studies at a new site, to assess and predict impacts and thus decide whether or how to proceed?
III There is a need to develop models that can predict impacts at proposed sites, and reduce the need for lengthy and costly field studies. A paper by Michael Morrison and Kenneth Pollock, presented at this meeting, presents a modeling framework to address wind technology impacts on bird populations.

---- - - ----------~----~-.....-- .. --_._._- -----.----~--.. ------
192 National Avian - Wind Power Planning Meeting III
Gap: Need To Conduct Research on Large (e.g. 750 kJfJ Turbines
This was identified as High Priority.
411 Most of the research is being conducted on wind turbine technology that will be replaced in the future. Research on the impacts oflarger turbines (e.g., 750 kW) will be necessary.
Gap: Carcass SearcheslWhen is Carcass Detection No Longer Needed?
• Carcass searches are a component of most studies, but such searches are well known to have limitations. Carcass searches also are time consuming, and limited budgets may be better spent in addressing other data needs, such as documenting nocturnal activities. Are carcass searches necessary if few birds use the site? Participants discussed this, and whether more emphasis ought to be placed on other topics such as poisoning, nocturnal behavior, etc. It was generally concluded that carcass searches are necessary. Carcass searches are a method that estimates "incidental take", a legislated requirement. Thus, there are two parts to the discussion of carcass searches - technical, and policy or need. It was decided to reword this data gap as, "When is carcass detection no longer needed?". This was identified as a Low Priority data gap.
Gap: How To Make Short-Term Monitoring Most Effective
• Some participants wanted more information on how to make the most of short-term monitoring. They sought an index that would provide guidance regarding when a proposed wind power facility is small enough such that large studies are not necessary. How can we make monitoring most effective when limited time and budgets are involved? This point elicited a lengthy discussion, much of it revolving around how best to streamline the impact assessment process. The required duration and depth of a study depend on the questions that need to be answered, which often depend on legislated requirements. Methods to select and conduct the appropriate study for a site are addressed in the "Guidance Document" (see Anderson et al. 1999).1 The regulatory requirements of decision makers need to be addressed to streamline the process. It was felt that, as more research is conducted and the synthesis of results continues, the process will be shortened and improved. Nevertheless, the quality of the science demands that adequate effort and time be spent.
Gap: Application of Standard Comparable Methods to Altamont
411 There is need for a comprehensive, rigorous study of bird use and fatalities to be conducted at the Altamont Wind Resource Area. The Altamont is the largest wind development, and the "worst" known site in terms of fatalities of highly-valued birds. A study in the Altamont consistent with the studies that have been conducted at Tehachapi and San Gorgonio (see Anderson et aI., these Proceedings) would be very valuable.
411 This item was listed during the brainstorming session. During the review of the items identified during that session, this topic was glossed over by the facilitator. After the meeting, a number of meeting participants asked that this item be placed back on the priority list. This summary recognizes
1 Anderson, R., M. Morrison, K. Sinclair and D. Strickland, with H. Davis and W. Kendall. 1999. Studying wind energy/bird interactions: a guidance document. Nat. Wind Coord. Commit., clo RESOLVE, Washington, DC. 87 p. Available at www.nationalwind.org/pubs/default.htm
Research Priorities & Data Gaps 193
this request. However, because the group moved through the material too quickly, all participants did not have an opportunity to discuss whether or not this is a high priority.
Gap: Improvements in Altitude Estimates
• Additional work is needed to improve the ability of observers to estimate distances to birds, and to estimate altitudes of birds, in studies where no radar is used. Are observers' visual estimates adequate?

--194 National Avian - Wind Power Planning Meeting III
CONCLUSIONS
National Avian - Wind Power Planning Meeting ITI was held in May 1998. It demonstrated that much progress has been made in designing and implementing field studies, analyses and models that can be effective in predicting and measuring the impacts of wind power developments on birds. The presentations at the meeting also were notable in showing the geographic expansion of research on this topic within the U.S.A. and in Europe. In addition to several presentations concerning studies in California and Europe, this meeting included papers describing major studies in Washington, Wyoming, Colorado, Minnesota, Wisconsin and Vermont, plus additional methodological work in Nebraska, New York, and elsewhere. There is a need to continue many of these studies for sufficient time to ensure that the results are clear and robust. There is also a need to expand some of these studies to document additional relevant parameters. These include low-altitude nocturnal migration and impacts other than direct collisions with wind turbines (e.g., disturbance; habitat loss).
The presentations at the meeting provided a good basis for a discussion among meeting participants regarding remaining data gaps and research needs. A total of 14 different data gaps/research needs were identified. No specific priority was discussed for some of these topics, but at least eight of the topics were listed as being "High Priority":
II Nocturnal migration and other nocturnal activity,
II Risk assessment,
II Behaviors that lead to collisions,
II On-site impact reduction techniques,
II Whether and how to apply Adaptive Management to avian - wind power interactions,
II Local topographic/geographic influences on bird migration,
II Shortllong term impact studies, and studies of scale and impacts,
II Need to conduct research on large (e.g. 750 kW) turbines.
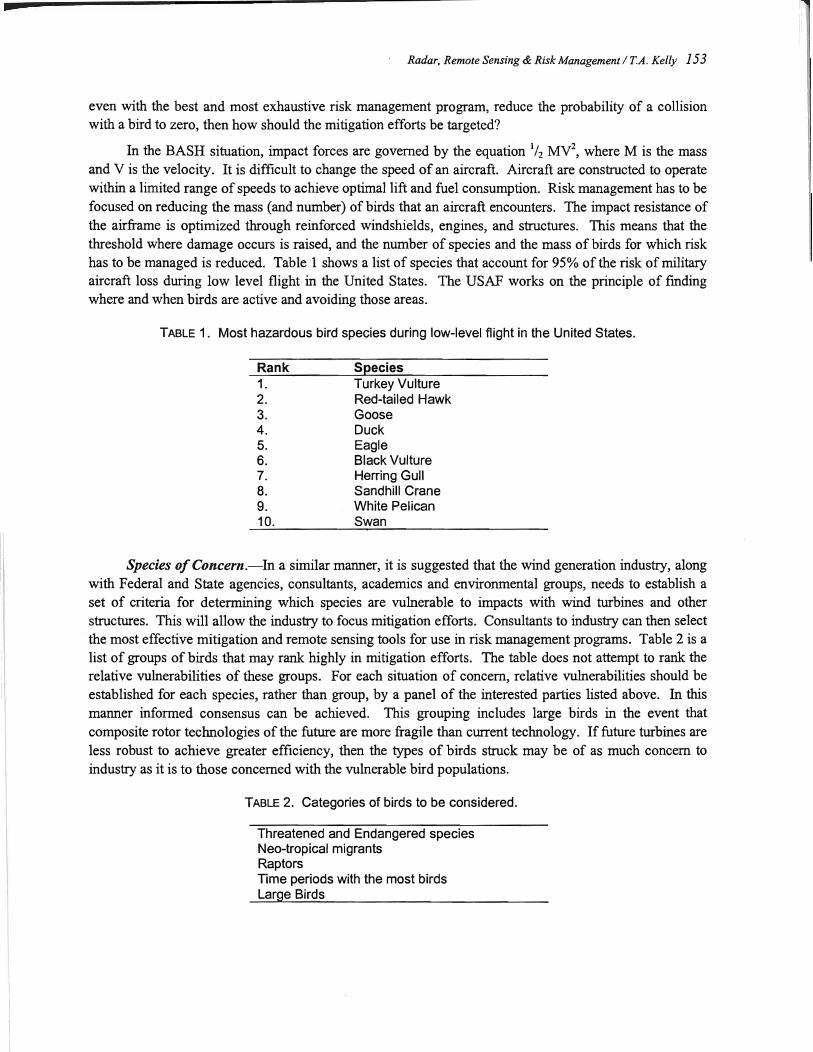
APPENDICES
Appendix 1. Meeting Participants
Anderson, Richard California Energy Commission 1516 Ninth Street Sacramento, CA 95814 916/654-4166 [email protected]
Arnold, Abby RESOLVE, Inc. 1255 23rd Street, NW, Suite 275 Washington, DC 20037 202/965-6211 [email protected]
Atwater, Ryan 510 Spinnaker Lane, #2 Green Bay, WI 54302 920/468-3302 [email protected]
Azeka, Mike SeaWest Energy Corp. 1455 Frazee Road, Suite 900 San Diego, CA 92108 619/908-3418 [email protected]
Bain, Don Renewable Resources Policy Analyst Oregon Office of Energy 6935 SW 45th Avenue Portland, OR 97219-1506 503/246-1132 [email protected]
Bissonnette, Michelle Braun Intertec 8585 West 78th Street Bloomington,N 55438 612/833-4650 [email protected]
195
Boyd,Hap Enron Wind Corporation 13000 Jameson Road Tehachapi, CA 93561 661/823-6734 [email protected]
Bragg, Charles National Audubon Society 585 Almar Ave. Pacific Palisades, CA 90272 310/454-9662 [email protected]
Buckley, Steve Alameda County Planning Department 399 Elmhurst Street, #136 Hayward, CA 94544 510/670-6556
Cooper, Brian ABRInc. PO Box 249 Forest Grove, OR 97116 503/359-7525 abroregon@aoLcom
Curry, Richard Curry & Kerlinger, L.L.C. 1734 Susquehannock Drive P.O. Box 66 McLean, VA22101 703/821-1404 RCA1817@aoLcom
Cutright, Noel Wisconsin Electric Power Company 231 West Michigan Street Milwaukee, WI 53201 414/221-2179 [email protected]
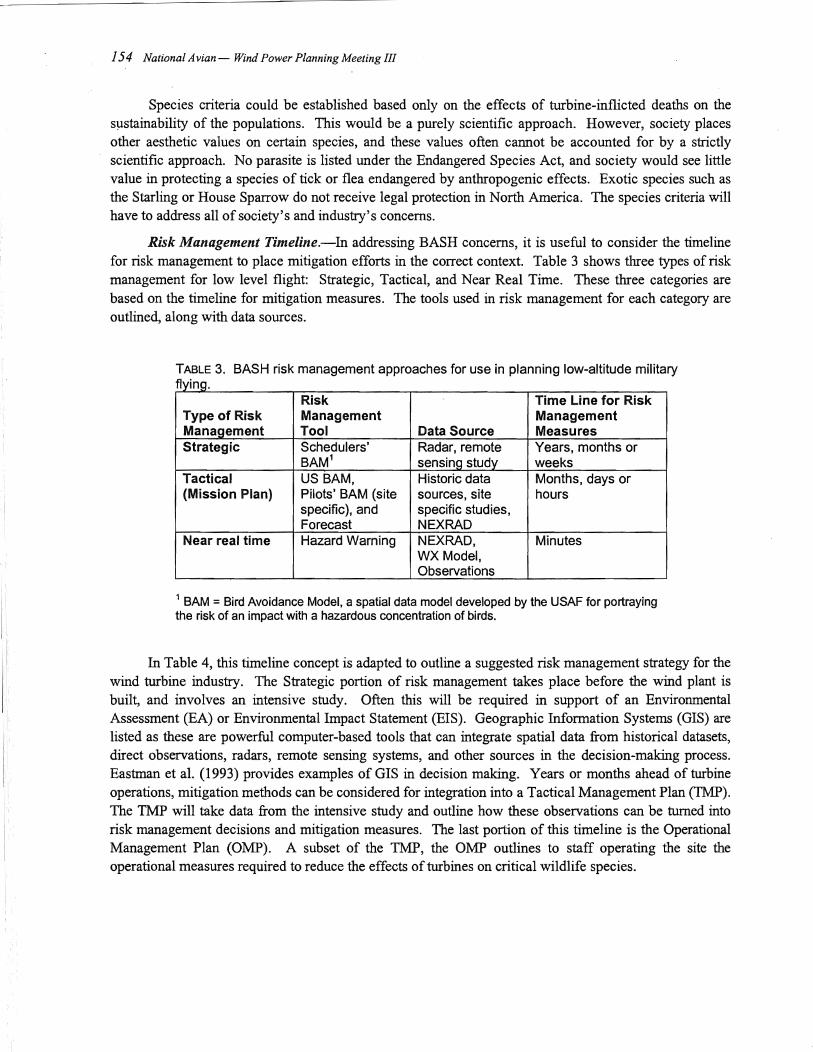
.......-------_.- -------
196 National Avian - Wind Power Planning Meeting III
Dedon,Mark Senior Biologist Pacific Gas & Electric Company Technical & Ecological Services 3400 Crow Canyon Road San Ramon, CA 94583 925/866-5829 [email protected]
Dirksen. Sjoerd Bureau Waardenburg bv P.O. Box 365 4100 AJ Culemborg The Netherlands 311345-512710 [email protected]
Erickson, Wallace Western Ecosystems Technology, Inc. 2003 Cental Ave. Cheyenne, WY 82001 307-634-1756 [email protected]
Evans, William P.O. Box 46 Mecklenburg, NY 14863 607/272-1786 [email protected]
Frank, Trisha Manzanita Tribe 1134 Sapphire Street San Diego, CA 92109 619/274-1987 [email protected]
Garrett, Monte PacifiCorp 920 SW 6th Ave. Portland, OR 97204 [email protected]
Gray, Thomas AWEA POBox 1008 Norwich, VT 05055 802/649-2112 [email protected]
Hanowski,JoPutn Natural Resources Research Institute University of Minnesota-Duluth 5013 Miller Trunk Hwy. Duluth, MN 55811 218/720-4311 [email protected]
Harris, Ross LGLLtd. 22 Fisher Street P.O. Box 280 King City, Ontario L 7B lA6 905/833-1244
Hartman, Larry B. Senior Technical Analyst Minnesota Environmental Quality Board 658 Cedar Street 300 Centennial Bldg. St. Paul, MN 55155 612/296-5089 larry [email protected]
Haukos, David Regional Migratory Bird Specialist U.S. Fish & Wildlife Service Department of Range, Wildlife, and
Fisheries Management Texas Tech University Lubbock, TX 79409-2125 [email protected]
Hunt, Grainger Predatory Bird Research Group University of California - Santa Cruz Long Marine Lab Santa Cruz, CA 95060 408/462-6229 [email protected]
Janss, Guyonne A.T. Clave Progreso 5 41013 Sevilla, SPAIN [email protected]
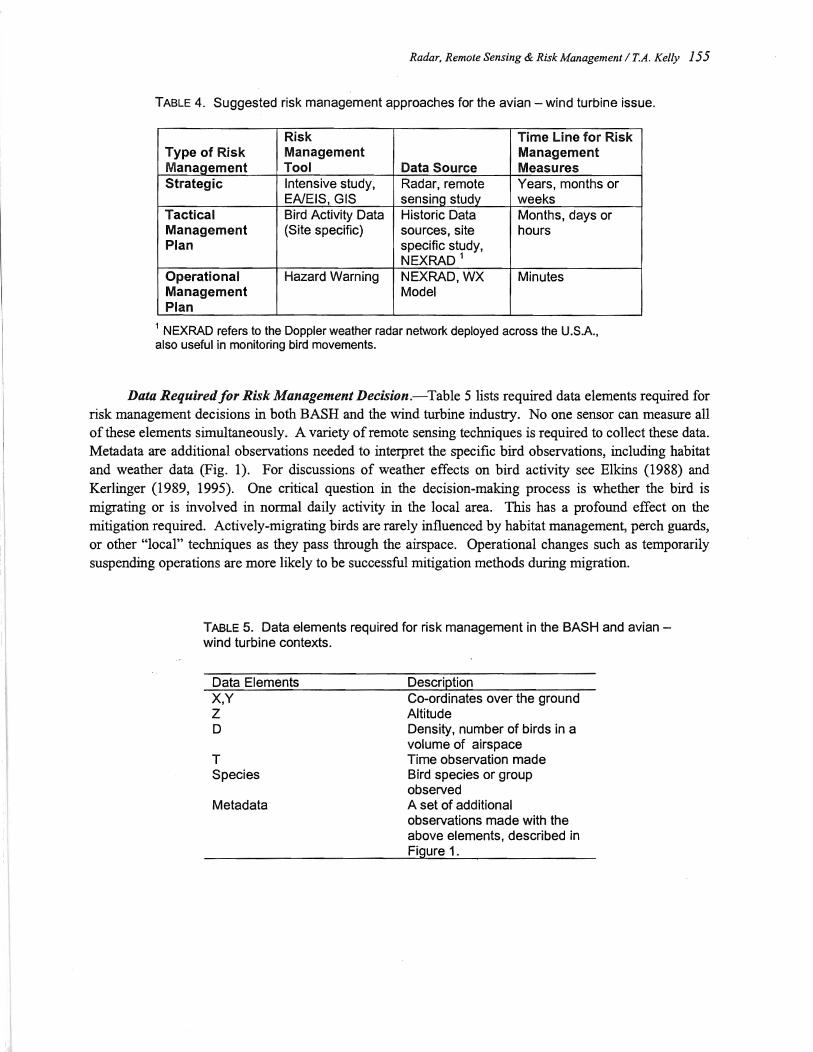
-----------------------~--------------
Kamm, Jennifer Braun Intertec Corporation P.O. Box 39108 Minneapolis, MN 55439-0108 612/833-4658 [email protected]
Kelly, T. Adam BASH Project Manager Geo Marine, Inc. 507 Hwy. 2297 Panama City, FL 32404 850/871-5657 [email protected]
Kendall, William U.S.G.S. Patuxent Wildlife
Research Center 11510 American Holly Drive Laurel, MD 20708-4017 3011497-5868 william_ [email protected]
Kerlinger, Paul Curry & Kerlinger, L.L.C. P.O. Box 453 Cape May Point, NJ 08212 609/884-2842 [email protected]
Linderman, Charles Director, Fossil Fuels & Renewable Programs Edison Electric Institute 701 Pennsylvania Avenue, N.W. Washington, D.C. 20024-2696 202/508-5652 [email protected]
Lowther, Stewart Casella Science and Environment Ltd. Yorkshire House Chapel Street Liverpool L39AG U.K. 44/151-255-1115 [email protected]
Appendix 1. Meeting Participants 197
Manville, Albert M. U.S. Fish & Wildlife Service Office of Migratory Bird Management 4401 N. Fairfax Drive, Suite 634 Arlington, VA 22203 703/358-1963 albert _ [email protected]
Mayer, Lawrence Good Samaritan Medical Center LL2, 1111 E. McDowell Phoenix, AZ 85006 602/239-4383 [email protected]
McGowin, Charles R. Manager, Wind Power Energy Conversion EPRI 3412 Hillview Avenue Palo Alto, CA 94304-1395 650/855-2445 [email protected]
Mellinger, David MBARI 7700 Sandholdt Rd. Moss Landing, CA 95039 408/775-1805 [email protected]
Morrison, Michael Department of Biological Sciences California State University Sacramento, CA 95819 916/996-2374 [email protected]
Richardson, John LGLLtd. 22 Fisher Street P.O. Box 280 King City, Ontario L7B lA6 905/833-1244 [email protected]
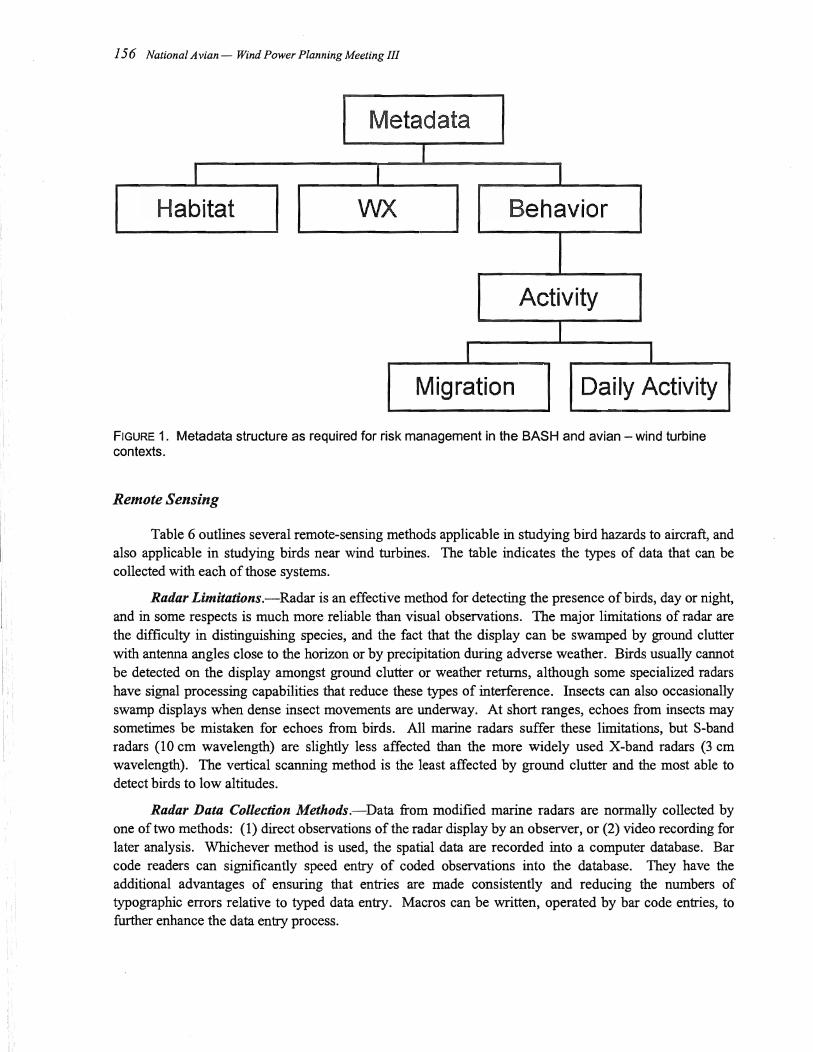
198 National Avian - Wind Power Planning Meeting III
Schooley. Thomas Washington Utilities and Transportation Commission PO Box 47250 Olympia, W A 98504-7250 360-664-1307 [email protected]
Sinclair, Karin National Renewable Energy Laboratory 1617 Cole Blvd. Golden, CO 80401 303/384-6946 karin _ [email protected]
Spiegel, Linda CEC 1516 Ninth Street - MS-40 Sacramento, CA 95814 916/654-4703 [email protected]
Stalker, Paul Zephyr North 4034 Mainway Burlington, Ontario CANADA L 7M 4B9 905/335-9670 [email protected]
Stewart, Joan M. Green Ridge Services Co. 6952 Preston Avenue Livennore, CA 94550 925/455-3144 joanie _ [email protected]
Stoddard, Detra RESOL VB, Inc. 1255 23rd Street, NW, Suite 275 Washington, DC 20037 202/965-6218 [email protected]
Strickland, Dale Western Ecosystems Technology, Inc. 2003 Central Avenue Cheyenne, WY 82001 307/634-1756 [email protected]
Thelander, Carl BioResources Consultants PO Box 1539 402 West Ojai Ave. Ojai, CA 93024-1539 805/646-3932 [email protected]
Thresher, Robert W. National Wind Technology Center National Renewable Energy Laboratory 1617 Cole Boulevard Golden, CO 80401-6922 303/384-6922 robert_ w _ [email protected]
U goretz, Steve Wisconsin Department of Natural Resources Energy Team P.O. Box 7921 101 S Webster Street Madison, WI 53707-7921 608/266-6673 [email protected]
Walton, Brian Predatory Bird Research Group UC Santa Cruz 1156 High Street Santa Cruz, CA 95064 408/459-2466 [email protected]
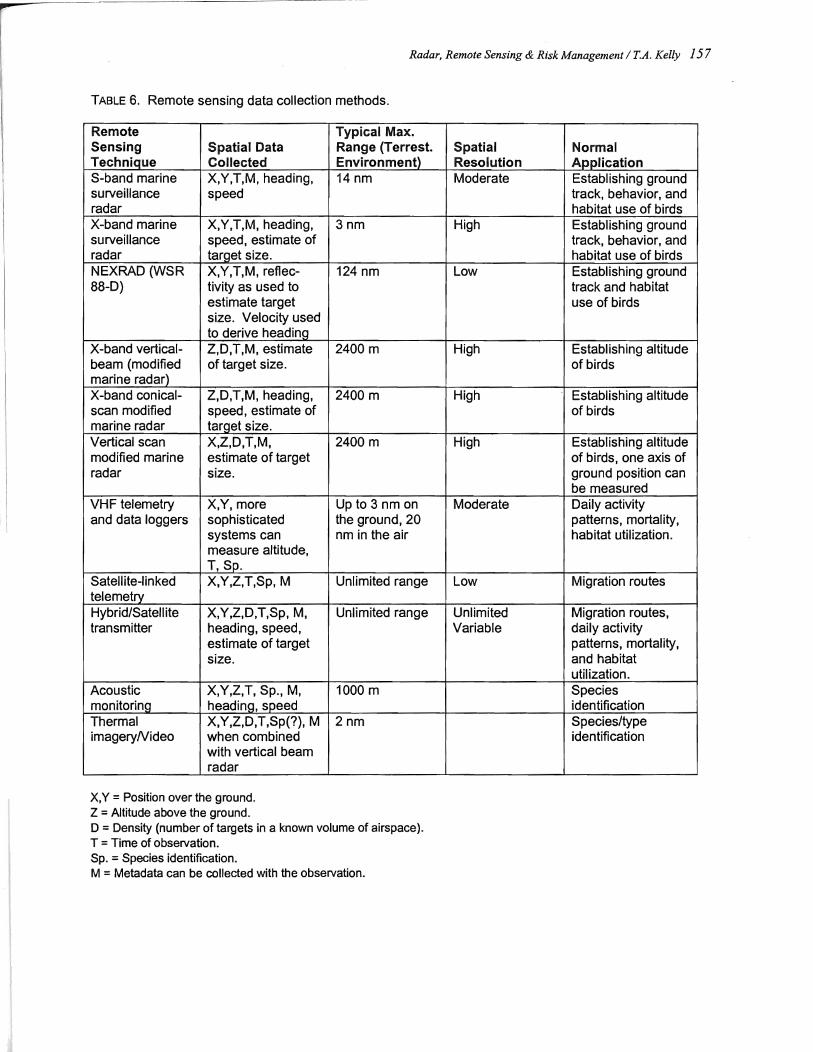
I I
:\
Appendix 2. Meeting Agenda
AVIAN - WIND POWER PLANNING MEETING III
Sponsored by the National Wind Coordinating Committee
May 27, 28, 29 1998
Kona Kai Continental Plaza Resort and Marina 1551 Shelter Island Drive
San Diego, California
Purpose:
III Facilitate scientific interchange on avian/wind power Interaction • Share what we are learning about avian/wind power interaction III Share new and developing research techniques III Identify and set priorities for future research
Wednesday, May 27
8:30 - 9:00 Introductions
9:00 -9:10
* Purpose of meeting * Product of meeting * Review agenda
Summary of Planning Meetings I & II
• What recommendations came out of the meetings?
9:10 -12:30 Review of Current and Planned Research [Each presentation will be followed by questions and brief discussion}
9:15 - 9:45 The Use of Marine Surveillance Radar in Studies of Bird Movements
Abby Arnold
and Impact Assessment Michael Morrison
9:45 - 10:15 Avian Use, Flight Behavior and Mortality on the Buffalo Ridge, Minnesota Wind Resource Area
10:15 -10:30 Break
10:30 - 11: 15 Avian Monitoring and Risk Assessment at Tehachapi Pass and
Dale Strickland
San Gorgonio Pass WRAS Richard Anderson
11:15 - 11:45 Demographic Trend of Golden Eagles at Altamont pass Grainger Hunt
199
200 National Avian - Wind Power Planning Meeting III
11 :45 - 12:00 Avian Risk Behavior and Mortality Assessment at the Altamont Wind Resource Area, California
12:00 - 12:15 A Study of the Effects of Bird Deterrent Methods Applied to Wind Turbines at the CARES Wind Power Site in Washington, Columbia Gorge - CARES
12:15 -1:15 Lunch
1:15 - 1:45
2:00 - 2:15
2:15 - 2:30
An Assessment of the Impacts of Green Mountain Power Corporation's Searsburg, Vermont, Wind Power Facility on Breeding and Migrating Birds
Role of Visual Acuity in Bird-Wind Turbine Interaction
A Study of the Impacts of a Small Wind Power Facility in Weld County, Colorado, on Breeding, Migrating, and Wintering Bird
2:30 - 2:45 Break
2:45 - 3:15 WindlBird Interaction Studies in Wisconsin
Carl Thelander
Dale Strickland
Paul Kerlinger
Mike Morrison
Paul Kerlinger
Steve Ugoretz
3:15 - 3:45 Avian Population Analysis for Wind Power in Western Minnesota JoAnn Hanowski
3:45 - 4:15 European Perspective - Stewart Lowther
4:15 - 5:00 Studies on Nocturnal Flight Paths and Altitudes of Waterbirds in Relation to Wind Turbines: A Review of Current Research in the Netherlands Sjoerd Dirksen
5:00 Adjourn
6:00 - 7:00 Reception (no-host)
Thursday, May 28
8:00 - 5:30 Review of Current and Planned Research, continued
8:00 - 8:20
8:20 - 8:45
A review of Recent Development in Wind Energy and Bird Research in Western Europe
A Study of bird Behavior in a Wind Farm and Adjacent Areas in Tarifa (Spain)
Sjoerd Dirksen
Guyonne Janss
Appendix 2. Meeting Agenda 201
8:45 -10:45 Standard Methodology and Metrics
Studying Wind EnergylBird Interactions: A Guidance Document Presentation and Discussion Richard Anderson,
10:45 -11:00 Break
11:00 -12:00 Migration
11 :00 - 11 :30 Bird Migration and Wind Turbines: Migration Timing, Flight Behavior, and Collision Risk
Michael Morrison, Karin Sinclair, and
Dale Strickland
John Richardson
11:30 - 12:00 Questions and Answers John Richardson/Paul Kerlinger
12:00 - 1 :00 Lunch
1:00 - 5:15 Technology and Methods for the Future
1:00 - 1:15 Development of a Practical Modeling Framework for Estimating the Impact of Wind Technology on Bird Populations Michael Morrison
1:15-2:15 Radar and Thermal Infrared Adam Kelley
2:15 - 2:30 Informal Discussion: Night Vision, Infrared, and Ceilometer
2:30 - 2:45 Break
2:45 - 3:30
3:30 - 4:15
4:15 - 5:00
Acoustics in Migrating Bird Monitoring
GIS-Uses and Statistical Analysis
Using GPS to Study Avian Interactions Associated With Wind Turbines
5:00 - 5:15 Preparing for Day Three,
Brian Cooper/Adam Kelly
Bill Evans
Wallace Erickson
Mark Dedon
Participants will be asked to begin thinking about answers to the questions raised on day Three (see below):
5:15 Adjourn
202 National Avian - Wind Power Planning Meeting III
Friday, Maya 29
8:00 - 8:15 Review Days I and II Adjust Agenda Accordingly
8:15 - 11 :00 Review of Reports From Day One and Day Two In plenary session, participants will brainstorm answers to the following three questions:
• What have we learned? • What conclusions, if any, can we draw from the research conducted to date? • Can we draw any conclusions that can apply to siting or design of new
facilities to reduce impact on avian species and what actions do our conclusions imply?
• Are there techniques we can recommend when retrofitting, or changing out, or replacing existing plants to reduce impact on avian species?
11 :00 - 12:00 What Additional Questions Need to Be Researched? (Break out groups will discuss what questions still need to be researched, and propose, what/where appropriate research ought to be conducted)
• What Additional Questions Need to Be Researched? • What Research Projects Does Group Recommend Be Conducted? • What Are The Priorities? • What Are Future Research and Other Project Needs?
12:00 -1:00 Lunch
1:00 - 3:00 What Additional Questions Need to Be Researched and Recommended Research, continued (Break out groups will continue meeting and then join the plenary session. In plenary session each break out group will summarize discussion prompting plenary discussion.)
3:00 - 3:15 Break
3:15 - 4:00 Develop Agreement on Recommendation to NWCC Avian Subcommittee
• Research project recommendations and priorities • Next Steps, who will do what by when
4:00 Adjourn
** ** **