Embed Size (px)
Citation preview
National Energy DataLao PDR
Khonetavanh DOUANGCHANH
Technical Officer
Department of Energy Policy and Planning,
Ministry of Energy and Mines, Lao PDR
21-23 November 2017, Kuala Lumpur, Malaysia
Contents
I. Background
II. Existing Energy Data
III. Data Collection
IV. Challenges
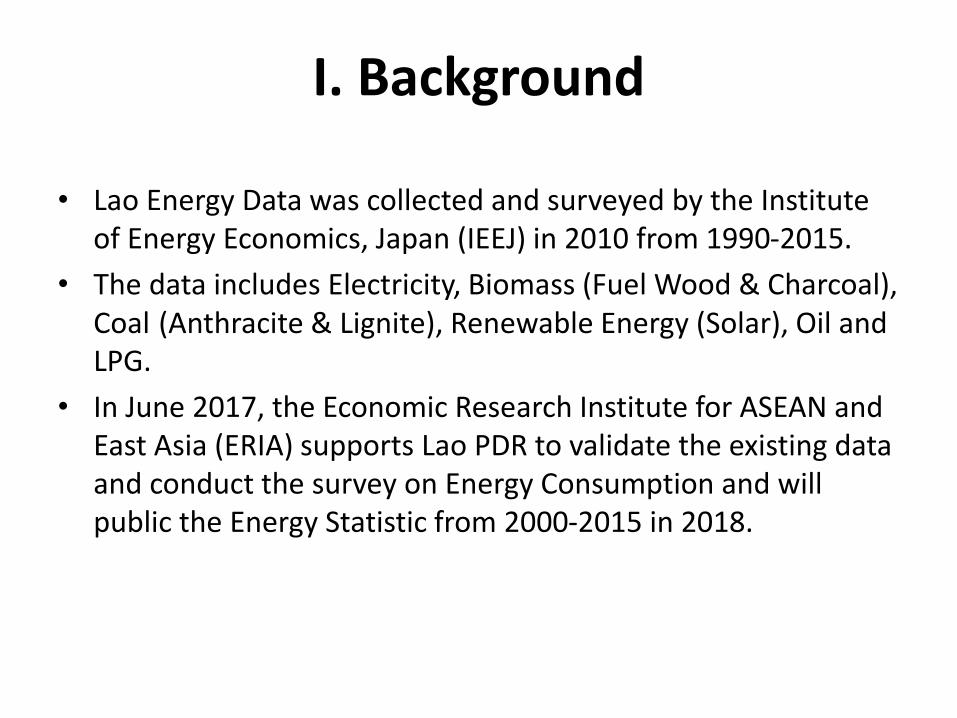
I. Background
• Lao Energy Data was collected and surveyed by the Institute of Energy Economics, Japan (IEEJ) in 2010 from 1990-2015.
• The data includes Electricity, Biomass (Fuel Wood & Charcoal), Coal (Anthracite & Lignite), Renewable Energy (Solar), Oil and LPG.
• In June 2017, the Economic Research Institute for ASEAN and East Asia (ERIA) supports Lao PDR to validate the existing data and conduct the survey on Energy Consumption and will public the Energy Statistic from 2000-2015 in 2018.
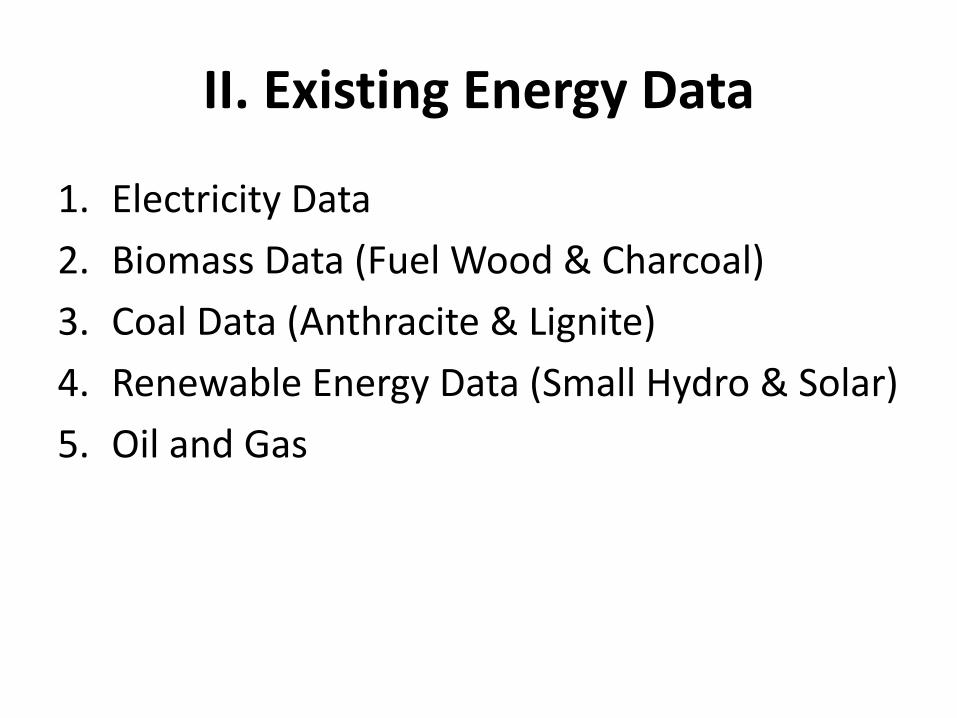
II. Existing Energy Data
1. Electricity Data
2. Biomass Data (Fuel Wood & Charcoal)
3. Coal Data (Anthracite & Lignite)
4. Renewable Energy Data (Small Hydro & Solar)
5. Oil and Gas
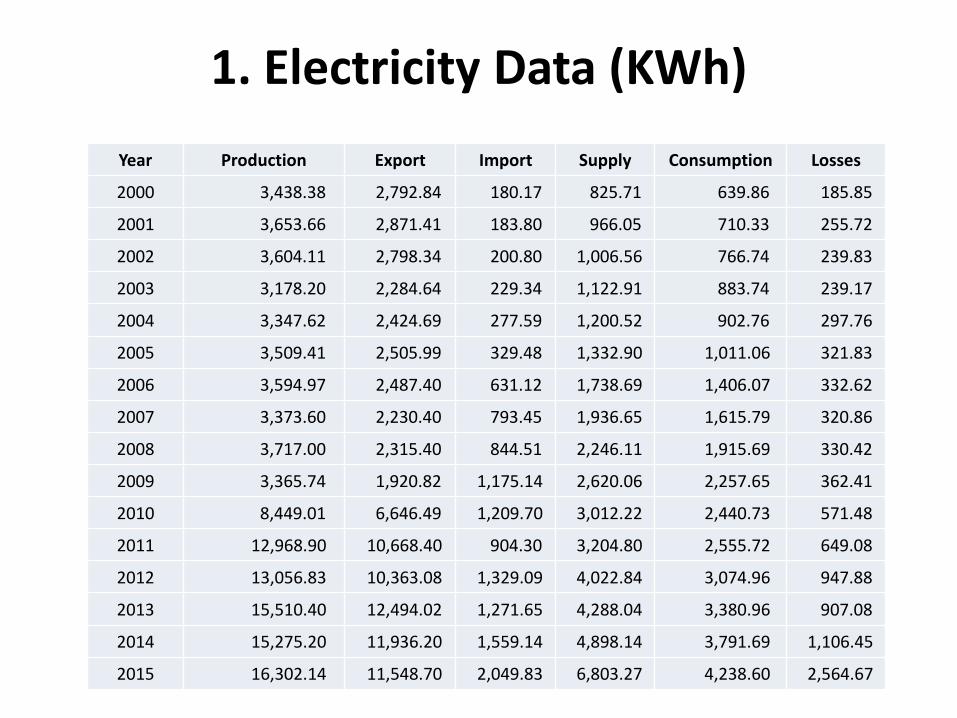
1. Electricity Data (KWh)
Year Production Export Import Supply Consumption Losses
2000 3,438.38 2,792.84 180.17 825.71 639.86 185.85
2001 3,653.66 2,871.41 183.80 966.05 710.33 255.72
2002 3,604.11 2,798.34 200.80 1,006.56 766.74 239.83
2003 3,178.20 2,284.64 229.34 1,122.91 883.74 239.17
2004 3,347.62 2,424.69 277.59 1,200.52 902.76 297.76
2005 3,509.41 2,505.99 329.48 1,332.90 1,011.06 321.83
2006 3,594.97 2,487.40 631.12 1,738.69 1,406.07 332.62
2007 3,373.60 2,230.40 793.45 1,936.65 1,615.79 320.86
2008 3,717.00 2,315.40 844.51 2,246.11 1,915.69 330.42
2009 3,365.74 1,920.82 1,175.14 2,620.06 2,257.65 362.41
2010 8,449.01 6,646.49 1,209.70 3,012.22 2,440.73 571.48
2011 12,968.90 10,668.40 904.30 3,204.80 2,555.72 649.08
2012 13,056.83 10,363.08 1,329.09 4,022.84 3,074.96 947.88
2013 15,510.40 12,494.02 1,271.65 4,288.04 3,380.96 907.08
2014 15,275.20 11,936.20 1,559.14 4,898.14 3,791.69 1,106.45
2015 16,302.14 11,548.70 2,049.83 6,803.27 4,238.60 2,564.67
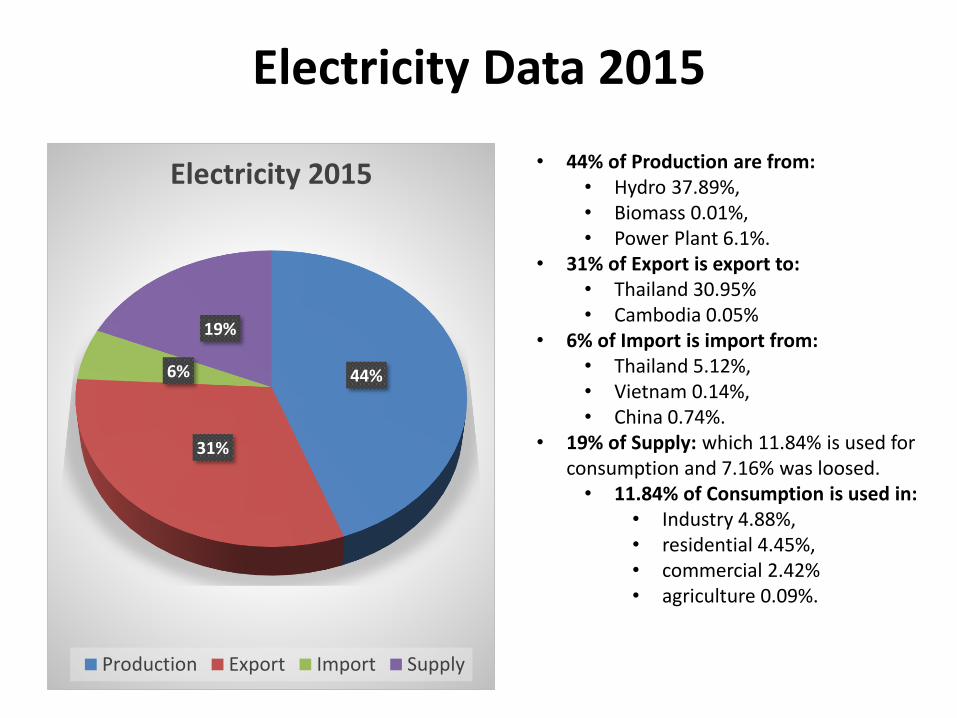
Electricity Data 2015
• 44% of Production are from:• Hydro 37.89%, • Biomass 0.01%, • Power Plant 6.1%.
• 31% of Export is export to: • Thailand 30.95%• Cambodia 0.05%
• 6% of Import is import from:• Thailand 5.12%, • Vietnam 0.14%, • China 0.74%.
• 19% of Supply: which 11.84% is used for consumption and 7.16% was loosed. • 11.84% of Consumption is used in:
• Industry 4.88%, • residential 4.45%, • commercial 2.42% • agriculture 0.09%.
44%
31%
6%
19%
Electricity 2015
Production Export Import Supply
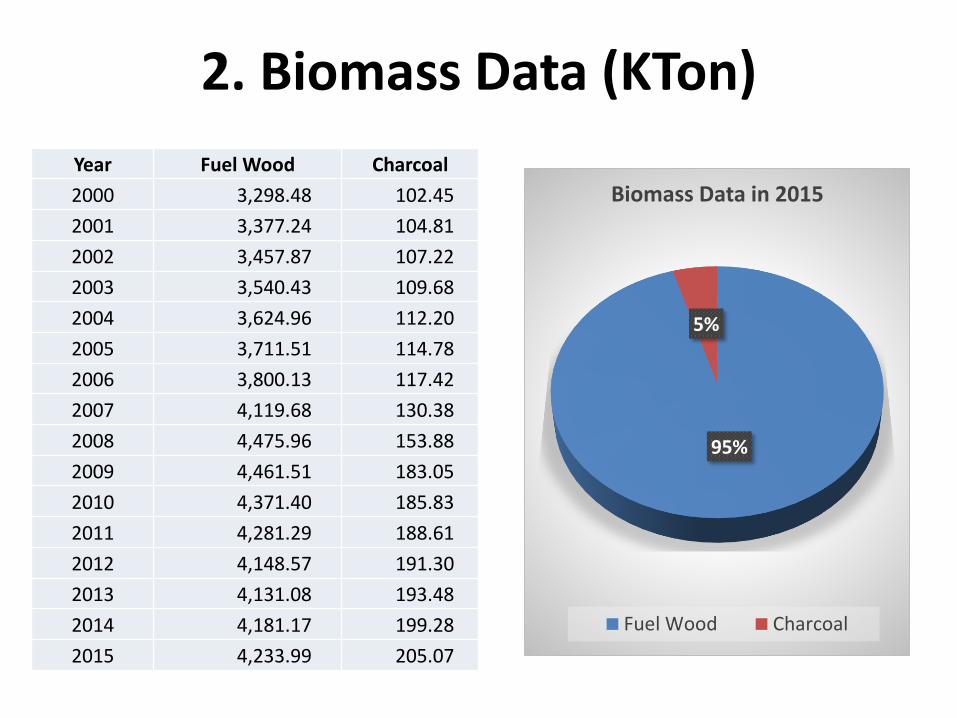
2. Biomass Data (KTon)
Year Fuel Wood Charcoal
2000 3,298.48 102.45
2001 3,377.24 104.81
2002 3,457.87 107.22
2003 3,540.43 109.68
2004 3,624.96 112.20
2005 3,711.51 114.78
2006 3,800.13 117.42
2007 4,119.68 130.38
2008 4,475.96 153.88
2009 4,461.51 183.05
2010 4,371.40 185.83
2011 4,281.29 188.61
2012 4,148.57 191.30
2013 4,131.08 193.48
2014 4,181.17 199.28
2015 4,233.99 205.07
95%
5%
Biomass Data in 2015
Fuel Wood Charcoal
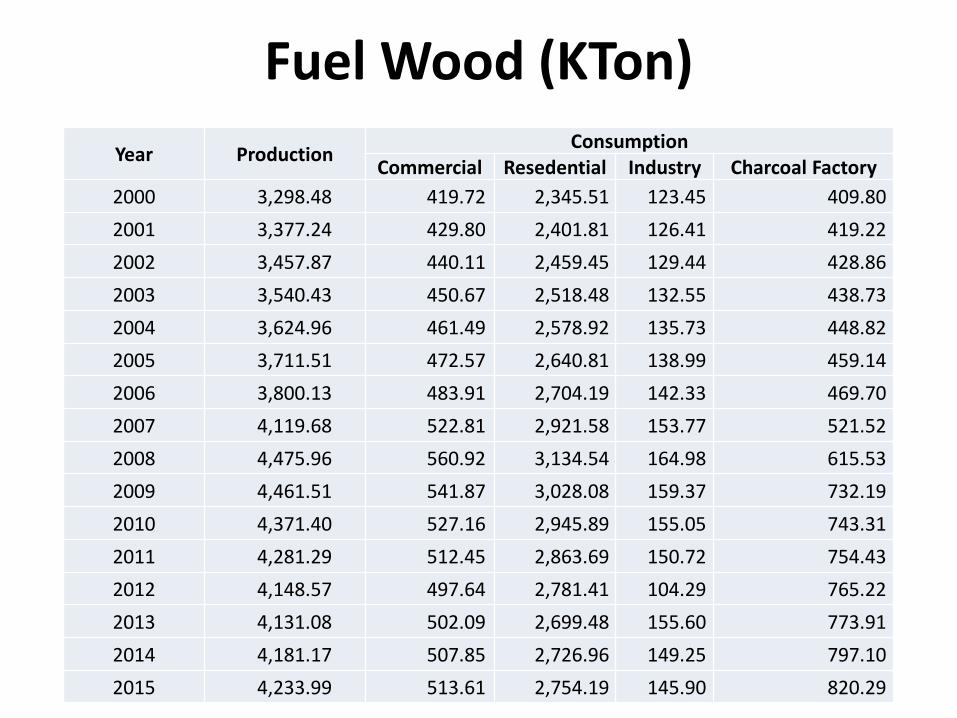
Fuel Wood (KTon)
Year ProductionConsumption
Commercial Resedential Industry Charcoal Factory
2000 3,298.48 419.72 2,345.51 123.45 409.80
2001 3,377.24 429.80 2,401.81 126.41 419.22
2002 3,457.87 440.11 2,459.45 129.44 428.86
2003 3,540.43 450.67 2,518.48 132.55 438.73
2004 3,624.96 461.49 2,578.92 135.73 448.82
2005 3,711.51 472.57 2,640.81 138.99 459.14
2006 3,800.13 483.91 2,704.19 142.33 469.70
2007 4,119.68 522.81 2,921.58 153.77 521.52
2008 4,475.96 560.92 3,134.54 164.98 615.53
2009 4,461.51 541.87 3,028.08 159.37 732.19
2010 4,371.40 527.16 2,945.89 155.05 743.31
2011 4,281.29 512.45 2,863.69 150.72 754.43
2012 4,148.57 497.64 2,781.41 104.29 765.22
2013 4,131.08 502.09 2,699.48 155.60 773.91
2014 4,181.17 507.85 2,726.96 149.25 797.10
2015 4,233.99 513.61 2,754.19 145.90 820.29
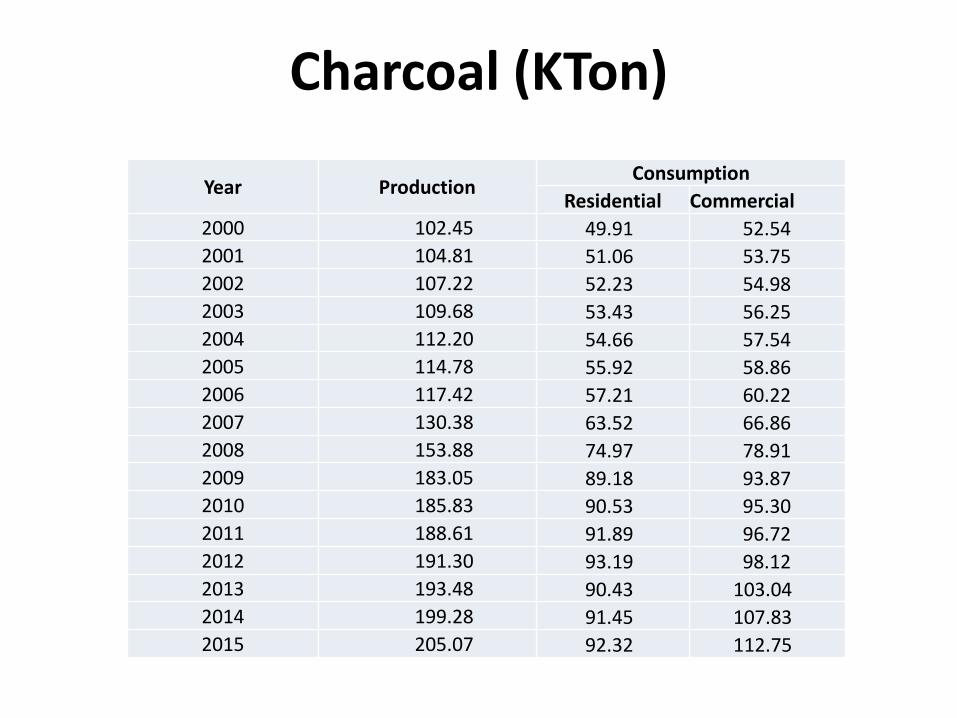
Charcoal (KTon)
Year ProductionConsumption
Residential Commercial
2000 102.45 49.91 52.54
2001 104.81 51.06 53.75
2002 107.22 52.23 54.98
2003 109.68 53.43 56.25
2004 112.20 54.66 57.54
2005 114.78 55.92 58.86
2006 117.42 57.21 60.22
2007 130.38 63.52 66.86
2008 153.88 74.97 78.91
2009 183.05 89.18 93.87
2010 185.83 90.53 95.30
2011 188.61 91.89 96.72
2012 191.30 93.19 98.12
2013 193.48 90.43 103.04
2014 199.28 91.45 107.83
2015 205.07 92.32 112.75
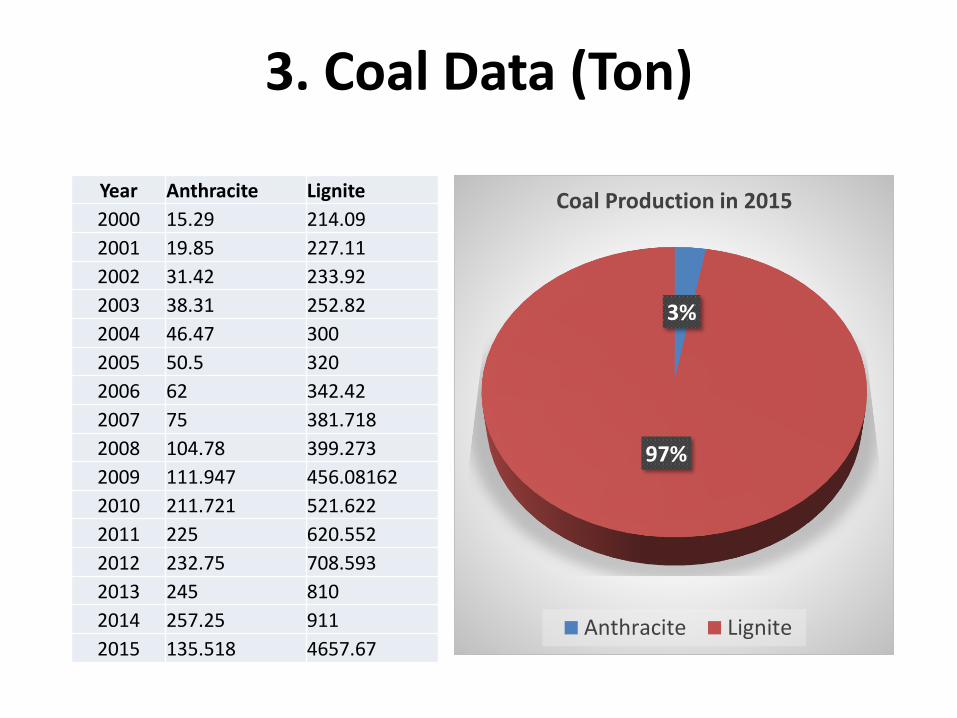
3. Coal Data (Ton)
Year Anthracite Lignite
2000 15.29 214.09
2001 19.85 227.11
2002 31.42 233.92
2003 38.31 252.82
2004 46.47 300
2005 50.5 320
2006 62 342.42
2007 75 381.718
2008 104.78 399.273
2009 111.947 456.08162
2010 211.721 521.622
2011 225 620.552
2012 232.75 708.593
2013 245 810
2014 257.25 911
2015 135.518 4657.67
3%
97%
Coal Production in 2015
Anthracite Lignite
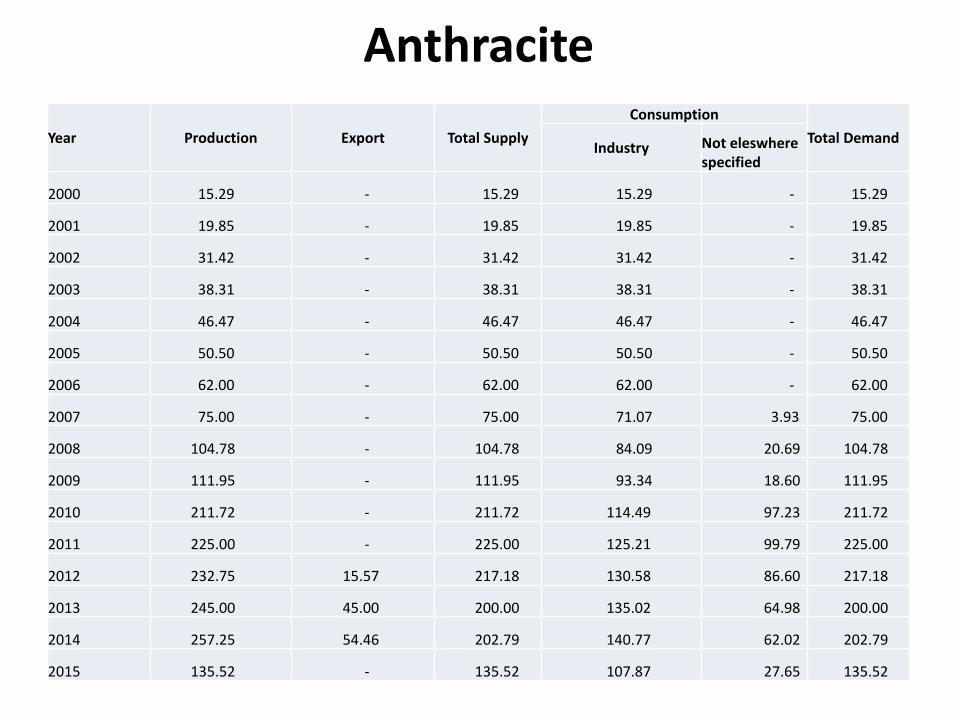
Anthracite
Year Production Export Total Supply
Consumption
Total DemandIndustry Not eleswhere
specified
2000 15.29 - 15.29 15.29 - 15.29
2001 19.85 - 19.85 19.85 - 19.85
2002 31.42 - 31.42 31.42 - 31.42
2003 38.31 - 38.31 38.31 - 38.31
2004 46.47 - 46.47 46.47 - 46.47
2005 50.50 - 50.50 50.50 - 50.50
2006 62.00 - 62.00 62.00 - 62.00
2007 75.00 - 75.00 71.07 3.93 75.00
2008 104.78 - 104.78 84.09 20.69 104.78
2009 111.95 - 111.95 93.34 18.60 111.95
2010 211.72 - 211.72 114.49 97.23 211.72
2011 225.00 - 225.00 125.21 99.79 225.00
2012 232.75 15.57 217.18 130.58 86.60 217.18
2013 245.00 45.00 200.00 135.02 64.98 200.00
2014 257.25 54.46 202.79 140.77 62.02 202.79
2015 135.52 - 135.52 107.87 27.65 135.52
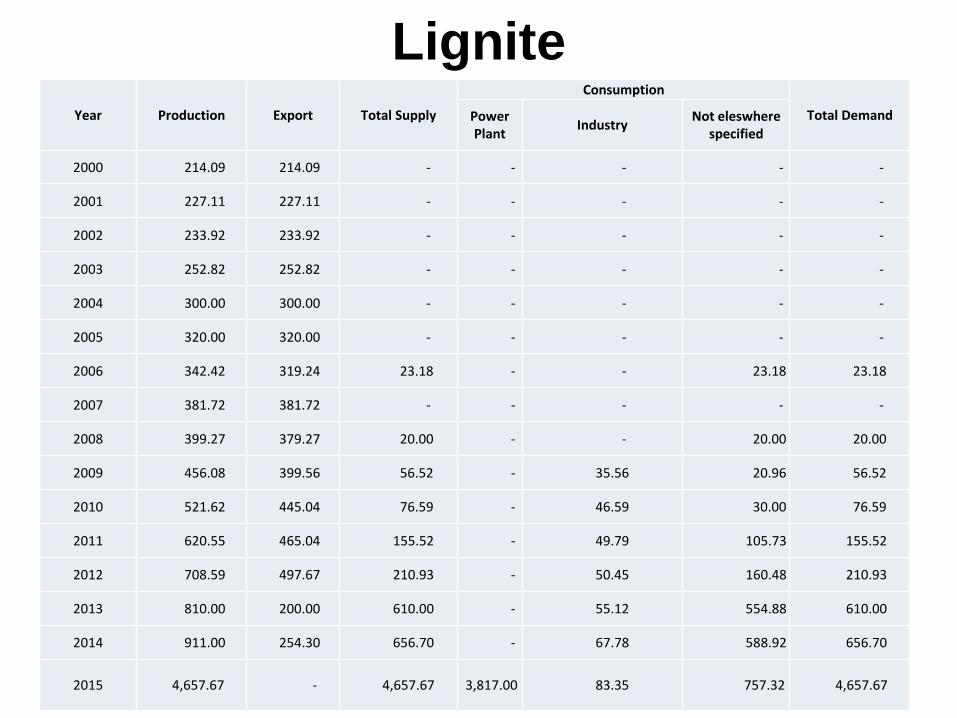
LigniteYear Production Export Total Supply
Consumption
Total DemandPower Plant
IndustryNot eleswhere
specified
2000 214.09 214.09 - - - - -
2001 227.11 227.11 - - - - -
2002 233.92 233.92 - - - - -
2003 252.82 252.82 - - - - -
2004 300.00 300.00 - - - - -
2005 320.00 320.00 - - - - -
2006 342.42 319.24 23.18 - - 23.18 23.18
2007 381.72 381.72 - - - - -
2008 399.27 379.27 20.00 - - 20.00 20.00
2009 456.08 399.56 56.52 - 35.56 20.96 56.52
2010 521.62 445.04 76.59 - 46.59 30.00 76.59
2011 620.55 465.04 155.52 - 49.79 105.73 155.52
2012 708.59 497.67 210.93 - 50.45 160.48 210.93
2013 810.00 200.00 610.00 - 55.12 554.88 610.00
2014 911.00 254.30 656.70 - 67.78 588.92 656.70
2015 4,657.67 - 4,657.67 3,817.00 83.35 757.32 4,657.67
4. Renewable Energy Data
• Small Hydropowers (>15 MW) are considered to be renewable energy but they are included in Electricity Data mentioned above;
• Solar in rural areas (off-grid);
• Solar (on-grid) operated in February 2017 (3MW), July 2017 (7MW);
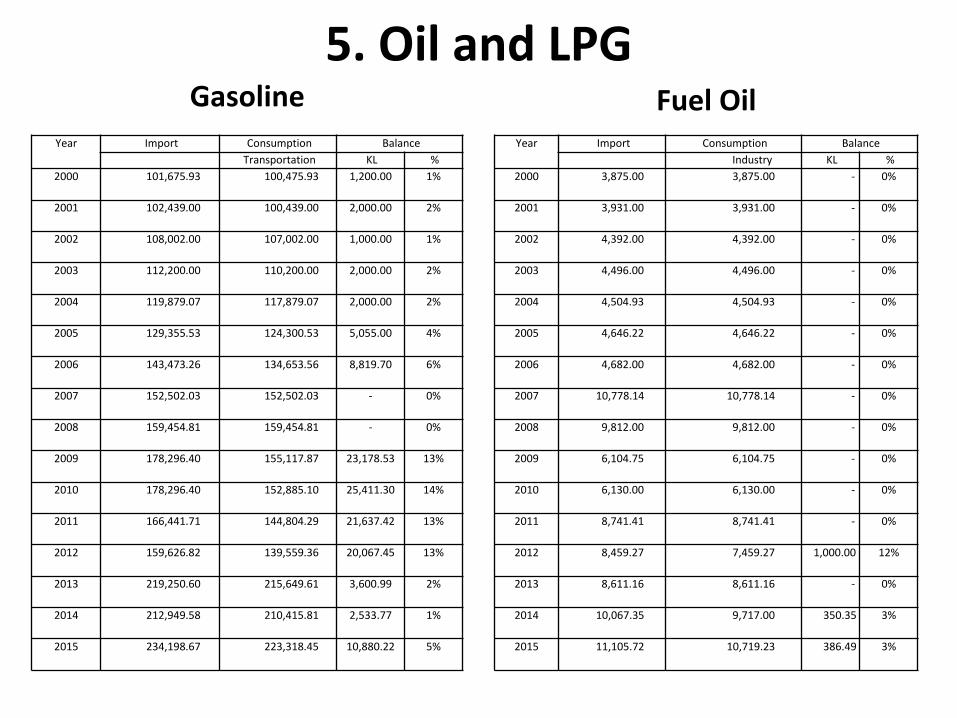
Fuel OilGasoline
Year Import Consumption Balance
Industry KL %
2000 3,875.00 3,875.00 - 0%
2001 3,931.00 3,931.00 - 0%
2002 4,392.00 4,392.00 - 0%
2003 4,496.00 4,496.00 - 0%
2004 4,504.93 4,504.93 - 0%
2005 4,646.22 4,646.22 - 0%
2006 4,682.00 4,682.00 - 0%
2007 10,778.14 10,778.14 - 0%
2008 9,812.00 9,812.00 - 0%
2009 6,104.75 6,104.75 - 0%
2010 6,130.00 6,130.00 - 0%
2011 8,741.41 8,741.41 - 0%
2012 8,459.27 7,459.27 1,000.00 12%
2013 8,611.16 8,611.16 - 0%
2014 10,067.35 9,717.00 350.35 3%
2015 11,105.72 10,719.23 386.49 3%
Year Import Consumption Balance
Transportation KL %
2000 101,675.93 100,475.93 1,200.00 1%
2001 102,439.00 100,439.00 2,000.00 2%
2002 108,002.00 107,002.00 1,000.00 1%
2003 112,200.00 110,200.00 2,000.00 2%
2004 119,879.07 117,879.07 2,000.00 2%
2005 129,355.53 124,300.53 5,055.00 4%
2006 143,473.26 134,653.56 8,819.70 6%
2007 152,502.03 152,502.03 - 0%
2008 159,454.81 159,454.81 - 0%
2009 178,296.40 155,117.87 23,178.53 13%
2010 178,296.40 152,885.10 25,411.30 14%
2011 166,441.71 144,804.29 21,637.42 13%
2012 159,626.82 139,559.36 20,067.45 13%
2013 219,250.60 215,649.61 3,600.99 2%
2014 212,949.58 210,415.81 2,533.77 1%
2015 234,198.67 223,318.45 10,880.22 5%
5. Oil and LPG
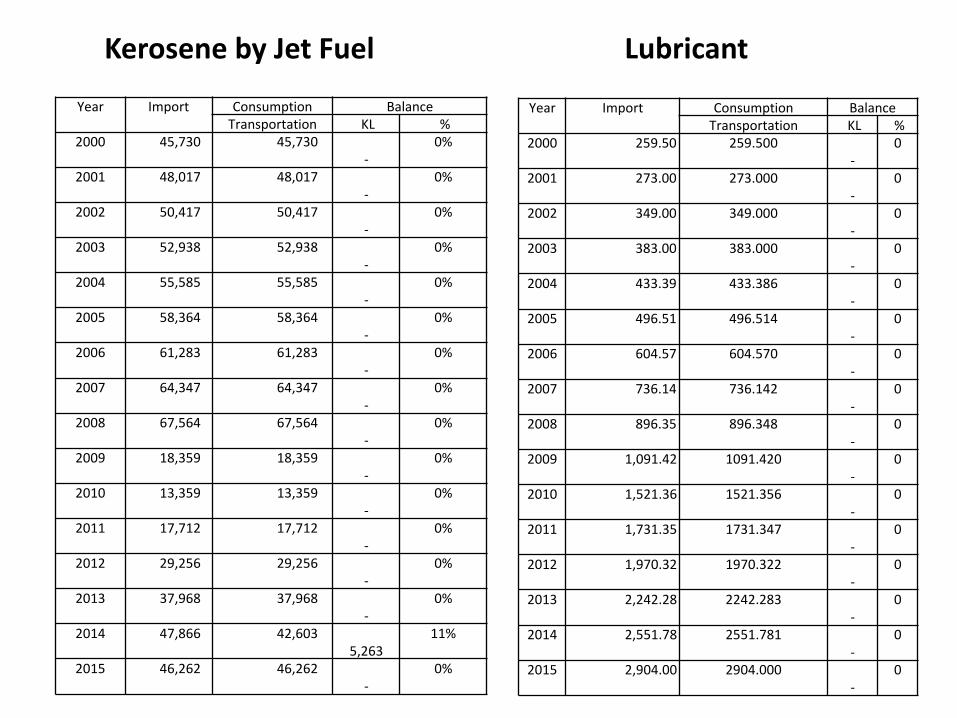
Year Import Consumption BalanceTransportation KL %
2000 45,730 45,730 -
0%
2001 48,017 48,017 -
0%
2002 50,417 50,417 -
0%
2003 52,938 52,938 -
0%
2004 55,585 55,585 -
0%
2005 58,364 58,364 -
0%
2006 61,283 61,283 -
0%
2007 64,347 64,347 -
0%
2008 67,564 67,564 -
0%
2009 18,359 18,359 -
0%
2010 13,359 13,359 -
0%
2011 17,712 17,712 -
0%
2012 29,256 29,256 -
0%
2013 37,968 37,968 -
0%
2014 47,866 42,603 5,263
11%
2015 46,262 46,262 -
0%
Kerosene by Jet Fuel Lubricant
Year Import Consumption BalanceTransportation KL %
2000 259.50 259.500-
0
2001 273.00 273.000-
0
2002 349.00 349.000-
0
2003 383.00 383.000-
0
2004 433.39 433.386-
0
2005 496.51 496.514-
0
2006 604.57 604.570-
0
2007 736.14 736.142-
0
2008 896.35 896.348-
0
2009 1,091.42 1091.420-
0
2010 1,521.36 1521.356-
0
2011 1,731.35 1731.347-
0
2012 1,970.32 1970.322-
0
2013 2,242.28 2242.283-
0
2014 2,551.78 2551.781-
0
2015 2,904.00 2904.000-
0
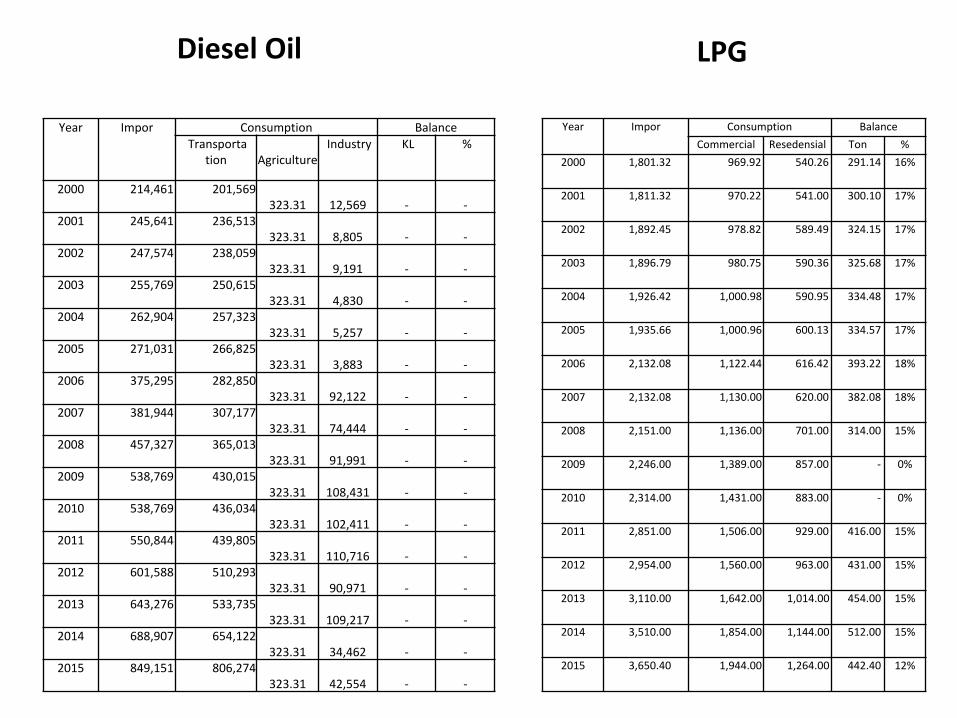
Year Impor Consumption BalanceTransporta
tion Agriculture Industry KL %
2000 214,461 201,569 323.31 12,569 - -
2001 245,641 236,513 323.31 8,805 - -
2002 247,574 238,059 323.31 9,191 - -
2003 255,769 250,615 323.31 4,830 - -
2004 262,904 257,323 323.31 5,257 - -
2005 271,031 266,825 323.31 3,883 - -
2006 375,295 282,850 323.31 92,122 - -
2007 381,944 307,177 323.31 74,444 - -
2008 457,327 365,013 323.31 91,991 - -
2009 538,769 430,015 323.31 108,431 - -
2010 538,769 436,034 323.31 102,411 - -
2011 550,844 439,805 323.31 110,716 - -
2012 601,588 510,293 323.31 90,971 - -
2013 643,276 533,735 323.31 109,217 - -
2014 688,907 654,122 323.31 34,462 - -
2015 849,151 806,274 323.31 42,554 - -
Diesel Oil
Year Impor Consumption Balance
Commercial Resedensial Ton %
2000 1,801.32 969.92 540.26 291.14 16%
2001 1,811.32 970.22 541.00 300.10 17%
2002 1,892.45 978.82 589.49 324.15 17%
2003 1,896.79 980.75 590.36 325.68 17%
2004 1,926.42 1,000.98 590.95 334.48 17%
2005 1,935.66 1,000.96 600.13 334.57 17%
2006 2,132.08 1,122.44 616.42 393.22 18%
2007 2,132.08 1,130.00 620.00 382.08 18%
2008 2,151.00 1,136.00 701.00 314.00 15%
2009 2,246.00 1,389.00 857.00 - 0%
2010 2,314.00 1,431.00 883.00 - 0%
2011 2,851.00 1,506.00 929.00 416.00 15%
2012 2,954.00 1,560.00 963.00 431.00 15%
2013 3,110.00 1,642.00 1,014.00 454.00 15%
2014 3,510.00 1,854.00 1,144.00 512.00 15%
2015 3,650.40 1,944.00 1,264.00 442.40 12%
LPG
III. Data collection
We use data that collected by IEEJ and are continuing to collect data from line agencies such as:
• Electricity: collect from the Utilities (EDL), IPPs and departments within the Ministry of Energy and Mines. The Electricity Statistic in 2015 has published.
• Biomass, oil and LPG: collect from Department of Import-Export, Department of Tax, Lao Fuel State Enterprise, oil companies and airline companies.
• Coal: collect from Department of Mines.
• Renewable Energy (Solar): Collect from Institute of Renewable Energy Promotion (IREP) and EDL-Gen.
IV. Challenges
• Lack of coordination between the Ministry of Energy and Mines and other line Ministries, utilities and IPPs,
• No committee to validate the data collected,
• No data center,
• No official website for energy data dissemination,
• There is a removal of a person who in charge for data collection,
• No budget for data collection.