Embed Size (px)
Citation preview
National Financial Inclusion Strategy
Financial Inclusion in Nigeria
Contents
Acknowledgments v
Executive Summary vi
1.0 Introduction 1
1.1 Definition of Financial Inclusion 1
1.2 Strategic Objectives 1
1.3 How the National Financial Inclusion Strategy Supports CBN Objectives 1
2.0 Strategy Stakeholders and Their Interests 3
3.0 The Current State of Financial Inclusion in Nigeria 6
3.1 Geographical Differences in Financial Inclusion 7
3.2 Characteristics of the Financially Excluded 8
3.3 Financial Sector Infrastructure 9
3.4 Regulation and Policy 9
4.0 International Benchmarks for Financial Inclusion 12
4.1 Products 12
4.2 Channels 16
4.3 Financial Inclusion Enablers 17
5.0 Major Challenges to Financial Inclusion in Nigeria: Issues and Evidence 20
5.1 Accessibility 20
5.2 Eligibility and Know Your Customer (KYC) Regulations 21
5.3 Financial Literacy 21
6.0 Key Financial Inclusion Targets 23
6.1 Product Targets 24
6.2 Channel Targets 26
6.3 Enabler Targets 27
6.4 Key Performance Indicators (KPIs) 28
7.0 Strategies for Achieving Financial Inclusion Targets 29
8.0 Proposed Roles and Responsibilities for Key Stakeholders 32
I
9.0 Possible Risks and Mitigation Strategies 36
10.0 Implementation Plan 37
11.0 Monitoring and Evaluation 38
12.0 Tracking Methodology 41
12.1 Management Summary 41
12.2 Status Update 42
12.3 Trend Analysis 43
12.4. Priority Checklist 44
12.3 Next Steps 44
13.0. Conclusion 45
II
Table of Figures
Figure 1: How financial inclusion supports CBN objectives 2
Figure 2: Financial inclusion stakeholders in Nigeria 3
Figure 3: The state of financial inclusion in Nigeria 6
Figure 4: Financial products and services usage by category 6
Figure 5: Financial inclusion in Nigeria by region 7
Figure 6: Geographical distribution of the financially excluded 7
Figure 7: Levels of financial exclusion in Nigeria 8
Figure 8: Characteristics of the financially excluded 8
Figure 9: Banking customers and branch infrastructure in Nigeria 9
Figure 10: Regulations and policy impacting financial inclusion in Nigeria 11
Figure 11: Financial inclusion in sub-Saharan Africa by country 12
Figure 12: Access to transaction services in selected countries 13
Figure 13: M-payments users as a percentage of the adult population 13
Figure 14: Access to savings in selected countries 13
Figure 15: Savings accounts with commercial banks in 2010 per 1,000 adults 14
Figure 16: Access to loan products in selected countries 14
Figure 17: Loan accounts with commercial banks per 1,000 adults 14
Figure 18: Access to insurance services in selected countries 15
Figure 19: Estimated percentage of the adult population using insurance in 2010 15
Figure 20: Estimated percentage of the adult population contributing to pensions in 2009 15
Figure 21: Commercial bank branches per 100,000 adults 16
Figure 22: ATMs per 100,000 adults 16
Figure 23: POS devices per 100,000 adults 17
Figure 24: Agents per 100,000 adults 17
Figure 25: Benchmarking KYC requirements 18
Figure 26: Key elements of consumer protection 18
Figure 27: Key elements of financial literacy 19
Figure 28: Reason for not having an account (% unbanked) 20
Figure 29: Average distance to a bank branch in Nigeria 20
Figure 30: Access to identification documents 21
Figure 31: Awareness and understanding of financial terms 21
Figure 32: Sources of financial information 22
Figure 33: The financial inclusion picture by target 23
III
Figure 34: Payment targets 24
Figure 35: Saving targets 24
Figure 36: Credit targets 25
Figure 37: Insurance targets 25
Figure 38: Pension targets 25
Figure 39: DMB branch targets 26
Figure 40: MFB branch targets 26
Figure 41: ATM targets 26
Figure 42: POS device targets 27
Figure 43: Agent banking targets 27
Figure 44: KPIs for monitoring progess 28
Figure 45: Illustrative management summary 41
Figure 46: Illustrative status report summary 1 42
Figure 47: Illustrative status report (KPIs) summary 2 42
Figure 48: Illustrative status report (other indicators) summary 3 43
Figure 49: Illustrative trend analysis 43
Figure 50: Illustrative priority checklist 44
Figure 51: Illustrative next steps 44
iv

Acknowledgments
The Central Bank of Nigeria would like to acknowledge the contributions of all stakeholders
who provided data, participated in interviews, reviewed and provided comments as this
National Financial Inclusion Strategy was drafted and finalised.
In particular, the Bank appreciates the support of the Alliance for Financial Inclusion (AFI), Enhancing Financial Innovation & Access (EFInA) and Messrs Roland Berger, Strategy Consultants, Germany, for assisting in the development of the National Financial Inclusion Strategy.
v
Executive Summary
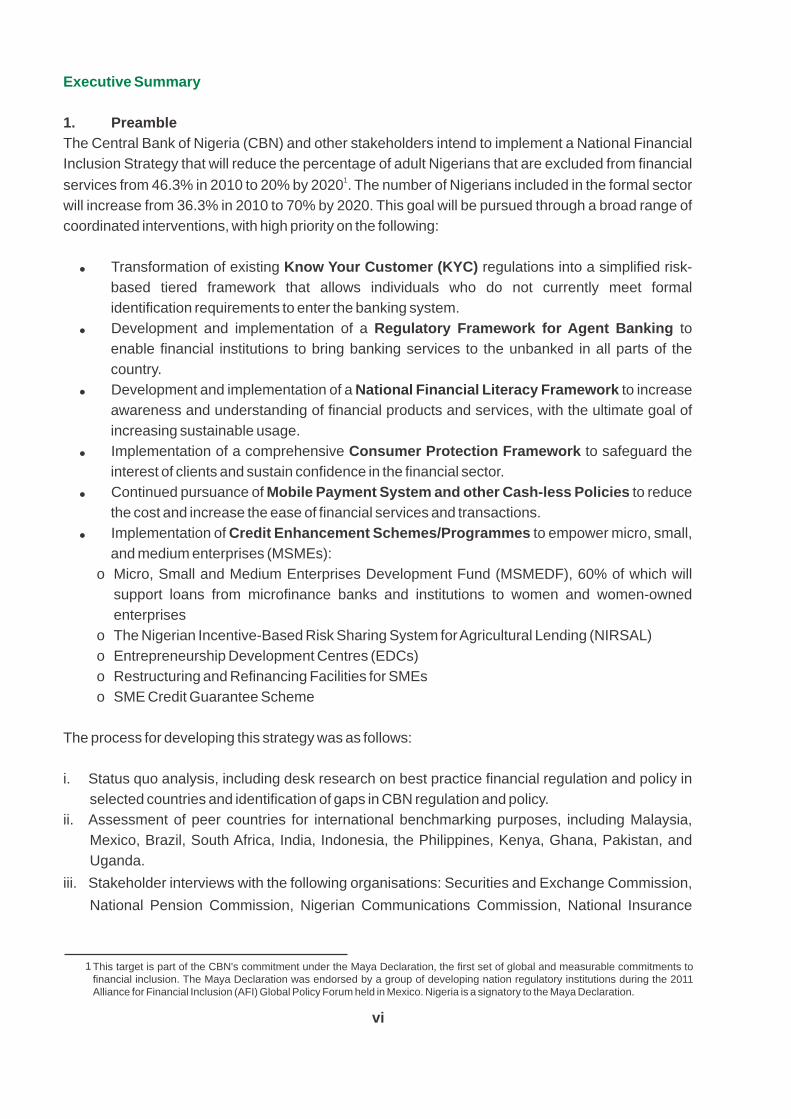
1. Preamble
The Central Bank of Nigeria (CBN) and other stakeholders intend to implement a National Financial
Inclusion Strategy that will reduce the percentage of adult Nigerians that are excluded from financial 1
services from 46.3% in 2010 to 20% by 2020 . The number of Nigerians included in the formal sector
will increase from 36.3% in 2010 to 70% by 2020. This goal will be pursued through a broad range of
coordinated interventions, with high priority on the following:
Transformation of existing Know Your Customer (KYC) regulations into a simplified risk-
based tiered framework that allows individuals who do not currently meet formal
identification requirements to enter the banking system.
Development and implementation of a Regulatory Framework for Agent Banking to
enable financial institutions to bring banking services to the unbanked in all parts of the
country.
Development and implementation of a National Financial Literacy Framework to increase
awareness and understanding of financial products and services, with the ultimate goal of
increasing sustainable usage.
Implementation of a comprehensive Consumer Protection Framework to safeguard the
interest of clients and sustain confidence in the financial sector.
Continued pursuance of Mobile Payment System and other Cash-less Policies to reduce
the cost and increase the ease of financial services and transactions.
Implementation of Credit Enhancement Schemes/Programmes to empower micro, small,
and medium enterprises (MSMEs):
o Micro, Small and Medium Enterprises Development Fund (MSMEDF), 60% of which will
support loans from microfinance banks and institutions to women and women-owned
enterprises
o The Nigerian Incentive-Based Risk Sharing System for Agricultural Lending (NIRSAL)
o Entrepreneurship Development Centres (EDCs)
o Restructuring and Refinancing Facilities for SMEs
o SME Credit Guarantee Scheme
The process for developing this strategy was as follows:
i. Status quo analysis, including desk research on best practice financial regulation and policy in
selected countries and identification of gaps in CBN regulation and policy.
ii. Assessment of peer countries for international benchmarking purposes, including Malaysia,
Mexico, Brazil, South Africa, India, Indonesia, the Philippines, Kenya, Ghana, Pakistan, and
Uganda.
iii. Stakeholder interviews with the following organisations: Securities and Exchange Commission,
National Pension Commission, Nigerian Communications Commission, National Insurance
This target is part of the CBN's commitment under the Maya Declaration, the first set of global and measurable commitments to financial inclusion. The Maya Declaration was endorsed by a group of developing nation regulatory institutions during the 2011 Alliance for Financial Inclusion (AFI) Global Policy Forum held in Mexico. Nigeria is a signatory to the Maya Declaration.
1
vi
Commission, GTBank, Stanbic Bank, United Bank for Africa, Unity Bank, AB Microfinance Bank,
Fortis Microfinance Bank, LAPO Microfinance Bank, Cornerstone Insurance, GT Assur, Royal
Exchange, ARM Pensions Managers, Airtel Nigeria, MTN Nigeria, Interswitch, Paga, Bureau of
Public Enterprises, National Identity Management Commission (NIMC), NEPAD Business
Group, Nigeria Postal Service, Rural Finance Institution Building Programme, Small and
Medium Enterprises Development Agency of Nigeria (SMEDAN), African Development Bank
(AfDB), Alithea Capital, Consultative Group to Assist the Poor (CGAP), Department for
International Development (DFID), and the German Agency for International Cooperation (GIZ).
iv. Release of the National Financial Inclusion Strategy to stakeholders for comments and input.
v. Summit held to review stakeholder comments/input and finalise the Strategy. Stakeholders
present at the summit included financial services regulators, Federal Government Ministries,
Departments and Agencies (MDAs), Deposit Money Banks (DMBs), microfinance banks and
institutions, development finance institutions, development partners, and others.
The Nigeria's National Financial Inclusion Strategy was drafted using an evidence-based and
analytical approach that considered global best practices.
2. Definition of financial inclusion
For the purpose of the Strategy, “financial inclusion is achieved when adult Nigerians have
easy access to a broad range of formal financial services that meet their needs at an
affordable cost.” The services include, but are not limited to, payments, savings, loans, insurance,
and pension products.
3. Strategy stakeholders and their interests
Various stakeholders participate in the National Financial Inclusion Strategy for a variety of reasons.
The respective rationale for their participation are:
Ÿ Providers: These include institutions that provide financial products and services, as well as their
partner infrastructure and technology. The attraction for providers is the untapped business
potential in serving the majority of Nigerians who are not currently using the identified financial
products and services.
Ÿ Enablers: These are regulators and public institutions responsible for setting regulations and
policies on financial inclusion. Their interest is triggered by the Federal Government's
commitment to make Nigeria one of the top 20 economies by the year 2020.
Ÿ Supporting institutions: These are institutions that enhance and support the CBN's efforts to
achieve the national financial inclusion goals. They include development partners and experts
committed to supporting the Nigerian people and government through technical assistance/aid
and similar programmes.
vii
24. The status of financial inclusion in Nigeria
A total of 39.2 million adult Nigerians (46.3% of the adult population) were financially
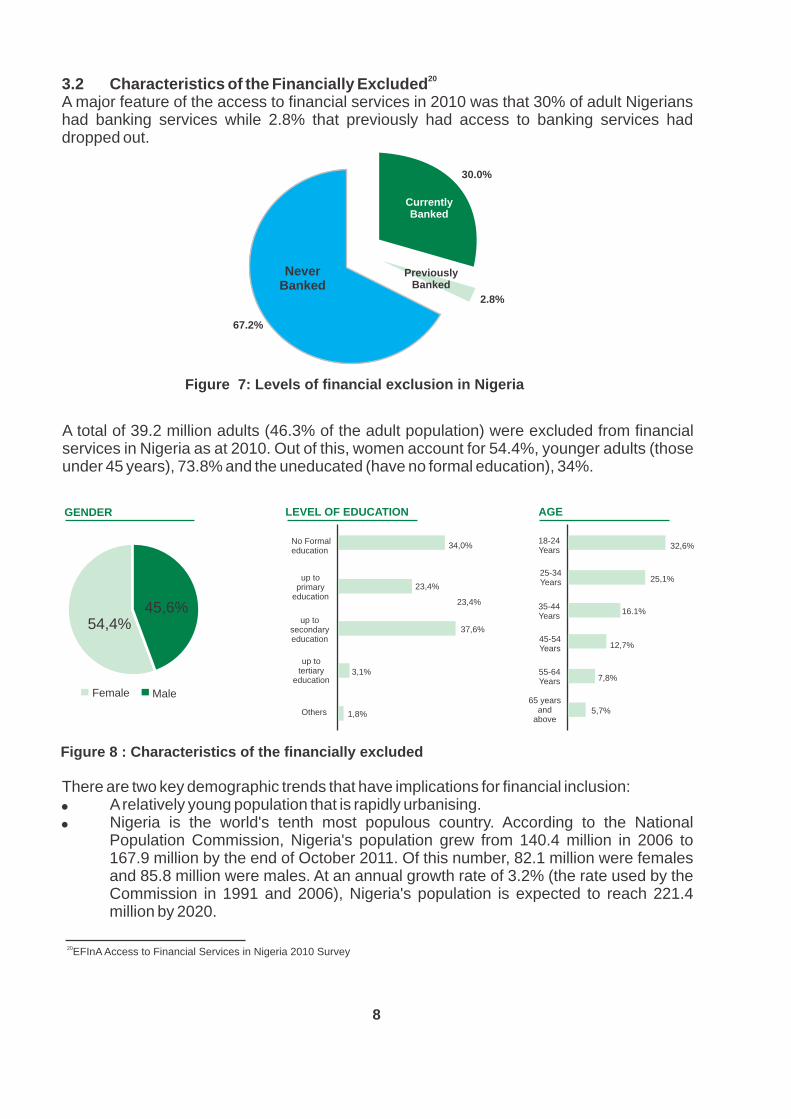
excluded in 2010. Further analysis has revealed that 54.4% of the excluded population were
women, 73.8% were younger than 45 years, 34.0% had no formal education, and 80.4% resided in
rural areas.
5. International benchmarks for financial inclusion
An analysis of global best practices revealed that explosive growth in financial inclusion is possible
through a variety of approaches. The most significant include:
Ÿ A strong uptake of payment services in Kenya, led by mobile network operators and based on
agent networks.
Ÿ Increased payments and savings services in Brazil, driven by agent banking, shared
infrastructure, partnerships between commercial banks and the national postal network, and
government policy that channelled welfare payments through this network.
Ÿ The high impact of tiered KYC regulation and basic savings / transaction accounts such as in
Mexico.
This benchmarking exercise views financial inclusion in Nigeria through a global lens and gives
legitimacy to the proposed strategies for addressing specific financial inclusion gaps.
6. Barriers to financial inclusion
The EFInA Access to Financial Services in Nigeria 2010 Survey categorise barriers to financial
inclusion as follows:
Demand-side barriers that arise for various reasons, such as irregular income, lack of employment,
and low literacy levels.
Supply-side barriers brought about by long distance to financial access points, the prohibitive cost
of financial services, and inappropriate financial products
Regulatory barriers such as cumbersome KYC requirements, lack of trust in financial services
providers, and high rates of corruption.
84.7 million
EFInA Access to Financial Services in Nigeria 2010 Survey 2
viii
8. Strategies for achieving the financial inclusion targets
In pursuing the stated targets, efforts will be concentrated in the following areas:
Ÿ Agent banking – Agent banking is the delivery of banking services outside traditional bank
branches through touchpoints such as existing retail stores and petrol stations or via
technology such as 'Point of Sale' (POS) devices and mobile phones.
Ÿ Mobile banking / mobile payments – Access to financial services through mobile phones
that are either directly linked to a bank account or the use of mobile wallets as intermediary
virtual money accounts.
Ÿ Linkage models – Enhancement of financial and business cooperation between traditional
financial institutions (Deposit Money Banks or Development Finance Institutions),
government and microfinance banks/institutions for providing wholesale funding for on-
lending transactions.
Ÿ Client empowerment – More people are brought into the formal financial system through
coordinated national financial literacy initiatives complemented by consumer protection
programmes and policies
9. Implications for regulation and policy in Nigeria
To implement the strategies and achieve the defined targets, priorities have been set to implement
guidelines and frameworks for:
Ÿ tiered KYC regulations
Ÿ agent banking regulation
Ÿ national financial literacy strategy
Ÿ consumer protection
The mobile payment system and other cash-less efforts will also be vigorously pursued, and
providers will be supported and guided in pilot testing relevant business models, buoyed by the
ix
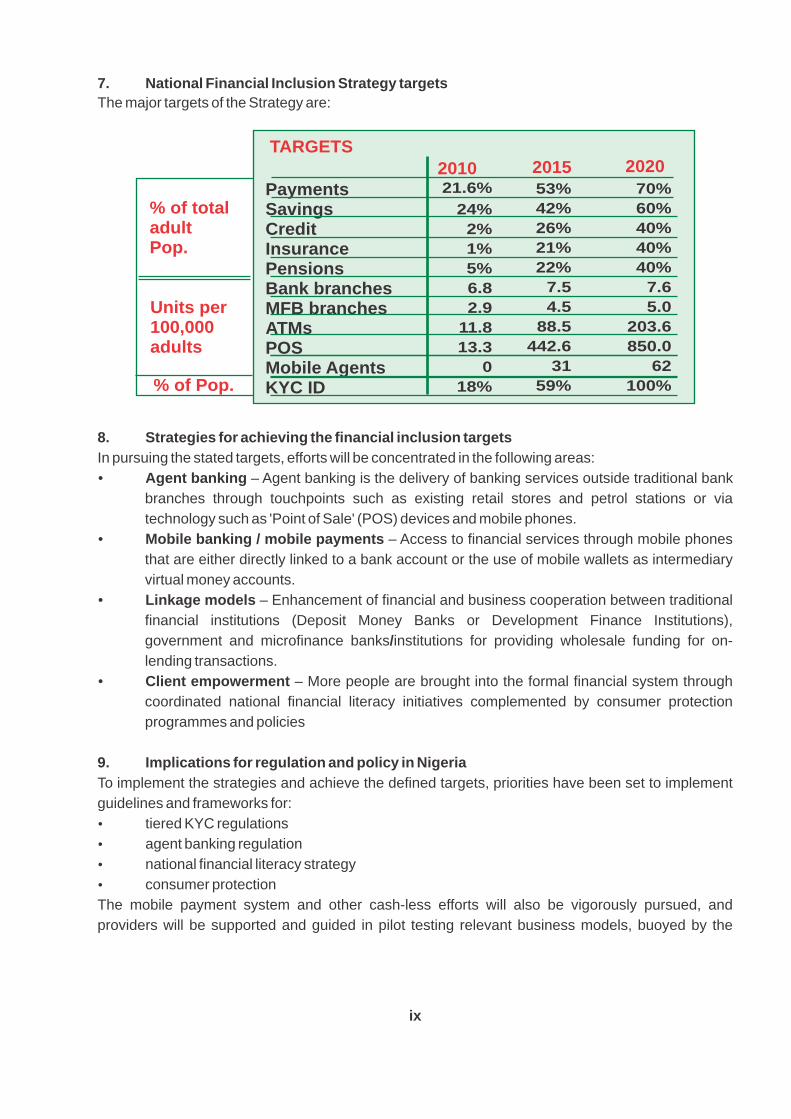
7. National Financial Inclusion Strategy targets
The major targets of the Strategy are:
PaymentsSavings Credit Insurance Pensions Bank branches MFB branchesATMsPOSMobile AgentsKYC ID
TARGETS
% of total adultPop.
Units per 100,000adults
% of Pop.
2010 2015 202021.6%
24%
2%
1%
5%
6.8
2.9
11.8
13.3
0
18%
53%
42%
26%
21%
22%
7.5
4.5
88.5
442.6
31
59%
70%
60%
40%
40%
40%
7.6
5.0
203.6
850.0
62
100%
implementation of global peer learning programmes.
10. Monitoring and evaluation
To ensure impact and proper strategic direction, the Financial Inclusion Secretariat will conduct
ongoing monitoring and evaluation. The process will follow these steps:
Ÿ Biannual collection of comprehensive data from industry stakeholders
Ÿ Distillation of key performance indicators from industry data
Ÿ Comparison of results with defined indicator targets
Ÿ Analysis of gaps and trends3
Ÿ Annual reporting to the Financial Services Regulation Coordinating Committee4(FRSCC) and the National Economic Council
Ÿ Suggestions to increase target achievement rates, such as necessary measures to be taken,
changes in priorities, or a partial review of the strategic direction
11. Organisational framework for institutionalising the National Financial Inclusion
Strategy
A Financial Inclusion Secretariat will be set up within the CBN to take responsibility for day-to-day
reporting, coordination, and implementation work. Its activities will be supervised by the Financial
Services Regulation Coordinating Committee (FSRCC), which will in turn, provide updates to the
National Economic Council (NEC).
FSRCC members include: Central Bank of Nigeria, Federal Ministry of Finance, Nigeria Deposit Insurance Corporation, Securities and Exchange Commission, National Pension Commission, Commissioner for Insurance, Corporate Affairs Commission, Abuja Securities and Commodities Exchange, Nigerian Stock Exchange, and Federal Inland Revenue Service.National Economic Council members include: Vice President, Federal Ministry of Finance, Central Bank of Nigeria, and State Governors
3
x
4
1
1.0 INTRODUCTION The purpose of Nigeria's National Financial Inclusion Strategy (FIS) is to set a clear agenda for significantly increasing access to and usage of financial services by 2020.
1.1 Definition of Financial Inclusion1Financial inclusion is achieved when adults have easy access to a broad range of formal
financial services that meet their needs and are provided at an affordable cost.
The definition of financial inclusion used in the FIS includes the following elements:i. Ease of access to financial products and services
Financial products must be within easy reach of all segments of the 2population and should not have onerous requirements.
ii. Use of a broad range of financial products and servicesFinancial inclusion implies not only access but usage of a full spectrum of financial services including, but not limited to payments, savings, credit, insurance, and pension products.
iii. Financial products designed according to needFinancial products must be designed to meet the needs of clients and should consider income levels, as well as access to distribution channels.
iv. Affordable Financial services should be affordable even for low-income groups.
1.2 Strategic ObjectivesTo set a clear agenda to significantly increase access to and use of financial services by 2020;To ensure that the concerns and inputs of all stakeholders are considered and that roles and responsibilities are defined before financial inclusion regulations and policies are established; andTo outline a framework for increasing the formal use of financial services from
336.3% of the adult population in 2010 to 70% by 2020.
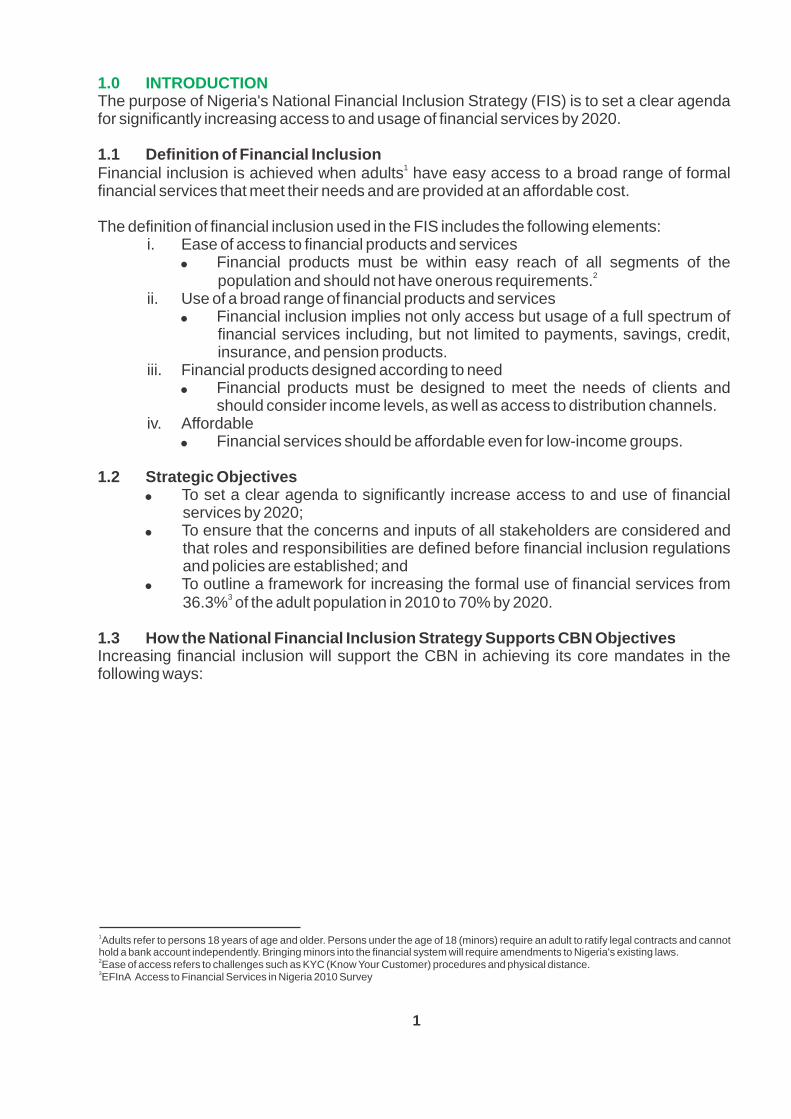
1.3 How the National Financial Inclusion Strategy Supports CBN Objectives Increasing financial inclusion will support the CBN in achieving its core mandates in the following ways:
1Adults refer to persons 18 years of age and older. Persons under the age of 18 (minors) require an adult to ratify legal contracts and cannot hold a bank account independently. Bringing minors into the financial system will require amendments to Nigeria's existing laws.2Ease of access refers to challenges such as KYC (Know Your Customer) procedures and physical distance.3EFInA Access to Financial Services in Nigeria 2010 Survey
2
OBJECTIVES OF THE CBN HOW FINANCIAL INCLUSION ADDRESSES THE CBN OBJECTIVES
The mandate of the Central Bank of Nigeria (CBN) is derived from the 1958 Act of Parliament, as amended in 1991, 1993, 1997, 1998, 1999 and 2007Source:Central Bank of Nigeria
§Ensure monetary and price stability
§ The CBN will be better able to influence savings, investment and consumption behavior through interest and exchange rate changes, a direct result of the increased participation of Nigerians in the formal financial sector
§Maintain external reserves to safeguard the international value of the Naira
§ Increased access to finance for MSMEs as a result of financial inclusion (credit made on the back of mobilized savings) will lead to greater productivity, increased non-oil exports/foreign exchange earnings and this will stabilize the value of the Naira
§Promote a sound financial system in Nigeria
§ Financial inclusion will lead to the development of a stable financial system funded by non-volatile savings that are robust and provide cushion against external shocks
§Issue legal tender currency in Nigeria
§ Increased penetration of e-payments use and cashless efforts will reduce the cost of cash management and thereby reduce the cost of issuing legal tender
§Provide economic and financial advice to the Federal Government
§ The CBN will be better able to advise the government as increased participation in formal finance will produce a more complete picture of the country’s economic performance.
Figure 1: How financial inclusion supports CBN objectives
Central Bank of Nigeria Central Bank of Nigeria EFInA Access to Financial Services in Nigeria 2010 Survey
4
5
6
3
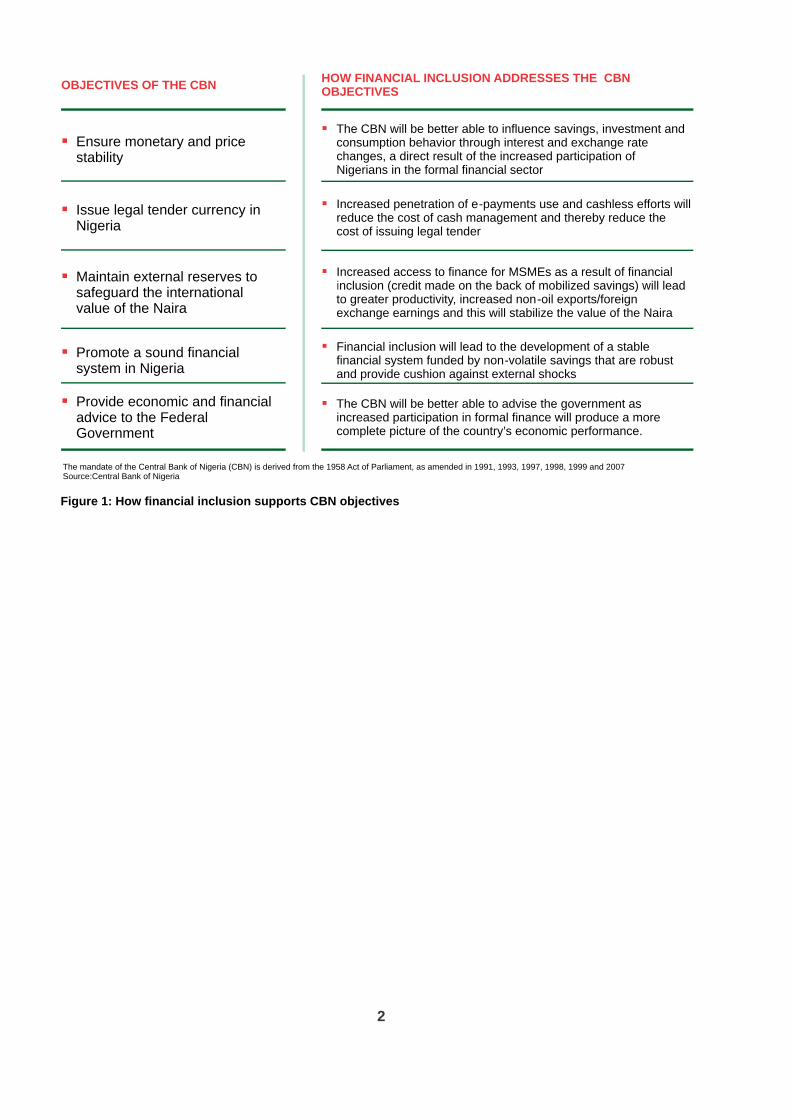
2.0 STRATEGY STAKEHOLDERS AND THEIR INTERESTS
The stakeholders involved in enhancing financial inclusion, as defined by FSS 2020, are: banks,
other financial institutions, the insurance industry, financial regulators, technology/
telecommunications firms, public institutions, and development partners/experts (see Figure 2):
REGULATORS
CBN, NDIC, NAICOM, PenCom, NIMC, NCC,
Self Regulatory
Organizations
INSURANCE§ Insurance companies§Loss adjusters§ Insurance agents
DEVELOPMENT PARTNERS & EXPERTS
§ International finance agencies§Donor institutions
§Consulting companies, advisors
OTHER FINANCIAL INSTITUTIONS
§Discount houses
§Pension Fund Administrators
§Development finance institutions
§
(BOA, BOI, NEXIM, FMBN)
TECHNOLOGY/
TELECOMMUNICATIONS FIRMS
§Settlement providers
§ATM service providers
§Mobile service providers
§E-payment/e-channel operators
BANKING
§Deposit Money Banks§Primary mortgage institutions
§Microfinance banks
PUBLIC INSTITUTIONS§Federal ministries§Government agencies and
programmes §Nigerian Postal Services
Figure 2: Financial inclusion stakeholders in Nigeria
Some of the major Financial Inclusion Strategy stakeholders and their interests include:
Ø Deposit Money Banks (DMBs)Currently, 21 Deposit Money Banks are serving about 20 million clients through a network of
4about 6,000 branches and 10,000 ATMs . With an adult population of over 84.7 million, this shows that a large part of the banking market in Nigeria is still untapped. This has the potential to become a major funding base through the mobilisation of savings, and a source of profit for commercial banks and other financial services institutions.
Ø Microfinance Banks (MFBs)5As of July 2011, Nigeria had 866 microfinance banks (MFBs) and the MFB network served
6only 3.8% of the adult population (3.2 million clients). Of these 3.2 million clients, 65% used savings products, 14% used credit products, and 4% used ATM cards.
The vast majority of MFBs can increase their scale and operating capacity by taking advantage of the opportunities provided by the Financial Inclusion Strategy.
4
Ø Development Finance Institutions (DFIs)There are five Development Finance Institutions (DFIs) in Nigeria that channel financial resources to critical sectors of the economy that would otherwise not be served by the banking sector. The Financial Inclusion Strategy can help DFIs harmonise multiple interventions and increase their impact on the economy.
Ø Microfinance Institutions (MFIs)Non-bank microfinance institutions (MFIs), which include financial NGOs, financial cooperatives, self-help groups, trade associations, and credit unions, are not regulated by the Central Bank of Nigeria. Over 600 MFIs are currently being monitored by CBN. MFIs may benefit from the Financial Inclusion Strategy through increased technical assistance and funding for more effective and efficient member outreach.
Ø InsuranceNigeria's recapitalisation exercise of 2007 consolidated the insurance industry into 49
7companies . However, as of December 2010, these companies served only 1% of the
8population. With 99% of the population still unserved, there is a large untapped market and enormous business potential for the insurance companies.
Ø PensionsThe 2004 Pension Reform Act established the Compulsory Pensions Scheme (CPS), which has largely been adopted by the Federal Government and the private sector. Annual
9pension contributions grew from NGN 60 billion in 2006 to NGN 290 billion in 2010. However, only 17 of the 36 State Governments and the Federal Capital Territory have passed bills to adopt and implement the CPS.
The current pension system makes allowances for voluntary contributions, which can be tapped by both the formal and informal sectors in Nigeria. Pension Fund Administrators and Custodians can expand their outreach to this untapped market with appropriately targeted products.
Ø Technology and Telecommunication CompaniesThere are nine mobile network operators (MNOs) in Nigeria. MTN, Globacom, and Airtel are the market leaders, with a combined market share of approximately 85%. Payment processing is handled by four companies: Interswitch, Valuecard, Cams, and eTranzact.
10Between 2006 and 2010, the sector experienced 38% CAGR in the total number of
11subscribers and 27% CAGR in tele-density.
MNOs could benefit from the Financial Inclusion Strategy through increased fee revenues that would be generated as a result of offering payments services.
7National Insurance Commission (NAICOM)8EFInA Access to Financial Services in Nigeria 2010 Survey9National Pension Commission (PenCom)10Nigerian Communication Commission (NCC)11Nigerian Communication Commission (NCC)

5
In addition, there would be an increase in client acquisition and retention through more attractive product offerings.
Ø Public InstitutionsParticipation in the Financial Inclusion Strategy would help relevant public institutions achieve their mandates. These institutions include the Small and Medium Enterprise Development Agency of Nigeria (SMEDAN), the National Identity Management Commission (NIMC), and the Nigeria Postal Service (NIPOST).
Ø Development PartnersVarious development partners support financial inclusion initiatives and the Strategy provides a blue print for their interventions thereby assisting them in achieving their objectives.
53.7% Financially Served
36.3% Formally included
46.3% Financially Excluded
Banked Formal Other Informal only Excluded
Formally BankedAdults who have access to or use
financial services supplied by Deposit Money Banks
Formal OtherAdults who have access to or use
formal financial services and financial products not supplied by
Deposit Money Banks
Informal Only Adults who have access to or use any unregulated financial institution
or informal service such as cooperatives or moneylenders
Completely excluded Adults without formal or informal
financial products
30.0% 6.3% 17.4% 46.3%
25.4m 5.3m 14.8m 39.2m
FinanciallyServed 45.5m
Formally included
30.7m
Financially Excluded
39.2m
Informal Only 14.8m
Formal Other 5.3m
Banked 25.4m
Adult Population
84.7m
36.3%
17.4%
30.0%
6.3%
53.7%
46.3%
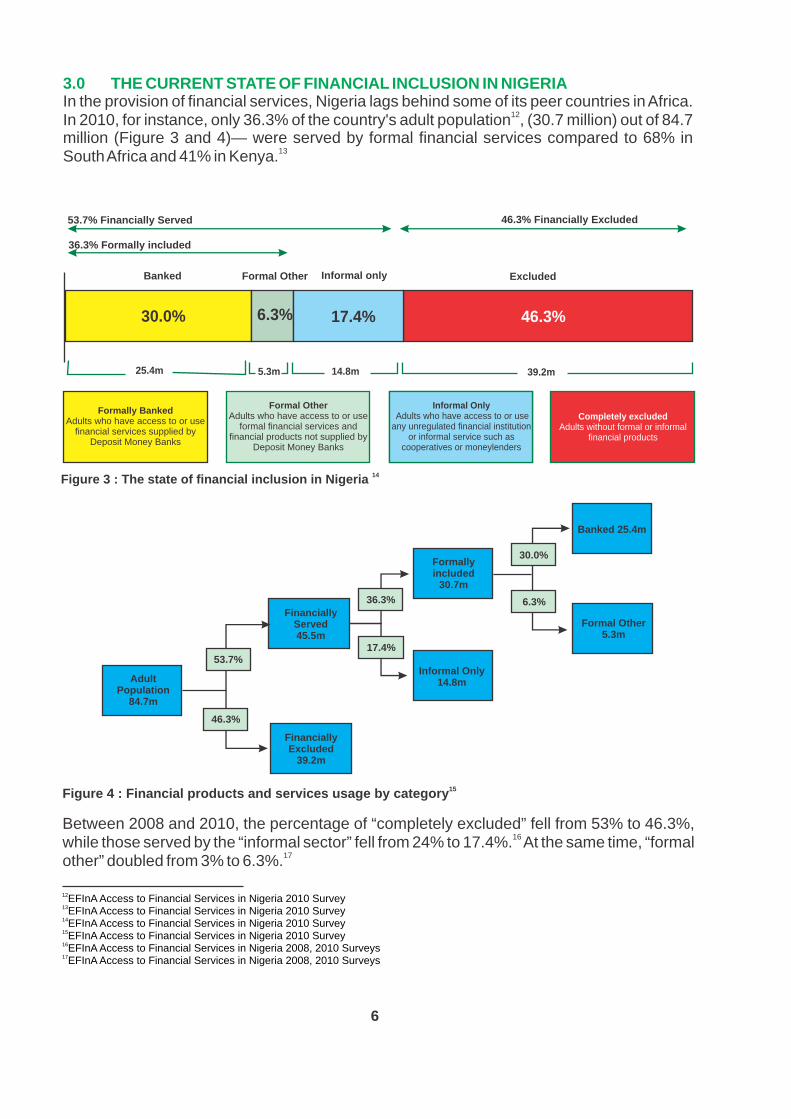
14Figure 3 : The state of financial inclusion in Nigeria
6
3.0 THE CURRENT STATE OF FINANCIAL INCLUSION IN NIGERIAIn the provision of financial services, Nigeria lags behind some of its peer countries in Africa.
12In 2010, for instance, only 36.3% of the country's adult population , (30.7 million) out of 84.7 million (Figure 3 and 4)— were served by formal financial services compared to 68% in
13South Africa and 41% in Kenya.
15Figure 4 : Financial products and services usage by category
Between 2008 and 2010, the percentage of “completely excluded” fell from 53% to 46.3%, 16while those served by the “informal sector” fell from 24% to 17.4%. At the same time, “formal
17other” doubled from 3% to 6.3%.
12EFInA Access to Financial Services in Nigeria 2010 Survey13EFInA Access to Financial Services in Nigeria 2010 Survey14EFInA Access to Financial Services in Nigeria 2010 Survey15EFInA Access to Financial Services in Nigeria 2010 Survey16EFInA Access to Financial Services in Nigeria 2008, 2010 Surveys17EFInA Access to Financial Services in Nigeria 2008, 2010 Surveys
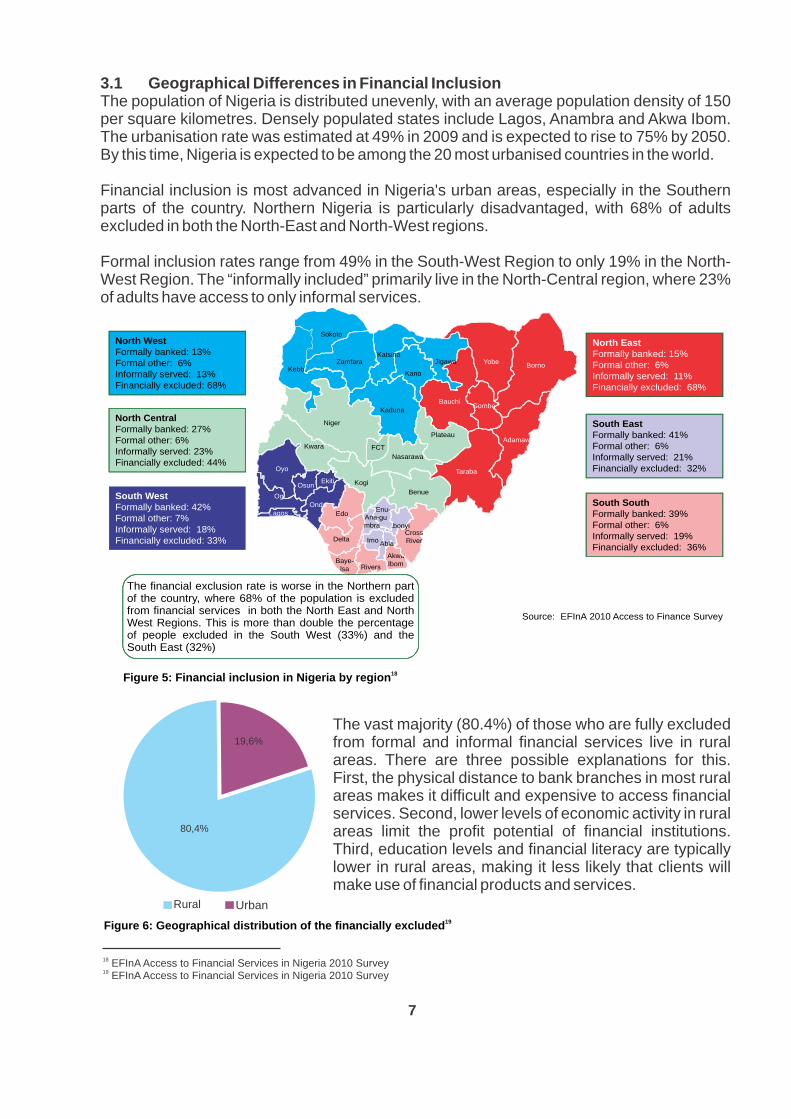
The vast majority (80.4%) of those who are fully excluded from formal and informal financial services live in rural areas. There are three possible explanations for this. First, the physical distance to bank branches in most rural areas makes it difficult and expensive to access financial services. Second, lower levels of economic activity in rural areas limit the profit potential of financial institutions. Third, education levels and financial literacy are typically lower in rural areas, making it less likely that clients will make use of financial products and services.
18 EFInA Access to Financial Services in Nigeria 2010 Survey19 EFInA Access to Financial Services in Nigeria 2010 Survey
7
3.1 Geographical Differences in Financial InclusionThe population of Nigeria is distributed unevenly, with an average population density of 150 per square kilometres. Densely populated states include Lagos, Anambra and Akwa Ibom. The urbanisation rate was estimated at 49% in 2009 and is expected to rise to 75% by 2050. By this time, Nigeria is expected to be among the 20 most urbanised countries in the world.
Financial inclusion is most advanced in Nigeria's urban areas, especially in the Southern parts of the country. Northern Nigeria is particularly disadvantaged, with 68% of adults excluded in both the North-East and North-West regions.
Formal inclusion rates range from 49% in the South-West Region to only 19% in the North- West Region. The “informally included” primarily live in the North-Central region, where 23% of adults have access to only informal services.
80,4%
19,6%
Rural Urban19
Figure 6: Geographical distribution of the financially excluded
Source: EFInA 2010 Access to Finance Survey
Adamawa
Akwa Ibom
Bauchi
Baye-
Benue
Borno
Cross RiverDelta
Ebonyi
Edo
Ekiti
Enu-gu
FCT
Gombe
Imo
Jigawa
Kaduna
Kano
Katsina
Kebbi
Kogi
Kwara
Lagos
Nasarawa
Niger
Ogun
Ondo
Osun
Oyo
Plateau
Rivers
Sokoto
Taraba
Yobe
Zamfara
Abia
Ana-mbra
North West
Formally banked: 13%
Formal other: 6%
Informally served: 13%
Financially excluded: 68%
North Central
Formally banked: 27%
Formal other: 6%
Informally served: 23%
Financially excluded: 44%
North EastFormally banked: 15% Formal other: 6%Informally served: 11%Financially excluded: 68%
South EastFormally banked: 41% Formal other: 6%Informally served: 21%Financially excluded: 32%
South SouthFormally banked: 39% Formal other: 6%Informally served: 19%Financially excluded: 36%
South WestFormally banked: 42%Formal other: 7%Informally served: 18%Financially excluded: 33%
18Figure 5: Financial inclusion in Nigeria by region
lsa
The financial exclusion rate is worse in the Northern partof the country, where 68% of the population is excludedfrom financial services in both the North East and NorthWest Regions. This is more than double the percentageof people excluded in the South West (33%) and theSouth East (32%)
20EFInA Access to Financial Services in Nigeria 2010 Survey
Figure 8 : Characteristics of the financially excluded
54,4%45,6%
MaleFemale
GENDER LEVEL OF EDUCATION AGE
No Formal education
up to primary
education
up to secondaryeducation
Others
up to tertiary
education
1,8%
3,1%
37,6%
23,4%
23,4%
34,0%18-24Years
25-34Years
35-44Years
45-54Years
55-64Years
65 years and
above
32,6%
25,1%
16.1%
12,7%
7,8%
5,7%
8
A total of 39.2 million adults (46.3% of the adult population) were excluded from financial services in Nigeria as at 2010. Out of this, women account for 54.4%, younger adults (those under 45 years), 73.8% and the uneducated (have no formal education), 34%.
Never Banked
CurrentlyBanked
Previously Banked
67.2%
2.8%
30.0%
Figure 7: Levels of financial exclusion in Nigeria
There are two key demographic trends that have implications for financial inclusion:A relatively young population that is rapidly urbanising.Nigeria is the world's tenth most populous country. According to the National Population Commission, Nigeria's population grew from 140.4 million in 2006 to 167.9 million by the end of October 2011. Of this number, 82.1 million were females and 85.8 million were males. At an annual growth rate of 3.2% (the rate used by the Commission in 1991 and 2006), Nigeria's population is expected to reach 221.4 million by 2020.
203.2 Characteristics of the Financially ExcludedA major feature of the access to financial services in 2010 was that 30% of adult Nigerians had banking services while 2.8% that previously had access to banking services had dropped out.
Source: CBN, Bank Annual Reports, EFinA Access so Financial Servcies inNigeria 2010
21Central Bank of Nigeria
9
3.3 Financial Sector InfrastructureThe existing banking infrastructure has the capacity to expand financial inclusion throughout the country. As of December 2010, Nigeria had a combined total of 5,797 bank branches,
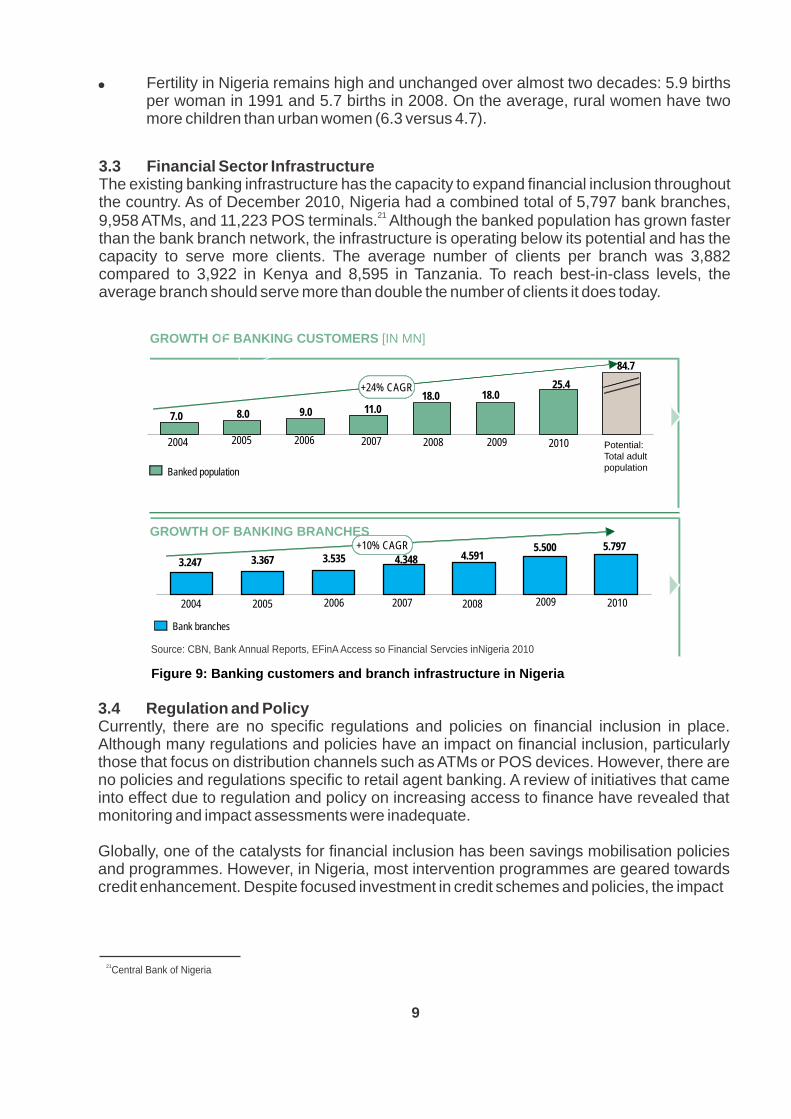
219,958 ATMs, and 11,223 POS terminals. Although the banked population has grown faster than the bank branch network, the infrastructure is operating below its potential and has the capacity to serve more clients. The average number of clients per branch was 3,882 compared to 3,922 in Kenya and 8,595 in Tanzania. To reach best-in-class levels, the average branch should serve more than double the number of clients it does today.
GROWTH OF BANKING CUSTOMERS [IN MN]
GROWTH OF BANKING BRANCHES
+24%
CAGR
Potential: Total adult population
84.7
2010
25.4
2009
18.0
2008
18.0
2007
11.0
2006
9.0
2005
8.0
2004
7.0
Banked population
+10% CAGR
2010
5.797
2009
5.500
2008
4.591
2007
4.348
2006
3.535
2005
3.367
2004
3.247
Bank branches
Figure 9: Banking customers and branch infrastructure in Nigeria
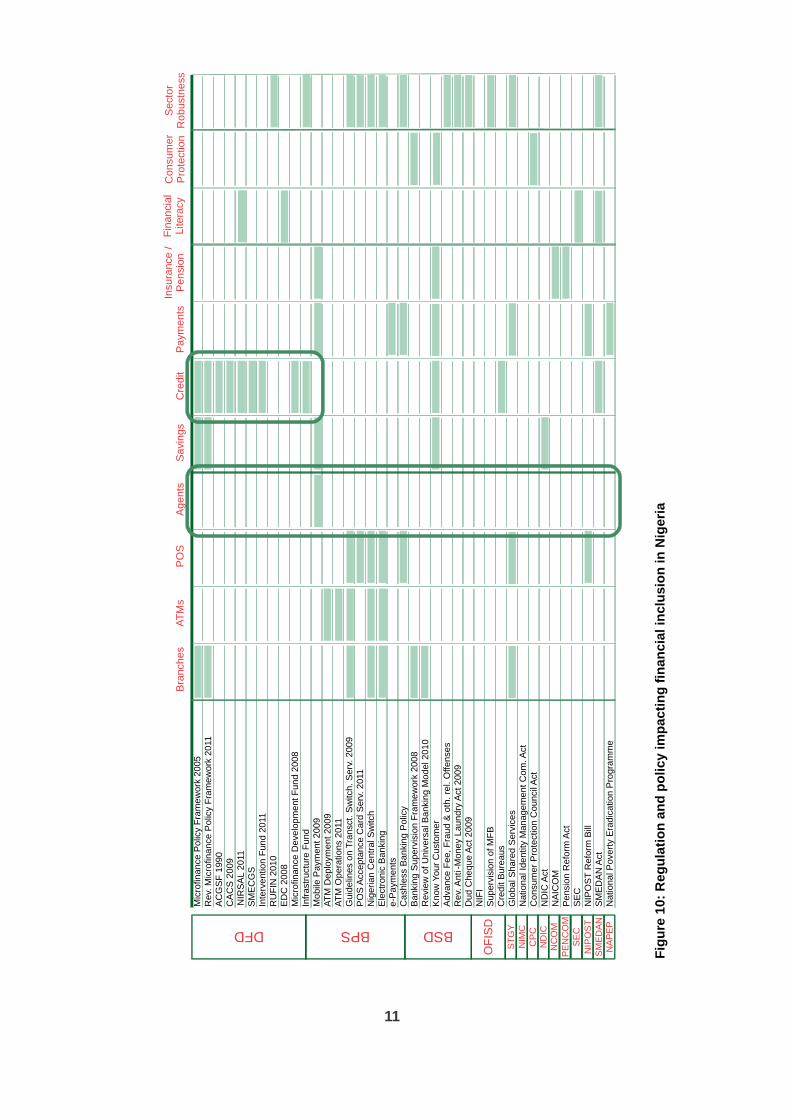
3.4 Regulation and PolicyCurrently, there are no specific regulations and policies on financial inclusion in place. Although many regulations and policies have an impact on financial inclusion, particularly those that focus on distribution channels such as ATMs or POS devices. However, there are no policies and regulations specific to retail agent banking. A review of initiatives that came into effect due to regulation and policy on increasing access to finance have revealed that monitoring and impact assessments were inadequate.
Globally, one of the catalysts for financial inclusion has been savings mobilisation policies and programmes. However, in Nigeria, most intervention programmes are geared towards credit enhancement. Despite focused investment in credit schemes and policies, the impact
Fertility in Nigeria remains high and unchanged over almost two decades: 5.9 births per woman in 1991 and 5.7 births in 2008. On the average, rural women have two more children than urban women (6.3 versus 4.7).

10
of these schemes appears to be limited considering the scale of financial exclusion in Nigeria.
The impact of these regulations and policies has been analysed in relation to the following factors (see Figure 10):
distribution channelsfinancial services and productsfinancial literacy and consumer protection
11
Mic
rofin
an
ce P
olic
y F
ram
ew
ork
20
05
R
ev.
Mic
rofin
an
ce P
olic
y F
ram
ew
ork
20
11
A
CG
SF
19
90
NIR
SA
L 2
011
Inte
rve
ntio
n F
un
d 2
011
R
UF
IN 2
01
0
Mic
rofin
an
ce D
eve
lop
me
nt
Fu
nd
20
08
AT
M D
ep
loym
en
t 2
00
9
Gu
ide
line
s o
n T
ran
sct.
Sw
itch
. S
erv
. 2
00
9
Nig
eria
n C
en
tra
l Sw
itch
E
lect
ron
ic B
an
kin
g
Ba
nki
ng
Su
pe
rvis
ion
Fra
me
wo
rk 2
00
8
Ad
van
ce F
ee
, F
rau
d &
oth
. re
l. O
ffe
nse
s
NIF
I
C
red
it B
ure
au
s
N
atio
na
l Id
en
tity
Ma
na
ge
me
nt
Co
m. A
ct
NA
ICO
M
S
EC
Na
tion
al P
ove
rty
Era
dic
atio
n P
rog
ram
me
CA
CS
20
09
SM
EC
GS
ED
C 2
00
8
Mo
bile
Pa
yme
nt
20
09
AT
M O
pe
ratio
ns
20
11
PO
S A
cce
pta
nce
Ca
rd S
erv
. 2
011
Infr
ast
ruct
ure
Fu
nd
Ca
shle
ss B
an
kin
g P
olic
y
Re
vie
w o
f U
niv
ers
al B
an
kin
g M
od
el 2
01
0
Du
d C
he
qu
e A
ct 2
00
9
e-P
aym
en
ts
Kn
ow
Yo
ur
Cu
sto
me
r
Re
v. A
nti
-Mo
ne
y L
au
nd
ry A
ct 2
00
9
Su
pe
rvis
ion
of
MF
B
G
lob
al S
ha
red
Se
rvic
es
C
on
sum
er
Pro
tect
ion
Co
un
cil A
ct
Pe
nsi
on
Re
form
Act
N
IPO
ST
Re
form
Bill
S
ME
DA
N A
ct
ND
IC A
ct
DFD
OF
ISD
BPS
BSD
ST
GY
N
IMC
C
PC
N
DIC
N
CO
M
PE
NC
OM
SE
C
NIP
OS
T
S
ME
DA
N
N
AP
EP
Bra
nch
es
A
TM
s
PO
S
A
gents
S
avi
ngs
C
redit
P
aym
ents
Insu
rance
/
Pensi
on
Fin
anci
al
Litera
cy
Consu
mer
Pro
tect
ion
Sect
or
Robust
ness
Fig
ure
10:
Reg
ula
tio
n a
nd
po
licy im
pacti
ng
fin
an
cia
l in
clu
sio
n in
Nig
eri
a
12
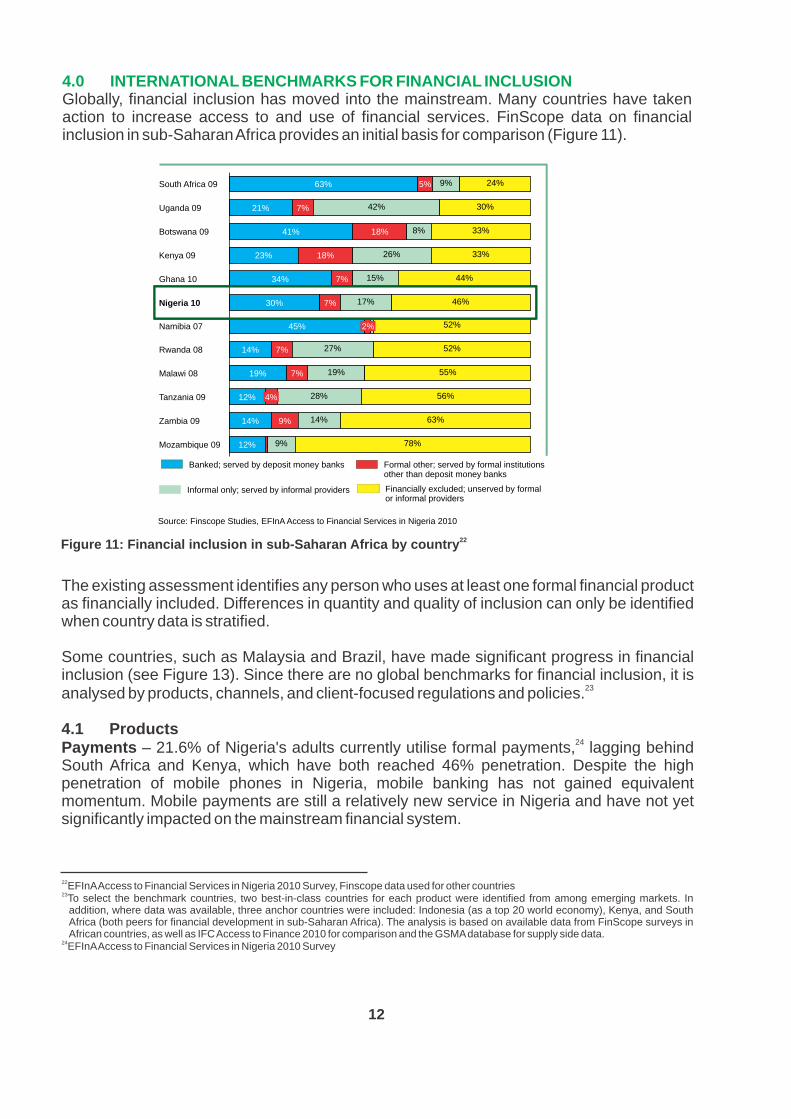
4.0 INTERNATIONAL BENCHMARKS FOR FINANCIAL INCLUSION Globally, financial inclusion has moved into the mainstream. Many countries have taken action to increase access to and use of financial services. FinScope data on financial inclusion in sub-Saharan Africa provides an initial basis for comparison (Figure 11).
9%
42%
8%
26%
15%
17%
27%
19%
28%
14%
9%
24%
30%
33%
33%
44%
46%
52%
52%
55%
56%
63%
78%
Zambia 09
14%
9%
Mozambique 09 12%
Tanzania 09
12%
4%
Malawi 08
19%
7%
Rwanda 08
14%
7%
Namibia 07
45%
2%
Nigeria 10
30%
7%
Ghana 10
34%
7%
Kenya 09
23%
18%
Botswana 09
41%
18%
Uganda 09
21%
7%
South Africa 09
63%
5%
Source: Finscope Studies, EFInA Access to Financial Services in Nigeria 2010
Banked; served by deposit money banks Formal other; served by formal institutions other than deposit money banks
Informal only; served by informal providers Financially excluded; unserved by formal or informal providers
22Figure 11: Financial inclusion in sub-Saharan Africa by country
The existing assessment identifies any person who uses at least one formal financial product as financially included. Differences in quantity and quality of inclusion can only be identified when country data is stratified.
Some countries, such as Malaysia and Brazil, have made significant progress in financial inclusion (see Figure 13). Since there are no global benchmarks for financial inclusion, it is
23analysed by products, channels, and client-focused regulations and policies.
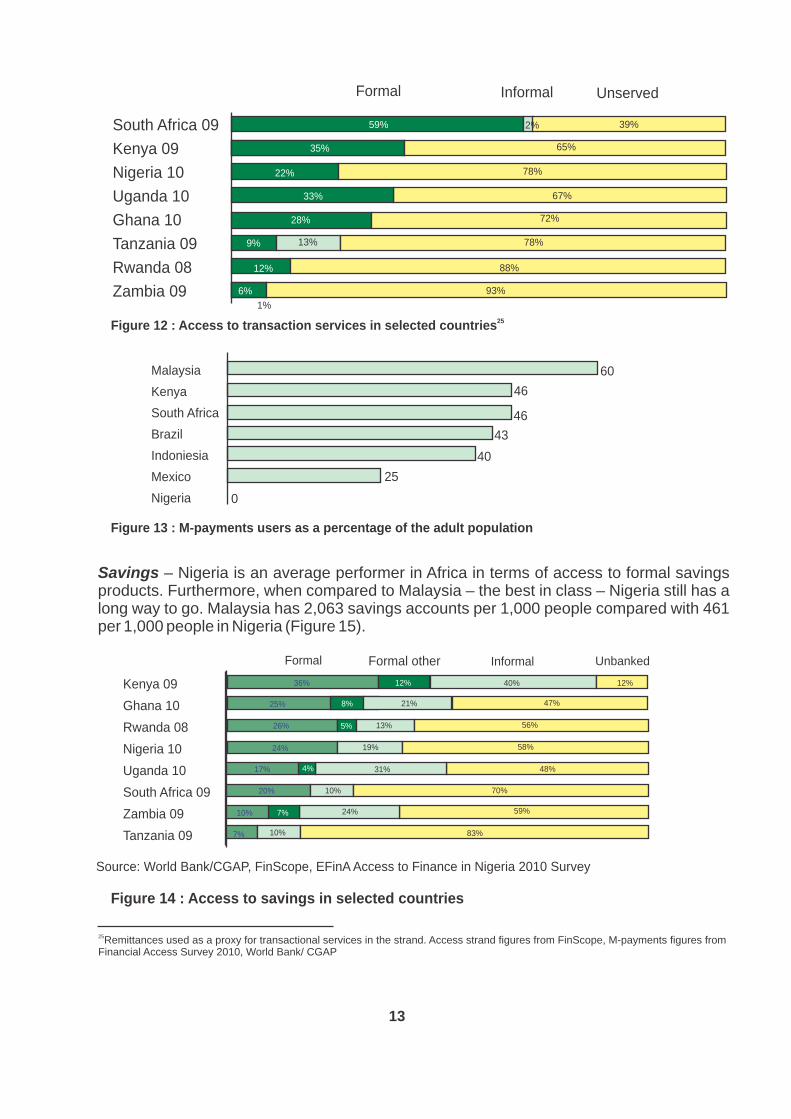
4.1 Products24Payments – 21.6% of Nigeria's adults currently utilise formal payments, lagging behind
South Africa and Kenya, which have both reached 46% penetration. Despite the high penetration of mobile phones in Nigeria, mobile banking has not gained equivalent momentum. Mobile payments are still a relatively new service in Nigeria and have not yet significantly impacted on the mainstream financial system.
22EFInA Access to Financial Services in Nigeria 2010 Survey, Finscope data used for other countries23To select the benchmark countries, two best-in-class countries for each product were identified from among emerging markets. In
addition, where data was available, three anchor countries were included: Indonesia (as a top 20 world economy), Kenya, and South Africa (both peers for financial development in sub-Saharan Africa). The analysis is based on available data from FinScope surveys in African countries, as well as IFC Access to Finance 2010 for comparison and the GSMA database for supply side data.
24EFInA Access to Financial Services in Nigeria 2010 Survey
Formal Informal Unserved
South Africa 09
Kenya 09
Nigeria 10
Uganda 10
Ghana 10
Tanzania 09
Rwanda 08
Zambia 09
59% 39%
35% 65%
22% 78%
33% 67%
28% 72%
9% 13% 78%
12% 88%
6%
1%
93%
Malaysia
Kenya
South Africa
Brazil
Indoniesia
Mexico
Nigeria
60
46
43
40
25
0
46
Kenya 09
Ghana 10
Rwanda 08
Nigeria 10
Uganda 10
South Africa 09
Zambia 09
Tanzania 09
Source: World Bank/CGAP, FinScope, EFinA Access to Finance in Nigeria 2010 Survey
Formal Informal Formal other Unbanked
36% 12% 40%
25% 8% 21% 47%
26% 5% 13% 56%
17% 4% 31%
58%
12%
24% 19%
48%
20%
10% 7% 24% 59%
7% 10% 83%
10% 70%
25Figure 12 : Access to transaction services in selected countries
Figure 13 : M-payments users as a percentage of the adult population
Figure 14 : Access to savings in selected countries
25Remittances used as a proxy for transactional services in the strand. Access strand figures from FinScope, M-payments figures from Financial Access Survey 2010, World Bank/ CGAP
13
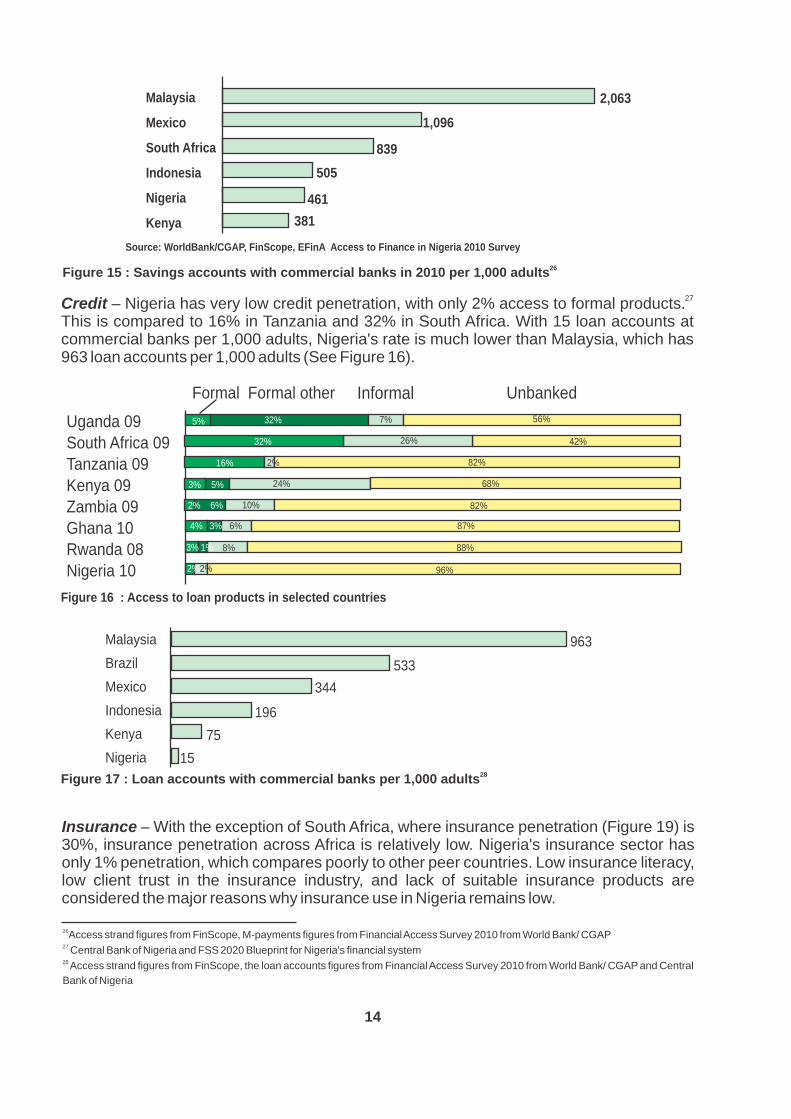
Savings – Nigeria is an average performer in Africa in terms of access to formal savings products. Furthermore, when compared to Malaysia – the best in class – Nigeria still has a long way to go. Malaysia has 2,063 savings accounts per 1,000 people compared with 461 per 1,000 people in Nigeria (Figure 15).
2%
Formal Formal other Informal Unbanked
Uganda 09South Africa 09Tanzania 09Kenya 09Zambia 09Ghana 10Rwanda 08Nigeria 10
28%3% 5% 63%
8%
5% 7%
6%
10% 82%
87%
88%
96%
42%
16%
32% 26%
82%
56%
381
461
505
839
1,096
2,063Malaysia
Mexico
South Africa
Indonesia
Nigeria
Kenya
Source: WorldBank/CGAP, FinScope, EFinA Access to Finance in Nigeria 2010 Survey
Figure 16 : Access to loan products in selected countries
Malaysia
Brazil
Mexico
Indonesia
Kenya
Nigeria
963
533
344
196
75
15
26Access strand figures from FinScope, M-payments figures from Financial Access Survey 2010 from World Bank/ CGAP27 Central Bank of Nigeria and FSS 2020 Blueprint for Nigeria's financial system28 Access strand figures from FinScope, the loan accounts figures from Financial Access Survey 2010 from World Bank/ CGAP and Central
Bank of Nigeria
14
27 Credit – Nigeria has very low credit penetration, with only 2% access to formal products.This is compared to 16% in Tanzania and 32% in South Africa. With 15 loan accounts at commercial banks per 1,000 adults, Nigeria's rate is much lower than Malaysia, which has 963 loan accounts per 1,000 adults (See Figure 16).
26Figure 15 : Savings accounts with commercial banks in 2010 per 1,000 adults
28Figure 17 : Loan accounts with commercial banks per 1,000 adults
Insurance – With the exception of South Africa, where insurance penetration (Figure 19) is 30%, insurance penetration across Africa is relatively low. Nigeria's insurance sector has only 1% penetration, which compares poorly to other peer countries. Low insurance literacy, low client trust in the insurance industry, and lack of suitable insurance products are considered the major reasons why insurance use in Nigeria remains low.
32%
2%
24% 68%
2% 6%
4% 3%
3% 1% 8%
2% 2%
South Africa 09
Kenya 09
Tanzania 09
Ghana 10
Zambia 09
Uganda 09
Nigeria 10
Rwanda 08
Source: Swiss Reinsurance Company Ltd., EFinA Access to Finance in Nigeria 2010 Survey
Formal Formal Other Informal Uninsured
36% 8%
7%
56%
75%
99%
17% 82%
93%
22%
96%
95%
93%6%
4%
4%
Figure 18 : Access to insurance services in selected countries
South Africa
Brazil
Malaysia
Mexico
Kenya
Nigeria
30
24
21
14
2
1
Chile
South Africa
Argentina
Mexico
China
Brazil
Nigeria
39%
37%
35%
24%
5%
6%
15%
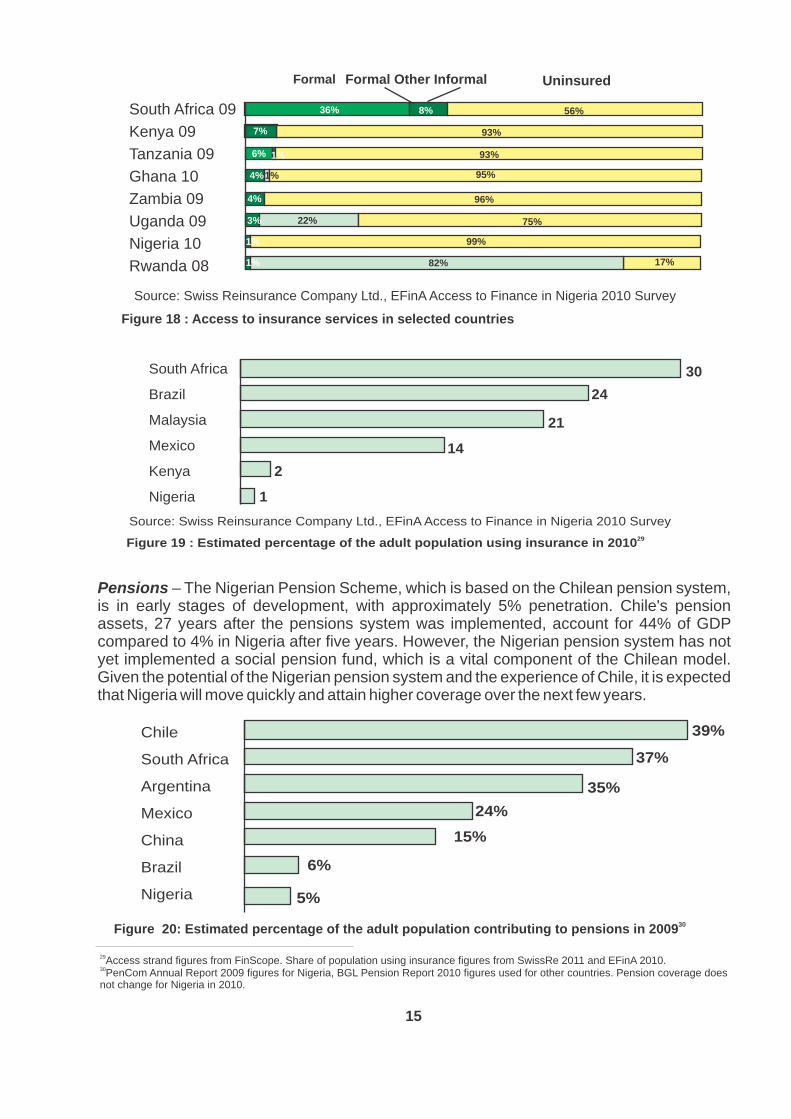
29Access strand figures from FinScope. Share of population using insurance figures from SwissRe 2011 and EFinA 2010.30PenCom Annual Report 2009 figures for Nigeria, BGL Pension Report 2010 figures used for other countries. Pension coverage does not change for Nigeria in 2010.
30Figure 20: Estimated percentage of the adult population contributing to pensions in 2009
15
Source: Swiss Reinsurance Company Ltd., EFinA Access to Finance in Nigeria 2010 Survey29Figure 19 : Estimated percentage of the adult population using insurance in 2010
Pensions – The Nigerian Pension Scheme, which is based on the Chilean pension system, is in early stages of development, with approximately 5% penetration. Chile's pension assets, 27 years after the pensions system was implemented, account for 44% of GDP compared to 4% in Nigeria after five years. However, the Nigerian pension system has not yet implemented a social pension fund, which is a vital component of the Chilean model. Given the potential of the Nigerian pension system and the experience of Chile, it is expected that Nigeria will move quickly and attain higher coverage over the next few years.
1%
1%
1%
3%
1%
Mexico Brazil Nigeria Indonesia South Africa Kenya
12.8 13.8 14.515.2
13.3 13.5 13.9 13.8
5.8 6.5 6.7 6.88.9 9.7
10.912.4
6.17.9
9.4 10.1
3.9 4.5 4.9 5.1
07 08 09 10 07 08 09 10 07 08 09 10 07 08 09 10 07 08 09 10 07 08 09 10
Source: world bank Central Bank of Kenya, Central Bank of Nigeria
+6% +1%
+5%
+12%
+19%
+10%
31 While there are various “mini branch” concepts in place around the world, we understand them as brick and mortar banking infrastructure that offers a limited set of financial products and services and does not exceed five staff, not including agents that may be linked to the branch.
Brazil Thailand Nigeria Indonesia South Africa Kenya
+3%
+18%
+33% +5%
+25%
+22%
07 08 09 10 07 08 09 10 07 08 09 10 07 08 09 10 07 08 09 10 07 08 09 10
Source: Banco Central do Brazil, Bank of Thailand, Central Bank of Kenya, World Bank
47.8
66.274.477.7
5.1 9.5 12.311.8 11.613.314.3 13.4
30.844.1 52.6
59.6
5.3 6.8 8.5 9.6
110.0112.1
115.4 120.6
Figure 22 : ATMs per 100,000 adults
16
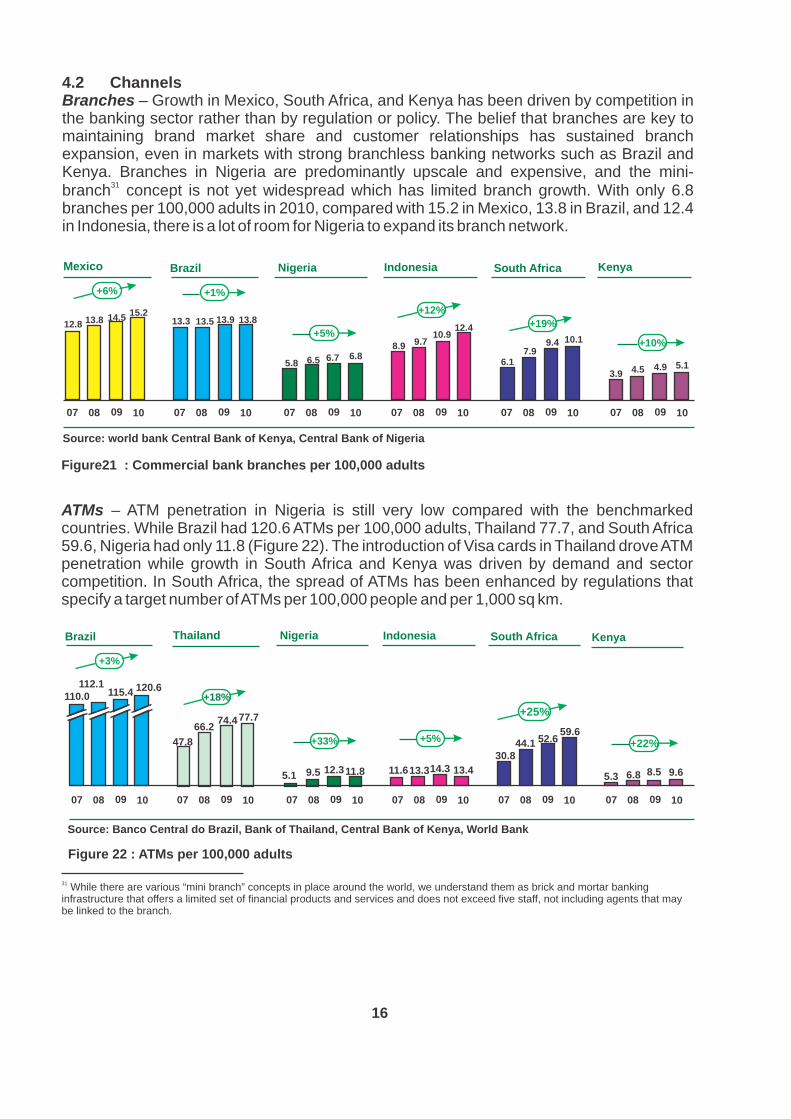
4.2 ChannelsBranches – Growth in Mexico, South Africa, and Kenya has been driven by competition in the banking sector rather than by regulation or policy. The belief that branches are key to maintaining brand market share and customer relationships has sustained branch expansion, even in markets with strong branchless banking networks such as Brazil and Kenya. Branches in Nigeria are predominantly upscale and expensive, and the mini-
31branch concept is not yet widespread which has limited branch growth. With only 6.8 branches per 100,000 adults in 2010, compared with 15.2 in Mexico, 13.8 in Brazil, and 12.4 in Indonesia, there is a lot of room for Nigeria to expand its branch network.
Figure21 : Commercial bank branches per 100,000 adults
ATMs – ATM penetration in Nigeria is still very low compared with the benchmarked countries. While Brazil had 120.6 ATMs per 100,000 adults, Thailand 77.7, and South Africa 59.6, Nigeria had only 11.8 (Figure 22). The introduction of Visa cards in Thailand drove ATM penetration while growth in South Africa and Kenya was driven by demand and sector competition. In South Africa, the spread of ATMs has been enhanced by regulations that specify a target number of ATMs per 100,000 people and per 1,000 sq km.
Brazil Malaysia Nigeria Mexico South Africa Kenya
Source: Central Bank of Kenya, Banco Central do Brazil, Central Bank of Malaysia
07 08 09 10 07 08 09 10 07 08 09 10 07 08 09 10 07 08 09 10 07 08 09 10
1,5821,982
2,085
2,193
580
670720
790
9 15 14 13
615 643 631716
569651
744
850
63 71 79 88
+11%+12%
+5%+14%+11%
+11%
Figure 23: POS devices per 100,000 adults
Kenya ‘10
Brazil ‘10
South Africa ‘08
Philippines ‘08
Source: Central Bank of Kenya, Banco Central do Brazil CGAPBill and Melinda Gates Foundation
154
122
16
12
32 Central Bank of Kenya, Banco do Brasil, CGAP, Bill and Melinda Gates Foundation
17
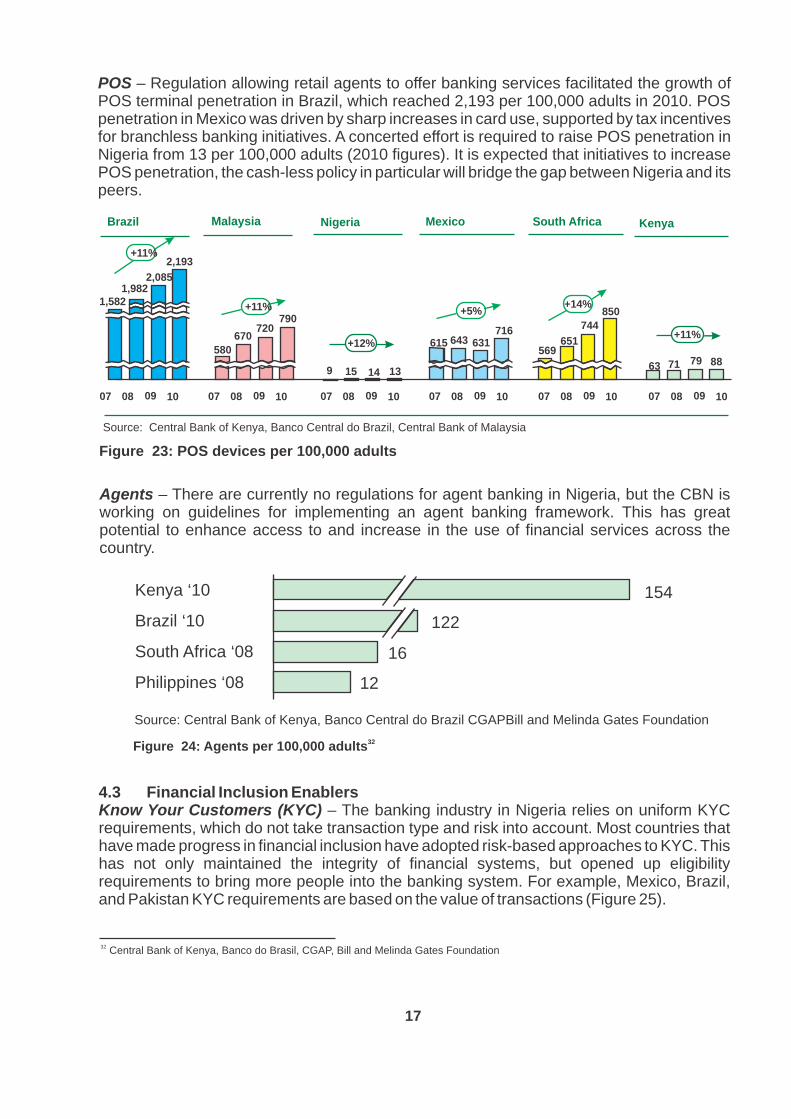
POS – Regulation allowing retail agents to offer banking services facilitated the growth of POS terminal penetration in Brazil, which reached 2,193 per 100,000 adults in 2010. POS penetration in Mexico was driven by sharp increases in card use, supported by tax incentives for branchless banking initiatives. A concerted effort is required to raise POS penetration in Nigeria from 13 per 100,000 adults (2010 figures). It is expected that initiatives to increase POS penetration, the cash-less policy in particular will bridge the gap between Nigeria and its peers.
Agents – There are currently no regulations for agent banking in Nigeria, but the CBN is working on guidelines for implementing an agent banking framework. This has great potential to enhance access to and increase in the use of financial services across the country.
32Figure 24: Agents per 100,000 adults
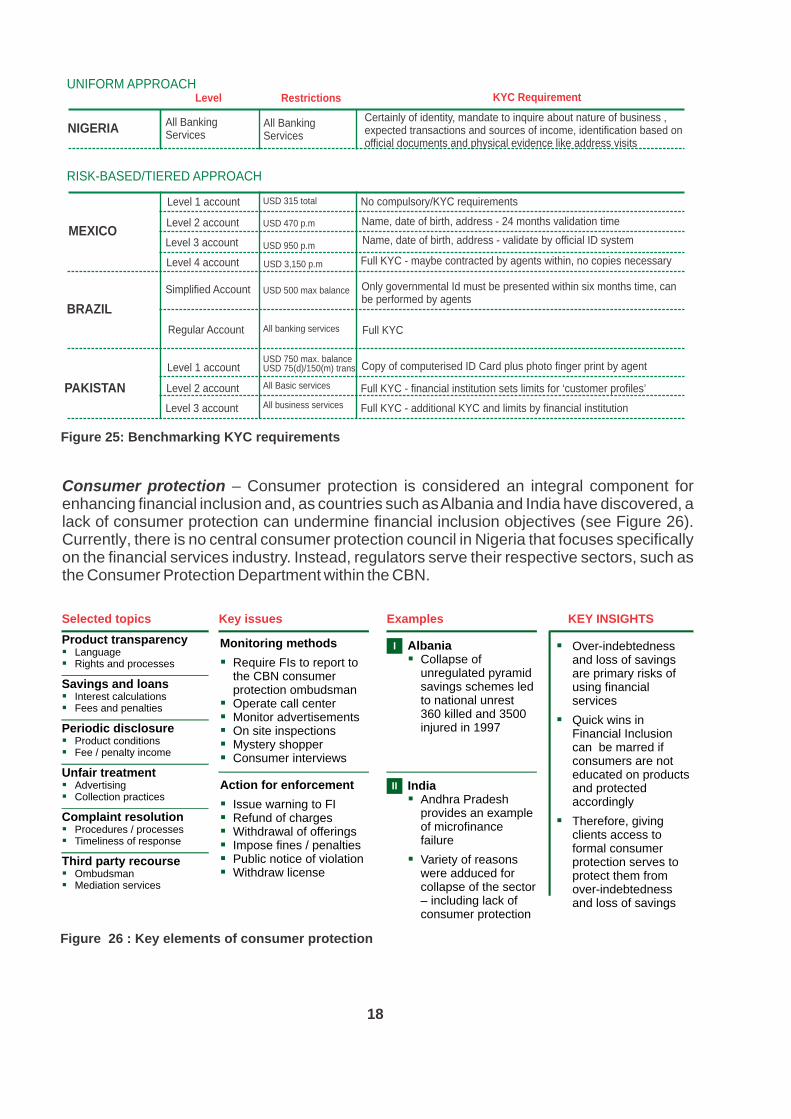
4.3 Financial Inclusion Enablers Know Your Customers (KYC) – The banking industry in Nigeria relies on uniform KYC requirements, which do not take transaction type and risk into account. Most countries that have made progress in financial inclusion have adopted risk-based approaches to KYC. This has not only maintained the integrity of financial systems, but opened up eligibility requirements to bring more people into the banking system. For example, Mexico, Brazil, and Pakistan KYC requirements are based on the value of transactions (Figure 25).
UNIFORM APPROACH
NIGERIA
MEXICO
BRAZIL
PAKISTAN
RISK-BASED/TIERED APPROACH
Level Restrictions KYC Requirement
Certainly of identity, mandate to inquire about nature of business , expected transactions and sources of income, identification based on official documents and physical evidence like address visits
Name, date of birth, address - 24 months validation time
Name, date of birth, address - validate by official ID system
Full KYC - maybe contracted by agents within, no copies necessary
Only governmental Id must be presented within six months time, can be performed by agents
Full KYC
Copy of computerised ID Card plus photo finger print by agent
Full KYC - financial institution sets limits for ‘customer profiles’
Full KYC - additional KYC and limits by financial institution
All Banking Services
All Banking Services
Level 1 account
Level 2 account
Level 3 account
Level 4 account
Simplified Account
Regular Account
Level 1 account
Level 2 account
Level 3 account
USD 315 total
USD 470 p.m
USD 950 p.m
USD 3,150 p.m
USD 500 max balance
All banking services
USD 750 max. balance USD 75(d)/150(m) trans
All Basic services
All business services
No compulsory/KYC requirements
18
Figure 25: Benchmarking KYC requirements
Consumer protection – Consumer protection is considered an integral component for enhancing financial inclusion and, as countries such as Albania and India have discovered, a lack of consumer protection can undermine financial inclusion objectives (see Figure 26). Currently, there is no central consumer protection council in Nigeria that focuses specifically on the financial services industry. Instead, regulators serve their respective sectors, such as the Consumer Protection Department within the CBN.
Figure 26 : Key elements of consumer protection
Selected topics Key issues Examples KEY INSIGHTS
§ Over-indebtedness and loss of savings are primary risks of using financial services
§ Quick wins in Financial Inclusion can be marred if consumers are not educated on products and protected accordingly
§ Therefore, giving clients access to formal consumer protection serves to protect them from over-indebtedness and loss of savings
Product transparency § Language
§ Rights and processes
I Albania§Collapse of
unregulated pyramid savings schemes led to national unrest 360 killed and 3500 injured in 1997
Savings and loans
§ Interest calculations
§ Fees and penalties
Periodic disclosure
§ Product conditions
§ Fee / penalty income
Unfair treatment§ Advertising§ Collection practices
Complaint resolution§ Procedures / processes§ Timeliness of response
II India§Andhra Pradesh
provides an example of microfinance failure
§Variety of reasons were adduced for collapse of the sector – including lack of consumer protection
Third party recourse§ Ombudsman§ Mediation services
Monitoring methods
§Require FIs to report to the CBN consumer protection ombudsman
§Operate call center§Monitor advertisements§On site inspections§Mystery shopper
§Consumer interviews
Action for enforcement
§ Issue warning to FI§Refund of charges§Withdrawal of offerings§ Impose fines / penalties§Public notice of violation§Withdraw license
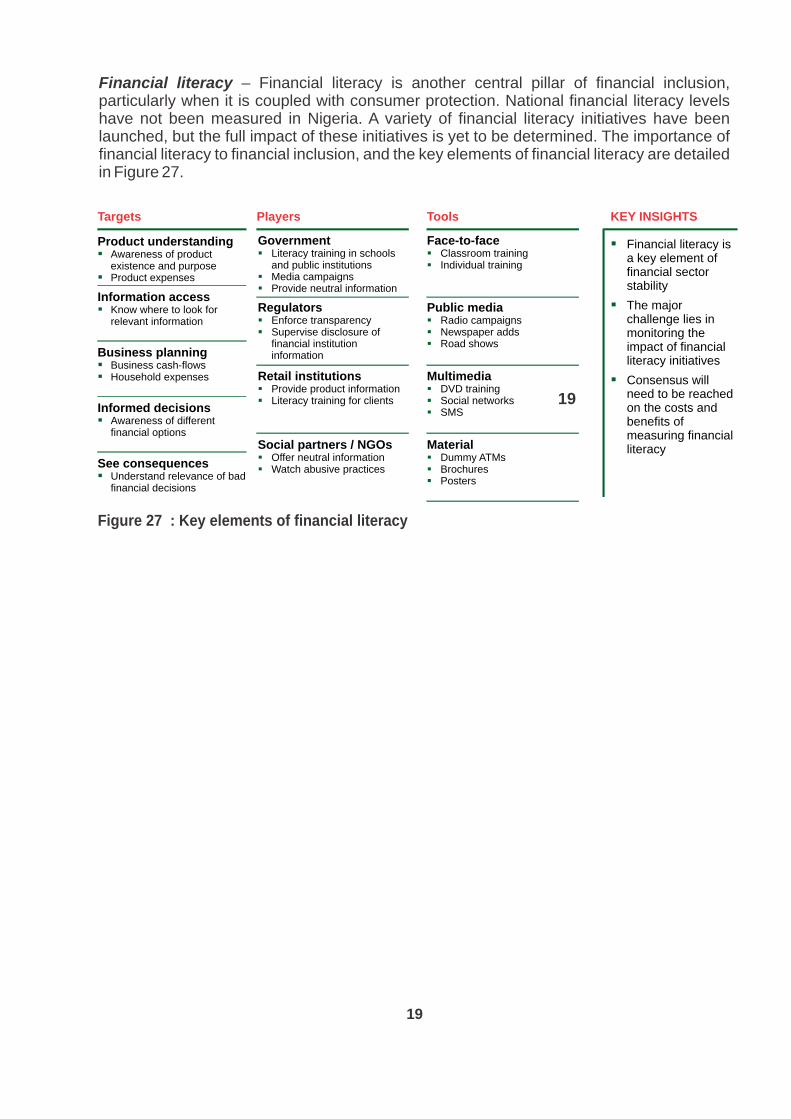
Figure 27 : Key elements of financial literacy
Financial literacy – Financial literacy is another central pillar of financial inclusion, particularly when it is coupled with consumer protection. National financial literacy levels have not been measured in Nigeria. A variety of financial literacy initiatives have been launched, but the full impact of these initiatives is yet to be determined. The importance of financial literacy to financial inclusion, and the key elements of financial literacy are detailed in Figure 27.
19
Targets Players Tools KEY INSIGHTS
§ Financial literacy is a key element of financial sector stability
§ The major challenge lies in monitoring the impact of financial literacy initiatives
§ Consensus will need to be reached on the costs and benefits of measuring financial literacy
Product understanding § Awareness of product
existence and purpose
§ Product expenses
Government § Literacy training in schools
and public institutions
§ Media campaigns
§ Provide neutral information
Information access
§ Know where to look for relevant information
Business planning
§ Business cash-flows
§ Household expenses
Informed decisions§ Awareness of different
financial options
See consequences§ Understand relevance of bad
financial decisions
Retail institutions
§ Provide product information
§ Literacy training for clients
Regulators
§ Enforce transparency
§ Supervise disclosure of financial institution information
Social partners / NGOs§ Offer neutral information§ Watch abusive practices
Face-to-face § Classroom training
§ Individual training
Public media
§ Radio campaigns§ Newspaper adds§ Road shows
Multimedia
§ DVD training
§ Social networks§ SMS
Material§ Dummy ATMs§ Brochures§ Posters
19
5.1 Accessibility
Figure 29 : Average distance to a bank branch in Nigeria
Average distance to next branch in km
5 or less5 to 10 10 to 15 15 to 20 20 or more
56.4
9.0
6.4
3.7
21.7
Sokoto
Kebbi
Niger
Edo
Delta
Bayelsa
Nasarawa
Zamfara
Osun Ekiti
Ondo
Kwara FCT
Kogi
2.9
Benue
Ebonyi
Cross River
Abia Imo
Anambra
Enugu
Kaduna
Kano
Katsina Jigawa Yobe
Borno
Bauchi
Gombe
Adamawa
Taraba
Plateau
Rivers Akwa Ibom
0.9
Oyo
Ogun
Lagos
20
5.0 MAJOR CHALLENGES TO FINANCIAL INCLUSION IN NIGERIA: ISSUES AND EVIDENCE
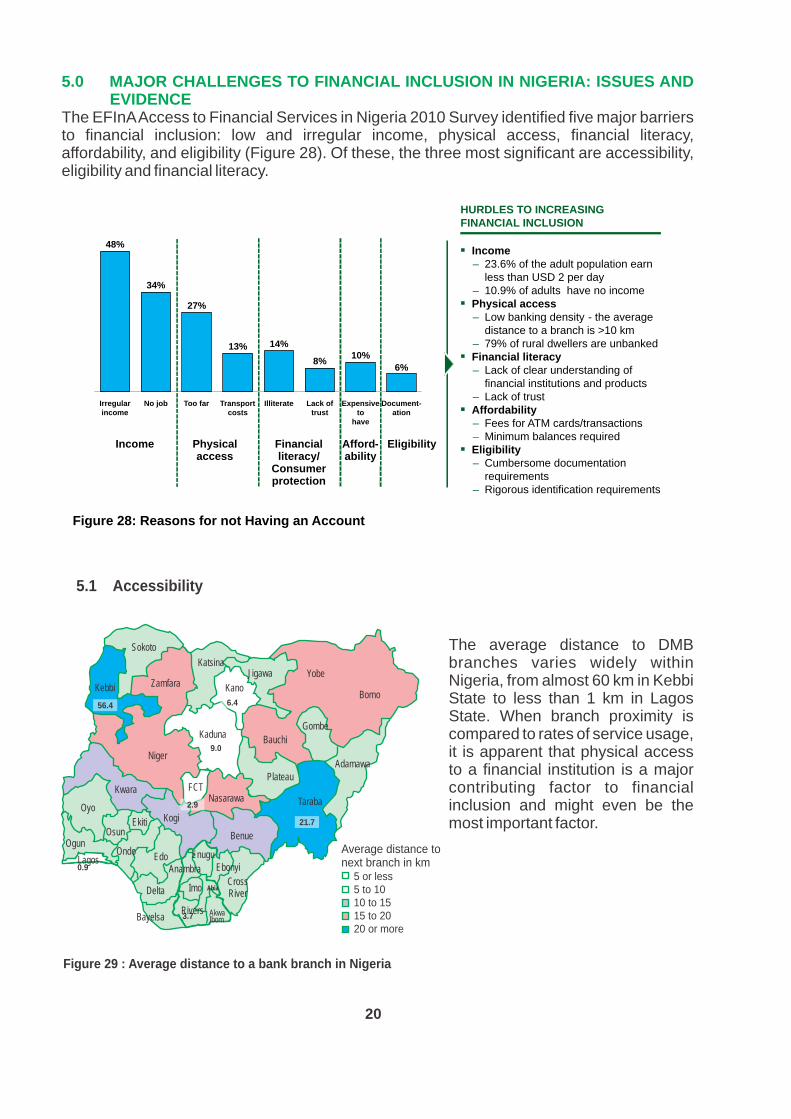
The EFInA Access to Financial Services in Nigeria 2010 Survey identified five major barriers to financial inclusion: low and irregular income, physical access, financial literacy, affordability, and eligibility (Figure 28). Of these, the three most significant are accessibility, eligibility and financial literacy.
Document-ation
6%
Expensive to
have
10%
Lack of trust
8%
Illiterate
14%
Transport costs
13%
Too far
27%
No job
34%
Irregular income
48%
Income Physical access
Financial literacy/
Consumer protection
Afford-ability
Eligibility
HURDLES TO INCREASING FINANCIAL INCLUSION
§ Income– 23.6% of the adult population earn
less than USD 2 per day– 10.9% of adults have no income
§Physical access– Low banking density - the average
distance to a branch is >10 km– 79% of rural dwellers are unbanked
§Financial literacy– Lack of clear understanding of
financial institutions and products– Lack of trust
§Affordability– Fees for ATM cards/transactions– Minimum balances required
§Eligibility– Cumbersome documentation
requirements– Rigorous identification requirements
Figure 28: Reasons for not Having an Account
The average distance to DMB branches varies widely within Nigeria, from almost 60 km in Kebbi State to less than 1 km in Lagos State. When branch proximity is compared to rates of service usage, it is apparent that physical access to a financial institution is a major contributing factor to financial inclusion and might even be the most important factor.
Banked Unbanked
Documentary Evidence of address
Bank Statement
Utility Bill
Land Ownership Documents
Home Ownership Documents
Local Government Rates & Taxes Invoices Tenancy Agreement
Personal Identity Documents
Employment ID Card
Birth Certificate
Driver’s License
International Passport
Tax Return
50%
32%
21%
12%
6%
15%
84%
74%
25%
18%
10%
7%
0%
10%
10%
7%
3%
1%
47%
40%
2%
3%
1%
2%
I d e n t i f i c a t i o n documents marked in green are currently accepted as formal identification by the CBN.
Bank
Interest
Loans
Savings Account
Pension
Cheque
ATM Card
Current Account
Insurance
Microfinance
Shares
Mortages
Credit Card
Non-interest (Islamic) Banking
84.6%
71.5%
69.9%
59.5%
55.1%
54.5
45.7%
44.1%
35.9%
35.5%
27.5%
17.6%
15.6%
6.4%
7.5%
10.5%
13.1%
12.9%
17.8%
15.7%
16.2%
18.5%
21.3%
19.8%
18.0%
17.1%
15.8%
9.8%
7.9%
18.0%
17.0%
27.6%
27.1%
29.8%
38.1%
37.4%
42.8%
44.7%
54.5%
65.3%
68.6%
83.8%
Has Heard and knowswhat it means
Has heard but doesn’tknow what it means
Has never Heard
35Figure 31 : Awareness and understanding of financial terms
34Figure 30 : Access to identification documents
33Central Bank of Nigeria: Know Your Customer Manual for Banks and other Financial Institutions in Nigeria (2003)34 EFInA Access to Financial Services in Nigeria 2010 Survey35 EFInA Access to Financial Services in Nigeria 2010 Survey
21
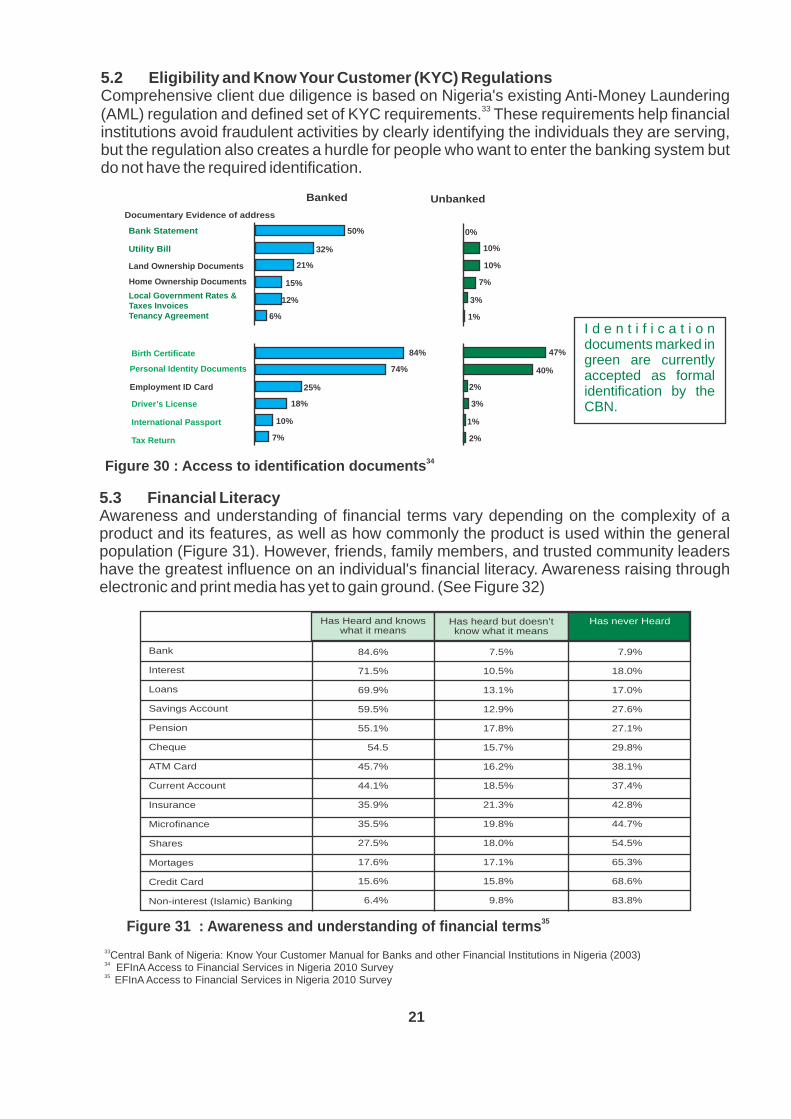
5.2 Eligibility and Know Your Customer (KYC) RegulationsComprehensive client due diligence is based on Nigeria's existing Anti-Money Laundering
33(AML) regulation and defined set of KYC requirements. These requirements help financial institutions avoid fraudulent activities by clearly identifying the individuals they are serving, but the regulation also creates a hurdle for people who want to enter the banking system but do not have the required identification.
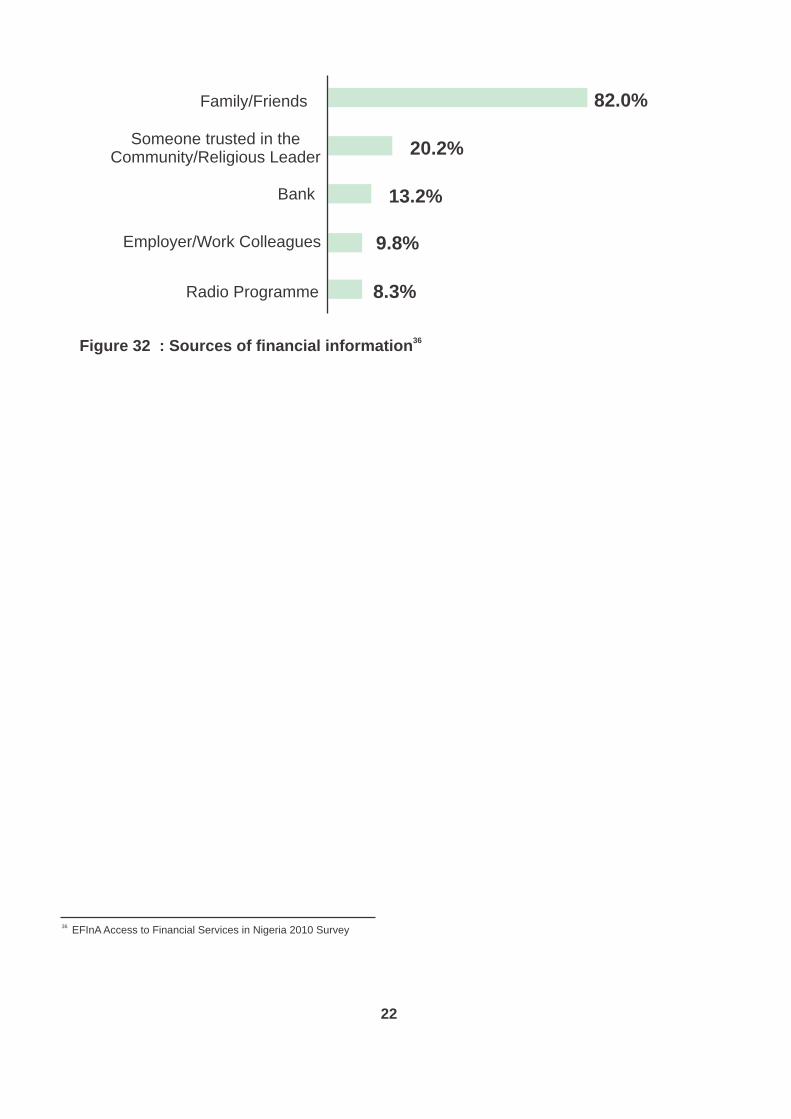
5.3 Financial Literacy Awareness and understanding of financial terms vary depending on the complexity of a product and its features, as well as how commonly the product is used within the general population (Figure 31). However, friends, family members, and trusted community leaders have the greatest influence on an individual's financial literacy. Awareness raising through electronic and print media has yet to gain ground. (See Figure 32)
Family/Friends
Someone trusted in the Community/Religious Leader
Bank
Employer/Work Colleagues
Radio Programme
82.0%
20.2%
13.2%
9.8%
8.3%
36 Figure 32 : Sources of financial information
36 EFInA Access to Financial Services in Nigeria 2010 Survey
22
23
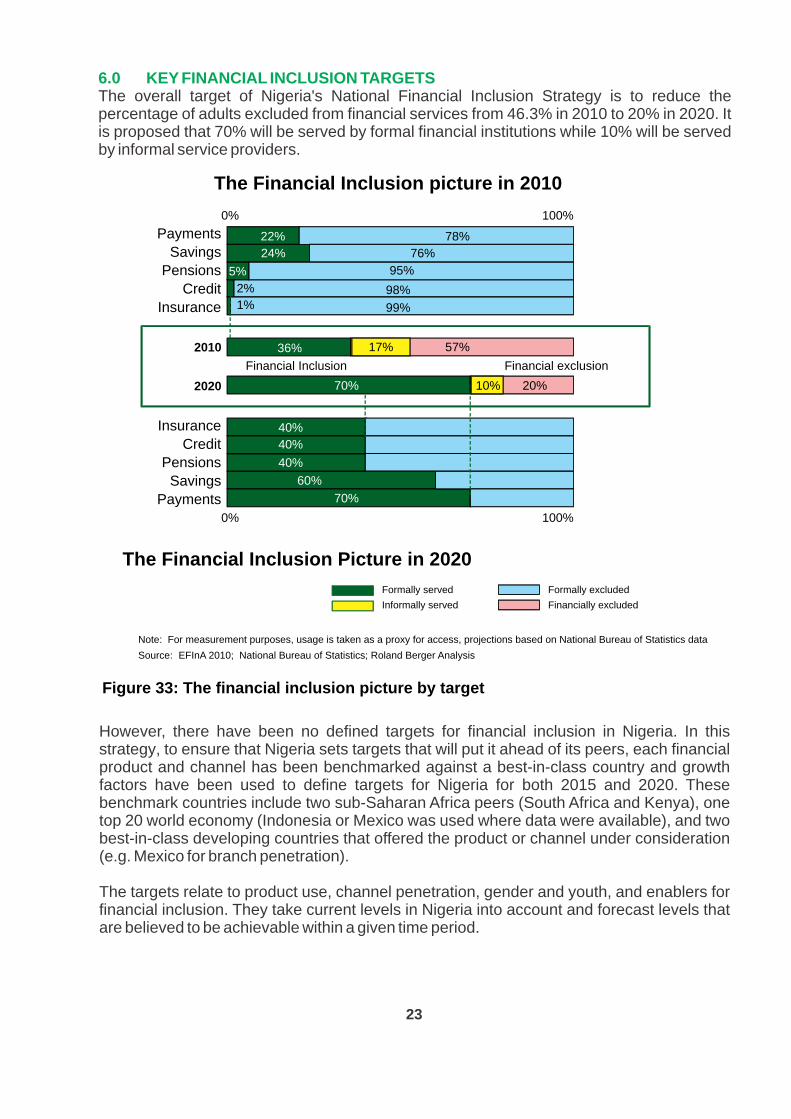
6.0 KEY FINANCIAL INCLUSION TARGETSThe overall target of Nigeria's National Financial Inclusion Strategy is to reduce the percentage of adults excluded from financial services from 46.3% in 2010 to 20% in 2020. It is proposed that 70% will be served by formal financial institutions while 10% will be served by informal service providers.
The Financial Inclusion picture in 2010 0%
100%
0% 100%
2010
2020
Financial Inclusion
Payments
Savings
Pensions
Credit
Insurance
Insurance
Credit
Pensions
Savings
Payments
22%
24%
98%
99%
40%
40%
60%
70%
76%
78%
2%
1%
The Financial Inclusion Picture in 2020
Source: EFInA 2010; National Bureau of Statistics; Roland Berger Analysis
Note: For measurement purposes, usage is taken as a proxy for access, projections based on National Bureau of Statistics data
40%
5%
95%
Formally excludedFormally served
36%
57%
17%
10%
20%70%
Financial exclusion
Informally served Financially excluded
Figure 33: The financial inclusion picture by target
However, there have been no defined targets for financial inclusion in Nigeria. In this strategy, to ensure that Nigeria sets targets that will put it ahead of its peers, each financial product and channel has been benchmarked against a best-in-class country and growth factors have been used to define targets for Nigeria for both 2015 and 2020. These benchmark countries include two sub-Saharan Africa peers (South Africa and Kenya), one top 20 world economy (Indonesia or Mexico was used where data were available), and two best-in-class developing countries that offered the product or channel under consideration (e.g. Mexico for branch penetration).
The targets relate to product use, channel penetration, gender and youth, and enablers for financial inclusion. They take current levels in Nigeria into account and forecast levels that are believed to be achievable within a given time period.
Status as of 2010 Current FSS 2020
target
None Specified 21.6% 70% Based on
improvement of best in class - South Africa at 59%
RationaleProposed target for 2020
Based on improvement of best in class - Kenya at
48%
60% None Specified 24.2%
Status as of 2010 Current FSS 2020target
RationaleProposed target for 2020
37 World Bank/CGAP38 World Bank/CGAP39 World Bank/CGAP
24
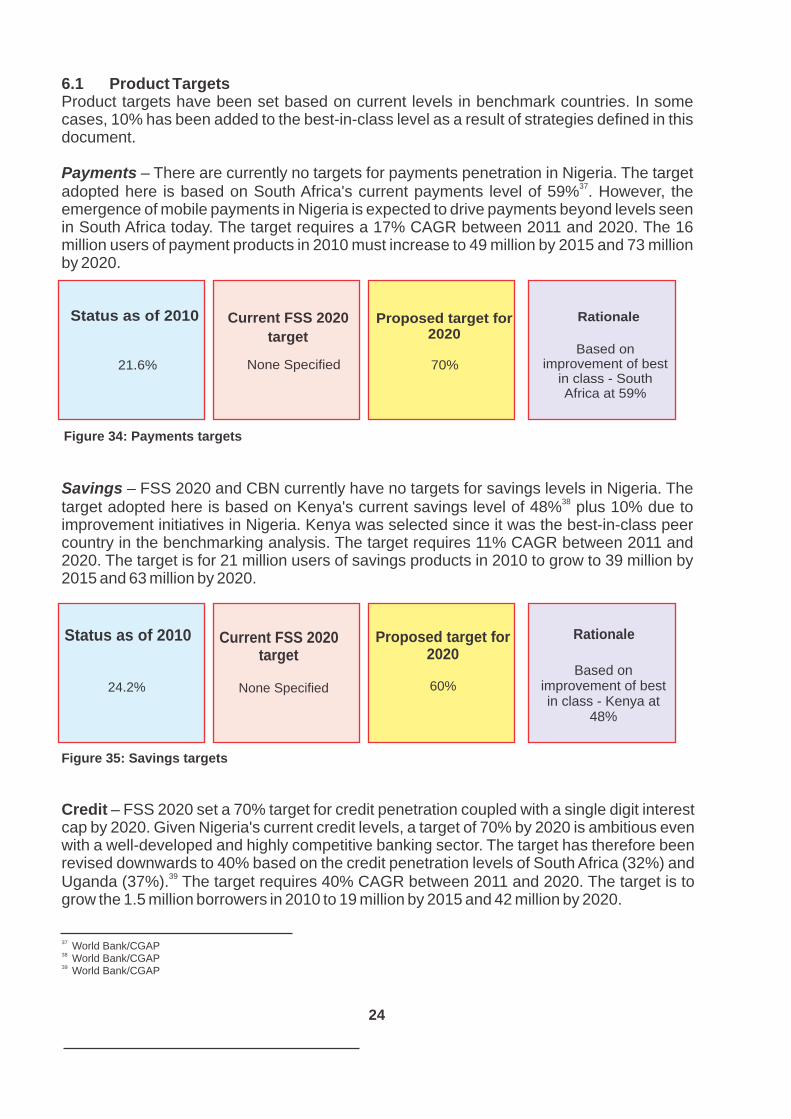
6.1 Product TargetsProduct targets have been set based on current levels in benchmark countries. In some cases, 10% has been added to the best-in-class level as a result of strategies defined in this document.
Payments – There are currently no targets for payments penetration in Nigeria. The target 37
adopted here is based on South Africa's current payments level of 59% . However, the emergence of mobile payments in Nigeria is expected to drive payments beyond levels seen in South Africa today. The target requires a 17% CAGR between 2011 and 2020. The 16 million users of payment products in 2010 must increase to 49 million by 2015 and 73 million by 2020.
Figure 34: Payments targets
Savings – FSS 2020 and CBN currently have no targets for savings levels in Nigeria. The 38
target adopted here is based on Kenya's current savings level of 48% plus 10% due to improvement initiatives in Nigeria. Kenya was selected since it was the best-in-class peer country in the benchmarking analysis. The target requires 11% CAGR between 2011 and 2020. The target is for 21 million users of savings products in 2010 to grow to 39 million by 2015 and 63 million by 2020.
Figure 35: Savings targets
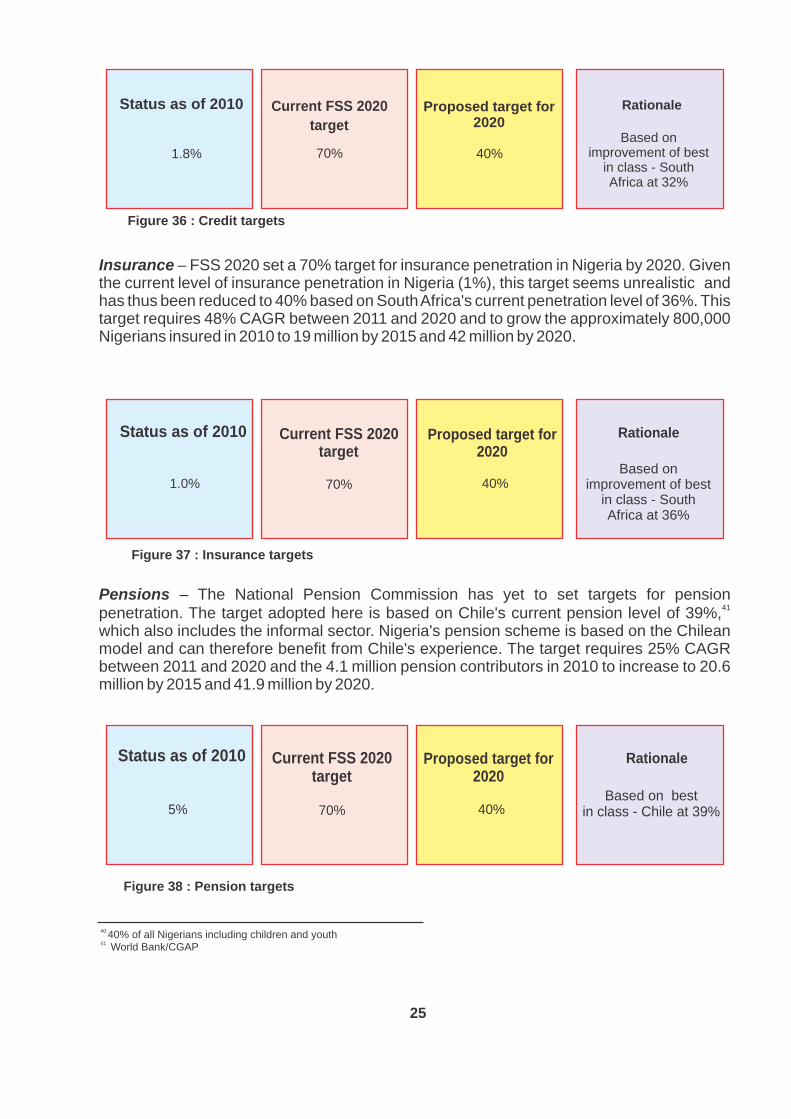
Credit – FSS 2020 set a 70% target for credit penetration coupled with a single digit interest cap by 2020. Given Nigeria's current credit levels, a target of 70% by 2020 is ambitious even with a well-developed and highly competitive banking sector. The target has therefore been revised downwards to 40% based on the credit penetration levels of South Africa (32%) and
39Uganda (37%). The target requires 40% CAGR between 2011 and 2020. The target is to grow the 1.5 million borrowers in 2010 to 19 million by 2015 and 42 million by 2020.
Status as of 2010 Current FSS 2020
target
70%1.8% 40% Based on
improvement of best in class - South Africa at 32%
RationaleProposed target for 2020
Based on improvement of best
in class - South Africa at 36%
40% 70%1.0%
Status as of 2010 Current FSS 2020target
RationaleProposed target for 2020
Based on best in class - Chile at 39%40% 70%5%
Status as of 2010 Current FSS 2020target
RationaleProposed target for 2020
Figure 38 : Pension targets
40 40% of all Nigerians including children and youth41 World Bank/CGAP
25
Figure 36 : Credit targets
Figure 37 : Insurance targets
Pensions – The National Pension Commission has yet to set targets for pension 41
penetration. The target adopted here is based on Chile's current pension level of 39%,which also includes the informal sector. Nigeria's pension scheme is based on the Chilean model and can therefore benefit from Chile's experience. The target requires 25% CAGR between 2011 and 2020 and the 4.1 million pension contributors in 2010 to increase to 20.6 million by 2015 and 41.9 million by 2020.
Insurance – FSS 2020 set a 70% target for insurance penetration in Nigeria by 2020. Given the current level of insurance penetration in Nigeria (1%), this target seems unrealistic and has thus been reduced to 40% based on South Africa's current penetration level of 36%. This target requires 48% CAGR between 2011 and 2020 and to grow the approximately 800,000 Nigerians insured in 2010 to 19 million by 2015 and 42 million by 2020.
Growth slowdown to 3.3% p.a from 5% p. a due to use of
non-branch channels
7.6 per 100,000adults
None Specified
Status as of 2011 Current CBN target RationaleProposed target for 2020
6.8 per 100,000adults
Based on best in class - Bolivia at 5.0 per 100,000 adults
None Specified
Status as of 2011 Current CBN target Rationale
5.0 per 100,000adults
Proposed target for 2020
2.9 per 100,000adults
Based on recent growth rate in
Nigeria at 33% p. a. (2007- 2011)
203.6 per 100,000adults
88.5 per 100,000adults in 2015
Status as of 2011 Current CBN target RationaleProposed target for 2020
11.8 per 100,000adults
Figure 41 : ATM targets
26
6.2 Channel targets
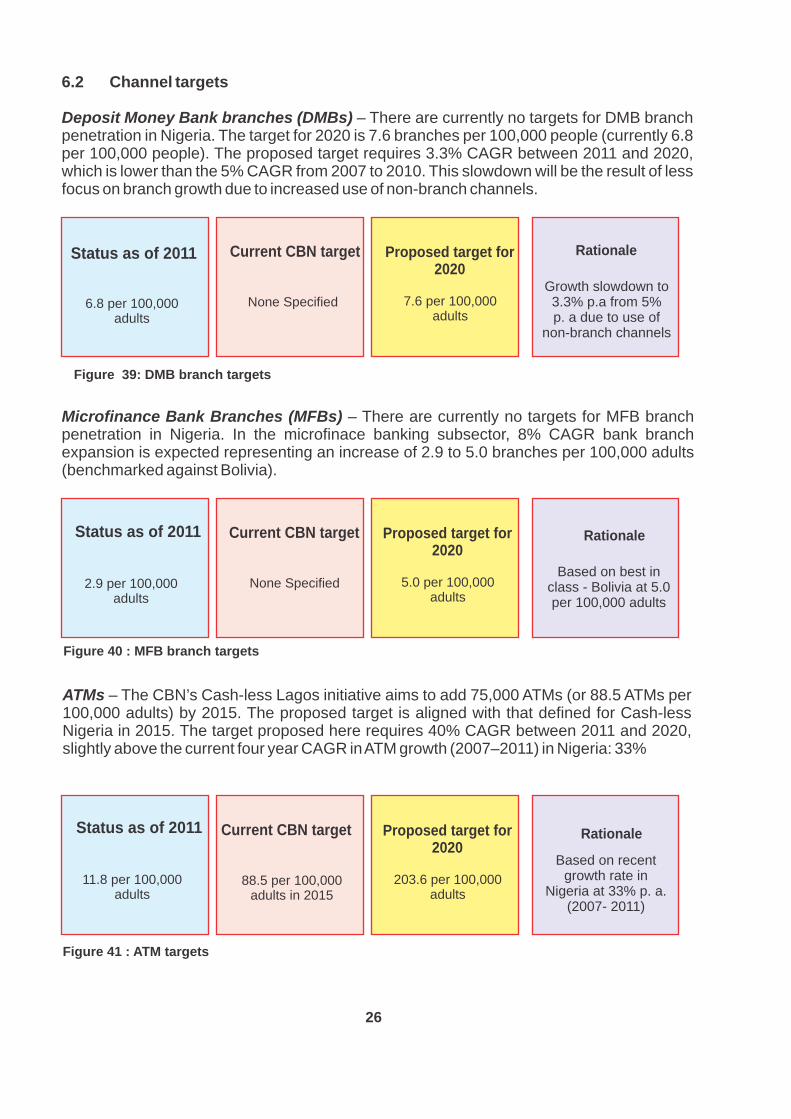
Deposit Money Bank branches (DMBs) – There are currently no targets for DMB branch penetration in Nigeria. The target for 2020 is 7.6 branches per 100,000 people (currently 6.8 per 100,000 people). The proposed target requires 3.3% CAGR between 2011 and 2020, which is lower than the 5% CAGR from 2007 to 2010. This slowdown will be the result of less focus on branch growth due to increased use of non-branch channels.
Figure 39: DMB branch targets
Microfinance Bank Branches (MFBs) – There are currently no targets for MFB branch penetration in Nigeria. In the microfinace banking subsector, 8% CAGR bank branch expansion is expected representing an increase of 2.9 to 5.0 branches per 100,000 adults (benchmarked against Bolivia).
Figure 40 : MFB branch targets
ATMs – The CBN’s Cash-less Lagos initiative aims to add 75,000 ATMs (or 88.5 ATMs per 100,000 adults) by 2015. The proposed target is aligned with that defined for Cash-less Nigeria in 2015. The target proposed here requires 40% CAGR between 2011 and 2020, slightly above the current four year CAGR in ATM growth (2007–2011) in Nigeria: 33%
Based on best in class - South Africaat 850 per 100,000
adults
850.0 per 100,000adults
442.6 per 100,000adults in 2015
Proposed CBN target for 2012
RationaleProposed target for 2020
13.3 per 100,000adults
Proposed CBN target for 2015
Based on Brazil (122per 100,000 capita) and south Africa (16per 100,000 capita)
62.0 per 100,000adults
None Specified
Status as of 2011 Current CBN target RationaleProposed target for 2020
0 per 100,000 adults
Figure 43 : Agent banking targets
27
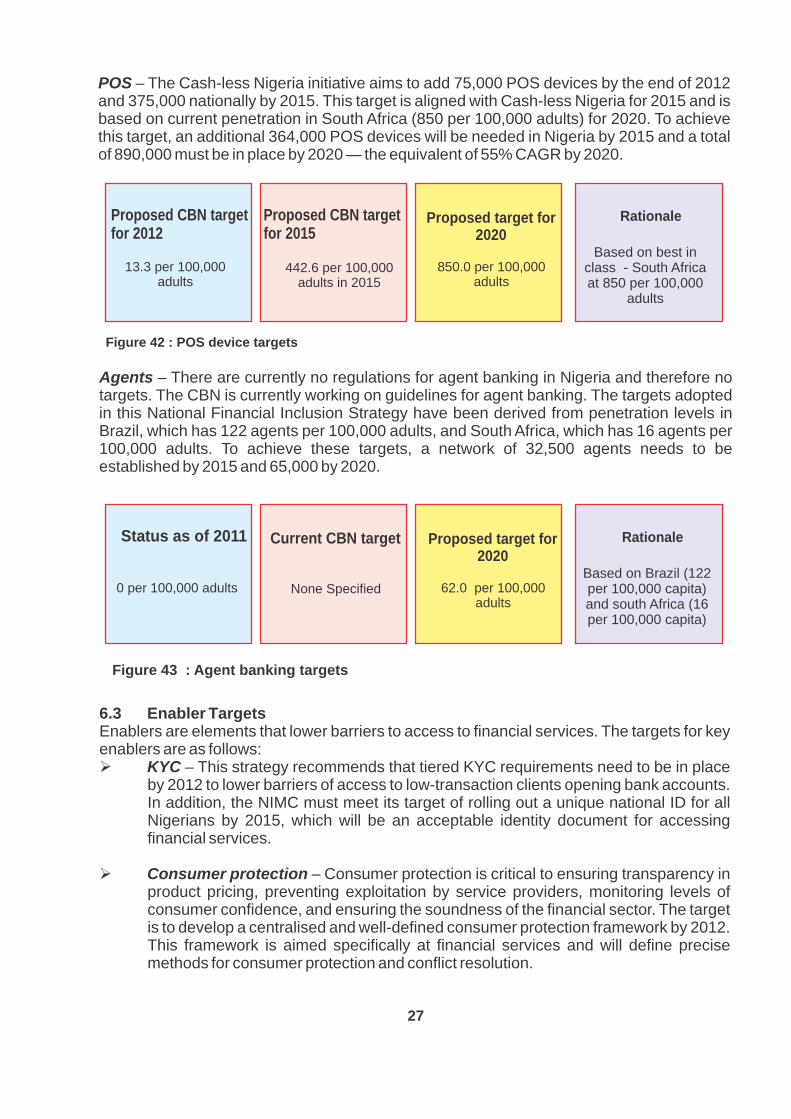
POS – The Cash-less Nigeria initiative aims to add 75,000 POS devices by the end of 2012 and 375,000 nationally by 2015. This target is aligned with Cash-less Nigeria for 2015 and is based on current penetration in South Africa (850 per 100,000 adults) for 2020. To achieve this target, an additional 364,000 POS devices will be needed in Nigeria by 2015 and a total of 890,000 must be in place by 2020 — the equivalent of 55% CAGR by 2020.
Figure 42 : POS device targets
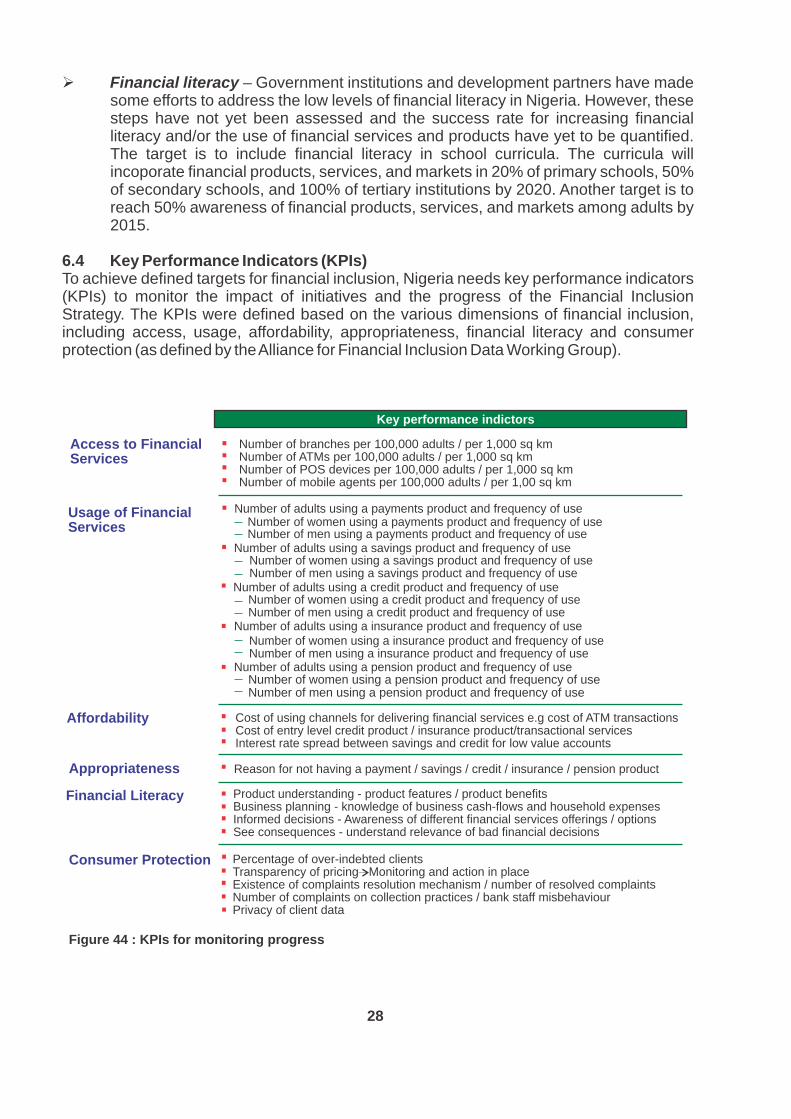
Agents – There are currently no regulations for agent banking in Nigeria and therefore no targets. The CBN is currently working on guidelines for agent banking. The targets adopted in this National Financial Inclusion Strategy have been derived from penetration levels in Brazil, which has 122 agents per 100,000 adults, and South Africa, which has 16 agents per 100,000 adults. To achieve these targets, a network of 32,500 agents needs to be established by 2015 and 65,000 by 2020.
6.3 Enabler Targets Enablers are elements that lower barriers to access to financial services. The targets for key enablers are as follows:Ø KYC – This strategy recommends that tiered KYC requirements need to be in place
by 2012 to lower barriers of access to low-transaction clients opening bank accounts. In addition, the NIMC must meet its target of rolling out a unique national ID for all Nigerians by 2015, which will be an acceptable identity document for accessing financial services.
Ø Consumer protection – Consumer protection is critical to ensuring transparency in product pricing, preventing exploitation by service providers, monitoring levels of consumer confidence, and ensuring the soundness of the financial sector. The target is to develop a centralised and well-defined consumer protection framework by 2012. This framework is aimed specifically at financial services and will define precise methods for consumer protection and conflict resolution.
Access to Financial Services
Key performance indictors
Number of branches per 100,000 adults / per 1,000 sq km Number of ATMs per 100,000 adults / per 1,000 sq km Number of POS devices per 100,000 adults / per 1,000 sq km Number of mobile agents per 100,000 adults / per 1,00 sq km
Number of adults using a payments product and frequency of use Number of women using a payments product and frequency of use Number of men using a payments product and frequency of use
Number of adults using a savings product and frequency of use Number of women using a savings product and frequency of use Number of men using a savings product and frequency of use
Number of adults using a insurance product and frequency of use
Cost of using channels for delivering financial services e.g cost of ATM transactions Cost of entry level credit product / insurance product/transactional services Interest rate spread between savings and credit for low value accounts
Number of adults using a pension product and frequency of use Number of women using a pension product and frequency of use Number of men using a pension product and frequency of use
Number of adults using a credit product and frequency of use Number of women using a credit product and frequency of use Number of men using a credit product and frequency of use
Number of women using a insurance product and frequency of use Number of men using a insurance product and frequency of use
Reason for not having a payment / savings / credit / insurance / pension product
Product understanding - product features / product benefitsBusiness planning - knowledge of business cash-flows and household expensesInformed decisions - Awareness of different financial services offerings / optionsSee consequences - understand relevance of bad financial decisions
Percentage of over-indebted clientsTransparency of pricing Monitoring and action in place Existence of complaints resolution mechanism / number of resolved complaints Number of complaints on collection practices / bank staff misbehaviourPrivacy of client data
Consumer Protection
Usage of Financial Services
Financial Literacy
Appropriateness
Affordability
Figure 44 : KPIs for monitoring progress
28
Ø Financial literacy – Government institutions and development partners have made some efforts to address the low levels of financial literacy in Nigeria. However, these steps have not yet been assessed and the success rate for increasing financial literacy and/or the use of financial services and products have yet to be quantified. The target is to include financial literacy in school curricula. The curricula will incoporate financial products, services, and markets in 20% of primary schools, 50% of secondary schools, and 100% of tertiary institutions by 2020. Another target is to reach 50% awareness of financial products, services, and markets among adults by 2015.
6.4 Key Performance Indicators (KPIs)To achieve defined targets for financial inclusion, Nigeria needs key performance indicators (KPIs) to monitor the impact of initiatives and the progress of the Financial Inclusion Strategy. The KPIs were defined based on the various dimensions of financial inclusion, including access, usage, affordability, appropriateness, financial literacy and consumer protection (as defined by the Alliance for Financial Inclusion Data Working Group).
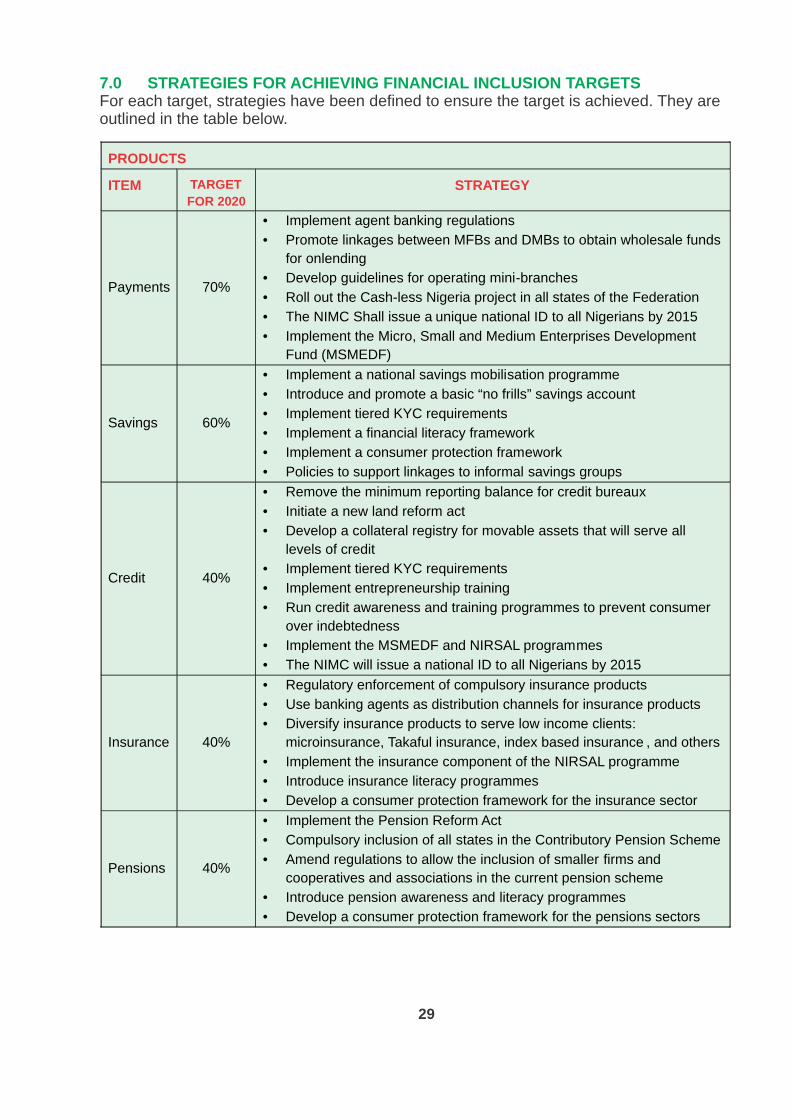
29
7.0 STRATEGIES FOR ACHIEVING FINANCIAL INCLUSION TARGETSFor each target, strategies have been defined to ensure the target is achieved. They are outlined in the table below.
PRODUCTS
ITEM TARGET FOR 2020
STRATEGY
Payments
70%
· Implement agent banking regulations · Promote linkages between MFBs and DMBs to obtain wholesale funds
for onlending ·
Develop
guidelines for operating mini-branches
· Roll
out the Cash-less Nigeria project in all states of the Federation
· The NIMC
Shall issue a unique national ID to all Nigerians by 2015
· Implement
the Micro,
Small and Medium Enterprises Development
Fund (MSMEDF)
Savings
60%
· Implement
a national savings mobilisation programme
· Introduce and promote a basic “no frills” savings account
· Implement
tiered KYC requirements
· Implement
a financial literacy framework
·
Implement
a consumer protection framework
·
Policies to support linkages to informal savings groups
Credit
40%
·
Remove the minimum reporting
balance for credit bureaux
·
Initiate a new land reform
act
·
Develop
a collateral registry for movable assets that will serve all
levels
of credit
·
Implement
tiered KYC requirements
·
Implement
entrepreneurship training
·
Run credit awareness and training programmes to prevent consumer
over indebtedness
·
Implement
the MSMEDF
and NIRSAL programmes
·
The
NIMC
will issue
a national ID to all Nigerians by 2015
Insurance 40%
· Regulatory enforcement of compulsory insurance products
· Use banking agents as distribution channels for insurance products
· Diversify insurance products to serve low income clients:
microinsurance, Takaful insurance, index based insurance , and others
· Implement the insurance component of the NIRSAL programme
· Introduce insurance literacy programmes
· Develop a consumer protection framework for the insurance sector
Pensions 40%
· Implement the Pension Reform Act
· Compulsory inclusion of all states in the Contributory Pension Scheme
· Amend regulations to allow the inclusion of smaller firms and
cooperatives and associations in the current pension scheme
· Introduce pension awareness and literacy programmes
· Develop a consumer protection framework for the pensions sectors
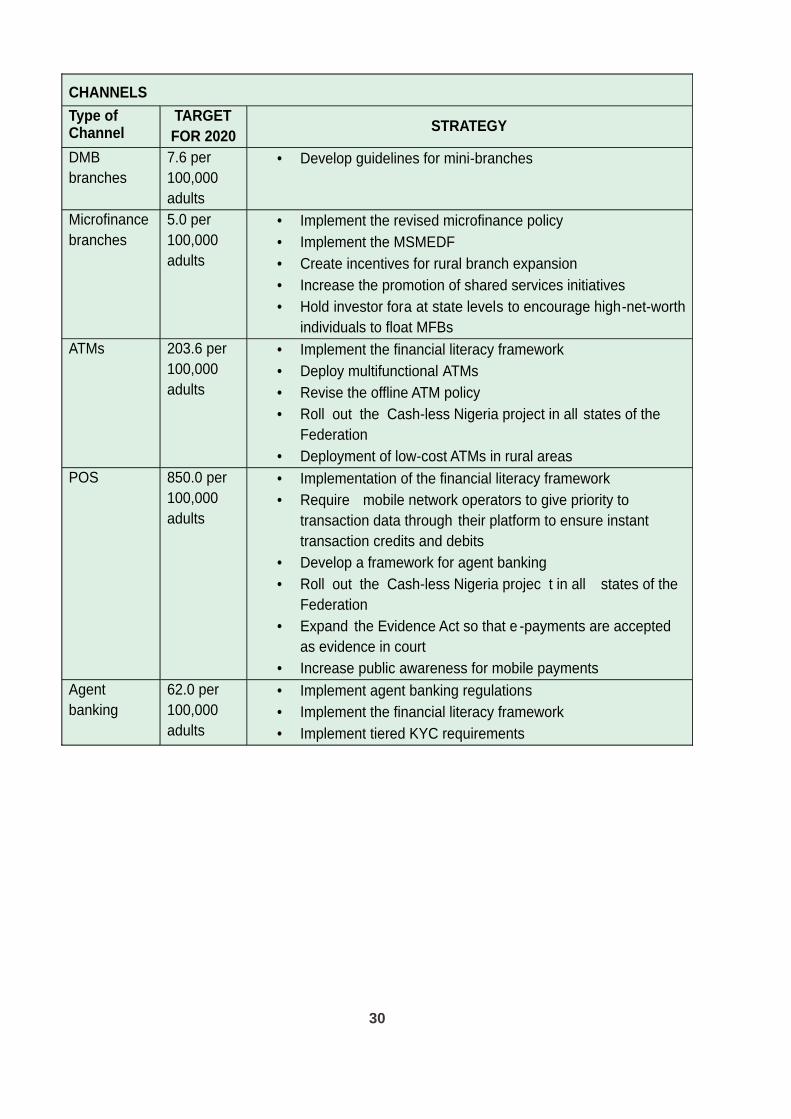
30
CHANNELS
Type of Channel
TARGET
FOR 2020 STRATEGY
DMB
branches 7.6 per
100,000
adults
· Develop guidelines for mini-branches
Microfinance
branches 5.0 per
100,000
adults
· Implement the revised microfinance policy
· Implement the MSMEDF
· Create incentives for rural branch expansion
· Increase
the
promotion of shared services initiatives
· Hold
investor fora
at state levels
to encourage high-net-worth
individuals to float MFBs
ATMs
203.6 per
100,000
adults
· Implement
the financial literacy framework
· Deploy
multifunctional ATMs
· Revise the offline ATM policy
· Roll
out the Cash-less Nigeria project in all states of the
Federation
· Deployment of low-cost ATMs in rural areas
POS
850.0 per
100,000
adults
· Implementation of the financial literacy framework
· Require
mobile network operators to give priority to
transaction data through their platform to ensure instant
transaction
credits and debits
·
Develop
a framework for agent banking
·
Roll
out the
Cash-less Nigeria projec t in all states of the
Federation
·
Expand the Evidence Act so that e -payments are accepted
as evidence in court
·
Increase public awareness for mobile payments
Agent
banking
62.0
per
100,000
adults
·
Implement
agent banking regulations
·
Implement
the financial literacy framework
·
Implement
tiered KYC requirements
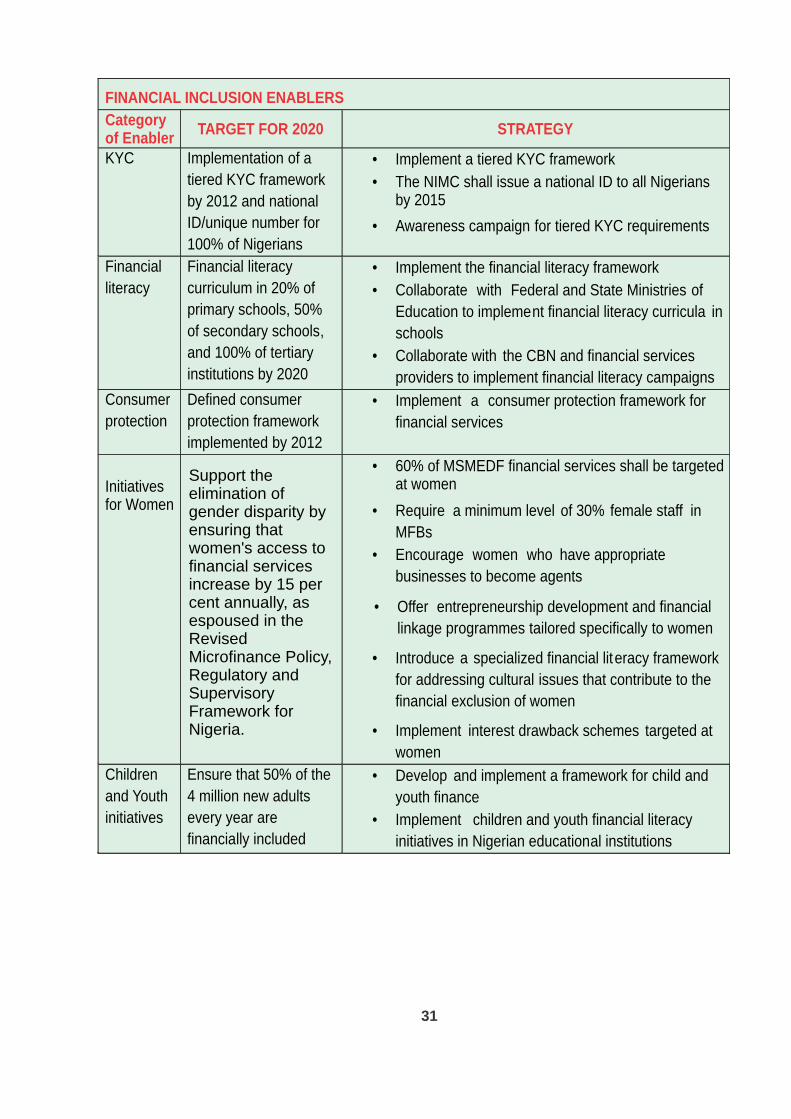
31
FINANCIAL INCLUSION ENABLERS
Category of Enabler
TARGET FOR 2020 STRATEGY
KYC
Implementation of a
tiered KYC framework
by 2012 and national
ID/unique number for
100% of Nigerians
· Implement
a tiered KYC framework
· The NIMC shall issue a national ID to all Nigerians by 2015
· Awareness campaign for
tiered KYC requirements
Financial
literacy Financial literacy
curriculum in 20% of
primary schools, 50%
of secondary schools,
and 100% of tertiary
institutions by 2020
· Implement
the financial literacy framework
·
Collaborate with Federal and State Ministries
of
Education to implement financial literacy curricula in
schools
·
Collaborate with the CBN and financial services
providers to implement financial literacy campaigns
Consumer
protection
Defined consumer
protection framework
implemented
by 2012
·
Implement
a
consumer protection framework for
financial services
Initiativesfor Women
·
60% of MSMEDF financial services shall be targeted at women
·
Require
a minimum level of 30% female staff in
MFBs
·
Encourage women who have appropriate
businesses
to become agents
·
Offer
entrepreneurship development and financial
linkage programmes
tailored specifically to women
·
Introduce a specialized financial literacy framework
for addressing cultural issues that contribute to the
financial exclusion of women
·
Implement
interest drawback schemes targeted at
women
Children
and Youth
initiatives
Ensure that 50% of the
4 million new adults
every year
are
financially included
·
Develop
and implement
a framework for child and
youth finance
· Implement children and youth financial literacy
initiatives in Nigerian educational institutions
Support the elimination of gender disparity by ensuring that women's access to financial services increase by 15 per cent annually, as espoused in the Revised Microfinance Policy, Regulatory and Supervisory Framework for Nigeria.
32
8.0 PROPOSED ROLES AND RESPONSIBILITIES FOR KEY STAKEHOLDERS
Ø Federal governmentInvest in infrastructure, such as a fibre optic network for the telecommunications sector and solar panels to generate cheap electricity for rural areasContribute to the MSMEDFMaintain adequate security in the country, and for bank branches and agentsUndertake necessary reforms (e.g. collateral reforms, consumer protection act)Set aside part of the national budget for social pensions and a minimum guaranteed pensionInstitutionalise a data protection act and a new land reform act
Ø Central Bank of Nigeria (CBN)Implement an agent banking frameworkDefine and implement a tiered KYC frameworkCommission pilots to demonstrate the business case for financial inclusion initiatives, for example, tiered KYC, no-frills accounts, agent banking, and mini-branchesEducate stakeholders on regulatory changesPromote shared services initiatives to reduce channel costsIncentivise providers to deploy ATMs and POS in rural communitiesCreate incentives for MFBs to focus on serving rural communitiesIncrease funding available to MSME businesses through the MFB sectorExpand financial literacy programmes and activities (including in local languages) that raise awareness about the availability and benefits of productsEstablish automated financial reporting for MFBsPromote the child and youth finance frameworkEnforce the deadline for terminal interoperabilityPropose expansion of the Evidence Act to make e-payments acceptable as evidence in courtReview the framework for off-site ATMs to better align with Financial Inclusion initiatives.
Ø Deposit Money Banks (DMBs)Participate in shared service initiatives to reduce channel costsLeverage (multifunctional) ATM and POS channels to expand reach and reduce costsImplement mini-branch models for low-cost service in rural areasEstablish linkages for wholesale lending to MFBsImplement the agent banking model to extend outreachImplement a no-frills (zero balance) accountImplement the tiered KYC frameworkLeverage cash management initiatives e.g Cash-less Lagos to reduce transaction costsRevise channel delivery costs to incentivise correct merchant behaviour
Ø Development Finance Institutions (DFIs)Provide wholesale funding for lending to low-income clientsProvide capacity building to MSMEs to improve their financial literacy and credit worthinessImplement targeted financial inclusion programmes, e.g. credit guarantees, refinancing
33
Ø Bankers' CommitteeMonitor the implementation of financial inclusion in relation to Deposit Money Bank roles and responsibilitiesContribute to the review process of the Strategy document
Ø Microfinance Banks (MFBs)Develop innovative products for serving low-income rural residents Participate in shared service initiatives to reduce channel costsLeverage (multifunctional) ATM and POS channels to expand reach and reduce costsImplement the agent banking model to extend outreachImplement a no-frills (zero balance) accountImplement the tiered KYC frameworkTake advantage of the social and commercial components of the MSMEDF Focus on profitably delivering financial services to the poor and informal segments, to prevent mission drift
Ø Committee of Microfinance Banks in Nigeria (COMBIN)Monitor the implementation of financial inclusion in relation to microfinance banksContribute to the review process of the Strategy document
Ø National Insurance Commission (NAICOM)Define and implement insurance literacy programmesEnforce quick settlement of claims and sanctions for infractionsEnforce compulsory insurance productsIncentivise insurance companies to develop microinsurance products, Islamic insurance (Takaful), and index-based insurance products to serve low-income/rural individualsLeverage ongoing work by NIMC to identify individuals and strengthen the integrity of insurance systemsDefine initiatives for insurance agents to increase outreach in rural areas
Ø Insurance companiesExpand the current portfolio of insurance products to better address consumer needs, for example, microinsurance, Islamic insurance (Takaful), and index-based insuranceIncrease the focus on outreach and specific sectors, e.g. lower-income segmentsProcess and pay claims in a timely manner
Ø National Pension Commision (PenCom)Expand and communicate consumer protection initiativesExpand pension literacy programmes and activities to raise awareness of the availability and benefits of pension productsCreate a pension framework for the informal sectorAdvocate for the compulsory inclusion of all states of the Federation in the current pension schemeAmend regulations to allow the inclusion of smaller firms (those with less than five employees) and cooperatives/associations in the current pension scheme
42Unstructured Supplementary Service Data: Protocol that allows mobile payments though SMS
34
Ø Pension Fund Administrators (PFAs)Leverage technology and expand collection and disbursement methods, e.g. e-channel paymentsEngage cooperatives and associations in order to learn best methods for serving low-income clients
Ø National Communication Commission (NCCs)Define a plan for the Federal Government to invest in fibre optic cables for mobile network operatorsMandate dedicated bandwidth for data services to give priority to payments and other e-channels as a temporary measure to drive mobile paymentsInstitute and publish statistics on network downtime to incentivise operators to keep the network active
Ø Mobile payments operators (MPOs)Implement the mobile payments frameworkProvide innovative mobile payments products to increase outreachIncrease investment in infrastructure for the telecommunications sector, e.g. a dedicated percentage of earnings to go to infrastructure and investment in
42USSD to facilitate the inclusion of low-income people
Ø Nigeria Postal Service (NIPOST)Act as an agent for DMBs, MFBs, and/or mobile services providersAct as distribution centres for financial literacy materials
Ø Ministry of EducationInstitutionalise financial literacy programmes within educational institutions through agencies such as the National Universities Commission and Universal Basic Education CommissionDevelop and implement curriculum for financial literacy in primary and secondary schools as well as tertiary institutions
Ø National Bureau of StatisticsConduct surveys and provide data on financial inclusion
Ø Development partnersProvide technical and financial assistance to the implementation of the Financial Inclusion StrategyMonitor the implementation of the Financial Inclusion StrategyFacilitate peer learning on financial inclusionProvide a knowledge base for financial inclusion
Ø Financial Services Regulation Coordination (FSRCC)Coordinate initiatives across various regulatory bodiesGive strategic direction on the implementation of the StrategySecure buy-in from government at the highest levelsApprove the review of targets for reporting and monitoring Take full responsibility for the implementation of the StrategyApprove the publication of an annual report on financial inclusion
35
Ø Financial Inclusion Secretariat (Unit or Divisional level)Coordinate stakeholder activities aimed at increasing financial inclusionReview and revise the roles and responsibilities of stakeholders, as requiredEnsure that annual reports on the progress on financial inclusion are publishedLiaise with and ensure that all financial inclusion stakeholders perform their roles and responsibilitiesEnsure that appropriate arrangements are made for financial inclusion data gathering and publicationMaintain a database of financial inclusion in Nigeria as well as global trends in financial inclusionInitiate necessary reviews on the Financial Inclusion Strategy and support evidence-based policy makingTrack and monitor progress on financial inclusion vis-à-vis the targets set for measuring financial inclusionAddress capacity building initiatives on financial inclusion issues
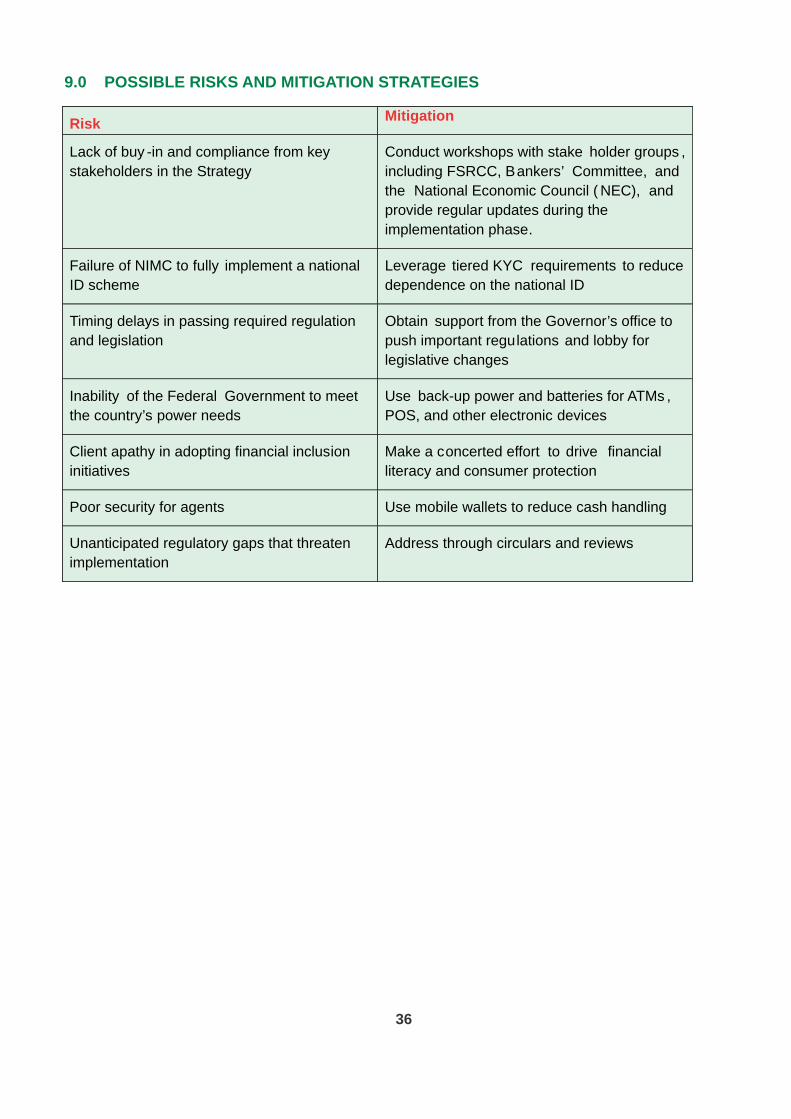
36
9.0 POSSIBLE RISKS AND MITIGATION STRATEGIES
Risk Mitigation
Lack of buy -in and compliance from key
stakeholders in the Strategy
Conduct workshops with stake holder groups ,
including FSRCC, Bankers’ Committee, and
the National Economic Council ( NEC), and
provide regular updates during the
implementation phase.
Failure of NIMC to fully implement a national
ID scheme
Leverage tiered KYC requirements to reduce
dependence on the national ID
Timing delays in passing required regulation
and legislation
Obtain support from the Governor’s office to
push important regulations and lobby for
legislative changes
Inability of the Federal Government to meet
the country’s power needs
Use back-up power and batteries for ATMs ,
POS, and other electronic devices
Client apathy in adopting financial inclusion
initiatives
Make a concerted effort to drive financial
literacy and consumer protection
Poor security for agents Use mobile wallets to reduce cash handling
Unanticipated regulatory gaps that threaten
implementation
Address through circulars and reviews
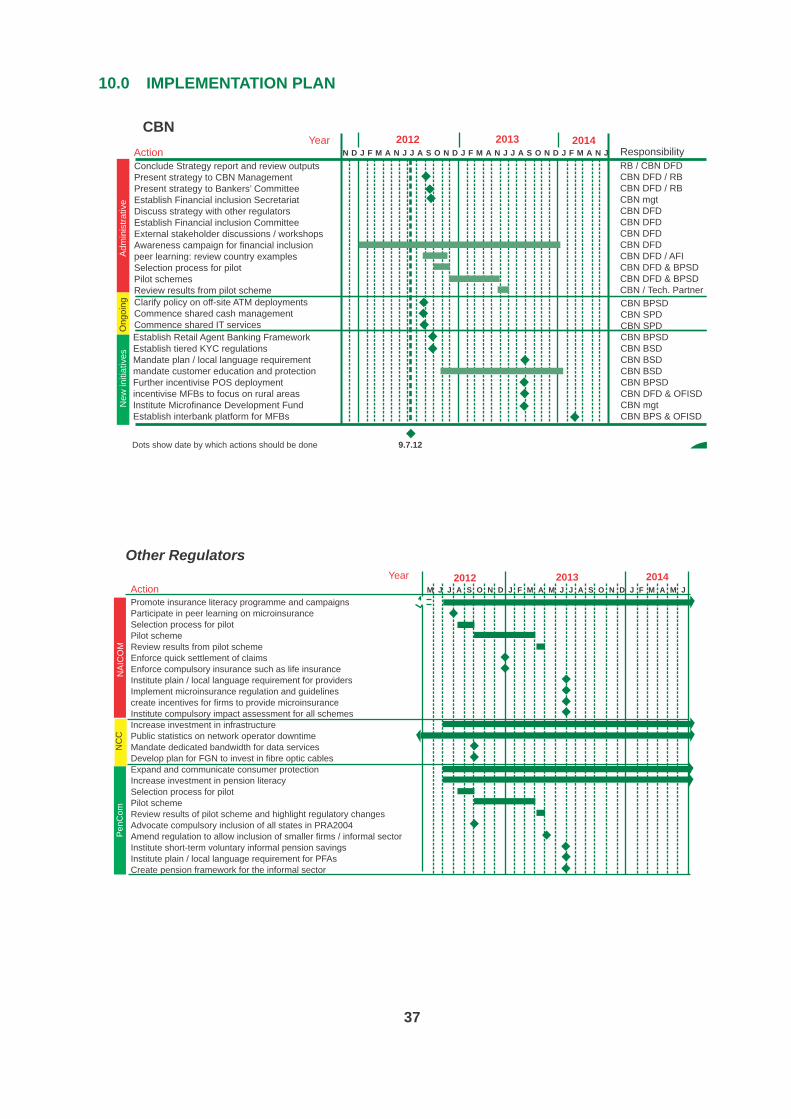
10.0 IMPLEMENTATION PLAN
Year 2012 2013 2014Action Conclude Strategy report and review outputs Present strategy to CBN ManagementPresent strategy to Bankers’ Committee Establish Financial inclusion Secretariat Discuss strategy with other regulatorsEstablish Financial inclusion Committee External stakeholder discussions / workshopsAwareness campaign for financial inclusion peer learning: review country examples Selection process for pilot Pilot schemes Review results from pilot scheme
Establish Retail Agent Banking Framework Establish tiered KYC regulationsMandate plan / local language requirementmandate customer education and protection Further incentivise POS deployment incentivise MFBs to focus on rural areas Institute Microfinance Development FundEstablish interbank platform for MFBs
Clarify policy on off-site ATM deployments Commence shared cash management Commence shared IT services
Dots show date by which actions should be done 9.7.12
N D J F M A N J J A S O N D J F M A N J J A S O N D J F M A N J Responsibility
RB / CBN DFDCBN DFD / RBCBN DFD / RBCBN mgt CBN DFDCBN DFDCBN DFDCBN DFDCBN DFD / AFICBN DFD & BPSDCBN DFD & BPSDCBN / Tech. Partner
CBN BPSDCBN SPDCBN SPDCBN BPSDCBN BSDCBN BSDCBN BSDCBN BPSDCBN DFD & OFISDCBN mgtCBN BPS & OFISD
Ne
w in
itia
tive
s O
ng
oin
g
Ad
min
istr
ative
CBN
NC
CP
enC
om
N
AIC
OM
Promote insurance literacy programme and campaigns Participate in peer learning on microinsurance Selection process for pilot Pilot schemeReview results from pilot schemeEnforce quick settlement of claims Enforce compulsory insurance such as life insurance Institute plain / local language requirement for providers Implement microinsurance regulation and guidelines create incentives for firms to provide microinsurance Institute compulsory impact assessment for all schemesIncrease investment in infrastructure Public statistics on network operator downtime Mandate dedicated bandwidth for data services Develop plan for FGN to invest in fibre optic cables Expand and communicate consumer protection Increase investment in pension literacy Selection process for pilot Pilot scheme Review results of pilot scheme and highlight regulatory changes Advocate compulsory inclusion of all states in PRA2004 Amend regulation to allow inclusion of smaller firms / informal sector Institute short-term voluntary informal pension savings Institute plain / local language requirement for PFAsCreate pension framework for the informal sector
Year 2012 2013 2014Action M J J A S O N D J F M A M J J A S O N D J F M A M J
Other Regulators
37
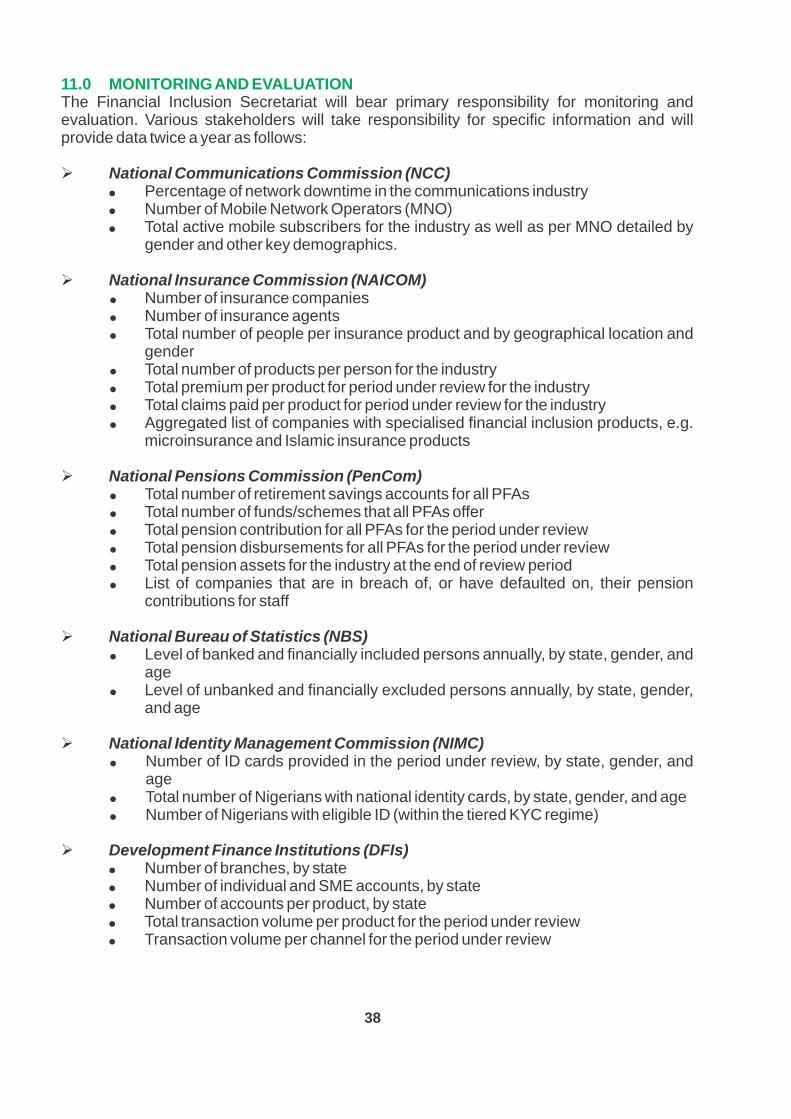
38
11.0 MONITORING AND EVALUATIONThe Financial Inclusion Secretariat will bear primary responsibility for monitoring and evaluation. Various stakeholders will take responsibility for specific information and will provide data twice a year as follows:
Ø National Communications Commission (NCC)Percentage of network downtime in the communications industryNumber of Mobile Network Operators (MNO)Total active mobile subscribers for the industry as well as per MNO detailed by gender and other key demographics.
Ø National Insurance Commission (NAICOM)Number of insurance companiesNumber of insurance agentsTotal number of people per insurance product and by geographical location and genderTotal number of products per person for the industryTotal premium per product for period under review for the industryTotal claims paid per product for period under review for the industryAggregated list of companies with specialised financial inclusion products, e.g. microinsurance and Islamic insurance products
Ø National Pensions Commission (PenCom)Total number of retirement savings accounts for all PFAs Total number of funds/schemes that all PFAs offerTotal pension contribution for all PFAs for the period under reviewTotal pension disbursements for all PFAs for the period under reviewTotal pension assets for the industry at the end of review periodList of companies that are in breach of, or have defaulted on, their pension contributions for staff
Ø National Bureau of Statistics (NBS)Level of banked and financially included persons annually, by state, gender, and ageLevel of unbanked and financially excluded persons annually, by state, gender, and age
Ø National Identity Management Commission (NIMC)Number of ID cards provided in the period under review, by state, gender, and ageTotal number of Nigerians with national identity cards, by state, gender, and ageNumber of Nigerians with eligible ID (within the tiered KYC regime)
Ø Development Finance Institutions (DFIs)Number of branches, by state Number of individual and SME accounts, by stateNumber of accounts per product, by stateTotal transaction volume per product for the period under reviewTransaction volume per channel for the period under review
39
Number of transactions per channel, by transaction type (e.g. withdrawal, deposit, transfer)Amounts outstanding on loans
Ø Nigerian Postal Service (NIPOST)Complete list of NIPOST's financial services activities Additional information regarding the size of financial service activities and numbers of financial service beneficiaries/clients served by NIPOSTNIPOST's financial services partnerships
Ø National Planning CommissionList of all funds committed to developing the financial services sector within the review period, including size of funds, amounts disbursed, and means of disbursementList of all capacity building initiatives embarked on, including number of participants and the impact of each initiative
Ø CBN – Development Finance DepartmentValue and number of disbursement of each fund or scheme that is active at DFD, by state, gender, and ageValue and number of disbursement of each fund or initiative of other government institutions, by state, gender, and ageDevelopment partner funding and grants for financial inclusion initiativesNumber of informal microfinance institutions and number of clients by state, gender, and age
Ø CBN – Banking Supervision DepartmentTotal number of branches, including full scale and mini-branches (i.e. fewer than five staff members)Number of branches, grouped by banking institution and broken down into states, LGAs, etc.Number of new licenses issued to Deposit Money Banks Number of banking agents, by stateNumber of clients using products (savings, credit, payments) by state, gender, and ageNumber of accounts for each product: savings, credit, paymentsAvailable product types per bank and amounts committed for savings, credit, paymentsLoan exposure by size from credit bureaux
Ø CBN – Other Financial Institutions Supervision DepartmentDFIs' intervention funds and the number of beneficiaries of eachNumber of MFB branches broken down by state, local government area, and municipality Total number of customers served by microfinance banks by state, gender, and ageTotal amount per product category at MFBs for savings, credit, and paymentsNumber of new licenses issued to MFBs
40
Ø CBN – Banking and Payments System Department
Total number of m-payments agents and broken down by state, local government area, and municipality Total number of ATMs and POS and broken down by state, local government area, and municipalityTotal value of m-payment transactions for the industryTotal volume of m-payment transactions for the industry Number of m-payments operators licensedList and size of financial services activities handled by NIPOST
Ø CBN – Consumer and Financial Protection DepartmentLevel of financial literacy nationwide and by state, gender, and ageNumber of complaints received and number resolved per financial services provider
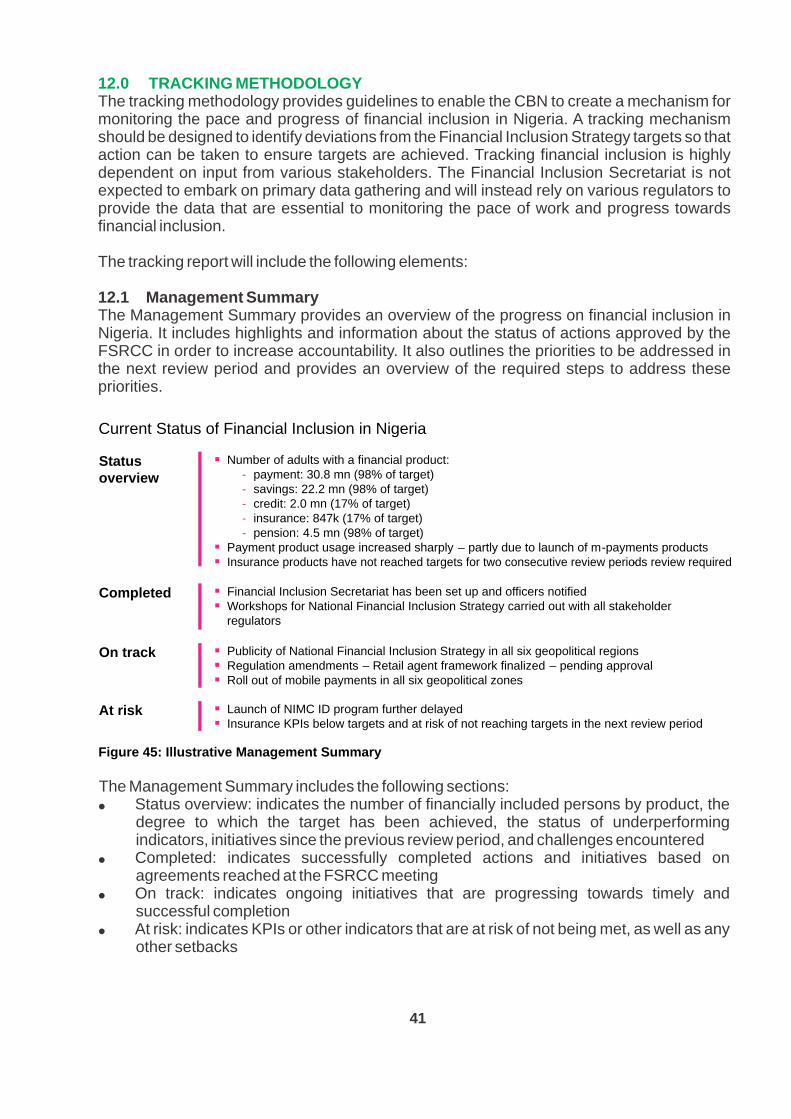
41
12.0 TRACKING METHODOLOGYThe tracking methodology provides guidelines to enable the CBN to create a mechanism for monitoring the pace and progress of financial inclusion in Nigeria. A tracking mechanism should be designed to identify deviations from the Financial Inclusion Strategy targets so that action can be taken to ensure targets are achieved. Tracking financial inclusion is highly dependent on input from various stakeholders. The Financial Inclusion Secretariat is not expected to embark on primary data gathering and will instead rely on various regulators to provide the data that are essential to monitoring the pace of work and progress towards financial inclusion.
The tracking report will include the following elements:
12.1 Management SummaryThe Management Summary provides an overview of the progress on financial inclusion in Nigeria. It includes highlights and information about the status of actions approved by the FSRCC in order to increase accountability. It also outlines the priorities to be addressed in the next review period and provides an overview of the required steps to address these priorities.
§Number of adults with a financial product:- payment: 30.8 mn (98% of target)- savings: 22.2 mn (98% of target)- credit: 2.0 mn (17% of target)
- insurance: 847k (17% of target)- pension: 4.5 mn (98% of target)
§Payment product usage increased sharply – partly due to launch of m-payments products§ Insurance products have not reached targets for two consecutive review periods review required-
Status overview
§Financial Inclusion Secretariat has been set up and officers notified§Workshops for National Financial Inclusion Strategy carried out with all stakeholder
regulators
Completed
§Publicity of National Financial Inclusion Strategy in all six geopolitical regions§Regulation amendments – Retail agent framework finalized – pending approval§Roll out of mobile payments in all six geopolitical zones
On track
§Launch of NIMC ID program further delayed§ Insurance KPIs below targets and at risk of not reaching targets in the next review period
At risk
Current Status of Financial Inclusion in Nigeria
Figure 45: Illustrative Management Summary
The Management Summary includes the following sections:Status overview: indicates the number of financially included persons by product, the degree to which the target has been achieved, the status of underperforming indicators, initiatives since the previous review period, and challenges encounteredCompleted: indicates successfully completed actions and initiatives based on agreements reached at the FSRCC meetingOn track: indicates ongoing initiatives that are progressing towards timely and successful completionAt risk: indicates KPIs or other indicators that are at risk of not being met, as well as any other setbacks
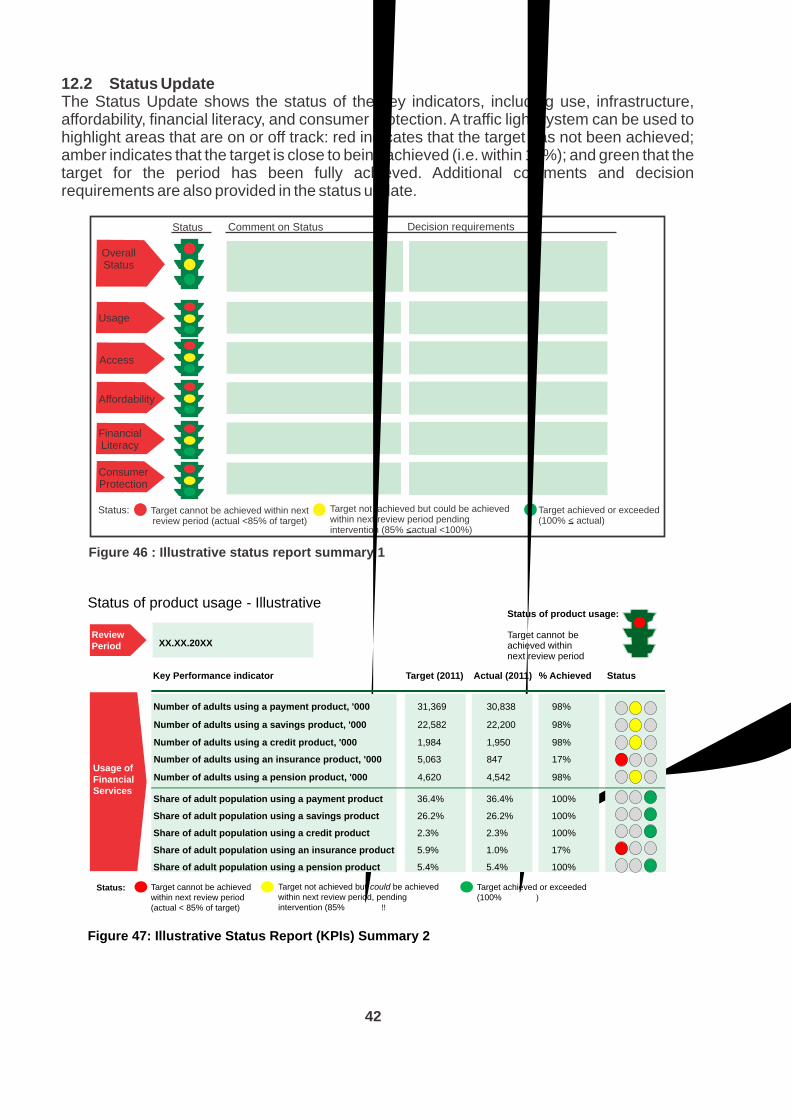
Overall Status
Usage
Access
Affordability
Financial Literacy
ConsumerProtection
Status:
Status Comment on Status Decision requirements
Target cannot be achieved within next review period (actual <85% of target)
Target not achieved but could be achieved within next review period pending intervention (85% <actual <100%)
Target achieved or exceeded (100% < actual)
Figure 46 : Illustrative status report summary 1
42
12.2 Status Update The Status Update shows the status of the key indicators, including use, infrastructure, affordability, financial literacy, and consumer protection. A traffic light system can be used to highlight areas that are on or off track: red indicates that the target has not been achieved; amber indicates that the target is close to being achieved (i.e. within 10%); and green that the target for the period has been fully achieved. Additional comments and decision requirements are also provided in the status update.
Status: Target cannot be achieved within next review period (actual < 85% of target)
Target achieved or exceeded(100%≤actual)
Target not achieved but could be achieved within next review period, pending intervention (85% ≤actual <100%)
Status of product usage - Illustrative
XX.XX.20XX
Review
Period
Status of product usage:
Target cannot be achieved within next review period
Usage of
Financial
Services
Key Performance indicator
% AchievedActual (2011)Target (2011) Status
Share of adult population using a payment product 36.4%36.4% 100%
Share of adult population using a savings product 26.2%26.2% 100%
Share of adult population using a credit product 2.3%2.3% 100%
Share of adult population using an insurance product 1.0%5.9% 17%
Share of adult population using a pension product 5.4%5.4% 100%
Number of adults using a payment product, '000
98%30,83831,369
Number of adults using a credit product, '000
98%1,9501,984
Number of adults using a pension product, '000
98%4,5424,620
Number of adults using a savings product, '000
22,20022,582 98%
Number of adults using an insurance product, '000
8475,063 17%
Figure 47: Illustrative Status Report (KPIs) Summary 2
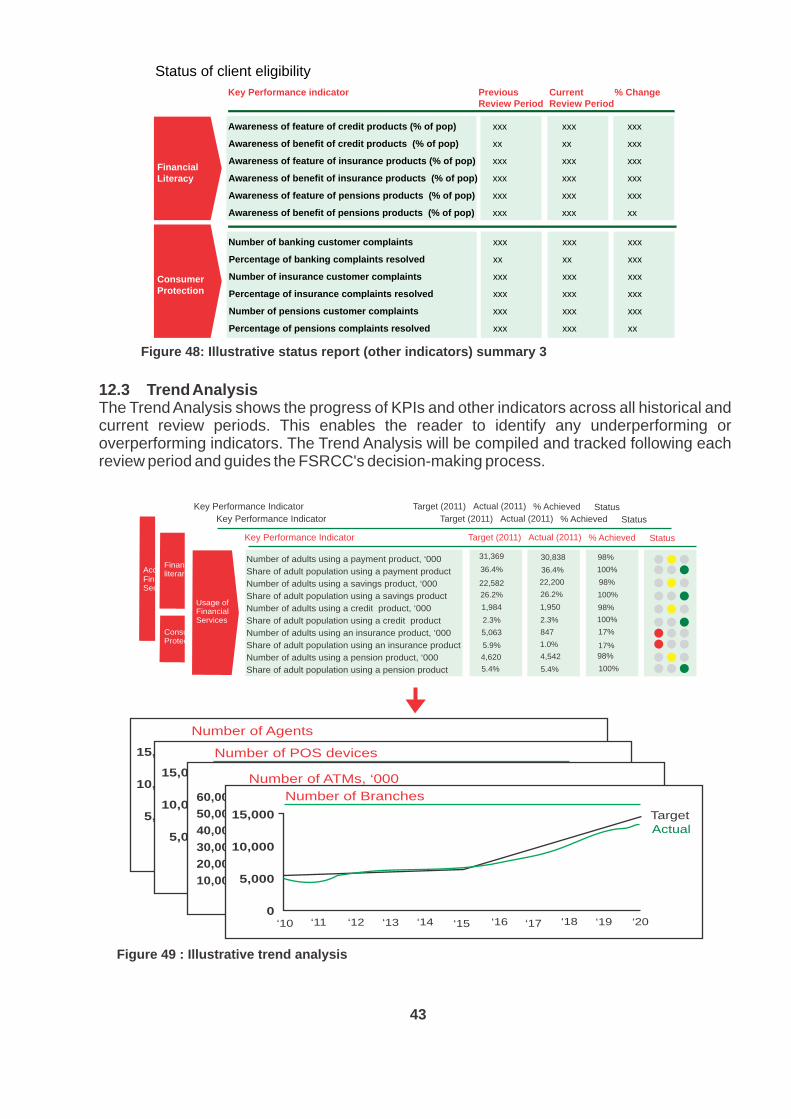
Financial Service
AccessFinancial literarcy
ConsumerProtection
Number of Agents
15,000
10,000
5,000
0
Number of POS devices
15,000
10,000
5,000
0
60,00
50,00
40,00
30,00
20,00
10,00
Number of ATMs, ‘000
15,000
10,000
5,000
0
Number of Branches
Target Actual
‘10 ‘11 ‘12 ‘13 ‘14 ‘15 ‘16 ‘17 ‘18 ‘19 ‘20
Number of adults using a payment product, ‘000
Share of adult population using a payment product
Number of adults using a savings product, ‘000
Share of adult population using a savings product
Number of adults using a credit product, ‘000
Share of adult population using a credit product
Number of adults using an insurance product, ‘000
Share of adult population using an insurance product
Number of adults using a pension product, ‘000
Share of adult population using a pension product
Key Performance Indicator Target (2011) Actual (2011) % Achieved Status
Target (2011) Actual (2011) % Achieved StatusKey Performance Indicator
31,369
22,582
1,984
5,063
4,620
30,838
22,200
1,950
847
4,542
98%
98%
98%
17%
36.4%
26.2%
2.3%
5.9%
5.4%
36.4%
26.2%
2.3%
1.0%
5.4%
100%
100%
100%
Key Performance Indicator Target (2011) Actual (2011) % Achieved Status
17%
98%
100%
Usage of Financial Services
Figure 49 : Illustrative trend analysis
43
Figure 48: Illustrative status report (other indicators) summary 3
12.3 Trend AnalysisThe Trend Analysis shows the progress of KPIs and other indicators across all historical and current review periods. This enables the reader to identify any underperforming or overperforming indicators. The Trend Analysis will be compiled and tracked following each review period and guides the FSRCC's decision-making process.
Status of client eligibility Key Performance indicator
% ChangeCurrent Review Period
Previous Review Period
ConsumerProtection
Number of banking customer complaints xxxxxxxxx
Number of insurance customer complaints xxxxxxxxx
Number of pensions customer complaints xxxxxxxxx
Percentage of banking complaints resolved xxxx xxx
Percentage of insurance complaints resolved xxxxxx xxx
Percentage of pensions complaints resolved xxxxxx xx
Financial Literacy
Awareness of feature of credit products (% of pop)
xxxxxxxxx
Awareness of feature of insurance products (% of pop) xxxxxxxxx
Awareness of feature of pensions products (% of pop) xxxxxxxxx
Awareness of benefit of credit products (% of pop) xxxx xxx
Awareness of benefit of insurance products (% of pop) xxxxxx xxx
Awareness of benefit of pensions products (% of pop) xxxxxx xx
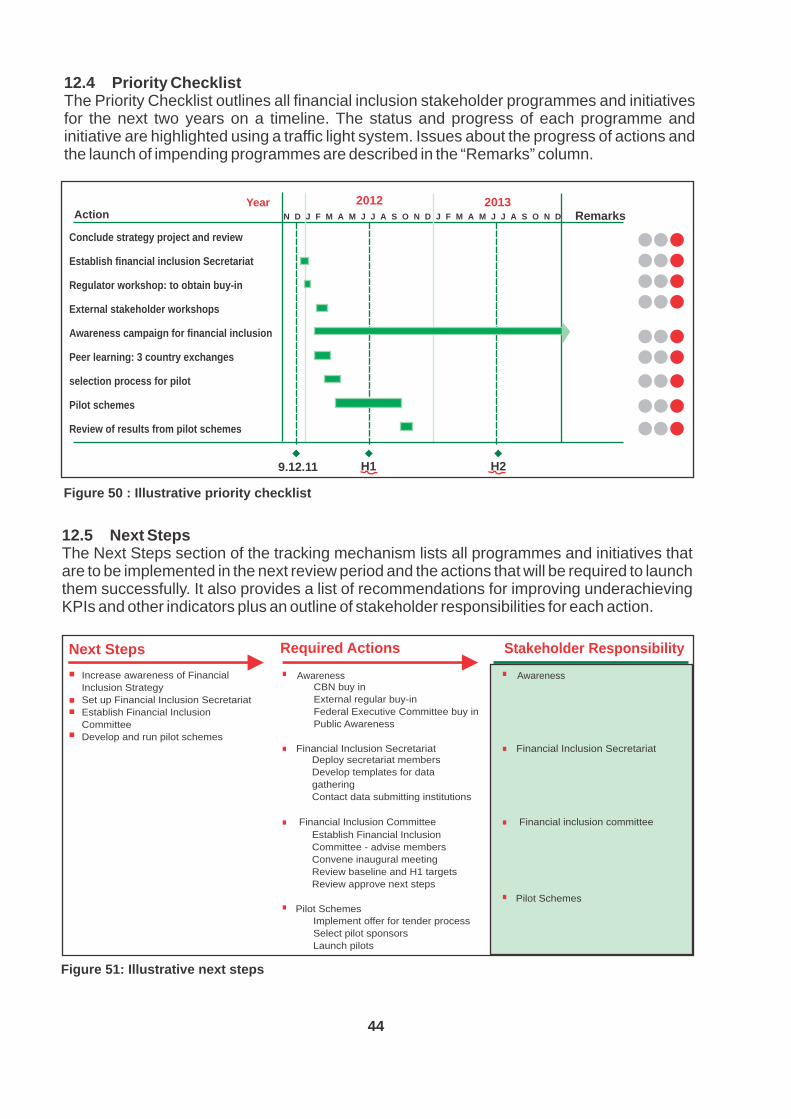
Action Year 2012 2013
Remarks
H1 H29.12.11
N D J F M A M J J A S O N D J F M A M J J A S O N D
Conclude strategy project and review
Establish financial inclusion Secretariat
Regulator workshop: to obtain buy-in
External stakeholder workshops
Awareness campaign for financial inclusion
Peer learning: 3 country exchanges
selection process for pilot
Pilot schemes
Review of results from pilot schemes
Next Steps
Increase awareness of Financial
Inclusion Strategy
Set up Financial Inclusion Secretariat
Establish Financial Inclusion
Committee
Develop and run pilot schemes
CBN buy in
External regular buy-in
Federal Executive Committee buy in
Public Awareness
Awareness
Deploy secretariat members
Develop templates for data
gathering
Contact data submitting institutions
Establish Financial Inclusion
Committee - advise members
Convene inaugural meeting
Review baseline and H1 targets
Review approve next steps
Financial Inclusion Secretariat
Financial Inclusion Committee
Pilot SchemesImplement offer for tender process
Select pilot sponsors
Launch pilots
Required Actions Stakeholder Responsibility
Awareness
Financial Inclusion Secretariat
Financial inclusion committee
Pilot Schemes
44
12.4 Priority Checklist The Priority Checklist outlines all financial inclusion stakeholder programmes and initiatives for the next two years on a timeline. The status and progress of each programme and initiative are highlighted using a traffic light system. Issues about the progress of actions and the launch of impending programmes are described in the “Remarks” column.
Figure 50 : Illustrative priority checklist
12.5 Next Steps The Next Steps section of the tracking mechanism lists all programmes and initiatives that are to be implemented in the next review period and the actions that will be required to launch them successfully. It also provides a list of recommendations for improving underachieving KPIs and other indicators plus an outline of stakeholder responsibilities for each action.
Figure 51: Illustrative next steps
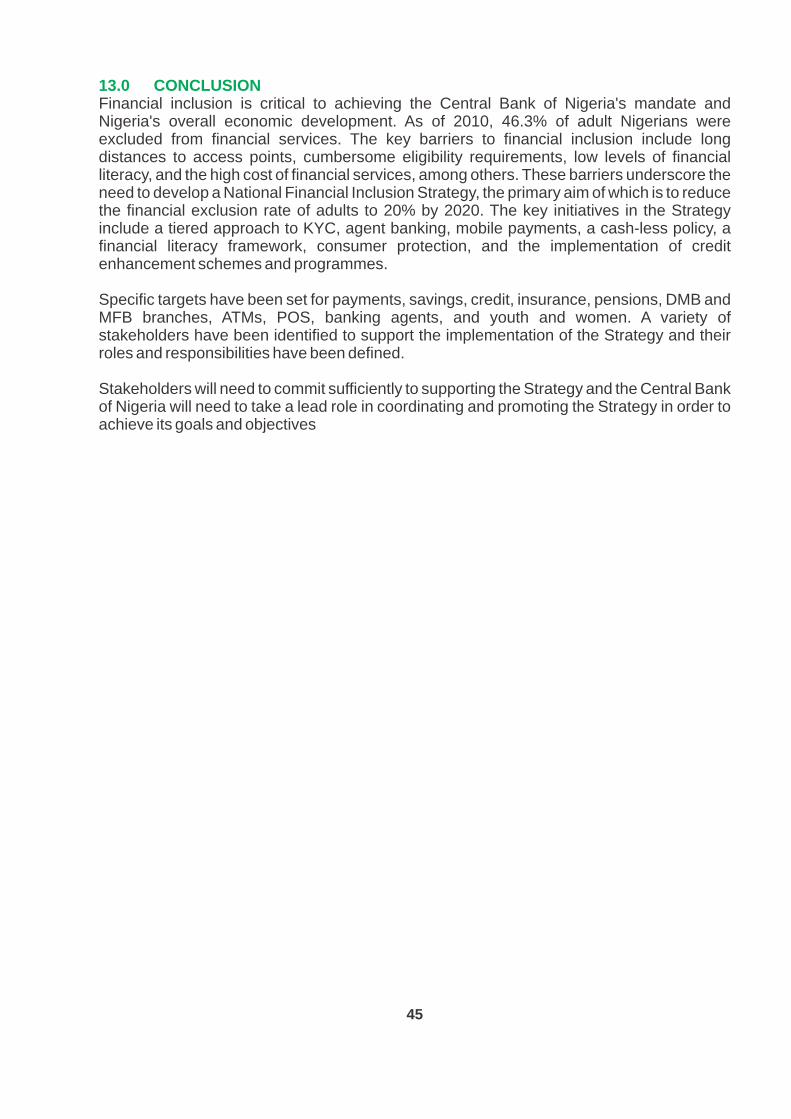
45
13.0 CONCLUSIONFinancial inclusion is critical to achieving the Central Bank of Nigeria's mandate and Nigeria's overall economic development. As of 2010, 46.3% of adult Nigerians were excluded from financial services. The key barriers to financial inclusion include long distances to access points, cumbersome eligibility requirements, low levels of financial literacy, and the high cost of financial services, among others. These barriers underscore the need to develop a National Financial Inclusion Strategy, the primary aim of which is to reduce the financial exclusion rate of adults to 20% by 2020. The key initiatives in the Strategy include a tiered approach to KYC, agent banking, mobile payments, a cash-less policy, a financial literacy framework, consumer protection, and the implementation of credit enhancement schemes and programmes.
Specific targets have been set for payments, savings, credit, insurance, pensions, DMB and MFB branches, ATMs, POS, banking agents, and youth and women. A variety of stakeholders have been identified to support the implementation of the Strategy and their roles and responsibilities have been defined.
Stakeholders will need to commit sufficiently to supporting the Strategy and the Central Bank of Nigeria will need to take a lead role in coordinating and promoting the Strategy in order to achieve its goals and objectives
46
Glossary AfDB African Development BankAFI Alliance for Financial Inclusion AMCON Asset Management Corporation of NigeriaARB Association of Rural BanksATM Automated Teller Machine BOA Bank of Agriculture BOI Bank of IndustryBPR Business Process Re-engineeringBPSD Banking and Payment Systems Department of the CBN BSP Billing and Settlement PaymentBSD Banking Supervision Department of the CBN CAGR Compound Asset Growth RateCBN Central Bank of NigeriaCENFRI Centre for Financial Regulation and InclusionCPC Consumer Protection CouncilCPS Compulsory Pension SchemeCUA Credit Unions AssociationCYFI Child and Youth Finance InitiativeDFD Development Finance Department of the CBN DFI Development Finance InstitutionsDFID Department for International DevelopmentDG Deputy Governor / Director GeneralEFInA Enhancing Financial Innovation and AccessEoPSD Employment-oriented Private Sector Development FCT Federal Capital Territory FMBN Federal Mortgage Bank of Nigeria FSD First Securities Discount House NigeriaFSS Financial System Strategy FPRD Financial Policy & Regulation Department of the CBNG2P Government to PeopleGDP Gross Domestic Product GIZ Deutsche Gesellschaft für Internationale ZusammenarbeitGSMA GSM AssociationGT Guarantee TrustIAD Independent ATM Deployer ID Identity IFC International Finance CorporationITU International Telecommunications UnionKPI Key Performance IndicatorKYC Know Your Customer LAPO lifd Abono Poverty OrganisationMSMEDF Micro, Small and Medium Enterprises Development FundMDRI Market Development and Restructuring Initiative MFB Microfinance BankMFI Microfinance InstitutionMNO Mobile Network OperatorsMPP Mobile Payment ProvidersMSME Micro, Small and Medium Enterprise
47
NAICOM National Insurance CommissionNAPEP National Poverty Eradication Programme of NigeriaNBS National Bureau of StatisticsNCC Nigerian Communications CommissionNDE National Directorate of Employment NDIC Nigeria Deposit Insurance Corporation NEPAD New Partnership for African DevelopmentNEXIM Nigerian Export-Import BankNIFI Non-interest Financial InstitutionsNGN NairaNIMC National Identity Management CommissionNIPOST Nigerian Postal ServiceNYSC National Youth Service CorpsOFISD Other Financial Institutions Supervision Department of the CBN OTC Over the counterPOS Point of SalePenCom National Pension Commission PIN Personal Identification NumberPRA Pension Reform ActPFA Pension Fund AdministratorRUFIN Rural Finance Institutions Building Programme SEC Securities and Exchange CommissionSME Small and Medium Enterprise SMEDAN Small and Medium Enterprise Development Agency of NigeriaSMS Short Message ServiceSMD Strategy Management Department of the CBN TB Treasury BillsUSD United States DollarUSSD Unstructured Supplementary Service DataVAT Value Added Tax