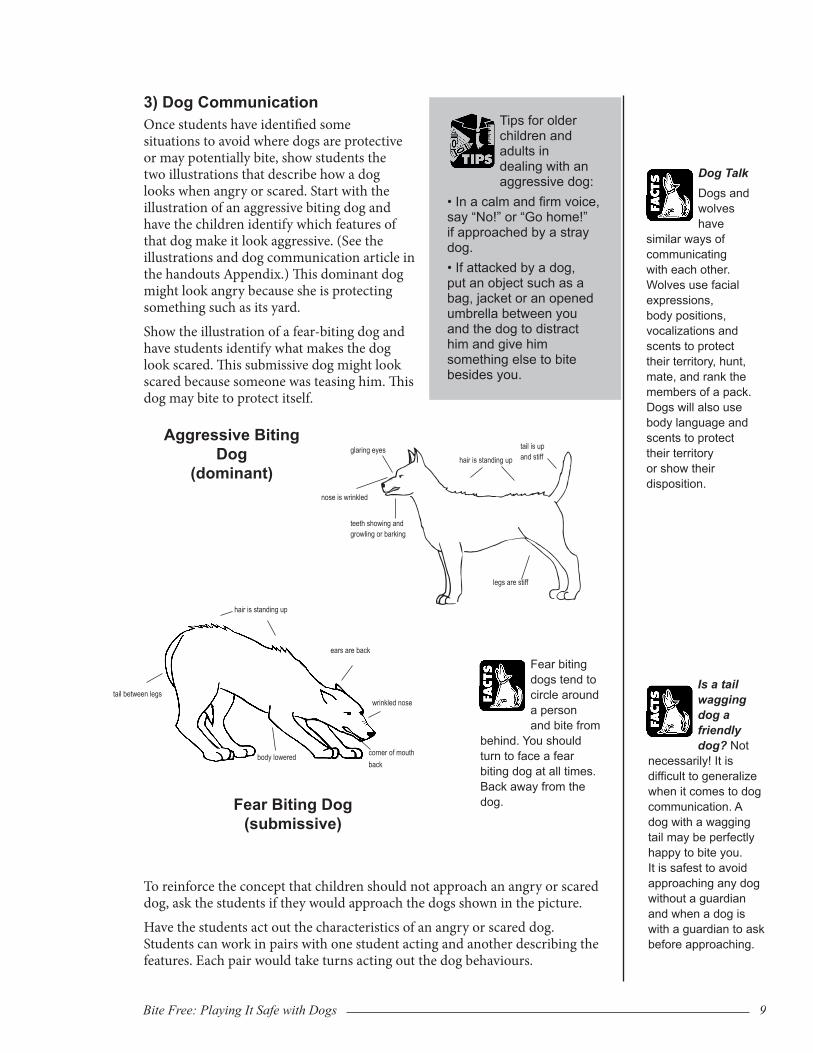
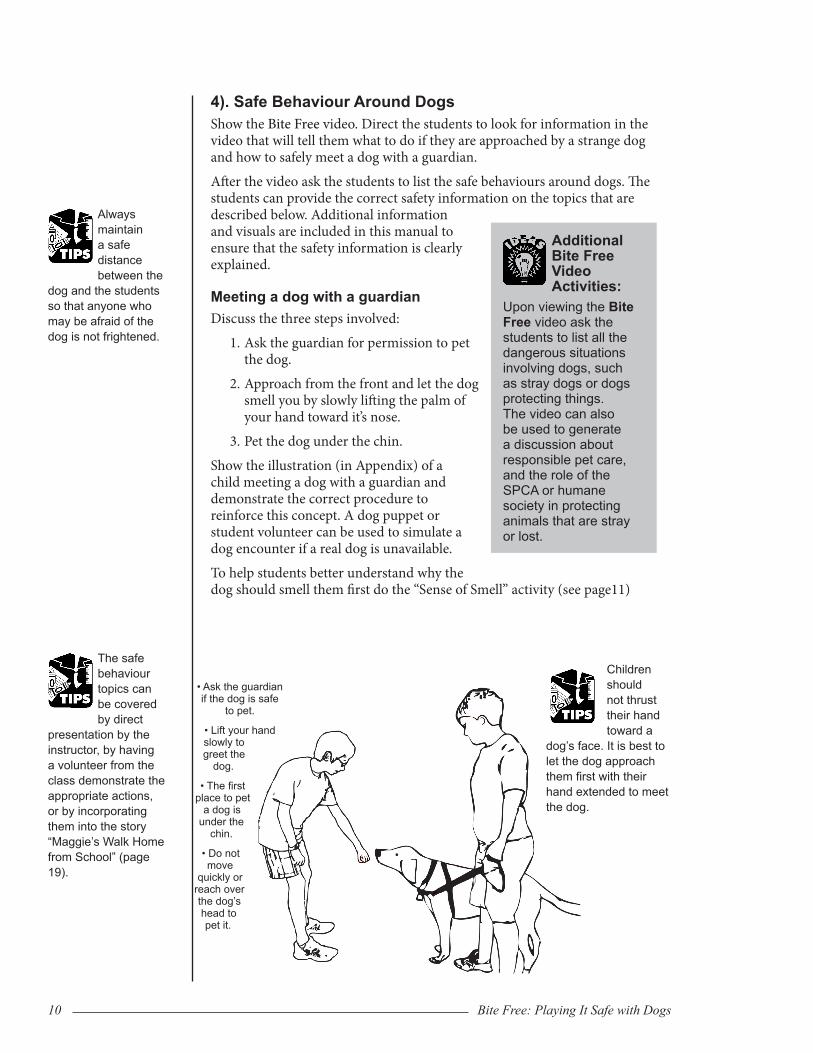
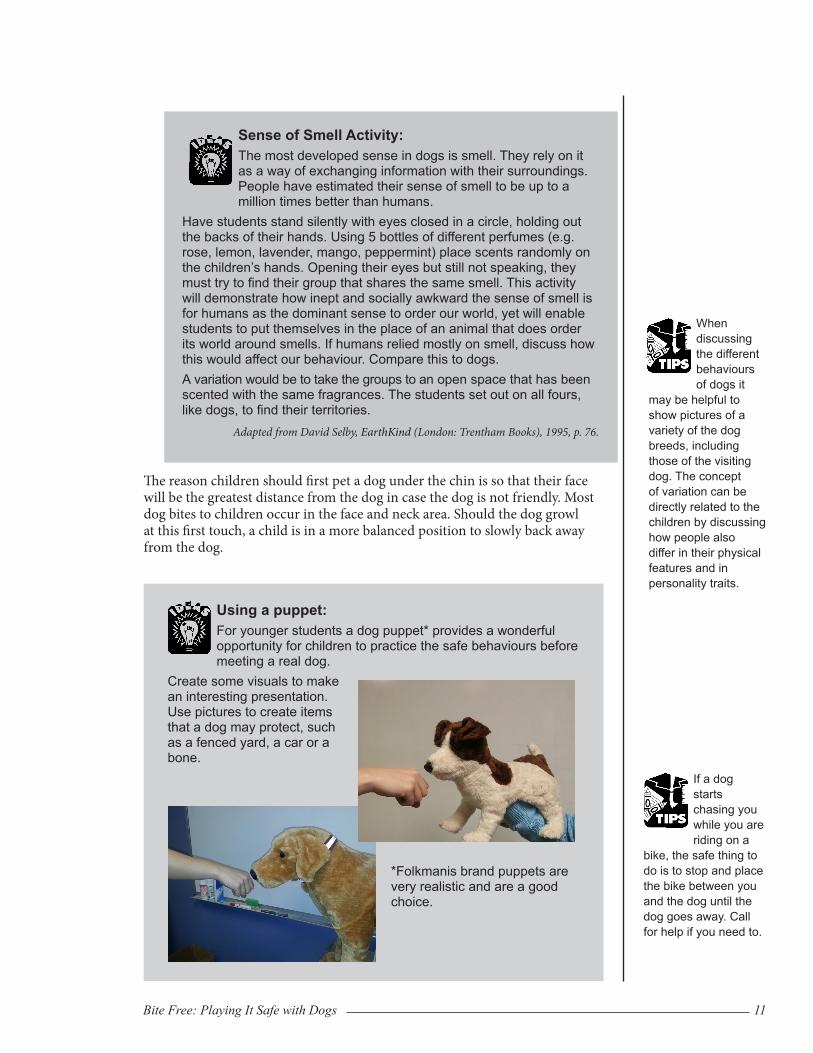
Embed Size (px)
Citation preview

1
National Forest Inventory of Ireland
Data processing methods
Portlaoise, July 2007
Martin Černý*, John Redmond#, Radek Russ*
*Institute of Forest Ecosystem Research Ltd., #Forest Service
Content
1. Data processing basis – NFI design
2. Pre-processing – secondary attributes
3. Statistical data processing
4. Technology for data processing
5. Further possibilities of data processing
2
Data processing basis – NFI design
� 17,417of inventory plots
� sampling intensity 0.0125%
� 1,742 forest plots
Statistically representative randomized regular grid of inventory plots
Data processing basis – plot design
� Permanent circular inventory plots 500 m2
� Concentric circles (R=3-7-12.6 m; DBH=7-12-20 cm)
� 170 primary attributes
� Mapping of tree positions
� 24,946 recorded trees i.e. 16.0 per plot in average
R = 12.62 m
R = 7 m
Trees
R = 3 m
3
Data processing basis - computer aided field data collection
Data processing basis - NFI database
Database:
29 tables
170 primary attributes
400 attributes in total(primary+secondary)
Plots
Site description
Ground vegetation
Height classes/Species
Damage
Trees
Deadwood, stumps
Forest
Small trees (regeneration)
Vitality
Stand layers
Species
4
Pre-processing of data
Methods of data pre-processing
� Modeling (e.g. tree volume, biodiversity indices)
� Classification (e.g. diameter classes)
� Aggregation (e.g. number of species per plot)
� Re-classification (e.g. species groups)
� Post-stratification (e.g. by counties)
5
Tasks of data pre-processing
1. Tree heights
2. Timber volume
3. Tree biomass, carbon content
4. Virtual trees from regeneration
5. Representative area of a tree
6. Biodiversity indicators
7. Classification
8. Re-classification, species groups
9. Aggregation
10. Stratification
Modeled tree heights
� 33.6% of measured trees
� Non-linear and linear regression models parameterized using NFI data
0 10 20 30 40 50 60 70 800
5
10
15
20
25
30
35
40
Heig
ht, m
DBH, cm
All plots All species
Chapman-Richards: Y=1.3+P1*(1-exp(-P2*X))(1/P3)
Global function (params: 22.04564,0.05263,0.64931)
0 5 10 15 20 25 300
2
4
6
8
10
12
14
16
Heig
ht, m
DBH, cm
Plot ID = 10195 Alnus glutinosa
Chapman-Richards: Y=1.3+P1*(1-exp(-P2*X))(1/P3)
Local function (params: 12.13205,0.09393,1.08653)
0 5 10 15 20 25 30 35 400
5
10
15
20
25
30
35
40
Pre
dic
ted
he
ight
, m
Observed height, m(N=7144 Syx=1.0m R=0.98)
Model Equation
exponential (Chapman-Richards) ( )23
1
11.3 1P dbh Ph P e
− ×= + × −
exponential 2
1
1.3
PP
dbhh e+
= +
logarithm ( )1 21.3 lnh P P dbh= + + ×
6
Timber volume calculation
� Single tree models (volume calculated for every sample tree)
� British Forestry Commission Tariffs
� Irish national models
tree height
stump height
d=7 cm
overbark
underbark
Timber volume by assortments
� Proportion of pulp, pallet, sawlog volume based on tree DBH
� Adjusted for stem quality attributes� Stem straightness� Stem break� Stem fork

7
Tree biomass, carbon content
� Biomass components� Belowground biomass� Aboveground biomass� Total biomass
� Allometric equations compiled by Dr. Kevin Black (dry matter of biomass by species, dimension class, DBH and tree height)
� Carbon content (46% of biomass)
Virtual trees from regeneration
� Trees with DBH ≥ 7 cm recorded individually
� Regeneration trees (h>0.2m … DBH<7cm) recorded by species and dimension class
� Complete tree table for data processing comprises all trees (h>0.2m) –tree of all dimensions are included into data processing
8
Representative area of a tree
� Area of the inventory plot is distributed among the trees
� Representative are of the tree is proportional to its size
� Representative area becomes an attribute of the tree and may be used for further processing
ô
ôô
ô
ô
ô
ô
ô
Biodiversity indicators
� Non-spatial indicators – diversity by species and dimensions
� Entropy (by species, growth stage)
� Simpson index
1
lnn
i i
i
s sH
S S=
= ×
∑
1
1n
i i
i
s sI
S S=
= − ×
∑
9
Classification
� Continuous data into discrete classes
� e.g. DBH into diameter classes, age into age classes etc.
Re-classification, species groups
� re-grouping classesSpecies group Species
1 Sitka spruce sitka spruce
2 Norway spruce Norway spruce
3 Scots pine Scots pine
4 other pine spp. lodgepole pine, Austrian pine, Monterey pine
5 Douglas fir Douglas fir
6 larch spp. European larch, Japanese larch, other larches
7 other conifers silver fir, grand fir, noble fir, cedar of Lebanon, Lawson cypress, coast redwood,
yew, western redcedar, western hemlock
8 sessile and pedunculate oak sessile oak, pedunculate oak
9 beech beech
10 ash ash
11 sycamore sycamore
12 birch spp. silver birch
13 downy birch
14 alder spp. alder
15 other long living broadleaves field maple, maple, horse chestnut, Strawberry tree, hornbeam, sweet chestnut,
holly, notofagus sp., white poplar, black poplar, Turkey oak, pin oak, whitebeam,
small-leaved linden, large-leaved linden, wych elm
16 other short living broadleaves crab apple, aspen, Mazzard cherry, Wild cherry, blackthorn, goat willow, other
willows, mountain ash, hazel
10
Stratification
� Less variability within strata � more accurate estimate of statistics
� Post-stratification
� Counties
Statistical data processing
11
Statistical data processing tasks
Basic terms:
1. Evaluated variable (area, volume, number of trees)
2. Stratifier(post-stratification decreasing variance)
3. Classifier (species, diameter classes, soil groups, etc.)
Calculated statistics
� Totals (total area, total volume, etc.)
� Mean values(mean volume, mean height, mean defoliation, etc.)
� Mean of totals� Mean of means� Mean of weighted means� Normalized mean of totals� Normalized mean of weighted means
� Confidence interval for α=0.05
12
Standardized outputs (tables)
Species group
County / Volume (BFC ground to 7cm)
Wicklow
1000 m3 (α = 0.05) %
Kerry
1000 m3 (α = 0.05) %
Total
1000 m3 (α = 0.05) %
Sitka spruce 2 458.7 (1 628.8 3 288.5) – 59.9 2 938.1 (2 126.6 3 749.6) – 53.1 5 396.8 (4 266.2 6 527.3) – 56.0
Norway spruce 248.7 (0.0 2 861.9) – 6.1 – – – – 248.7 (0.0 2 861.9) – 2.6
pine 60.2 (0.0 143.1) – 1.5 1 095.4 (0.0 2 377.2) – 19.8 1 155.5 (0.0 2 438.1) – 12.0
Douglas fir 116.9 (0.0 302.5) – 2.9 – – – – 116.9 (0.0 302.5) – 1.2
larch 168.6 (0.0 346.9) – 4.1 2.8 – – 0.05 171.4 (0.0 349.7) – 1.8
other conifers 149.6 (86.4 212.7) – 3.7 155.5 (0.0 1 257.8) – 2.8 305.1 (0.0 1 409.1) – 3.2
oak 468.8 (63.7 873.9) – 11.4 438.3 (159.6 716.9) – 7.9 907.1 (445.5 1 368.6) – 9.4
beech 272.9 (0.0 577.7) – 6.7 50.8 (0.0 164.1) – 0.9 323.7 (1.4 646.0) – 3.4
ash 56.6 (8.0 105.2) – 1.4 48.7 (10.4 87.1) – 0.9 105.3 (43.4 167.2) – 1.1
birch 50.5 (0.0 147.6) – 1.2 336.5 (67.2 605.8) – 6.1 387.0 (116.0 657.9) – 4.0
alder 30.6 – – 0.7 118.0 (55.5 180.6) – 2.1 148.7 (86.1 211.2) – 1.5
other long living broadleaves 7.6 (0.0 15.5) – 0.2 235.3 (20.5 450.0) – 4.3 242.8 (28.1 457.6) – 2.5
other short living broadleaves 8.3 (0.0 29.8) – 0.2 112.1 (16.1 208.2) – 2.0 120.5 (24.3 216.7) – 1.3
Total 4 097.8 (3 094.9 5 100.7) – 100.0 5 531.6 (4 110.0 6 953.2) – 100.0 9 629.4 (7 909.7 11 349.1) – 100.0
ClassesCalculated statistics
(total)
Confidence
interval
Totals, sub-totals
Percentage
Standardized outputs (charts)
0
1000
2000
3000
4000
5000
6000
Volu
me (
BF
C g
roun
d to 7
cm),
10
00 m
3
County
Wicklow Kerry
Species group
Sitka spruce
Norway spruce
pine
Douglas fir
larch
other conifers
oak
beech
ash
birch
alder
other long living broadleaves
other short living broadleaves
less reliable data
4 097.8
5 531.6
Species group
Sitka spruce1
Norway spruce2
pine3
Douglas fir4
larch5
other conifers6
oak7
beech8
ash9
birch10
alder11
other long living broadleaves12
other short living broadleaves13
1
2
3
4
5
6
7
8
910
11 12 13
0
500
1000
1500
2000
2500
3000
Volu
me (
BF
C g
roun
d to 7
cm),
10
00 m
3
County
Wicklow Kerry
Species group
Sitka spruce
Norway spruce
pine
Douglas fir
larch
other conifers
oak
beech
ash
birch
alder
other long living broadleaves
other short living broadleaves
less reliable data
0
5
10
15
20
25
He
igh
t, m
Dimension class
0.1
- 0
.5 m
0.5
- 1
.3 m
1.3
m -
7 c
m
7 -
12
cm
12
- 1
7 c
m
17
- 2
2 c
m
22
- 2
7 c
m
27
- 3
2 c
m
32
- 3
7 c
m
37
- 4
2 c
m
42
- 4
7 c
m
47
- 5
2 c
m
52
- 5
7 c
m
57
- 6
2 c
m
62
- 6
7 c
m
67
- 7
2 c
m
>7
2 c
m
Species group
Sitka spruce
Norway spruce
pine
Douglas fir
larch
other conifers
oak
beech
ash
birch
alder
other long living broadleaves
other short living broadleaves

13
Data processing technology
Comprehensive technology for NFI

14
Field-Map Inventory Analyst
Further possibilities

15
Data processing possibilities
1. Regionalization
2. Forecasting
3. Specific tasks of the scientific analysis
Regionalization
� Irish NFI provides data for the country level
� County data can be evaluated with limited accuracy
� Results for local forest managers ?
16
Regionalization options
� Modeling approach(generalization of NFI information in form of models and application elsewhere)
� Spatial modeling (GIS: geostatistical techniques such as co-kriging)
� Regression modeling (“cause-effect” models enabling to calculate broader set of variables based on limited local information)
� Denser inventory grid for regions (counties)(operational statistical forest inventory)
NFI potential for forecasting
� Current increment data (at least one repeated inventory) = inventory of current incrementEvaluation of cutting possibilities (quantity & quality)
� Forecastingrequires combination of NFI data with a model (e.g. growth and yield model)
� Model development� Model parameterization using NFI data� Formulation of new models
17
Stand level models / virtual standsô
ôô
ô
ô
ô
ô
ô
ô
ô
ô
ô
ô
ô
ô
ô
ô
ô
ô
ô
ô
ô
ô
ô ô
ô
ô
ô
ôô ô
ô
ôô
ô
ôôô ôô ôôô ô ôôô ôô ôô ô ô ôô
ôôô ôôô ôô ô ôô ôô ôô ô
ô ôôô ôô ôô ô ôôô ôô ôôô
ôô ôôô ôô ôôô ôôô ô ôôô ô ô ôô ôô ôô ô ô ô
ôôô ôôô ô
ôô ô ôô ôô ôôô ô ôôô ô ôô
ô ôôô ôô ôôôô ô ôô
ôôôô ô ôô ô
ôô
ô ô ô ôôô ô ôôô ô ô ôô ô ôô ô ôô
ô ôôô ôô ô ôô ô ôô
ô ôô ôô ôôô ôôô ôôô ô ôôô ôôô ôô ôôô ô
ô ôô ôô ô ôô ô
ôôôô ôôô ô
ô ô ôô ô
…
Virtual even-aged monocultures