Embed Size (px)
Citation preview
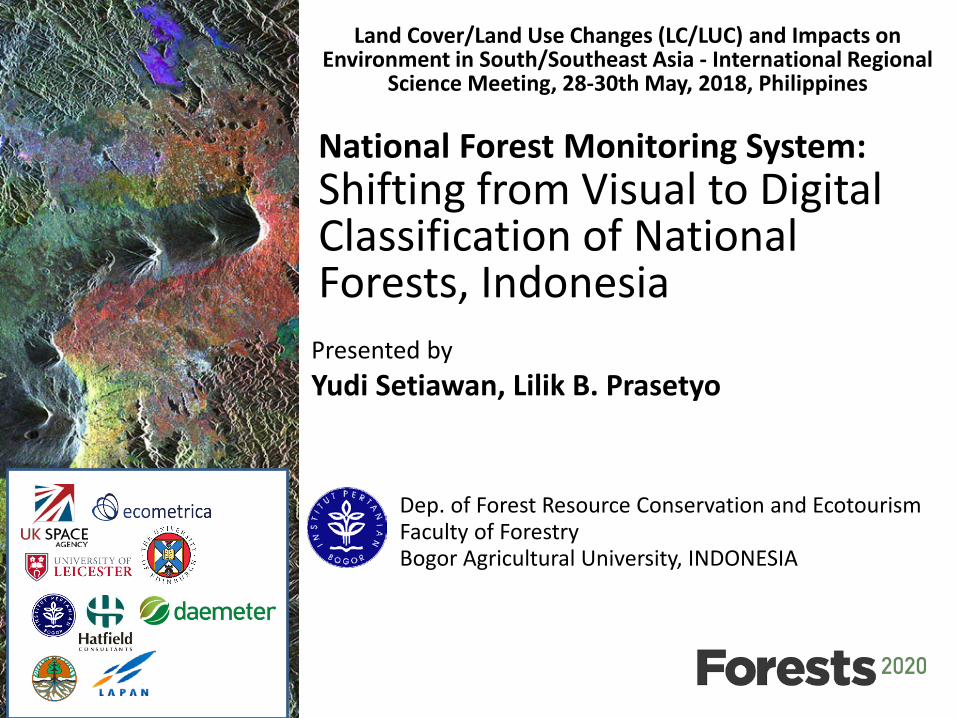
National Forest Monitoring System:Shifting from Visual to Digital Classification of National Forests, Indonesia
Presented byYudi Setiawan, Lilik B. Prasetyo
Land Cover/Land Use Changes (LC/LUC) and Impacts on Environment in South/Southeast Asia - International Regional
Science Meeting, 28-30th May, 2018, Philippines
Dep. of Forest Resource Conservation and Ecotourism Faculty of ForestryBogor Agricultural University, INDONESIA
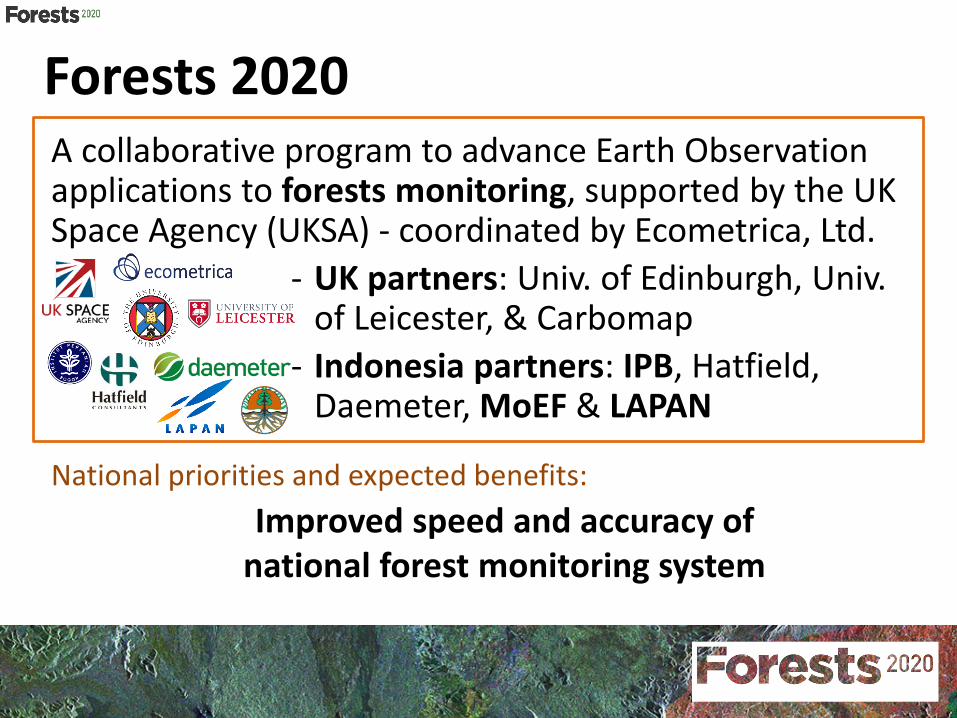
Forests 2020A collaborative program to advance Earth Observation applications to forests monitoring, supported by the UK Space Agency (UKSA) - coordinated by Ecometrica, Ltd.
- UK partners: Univ. of Edinburgh, Univ. of Leicester, & Carbomap
- Indonesia partners: IPB, Hatfield, Daemeter, MoEF & LAPAN
Improved speed and accuracy of national forest monitoring system
National priorities and expected benefits:
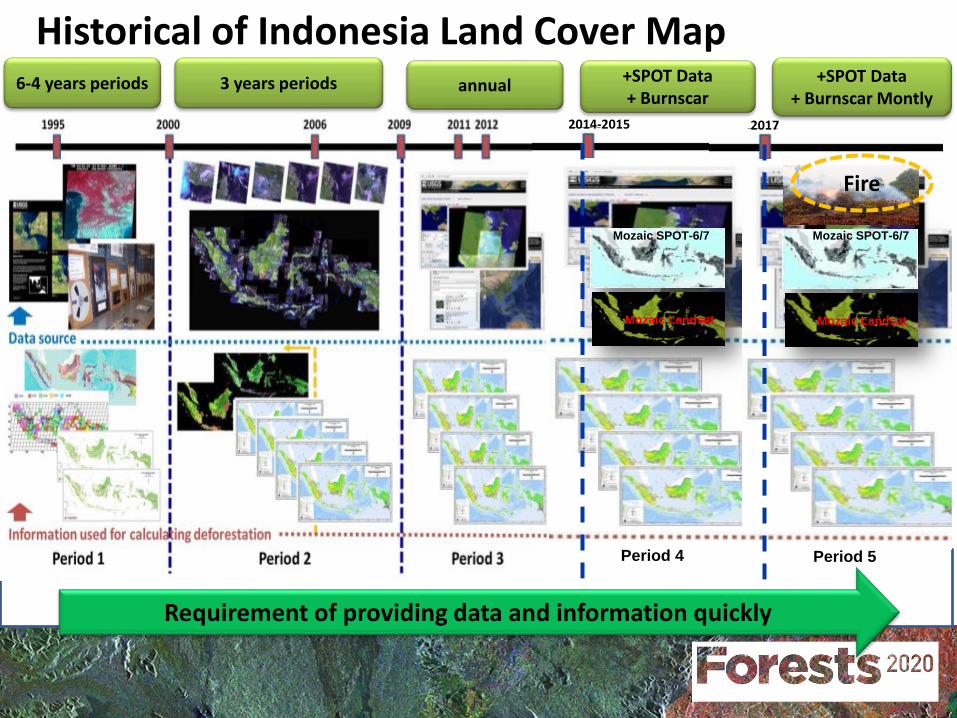
Mozaic SPOT-6/7
Mozaic Landsat
Period 4
2014-2015
Mozaic SPOT-6/7
Mozaic Landsat
Period 5
2017
6-4 years periods 3 years periods annual +SPOT Data+ Burnscar
+SPOT Data+ Burnscar Montly
Fire
Requirement of providing data and information quickly
Historical of Indonesia Land Cover Map
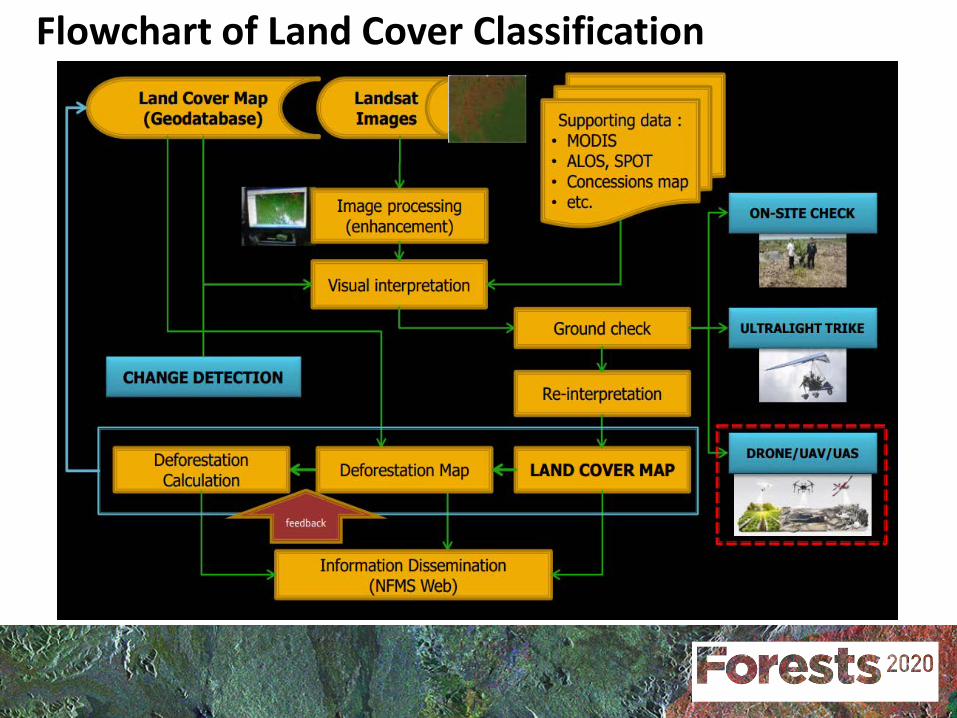
Flowchart of Land Cover Classification
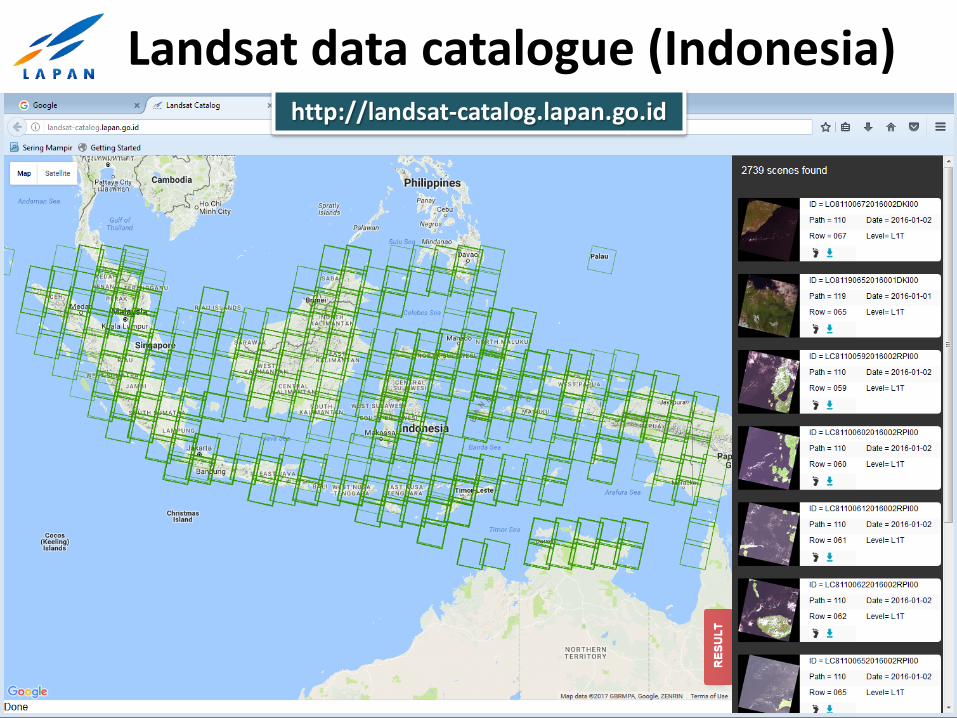
Landsat data catalogue (Indonesia)http://landsat-catalog.lapan.go.id
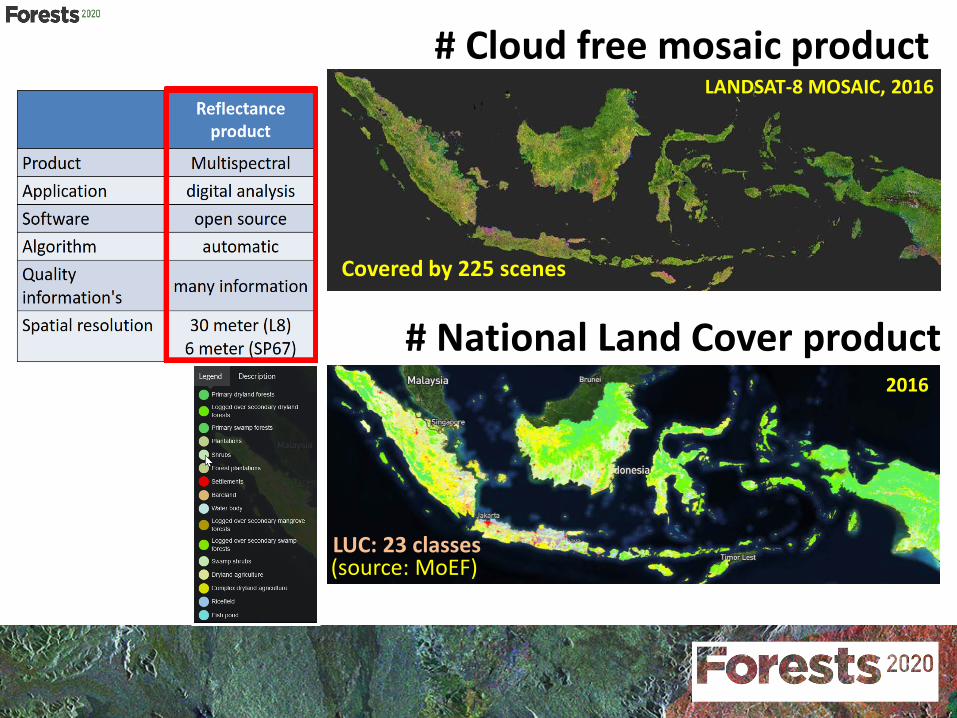
# Cloud free mosaic productLANDSAT-8 MOSAIC, 2016
# National Land Cover product2016
LUC: 23 classes(source: MoEF)
Covered by 225 scenes
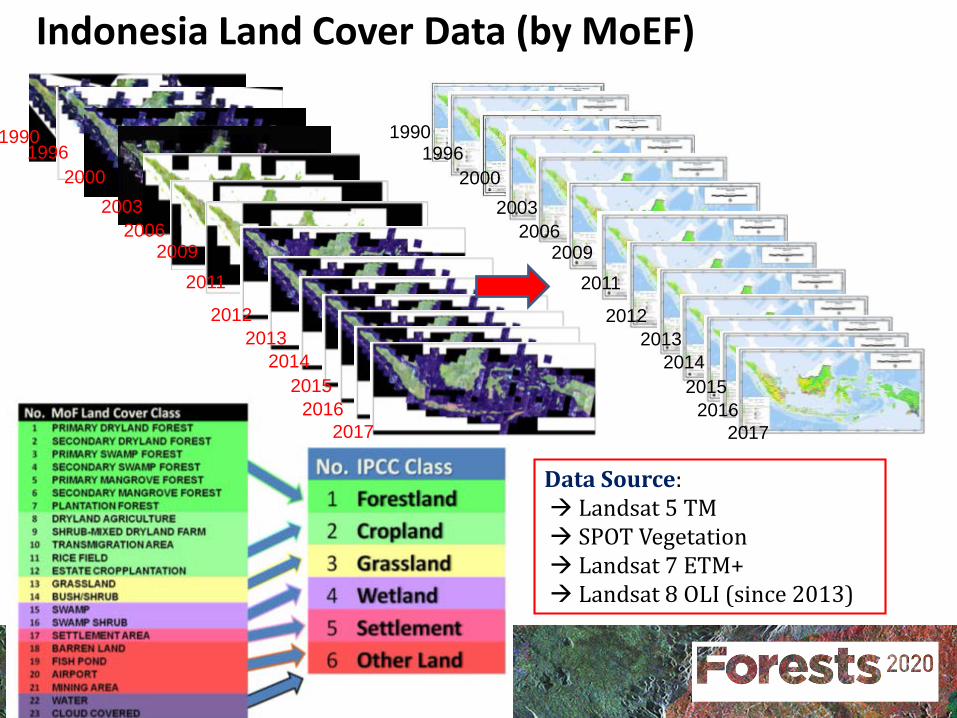
Landsat Mosaic – Land Cover 1990-2017
1990
Data Source: Landsat 5 TM SPOT Vegetation Landsat 7 ETM+ Landsat 8 OLI (since 2013)
19901996
20002003
20062009
2011
2012
7
20132014
20162015
2017
19962000
20032006
20092011
20122013
2014
20162015
2017
Indonesia Land Cover Data (by MoEF)
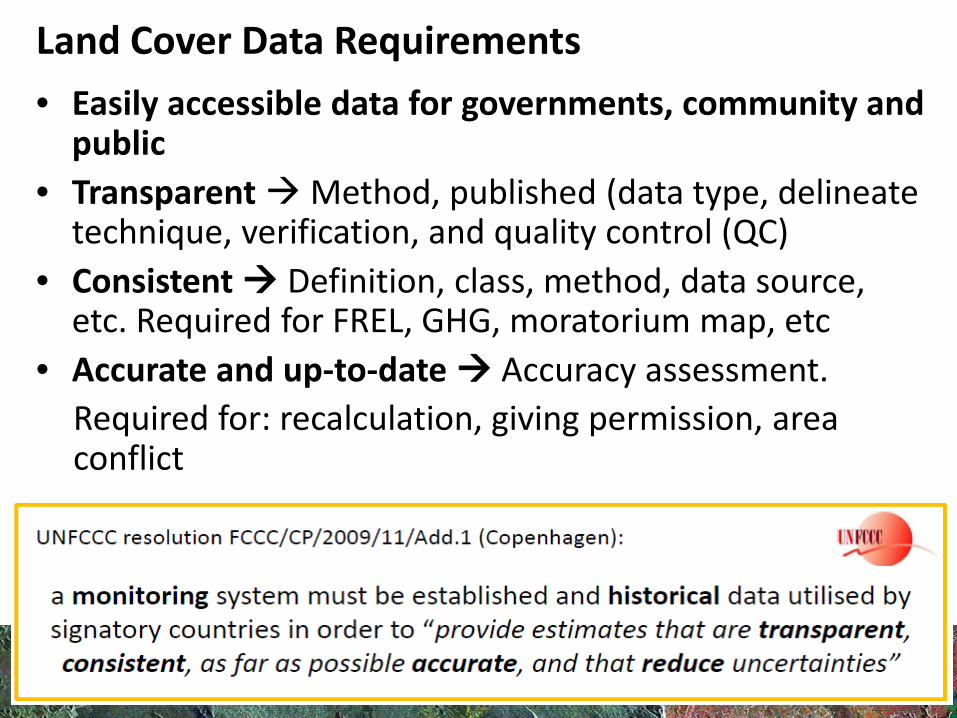
• Easily accessible data for governments, community and public
• Transparent Method, published (data type, delineate technique, verification, and quality control (QC)
• Consistent Definition, class, method, data source, etc. Required for FREL, GHG, moratorium map, etc
• Accurate and up-to-date Accuracy assessment.Required for: recalculation, giving permission, area conflict
Land Cover Data Requirements
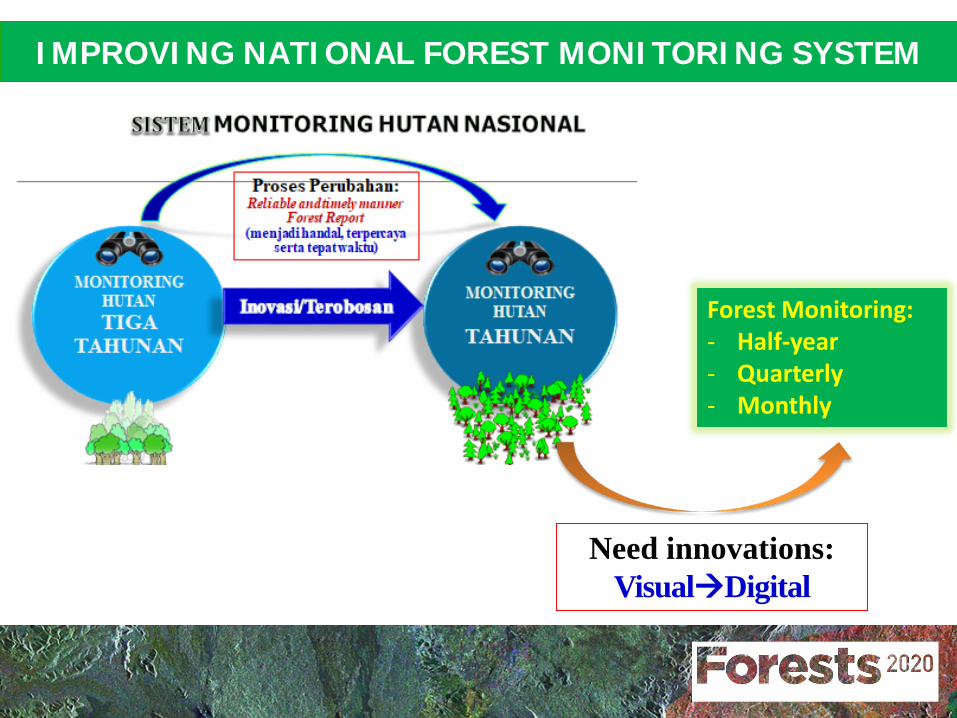
IMPROVING NATIONAL FOREST MONITORING SYSTEM
Need innovations:VisualDigital
Forest Monitoring:- Half-year- Quarterly- Monthly
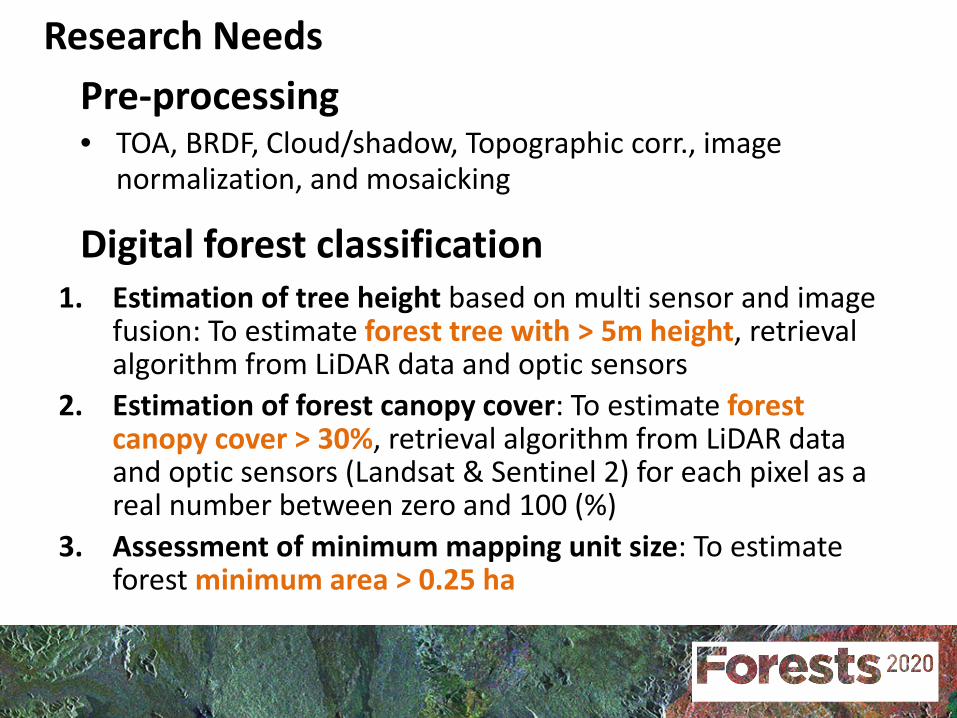
1. Estimation of tree height based on multi sensor and image fusion: To estimate forest tree with > 5m height, retrieval algorithm from LiDAR data and optic sensors
2. Estimation of forest canopy cover: To estimate forest canopy cover > 30%, retrieval algorithm from LiDAR data and optic sensors (Landsat & Sentinel 2) for each pixel as a real number between zero and 100 (%)
3. Assessment of minimum mapping unit size: To estimate forest minimum area > 0.25 ha
Pre-processing• TOA, BRDF, Cloud/shadow, Topographic corr., image
normalization, and mosaicking
Research Needs
Digital forest classification
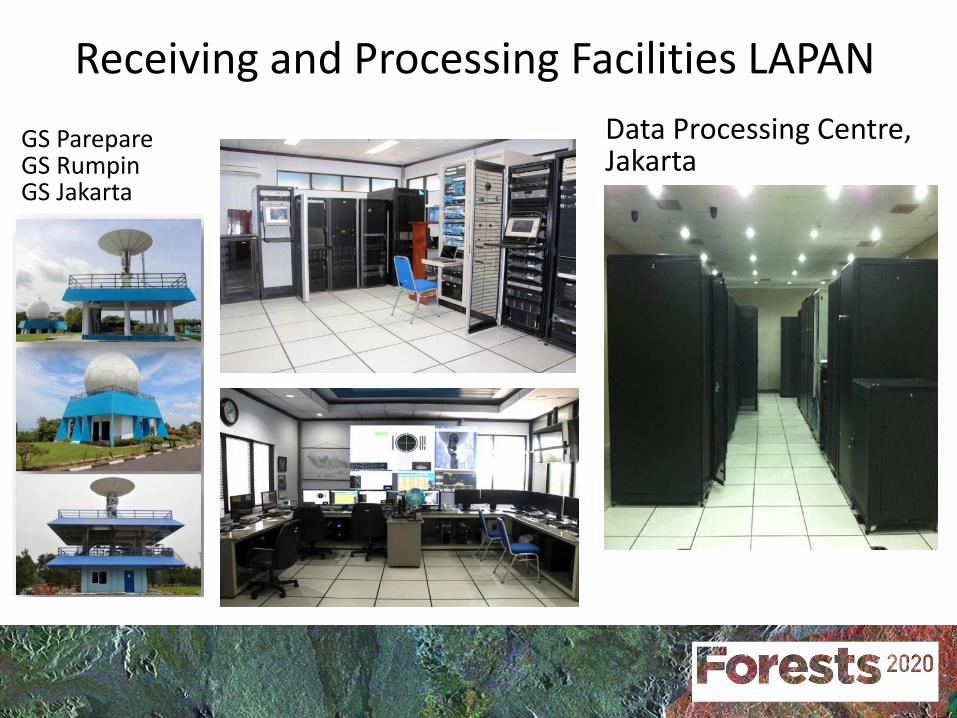
Receiving and Processing Facilities LAPANGS ParepareGS RumpinGS Jakarta
Data Processing Centre,Jakarta
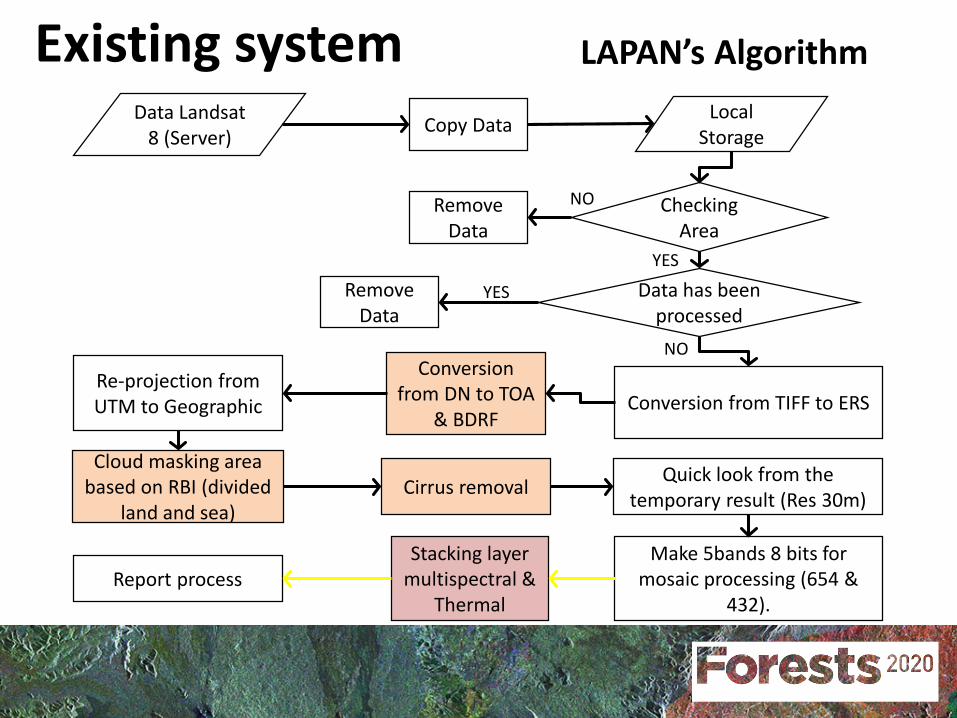
Data Landsat 8 (Server) Copy Data Local
Storage
Checking Area
Remove Data
Data has been processed
Remove Data
Conversion from TIFF to ERS
Conversion from DN to TOA
& BDRF
Re-projection from UTM to Geographic
Cloud masking area based on RBI (divided
land and sea)Cirrus removal Quick look from the
temporary result (Res 30m)
NO
YES
YES
NO
Make 5bands 8 bits for mosaic processing (654 &
432).
Stacking layer multispectral &
ThermalReport process
LAPAN’s AlgorithmExisting system
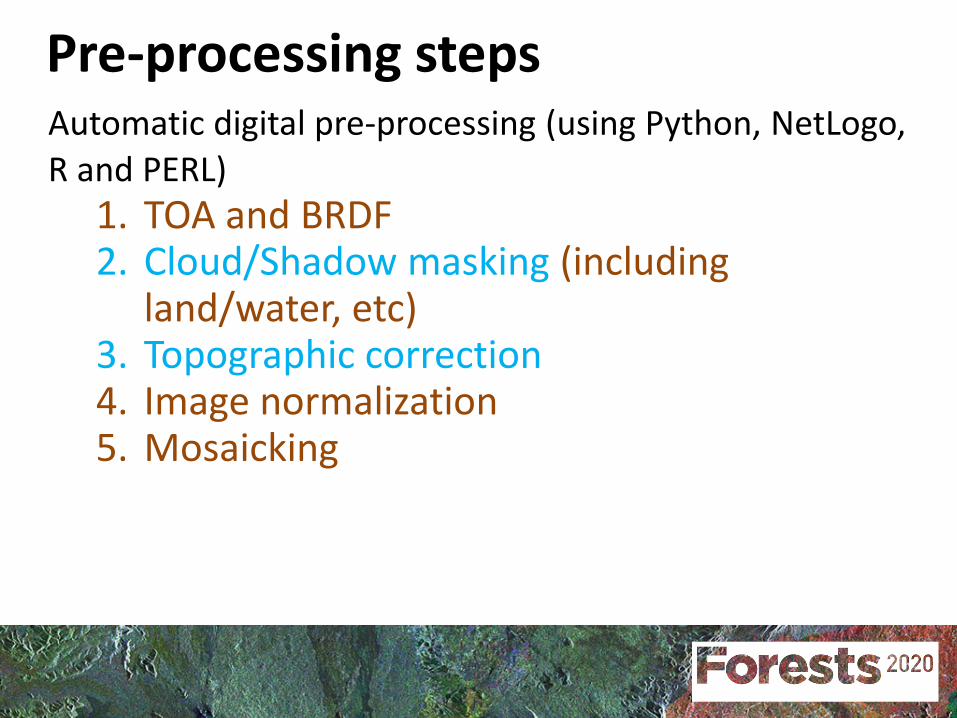
Pre-processing stepsAutomatic digital pre-processing (using Python, NetLogo, R and PERL)
1. TOA and BRDF2. Cloud/Shadow masking (including
land/water, etc)3. Topographic correction4. Image normalization5. Mosaicking
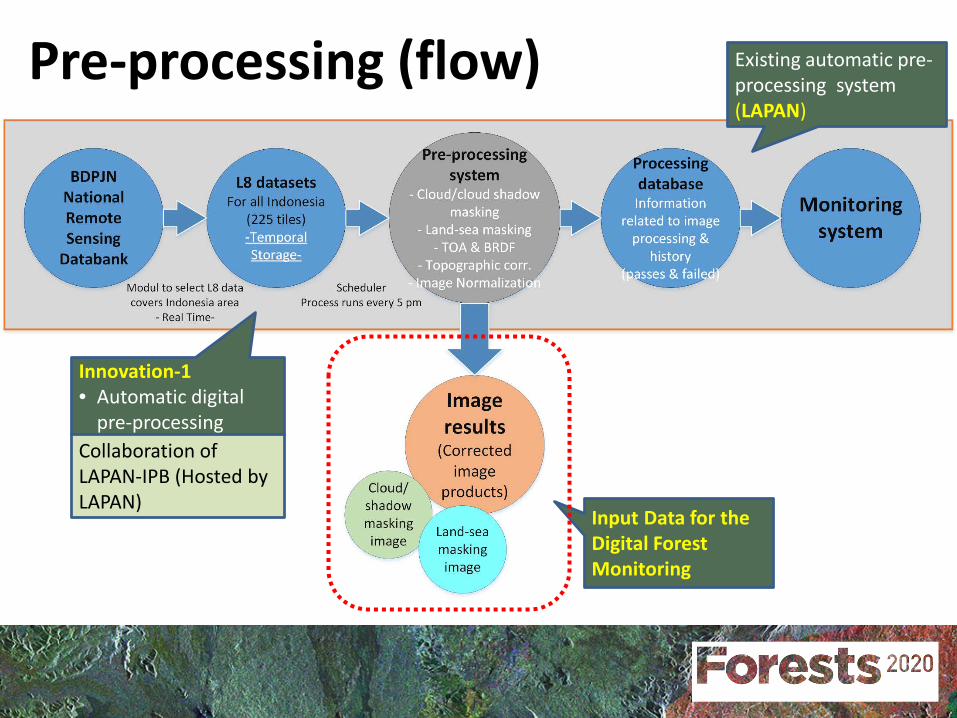
Pre-processing (flow)
Innovation-1• Automatic digital
pre-processing
Input Data for the Digital Forest Monitoring
Collaboration of LAPAN-IPB (Hosted by LAPAN)
Existing automatic pre-processing system (LAPAN)
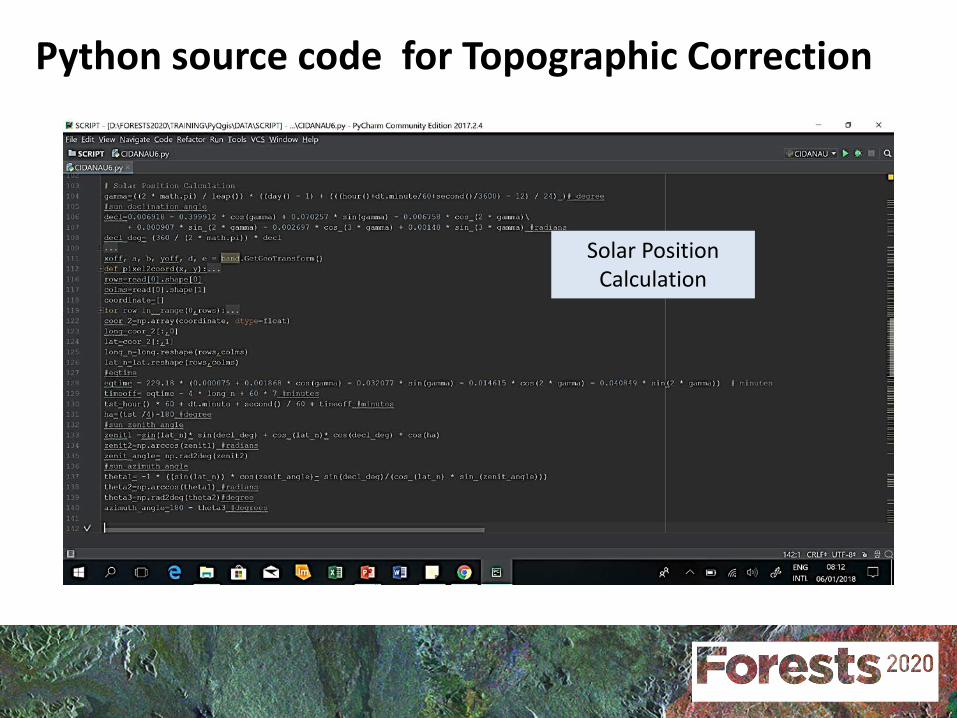
Python source code for Topographic Correction
Solar Position Calculation
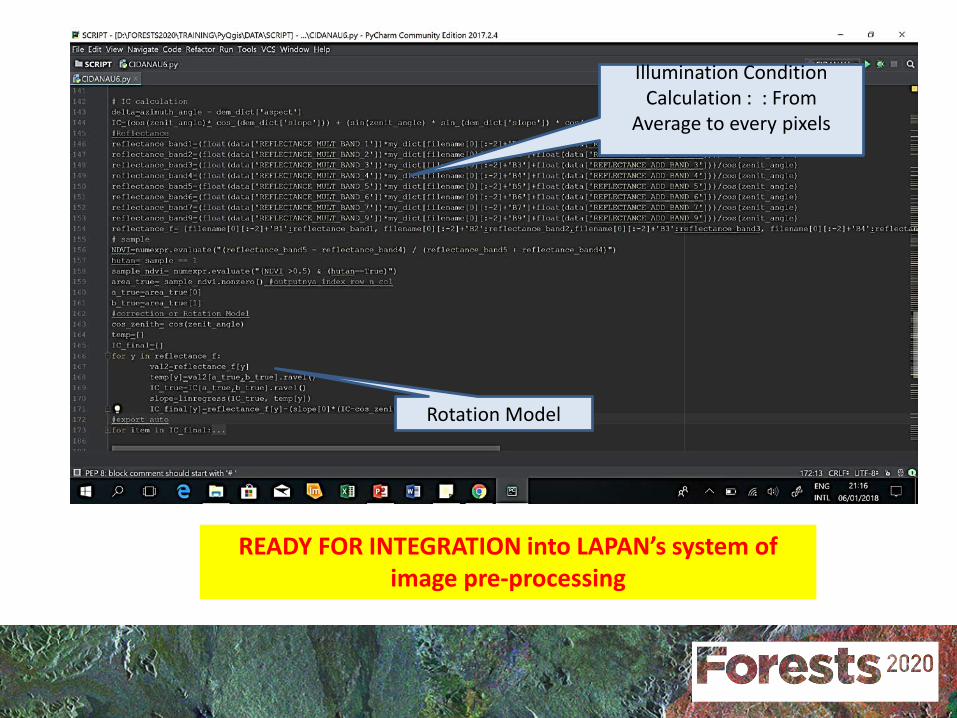
Illumination Condition Calculation : : From
Average to every pixels
Rotation Model
READY FOR INTEGRATION into LAPAN’s system of image pre-processing
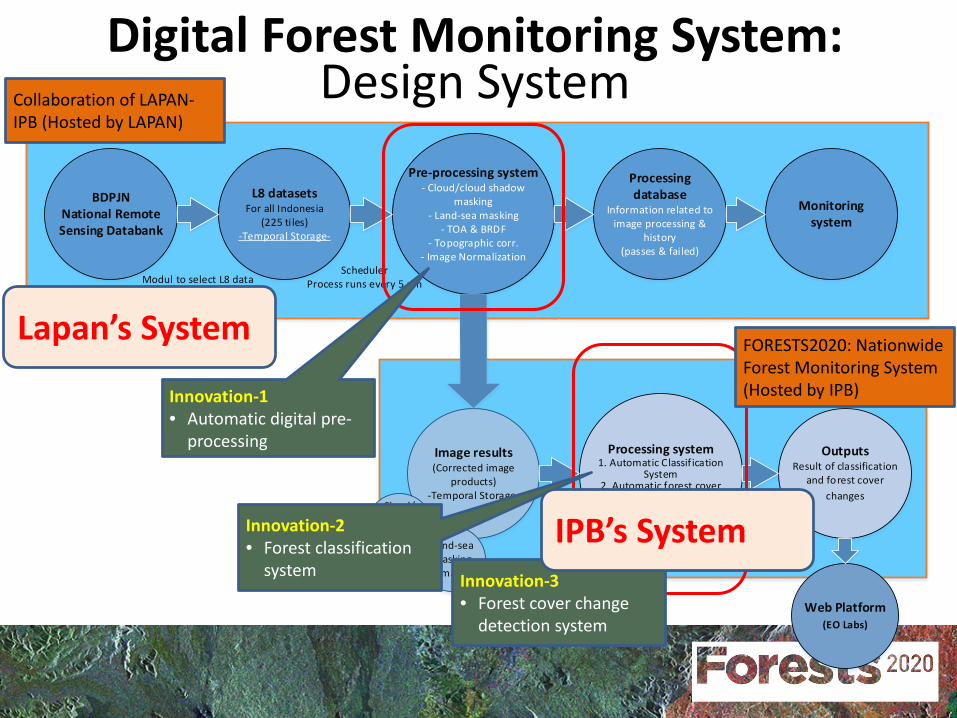
BDPJNNational Remote Sensing Databank
L8 datasetsFor all Indonesia
(225 ti les)-Temporal Storage-
Pre-processing system- Cloud/cloud shadow
masking- Land-sea masking
- TOA & BRDF- Topographic corr.
- Image Normalization
Processing database
Information related to image processing &
history(passes & failed)
Image results(Corrected image
products)-Temporal Storage-
Processing system1. Automatic Classification
System2. Automatic forest cover change detection System
Monitoring system
OutputsResult of classification
and forest cover changes
Web Platform(EO Labs)
Modul to select L8 data covers Indonesia area
- Real Time-
SchedulerProcess runs every 5 pm
Collaboration of IPB-LAPANHosted by LAPAN
FORESTS2020: Nationwide Forest Monitoring SystemHosted by IPB
Cloud/shadow masking image Land-sea
masking image
Digital Forest Monitoring System: Design System
Innovation-1• Automatic digital pre-
processing
Innovation-2• Forest classification
system Innovation-3• Forest cover change
detection system
Collaboration of LAPAN-IPB (Hosted by LAPAN)
FORESTS2020: Nationwide Forest Monitoring System (Hosted by IPB)
Lapan’s System
IPB’s System
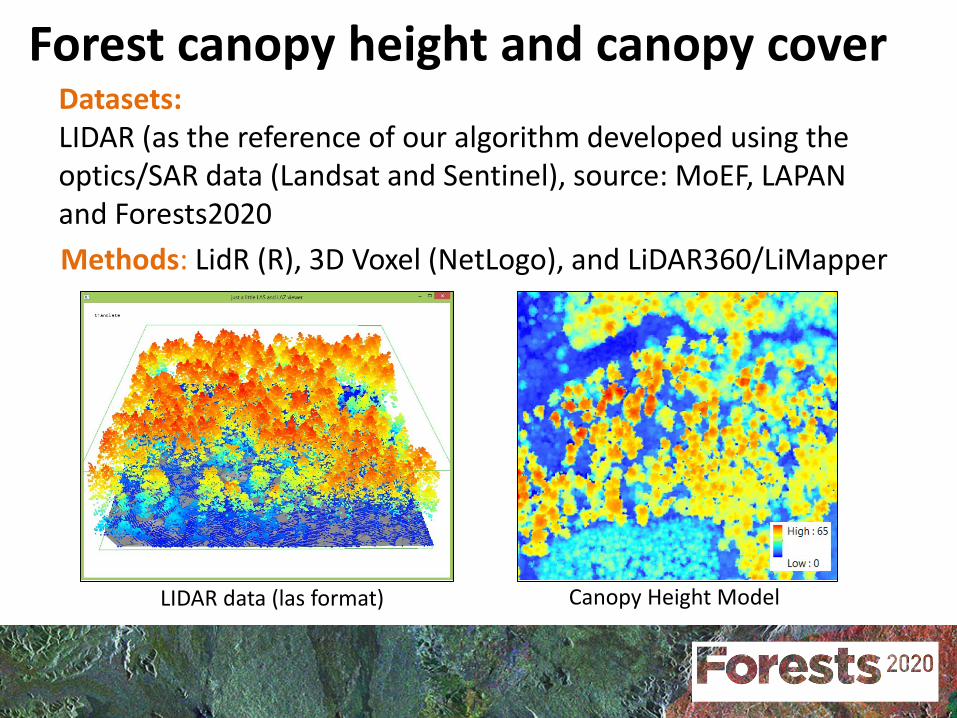
Forest canopy height and canopy coverDatasets: LIDAR (as the reference of our algorithm developed using the optics/SAR data (Landsat and Sentinel), source: MoEF, LAPAN and Forests2020 Methods: LidR (R), 3D Voxel (NetLogo), and LiDAR360/LiMapper
LIDAR data (las format) Canopy Height Model
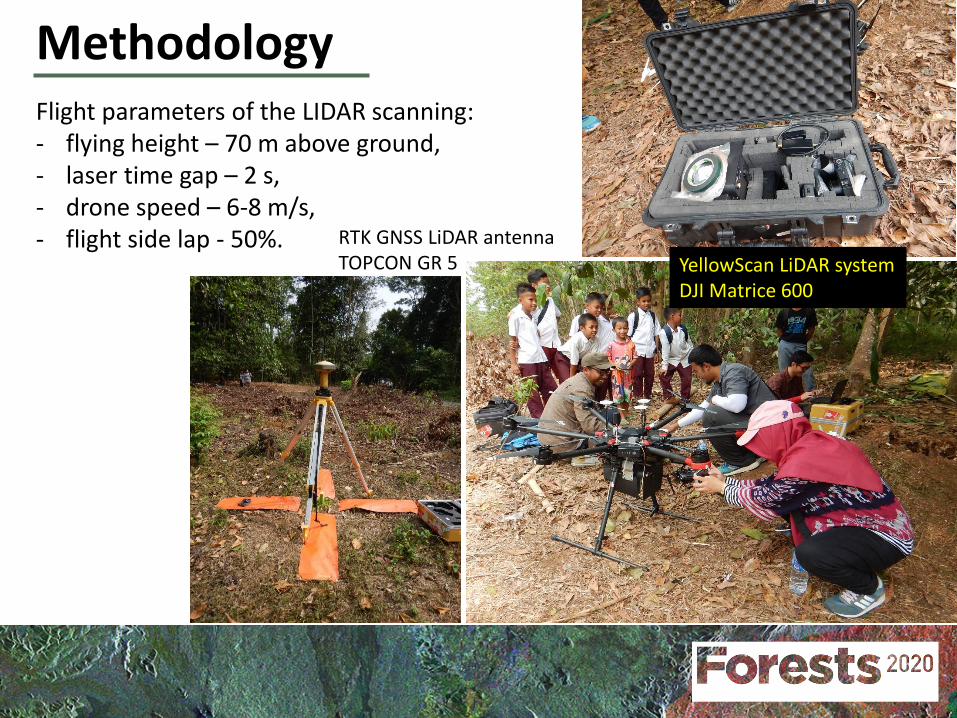
Flight parameters of the LIDAR scanning: - flying height – 70 m above ground, - laser time gap – 2 s, - drone speed – 6-8 m/s, - flight side lap - 50%. RTK GNSS LiDAR antenna
TOPCON GR 5 YellowScan LiDAR systemDJI Matrice 600
Methodology
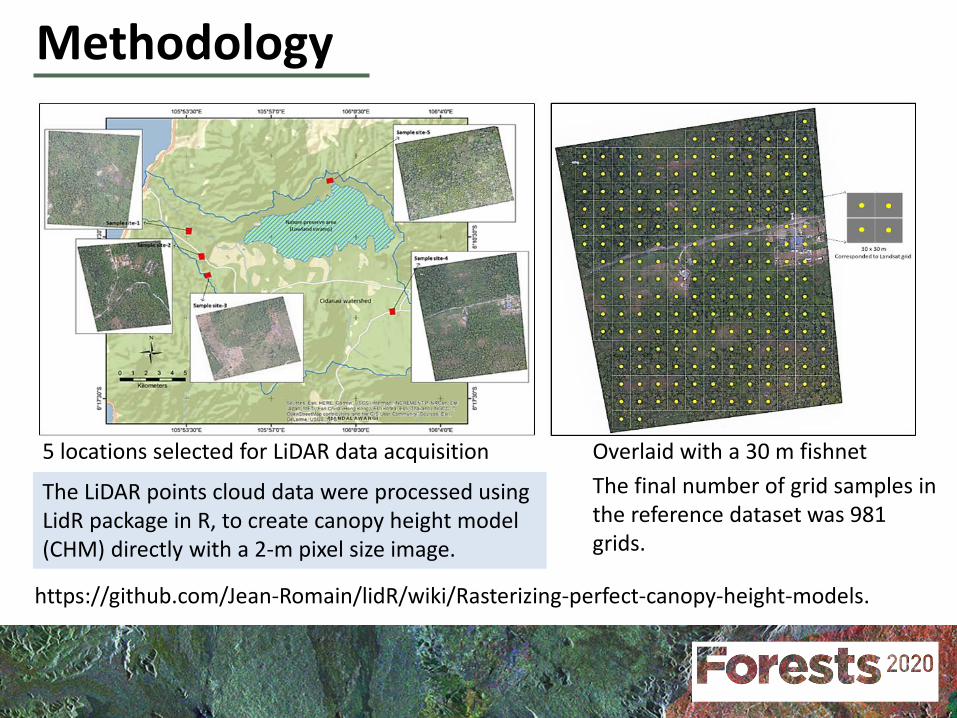
5 locations selected for LiDAR data acquisition Overlaid with a 30 m fishnet The final number of grid samples in the reference dataset was 981 grids.
The LiDAR points cloud data were processed using LidR package in R, to create canopy height model (CHM) directly with a 2-m pixel size image.
https://github.com/Jean-Romain/lidR/wiki/Rasterizing-perfect-canopy-height-models.
Methodology
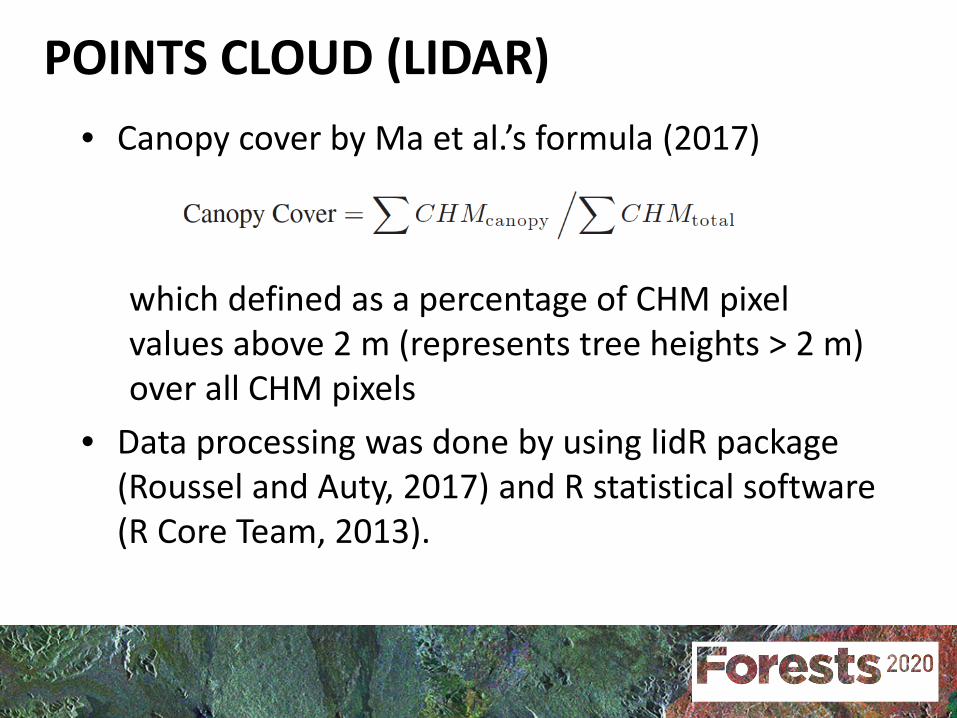
POINTS CLOUD (LIDAR)• Canopy cover by Ma et al.’s formula (2017)
which defined as a percentage of CHM pixel values above 2 m (represents tree heights > 2 m) over all CHM pixels
• Data processing was done by using lidR package (Roussel and Auty, 2017) and R statistical software (R Core Team, 2013).
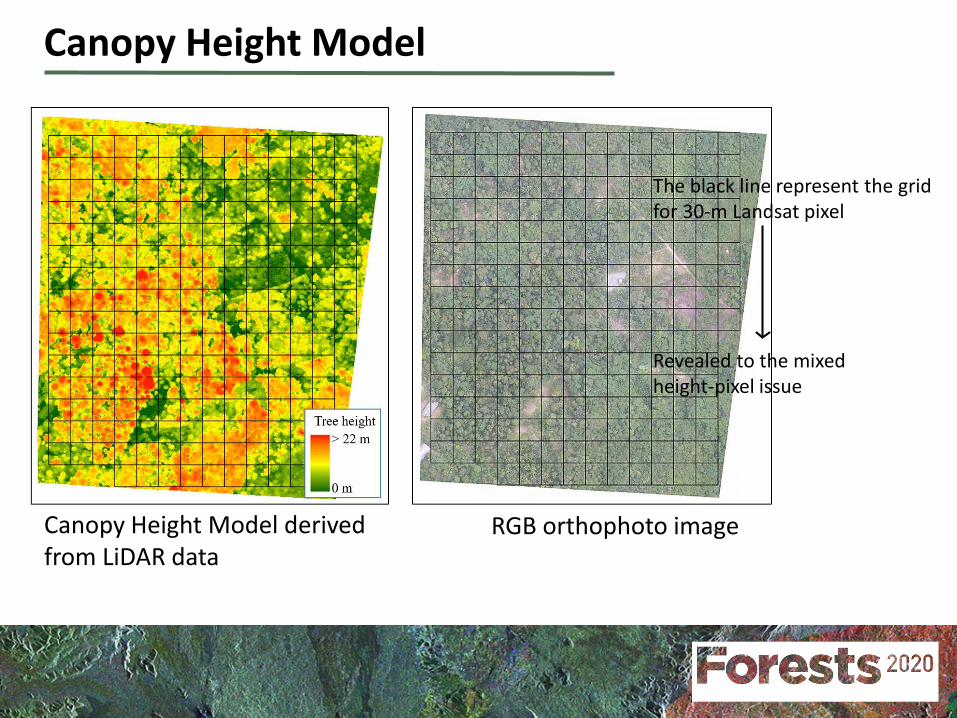
Canopy Height Model derived from LiDAR data
RGB orthophoto image
The black line represent the grid for 30-m Landsat pixel
Revealed to the mixed height-pixel issue
Canopy Height Model
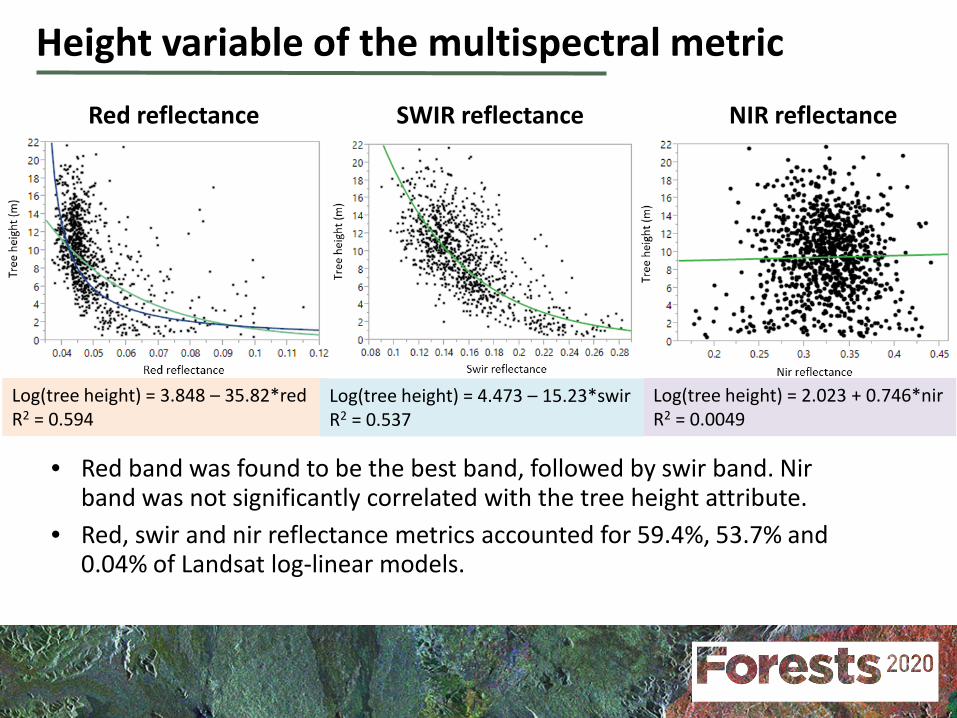
• Red band was found to be the best band, followed by swir band. Nirband was not significantly correlated with the tree height attribute.
• Red, swir and nir reflectance metrics accounted for 59.4%, 53.7% and 0.04% of Landsat log-linear models.
Red reflectance SWIR reflectance NIR reflectance
Log(tree height) = 3.848 – 35.82*redR2 = 0.594
Log(tree height) = 4.473 – 15.23*swirR2 = 0.537
Log(tree height) = 2.023 + 0.746*nirR2 = 0.0049
Height variable of the multispectral metric
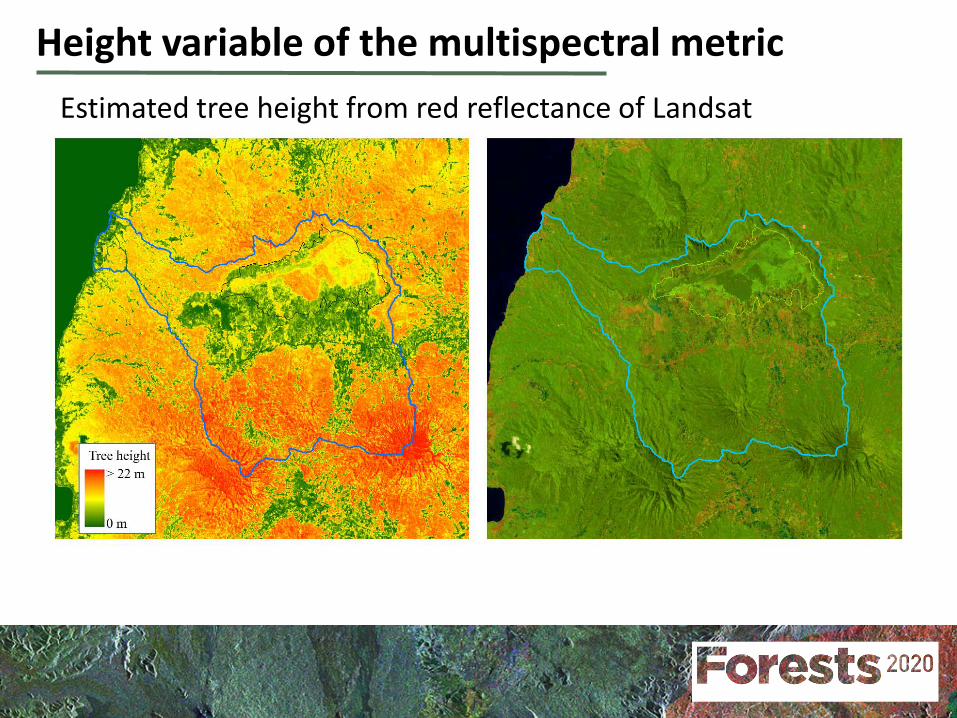
Estimated tree height from red reflectance of Landsat
Height variable of the multispectral metric
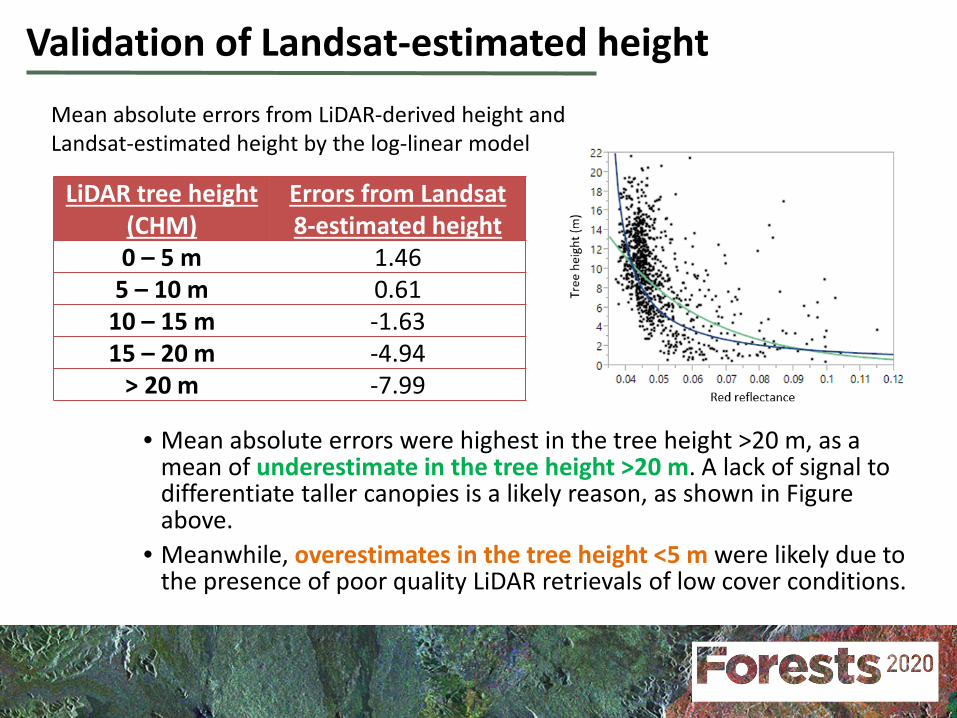
• Mean absolute errors were highest in the tree height >20 m, as a mean of underestimate in the tree height >20 m. A lack of signal to differentiate taller canopies is a likely reason, as shown in Figure above.
• Meanwhile, overestimates in the tree height <5 m were likely due to the presence of poor quality LiDAR retrievals of low cover conditions.
Mean absolute errors from LiDAR-derived height and Landsat-estimated height by the log-linear model
LiDAR tree height (CHM)
Errors from Landsat 8-estimated height
0 – 5 m 1.465 – 10 m 0.61
10 – 15 m -1.6315 – 20 m -4.94
> 20 m -7.99
Validation of Landsat-estimated height
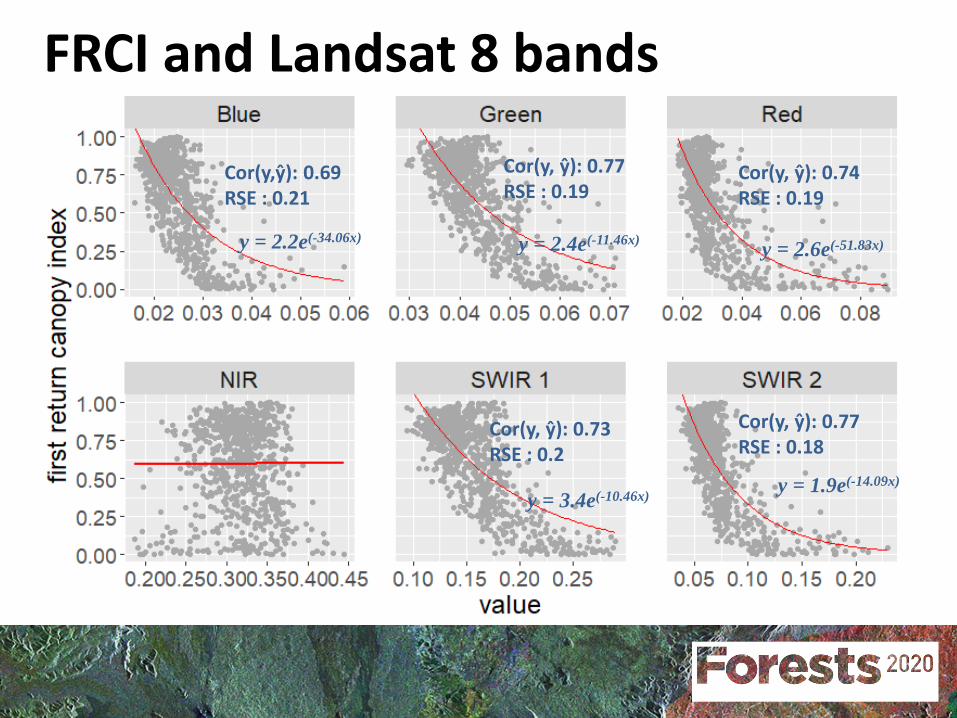
FRCI and Landsat 8 bands
Cor(y,ŷ): 0.69 RSE : 0.21
Cor(y, ŷ): 0.77RSE : 0.19
Cor(y, ŷ): 0.74RSE : 0.19
Cor(y, ŷ): 0.73RSE : 0.2
Cor(y, ŷ): 0.77RSE : 0.18
y = 2.2e(-34.06x) y = 2.4e(-11.46x) y = 2.6e(-51.83x)
y = 1.9e(-14.09x)y = 3.4e(-10.46x)
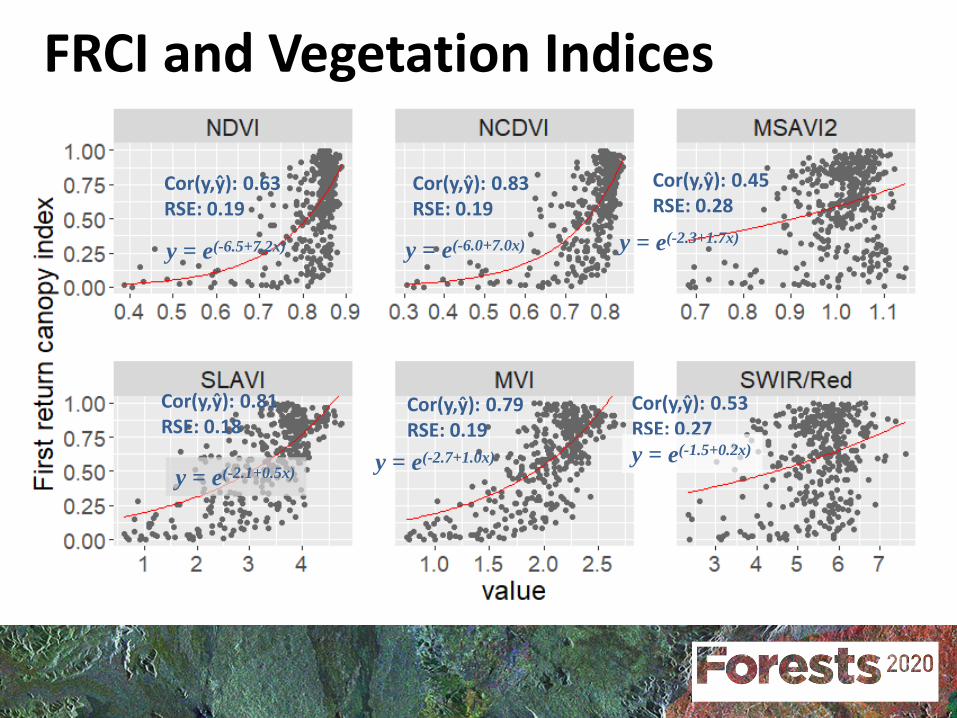
Cor(y,ŷ): 0.63RSE: 0.19
Cor(y,ŷ): 0.83RSE: 0.19
Cor(y,ŷ): 0.45RSE: 0.28
Cor(y,ŷ): 0.81RSE: 0.18
Cor(y,ŷ): 0.79RSE: 0.19
Cor(y,ŷ): 0.53RSE: 0.27
y = e(-6.5+7.2x) y = e(-6.0+7.0x) y = e(-2.3+1.7x)
y = e(-2.1+0.5x) y = e(-2.7+1.0x) y = e(-1.5+0.2x)
FRCI and Vegetation Indices
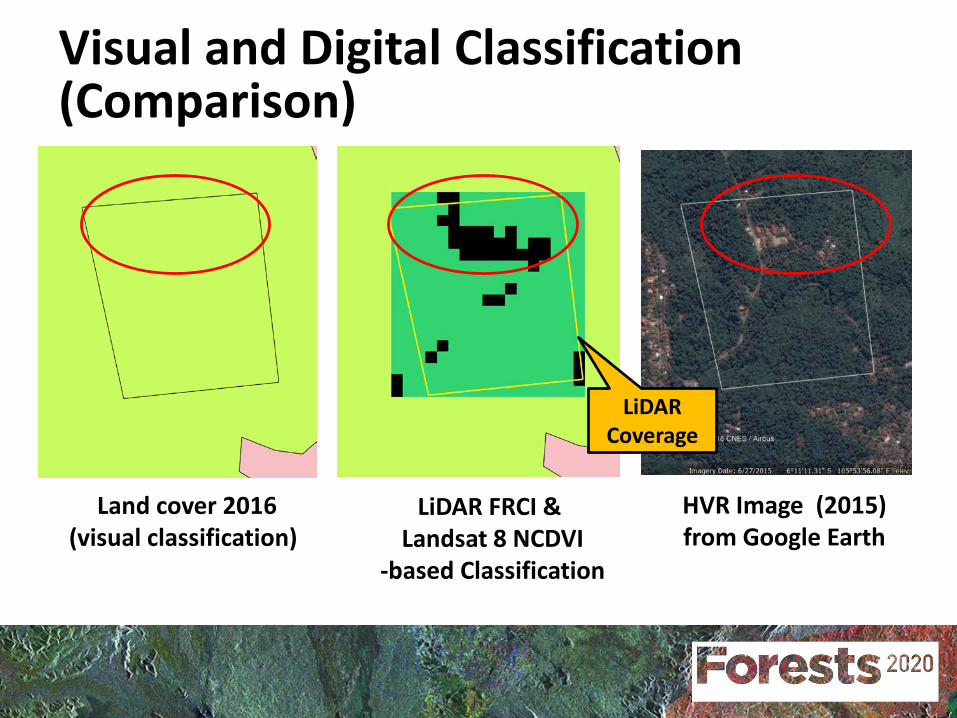
Visual and Digital Classification (Comparison)
Land cover 2016(visual classification)
LiDAR FRCI & Landsat 8 NCDVI
-based Classification
HVR Image (2015) from Google Earth
LiDAR Coverage
• To collect ground reference datasets• To test and evaluate the algorithm to other
ecosystem types (mangrove, swamp forests, peat swamp, lowland and mountainous forest ecosystems.
• To evaluate the algorithm at operational level (national-scale).
• To disaggregate forest classes (forest types and degradation levels)
Further works
Thank you very much Salamat
(Cidanau, Dec 2017)
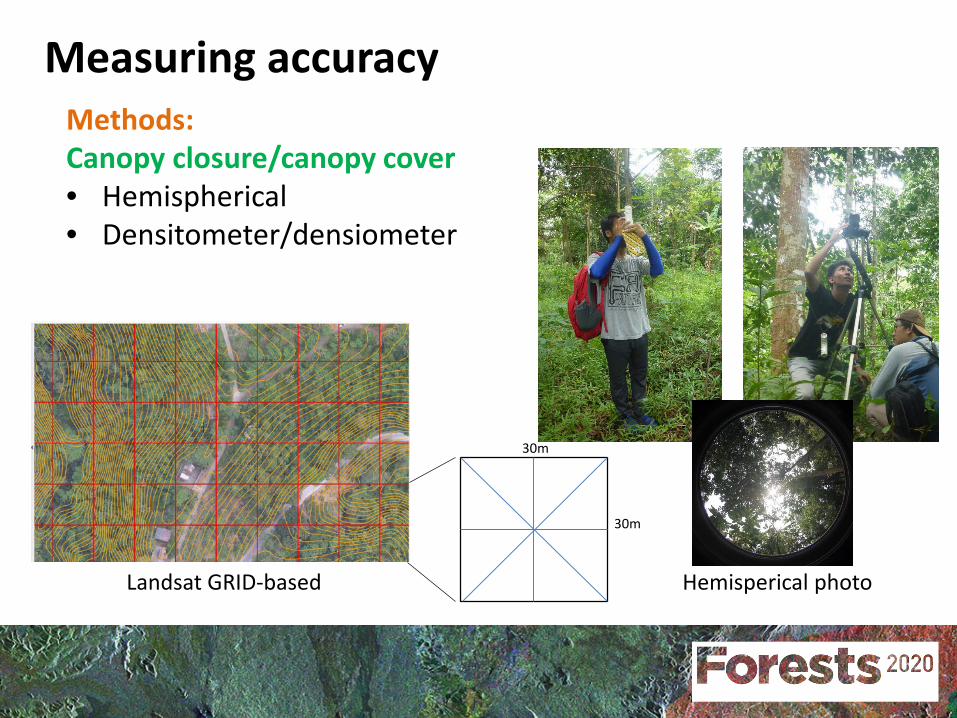
Measuring accuracyMethods:Canopy closure/canopy cover• Hemispherical• Densitometer/densiometer
Landsat GRID-based Hemisperical photo
30m
30m
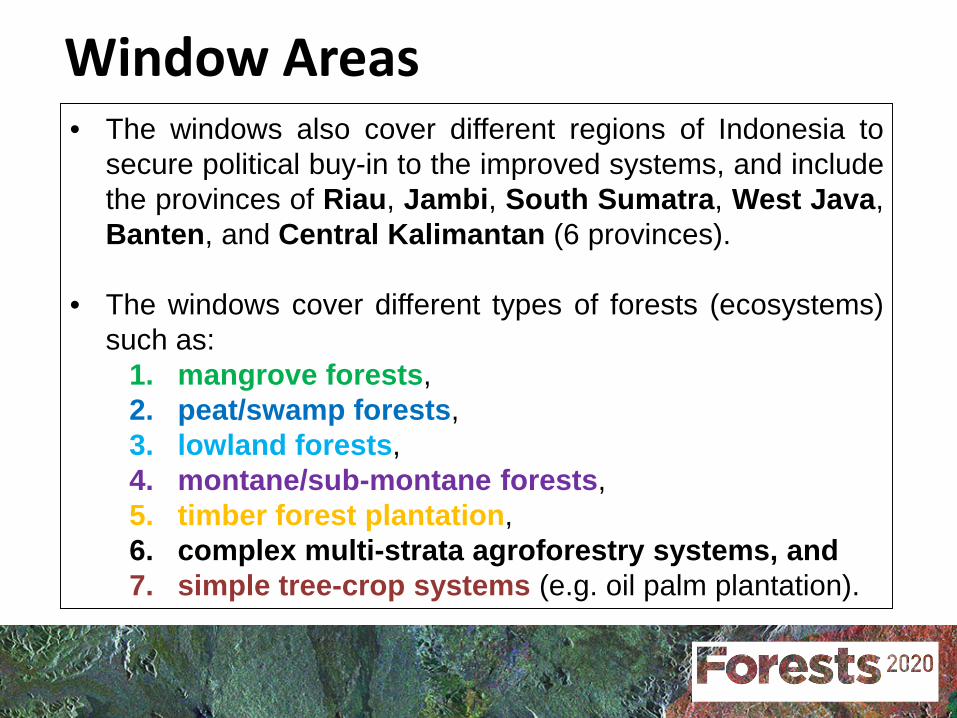
• The windows also cover different regions of Indonesia tosecure political buy-in to the improved systems, and includethe provinces of Riau, Jambi, South Sumatra, West Java,Banten, and Central Kalimantan (6 provinces).
• The windows cover different types of forests (ecosystems)such as:
1. mangrove forests,2. peat/swamp forests,3. lowland forests,4. montane/sub-montane forests,5. timber forest plantation,6. complex multi-strata agroforestry systems, and7. simple tree-crop systems (e.g. oil palm plantation).
Window Areas
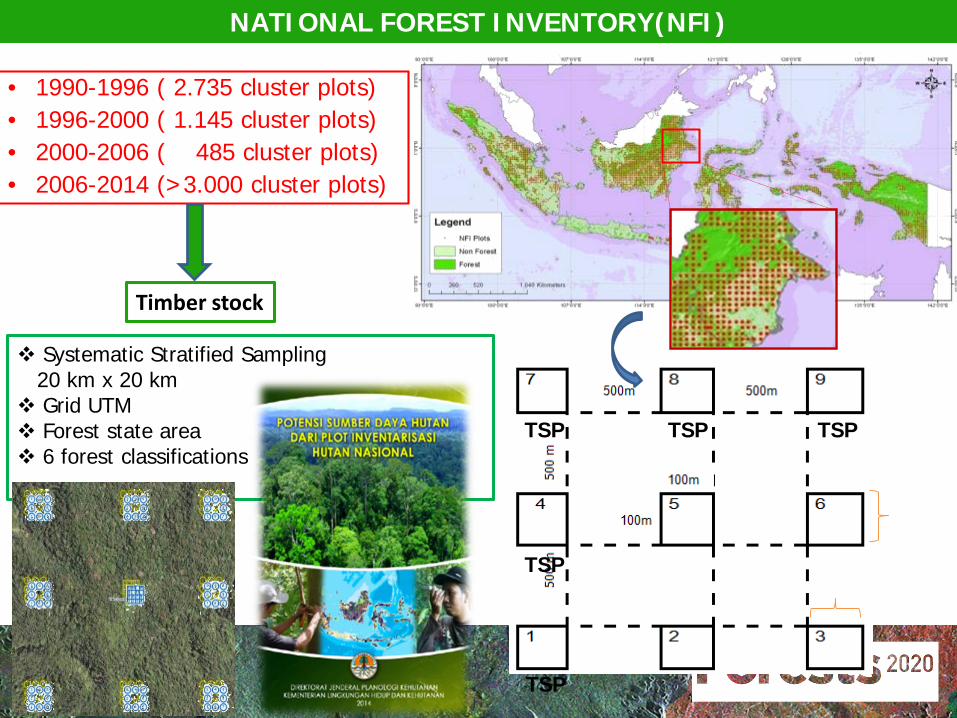
NATIONAL FOREST INVENTORY(NFI)
• 1990-1996 ( 2.735 cluster plots)• 1996-2000 ( 1.145 cluster plots)• 2000-2006 ( 485 cluster plots)• 2006-2014 (>3.000 cluster plots)
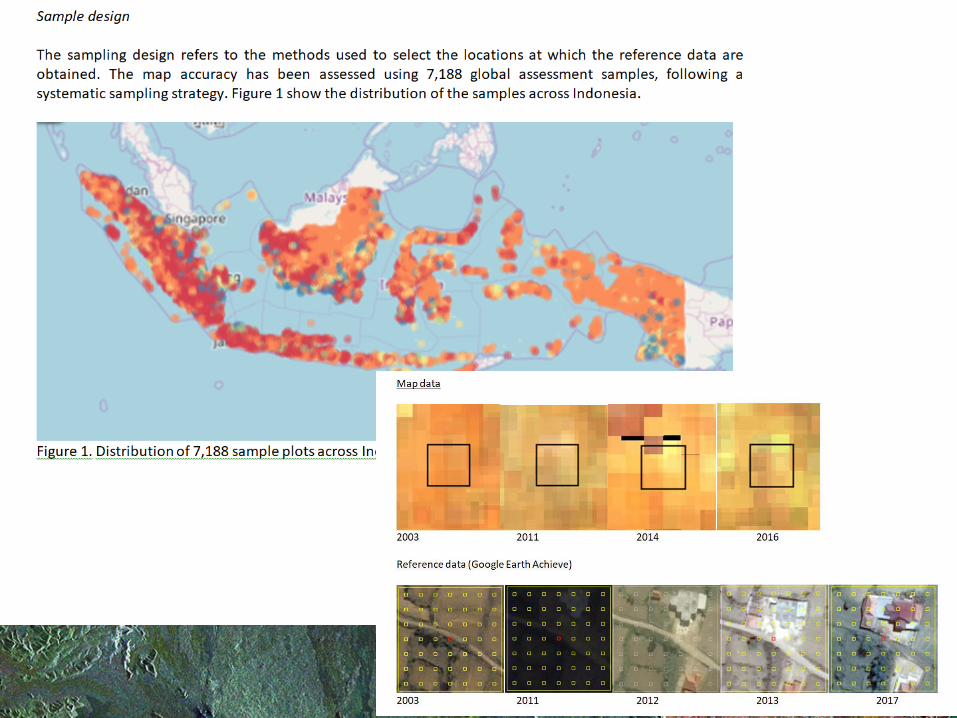
Systematic Stratified Sampling 20 km x 20 km
Grid UTM Forest state area 6 forest classifications
PSP
TSP
TSP TSP
TSP
TSPTSPTSP
TSP
Timber stock