Embed Size (px)
Citation preview
National Innovation Systemand Inequality:
Russia
Thiruvananthapuram, India, August 19-21 2009
Stanislav Zaichenko
2
Inequality patterns in Russia
•Historical trends
•Interpersonal inequality
•Interregional imbalances
•Inequality by social groups
3
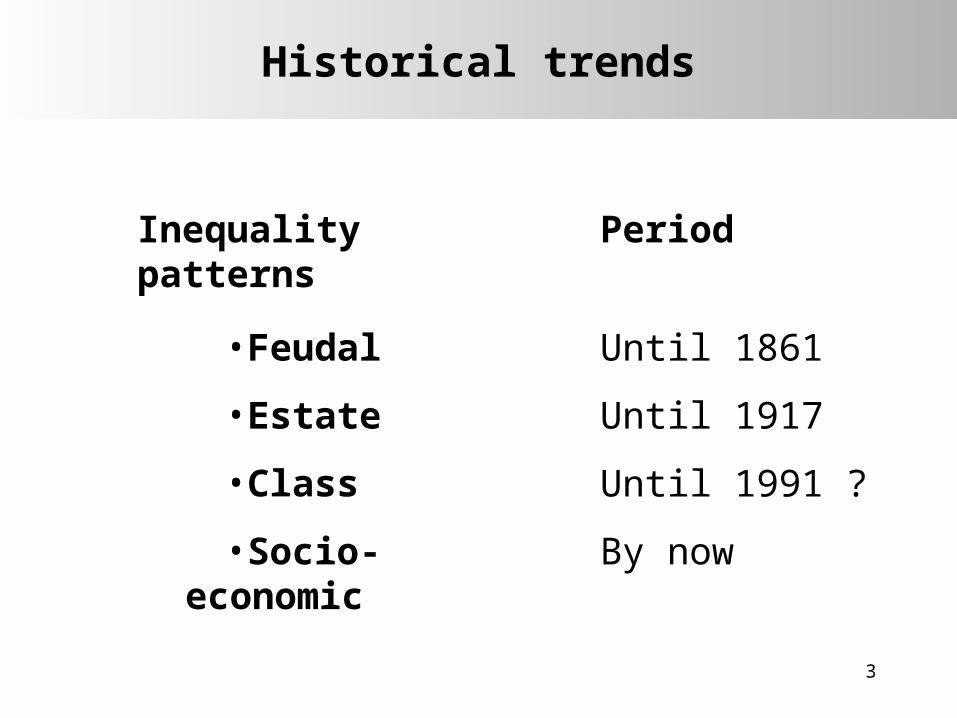
Historical trends
•Feudal
•Estate
•Class
•Socio-economic
Until 1861
Until 1917
Until 1991 ?
By now
Inequality patterns
Period
4
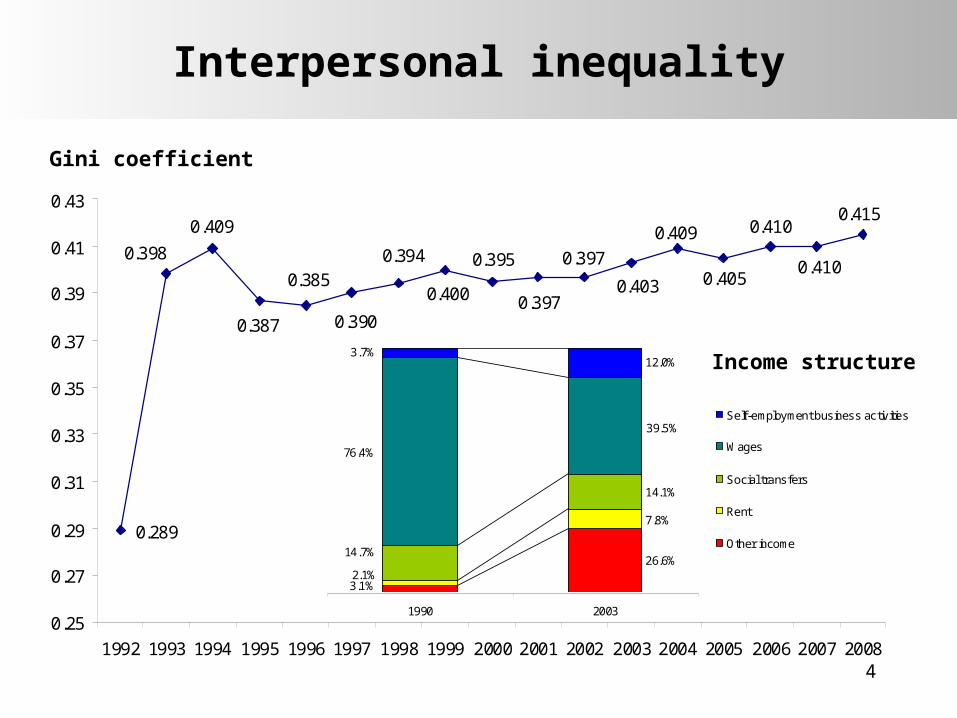
Interpersonal inequality
0.289
0.410
0.4150.410
0.405
0.409
0.403
0.397
0.397
0.395
0.400
0.394
0.390
0.385
0.387
0.409
0.398
0.25
0.27
0.29
0.31
0.33
0.35
0.37
0.39
0.41
0.43
1992 1993 1994 1995 1996 1997 1998 1999 2000 2001 2002 2003 2004 2005 2006 2007 2008
Gini coefficient
26.6%
3.1%
7.8%
2.1%
14.1%
14.7%
39.5%
76.4%
12.0%3.7%
1990 2003
Self-employment business activities
Wages
Social transfers
Rent
Other income
Income structure
5
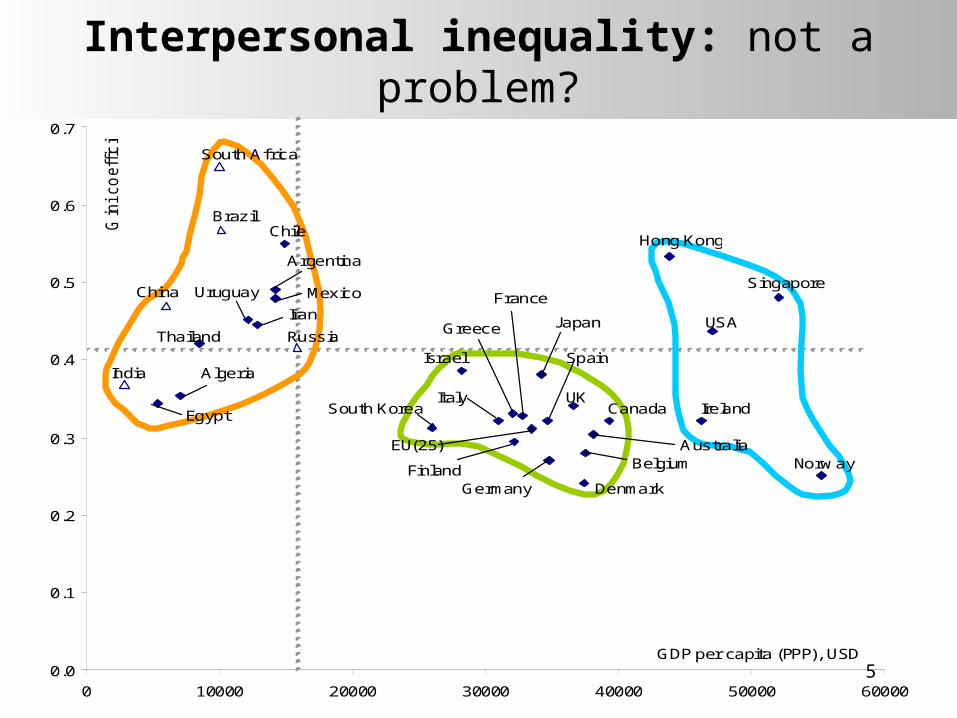
Interpersonal inequality: not a problem?
0.0
0.1
0.2
0.3
0.4
0.5
0.6
0.7
0 10000 20000 30000 40000 50000 60000
South Africa
Brazil
China
Russia
India
USA
CanadaUK
EU(25)
France
Gin
i co
eff
icie
nt
GDP per capita (PPP), USD
Germany
Belgium
Denmark
Italy
Spain
Greece
Mexico
Thailand
Singapore
Japan
Finland
AlgeriaIsrael
Iran
South Korea
Hong Kong
Australia
Argentina
Chile
Egypt
Uruguay
Norway
Ireland
6
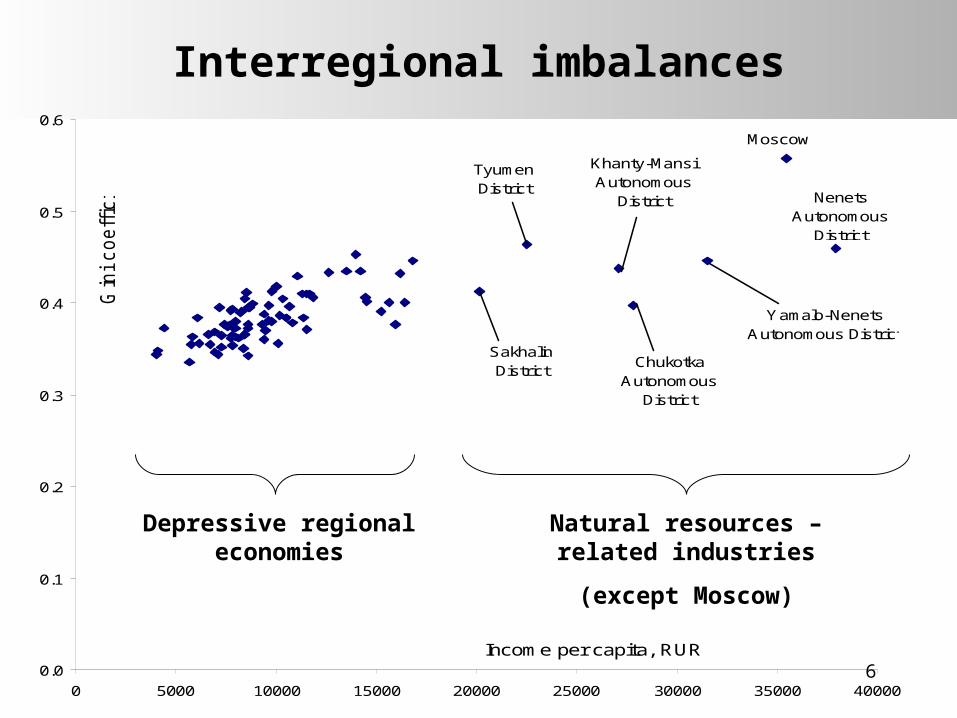
Interregional imbalances
0.0
0.1
0.2
0.3
0.4
0.5
0.6
0 5000 10000 15000 20000 25000 30000 35000 40000
Gin
i coeff
icie
nt
Income per capita, RUR
Moscow
Nenets Autonomous
District
Yamalo-Nenets Autonomous District
Chukotka Autonomous
District
Khanty-Mansi Autonomous
District
Tyumen District
Sakhalin District
Natural resources – related industries
(except Moscow)
Depressive regional economies
7
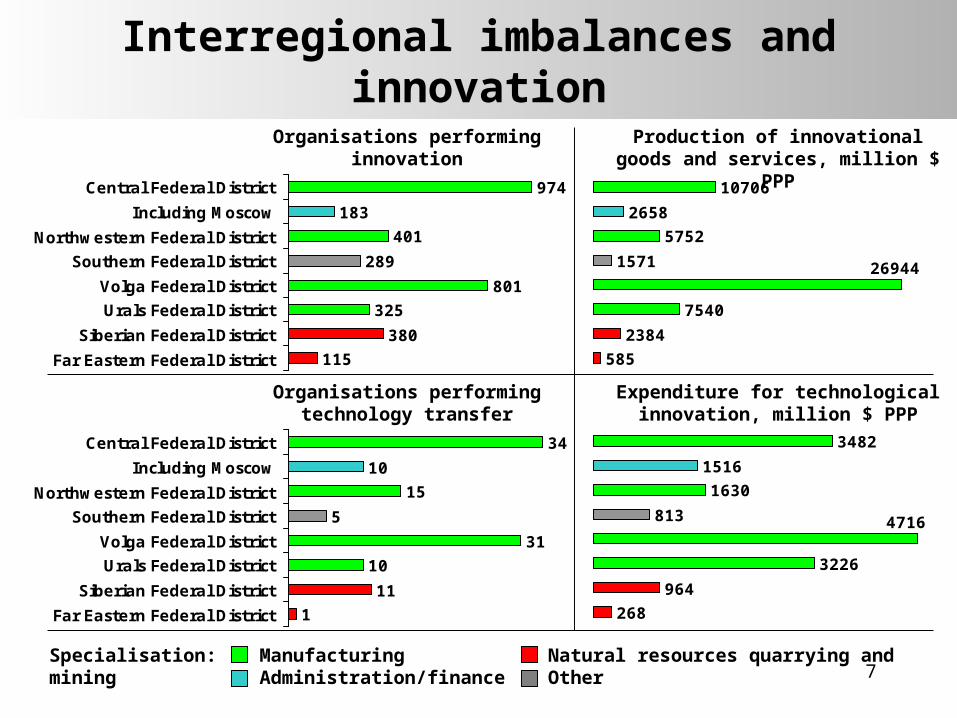
Interregional imbalances and innovation
974
183
401
289
801
325
380
115
Central Federal District
Including Moscow
Northwestern Federal District
Southern Federal District
Volga Federal District
Urals Federal District
Siberian Federal District
Far Eastern Federal District
34
10
15
5
31
10
11
1
Central Federal District
Including Moscow
Northwestern Federal District
Southern Federal District
Volga Federal District
Urals Federal District
Siberian Federal District
Far Eastern Federal District
10706
2658
5752
1571
7540
2384
585
26944
3482
1516
1630
813
3226
964
268
4716
Organisations performing innovation
Production of innovational goods and services, million $
PPP
Organisations performing technology transfer
Expenditure for technological innovation, million $ PPP
Specialisation: Manufacturing Natural resources quarrying and mining Administration/finance Other
8
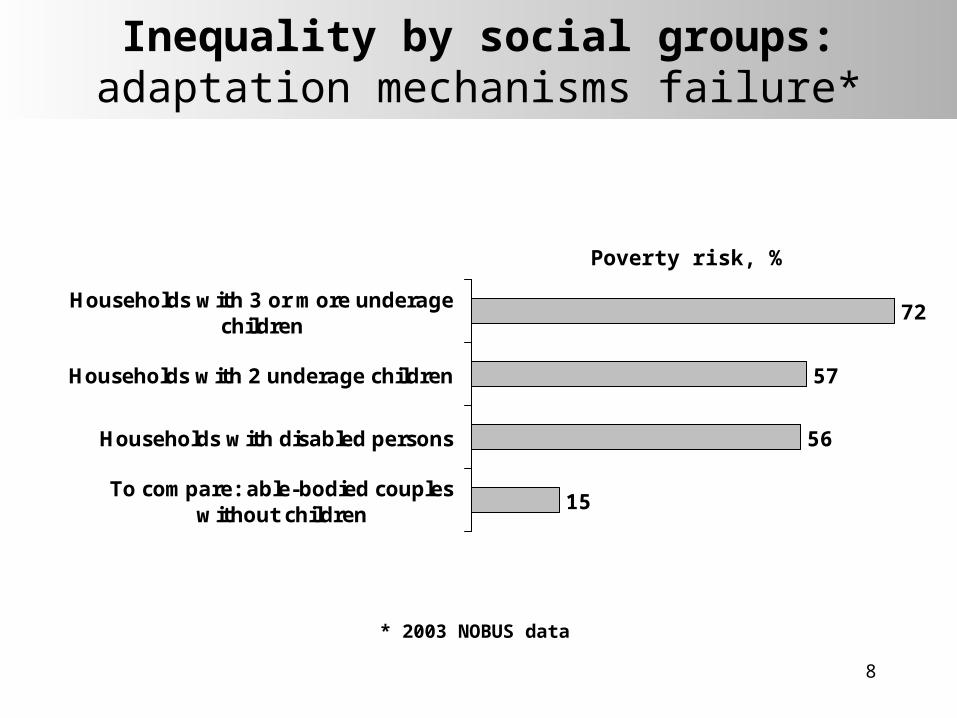
Inequality by social groups:adaptation mechanisms failure*
72
57
56
15
Households with 3 or more underagechildren
Households with 2 underage children
Households with disabled persons
To compare: able-bodied coupleswithout children
Poverty risk, %
* 2003 NOBUS data
9
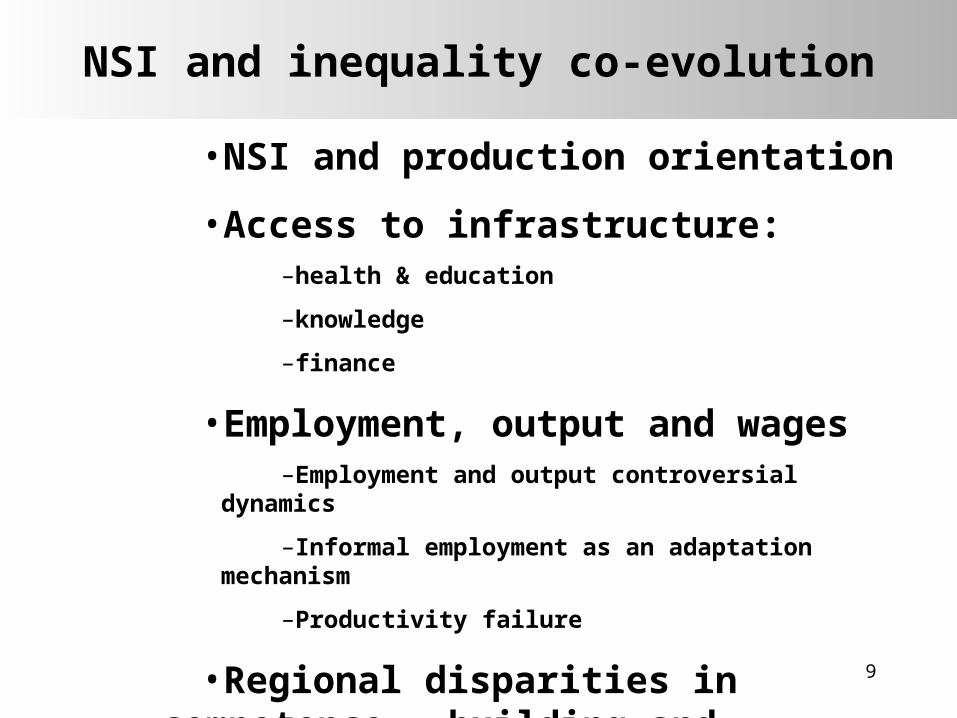
NSI and inequality co-evolution
•NSI and production orientation
•Access to infrastructure:–health & education
–knowledge
–finance
•Employment, output and wages–Employment and output controversial
dynamics
–Informal employment as an adaptation mechanism
–Productivity failure
•Regional disparities in competence building and production
10
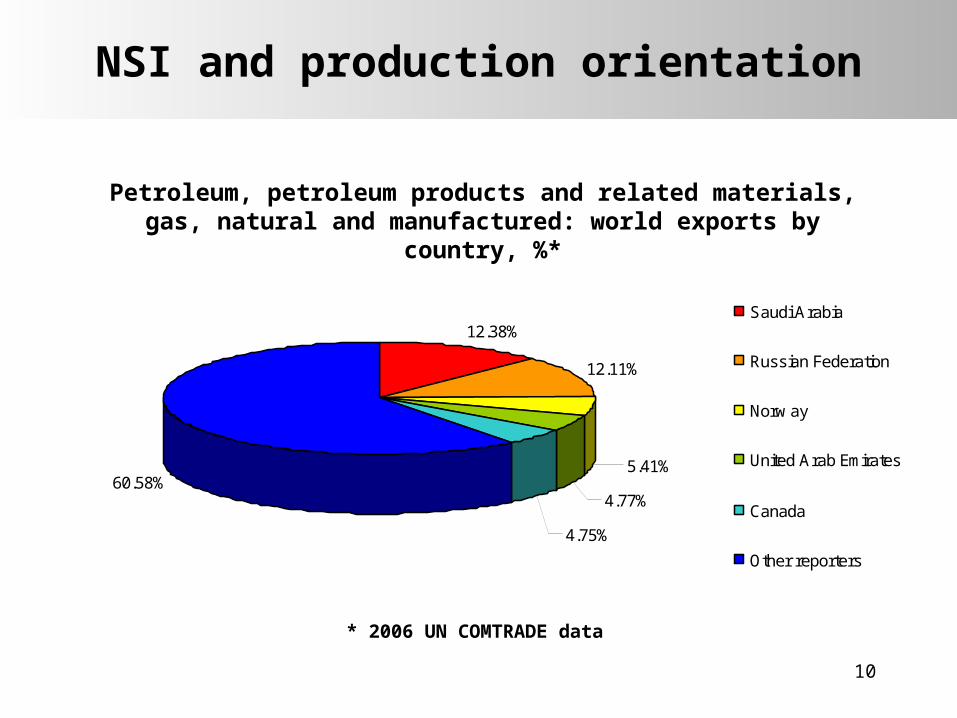
NSI and production orientation
12.38%
12.11%
5.41%
4.77%
4.75%
60.58%
Saudi Arabia
Russian Federation
Norw ay
United Arab Emirates
Canada
Other reporters
Petroleum, petroleum products and related materials, gas, natural and manufactured: world exports by
country, %*
* 2006 UN COMTRADE data
11
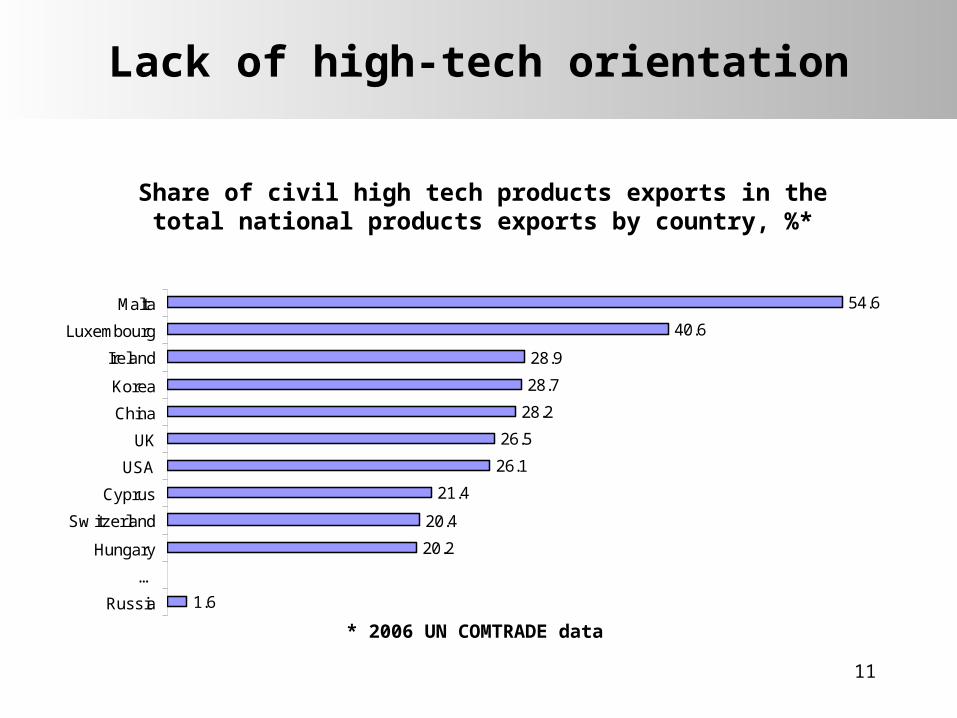
Lack of high-tech orientation
Share of civil high tech products exports in the total national products exports by country, %*
54.6
40.6
28.9
28.7
28.2
26.5
26.1
21.4
20.4
20.2
1.6
Malta
Luxembourg
Ireland
Korea
China
UK
USA
Cyprus
Sw itzerland
Hungary
…
Russia
* 2006 UN COMTRADE data
12
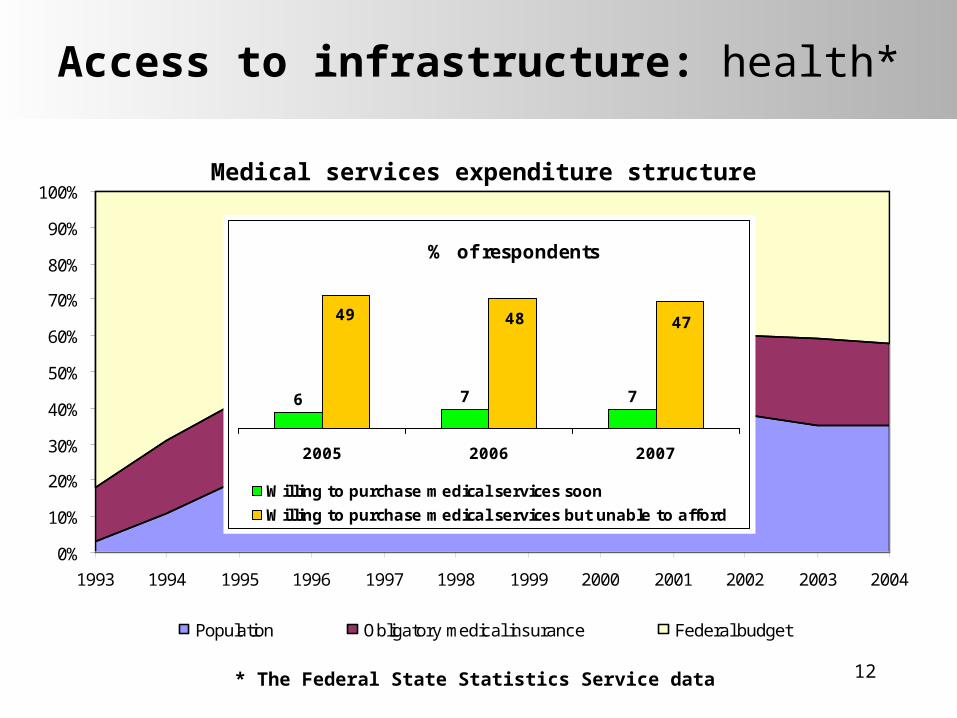
Access to infrastructure: health*
0%
10%
20%
30%
40%
50%
60%
70%
80%
90%
100%
1993 1994 1995 1996 1997 1998 1999 2000 2001 2002 2003 2004
Population Obligatory medical insurance Federal budget
Medical services expenditure structure
6 7 7
474849
2005 2006 2007
Willing to purchase medical services soon
Willing to purchase medical services but unable to afford
% of respondents
* The Federal State Statistics Service data

13
Access to infrastructure: education*
* The Federal State Statistics Service data
2.6
5.7
12.6
Secondary education
Professional education
Higher education
Monthly average expenditure for education services,% of average monthly household income
6 5 6
2325
27
2005 2006 2007
Willing to purchase educationservices soon
Willing to purchase educationservices but unable to afford
% of respondents

14
Access to infrastructure: knowledge
3.1
2.8
0.8
0.5
0.8
To do my job better
To advance vocational knowledge and skills
To earn more money
To change the nature of job
Other
Reasons for LLL (refresher courses), % of respondents
Attending LLL (refresher courses) total = 4.6%
56
23
18
3
Employer
Employment agency
Respondent
Other
Who paid for LLL (refresher courses)?, % of attending respondents
15
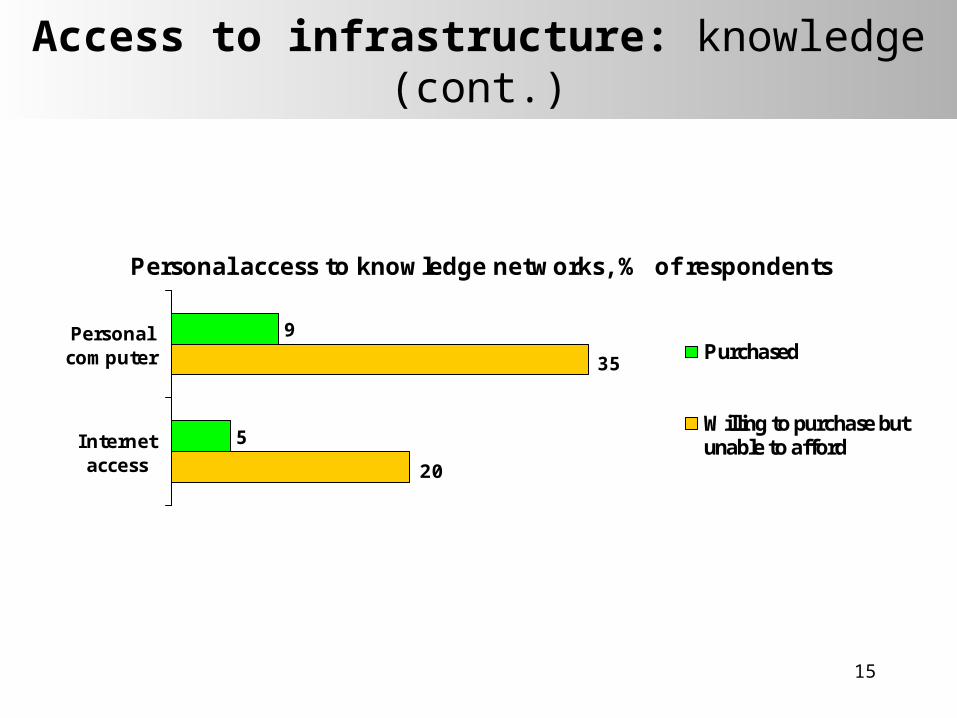
Access to infrastructure: knowledge (cont.)
9
5
20
35
Personalcomputer
Internetaccess
Purchased
Willing to purchase butunable to afford
Personal access to knowledge networks, % of respondents
16
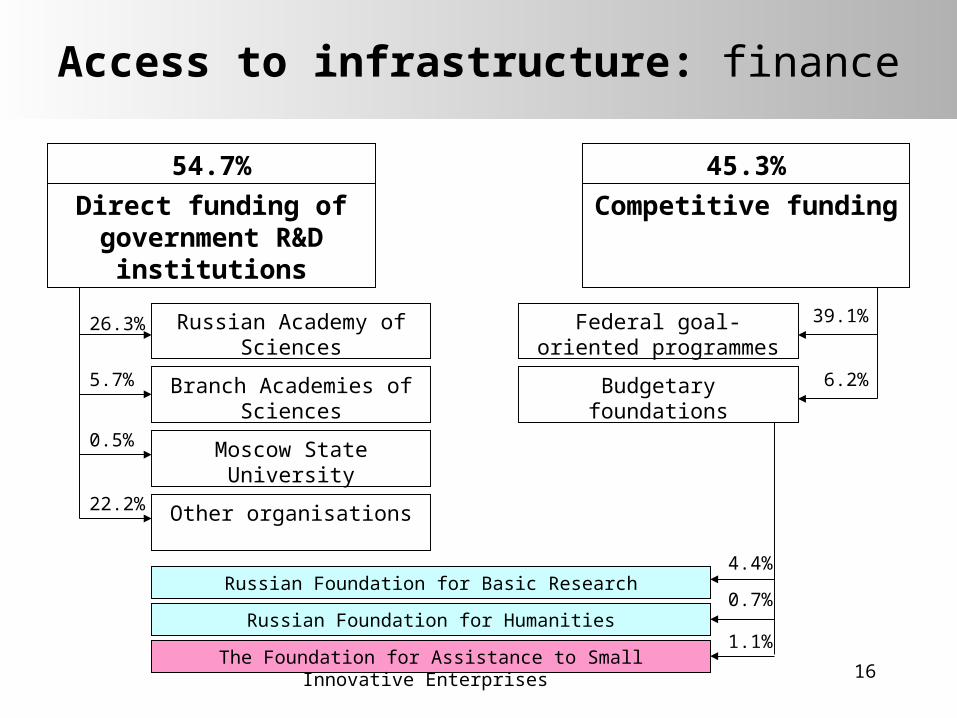
Access to infrastructure: finance
Russian Foundation for Basic Research
Russian Foundation for Humanities
The Foundation for Assistance to Small Innovative Enterprises
4.4%
0.7%
1.1%
Federal goal-oriented programmes
Budgetary foundations 6.2%
39.1%
Competitive funding
45.3%
Direct funding of government R&D
institutions
54.7%
Russian Academy of Sciences
Branch Academies of Sciences
26.3%
5.7%
Moscow State University
0.5%
Other organisations22.2%
17
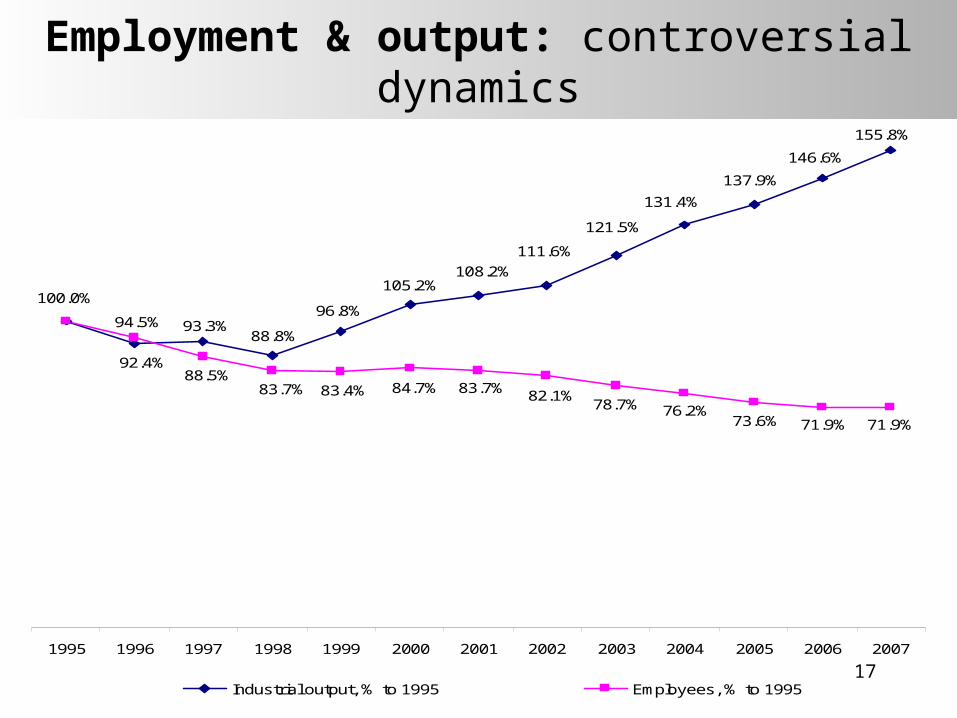
Employment & output: controversial dynamics
155.8%
146.6%
137.9%
131.4%
121.5%
111.6%
108.2%105.2%
96.8%
88.8%93.3%
92.4%
71.9%71.9%73.6%76.2%78.7%
82.1%83.7%84.7%83.4%83.7%88.5%
100.0%
94.5%
1995 1996 1997 1998 1999 2000 2001 2002 2003 2004 2005 2006 2007
Industrial output, % to 1995 Employees, % to 1995
18
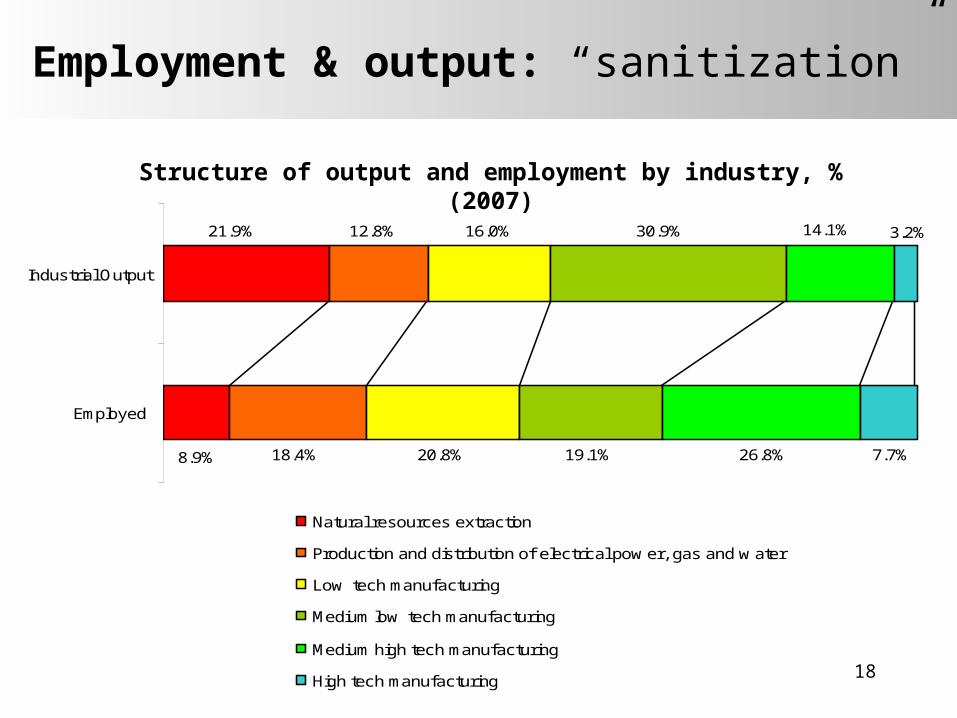
Employment & output: “sanitization”
21.9%
8.9%
12.8%
18.4%
16.0%
20.8%
30.9%
19.1%
14.1%
26.8%
3.2%
7.7%
Industrial Output
Employed
Natural resources extraction
Production and distribution of electrical pow er, gas and w ater
Low tech manufacturing
Medium low tech manufacturing
Medium high tech manufacturing
High tech manufacturing
Structure of output and employment by industry, % (2007)
19
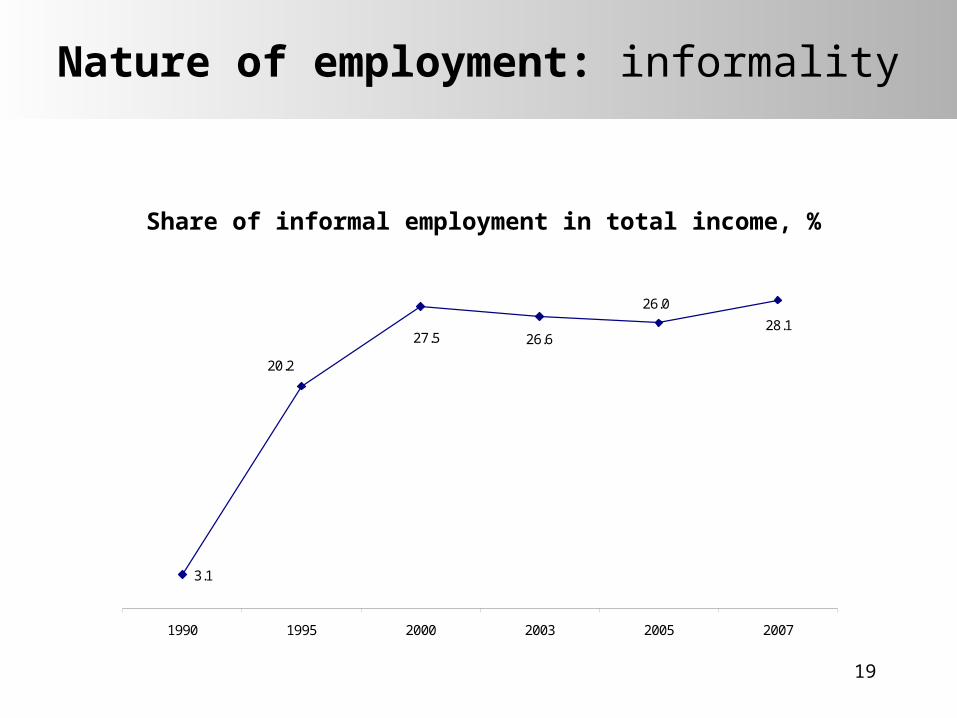
Nature of employment: informality
Share of informal employment in total income, %
3.1
28.1
26.0
26.627.5
20.2
1990 1995 2000 2003 2005 2007
20
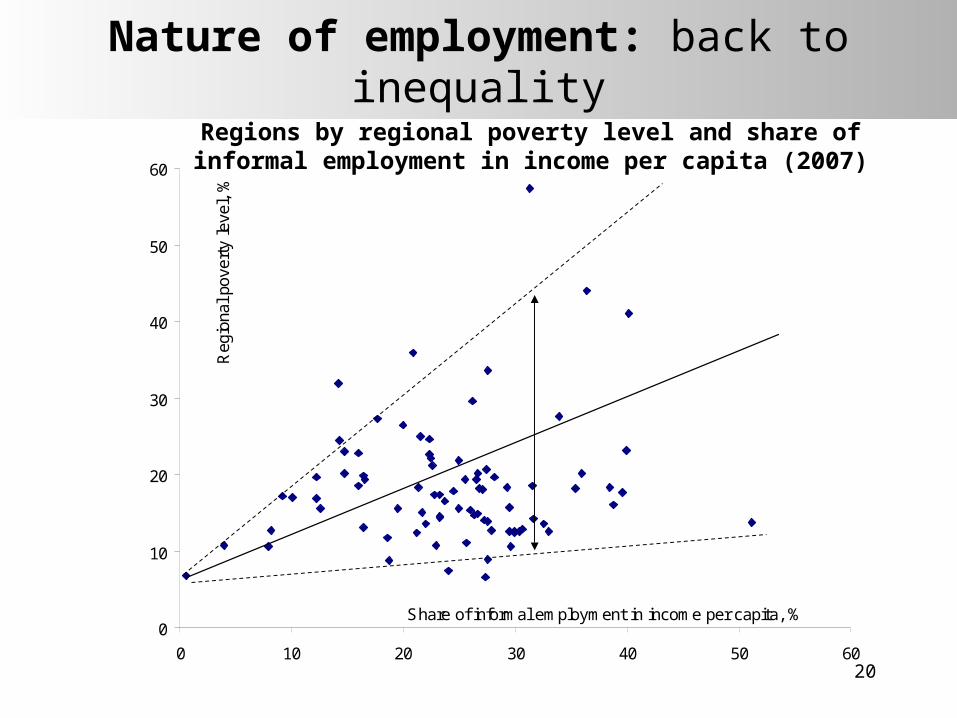
Nature of employment: back to inequality
Regions by regional poverty level and share of informal employment in income per capita (2007)
0
10
20
30
40
50
60
0 10 20 30 40 50 60
Reg
iona
l pov
erty
leve
l, %
Share of informal employment in income per capita, %
21
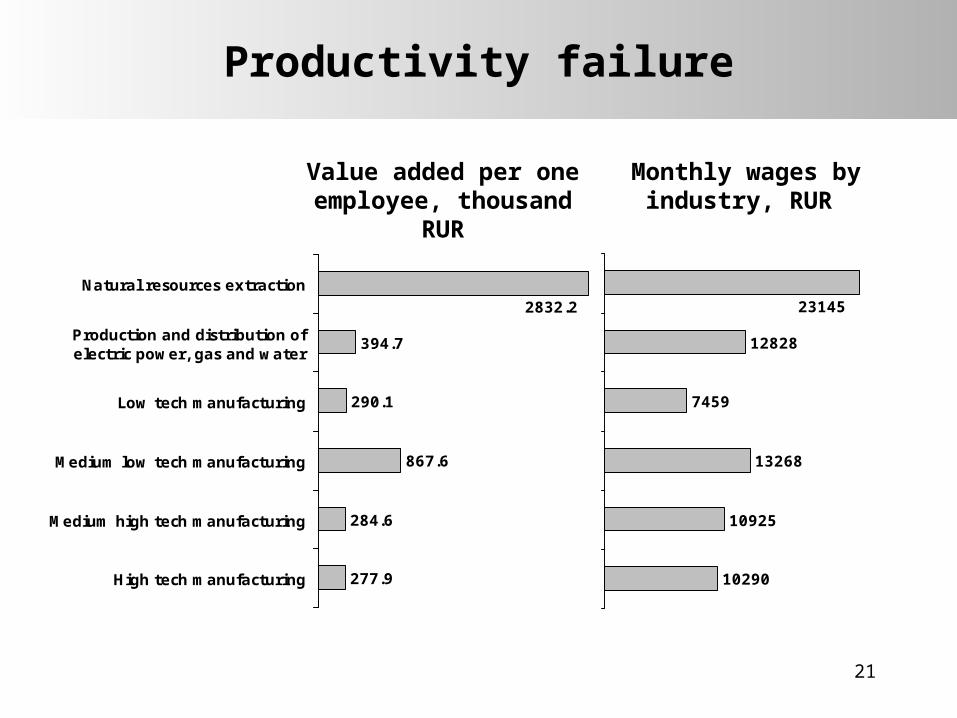
Productivity failure
Monthly wages by industry, RUR
394.7
290.1
867.6
284.6
277.9
2832.2Natural resources extraction
Production and distribution ofelectric power, gas and water
Low tech manufacturing
Medium low tech manufacturing
Medium high tech manufacturing
High tech manufacturing
7459
13268
10925
10290
12828
23145
Value added per one employee, thousand
RUR
22
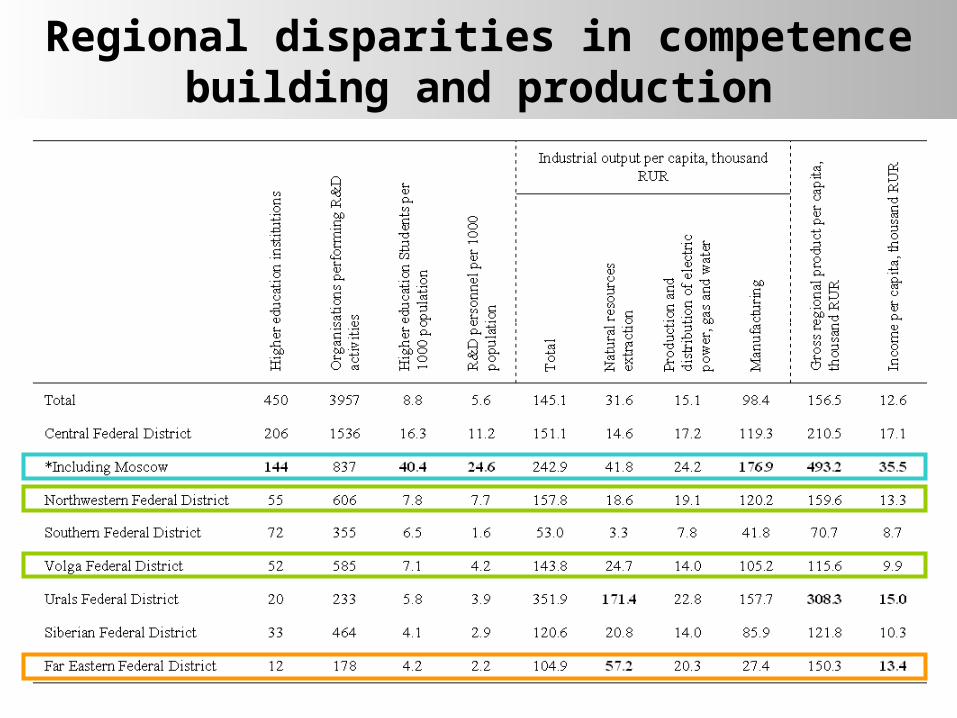
Regional disparities in competence building and production
23
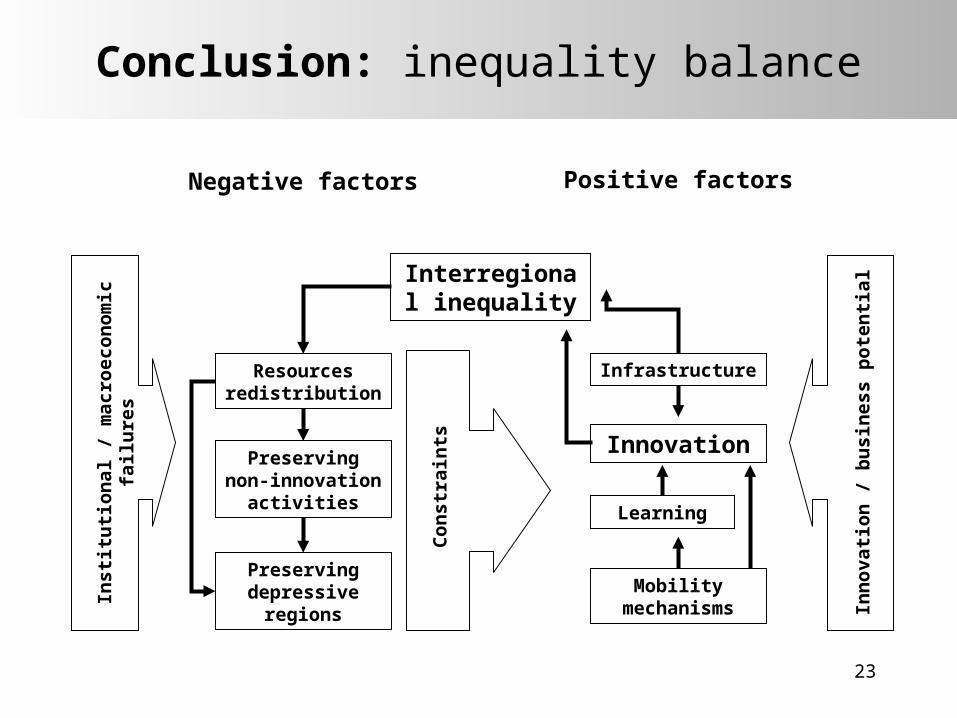
Conclusion: inequality balance
Interregional inequality
Resources redistribution
Preserving non-
innovation activities
Preserving depressive
regions
Innovation
Infrastructure
Learning
Mobility mechanisms
Negative factors Positive factors
Con
str
ain
ts
Insti
tuti
on
al /
macro
econ
om
ic
failu
res
Inn
ovati
on
/ b
usin
ess p
ote
nti
al
24
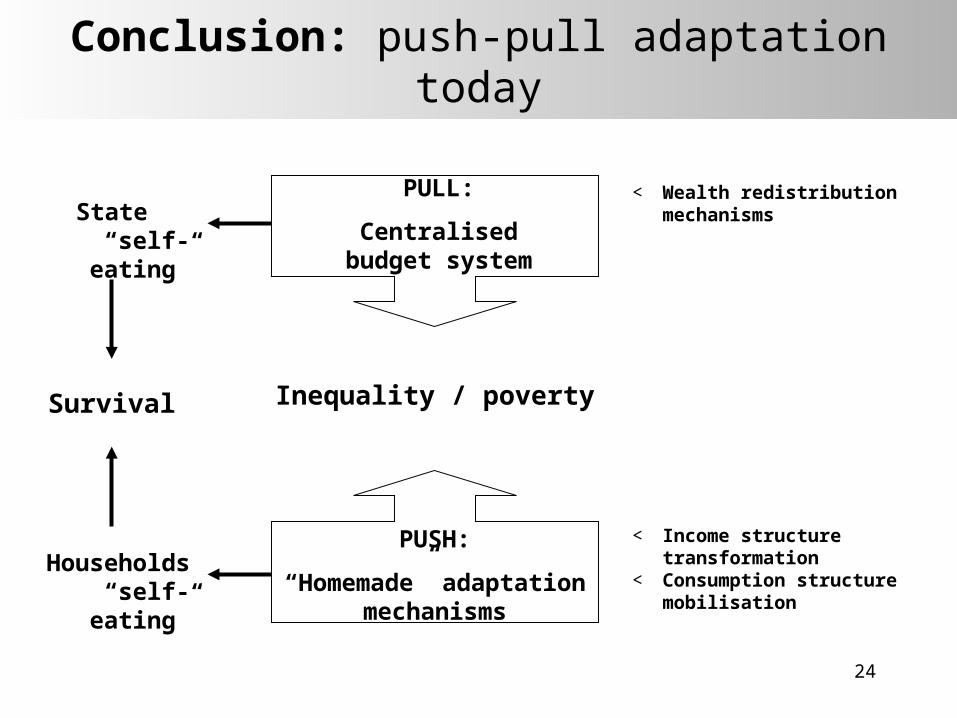
Conclusion: push-pull adaptation today
PUSH:
“Homemade” adaptation
mechanisms
PULL:
Centralised budget system
Inequality / poverty
Households
“self-eating”
State“self-
eating”
Survival
< Income structure transformation
< Consumption structure mobilisation
< Wealth redistribution mechanisms
25
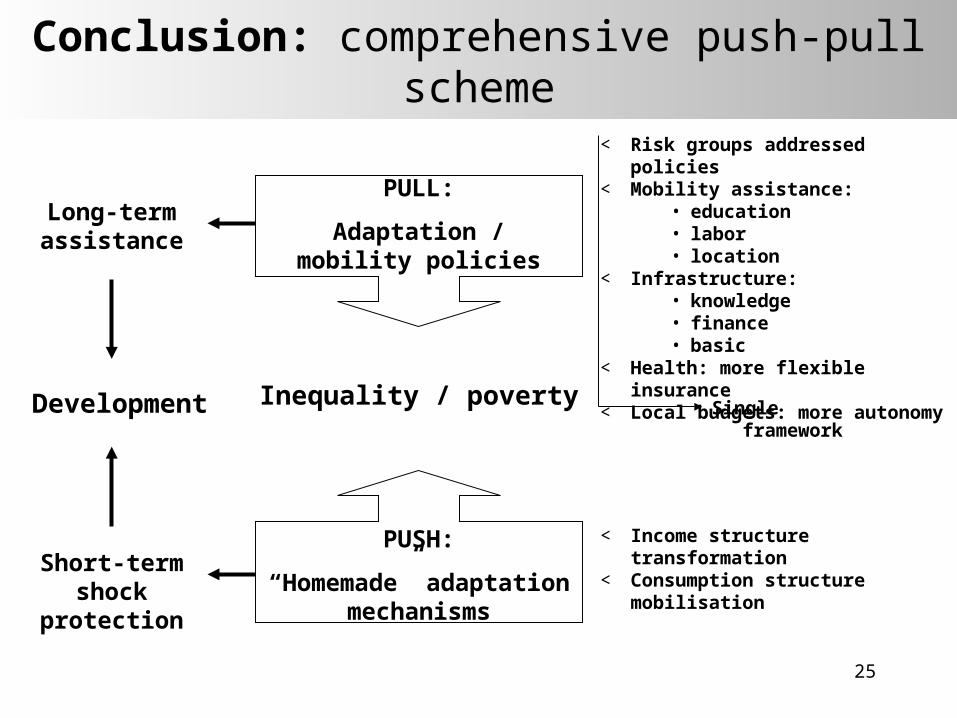
Conclusion: comprehensive push-pull scheme
PUSH:
“Homemade” adaptation
mechanisms
PULL:
Adaptation / mobility policies
Inequality / poverty
Short-termshock
protection
Long-termassistance
Development
< Income structure transformation
< Consumption structure mobilisation
< Risk groups addressed policies
< Mobility assistance:• education• labor• location
< Infrastructure:• knowledge• finance• basic
< Health: more flexible insurance
< Local budgets: more autonomy
Single framework