Embed Size (px)
Citation preview
1
National School Lunch Program Menus: A Moral Hazard Problem
Kristen Capogrossi1 and Wen You
2
Selected Paper prepared for presentation at the Agricultural & Applied Economics Association’s 2013 AAEA & CAES Joint Annual Meeting, Washington,
DC, August 4-6, 2013. Copyright 2013 by Kristen Capogrossi and Wen You. All rights reserved. Readers may make verbatim copies of this document for non-commercial purposes by any means, provided this copyright notice appears on all such copies.
1 Economist at Christensen Associates, Email: [email protected]; Voice: (608)231-2266
2 Assistant Professor at Virginia Tech, Email: [email protected]
2
I. Introduction
Newspaper headlines read “Senate Saves the Potato on School Lunch Menus” (Pear 2011)
and “Putting Nutrition at the Head of the School Lunch Line” (Alderman 2010) as the National
School Lunch Program garners more media attention regarding the nutritional content of school
meals. Decisions are made daily concerning many facets of the school meal programs at the
federal, state and local levels, but how are decisions made with regard to the actual choice of
foods on school lunch menus?
The National School Lunch Program (NSLP) is a federally assisted school meal program
operating in public and nonprofit private schools to provide nutritionally balanced, low-cost or
free meals to children. As of 2009-2010, the program covered over 101,000 schools with over
31.7 million children participating each day and costing $10.8 billion in FY 2010 (USDA
2010). According to a report published by the Economic Research Service in 2008, a balancing
act of three different objectives determines the success of the NSLP: “serving a nutritious meal,
getting children to purchase and eat the meal, and doing it all on a limited budget”. However,
in a 2007 School Lunch Report Card, the Physicians Committee for Responsible Medicine
found that 80% of schools do not meet USDA nutrition requirements for school meals (PCRM
2008).
Other research finds that NSLP participation is associated with higher proportions of
food energy coming from fat and saturated fat as well as higher than recommended amounts of
sodium (Burghardt, Gordon and Fraker 1995; Gordon, Devaney and Burghardt 1995).
Specifically, the third School Nutrition Dietary Assessment Study (SNDA-III) finds that as of
2004/2005 80% of schools failed to meet the guidelines for total fat in an average lunch, and
3
70% of schools serve meals with more than 10% of calories coming from saturated fats.
Further research finds that NSLP participants consume more calories on average from low-
nutrient, energy-dense solid foods such as pizza compared to nonparticipants (Briefel, Wilson
and Gleason 2009; Cole and Fox 2008; Gordon et al. 2007), while other studies conclude that
NSLP contributes to better nutrient intake of certain vitamins and minerals among participants
(e.g., Bhattacharya, Currie and Haider 2006; Gleason and Suitor 2003; Kennedy and Davis
1998). Taking this research a step further, a handful of studies have analyzed the impact of
current program participation on child weight with mixed results (Millimet, Tchernis and
Husain 2010; Schanzenbach 2009; Gunderson, Kreider and Pepper 2009). In order to change
the nutritional quality of school meals, research needs to be conducted on the decision-making
process regarding school lunch menus.
School Food Authorities (SFAs) are administrative bodies governed above the school
level (usually aligned with school districts) providing food services to schools. They are
responsible for contracting with companies that provide foods to schools (including vending
machines and fast food establishments as well as foods offered through the school meal
programs), establishing meal program menus and ensuring that meals meet federal nutrition
requirements among other responsibilities. They also receive reimbursements and agricultural
commodities for school meals from the federal government. Currently, SFAs must meet
nutrition requirements of the 1995 School Meals Initiative (SMI) through one of five meal
planning systems and must demonstrate that lunches meet nutrition standards for specific
age/grade groupings averaged over each school week. These five meal planning systems
include: Nutrient Standard Menu Planning, Assisted Nutrient Standard Menu Planning,
Enhanced Food Based Menu Planning, Traditional Meal Pattern, and any other reasonable
4
approach. The SMI regulations require that schools are evaluated on a weighted analysis of the
nutrient content of their lunch menus over a typical school week.3
Implementation of nutrition standards is monitored through an audit of each SFA at least
once every five years. Detailed information on the expected number of meals served, the actual
number of meals served, and portion sizes for each of the grade groupings served within a
school are reported. In addition, SFAs are required to provide a school food authority profile, a
record of weekly milk usage, menus for the week being reviewed, standardized recipes,
production records, nutrition facts labels on purchased products, and a meal component
worksheet. If an SFA fails to meet standards, it is required to develop improvement plans for
meeting SMI goals with technical assistance from the Education Service Center Program
Specialist. According to The School Meals Initiative Implementation Study Third Year Report
(SMIIS III), 62% of SFAs that underwent compliance review in 1998/1999 required
improvement plans; however, the proportion of SFAs devising improvement plans varied
extensively among states suggesting an absence of consistency in upholding the standards.
Another repercussion for failing to meet standards is that reimbursement payments for meals
can be eliminated. However, if it is believed that the SFA is trying to abide by SMI nutrition
requirements, reimbursements are not affected.4
While accountability measures are in place to satisfy the SMI, the penalty for failing to
comply is negligible: this is a disincentive for providing more costly meals that meet nutrition
requirements. In addition, sizable implementation costs are another disincentive. The Federal
Register (2011) estimates that the SMI requirements will increase food costs by $3.4 billion
from FY 2012 through FY 2016. Furthermore, once the 100 percent whole grain requirement
3 Nutrients are weighted by the proportion of students who select the food item.
4 I could not find data on whether reimbursement payments had been withheld from any schools
5
takes effect, the increase in food costs is estimated at $1 billion annually. Because healthier
foods require more on-site preparation, labor costs are also expected to increase by
approximately the same amount as food costs. Therefore, the Federal Register estimates that
total costs of SMI implementation may increase by $6.8 billion through FY 2016. This is
equivalent to about 14 cents for each reimbursable school lunch. The entirety of these costs is
incurred by local and state agencies that contribute to school food service accounts.
No study that we are aware of examines the incentives and barriers among the SFAs
decision-making process with regard to the provision of healthier lunch menus. The issue faced
by SFAs is a classic moral hazard problem: a SFA’s effort and concern for the provision of
healthy menu options is unknown (i.e., asymmetric information). SFAs can accept federal
funds and agricultural commodities to provide healthy lunches while districts create school
wellness policies “requiring” minimum nutritional quality of school-provided foods, but the
overall quality of implementation is relatively unknown.
The significance of this study is highlighted by the undeniable health and economic
implications of childhood obesity and the quality of school meals affecting millions of children.
If the NSLP contributes to a positive impact on child health, the program will provide useful
policy tools that will be easy to execute. If the program contributes to a negative impact on
child health, then this research gives policy analysts knowledge and the opportunity to
implement incentives to ameliorate the problem. Therefore, this research has the following
objectives: (1) Address the need for an impact analysis of NSLP on child health using economic
theory and estimation methods to identify the underlying mechanisms of this relationship; (2)
Utilize the Principal-Agent (PA) framework to model efforts put into healthy eating and
6
providing healthy foods on the part of the school meal program at the level of the School Food
Authority; (3) Examine potential incentives and costs for SFAs to adopt healthier lunch menus.
II. Conceptual Framework
In the PA framework, the SFAs are the agents that put forth an unobservable level of
effort to contract with food service management companies, verify the eligibility of children for
free and reduced-price meals, establish meal program menus, and conduct yearly on-site
reviews of each school within its authority to ensure the validity of meals claimed for
reimbursement. According to SMIIS III, the three most difficult tasks for SFAs to implement
are entering and analyzing recipes, entering and analyzing menus, and obtaining missing
nutrient information. Each of these tasks is integral to the provision of healthier foods and can
be incorporated as part of incentives for SFAs.
We use the nutritional quality (n) of the food served to measure the effort level of the
agents with regard to the provision of healthy food choices. This nutritional level serves as a
proxy for the decision making process on the part of the SFAs. Because exact nutritional
quality can differ considerably depending on the meal options served on any given day, we use
discrete values of low and high for the average nutritional value of a day’s worth of lunch
options: { , }low highn n n where 0 1low highn n . While most schools do not provide
nutritional information of meal options at point of sale5, this would be relatively easy to
implement as part of Local Wellness Policies. Nonetheless, according to the SMI, SFAs should
have a record of nutritional information of all meals served.
5 Some school districts, such as Montgomery County and Fairfax County schools, post calorie information next to
the item in the school cafeteria, and others post nutrition information online for parents.
7
A meal is considered to be of low nutritional value (nlow) if any of the following nutrition
regulations are not met:
- No more than 30% of a meal’s calories come from fat
- Less than 10% of a meal’s calories come from saturated fat
- Meal must provide one-third of the Recommended Daily Allowance of
protein, Vitamin A, Vitamin C, iron, calcium and calories
The school meals provided through the SFA for the NSLP produce a child health
outcome that is measured by child weight ( )W n . We assume that other factors contributing to
child weight such as exercise and food consumed outside of school are accounted for in ( )W
and that child weight is a discrete outcome: overweight, WOW, or healthy weight WH. If an SFA
exerts low effort to make meals healthy for students ( )lown n , then the probability that the
child is of healthy weight is 0 while the probability that the child is overweight is 0(1 ) . If
a SFA exerts high effort to make meals healthy for students participating in NSLP ( )highn n ,
then the probability that the child is of healthy weight WH is 1 , and the probability that the
child is overweight is 1(1 ) . We assume that the provision of school meals with higher
nutritional quality from the higher effort levels of SFA agents increases the probability that the
child is of healthy weight: 1 0 .
Because SFAs receive reimbursements for school meals, we denote r as the
reimbursement transfer that the principal (i.e., the federal government) gives to the agent. We
focus on the reimbursement for free lunches which is currently $2.77 for each free lunch
provided and is given to all SFAs (USDA 2010). We denote this current level of
reimbursement as cr r . One possible incentive contract to provide more nutritious school
8
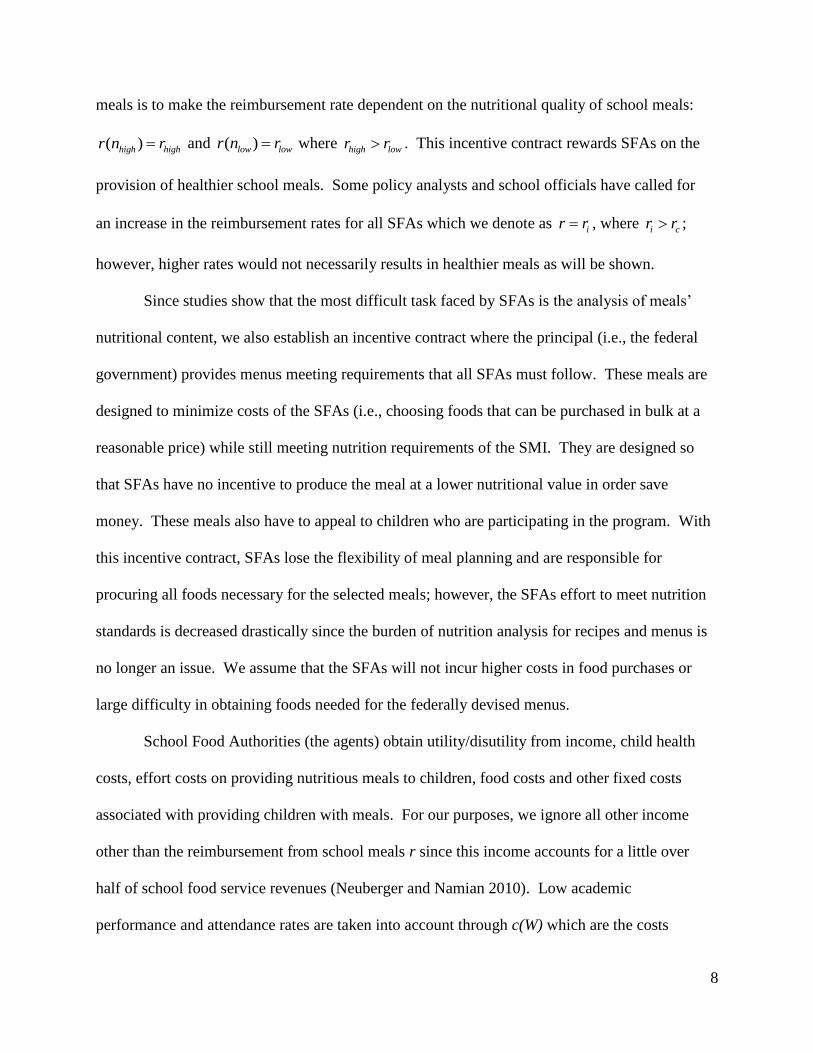
meals is to make the reimbursement rate dependent on the nutritional quality of school meals:
( )high highr n r and ( )low lowr n r where high lowr r . This incentive contract rewards SFAs on the
provision of healthier school meals. Some policy analysts and school officials have called for
an increase in the reimbursement rates for all SFAs which we denote as ir r , where i cr r ;
however, higher rates would not necessarily results in healthier meals as will be shown.
Since studies show that the most difficult task faced by SFAs is the analysis of meals’
nutritional content, we also establish an incentive contract where the principal (i.e., the federal
government) provides menus meeting requirements that all SFAs must follow. These meals are
designed to minimize costs of the SFAs (i.e., choosing foods that can be purchased in bulk at a
reasonable price) while still meeting nutrition requirements of the SMI. They are designed so
that SFAs have no incentive to produce the meal at a lower nutritional value in order save
money. These meals also have to appeal to children who are participating in the program. With
this incentive contract, SFAs lose the flexibility of meal planning and are responsible for
procuring all foods necessary for the selected meals; however, the SFAs effort to meet nutrition
standards is decreased drastically since the burden of nutrition analysis for recipes and menus is
no longer an issue. We assume that the SFAs will not incur higher costs in food purchases or
large difficulty in obtaining foods needed for the federally devised menus.
School Food Authorities (the agents) obtain utility/disutility from income, child health
costs, effort costs on providing nutritious meals to children, food costs and other fixed costs
associated with providing children with meals. For our purposes, we ignore all other income
other than the reimbursement from school meals r since this income accounts for a little over
half of school food service revenues (Neuberger and Namian 2010). Low academic
performance and attendance rates are taken into account through c(W) which are the costs
9
associated with child weight since school funding is now often tied to academic performance
and attendance rates (Averett and Stifel 2010; Glewwe, Jacoby and King 2001; Meyers et al.
1989; Murphy et al. 1998).
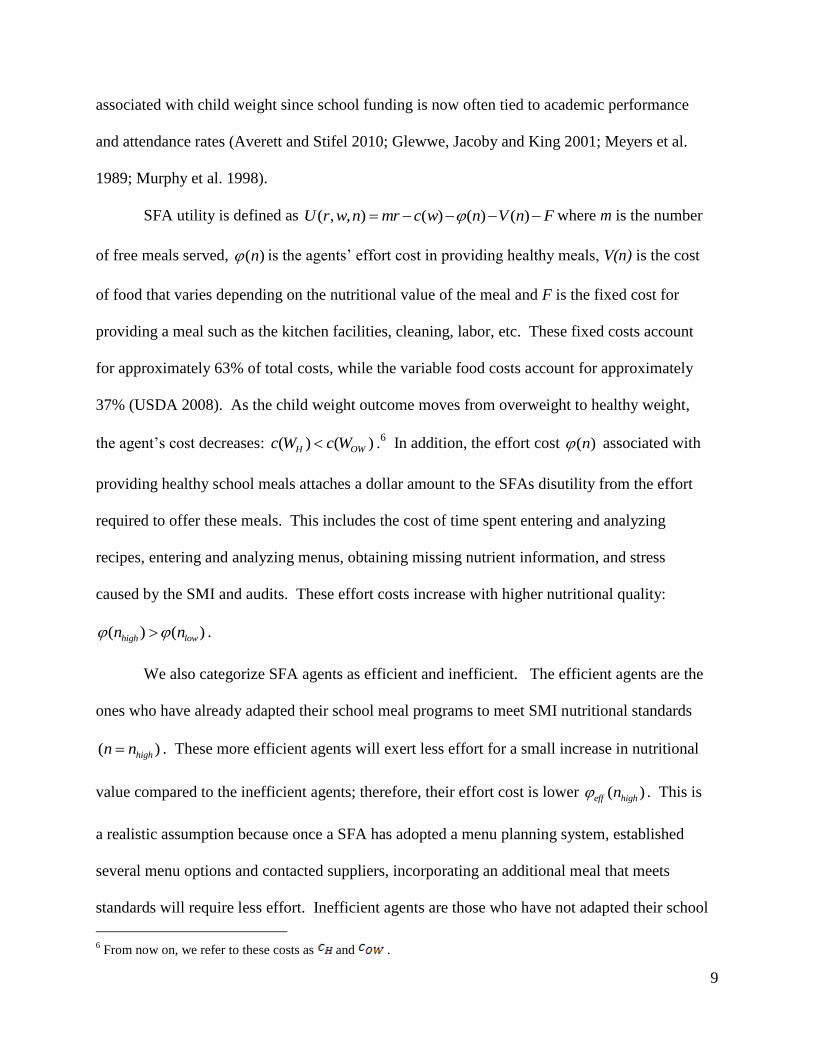
SFA utility is defined as ( , , ) ( ) ( ) ( )U r w n mr c w n V n F where m is the number
of free meals served, ( )n is the agents’ effort cost in providing healthy meals, V(n) is the cost
of food that varies depending on the nutritional value of the meal and F is the fixed cost for
providing a meal such as the kitchen facilities, cleaning, labor, etc. These fixed costs account
for approximately 63% of total costs, while the variable food costs account for approximately
37% (USDA 2008). As the child weight outcome moves from overweight to healthy weight,
the agent’s cost decreases: ( ) ( )H OWc W c W .6 In addition, the effort cost ( )n associated with
providing healthy school meals attaches a dollar amount to the SFAs disutility from the effort
required to offer these meals. This includes the cost of time spent entering and analyzing
recipes, entering and analyzing menus, obtaining missing nutrient information, and stress
caused by the SMI and audits. These effort costs increase with higher nutritional quality:
( ) ( )high lown n .
We also categorize SFA agents as efficient and inefficient. The efficient agents are the
ones who have already adapted their school meal programs to meet SMI nutritional standards
( )highn n . These more efficient agents will exert less effort for a small increase in nutritional
value compared to the inefficient agents; therefore, their effort cost is lower ( )eff highn . This is
a realistic assumption because once a SFA has adopted a menu planning system, established
several menu options and contacted suppliers, incorporating an additional meal that meets
standards will require less effort. Inefficient agents are those who have not adapted their school
6 From now on, we refer to these costs as and .
10
meal program to meet the nutrition standards ( )lown n . The effort costs of these agents are
( )ineff lown . Among the SFAs, the proportion of inefficient agents is θ, and the proportion of
efficient agents is (1 ) . The principal managing the SFAs does not observe agent type, but
we assume that he knows the distribution of agent types or the probability that a SFA is efficient
or inefficient.
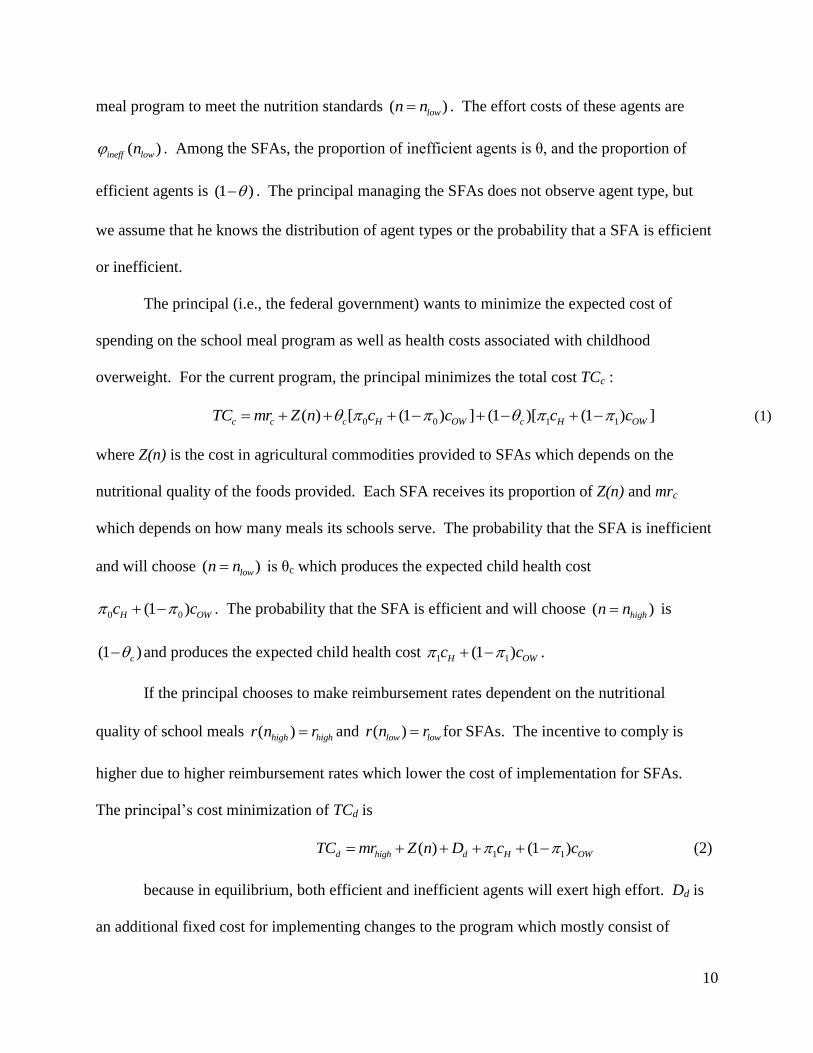
The principal (i.e., the federal government) wants to minimize the expected cost of
spending on the school meal program as well as health costs associated with childhood
overweight. For the current program, the principal minimizes the total cost TCc :
0 0 1 1( ) [ (1 ) ] (1 )[ (1 ) ]c c c H OW c H OWTC mr Z n c c c c
(1)
where Z(n) is the cost in agricultural commodities provided to SFAs which depends on the
nutritional quality of the foods provided. Each SFA receives its proportion of Z(n) and mrc
which depends on how many meals its schools serve. The probability that the SFA is inefficient
and will choose ( )lown n is θc which produces the expected child health cost
0 0(1 )H OWc c . The probability that the SFA is efficient and will choose ( )highn n is
(1 )c and produces the expected child health cost 1 1(1 )H OWc c .
If the principal chooses to make reimbursement rates dependent on the nutritional
quality of school meals ( )high highr n r and ( )low lowr n r for SFAs. The incentive to comply is
higher due to higher reimbursement rates which lower the cost of implementation for SFAs.
The principal’s cost minimization of TCd is
1 1( ) (1 )d high d H OWTC mr Z n D c c (2)
because in equilibrium, both efficient and inefficient agents will exert high effort. Dd is
an additional fixed cost for implementing changes to the program which mostly consist of
11
monitoring costs in determining whether schools are eligible for high or low reimbursement
rates. In this case, all SFAs receive the high reimbursement, and the expected health cost
is 1 1(1 )H OWc c .
If the principal chooses to provide all the SFAs with nutritious school menus, then the
principal will minimize the total cost TCp:
1 1( ) (1 )p p p H OWTC mr Z n D c c (3)
In this case, the reimbursement rate is rp, and the federal government incurs the
additional fixed cost of designing and analyzing meals Dp which considerably decreases the
effort cost of the agents. Therefore, both efficient and inefficient agents will exert high effort
generating the expected health cost 1 1(1 )H OWc c .
III. Program and Incentive Designs
3.1 Current Reimbursement Rate
From research it is evident that the current reimbursement rate is not enough incentive to
guarantee compliance with the SMI since SNDA-III finds that as of 2004/2005 80% of schools
failed to meet nutrition requirements. The participation constraints for the inefficient agents are
not being met under current conditions. The participation constraints require that each agent’s
expected utility (efficient and inefficient) at least equals his/her reservation utility. However,
the inefficient agent’s participation constraint is not binding in the current program because the
incentive mechanism is not large enough to require compliance. First, we derive the current
model to determine why there is minimal compliance.
The principal must find a reimbursement rate (rc) that minimizes the cost TCc while
ensuring that both efficient and inefficient agents will comply to nutrition standards. We
12
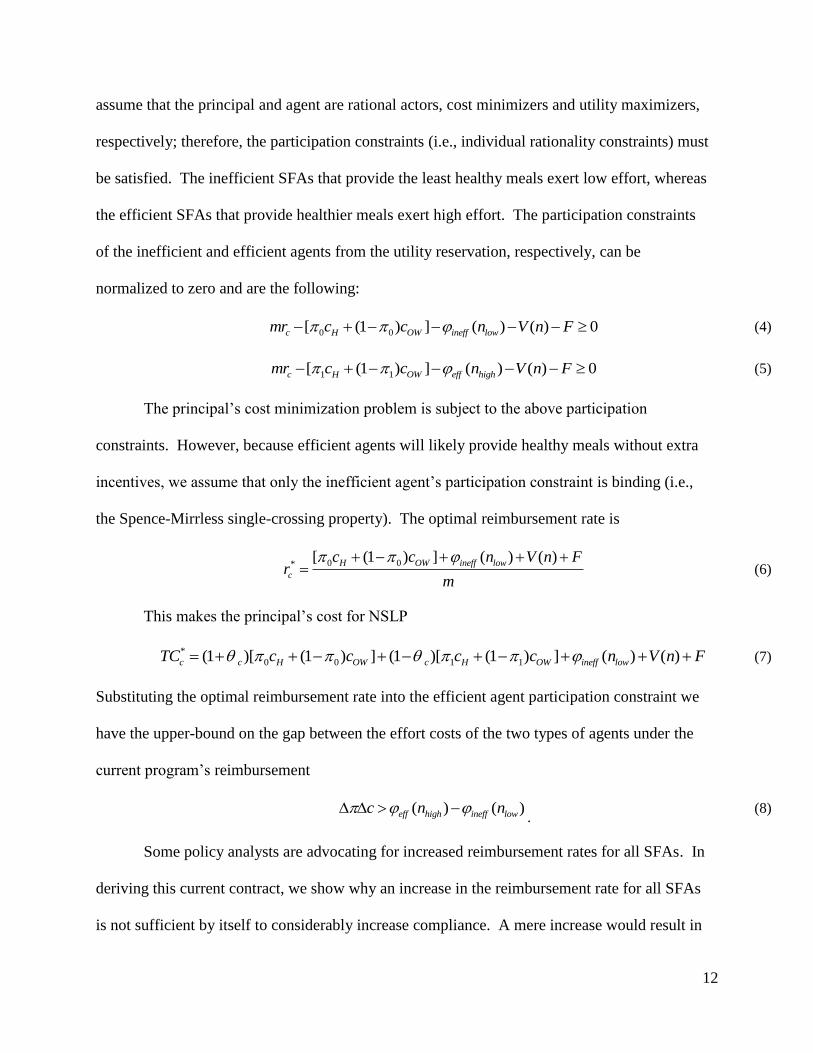
assume that the principal and agent are rational actors, cost minimizers and utility maximizers,
respectively; therefore, the participation constraints (i.e., individual rationality constraints) must
be satisfied. The inefficient SFAs that provide the least healthy meals exert low effort, whereas
the efficient SFAs that provide healthier meals exert high effort. The participation constraints
of the inefficient and efficient agents from the utility reservation, respectively, can be
normalized to zero and are the following:
0 0[ (1 ) ] ( ) ( ) 0c H OW ineff lowmr c c n V n F (4)
1 1[ (1 ) ] ( ) ( ) 0c H OW eff highmr c c n V n F (5)
The principal’s cost minimization problem is subject to the above participation
constraints. However, because efficient agents will likely provide healthy meals without extra
incentives, we assume that only the inefficient agent’s participation constraint is binding (i.e.,
the Spence-Mirrless single-crossing property). The optimal reimbursement rate is
0 0*
[ (1 ) ] ( ) ( )H OW ineff low
c
c c n V n Fr
m
(6)
This makes the principal’s cost for NSLP
*
0 0 1 1(1 )[ (1 ) ] (1 )[ (1 ) ] ( ) ( )c c H OW c H OW ineff lowTC c c c c n V n F (7)
Substituting the optimal reimbursement rate into the efficient agent participation constraint we
have the upper-bound on the gap between the effort costs of the two types of agents under the
current program’s reimbursement
( ) ( )eff high ineff lowc n n . (8)
Some policy analysts are advocating for increased reimbursement rates for all SFAs. In
deriving this current contract, we show why an increase in the reimbursement rate for all SFAs
is not sufficient by itself to considerably increase compliance. A mere increase would result in
13
similar conclusions as the current contract where not all SFAs would meet standards. While an
increase in the federal reimbursement rate of school meals is a feasible policy objective, we
show that it does not guarantee complete compliance.
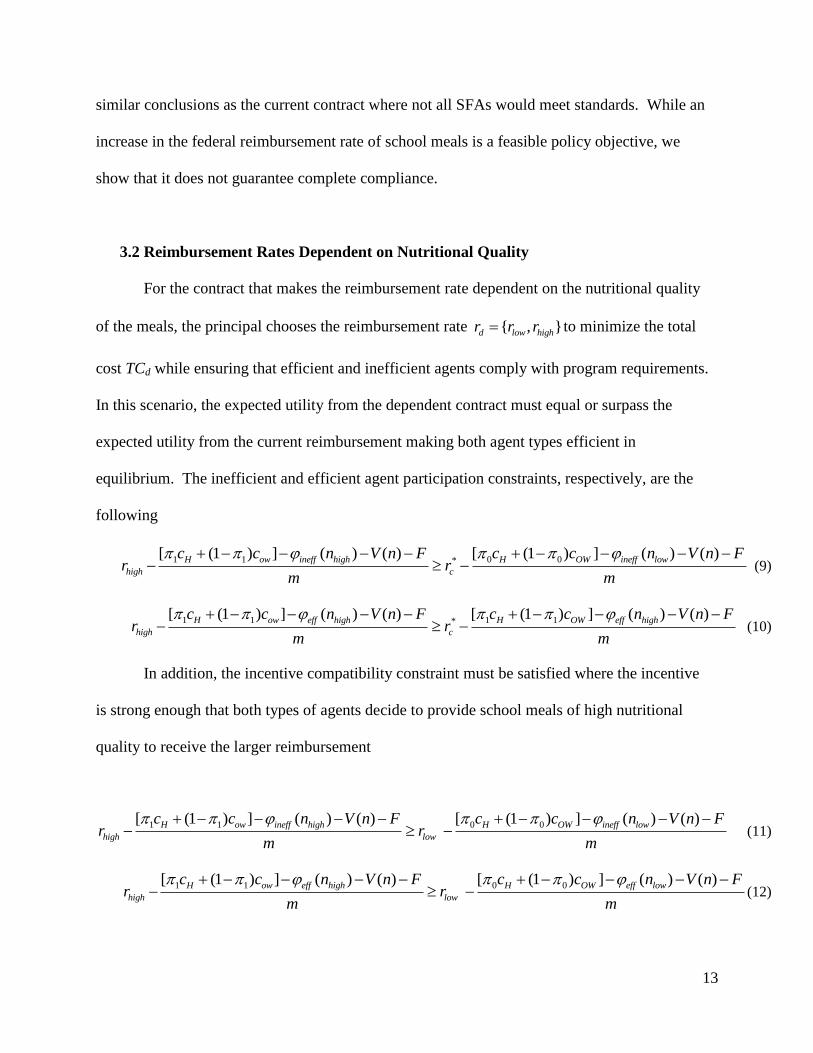
3.2 Reimbursement Rates Dependent on Nutritional Quality
For the contract that makes the reimbursement rate dependent on the nutritional quality
of the meals, the principal chooses the reimbursement rate { , }d low highr r r to minimize the total
cost TCd while ensuring that efficient and inefficient agents comply with program requirements.
In this scenario, the expected utility from the dependent contract must equal or surpass the
expected utility from the current reimbursement making both agent types efficient in
equilibrium. The inefficient and efficient agent participation constraints, respectively, are the
following
1 1 0 0*
[ (1 ) ] ( ) ( ) [ (1 ) ] ( ) ( )H ow ineff high H OW ineff low
high c
c c n V n F c c n V n Fr r
m m
(9)
1 1 1 1*
[ (1 ) ] ( ) ( ) [ (1 ) ] ( ) ( )H ow eff high H OW eff high
high c
c c n V n F c c n V n Fr r
m m
(10)
In addition, the incentive compatibility constraint must be satisfied where the incentive
is strong enough that both types of agents decide to provide school meals of high nutritional
quality to receive the larger reimbursement
1 1 0 0[ (1 ) ] ( ) ( ) [ (1 ) ] ( ) ( )H ow ineff high H OW ineff low
high low
c c n V n F c c n V n Fr r
m m
(11)
1 1 0 0[ (1 ) ] ( ) ( ) [ (1 ) ] ( ) ( )H ow eff high H OW eff low
high low
c c n V n F c c n V n Fr r
m m
(12)
14
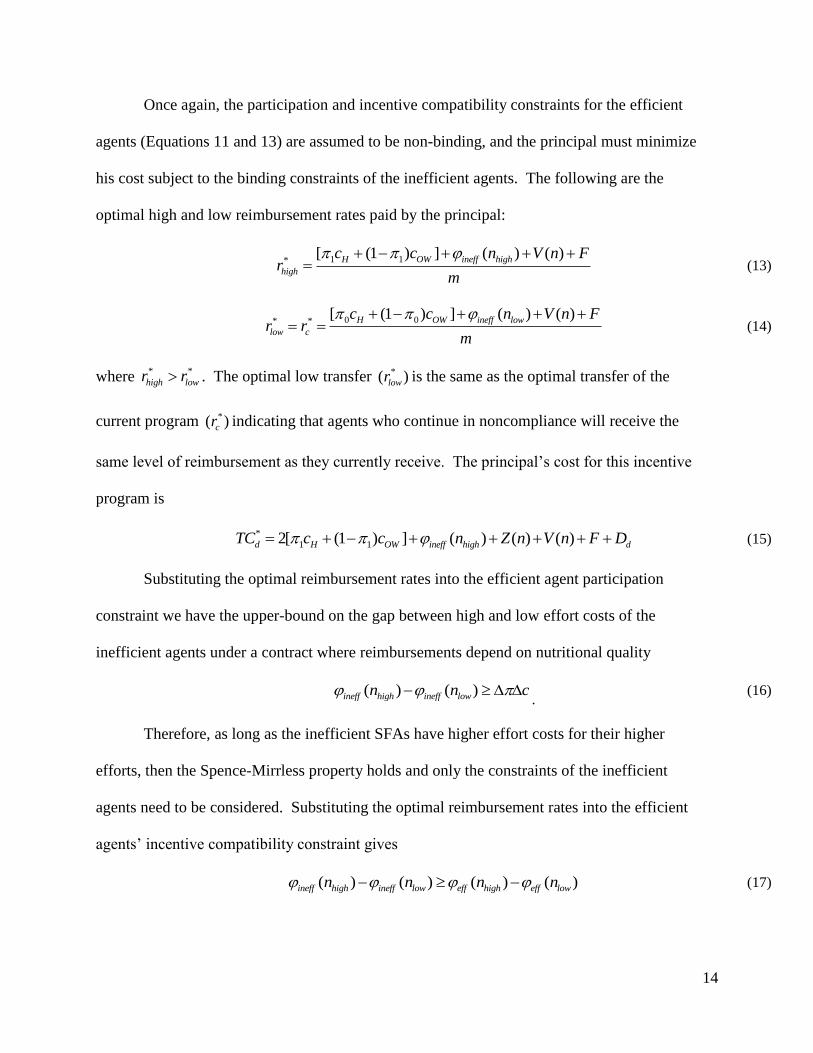
Once again, the participation and incentive compatibility constraints for the efficient
agents (Equations 11 and 13) are assumed to be non-binding, and the principal must minimize
his cost subject to the binding constraints of the inefficient agents. The following are the
optimal high and low reimbursement rates paid by the principal:
1 1*
[ (1 ) ] ( ) ( )H OW ineff high
high
c c n V n Fr
m
(13)
0 0* *
[ (1 ) ] ( ) ( )H OW ineff low
low c
c c n V n Fr r
m
(14)
where * *
high lowr r . The optimal low transfer *( )lowr is the same as the optimal transfer of the
current program *( )cr indicating that agents who continue in noncompliance will receive the
same level of reimbursement as they currently receive. The principal’s cost for this incentive
program is
*
1 12[ (1 ) ] ( ) ( ) ( )d H OW ineff high dTC c c n Z n V n F D (15)
Substituting the optimal reimbursement rates into the efficient agent participation
constraint we have the upper-bound on the gap between high and low effort costs of the
inefficient agents under a contract where reimbursements depend on nutritional quality
( ) ( )ineff high ineff lown n c . (16)
Therefore, as long as the inefficient SFAs have higher effort costs for their higher
efforts, then the Spence-Mirrless property holds and only the constraints of the inefficient
agents need to be considered. Substituting the optimal reimbursement rates into the efficient
agents’ incentive compatibility constraint gives
( ) ( ) ( ) ( )ineff high ineff low eff high eff lown n n n (17)
15
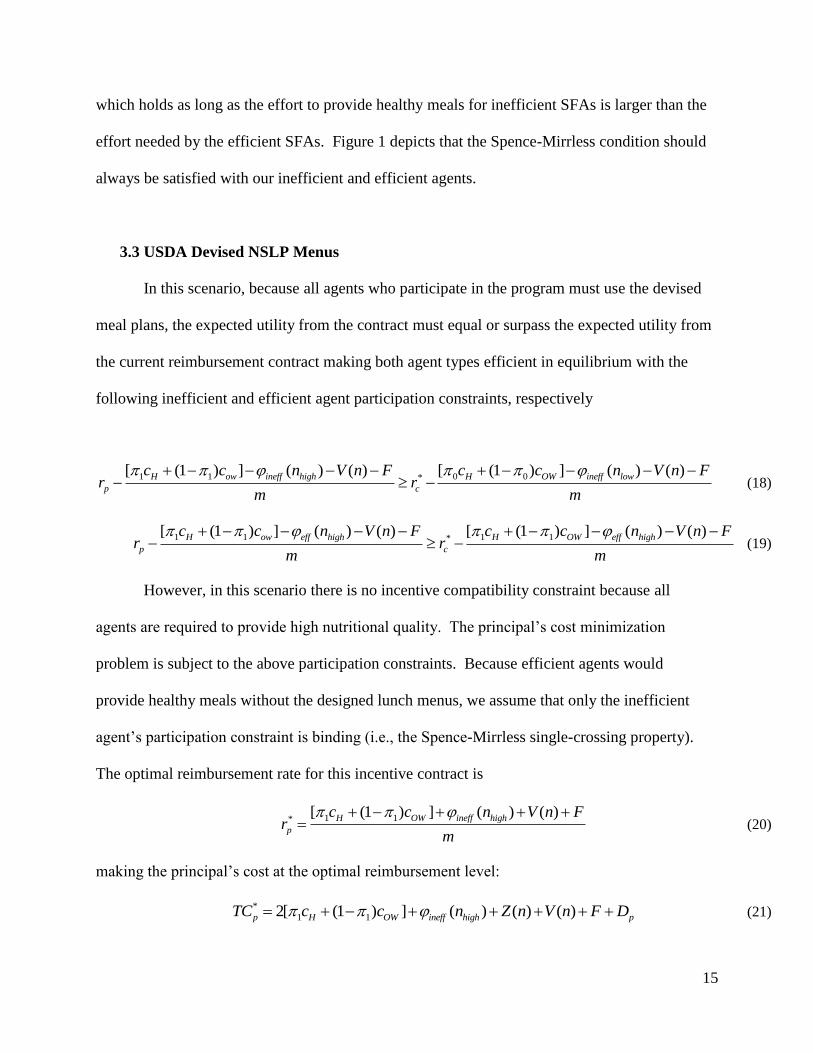
which holds as long as the effort to provide healthy meals for inefficient SFAs is larger than the
effort needed by the efficient SFAs. Figure 1 depicts that the Spence-Mirrless condition should
always be satisfied with our inefficient and efficient agents.
3.3 USDA Devised NSLP Menus
In this scenario, because all agents who participate in the program must use the devised
meal plans, the expected utility from the contract must equal or surpass the expected utility from
the current reimbursement contract making both agent types efficient in equilibrium with the
following inefficient and efficient agent participation constraints, respectively
1 1 0 0*[ (1 ) ] ( ) ( ) [ (1 ) ] ( ) ( )H ow ineff high H OW ineff low
p c
c c n V n F c c n V n Fr r
m m
(18)
1 1 1 1*
[ (1 ) ] ( ) ( ) [ (1 ) ] ( ) ( )H ow eff high H OW eff high
p c
c c n V n F c c n V n Fr r
m m
(19)
However, in this scenario there is no incentive compatibility constraint because all
agents are required to provide high nutritional quality. The principal’s cost minimization
problem is subject to the above participation constraints. Because efficient agents would
provide healthy meals without the designed lunch menus, we assume that only the inefficient
agent’s participation constraint is binding (i.e., the Spence-Mirrless single-crossing property).
The optimal reimbursement rate for this incentive contract is
1 1*
[ (1 ) ] ( ) ( )H OW ineff high
p
c c n V n Fr
m
(20)
making the principal’s cost at the optimal reimbursement level:
*
1 12[ (1 ) ] ( ) ( ) ( )p H OW ineff high pTC c c n Z n V n F D (21)
16
Substituting the optimal reimbursement rates into the efficient agent participation
constraint we have
( ) ( )ineff high ineff lown n c (22)
This condition is satisfied as long as the effort cost for inefficient agents to provide
meals of high nutritional value is larger than the effort cost to provide low quality meals.
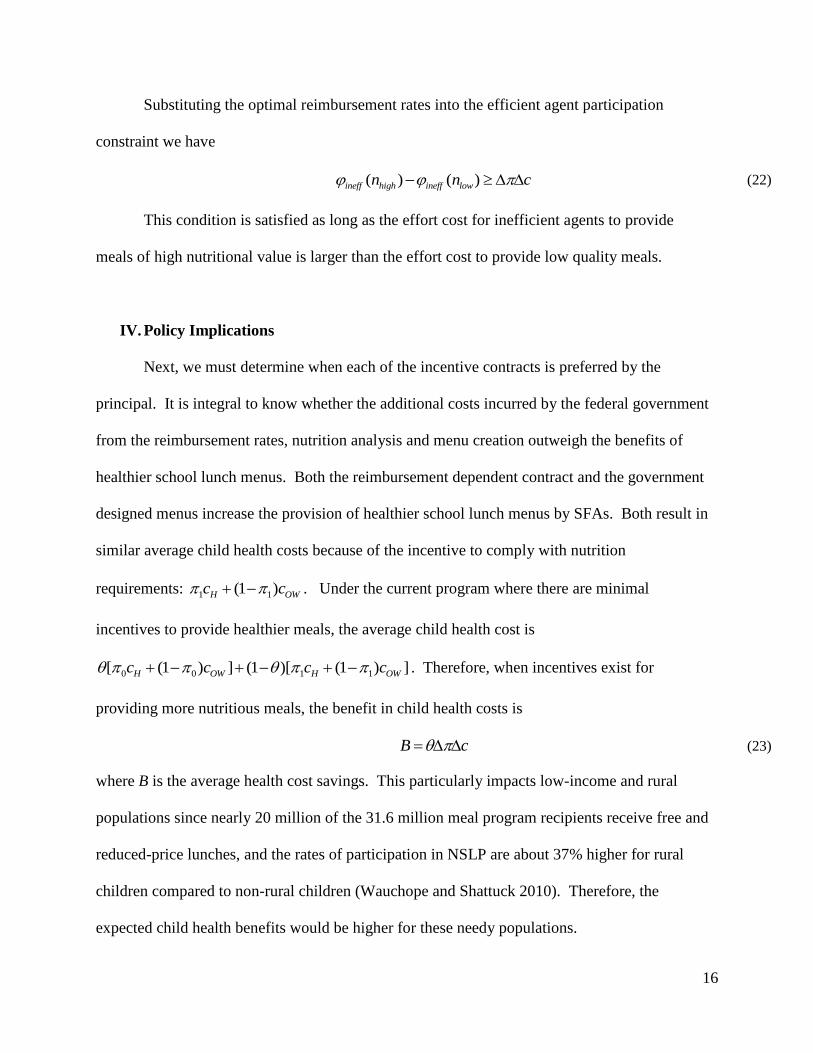
IV. Policy Implications
Next, we must determine when each of the incentive contracts is preferred by the
principal. It is integral to know whether the additional costs incurred by the federal government
from the reimbursement rates, nutrition analysis and menu creation outweigh the benefits of
healthier school lunch menus. Both the reimbursement dependent contract and the government
designed menus increase the provision of healthier school lunch menus by SFAs. Both result in
similar average child health costs because of the incentive to comply with nutrition
requirements: 1 1(1 )H OWc c . Under the current program where there are minimal
incentives to provide healthier meals, the average child health cost is
0 0 1 1[ (1 ) ] (1 )[ (1 ) ]H OW H OWc c c c . Therefore, when incentives exist for
providing more nutritious meals, the benefit in child health costs is
B c (23)
where B is the average health cost savings. This particularly impacts low-income and rural
populations since nearly 20 million of the 31.6 million meal program recipients receive free and
reduced-price lunches, and the rates of participation in NSLP are about 37% higher for rural
children compared to non-rural children (Wauchope and Shattuck 2010). Therefore, the
expected child health benefits would be higher for these needy populations.
17
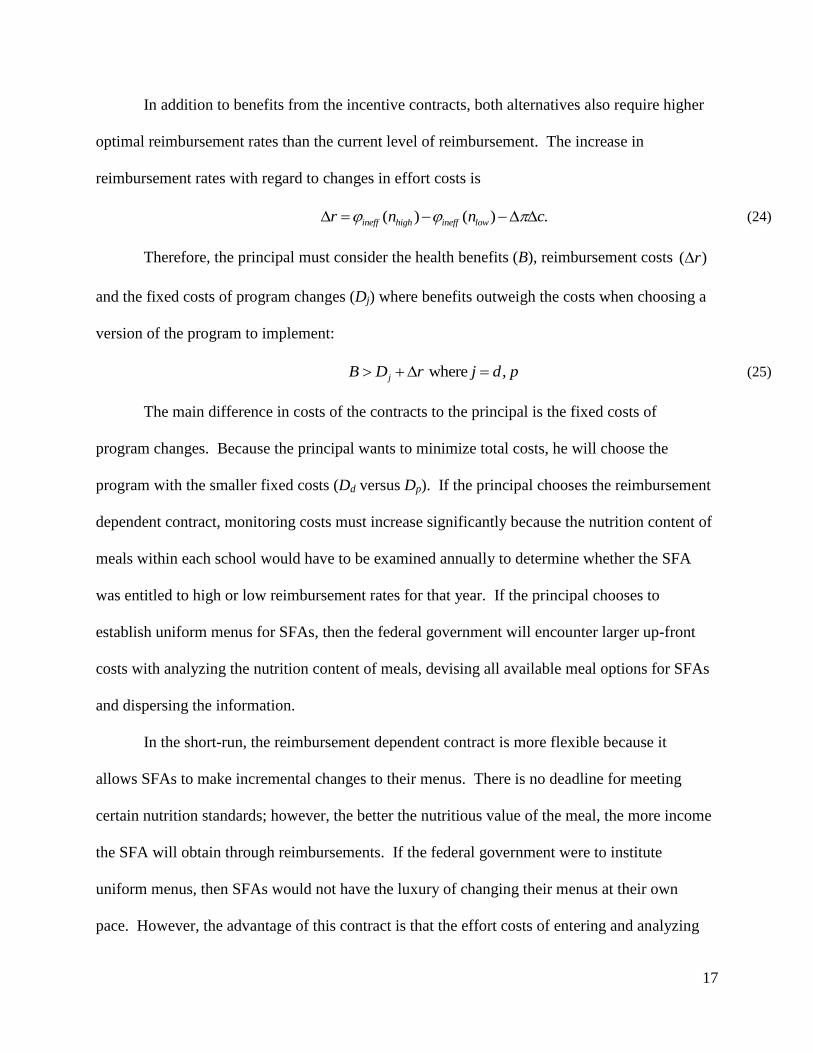
In addition to benefits from the incentive contracts, both alternatives also require higher
optimal reimbursement rates than the current level of reimbursement. The increase in
reimbursement rates with regard to changes in effort costs is
( ) ( ) .ineff high ineff lowr n n c (24)
Therefore, the principal must consider the health benefits (B), reimbursement costs ( )r
and the fixed costs of program changes (Dj) where benefits outweigh the costs when choosing a
version of the program to implement:
where ,jB D r j d p (25)
The main difference in costs of the contracts to the principal is the fixed costs of
program changes. Because the principal wants to minimize total costs, he will choose the
program with the smaller fixed costs (Dd versus Dp). If the principal chooses the reimbursement
dependent contract, monitoring costs must increase significantly because the nutrition content of
meals within each school would have to be examined annually to determine whether the SFA
was entitled to high or low reimbursement rates for that year. If the principal chooses to
establish uniform menus for SFAs, then the federal government will encounter larger up-front
costs with analyzing the nutrition content of meals, devising all available meal options for SFAs
and dispersing the information.
In the short-run, the reimbursement dependent contract is more flexible because it
allows SFAs to make incremental changes to their menus. There is no deadline for meeting
certain nutrition standards; however, the better the nutritious value of the meal, the more income
the SFA will obtain through reimbursements. If the federal government were to institute
uniform menus, then SFAs would not have the luxury of changing their menus at their own
pace. However, the advantage of this contract is that the effort costs of entering and analyzing
18
recipes, entering and analyzing menus and obtaining missing nutrient information is diminished
which are the three most difficult tasks for SFAs to implement according to SMIIS III.
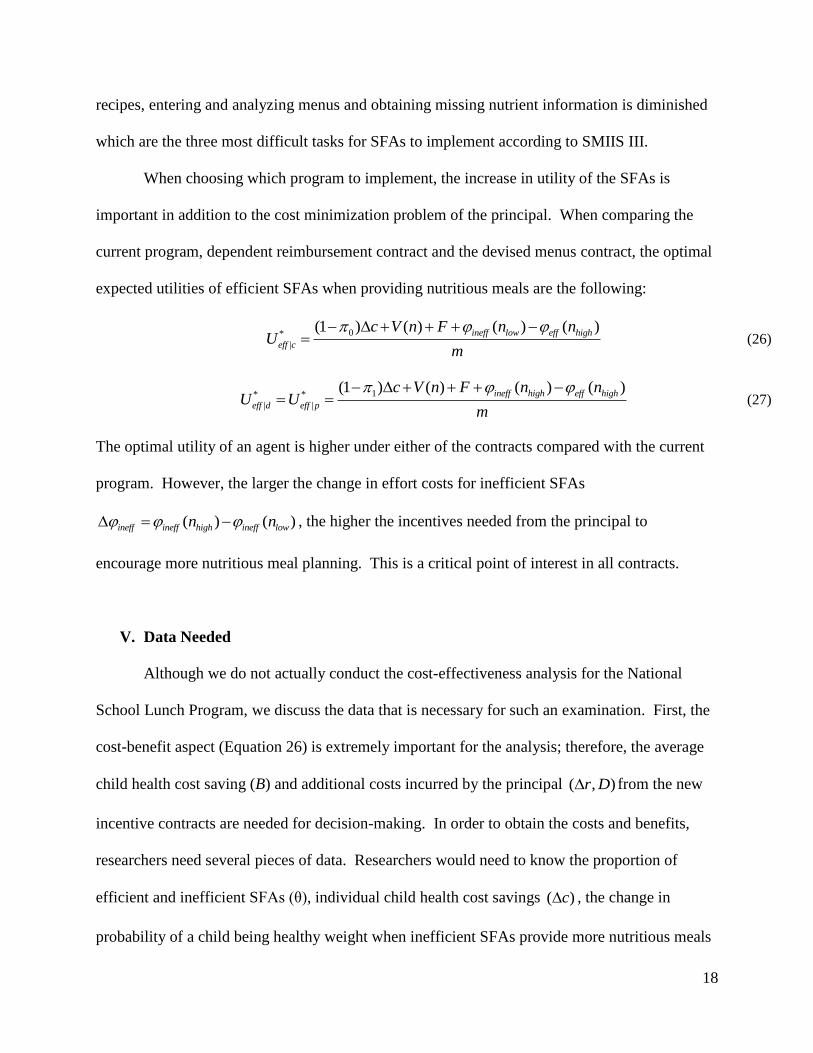
When choosing which program to implement, the increase in utility of the SFAs is
important in addition to the cost minimization problem of the principal. When comparing the
current program, dependent reimbursement contract and the devised menus contract, the optimal
expected utilities of efficient SFAs when providing nutritious meals are the following:
0*
|
(1 ) ( ) ( ) ( )ineff low eff high
eff c
c V n F n nU
m
(26)
1* *
| |
(1 ) ( ) ( ) ( )ineff high eff high
eff d eff p
c V n F n nU U
m
(27)
The optimal utility of an agent is higher under either of the contracts compared with the current
program. However, the larger the change in effort costs for inefficient SFAs
( ) ( )ineff ineff high ineff lown n , the higher the incentives needed from the principal to
encourage more nutritious meal planning. This is a critical point of interest in all contracts.
V. Data Needed
Although we do not actually conduct the cost-effectiveness analysis for the National
School Lunch Program, we discuss the data that is necessary for such an examination. First, the
cost-benefit aspect (Equation 26) is extremely important for the analysis; therefore, the average
child health cost saving (B) and additional costs incurred by the principal ( , )r D from the new
incentive contracts are needed for decision-making. In order to obtain the costs and benefits,
researchers need several pieces of data. Researchers would need to know the proportion of
efficient and inefficient SFAs (θ), individual child health cost savings ( )c , the change in
probability of a child being healthy weight when inefficient SFAs provide more nutritious meals
19
( ) , the change in effort costs for inefficient SFAs to provide healthy meals ( )ineff , and
additional fixed costs of the principal from changing the program (D).
The proportion of efficient/inefficient SFAs (θ) can be gathered from previous research
since both SNDA-III and the Physicians Committee for Responsible Medicine find that 80% of
schools do not meet USDA nutrition requirements for school lunches. According to this
statistic, 80 since 80% of our agents are inefficient at providing school meals of high
nutritional quality.
The SNDA-III data is representative of all public SFAs that offer NSLP, schools within
those SFAs and students within those schools. In the data set, SFA directors provide
information on district-wide policies including menu planning and operations such as food
purchasing. School foodservice managers completed a Menu Survey on detailed food
descriptions, portion sizes, number of servings provided in reimbursable meals and competitive
foods available near the foodservice area. Students provided a 24-hour dietary recall as well as
information on their school meal consumption, opinions about school meals, dietary supplement
use, recreational activities and exercise. The data set also contains demographic,
socioeconomic, and health-related information (including BMI measured by field staff) along
with whether children participate in NSLP, how many times per week and if they receive free-
or reduced-price lunches or pay for meals in full. From this information, we could estimate a
model that would predict the probability that a child is of healthy weight ( ) using
participation status in the NSLP as well as whether the SFA is considered efficient or inefficient
as predictors while controlling for demographic, socioeconomic, dietary and exercise
information.
20
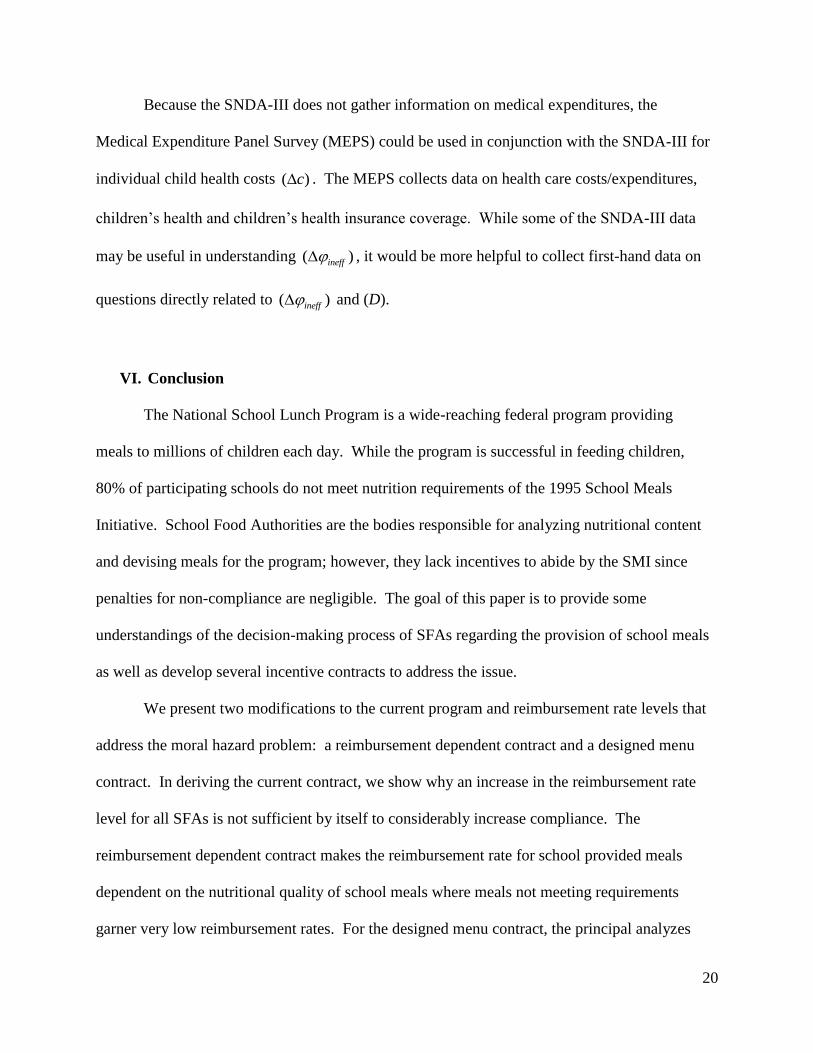
Because the SNDA-III does not gather information on medical expenditures, the
Medical Expenditure Panel Survey (MEPS) could be used in conjunction with the SNDA-III for
individual child health costs ( )c . The MEPS collects data on health care costs/expenditures,
children’s health and children’s health insurance coverage. While some of the SNDA-III data
may be useful in understanding ( )ineff , it would be more helpful to collect first-hand data on
questions directly related to ( )ineff and (D).
VI. Conclusion
The National School Lunch Program is a wide-reaching federal program providing
meals to millions of children each day. While the program is successful in feeding children,
80% of participating schools do not meet nutrition requirements of the 1995 School Meals
Initiative. School Food Authorities are the bodies responsible for analyzing nutritional content
and devising meals for the program; however, they lack incentives to abide by the SMI since
penalties for non-compliance are negligible. The goal of this paper is to provide some
understandings of the decision-making process of SFAs regarding the provision of school meals
as well as develop several incentive contracts to address the issue.
We present two modifications to the current program and reimbursement rate levels that
address the moral hazard problem: a reimbursement dependent contract and a designed menu
contract. In deriving the current contract, we show why an increase in the reimbursement rate
level for all SFAs is not sufficient by itself to considerably increase compliance. The
reimbursement dependent contract makes the reimbursement rate for school provided meals
dependent on the nutritional quality of school meals where meals not meeting requirements
garner very low reimbursement rates. For the designed menu contract, the principal analyzes
21
the nutritional content of potential meals and provides SFAs with menus that are cost efficient
and are eligible for reimbursement.
Our results show the mechanisms behind each of these contracts, under which
conditions each would be the most effective and the data necessary for empirical evaluation of
such an analysis. The crucial element is the additional effort cost that is needed for inefficient
SFAs to provide more nutritious meals. If these effort costs outweigh the benefits in child
health costs, then the contracts will be unsuccessful in incentivizing SFAs. However, detailed
data are needed for true effectiveness of each of the contracts.
We would like to recognize that our model is merely a first look at the decision-making
process behind SFAs only taking into consideration the free lunch program and income derived
from the reimbursement of free meals. In future research, income from reduced-price meals and
paid meals as well as other state and local agencies should also be taken into account. In
addition, because the variable food costs are nutrition dependent, there is likely a threshold that
SFAs are willing to spend on these food costs that is also unknown to the principal which can be
incorporated in the model. With regard to the costs and benefits, the state level influence on
SFAs should be considered more thoroughly. All of these are avenues for future research in an
area where minimal investigation has been conducted.
22
References
Alderman, L. (2010), 'Putting Nutrition at the Head of the School Lunch Line', The New York
Times, B6.
Averett, S. & Stifel, D. (2010), 'Race and gender differences in the cognitive effects of childhood
overweight', Applied Economics Letters 17, 1673-1679.
Bhattacharya, J.; Currie, J. & Haider, S. (2006), 'Breakfast of Champions? The School Breakfast
Program and the Nutrition of Children and Families', The Journal of Human Resources
41, 445-466.
Briefel, R.; Wilson, A. & Gleason, P. (2009), 'Consumption of Low-Nutrient, Energy-Dense
Foods and Beverages at School, Home, and Other Locations among School Lunch
Participants and Nonparticipants', Journal of the American Dietetic Association 109(2),
S79-S90.
Burghardt, J.; Gordon, A. & Fraker, T. (1995), 'Meals offered in the National School Lunch
Program and the School Breakfast Program', American Journal of Clinical Nutrition
61(1), 187S-198S.
Cole, N. & Fox, M. K. (2008), 'Diet Quality of American School-Age Children by School Lunch
Participation Status: Data from the National Health and Nutrition Examination Survey,
1999-2004', Technical report, U.S. Department of Agriculture, Food and Nutrition
Service, Office of Research, Nutrition and Analysis.
Gleason, P. & Suitor, C. (2003), 'Eating at School: How the National School Lunch Program
Affects Children's Diets', American Journal of Agricultural Economics 85(4), 1047-1061.
Glewwe, P.; Jacoby, H. & King, E. (2001), 'Early Childhood Nutrition and Academic
Achievement: A Longitudinal Analysis', Journal of Public Economics 81, 345-368.
23
Gordon, A.; Devaney, B. & Burghardt, J. (1995), 'Dietary effects of the National School Lunch
Program and the School Breakfast Program', American Journal of Clinical Nutrition
61(1), 221S-231S.
Gordon, A.; Fox, M. K.; Clark, M.; Noquales, R.; Condon, E.; Gleason, P. & Sarin, A. (2007),
'School Nutrition Dietary Assessment Study-III: Volume II: Student Participation and
Dietary Intakes', Technical report, United States Department of Agriculture.
Gundersen, C.; Kreider, B. & Pepper, J. (2009), 'The Impact of the National School Lunch
Program on Child Health: A Nonparametric Bounds Analysis', Working Paper No.
09027.
Kennedy, E. & Davis, C. (1998), 'US Department of Agriculture School Breakfast Program',
American Journal of Clinical Nutrition 67, 798S-803S.
Meyers, A.; Sampson, A.; Weitzman, M.; Rogers, B. & Kayne, H. (1989), 'School Breakfast
Program and School Performance', Am J Dis Child 143, 1234-1239.
Millimet, D.; Tchernis, R. & Husain, M. (2010), 'School Nutrition Programs and the Incidence of
Childhood Obesity', The Journal of Human Resouces 45(3), 640-654.
Murphy, J. M.; Pagano, M.; Nachmani, J.; Sperling, P.; Kane, S. & Kleinman, R. (1998), 'The
Relationship of School Breakfast to Psychosocial and Academic Functioning: Cross-
sectional and Longitudinal Observations in an Inner-city School Sample', Arch Pediatr
Adolesc Med 152, 899-907.
Neuberger, Z. & Namian, T. F. (2010), 'Who Benefits from Federal Subsidies for Free and
Reduced Price School Meals?', Technical report, Center on Budget and Policy Priorities.
Pear, R. (2011), 'Senate Saves the Potato on School Lunch Menus', The New York Times A20.
24
Schanzenbach, D. (2009), 'Do School Lunches Contribute to Childhood Obesity?', The Journal
of Human Resources 44(3), 684-709.
Wauchope, B. and Shattuck, A. (2010), ‘Federal Child Nutrition Programs are Important to Rural
Households.’ Technical report, Issue Brief No. 11, The Carsey Institute at the University
of New Hampshire.
USDA (2010), 'National School Lunch Program Fact Sheet',
http://www.fns.usda.gov/cnd/Lunch/AboutLunch/NSLPFactSheet.pdf.
USDA (2008), ‘School Lunch and Breakfast Cost Study II’, Food and Nutrition Service.