Embed Size (px)
Citation preview
School Construction Report19th
Annual19thAnnual
School Construction ReportNational Statistics & Trends • Providing Detailed AnalysisNational Statistics & Trends • Providing Detailed Analysis
16 SCHOOL PLANNING & MANAGEMENT / FEBRUARY 2014 WEBSPM.COM
TRENDS SINCE 1995MEDIANS FOR SCHOOLSFROM THE PAST 19 YEARS.
REGIONAL ANALYSISWHAT’S HAPPENING IN YOUR PART OF THE COUNTRY?
NATIONAL STATISTICSWHAT HAPPENED IN 2013? HOW WERE THOSE DOLLARS USED?
PHO
TO C
OU
RTE
SY O
F H
UN
T C
ON
STRU
CTI
ON
GR
OU
P

New School Buildings Led Increase in Spending
19 T H A N N UA L R E P O R T
by PAUL ABRAMSON
Total school construction in 2013 continued to climb to more than $13 billion.
REGIONS2013
Completed2014 Projected
to Be Completed2014 Projected
to Start
New School
Additions
Renovation
Total
$7,573,438
$3,059,338
$2,757,622
$13,390,396
$6,367,935
$1,940,150
$1,714,819
$10,022,904
$5,227,601
$2,532,031
$1,680,116
$9,439,748
1 SCHOOL CONSTRUCTION IN THE U.S. ($000’S)SCHOOL CONSTRUCTION
1111
1212
1010
99 55
44
3388
7766 22
11
THE MORE THINGS remain the same, the more they seem to change. Contradictory, but in the realm of school construc-tion, apparently true.
Last year, in looking at data for school construction completed in 2012, I noted that for the fi rst time in fi ve years the total value of construction put in place in a calendar year had risen from the year before. The uptick was hardly huge (a $700 million in-crease after a fi ve-year fall of almost $8 bil-lion) but it represented a slight turnaround.
What was noticeable was that all of increase was attributable to spending on fi x-ing up and enlarging existing buildings. The amount of money spent on new schools had continued to fall. I speculated that this was due, in part, to the effects of the Recession, starting in 2008 that had put many projects on hold. As the economy began to improve even very slightly, the pent-up demand to fi x deteriorating buildings and to fi nd room for expanding populations seemed to be driving an increase in spending.
School construction in 2013 continued to climb very slightly (increasing about $400 million over 2012), but last year, it was the completion of new buildings that drove the increase. Spending for completed new school buildings rose $1.4 billion from 2012, when it was at a 16-year low, while spending for additions and retrofi t fell back.
Why new schools rather than improve-ment to existing ones? Without interview-ing leaders in districts across the nation, one can only speculate based on analysis of information collected. What seems to have happened is that two and three years ago, school districts began to see a change in the economy and a change in atmosphere. They began once again to look at their physical needs, put their plans forward, ob-tained necessary funds and went to work.
Upgrading existing buildings went fi rst and went relatively quickly. After all, in many cases these “infrastructure” projects had been planned when it appeared that federal money might fl ow during the depths of the Recession. Though Congress never provided the funds, the plans remained
necessary and viable, and when other sources of money were found, the projects got underway. They did not take long, and showed up as completed work in 2012.
New buildings take longer to plan and to construct. As funds began to fl ow, these proj-ects apparently also got underway — start dates given for new school projects indicate this — but completion came later, in 2013.
These are among the major fi ndings and conclusions to be drawn from School Planning & Management’s 19th Annual School Construction Report, covering ac-tivity completed in 2013 and expected to be completed or started in 2014 (see Table 1).
To prepare this report, School Planning & Management received information on school construction completed and underway dur-ing 2013 and planned to start in 2014 from Market Data Retrieval (MDR), a company of Dun and Bradstreet (D&B). MDR contacts school districts throughout the United States seeking information on their construction plans — new buildings, additions to existing buildings and major renovation, retrofi t or modernization projects. (The three terms
FEBRUARY 2014 / SCHOOL PLANNING & MANAGEMENT 17
are used interchangeably throughout this report.) We take that project information and use it to estimate construction on a na-tional and regional basis, and to report on how dollars are being spent on new schools.
All of the fi gures published are “annual in nature.” That is, they do not accumulate ongoing construction, but rather compile information on what was completed or expected to be completed or started in a given calendar year. School districts may be involved in more construction, but work started or completed outside the targeted years is not included. (Table 6, which details where money was or will be spent based on grade levels and purpose of buildings, summarizes all of the expected spending over a three-year period and pro-vides a useful estimate of the total impact of school construction on the economy.)
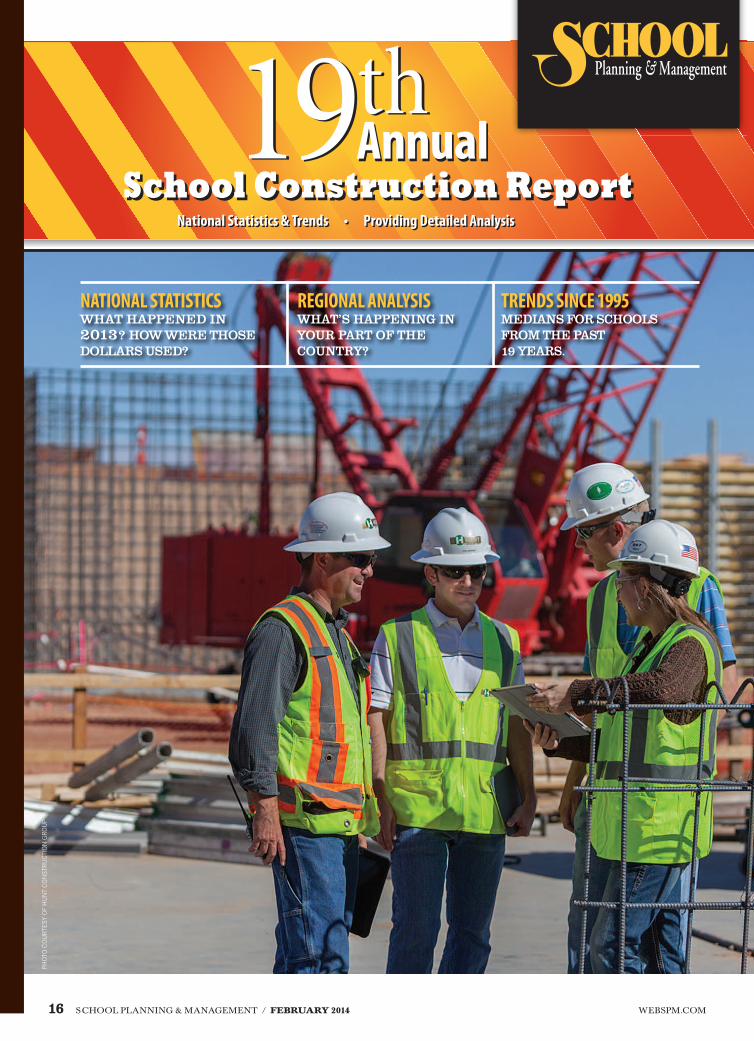
The national sceneSchool districts in the United
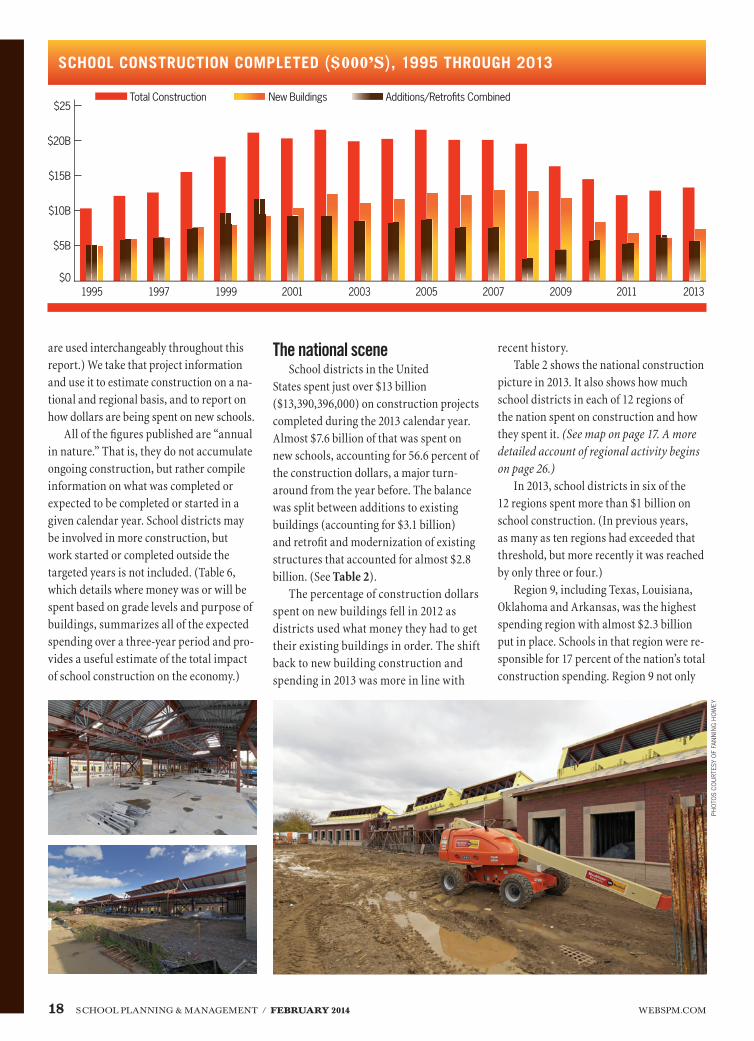
States spent just over $13 billion ($13,390,396,000) on construction projects completed during the 2013 calendar year. Almost $7.6 billion of that was spent on new schools, accounting for 56.6 percent of the construction dollars, a major turn-around from the year before. The balance was split between additions to existing buildings (accounting for $3.1 billion) and retrofi t and modernization of existing structures that accounted for almost $2.8 billion. (See Table 2).
The percentage of construction dollars spent on new buildings fell in 2012 as districts used what money they had to get their existing buildings in order. The shift back to new building construction and spending in 2013 was more in line with
recent history. Table 2 shows the national construction
picture in 2013. It also shows how much school districts in each of 12 regions of the nation spent on construction and how they spent it. (See map on page 17. A more detailed account of regional activity begins on page 26.)
In 2013, school districts in six of the 12 regions spent more than $1 billion on school construction. (In previous years, as many as ten regions had exceeded that threshold, but more recently it was reached by only three or four.)
Region 9, including Texas, Louisiana, Oklahoma and Arkansas, was the highest spending region with almost $2.3 billion put in place. Schools in that region were re-sponsible for 17 percent of the nation’s total construction spending. Region 9 not only
PHO
TOS
CO
UR
TESY
OF
FAN
NIN
G H
OW
EY
18 SCHOOL PLANNING & MANAGEMENT / FEBRUARY 2014 WEBSPM.COM
SCHOOL CONSTRUCTION COMPLETED ($000’S), 1995 THROUGH 2013
Total Construction$25
$20B
$15B
$10B
$5B
$0
New Buildings Additions/Retrofi ts Combined
1995 1997 1999 2001 2003 2005 2007 2009 2011 2013
1
2
3
4
5
6
7
8
9
10
11
12
Nat’l
Region New Schools New Addition Renovation% of
Nation% OF SPENDING FOR
$482,001
$533,600
$702,530
$592,104
$898,476
$359,382
$383,814
$500,200
$1,337,417
$562,112
$917,300
$304,500
$7,573,436
Additions
$339,091
$306,417
$176,276
$229,898
$191,406
$295,600
$127,418
$167,763
$510,595
$134,855
$446,451
$133,569
$3,059,338
Renovation
$209,071
$492,730
$184,076
$141,118
$112,557
$260,406
$139,798
$212,840
$432,058
$141,997
$311,471
$119,499
$2,757,622
Total
$1,030,163
$1,332,747
$1,062,882
$963,120
$1,202,439
$915,388
$651,030
$880,803
$2,280,070
$838,964
$1,675,222
$557,568
$13,390,396
46.8%
40.0%
66.1%
61.4%
74.7%
39.3%
59.0%
56.8%
58.7%
67.0%
54.8%
54.6%
56.6%
32.9%
23.0%
16.6%
23.9%
15.9%
32.3%
19.6%
19.0%
22.4%
16.1%
26.6%
24.0%
22.8%
20.3%
37.0%
17.3%
14.7%
9.4%
28.4%
21.4%
24.2%
18.9%
16.9%
18.6%
21.4%
20.6%
7.7%
10.0%
7.9%
7.2%
9.0%
6.8%
4.9%
6.6%
17.0%
6.3%
12.5%
4.2%
100.0%
To read this table: Public schools in Region 1 (New England) completed new buildings worth more than $482 million in 2013. They also put in place $339 million in additions to existing buildings and spent $209 million on renovations. School districts in Region 1 completed about $1 billion of school construction in 2013 with 46.8% of those dollars spent on new buildings, the balance on adding to and upgrading existing buildings. Region 1 accounted for 7.7% of all school construction dollars spent on projects completed in the United States in 2013.
2 SCHOOL CONSTRUCTION COMPLETED IN 2013 ($000’S)
put more construction in place than any other region, it also led the way in spending for new school buildings with $1.34 billion going for that purpose, in funding of addi-tions (almost $511 million) and was second to Region 2 in spending for renovations ($432 million).
Construction spending in Region 11 including Arizona, California, Hawaii and Nevada totaled almost $1.68 billion, mak-ing it the second highest spending region. Almost $1 billion went into new buildings.
School districts in Region 2, including New York, New Jersey and Pennsylvania, put $1.33 billion of school construction in place in 2013, a slight increase over the previous year. It was the third highest region in terms of overall spending, but unlike Regions 9 and 11, the bulk of its money went into improving, upgrading and adding to existing buildings. Region 2 is located, in large part, in a high cost area of the nation where construction routinely is estimated around $300 per square foot, so while it spends a great deal, the amount of construction completed is not nearly so great as in some of the less expensive regions including, as an example, Region 9.
Region 5, including Florida, Georgia, Alabama and Mississippi, completed
construction worth $1.2 billion last year. This is a region where the dollar tends to go farther, and it is also a region of continued population growth. About three-quarters of its dollars (almost $900 million) are spent on new schools.
Region 3 (Delaware, District of Colum-bia, Maryland, Virginia and West Virginia) continued to put more than $1 billion per year into school construction. The bulk of that goes into new school buildings, some needed to house rising populations spiraling out from Washington, D.C. into the suburbs of Maryland and Virginia, and some to replace old schools throughout the region that no longer serve their purpose.
Region 1(Connecticut, Maine, Mas-sachusetts, New Hampshire, Rhode Island and Vermont) was the sixth highest spending region in 2013, breaking the $1 billion mark. It is another high-cost area, so while the expenditures are high, the amount of school construction actually undertaken is relatively small.
School districts in Region 4 (North Carolina, South Carolina, Kentucky and Tennessee) spent $963 million in 2013. That represents a bounce-back from the year before but is still below what districts in the region had spent during the early
years of this century. Districts in Region 6 (Indiana, Michigan
and Ohio) reported $915 million in com-pleted work, relatively evenly split among new buildings, additions and retrofi t. School districts in Ohio, in particular, indicate that they are ready, willing and able to spend con-struction dollars but have relatively little of their own and are waiting on state funding.
Region 8 (Iowa, Kansas, Missouri and Nebraska) reported spending over $880 million on work completed in 2013. That’s a step-up from previous years. More than half the dollars are being used to bring new schools on line.
Region 10 (Colorado, Montana, New Mexico, North Dakota, South Dakota, Utah and Wyoming) districts doubled their construction spending in 2013 from the previous year, putting more than $800 million in place. One has to wonder if so much more construction was completed in one year or whether reporting errors have muddied the statistical waters.
Region 7 (Illinois, Minnesota and Wis-consin) spent $651 million in 2013, about the same as the year before. This year the reports show almost six of ten construction dollars going to new school buildings.
Region 12 (Alaska, Idaho, Oregon and
FEBRUARY 2014 / SCHOOL PLANNING & MANAGEMENT 19
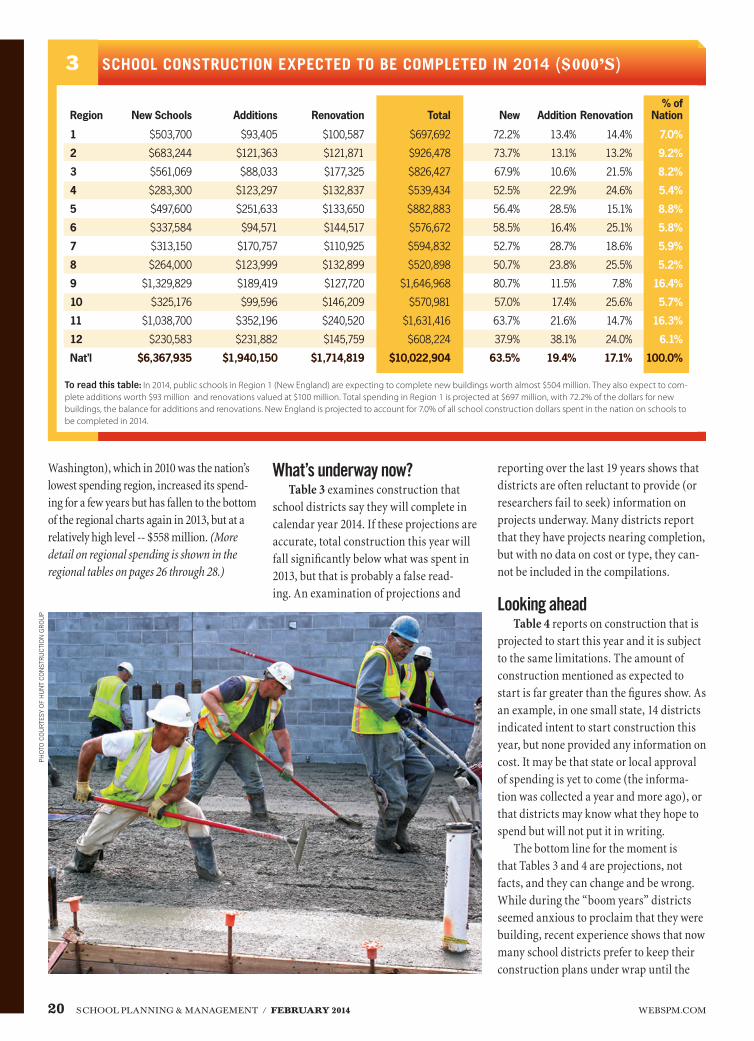
Washington), which in 2010 was the nation’s lowest spending region, increased its spend-ing for a few years but has fallen to the bottom of the regional charts again in 2013, but at a relatively high level -- $558 million. (More detail on regional spending is shown in the regional tables on pages 26 through 28.)
What’s underway now?Table 3 examines construction that
school districts say they will complete in calendar year 2014. If these projections are accurate, total construction this year will fall signifi cantly below what was spent in 2013, but that is probably a false read-ing. An examination of projections and
reporting over the last 19 years shows that districts are often reluctant to provide (or researchers fail to seek) information on projects underway. Many districts report that they have projects nearing completion, but with no data on cost or type, they can-not be included in the compilations.
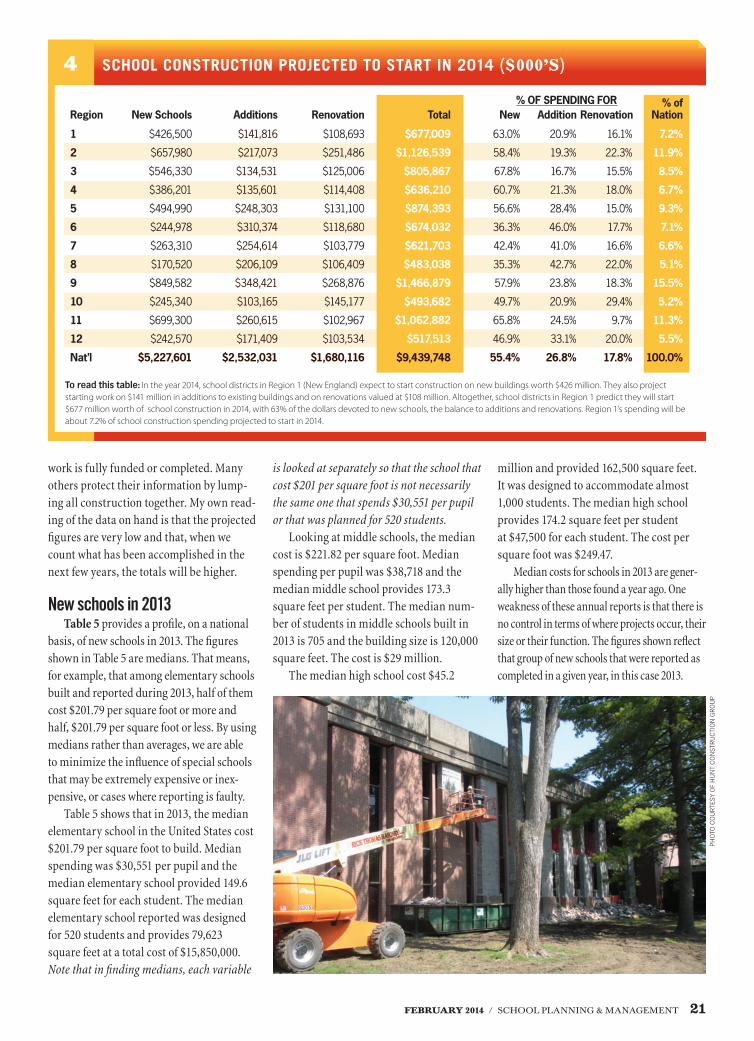
Looking aheadTable 4 reports on construction that is
projected to start this year and it is subject to the same limitations. The amount of construction mentioned as expected to start is far greater than the fi gures show. As an example, in one small state, 14 districts indicated intent to start construction this year, but none provided any information on cost. It may be that state or local approval of spending is yet to come (the informa-tion was collected a year and more ago), or that districts may know what they hope to spend but will not put it in writing.
The bottom line for the moment is that Tables 3 and 4 are projections, not facts, and they can change and be wrong. While during the “boom years” districts seemed anxious to proclaim that they were building, recent experience shows that now many school districts prefer to keep their construction plans under wrap until the
20 SCHOOL PLANNING & MANAGEMENT / FEBRUARY 2014 WEBSPM.COM
1
2
3
4
5
6
7
8
9
10
11
12
Nat’l
Region New Schools New Addition Renovation% of
Nation
$503,700
$683,244
$561,069
$283,300
$497,600
$337,584
$313,150
$264,000
$1,329,829
$325,176
$1,038,700
$230,583
$6,367,935
Additions
$93,405
$121,363
$88,033
$123,297
$251,633
$94,571
$170,757
$123,999
$189,419
$99,596
$352,196
$231,882
$1,940,150
Renovation
$100,587
$121,871
$177,325
$132,837
$133,650
$144,517
$110,925
$132,899
$127,720
$146,209
$240,520
$145,759
$1,714,819
Total
$697,692
$926,478
$826,427
$539,434
$882,883
$576,672
$594,832
$520,898
$1,646,968
$570,981
$1,631,416
$608,224
$10,022,904
72.2%
73.7%
67.9%
52.5%
56.4%
58.5%
52.7%
50.7%
80.7%
57.0%
63.7%
37.9%
63.5%
13.4%
13.1%
10.6%
22.9%
28.5%
16.4%
28.7%
23.8%
11.5%
17.4%
21.6%
38.1%
19.4%
14.4%
13.2%
21.5%
24.6%
15.1%
25.1%
18.6%
25.5%
7.8%
25.6%
14.7%
24.0%
17.1%
7.0%
9.2%
8.2%
5.4%
8.8%
5.8%
5.9%
5.2%
16.4%
5.7%
16.3%
6.1%
100.0%
To read this table: In 2014, public schools in Region 1 (New England) are expecting to complete new buildings worth almost $504 million. They also expect to com-plete additions worth $93 million and renovations valued at $100 million. Total spending in Region 1 is projected at $697 million, with 72.2% of the dollars for new buildings, the balance for additions and renovations. New England is projected to account for 7.0% of all school construction dollars spent in the nation on schools to be completed in 2014.
3 SCHOOL CONSTRUCTION EXPECTED TO BE COMPLETED IN 2014 ($000’S)
PHO
TO C
OU
RTE
SY O
F H
UN
T C
ON
STRU
CTI
ON
GR
OU
P
1
2
3
4
5
6
7
8
9
10
11
12
Nat’l
Region New Schools New Addition Renovation% of
Nation% OF SPENDING FOR
$426,500
$657,980
$546,330
$386,201
$494,990
$244,978
$263,310
$170,520
$849,582
$245,340
$699,300
$242,570
$5,227,601
Additions
$141,816
$217,073
$134,531
$135,601
$248,303
$310,374
$254,614
$206,109
$348,421
$103,165
$260,615
$171,409
$2,532,031
Renovation
$108,693
$251,486
$125,006
$114,408
$131,100
$118,680
$103,779
$106,409
$268,876
$145,177
$102,967
$103,534
$1,680,116
Total
$677,009
$1,126,539
$805,867
$636,210
$874,393
$674,032
$621,703
$483,038
$1,466,879
$493,682
$1,062,882
$517,513
$9,439,748
63.0%
58.4%
67.8%
60.7%
56.6%
36.3%
42.4%
35.3%
57.9%
49.7%
65.8%
46.9%
55.4%
20.9%
19.3%
16.7%
21.3%
28.4%
46.0%
41.0%
42.7%
23.8%
20.9%
24.5%
33.1%
26.8%
16.1%
22.3%
15.5%
18.0%
15.0%
17.7%
16.6%
22.0%
18.3%
29.4%
9.7%
20.0%
17.8%
7.2%
11.9%
8.5%
6.7%
9.3%
7.1%
6.6%
5.1%
15.5%
5.2%
11.3%
5.5%
100.0%
To read this table: In the year 2014, school districts in Region 1 (New England) expect to start construction on new buildings worth $426 million. They also project starting work on $141 million in additions to existing buildings and on renovations valued at $108 million. Altogether, school districts in Region 1 predict they will start $677 million worth of school construction in 2014, with 63% of the dollars devoted to new schools, the balance to additions and renovations. Region 1’s spending will be about 7.2% of school construction spending projected to start in 2014.
4 SCHOOL CONSTRUCTION PROJECTED TO START IN 2014 ($000’S)
work is fully funded or completed. Many others protect their information by lump-ing all construction together. My own read-ing of the data on hand is that the projected fi gures are very low and that, when we count what has been accomplished in the next few years, the totals will be higher.
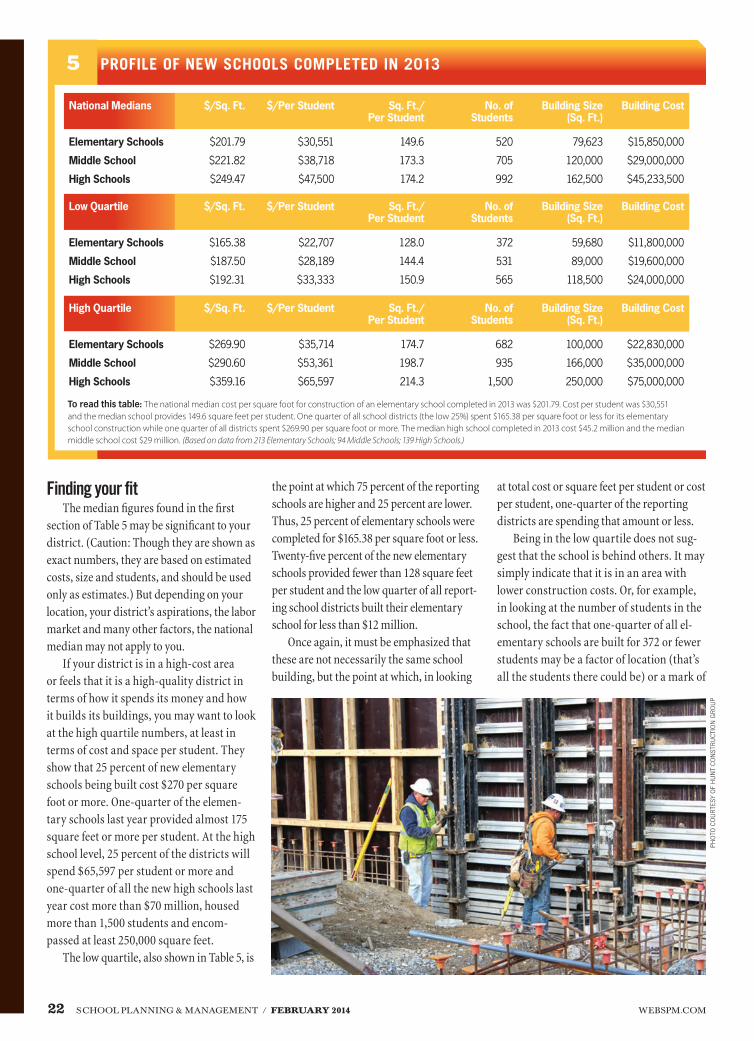
New schools in 2013Table 5 provides a profi le, on a national
basis, of new schools in 2013. The fi gures shown in Table 5 are medians. That means, for example, that among elementary schools built and reported during 2013, half of them cost $201.79 per square foot or more and half, $201.79 per square foot or less. By using medians rather than averages, we are able to minimize the infl uence of special schools that may be extremely expensive or inex-pensive, or cases where reporting is faulty.
Table 5 shows that in 2013, the median elementary school in the United States cost $201.79 per square foot to build. Median spending was $30,551 per pupil and the median elementary school provided 149.6 square feet for each student. The median elementary school reported was designed for 520 students and provides 79,623 square feet at a total cost of $15,850,000. Note that in fi nding medians, each variable
is looked at separately so that the school that cost $201 per square foot is not necessarily the same one that spends $30,551 per pupil or that was planned for 520 students.
Looking at middle schools, the median cost is $221.82 per square foot. Median spending per pupil was $38,718 and the median middle school provides 173.3 square feet per student. The median num-ber of students in middle schools built in 2013 is 705 and the building size is 120,000 square feet. The cost is $29 million.
The median high school cost $45.2
million and provided 162,500 square feet. It was designed to accommodate almost 1,000 students. The median high school provides 174.2 square feet per student at $47,500 for each student. The cost per square foot was $249.47.
Median costs for schools in 2013 are gener-ally higher than those found a year ago. One weakness of these annual reports is that there is no control in terms of where projects occur, their size or their function. The fi gures shown refl ect that group of new schools that were reported as completed in a given year, in this case 2013.
FEBRUARY 2014 / SCHOOL PLANNING & MANAGEMENT 21
PHO
TO C
OU
RTE
SY O
F H
UN
T C
ON
STRU
CTI
ON
GR
OU
P
Finding your fi tThe median fi gures found in the fi rst
section of Table 5 may be signifi cant to your district. (Caution: Though they are shown as exact numbers, they are based on estimated costs, size and students, and should be used only as estimates.) But depending on your location, your district’s aspirations, the labor market and many other factors, the national median may not apply to you.
If your district is in a high-cost area or feels that it is a high-quality district in terms of how it spends its money and how it builds its buildings, you may want to look at the high quartile numbers, at least in terms of cost and space per student. They show that 25 percent of new elementary schools being built cost $270 per square foot or more. One-quarter of the elemen-tary schools last year provided almost 175 square feet or more per student. At the high school level, 25 percent of the districts will spend $65,597 per student or more and one-quarter of all the new high schools last year cost more than $70 million, housed more than 1,500 students and encom-passed at least 250,000 square feet.
The low quartile, also shown in Table 5, is
the point at which 75 percent of the reporting schools are higher and 25 percent are lower. Thus, 25 percent of elementary schools were completed for $165.38 per square foot or less. Twenty-fi ve percent of the new elementary schools provided fewer than 128 square feet per student and the low quarter of all report-ing school districts built their elementary school for less than $12 million.
Once again, it must be emphasized that these are not necessarily the same school building, but the point at which, in looking
at total cost or square feet per student or cost per student, one-quarter of the reporting districts are spending that amount or less.
Being in the low quartile does not sug-gest that the school is behind others. It may simply indicate that it is in an area with lower construction costs. Or, for example, in looking at the number of students in the school, the fact that one-quarter of all el-ementary schools are built for 372 or fewer students may be a factor of location (that’s all the students there could be) or a mark of
22 SCHOOL PLANNING & MANAGEMENT / FEBRUARY 2014 WEBSPM.COM
Elementary Schools
Middle School
High Schools
$/Sq. Ft. $/Per Student Sq. Ft./Per Student
No. of Students
Building Size (Sq. Ft.)
Building Cost
$201.79
$221.82
$249.47
$30,551
$38,718
$47,500
149.6
173.3
174.2
520
705
992
79,623
120,000
162,500
$15,850,000
$29,000,000
$45,233,500
Elementary Schools
Middle School
High Schools
$/Sq. Ft. $/Per Student Sq. Ft./Per Student
No. of Students
Building Size (Sq. Ft.)
Building Cost
$165.38
$187.50
$192.31
$22,707
$28,189
$33,333
128.0
144.4
150.9
372
531
565
59,680
89,000
118,500
$11,800,000
$19,600,000
$24,000,000
Elementary Schools
Middle School
High Schools
$/Sq. Ft. $/Per Student Sq. Ft./Per Student
No. of Students
Building Size (Sq. Ft.)
Building Cost
$269.90
$290.60
$359.16
$35,714
$53,361
$65,597
174.7
198.7
214.3
682
935
1,500
100,000
166,000
250,000
$22,830,000
$35,000,000
$75,000,000
To read this table: The national median cost per square foot for construction of an elementary school completed in 2013 was $201.79. Cost per student was $30,551 and the median school provides 149.6 square feet per student. One quarter of all school districts (the low 25%) spent $165.38 per square foot or less for its elementary school construction while one quarter of all districts spent $269.90 per square foot or more. The median high school completed in 2013 cost $45.2 million and the median middle school cost $29 million. (Based on data from 213 Elementary Schools; 94 Middle Schools; 139 High Schools.)
5 PROFILE OF NEW SCHOOLS COMPLETED IN 2013
National Medians
Low Quartile
High Quartile
PHO
TO C
OU
RTE
SY O
F H
UN
T C
ON
STRU
CTI
ON
GR
OU
P
distinction (the school was kept small for educational purposes).
The fi gures shown in Table 5 are based on reports from 213 elementary schools, 94 middle schools and 139 high schools either completed in 2013 or substantially
fi nished and scheduled to open early in 2014. Keep in mind that the fi gures shown in Table 5 are meant as comparison points, not as arbiters of right and wrong, cheap or expensive.
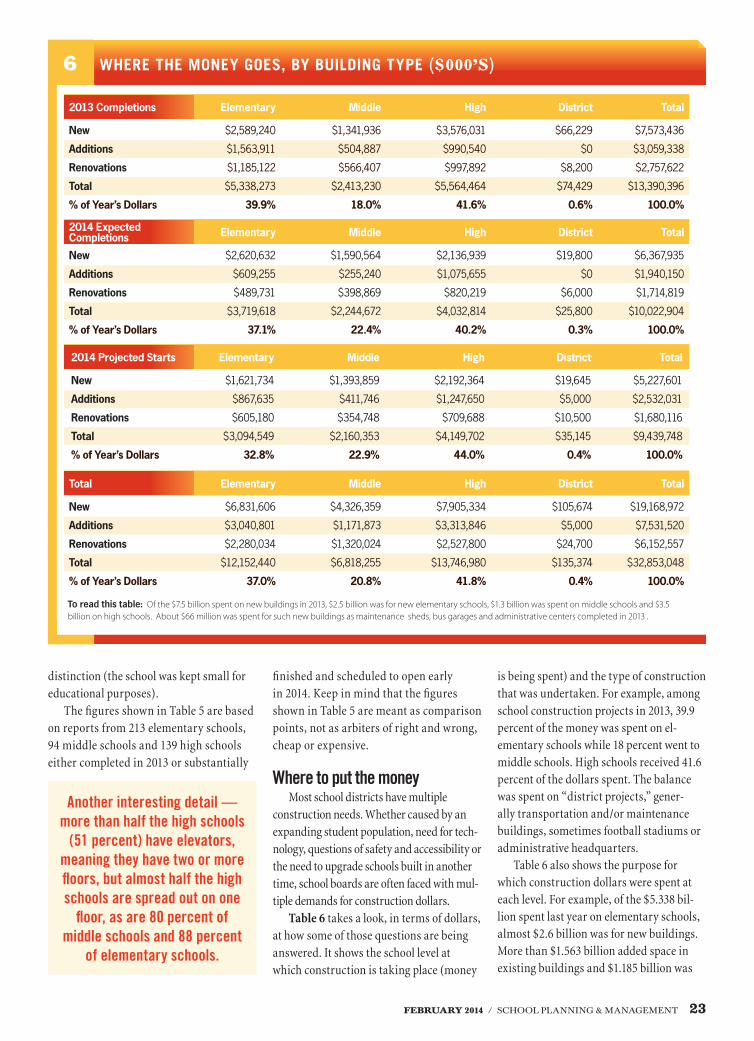
Where to put the moneyMost school districts have multiple
construction needs. Whether caused by an expanding student population, need for tech-nology, questions of safety and accessibility or the need to upgrade schools built in another time, school boards are often faced with mul-tiple demands for construction dollars.
Table 6 takes a look, in terms of dollars, at how some of those questions are being answered. It shows the school level at which construction is taking place (money
is being spent) and the type of construction that was undertaken. For example, among school construction projects in 2013, 39.9 percent of the money was spent on el-ementary schools while 18 percent went to middle schools. High schools received 41.6 percent of the dollars spent. The balance was spent on “district projects,” gener-ally transportation and/or maintenance buildings, sometimes football stadiums or administrative headquarters.
Table 6 also shows the purpose for which construction dollars were spent at each level. For example, of the $5.338 bil-lion spent last year on elementary schools, almost $2.6 billion was for new buildings. More than $1.563 billion added space in existing buildings and $1.185 billion was
New
Additions
Renovations
Total
% of Year’s Dollars
Elementary Middle High District Total
$2,589,240
$1,563,911
$1,185,122
$5,338,273
39.9%
$1,341,936
$504,887
$566,407
$2,413,230
18.0%
$3,576,031
$990,540
$997,892
$5,564,464
41.6%
$66,229
$0
$8,200
$74,429
0.6%
$7,573,436
$3,059,338
$2,757,622
$13,390,396
100.0%
New
Additions
Renovations
Total
% of Year’s Dollars
Elementary Middle High District Total
$2,620,632
$609,255
$489,731
$3,719,618
37.1%
$1,590,564
$255,240
$398,869
$2,244,672
22.4%
$2,136,939
$1,075,655
$820,219
$4,032,814
40.2%
$19,800
$0
$6,000
$25,800
0.3%
$6,367,935
$1,940,150
$1,714,819
$10,022,904
100.0%
New
Additions
Renovations
Total
% of Year’s Dollars
Elementary Middle High District Total
$1,621,734
$867,635
$605,180
$3,094,549
32.8%
$1,393,859
$411,746
$354,748
$2,160,353
22.9%
$2,192,364
$1,247,650
$709,688
$4,149,702
44.0%
$19,645
$5,000
$10,500
$35,145
0.4%
$5,227,601
$2,532,031
$1,680,116
$9,439,748
100.0%
New
Additions
Renovations
Total
% of Year’s Dollars
Elementary Middle High District Total
$6,831,606
$3,040,801
$2,280,034
$12,152,440
37.0%
$4,326,359
$1,171,873
$1,320,024
$6,818,255
20.8%
$7,905,334
$3,313,846
$2,527,800
$13,746,980
41.8%
$105,674
$5,000
$24,700
$135,374
0.4%
$19,168,972
$7,531,520
$6,152,557
$32,853,048
100.0%
To read this table: Of the $7.5 billion spent on new buildings in 2013, $2.5 billion was for new elementary schools, $1.3 billion was spent on middle schools and $3.5 billion on high schools. About $66 million was spent for such new buildings as maintenance sheds, bus garages and administrative centers completed in 2013 .
6 WHERE THE MONEY GOES, BY BUILDING TYPE ($000’S)
2013 Completions
2014 Expected Completions
2014 Projected Starts
Total
Another interesting detail — more than half the high schools
(51 percent) have elevators, meaning they have two or more fl oors, but almost half the high schools are spread out on one
fl oor, as are 80 percent of middle schools and 88 percent
of elementary schools.
FEBRUARY 2014 / SCHOOL PLANNING & MANAGEMENT 23
for renovations to existing buildings.Table 6 also shows how districts are ex-
pecting to spend their dollars in projects be-ing completed or starting in 2014. In general, high schools get the lion’s share of the dollars.
The total dollars expended in 2013 totaled just about $13.4 billion. There are other reporting agencies that write about ongoing school construction spending that report considerably more activity than that.
Our numbers attempt to track actual work completed in a given calendar year. Those other agencies are reporting on the amount of activity that is taking place at a given time, no matter when it started or will be completed. The fi gures in the bottom section of Table 6 (Total Construction Underway) are a measure of ongoing activity — projects in various states of completion — and show that the im-pact of school construction on the economy at any one time is close to $33 billion.
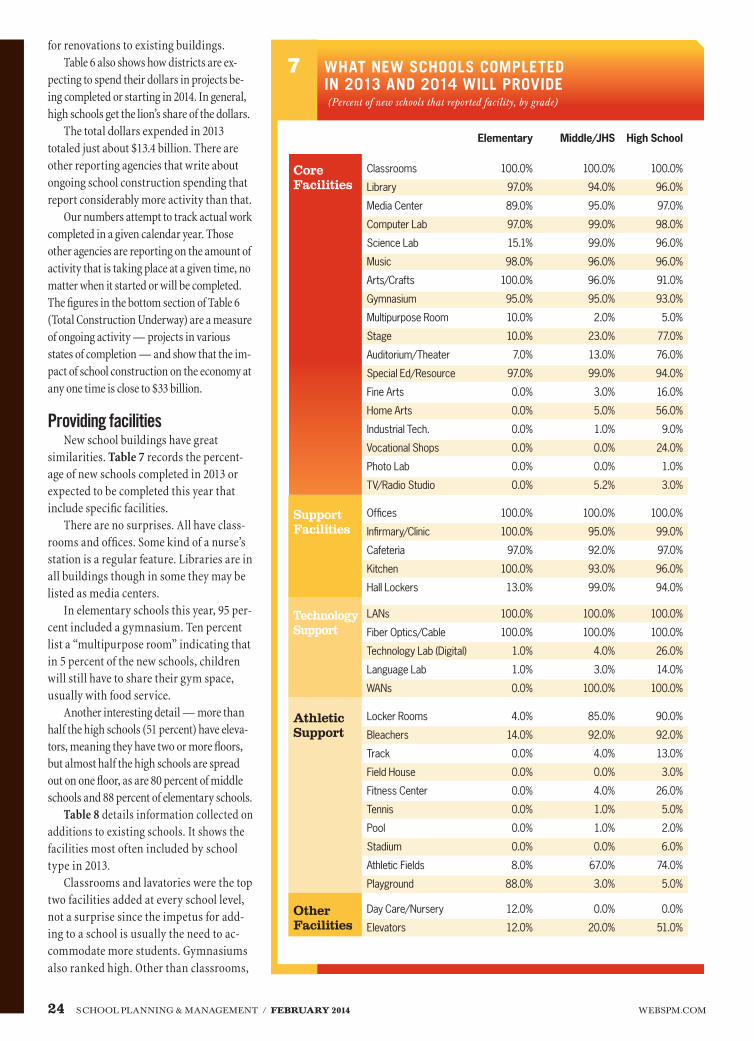
Providing facilitiesNew school buildings have great
similarities. Table 7 records the percent-age of new schools completed in 2013 or expected to be completed this year that include specifi c facilities.
There are no surprises. All have class-rooms and offi ces. Some kind of a nurse’s station is a regular feature. Libraries are in all buildings though in some they may be listed as media centers.
In elementary schools this year, 95 per-cent included a gymnasium. Ten percent list a “multipurpose room” indicating that in 5 percent of the new schools, children will still have to share their gym space, usually with food service.
Another interesting detail — more than half the high schools (51 percent) have eleva-tors, meaning they have two or more fl oors, but almost half the high schools are spread out on one fl oor, as are 80 percent of middle schools and 88 percent of elementary schools.
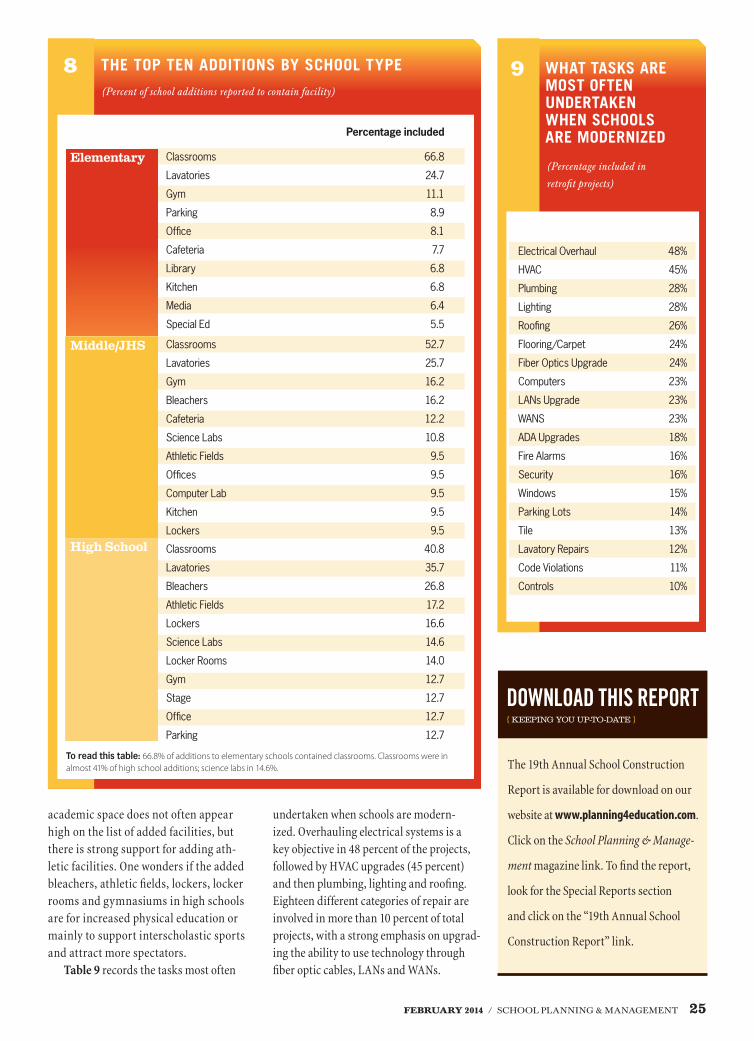
Table 8 details information collected on additions to existing schools. It shows the facilities most often included by school type in 2013.
Classrooms and lavatories were the top two facilities added at every school level, not a surprise since the impetus for add-ing to a school is usually the need to ac-commodate more students. Gymnasiums also ranked high. Other than classrooms,
Elementary Middle/JHS High School
100.0%
100.0%
97.0%
100.0%
13.0%
100.0%
95.0%
92.0%
93.0%
99.0%
100.0%
99.0%
97.0%
96.0%
94.0%
100.0%
97.0%
89.0%
97.0%
15.1%
98.0%
100.0%
95.0%
10.0%
10.0%
7.0%
97.0%
0.0%
0.0%
0.0%
0.0%
0.0%
0.0%
100.0%
94.0%
95.0%
99.0%
99.0%
96.0%
96.0%
95.0%
2.0%
23.0%
13.0%
99.0%
3.0%
5.0%
1.0%
0.0%
0.0%
5.2%
100.0%
96.0%
97.0%
98.0%
96.0%
96.0%
91.0%
93.0%
5.0%
77.0%
76.0%
94.0%
16.0%
56.0%
9.0%
24.0%
1.0%
3.0%
100.0%
100.0%
1.0%
1.0%
0.0%
100.0%
100.0%
4.0%
3.0%
100.0%
Classrooms
Library
Media Center
Computer Lab
Science Lab
Music
Arts/Crafts
Gymnasium
Multipurpose Room
Stage
Auditorium/Theater
Special Ed/Resource
Fine Arts
Home Arts
Industrial Tech.
Vocational Shops
Photo Lab
TV/Radio Studio
Offi ces
Infi rmary/Clinic
Cafeteria
Kitchen
Hall Lockers
LANs
Fiber Optics/Cable
Technology Lab (Digital)
Language Lab
WANs
100.0%
100.0%
26.0%
14.0%
100.0%
Core Facilities
Support Facilities
Technology Support
Locker Rooms
Bleachers
Track
Field House
Fitness Center
Tennis
Pool
Stadium
Athletic Fields
Playground
4.0%
14.0%
0.0%
0.0%
0.0%
0.0%
0.0%
0.0%
8.0%
88.0%
85.0%
92.0%
4.0%
0.0%
4.0%
1.0%
1.0%
0.0%
67.0%
3.0%
90.0%
92.0%
13.0%
3.0%
26.0%
5.0%
2.0%
6.0%
74.0%
5.0%
Day Care/Nursery
Elevators
12.0%
12.0%
0.0%
20.0%
0.0%
51.0%
Athletic Support
Other Facilities
7 WHAT NEW SCHOOLS COMPLETED IN 2013 AND 2014 WILL PROVIDE(Percent of new schools that reported facility, by grade)
24 SCHOOL PLANNING & MANAGEMENT / FEBRUARY 2014 WEBSPM.COM
Percentage included
Classrooms
Lavatories
Gym
Parking
Offi ce
Cafeteria
Library
Kitchen
Media
Special Ed
66.8
24.7
11.1
8.9
8.1
7.7
6.8
6.8
6.4
5.5
Classrooms
Lavatories
Bleachers
Athletic Fields
Lockers
Science Labs
Locker Rooms
Gym
Stage
Offi ce
Parking
40.8
35.7
26.8
17.2
16.6
14.6
14.0
12.7
12.7
12.7
12.7
Classrooms
Lavatories
Gym
Bleachers
Cafeteria
Science Labs
Athletic Fields
Offi ces
Computer Lab
Kitchen
Lockers
52.7
25.7
16.2
16.2
12.2
10.8
9.5
9.5
9.5
9.5
9.5
Elementary
Middle/JHS
8 THE TOP TEN ADDITIONS BY SCHOOL TYPE
(Percent of school additions reported to contain facility)
9
(Percentage included in
retrofi t projects)
WHAT TASKS ARE MOST OFTEN UNDERTAKEN WHEN SCHOOLS ARE MODERNIZED
Electrical Overhaul
HVAC
Plumbing
Lighting
Roofi ng
Flooring/Carpet
Fiber Optics Upgrade
Computers
LANs Upgrade
WANS
ADA Upgrades
Fire Alarms
Security
Windows
Parking Lots
Tile
Lavatory Repairs
Code Violations
Controls
48%
45%
28%
28%
26%
24%
24%
23%
23%
23%
18%
16%
16%
15%
14%
13%
12%
11%
10%
High School
To read this table: 66.8% of additions to elementary schools contained classrooms. Classrooms were in almost 41% of high school additions; science labs in 14.6%.
DOWNLOAD THIS REPORT{ KEEPING YOU UP-TO-DATE }
The 19th Annual School Construction
Report is available for download on our
website at www.planning4education.com.
Click on the School Planning & Manage-
ment magazine link. To fi nd the report,
look for the Special Reports section
and click on the “19th Annual School
Construction Report” link.
FEBRUARY 2014 / SCHOOL PLANNING & MANAGEMENT 25
academic space does not often appear high on the list of added facilities, but there is strong support for adding ath-letic facilities. One wonders if the added bleachers, athletic fi elds, lockers, locker rooms and gymnasiums in high schools are for increased physical education or mainly to support interscholastic sports and attract more spectators.
Table 9 records the tasks most often
undertaken when schools are modern-ized. Overhauling electrical systems is a key objective in 48 percent of the projects, followed by HVAC upgrades (45 percent) and then plumbing, lighting and roofi ng. Eighteen different categories of repair are involved in more than 10 percent of total projects, with a strong emphasis on upgrad-ing the ability to use technology through fi ber optic cables, LANs and WANs.
A Closer Look at RegionsWhat is happening in your part of the country.
Elementary Middle High$328.95 $63,054
187.7522
97,287$34,849
$364.47 $66,039
178824
153,493$54,650
$385.42 $74,712
1871,131
213,544$83,700
$/sq. ft.$/studentSq. ft./studentStudentsSize (sq. ft.)Total cost ($000)
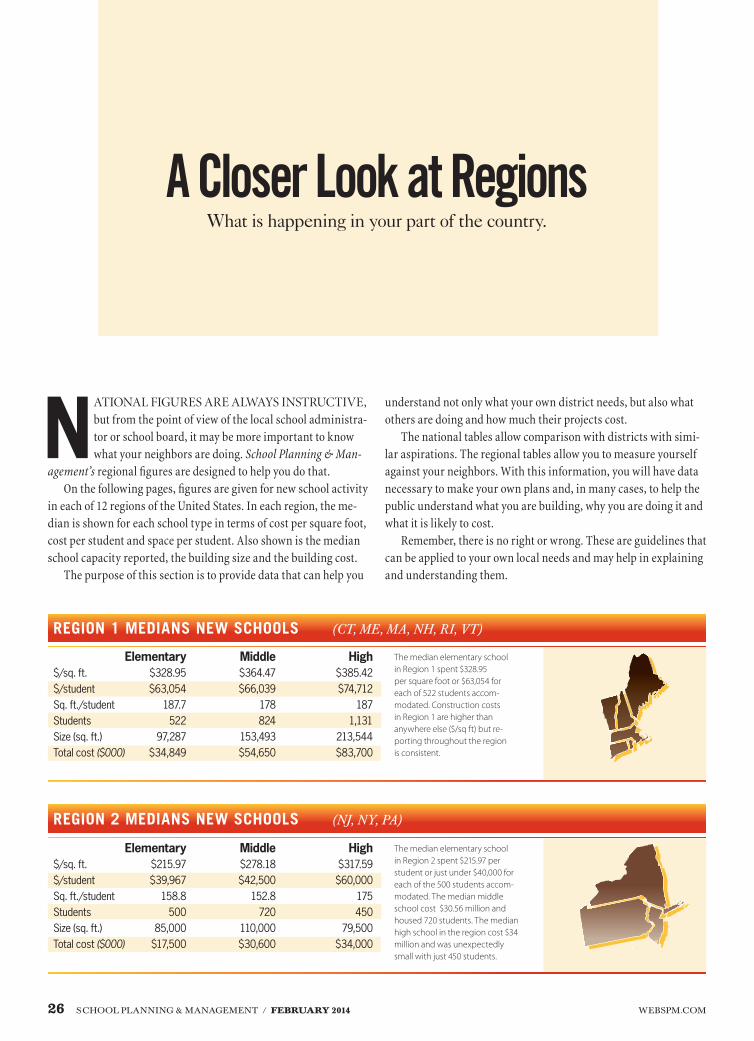
REGION 1 MEDIANS NEW SCHOOLS (CT, ME, MA, NH, RI, VT)
The median elementary school in Region 1 spent $328.95 per square foot or $63,054 for each of 522 students accom-modated. Construction costs in Region 1 are higher than anywhere else ($/sq ft) but re-porting throughout the region is consistent.
Elementary Middle High$215.97$39,967
158.8500
85,000 $17,500
$278.18$42,500
152.8720
110,000 $30,600
$317.59$60,000
175450
79,500 $34,000
$/sq. ft.$/studentSq. ft./studentStudentsSize (sq. ft.)Total cost ($000)
REGION 2 MEDIANS NEW SCHOOLS (NJ, NY, PA)
The median elementary school in Region 2 spent $215.97 per student or just under $40,000 for each of the 500 students accom-modated. The median middle school cost $30.56 million and housed 720 students. The median high school in the region cost $34 million and was unexpectedly small with just 450 students.
NATIONAL FIGURES ARE ALWAYS INSTRUCTIVE, but from the point of view of the local school administra-tor or school board, it may be more important to know what your neighbors are doing. School Planning & Man-
agement’s regional fi gures are designed to help you do that. On the following pages, fi gures are given for new school activity
in each of 12 regions of the United States. In each region, the me-dian is shown for each school type in terms of cost per square foot, cost per student and space per student. Also shown is the median school capacity reported, the building size and the building cost.
The purpose of this section is to provide data that can help you
understand not only what your own district needs, but also what others are doing and how much their projects cost.
The national tables allow comparison with districts with simi-lar aspirations. The regional tables allow you to measure yourself against your neighbors. With this information, you will have data necessary to make your own plans and, in many cases, to help the public understand what you are building, why you are doing it and what it is likely to cost.
Remember, there is no right or wrong. These are guidelines that can be applied to your own local needs and may help in explaining and understanding them.
26 SCHOOL PLANNING & MANAGEMENT / FEBRUARY 2014 WEBSPM.COM
Elementary Middle High$190.00$31,196
173.3375
75,000 $15,700
$221.82$45,951
207.2531
110,000 $25,000
$200.00$45,226
206.7750
150,000 $29,900
$/sq. ft.$/studentSq. ft./studentStudentsSize (sq. ft.)Total cost ($000)
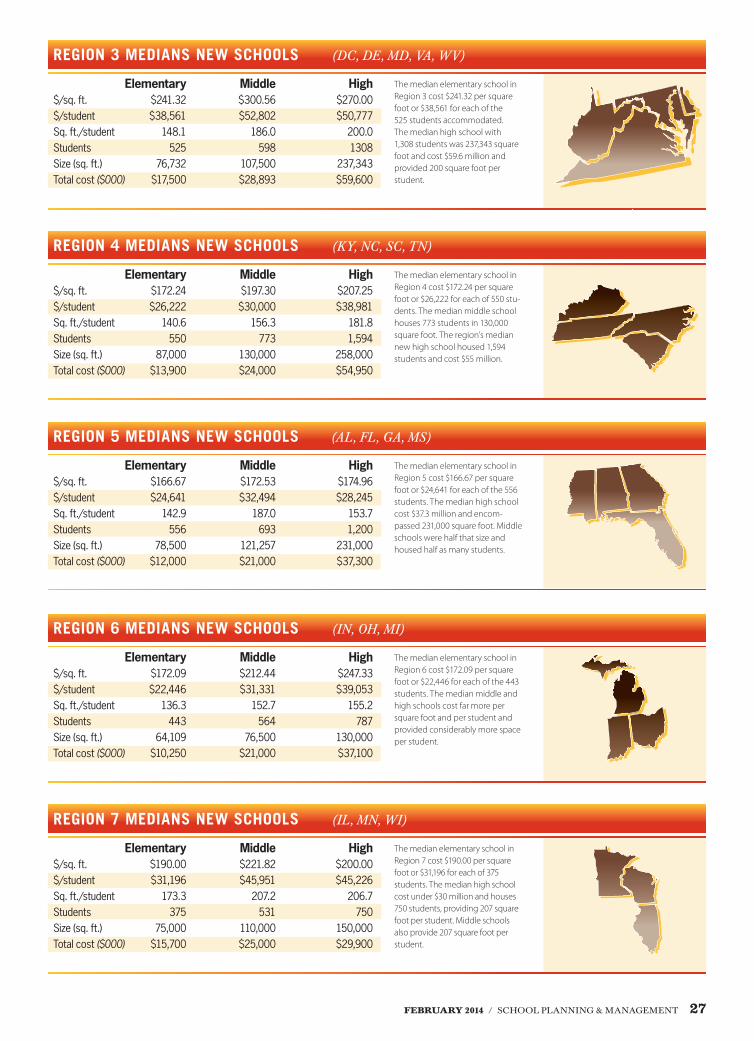
REGION 7 MEDIANS NEW SCHOOLS (IL, MN, WI)
The median elementary school in Region 7 cost $190.00 per square foot or $31,196 for each of 375 students. The median high school cost under $30 million and houses 750 students, providing 207 square foot per student. Middle schools also provide 207 square foot per student.
Elementary Middle High$241.32$38,561
148.1525
76,732 $17,500
$300.56$52,802
186.0598
107,500 $28,893
$270.00 $50,777
200.01308
237,343 $59,600
$/sq. ft.$/studentSq. ft./studentStudentsSize (sq. ft.)Total cost ($000)
REGION 3 MEDIANS NEW SCHOOLS (DC, DE, MD, VA, WV)
The median elementary school in Region 3 cost $241.32 per square foot or $38,561 for each of the 525 students accommodated. The median high school with 1,308 students was 237,343 square foot and cost $59.6 million and provided 200 square foot per student.
Elementary Middle High$172.24$26,222
140.6550
87,000 $13,900
$197.30$30,000
156.3773
130,000 $24,000
$207.25$38,981
181.81,594
258,000 $54,950
$/sq. ft.$/studentSq. ft./studentStudentsSize (sq. ft.)Total cost ($000)
REGION 4 MEDIANS NEW SCHOOLS (KY, NC, SC, TN)
The median elementary school in Region 4 cost $172.24 per square foot or $26,222 for each of 550 stu-dents. The median middle school houses 773 students in 130,000 square foot. The region’s median new high school housed 1,594 students and cost $55 million.
Elementary Middle High$166.67$24,641
142.9556
78,500 $12,000
$172.53$32,494
187.0693
121,257 $21,000
$174.96$28,245
153.71,200
231,000 $37,300
$/sq. ft.$/studentSq. ft./studentStudentsSize (sq. ft.)Total cost ($000)
REGION 5 MEDIANS NEW SCHOOLS (AL, FL, GA, MS)
The median elementary school in Region 5 cost $166.67 per square foot or $24,641 for each of the 556 students. The median high school cost $37.3 million and encom-passed 231,000 square foot. Middle schools were half that size and housed half as many students.
Elementary Middle High$172.09$22,446
136.3443
64,109 $10,250
$212.44$31,331
152.7564
76,500 $21,000
$247.33$39,053
155.2787
130,000 $37,100
$/sq. ft.$/studentSq. ft./studentStudentsSize (sq. ft.)Total cost ($000)
REGION 6 MEDIANS NEW SCHOOLS (IN, OH, MI)
The median elementary school in Region 6 cost $172.09 per square foot or $22,446 for each of the 443 students. The median middle and high schools cost far more per square foot and per student and provided considerably more space per student.
FEBRUARY 2014 / SCHOOL PLANNING & MANAGEMENT 27
Elementary Middle High$183.36$27,273
141.8550
78,000 $14,000
$237.89$46,962
183.7517
99,000 $27,450
$216.67$42,570
187.5800
170,000 $40,000
$/sq. ft.$/studentSq. ft./studentStudentsSize (sq. ft.)Total cost ($000)
REGION 8 MEDIANS NEW SCHOOLS (IA, KS, MO, NE)
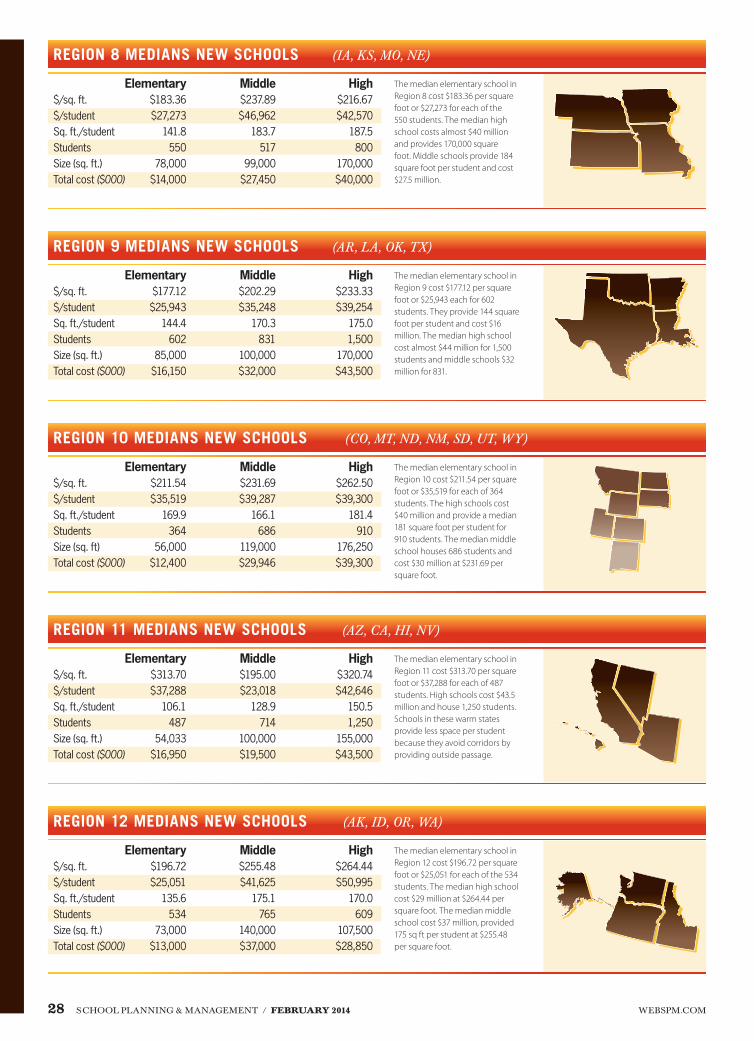
The median elementary school in Region 8 cost $183.36 per square foot or $27,273 for each of the 550 students. The median high school costs almost $40 million and provides 170,000 square foot. Middle schools provide 184 square foot per student and cost $27.5 million.
Elementary Middle High$177.12$25,943
144.4602
85,000 $16,150
$202.29$35,248
170.3831
100,000 $32,000
$233.33$39,254
175.01,500
170,000 $43,500
$/sq. ft.$/studentSq. ft./studentStudentsSize (sq. ft.)Total cost ($000)
REGION 9 MEDIANS NEW SCHOOLS (AR, LA, OK, TX)
The median elementary school in Region 9 cost $177.12 per square foot or $25,943 each for 602 students. They provide 144 square foot per student and cost $16 million. The median high school cost almost $44 million for 1,500 students and middle schools $32 million for 831.
Elementary Middle High$211.54$35,519
169.9364
56,000 $12,400
$231.69$39,287
166.1686
119,000 $29,946
$262.50$39,300
181.4910
176,250 $39,300
$/sq. ft.$/studentSq. ft./studentStudentsSize (sq. ft)Total cost ($000)
REGION 10 MEDIANS NEW SCHOOLS (CO, MT, ND, NM, SD, UT, WY)
The median elementary school in Region 10 cost $211.54 per square foot or $35,519 for each of 364 students. The high schools cost $40 million and provide a median 181 square foot per student for 910 students. The median middle school houses 686 students and cost $30 million at $231.69 per square foot.
Elementary Middle High$313.70$37,288
106.1487
54,033 $16,950
$195.00$23,018
128.9714
100,000 $19,500
$320.74$42,646
150.51,250
155,000 $43,500
$/sq. ft.$/studentSq. ft./studentStudentsSize (sq. ft.)Total cost ($000)
REGION 11 MEDIANS NEW SCHOOLS (AZ, CA, HI, NV)
The median elementary school in Region 11 cost $313.70 per square foot or $37,288 for each of 487 students. High schools cost $43.5 million and house 1,250 students. Schools in these warm states provide less space per student because they avoid corridors by providing outside passage.
Elementary Middle High$196.72$25,051
135.6534
73,000 $13,000
$255.48$41,625
175.1765
140,000 $37,000
$264.44$50,995
170.0609
107,500 $28,850
$/sq. ft.$/studentSq. ft./studentStudentsSize (sq. ft.)Total cost ($000)
REGION 12 MEDIANS NEW SCHOOLS (AK, ID, OR, WA)
The median elementary school in Region 12 cost $196.72 per square foot or $25,051 for each of the 534 students. The median high school cost $29 million at $264.44 per square foot. The median middle school cost $37 million, provided 175 sq ft per student at $255.48 per square foot.
28 SCHOOL PLANNING & MANAGEMENT / FEBRUARY 2014 WEBSPM.COM
Trends Since 1995T H E OV ER A L L PI C T U R E
This is the 19th year that School Planning & Management has col-
lected and published data on costs of new schools in the United
States. Reporting is done based on medians. The number shown is
more than what one-half of schools constructed cost and less than
the cost for the other half (see Table 5 for more on national medians and the
regional tables starting on page 26 for regional medians).
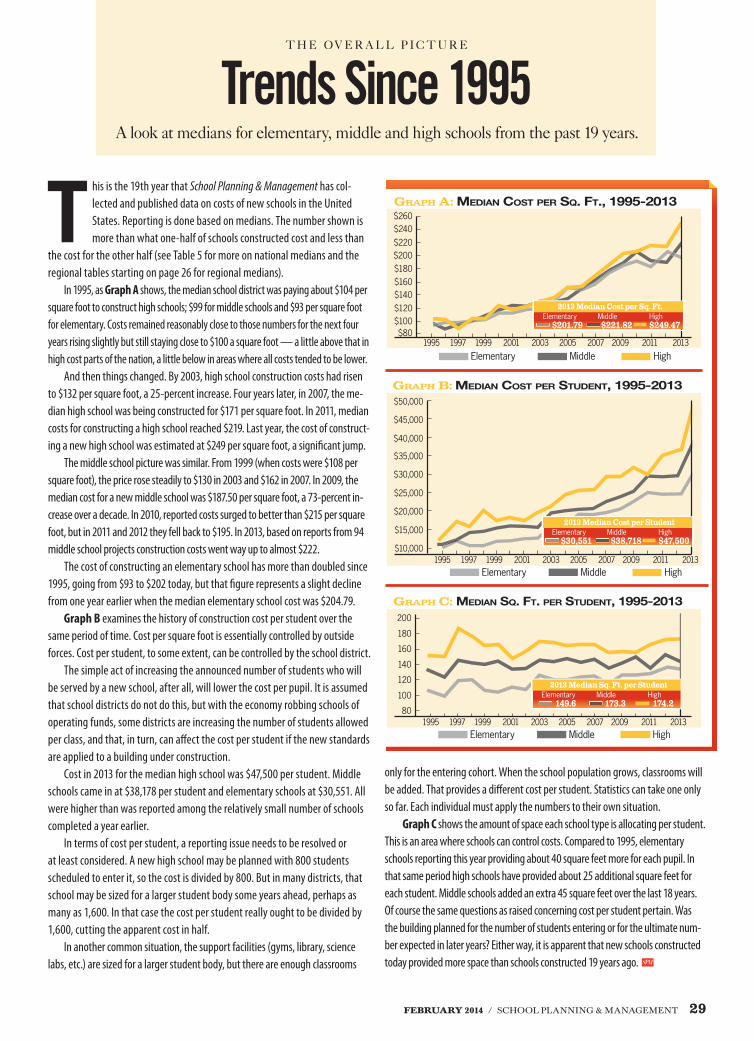
In 1995, as Graph A shows, the median school district was paying about $104 per
square foot to construct high schools; $99 for middle schools and $93 per square foot
for elementary. Costs remained reasonably close to those numbers for the next four
years rising slightly but still staying close to $100 a square foot — a little above that in
high cost parts of the nation, a little below in areas where all costs tended to be lower.
And then things changed. By 2003, high school construction costs had risen
to $132 per square foot, a 25-percent increase. Four years later, in 2007, the me-
dian high school was being constructed for $171 per square foot. In 2011, median
costs for constructing a high school reached $219. Last year, the cost of construct-
ing a new high school was estimated at $249 per square foot, a signifi cant jump.
The middle school picture was similar. From 1999 (when costs were $108 per
square foot), the price rose steadily to $130 in 2003 and $162 in 2007. In 2009, the
median cost for a new middle school was $187.50 per square foot, a 73-percent in-
crease over a decade. In 2010, reported costs surged to better than $215 per square
foot, but in 2011 and 2012 they fell back to $195. In 2013, based on reports from 94
middle school projects construction costs went way up to almost $222.
The cost of constructing an elementary school has more than doubled since
1995, going from $93 to $202 today, but that fi gure represents a slight decline
from one year earlier when the median elementary school cost was $204.79.
Graph B examines the history of construction cost per student over the
same period of time. Cost per square foot is essentially controlled by outside
forces. Cost per student, to some extent, can be controlled by the school district.
The simple act of increasing the announced number of students who will
be served by a new school, after all, will lower the cost per pupil. It is assumed
that school districts do not do this, but with the economy robbing schools of
operating funds, some districts are increasing the number of students allowed
per class, and that, in turn, can aff ect the cost per student if the new standards
are applied to a building under construction.
Cost in 2013 for the median high school was $47,500 per student. Middle
schools came in at $38,178 per student and elementary schools at $30,551. All
were higher than was reported among the relatively small number of schools
completed a year earlier.
In terms of cost per student, a reporting issue needs to be resolved or
at least considered. A new high school may be planned with 800 students
scheduled to enter it, so the cost is divided by 800. But in many districts, that
school may be sized for a larger student body some years ahead, perhaps as
many as 1,600. In that case the cost per student really ought to be divided by
1,600, cutting the apparent cost in half.
In another common situation, the support facilities (gyms, library, science
labs, etc.) are sized for a larger student body, but there are enough classrooms
only for the entering cohort. When the school population grows, classrooms will
be added. That provides a diff erent cost per student. Statistics can take one only
so far. Each individual must apply the numbers to their own situation.
Graph C shows the amount of space each school type is allocating per student.
This is an area where schools can control costs. Compared to 1995, elementary
schools reporting this year providing about 40 square feet more for each pupil. In
that same period high schools have provided about 25 additional square feet for
each student. Middle schools added an extra 45 square feet over the last 18 years.
Of course the same questions as raised concerning cost per student pertain. Was
the building planned for the number of students entering or for the ultimate num-
ber expected in later years? Either way, it is apparent that new schools constructed
today provided more space than schools constructed 19 years ago. SPM
A look at medians for elementary, middle and high schools from the past 19 years.
FEBRUARY 2014 / SCHOOL PLANNING & MANAGEMENT 29
Elementary Middle High
80
120
160
100
140
180
200
GRAPH C: MEDIAN SQ. FT. PER STUDENT, 1995-2013
1995 1997 1999 2001 2003 2005 2007 2009 2011 2013
2013 Median Sq. Ft. per Student
149.6 173.3 174.2Elementary Middle High
GRAPH A: MEDIAN COST PER SQ. FT., 1995-2013
Elementary Middle High1995 1997 1999 2001 2003 2005 2007 2009 2011 2013
$80
$120
$160
$100
$140
$180$200
$240$220
$260
2013 Median Cost per Sq. Ft.
$201.79 $221.82 $249.47Elementary Middle High
Elementary Middle High
GRAPH B: MEDIAN COST PER STUDENT, 1995-2013
1995 1997 1999 2001 2003 2005 2007 2009 2011$10,000
$20,000
$30,000
$45,000
$15,000
$25,000
$35,000
$50,000
$40,000
2013
2013 Median Cost per Student
$30,551 $38,718 $47,500Elementary Middle High


![Internet in Russia. 2014 [statistics & trends]](https://img.pdfslide.net/doc/110x75/53fa1c7f8d7f7253318b521e/internet-in-russia-2014-statistics-trends.jpg)