Embed Size (px)
Citation preview
National Vital Statistics Reports Volume 62, Number 7 January 6, 2014
United States Life Tables, 2009 by Elizabeth Arias, Ph.D., Division of Vital Statistics
Abstract Objectives—This report presents complete period life tables for
the United States by race, Hispanic origin, and sex based on age-specific death rates in 2009.
Methods—Data used to prepare the 2009 life tables are 2009 final mortality statistics; July 1, 2009, population estimates based on the 2000 decennial census; and 2009 Medicare data for persons aged 66–99. The methodology used to estimate the 2009 life tables is the same as that used for data year 2008, which was revised from that used for data years 2000–2007. The methodology used to estimate the life tables for the Hispanic population remains unchanged from that developed for the publication of life tables by Hispanic origin for data year 2006.
Results—In 2009, the overall expectation of life at birth was 78.5 years. Between 2008 and 2009, life expectancy at birth increased for all groups considered. Life expectancy increased for both males (from 75.6 to 76.0) and females (80.6 to 80.9) and for the white population (78.5 to 78.8), the black population (74.0 to 74.5), the Hispanic population (81.0 to 81.2), the non-Hispanic white population (78.4 to 78.7), and the non-Hispanic black population (73.7 to 74.2).
Keywords: life expectancy c survival c death rates c race
Introduction There are two types of U.S. life tables: the cohort (or generation)
life table and the period (or current) life table. The cohort life table presents the mortality experience of a particular birth cohort—all persons born in the year 1900, for example—from the moment of birth through consecutive ages in successive calendar years. Based on age-specific death rates observed through consecutive calendar years, the cohort life table reflects the mortality experience of an actual cohort from birth until no lives remain in the group. To prepare just a single complete cohort life table requires data over many years. It is usually not feasible to construct cohort life tables entirely on the basis of observed data for real cohorts due to data unavailability or incompleteness (1). For example, a life table representation of the
U.S. DEPARTMENT OF HEACenters for Disease C
National Center National Vital
mortality experience of a cohort of persons born in 1970 would require the use of data projection techniques to estimate deaths into the future (2,3).
Unlike the cohort life table, the period life table does not represent the mortality experience of an actual birth cohort. Rather, the period life table presents what would happen to a hypothetical cohort if it experienced throughout its entire life the mortality conditions of a particular period in time. For example, a period life table for 2009 assumes a hypothetical cohort that is subject throughout its lifetime to the age-specific death rates prevailing for the actual population in 2009. The period life table may thus be characterized as rendering a ‘‘snapshot’’ of current mortality experience and showing the long-range implications of a set of age-specific death rates that prevailed in a given year. In this report, the term ‘‘life table’’ refers only to the period life table and not to the cohort life table.
Life tables can be classified in two ways according to the length of the age interval in which data are presented. A complete life table contains data for every single year of age. An abridged life table typically contains data by 5- or 10-year age intervals. A complete life table, of course, can easily be aggregated into 5- or 10-year age groups (refer to Technical Notes at the end of this report for instructions). Other than the decennial life tables, U.S. life tables based on data prior to 1997 are abridged life tables constructed by reference to a standard table (4). This report presents complete period life tables by race, Hispanic origin, race for the non-Hispanic population, and sex.
Data and Methods The data used to prepare the U.S. life tables for 2009 are final
numbers of deaths for the year 2009, postcensal population estimates for the year 2009, and age-specific death and population counts for Medicare beneficiaries aged 66–99 for the year 2009 from the Centers for Medicare & Medicaid Services. Data from the Medicare program are used to supplement vital statistics and census data for ages 66 and over. (See Technical Notes for a detailed description of the data sets used.)
LTH AND HUMAN SERVICES ontrol and Prevention
for Health Statistics Statistics System
2 National Vital Statistics Reports, Vol. 62, No. 7, January 6, 2014
Expectation of life
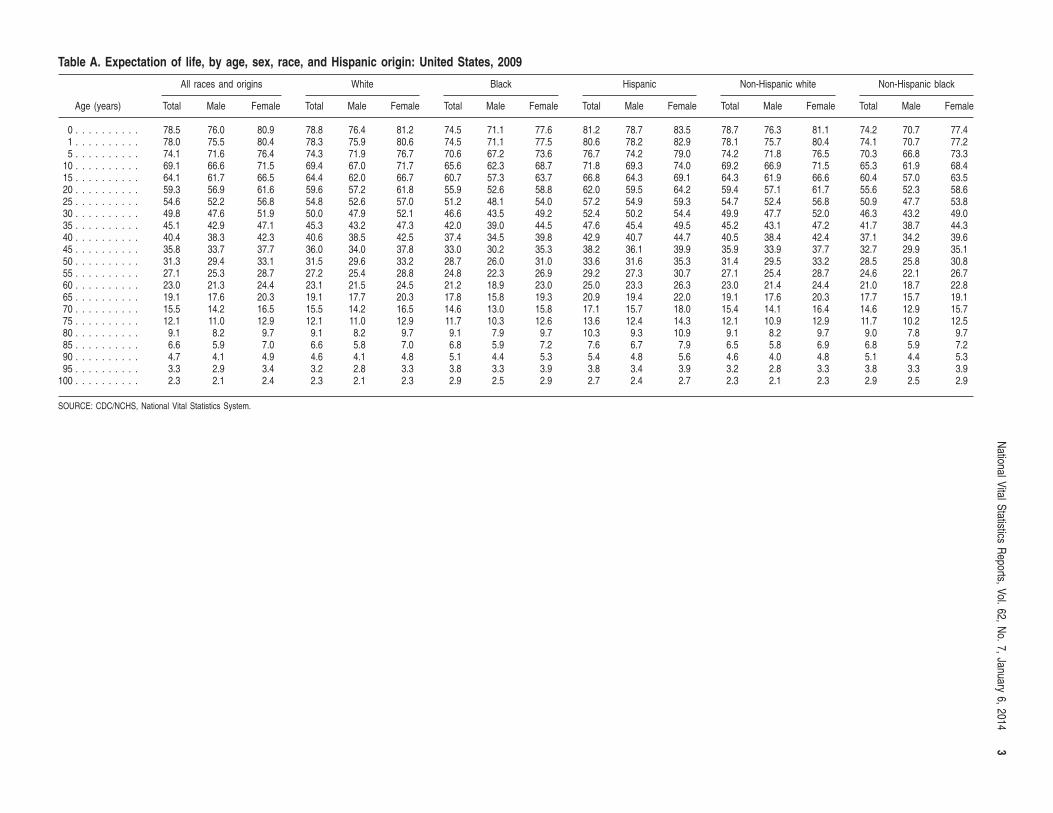
The most frequently used life table statistic is life expectancy (ex), which is the average number of years of life remaining for persons who have attained a given age (x). Life expectancy and other life table values for each age in 2009 are shown for the total population by race, Hispanic origin, and sex in Tables 1–18. Life expectancy is summarized by age, race, Hispanic origin, and sex in Table A.
Life expectancy at birth (e0) for 2009 for the total population was 78.5 years. This represents the average number of years that the members of the hypothetical life table cohort can expect to live at the time of birth (Table A).
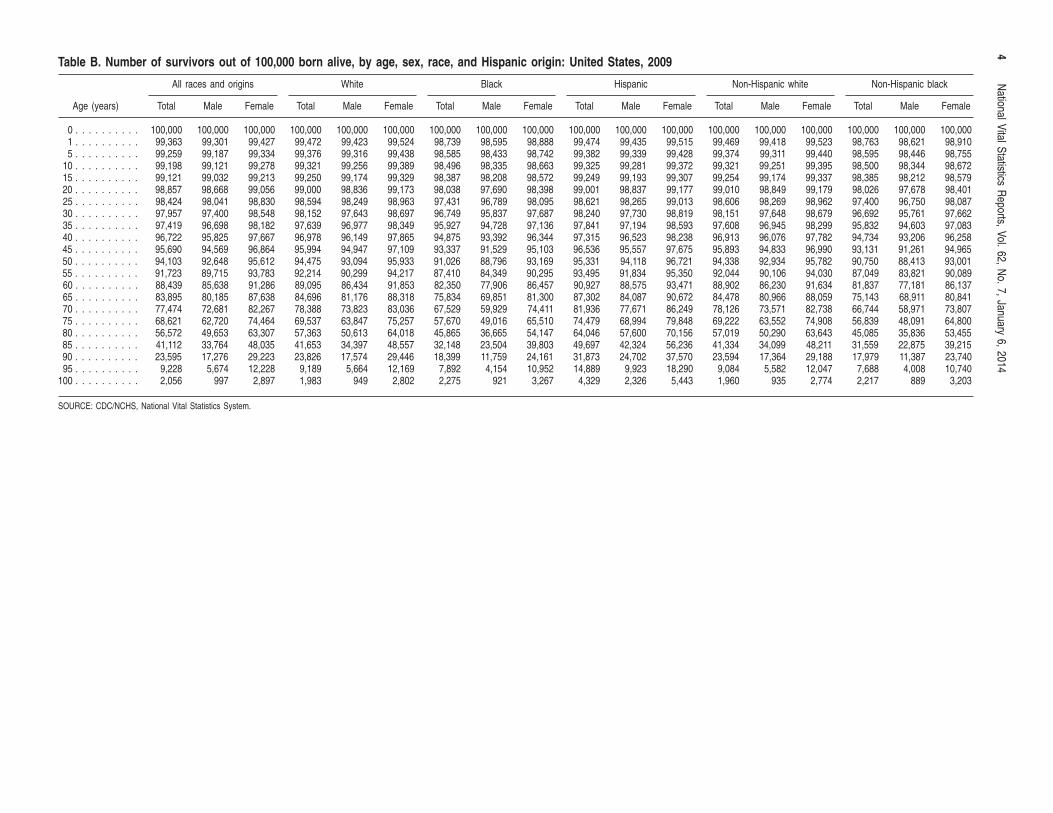
Survivors to specified ages
Another way of assessing the longevity of the period life table cohort is by determining the proportion that survives to specified ages. The lx column of the life table provides the data for computing this proportion. Table B summarizes the number of survivors by age, race, Hispanic origin, and sex. To illustrate, 56,572 persons out of the original 2009 hypothetical life table cohort of 100,000 (or 56.6%) were alive at exact age 80. In other words, the probability that a person will survive from birth to age 80, given 2009 age-specific mortality, is 56.6%. Probabilities of survival can be calculated at any age by dividing the number of survivors at the terminal age by the number at the beginning age. For example, to calculate the probability of surviving from age 20 to age 85, one would divide the number of survivors at age 85 (41,112) by the number of survivors at age 20 (98,857), which results in a 41.6% probability of survival.
Explanation of the columns of the life table
Column 1. Age (between x and x + 1)—Shows the age interval between the two exact ages indicated. For instance, ‘‘20–21’’ refers to the 1-year interval between the 20th and 21st birthdays.
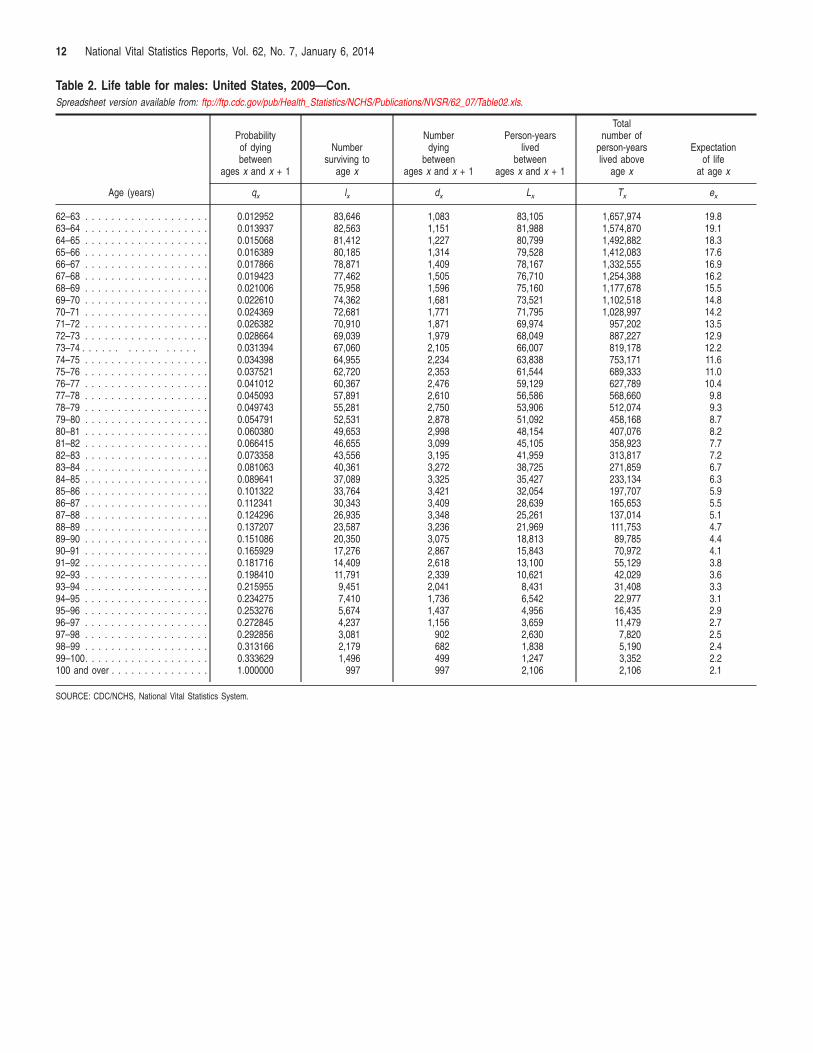
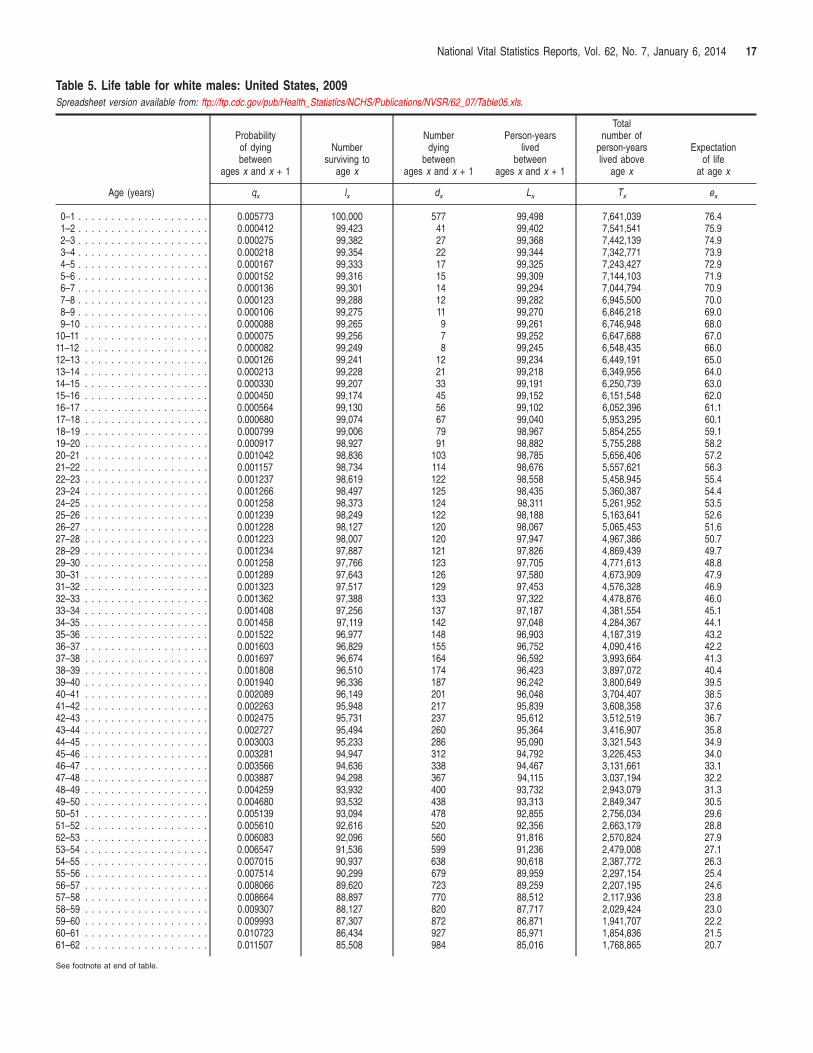
Column 2. Probability of dying (qx)—Shows the probability of dying between ages x and x + 1. For example, for males in the age interval 20–21, the probability of dying is 0.001116 (Table 2). This column forms the basis of the life table; all subsequent columns are derived from it.
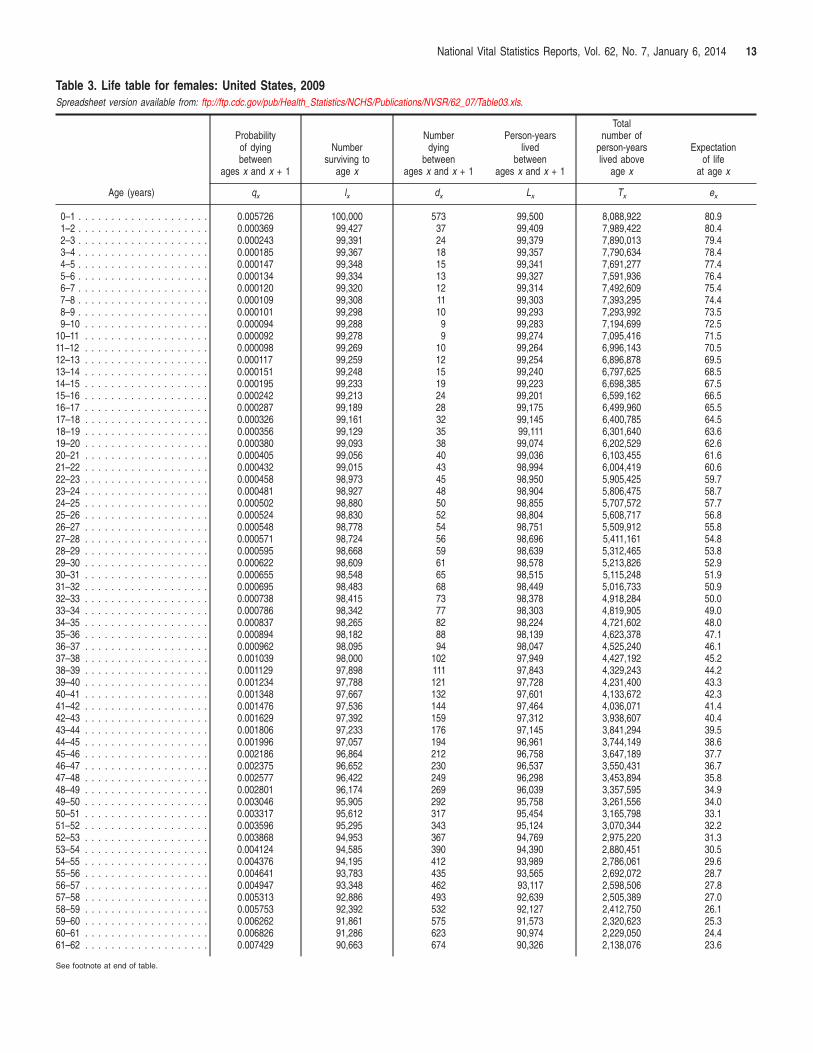
Column 3. Number surviving (lx)—Shows the number of persons from the original hypothetical cohort of 100,000 live births who survive to the beginning of each age interval. The lx values are computed from the qx values, which are successively applied to the remainder of the original 100,000 persons still alive at the beginning of each age interval. Thus, out of 100,000 female babies born alive, 99,427 will complete their first year of life and enter the second; 99,278 will reach age 10; 99,056 will reach age 20; and 48,035 will live to age 85 (Table 3).
Column 4. Number dying (dx)—Shows the number dying in each successive age interval out of the original 100,000 live births. For example, out of 100,000 males born alive, 699 will die in their first year of life; 110 will die between ages 20 and 21; and 997 will die after reaching age 100 (Table 2). Each figure in column 4 is the difference between two successive figures in column 3.
Column 5. Person-years lived (Lx )—Shows the number of person-years lived by the hypothetical life table cohort within an age interval x to x + 1. Each figure in column 5 represents the total time (in years) lived between two indicated birthdays by all those reaching the earlier
birthday. Thus, the figure 98,613 for males in the age interval 20–21 is the total number of years lived between the 20th and 21st birthdays by the 98,668 males (column 3) who reached their 20th birthday out of 100,000 males born alive (Table 2).
Column 6. Total number of person-years lived (Tx )—Shows the total number of person-years that would be lived after the beginning of the age interval x to x + 1 by the hypothetical life table cohort. For example, the figure 5,614,200 is the total number of years lived after attaining age 20 by the 98,668 males reaching that age (Table 2).
Column 7. Expectation of life (ex)—Shows, at any given age, the average number of years remaining to be lived by those surviving to that age, based on a given set of age-specific rates of dying. It is derived by dividing the total person-years that would be lived beyond age x by the number of persons who survived to that age interval (Tx / lx ). Thus, the average remaining lifetime for males who reach age 20 is 56.9 years (5,614,200 divided by 98,668) (Table 2).
Results
Life expectancy in the United States
Tables 1–18 show complete life tables for 2009 by race (white and black), Hispanic origin, race for the non-Hispanic population, and sex. Table A summarizes life expectancy by age, race, Hispanic origin, and sex. Life expectancy at birth for 2009 represents the average number of years that a group of infants would live if they were to experience throughout life the age-specific death rates prevailing in 2009. In 2009, life expectancy at birth was 78.5 years, an increase of 0.4 years, from 78.1 years in 2008.
Changes in mortality levels by age and cause of death have a major effect on changes in life expectancy. Life expectancy at birth increased in 2009 over 2008 because of decreases in mortality from heart disease, cancer, unintentional injuries, stroke, and Chronic lower respiratory diseases. Increases in life expectancy in 2009 from 2008 were slightly offset by increases in mortality from Chronic liver disease and suicide. Decreases in mortality from heart disease, unintentional injuries, cancer, Chronic lower respiratory diseases, and homicide contributed to increases in life expectancy among the male population. Increases in life expectancy for the female population were a result of decreases in mortality from heart disease, stroke, cancer, Alzheimer’s disease, and Chronic lower respiratory diseases (5).
The difference in life expectancy between the sexes was 4.9 years in 2009, declining from 5.0 years in 2008. From 1900 to 1975, the difference in life expectancy between the sexes increased from 2.0 years to 7.8 years. The increasing gap during these years is attributed to increases in male mortality due to ischemic heart disease and lung cancer, both of which increased largely as the result of men’s early and widespread adoption of cigarette smoking (6,7). Between 1979 and 2005, the difference in life expectancy between the sexes narrowed from 7.8 years to 5.0 years, increasing slightly to 5.1 years in 2006, and declining again to 5.0 years in 2007. The general decline in the sex difference since 1979 reflects proportionately greater increases in lung cancer mortality for women than for men and proportionately larger decreases in heart disease mortality among men (6,7).
The 2009 life table may be used to compare life expectancy at any age from birth onward. On the basis of mortality experienced in 2009, a person aged 65 could expect to live an average of 19.1 more
3 N
ational Vital Statistics Reports, Vol. 62, N
o. 7, January 6, 2014 Table A. Expectation of life, by age, sex, race, and Hispanic origin: United States, 2009
All races and origins White Black Hispanic Non-Hispanic white Non-Hispanic black
Age (years) Total Male Female Total Male Female Total Male Female Total Male Female Total Male Female Total Male Female
0 . . . . . . . . . . 78.5 76.0 80.9 78.8 76.4 81.2 74.5 71.1 77.6 81.2 78.7 83.5 78.7 76.3 81.1 74.2 70.7 77.4 1 . . . . . . . . . . 78.0 75.5 80.4 78.3 75.9 80.6 74.5 71.1 77.5 80.6 78.2 82.9 78.1 75.7 80.4 74.1 70.7 77.2 5 . . . . . . . . . . 74.1 71.6 76.4 74.3 71.9 76.7 70.6 67.2 73.6 76.7 74.2 79.0 74.2 71.8 76.5 70.3 66.8 73.3
10 . . . . . . . . . . 69.1 66.6 71.5 69.4 67.0 71.7 65.6 62.3 68.7 71.8 69.3 74.0 69.2 66.9 71.5 65.3 61.9 68.4 15 . . . . . . . . . . 64.1 61.7 66.5 64.4 62.0 66.7 60.7 57.3 63.7 66.8 64.3 69.1 64.3 61.9 66.6 60.4 57.0 63.5 20 . . . . . . . . . . 59.3 56.9 61.6 59.6 57.2 61.8 55.9 52.6 58.8 62.0 59.5 64.2 59.4 57.1 61.7 55.6 52.3 58.6 25 . . . . . . . . . . 54.6 52.2 56.8 54.8 52.6 57.0 51.2 48.1 54.0 57.2 54.9 59.3 54.7 52.4 56.8 50.9 47.7 53.8 30 . . . . . . . . . . 49.8 47.6 51.9 50.0 47.9 52.1 46.6 43.5 49.2 52.4 50.2 54.4 49.9 47.7 52.0 46.3 43.2 49.0 35 . . . . . . . . . . 45.1 42.9 47.1 45.3 43.2 47.3 42.0 39.0 44.5 47.6 45.4 49.5 45.2 43.1 47.2 41.7 38.7 44.3 40 . . . . . . . . . . 40.4 38.3 42.3 40.6 38.5 42.5 37.4 34.5 39.8 42.9 40.7 44.7 40.5 38.4 42.4 37.1 34.2 39.6 45 . . . . . . . . . . 35.8 33.7 37.7 36.0 34.0 37.8 33.0 30.2 35.3 38.2 36.1 39.9 35.9 33.9 37.7 32.7 29.9 35.1 50 . . . . . . . . . . 31.3 29.4 33.1 31.5 29.6 33.2 28.7 26.0 31.0 33.6 31.6 35.3 31.4 29.5 33.2 28.5 25.8 30.8 55 . . . . . . . . . . 27.1 25.3 28.7 27.2 25.4 28.8 24.8 22.3 26.9 29.2 27.3 30.7 27.1 25.4 28.7 24.6 22.1 26.7 60 . . . . . . . . . . 23.0 21.3 24.4 23.1 21.5 24.5 21.2 18.9 23.0 25.0 23.3 26.3 23.0 21.4 24.4 21.0 18.7 22.8 65 . . . . . . . . . . 19.1 17.6 20.3 19.1 17.7 20.3 17.8 15.8 19.3 20.9 19.4 22.0 19.1 17.6 20.3 17.7 15.7 19.1 70 . . . . . . . . . . 15.5 14.2 16.5 15.5 14.2 16.5 14.6 13.0 15.8 17.1 15.7 18.0 15.4 14.1 16.4 14.6 12.9 15.7 75 . . . . . . . . . . 12.1 11.0 12.9 12.1 11.0 12.9 11.7 10.3 12.6 13.6 12.4 14.3 12.1 10.9 12.9 11.7 10.2 12.5 80 . . . . . . . . . . 9.1 8.2 9.7 9.1 8.2 9.7 9.1 7.9 9.7 10.3 9.3 10.9 9.1 8.2 9.7 9.0 7.8 9.7 85 . . . . . . . . . . 6.6 5.9 7.0 6.6 5.8 7.0 6.8 5.9 7.2 7.6 6.7 7.9 6.5 5.8 6.9 6.8 5.9 7.2 90 . . . . . . . . . . 4.7 4.1 4.9 4.6 4.1 4.8 5.1 4.4 5.3 5.4 4.8 5.6 4.6 4.0 4.8 5.1 4.4 5.3 95 . . . . . . . . . . 3.3 2.9 3.4 3.2 2.8 3.3 3.8 3.3 3.9 3.8 3.4 3.9 3.2 2.8 3.3 3.8 3.3 3.9
100 . . . . . . . . . . 2.3 2.1 2.4 2.3 2.1 2.3 2.9 2.5 2.9 2.7 2.4 2.7 2.3 2.1 2.3 2.9 2.5 2.9
SOURCE: CDC/NCHS, National Vital Statistics System.
4 N
ational Vital Statistics Reports, Vol. 62, N
o. 7, January 6, 2014 Table B. Number of survivors out of 100,000 born alive, by age, sex, race, and Hispanic origin: United States, 2009
All races and origins White Black Hispanic Non-Hispanic white Non-Hispanic black
Age (years) Total Male Female Total Male Female Total Male Female Total Male Female Total Male Female Total Male Female
0 . . . . . . . . . . 100,000 100,000 100,000 100,000 100,000 100,000 100,000 100,000 100,000 100,000 100,000 100,000 100,000 100,000 100,000 100,000 100,000 100,000 1 . . . . . . . . . . 99,363 99,301 99,427 99,472 99,423 99,524 98,739 98,595 98,888 99,474 99,435 99,515 99,469 99,418 99,523 98,763 98,621 98,910 5 . . . . . . . . . . 99,259 99,187 99,334 99,376 99,316 99,438 98,585 98,433 98,742 99,382 99,339 99,428 99,374 99,311 99,440 98,595 98,446 98,755
10 . . . . . . . . . . 99,198 99,121 99,278 99,321 99,256 99,389 98,496 98,335 98,663 99,325 99,281 99,372 99,321 99,251 99,395 98,500 98,344 98,672 15 . . . . . . . . . . 99,121 99,032 99,213 99,250 99,174 99,329 98,387 98,208 98,572 99,249 99,193 99,307 99,254 99,174 99,337 98,385 98,212 98,579 20 . . . . . . . . . . 98,857 98,668 99,056 99,000 98,836 99,173 98,038 97,690 98,398 99,001 98,837 99,177 99,010 98,849 99,179 98,026 97,678 98,401 25 . . . . . . . . . . 98,424 98,041 98,830 98,594 98,249 98,963 97,431 96,789 98,095 98,621 98,265 99,013 98,606 98,269 98,962 97,400 96,750 98,087 30 . . . . . . . . . . 97,957 97,400 98,548 98,152 97,643 98,697 96,749 95,837 97,687 98,240 97,730 98,819 98,151 97,648 98,679 96,692 95,761 97,662 35 . . . . . . . . . . 97,419 96,698 98,182 97,639 96,977 98,349 95,927 94,728 97,136 97,841 97,194 98,593 97,608 96,945 98,299 95,832 94,603 97,083 40 . . . . . . . . . . 96,722 95,825 97,667 96,978 96,149 97,865 94,875 93,392 96,344 97,315 96,523 98,238 96,913 96,076 97,782 94,734 93,206 96,258 45 . . . . . . . . . . 95,690 94,569 96,864 95,994 94,947 97,109 93,337 91,529 95,103 96,536 95,557 97,675 95,893 94,833 96,990 93,131 91,261 94,965 50 . . . . . . . . . . 94,103 92,648 95,612 94,475 93,094 95,933 91,026 88,796 93,169 95,331 94,118 96,721 94,338 92,934 95,782 90,750 88,413 93,001 55 . . . . . . . . . . 91,723 89,715 93,783 92,214 90,299 94,217 87,410 84,349 90,295 93,495 91,834 95,350 92,044 90,106 94,030 87,049 83,821 90,089 60 . . . . . . . . . . 88,439 85,638 91,286 89,095 86,434 91,853 82,350 77,906 86,457 90,927 88,575 93,471 88,902 86,230 91,634 81,837 77,181 86,137 65 . . . . . . . . . . 83,895 80,185 87,638 84,696 81,176 88,318 75,834 69,851 81,300 87,302 84,087 90,672 84,478 80,966 88,059 75,143 68,911 80,841 70 . . . . . . . . . . 77,474 72,681 82,267 78,388 73,823 83,036 67,529 59,929 74,411 81,936 77,671 86,249 78,126 73,571 82,738 66,744 58,971 73,807 75 . . . . . . . . . . 68,621 62,720 74,464 69,537 63,847 75,257 57,670 49,016 65,510 74,479 68,994 79,848 69,222 63,552 74,908 56,839 48,091 64,800 80 . . . . . . . . . . 56,572 49,653 63,307 57,363 50,613 64,018 45,865 36,665 54,147 64,046 57,600 70,156 57,019 50,290 63,643 45,085 35,836 53,455 85 . . . . . . . . . . 41,112 33,764 48,035 41,653 34,397 48,557 32,148 23,504 39,803 49,697 42,324 56,236 41,334 34,099 48,211 31,559 22,875 39,215 90 . . . . . . . . . . 23,595 17,276 29,223 23,826 17,574 29,446 18,399 11,759 24,161 31,873 24,702 37,570 23,594 17,364 29,188 17,979 11,387 23,740 95 . . . . . . . . . . 9,228 5,674 12,228 9,189 5,664 12,169 7,892 4,154 10,952 14,889 9,923 18,290 9,084 5,582 12,047 7,688 4,008 10,740
100 . . . . . . . . . . 2,056 997 2,897 1,983 949 2,802 2,275 921 3,267 4,329 2,326 5,443 1,960 935 2,774 2,217 889 3,203
SOURCE: CDC/NCHS, National Vital Statistics System.
5 National Vital Statistics Reports, Vol. 62, No. 7, January 6, 2014
years for a total of 84.1 years; a person aged 85 could expect to live an additional 6.6 years for a total of 91.6 years; and a person aged 100 could expect to live an additional 2.3 years, on average (Table A).
Life expectancy by race
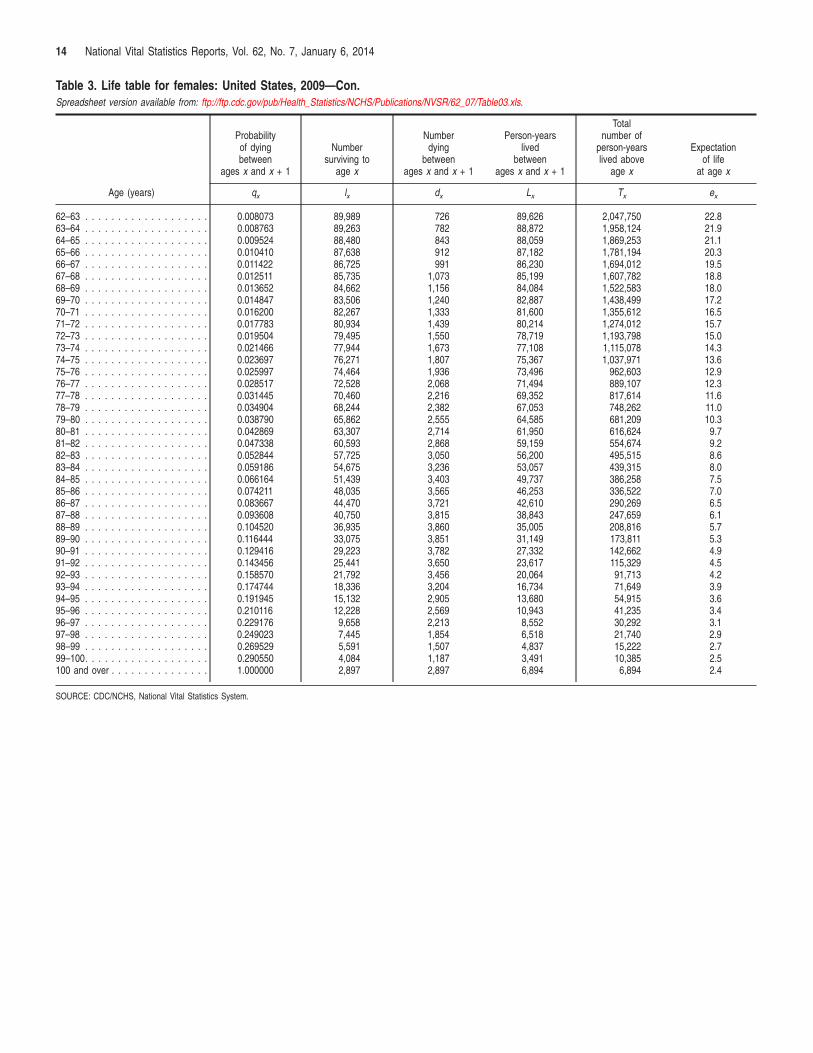
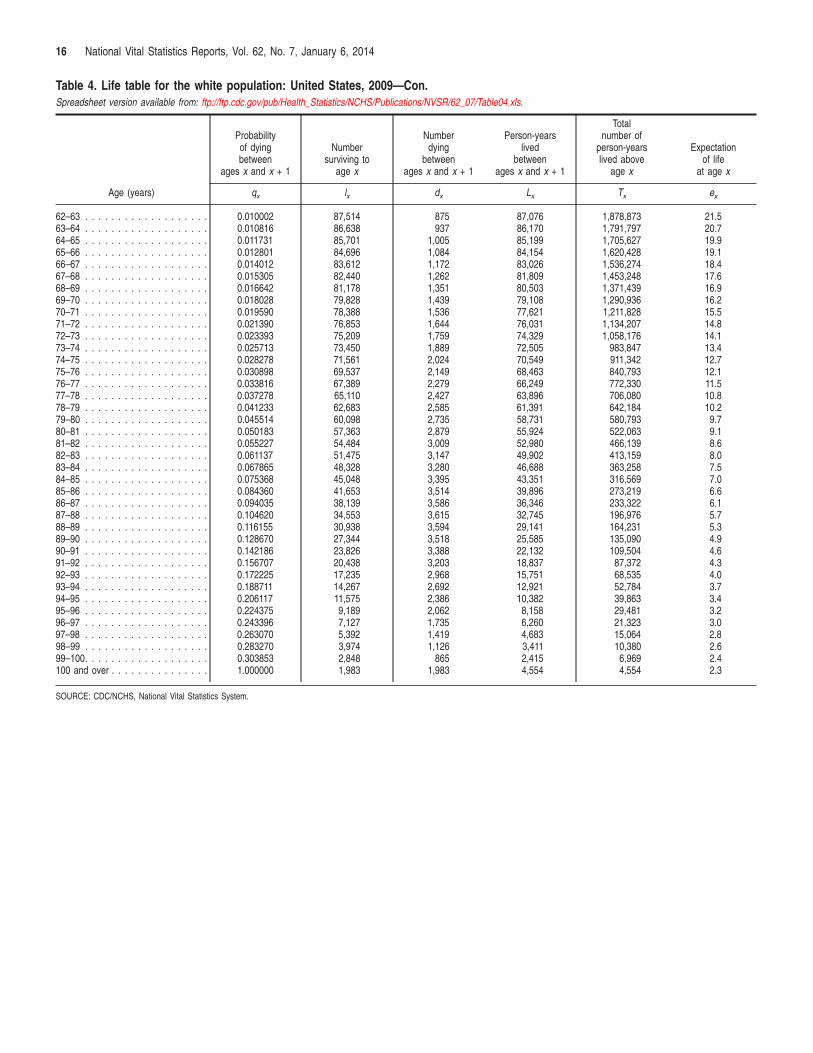
Between 2008 and 2009, life expectancy increased 0.5 years to 74.5 years for the black population, and 0.3 years to 78.8 years for the white population. The difference in life expectancy between the white and black populations was 4.3 years in 2009, a historically record-low level. The white-black difference in life expectancy narrowed from 14.6 years in 1900 to 5.7 years in 1982, but it increased to 7.1 years in 1993 before beginning to decline again in 1994 (7.0 years). The increase in the gap from 1983 to 1993 was largely the result of increases in mortality among the black male population due to HIV infection and homicide (7).
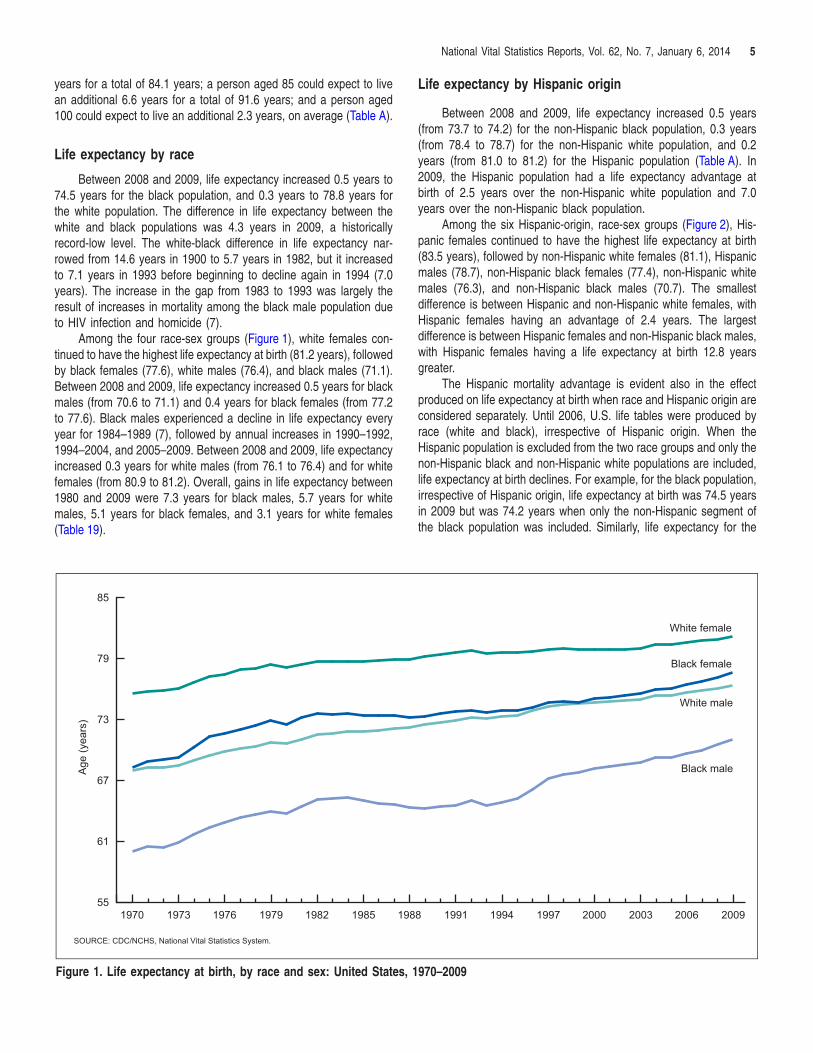
Among the four race-sex groups (Figure 1), white females continued to have the highest life expectancy at birth (81.2 years), followed by black females (77.6), white males (76.4), and black males (71.1). Between 2008 and 2009, life expectancy increased 0.5 years for black males (from 70.6 to 71.1) and 0.4 years for black females (from 77.2 to 77.6). Black males experienced a decline in life expectancy every year for 1984–1989 (7), followed by annual increases in 1990–1992, 1994–2004, and 2005–2009. Between 2008 and 2009, life expectancy increased 0.3 years for white males (from 76.1 to 76.4) and for white females (from 80.9 to 81.2). Overall, gains in life expectancy between 1980 and 2009 were 7.3 years for black males, 5.7 years for white males, 5.1 years for black females, and 3.1 years for white females (Table 19).
SOURCE: CDC/NCHS, National Vital Statistics System.
Age
(yea
rs)
55
61
67
73
79
85
1970 1973 1976 1979 1982 1985 198
Figure 1. Life expectancy at birth, by race and sex: United States, 1
Life expectancy by Hispanic origin
Between 2008 and 2009, life expectancy increased 0.5 years (from 73.7 to 74.2) for the non-Hispanic black population, 0.3 years (from 78.4 to 78.7) for the non-Hispanic white population, and 0.2 years (from 81.0 to 81.2) for the Hispanic population (Table A). In 2009, the Hispanic population had a life expectancy advantage at birth of 2.5 years over the non-Hispanic white population and 7.0 years over the non-Hispanic black population.
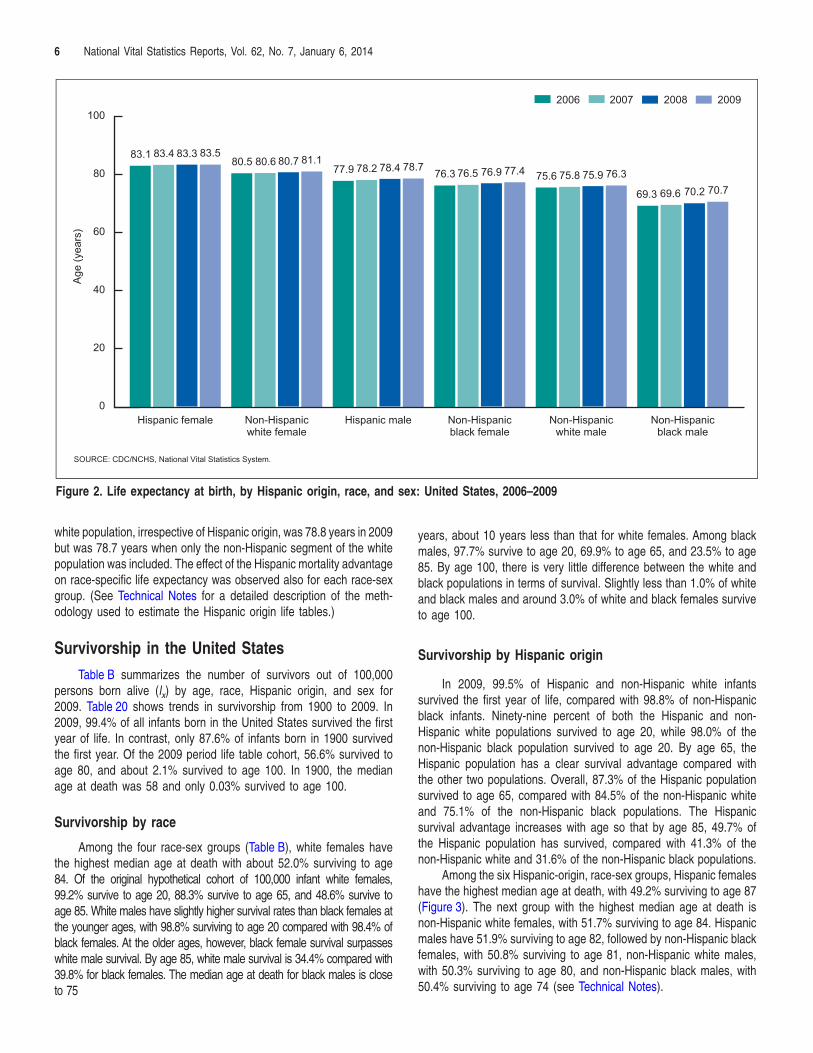
Among the six Hispanic-origin, race-sex groups (Figure 2), Hispanic females continued to have the highest life expectancy at birth (83.5 years), followed by non-Hispanic white females (81.1), Hispanic males (78.7), non-Hispanic black females (77.4), non-Hispanic white males (76.3), and non-Hispanic black males (70.7). The smallest difference is between Hispanic and non-Hispanic white females, with Hispanic females having an advantage of 2.4 years. The largest difference is between Hispanic females and non-Hispanic black males, with Hispanic females having a life expectancy at birth 12.8 years greater.
The Hispanic mortality advantage is evident also in the effect produced on life expectancy at birth when race and Hispanic origin are considered separately. Until 2006, U.S. life tables were produced by race (white and black), irrespective of Hispanic origin. When the Hispanic population is excluded from the two race groups and only the non-Hispanic black and non-Hispanic white populations are included, life expectancy at birth declines. For example, for the black population, irrespective of Hispanic origin, life expectancy at birth was 74.5 years in 2009 but was 74.2 years when only the non-Hispanic segment of the black population was included. Similarly, life expectancy for the
8 1991 1994 1997 2000 2003 2006 2009
White female
Black female
White male
Black male
970–2009
6 National Vital Statistics Reports, Vol. 62, No. 7, January 6, 2014
2006 2007 2008 2009
Age
(yea
rs)
0
20
40
60
80
100
83.1 80.5
77.9 76.3 75.6
69.3
83.4 80.6 78.2 76.5 75.8
69.6
83.3 80.7 78.4 76.9 75.9
70.2
83.5 81.1 78.7 77.4 76.3 70.7
Hispanic female Non-Hispanic Hispanic male Non-Hispanic Non-Hispanic Non-Hispanic white female black female white male black male
SOURCE: CDC/NCHS, National Vital Statistics System.
Figure 2. Life expectancy at birth, by Hispanic origin, race, and sex: United States, 2006–2009
white population, irrespective of Hispanic origin, was 78.8 years in 2009 but was 78.7 years when only the non-Hispanic segment of the white population was included. The effect of the Hispanic mortality advantage on race-specific life expectancy was observed also for each race-sex group. (See Technical Notes for a detailed description of the methodology used to estimate the Hispanic origin life tables.)
Survivorship in the United States
Table B summarizes the number of survivors out of 100,000 persons born alive (lx) by age, race, Hispanic origin, and sex for 2009. Table 20 shows trends in survivorship from 1900 to 2009. In 2009, 99.4% of all infants born in the United States survived the first year of life. In contrast, only 87.6% of infants born in 1900 survived the first year. Of the 2009 period life table cohort, 56.6% survived to age 80, and about 2.1% survived to age 100. In 1900, the median age at death was 58 and only 0.03% survived to age 100.
Survivorship by race
Among the four race-sex groups (Table B), white females have the highest median age at death with about 52.0% surviving to age 84. Of the original hypothetical cohort of 100,000 infant white females, 99.2% survive to age 20, 88.3% survive to age 65, and 48.6% survive to age 85. White males have slightly higher survival rates than black females at the younger ages, with 98.8% surviving to age 20 compared with 98.4% of black females. At the older ages, however, black female survival surpasses white male survival. By age 85, white male survival is 34.4% compared with 39.8% for black females. The median age at death for black males is close to 75
years, about 10 years less than that for white females. Among black males, 97.7% survive to age 20, 69.9% to age 65, and 23.5% to age 85. By age 100, there is very little difference between the white and black populations in terms of survival. Slightly less than 1.0% of white and black males and around 3.0% of white and black females survive to age 100.
Survivorship by Hispanic origin
In 2009, 99.5% of Hispanic and non-Hispanic white infants survived the first year of life, compared with 98.8% of non-Hispanic black infants. Ninety-nine percent of both the Hispanic and non-Hispanic white populations survived to age 20, while 98.0% of the non-Hispanic black population survived to age 20. By age 65, the Hispanic population has a clear survival advantage compared with the other two populations. Overall, 87.3% of the Hispanic population survived to age 65, compared with 84.5% of the non-Hispanic white and 75.1% of the non-Hispanic black populations. The Hispanic survival advantage increases with age so that by age 85, 49.7% of the Hispanic population has survived, compared with 41.3% of the non-Hispanic white and 31.6% of the non-Hispanic black populations.
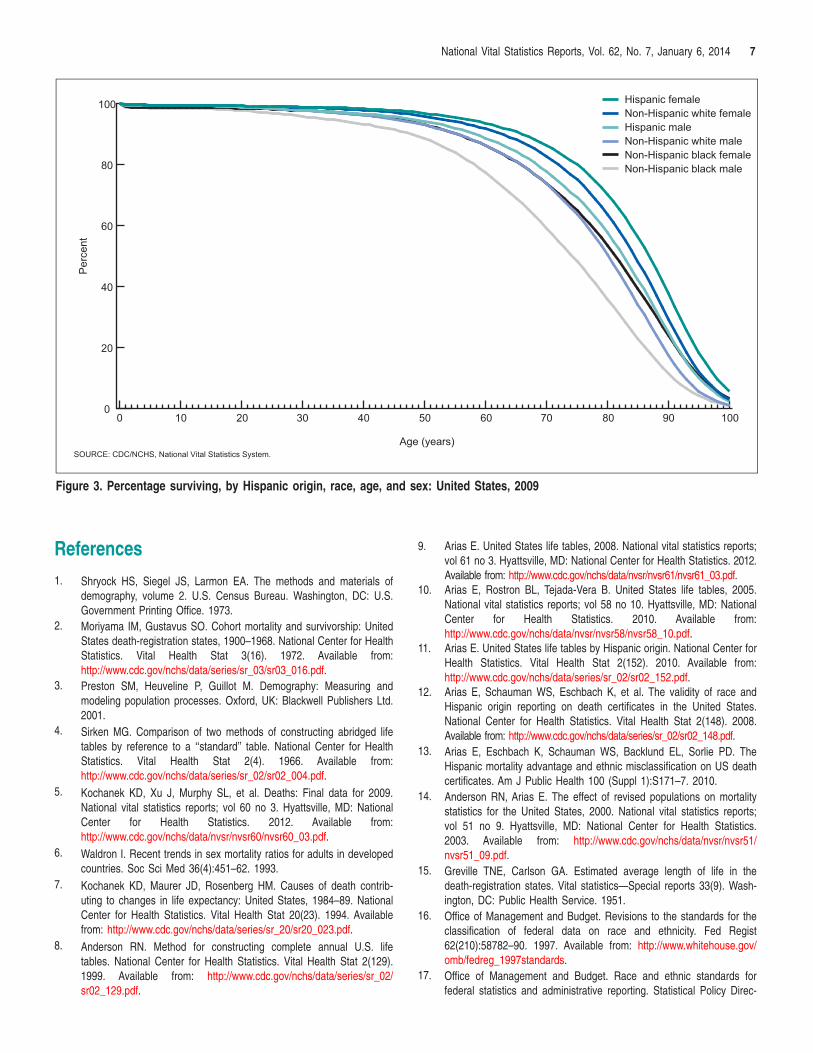
Among the six Hispanic-origin, race-sex groups, Hispanic females have the highest median age at death, with 49.2% surviving to age 87 (Figure 3). The next group with the highest median age at death is non-Hispanic white females, with 51.7% surviving to age 84. Hispanic males have 51.9% surviving to age 82, followed by non-Hispanic black females, with 50.8% surviving to age 81, non-Hispanic white males, with 50.3% surviving to age 80, and non-Hispanic black males, with 50.4% surviving to age 74 (see Technical Notes).
7 National Vital Statistics Reports, Vol. 62, No. 7, January 6, 2014
SOURCE: CDC/NCHS, National Vital Statistics System.
Per
cent
0
20
40
60
80
100
0 10 20 30 40 50 60 70 80 90 100
Non-Hispanic black male Non-Hispanic black female Non-Hispanic white male Hispanic male Non-Hispanic white female Hispanic female
Age (years)
Figure 3. Percentage surviving, by Hispanic origin, race, age, and sex: United States, 2009
References
1. Shryock HS, Siegel JS, Larmon EA. The methods and materials of demography, volume 2. U.S. Census Bureau. Washington, DC: U.S. Government Printing Office. 1973.
2. Moriyama IM, Gustavus SO. Cohort mortality and survivorship: United States death-registration states, 1900–1968. National Center for Health Statistics. Vital Health Stat 3(16). 1972. Available from: http://www.cdc.gov/nchs/data/series/sr_03/sr03_016.pdf.
3. Preston SM, Heuveline P, Guillot M. Demography: Measuring and modeling population processes. Oxford, UK: Blackwell Publishers Ltd. 2001.
4. Sirken MG. Comparison of two methods of constructing abridged life tables by reference to a ‘‘standard’’ table. National Center for Health Statistics. Vital Health Stat 2(4). 1966. Available from: http://www.cdc.gov/nchs/data/series/sr_02/sr02_004.pdf.
5. Kochanek KD, Xu J, Murphy SL, et al. Deaths: Final data for 2009. National vital statistics reports; vol 60 no 3. Hyattsville, MD: National Center for Health Statistics. 2012. Available from: http://www.cdc.gov/nchs/data/nvsr/nvsr60/nvsr60_03.pdf.
6. Waldron I. Recent trends in sex mortality ratios for adults in developed countries. Soc Sci Med 36(4):451–62. 1993.
7. Kochanek KD, Maurer JD, Rosenberg HM. Causes of death contributing to changes in life expectancy: United States, 1984–89. National Center for Health Statistics. Vital Health Stat 20(23). 1994. Available from: http://www.cdc.gov/nchs/data/series/sr_20/sr20_023.pdf.
8. Anderson RN. Method for constructing complete annual U.S. life tables. National Center for Health Statistics. Vital Health Stat 2(129). 1999. Available from: http://www.cdc.gov/nchs/data/series/sr_02/ sr02_129.pdf.
9. Arias E. United States life tables, 2008. National vital statistics reports; vol 61 no 3. Hyattsville, MD: National Center for Health Statistics. 2012. Available from: http://www.cdc.gov/nchs/data/nvsr/nvsr61/nvsr61_03.pdf.
10. Arias E, Rostron BL, Tejada-Vera B. United States life tables, 2005. National vital statistics reports; vol 58 no 10. Hyattsville, MD: National Center for Health Statistics. 2010. Available from: http://www.cdc.gov/nchs/data/nvsr/nvsr58/nvsr58_10.pdf.
11. Arias E. United States life tables by Hispanic origin. National Center for Health Statistics. Vital Health Stat 2(152). 2010. Available from: http://www.cdc.gov/nchs/data/series/sr_02/sr02_152.pdf.
12. Arias E, Schauman WS, Eschbach K, et al. The validity of race and Hispanic origin reporting on death certificates in the United States. National Center for Health Statistics. Vital Health Stat 2(148). 2008. Available from: http://www.cdc.gov/nchs/data/series/sr_02/sr02_148.pdf.
13. Arias E, Eschbach K, Schauman WS, Backlund EL, Sorlie PD. The Hispanic mortality advantage and ethnic misclassification on US death certificates. Am J Public Health 100 (Suppl 1):S171–7. 2010.
14. Anderson RN, Arias E. The effect of revised populations on mortality statistics for the United States, 2000. National vital statistics reports; vol 51 no 9. Hyattsville, MD: National Center for Health Statistics. 2003. Available from: http://www.cdc.gov/nchs/data/nvsr/nvsr51/ nvsr51_09.pdf.
15. Greville TNE, Carlson GA. Estimated average length of life in the death-registration states. Vital statistics—Special reports 33(9). Washington, DC: Public Health Service. 1951.
16. Office of Management and Budget. Revisions to the standards for the classification of federal data on race and ethnicity. Fed Regist 62(210):58782–90. 1997. Available from: http://www.whitehouse.gov/ omb/fedreg_1997standards.
17. Office of Management and Budget. Race and ethnic standards for federal statistics and administrative reporting. Statistical Policy Direc
8 National Vital Statistics Reports, Vol. 62, No. 7, January 6, 2014
111
111
2
2
tive No 15. 1977. Available from: http://wonder.cdc.gov/ WONDER/help/populations/bridged-race/Directive15.html.
18. Ingram DD, Parker JD, Schenker N, et al. United States Census 2000 population with bridged race categories. National Center for Health Statistics. Vital Health Stat 2(135). 2003. Available from: http://www.cdc.gov/nchs/data/series/sr_02/sr02_135.pdf.
19. U.S. Census Bureau. Age, sex, race, and Hispanic origin information from the 1990 census: A comparison of census results with results where age and race have been modified, 1990. CPH–L–74. 1991.
20. Bell FC, Miller ML. Life tables for the United States social security area 1900–2100. SSA Pub. No 11–11536. Baltimore, MD: Social Security Administration, Office of the Chief Actuary. 2005.
21. University of Minnesota, School of Public Health. Research Data Assistance Center. Introduction to the use of Medicare data for research. 2004.
22. Mathews TJ, MacDorman MF. Infant mortality statistics from the 2008 period linked birth/infant death data set. National vital statistics reports; vol 60 no 5. Hyattsville, MD: National Center for Health Statistics. 2012. Available from: http://www.cdc.gov/nchs/data/nvsr/nvsr60/ nvsr60_05.pdf.
23. Mathews TJ, MacDorman MF. Infant mortality statistics from the 2009 period linked birth/infant death data set. National vital statistics reports; vol 61 no 8. Hyattsville, MD: National Center for Health Statistics. 2013. Available from: http://www.cdc.gov/nchs/data/nvsr/nvsr61/ nvsr61_08.pdf.
24. Turra CM, Elo IT. The impact of salmon bias on the Hispanic mortality advantage: New evidence from social security data. Popul Res Policy Rev 27(5):515–30. 2008.
25. Chiang CL. The life table and its applications. Malabar, FL: R.E. Krieger Publishing Company. 1984.
26. Thatcher AR, Kannisto V, Vaupel JW. The force of mortality at ages 80 to 120. Odense, Denmark: Odense University Press. 1998.
27. Andreev KF, Bourbeau RR. Frailty modeling of Canadian and Swedish mortality at adult and advanced ages. Silver Spring, MD: Population Association of America. 2007.
28. Elo IT, Turra CM, Kestenbaum B, Fergusson BR. Mortality among elderly Hispanics in the United States: Past evidence and new results. Demography 41(1):109–28. 2004.
29. Brass W. On the scale of mortality. In: Brass W (ed.). Biological aspects of demography. London: Taylor and Francis. 99–110. 1971.
30. Himes CL, Preston SH, Condran GA. A relational model of mortality at older ages in low mortality countries. Popul Stud 48(2):269–91. 1994.
31. Preston SH, Elo IT. Black mortality at very old ages in official US life tables: A skeptical appraisal. Popul Dev Rev 32(3):557–65. 2006.
List of Detailed Tables 1. Life table for the total population: United States, 2009 . . . . . . 9 2. Life table for males: United States, 2009 . . . . . . . . . . . . . . . 11 3. Life table for females: United States, 2009 . . . . . . . . . . . . . . 13 4. Life table for the white population: United States, 2009 . . . . . . 15 5. Life table for white males: United States, 2009 . . . . . . . . . . . 17 6. Life table for white females: United States, 2009. . . . . . . . . . . . . 19 7. Life table for the black population: United States, 2009 . . . . . . 21 8. Life table for black males: United States, 2009 . . . . . . . . . . . 23 9. Life table for black females: United States, 2009. . . . . . . . . . . . . 25
10. Life table for the Hispanic population: United States, 2009 . . . 27 11. Life table for Hispanic males: United States, 2009 . . . . . . . . . . . . 29 12. Life table for Hispanic females: United States, 2009 . . . . . . . . 31 13. Life table for the non-Hispanic white population: United States,
2009 . . . . . . . . . . . . . . . . . . . . . . . . . . . . . . . . . . . . . . . 33
4. Life table for non-Hispanic white males: United States, 2009 . . . . . 35 5. Life table for non-Hispanic white females: United States, 2009 . . . . 37 6. Life table for the non-Hispanic black population: United States,
2009 . . . . . . . . . . . . . . . . . . . . . . . . . . . . . . . . . . . . . . . 39 7. Life table for non-Hispanic black males: United States, 2009 . . . . . 41 8. Life table for non-Hispanic black females: United States, 2009 . . . . 43 9. Estimated life expectancy at birth, in years, by race and sex:
Death-registration states, 1900–1928, and United States, 1929–2009 . . . . . . . . . . . . . . . . . . . . . . . . . . . . . . . . . . . 45
0. Survivorship by age, race, and sex: Death-registration states, 1900–1902 to 1919–1921, and United States, 1929–1931 to 2009 . . . . . . . . . . . . . . . . . . . . . . . . . . . . . . . . . . . . . . . 47
1. Life expectancy by age, race, and sex: Death-registration states, 1900–1902 to 1919–1921, and United States, 1929–1931 to 2009 . . . . . . . . . . . . . . . . . . . . . . . . . . . . . . . . . . . . . . . 51

9 National Vital Statistics Reports, Vol. 62, No. 7, January 6, 2014
Table 1. Life table for the total population: United States, 2009 Spreadsheet version available from: ftp://ftp.cdc.gov/pub/Health_Statistics/NCHS/Publications/NVSR/62_07/Table01.xls.
Age (years)
Probability of dying between
ages x and x + 1
Number surviving to
age x
Number dying
between ages x and x + 1
Person-years lived
between ages x and x + 1
Total number of
person-years lived above
age x
Expectation of life
at age x
qx lx dx Lx Tx ex
0–1 . . . . . . . . . . . . . . . . . . . . 0.006372 100,000 637 99,444 7,846,926 78.5 1–2 . . . . . . . . . . . . . . . . . . . . 0.000407 99,363 40 99,343 7,747,481 78.0 2–3 . . . . . . . . . . . . . . . . . . . . 0.000274 99,322 27 99,309 7,648,139 77.0 3–4 . . . . . . . . . . . . . . . . . . . . 0.000209 99,295 21 99,285 7,548,830 76.0 4–5 . . . . . . . . . . . . . . . . . . . . 0.000160 99,274 16 99,266 7,449,545 75.0 5–6 . . . . . . . . . . . . . . . . . . . . 0.000150 99,259 15 99,251 7,350,279 74.1 6–7 . . . . . . . . . . . . . . . . . . . . 0.000135 99,244 13 99,237 7,251,028 73.1 7–8 . . . . . . . . . . . . . . . . . . . . 0.000122 99,230 12 99,224 7,151,791 72.1 8–9 . . . . . . . . . . . . . . . . . . . . 0.000109 99,218 11 99,213 7,052,566 71.1 9–10 . . . . . . . . . . . . . . . . . . . 0.000095 99,207 9 99,203 6,953,354 70.1
10–11 . . . . . . . . . . . . . . . . . . . 0.000087 99,198 9 99,194 6,854,151 69.1 11–12 . . . . . . . . . . . . . . . . . . . 0.000093 99,189 9 99,185 6,754,957 68.1 12–13 . . . . . . . . . . . . . . . . . . . 0.000127 99,180 13 99,174 6,655,773 67.1 13–14 . . . . . . . . . . . . . . . . . . . 0.000193 99,167 19 99,158 6,556,599 66.1 14–15 . . . . . . . . . . . . . . . . . . . 0.000279 99,148 28 99,134 6,457,441 65.1 15–16 . . . . . . . . . . . . . . . . . . . 0.000370 99,121 37 99,102 6,358,307 64.1 16–17 . . . . . . . . . . . . . . . . . . . 0.000454 99,084 45 99,061 6,259,205 63.2 17–18 . . . . . . . . . . . . . . . . . . . 0.000537 99,039 53 99,012 6,160,143 62.2 18–19 . . . . . . . . . . . . . . . . . . . 0.000615 98,986 61 98,955 6,061,131 61.2 19–20 . . . . . . . . . . . . . . . . . . . 0.000691 98,925 68 98,891 5,962,175 60.3 20–21 . . . . . . . . . . . . . . . . . . . 0.000771 98,857 76 98,818 5,863,285 59.3 21–22 . . . . . . . . . . . . . . . . . . . 0.000848 98,780 84 98,739 5,764,466 58.4 22–23 . . . . . . . . . . . . . . . . . . . 0.000903 98,697 89 98,652 5,665,728 57.4 23–24 . . . . . . . . . . . . . . . . . . . 0.000929 98,608 92 98,562 5,567,076 56.5 24–25 . . . . . . . . . . . . . . . . . . . 0.000934 98,516 92 98,470 5,468,514 55.5 25–26 . . . . . . . . . . . . . . . . . . . 0.000932 98,424 92 98,378 5,370,044 54.6 26–27 . . . . . . . . . . . . . . . . . . . 0.000935 98,332 92 98,286 5,271,666 53.6 27–28 . . . . . . . . . . . . . . . . . . . 0.000943 98,240 93 98,194 5,173,380 52.7 28–29 . . . . . . . . . . . . . . . . . . . 0.000959 98,148 94 98,100 5,075,186 51.7 29–30 . . . . . . . . . . . . . . . . . . . 0.000985 98,053 97 98,005 4,977,086 50.8 30–31 . . . . . . . . . . . . . . . . . . . 0.001017 97,957 100 97,907 4,879,081 49.8 31–32 . . . . . . . . . . . . . . . . . . . 0.001053 97,857 103 97,806 4,781,173 48.9 32–33 . . . . . . . . . . . . . . . . . . . 0.001095 97,754 107 97,701 4,683,368 47.9 33–34 . . . . . . . . . . . . . . . . . . . 0.001143 97,647 112 97,591 4,585,667 47.0 34–35 . . . . . . . . . . . . . . . . . . . 0.001195 97,536 117 97,477 4,488,076 46.0 35–36 . . . . . . . . . . . . . . . . . . . 0.001257 97,419 122 97,358 4,390,598 45.1 36–37 . . . . . . . . . . . . . . . . 0.001332 97,297 130 97,232 4,293,241 44.1 37–38 . . . . . . . . . . . . . . . . . . . 0.001420 97,167 138 97,098 4,196,009 43.2 38–39 . . . . . . . . . . . . . . . . . . . 0.001522 97,029 148 96,955 4,098,911 42.2 39–40 . . . . . . . . . . . . . . . . . . . 0.001643 96,881 159 96,802 4,001,956 41.3 40–41 . . . . . . . . . . . . . . . . . . . 0.001777 96,722 172 96,636 3,905,154 40.4 41–42 . . . . . . . . . . . . . . . . . . . 0.001932 96,550 186 96,457 3,808,518 39.4 42–43 . . . . . . . . . . . . . . . . . . . 0.002116 96,364 204 96,262 3,712,061 38.5 43–44 . . . . . . . . . . . . . . . . . . . 0.002330 96,160 224 96,048 3,615,799 37.6 44–45 . . . . . . . . . . . . . . . . . . . 0.002563 95,936 246 95,813 3,519,751 36.7 45–46 . . . . . . . . . . . . . . . . . . . 0.002795 95,690 267 95,556 3,423,938 35.8 46–47 . . . . . . . . . . . . . . . . . . . 0.003033 95,422 289 95,278 3,328,382 34.9 47–48 . . . . . . . . . . . . . . . . . . . 0.003299 95,133 314 94,976 3,233,105 34.0 48–49 . . . . . . . . . . . . . . . . . . . 0.003608 94,819 342 94,648 3,138,128 33.1 49–50 . . . . . . . . . . . . . . . . . . . 0.003956 94,477 374 94,290 3,043,480 32.2 50–51 . . . . . . . . . . . . . . . . . . . 0.004337 94,103 408 93,899 2,949,190 31.3 51–52 . . . . . . . . . . . . . . . . . . . 0.004728 93,695 443 93,474 2,855,291 30.5 52–53 . . . . . . . . . . . . . . . . . . . 0.005118 93,252 477 93,014 2,761,817 29.6 53–54 . . . . . . . . . . . . . . . . . . . 0.005496 92,775 510 92,520 2,668,804 28.8 54–55 . . . . . . . . . . . . . . . . . . . 0.005874 92,265 542 91,994 2,576,284 27.9 55–56 . . . . . . . . . . . . . . . . . . . 0.006277 91,723 576 91,435 2,484,290 27.1 56–57 . . . . . . . . . . . . . . . . . . . 0.006724 91,147 613 90,841 2,392,854 26.3 57–58 . . . . . . . . . . . . . . . . . . . 0.007216 90,534 653 90,208 2,302,013 25.4 58–59 . . . . . . . . . . . . . . . . . . . 0.007759 89,881 697 89,532 2,211,806 24.6 59–60 . . . . . . . . . . . . . . . . . . . 0.008349 89,184 745 88,812 2,122,273 23.8 60–61 . . . . . . . . . . . . . . . . . . . 0.008986 88,439 795 88,042 2,033,462 23.0 61–62 . . . . . . . . . . . . . . . . . . . 0.009671 87,645 848 87,221 1,945,420 22.2
See footnote at end of table.

10 National Vital Statistics Reports, Vol. 62, No. 7, January 6, 2014
Table 1. Life table for the total population: United States, 2009—Con. Spreadsheet version available from: ftp://ftp.cdc.gov/pub/Health_Statistics/NCHS/Publications/NVSR/62_07/Table01.xls.
Age (years)
Probability of dying between
ages x and x + 1
Number surviving to
age x
Number dying
between ages x and x + 1
Person-years lived
between ages x and x + 1
Total number of
person-years lived above
age x
Expectation of life
at age x
qx lx dx Lx Tx ex
62–63 . . . . . . . . . . . . . . . . . . . 0.010415 86,797 904 86,345 1,858,199 21.4 63–64 . . . . . . . . . . . . . . . . . . . 0.011237 85,893 965 85,410 1,771,854 20.6 64–65 . . . . . . . . . . . . . . . . . . . 0.012164 84,928 1,033 84,411 1,686,444 19.9 65–66 . . . . . . . . . . . . . . . . . . . 0.013241 83,895 1,111 83,339 1,602,032 19.1 66–67 . . . . . . . . . . . . . . . . . . . 0.014457 82,784 1,197 82,185 1,518,693 18.3 67–68 . . . . . . . . . . . . . . . . . . . 0.015750 81,587 1,285 80,945 1,436,508 17.6 68–69 . . . . . . . . . . . . . . . . . . . 0.017081 80,302 1,372 79,616 1,355,563 16.9 69–70 . . . . . . . . . . . . . . . . . . . 0.018452 78,930 1,456 78,202 1,275,947 16.2 70–71 . . . . . . . . . . . . . . . . . . . 0.019976 77,474 1,548 76,700 1,197,745 15.5 71–72 . . . . . . . . . . . . . . . . . . . 0.021736 75,926 1,650 75,101 1,121,045 14.8 72–73 . . . . . . . . . . . . . . . . . . . 0.023687 74,276 1,759 73,396 1,045,943 14.1 73–74 . . . . . . . . . . . . . . . . . . . 0.025963 72,517 1,883 71,575 972,547 13.4 74–75 . . . . . . . . . . . . . . . . . . . 0.028500 70,634 2,013 69,627 900,971 12.8 75–76 . . . . . . . . . . . . . . . . . . . 0.031120 68,621 2,135 67,553 831,344 12.1 76–77 . . . . . . . . . . . . . . . . . . . 0.034014 66,485 2,261 65,355 763,791 11.5 77–78 . . . . . . . . . . . . . . . . . . . 0.037380 64,224 2,401 63,024 698,436 10.9 78–79 . . . . . . . . . . . . . . . . . . . 0.041272 61,823 2,552 60,548 635,412 10.3 79–80 . . . . . . . . . . . . . . . . . . . 0.045547 59,272 2,700 57,922 574,865 9.7 80–81 . . . . . . . . . . . . . . . . . . . 0.050131 56,572 2,836 55,154 516,943 9.1 81–82 . . . . . . . . . . . . . . . . . . . 0.055106 53,736 2,961 52,256 461,789 8.6 82–83 . . . . . . . . . . . . . . . . . . . 0.061029 50,775 3,099 49,226 409,533 8.1 83–84 . . . . . . . . . . . . . . . . . . . 0.067705 47,676 3,228 46,062 360,308 7.6 84–85 . . . . . . . . . . . . . . . . . . . 0.075068 44,448 3,337 42,780 314,246 7.1 85–86 . . . . . . . . . . . . . . . . 0.084240 41,112 3,463 39,380 271,466 6.6 86–87 . . . . . . . . . . . . . . . . . . . 0.093716 37,648 3,528 35,884 232,086 6.2 87–88 . . . . . . . . . . . . . . . . . . . 0.104067 34,120 3,551 32,345 196,201 5.8 88–89 . . . . . . . . . . . . . . . . . . . 0.115332 30,569 3,526 28,807 163,857 5.4 89–90 . . . . . . . . . . . . . . . . . . . 0.127539 27,044 3,449 25,319 135,050 5.0 90–91 . . . . . . . . . . . . . . . . . . . 0.140709 23,595 3,320 21,935 109,731 4.7 91–92 . . . . . . . . . . . . . . . . . . . 0.154848 20,275 3,139 18,705 87,796 4.3 92–93 . . . . . . . . . . . . . . . . . . . 0.169949 17,135 2,912 15,679 69,091 4.0 93–94 . . . . . . . . . . . . . . . . . . . 0.185987 14,223 2,645 12,900 53,412 3.8 94–95 . . . . . . . . . . . . . . . . . . . 0.202921 11,578 2,349 10,403 40,512 3.5 95–96 . . . . . . . . . . . . . . . . . . . 0.220689 9,228 2,037 8,210 30,109 3.3 96–97 . . . . . . . . . . . . . . . . . . . 0.239209 7,192 1,720 6,332 21,899 3.0 97–98 . . . . . . . . . . . . . . . . . . . 0.258384 5,471 1,414 4,765 15,567 2.8 98–99 . . . . . . . . . . . . . . . . . . . 0.278095 4,058 1,128 3,493 10,802 2.7 99–100. . . . . . . . . . . . . . . . . . . 0.298212 2,929 874 2,493 7,309 2.5 100 and over . . . . . . . . . . . . . . . 1.000000 2,056 2,056 4,816 4,816 2.3
SOURCE: CDC/NCHS, National Vital Statistics System.

National Vital Statistics Reports, Vol. 62, No. 7, January 6, 2014 11
Table 2. Life table for males: United States, 2009 Spreadsheet version available from: ftp://ftp.cdc.gov/pub/Health_Statistics/NCHS/Publications/NVSR/62_07/Table02.xls.
Age (years)
Probability of dying between
ages x and x + 1
Number surviving to
age x
Number dying
between ages x and x + 1
Person-years lived
between ages x and x + 1
Total number of
person-years lived above
age x
Expectation of life
at age x
qx lx dx Lx Tx ex
0–1 . . . . . . . . . . . . . . . . . . . . 0.006989 100,000 699 99,391 7,596,099 76.0 1–2 . . . . . . . . . . . . . . . . . . . . 0.000442 99,301 44 99,279 7,496,709 75.5 2–3 . . . . . . . . . . . . . . . . . . . . 0.000303 99,257 30 99,242 7,397,429 74.5 3–4 . . . . . . . . . . . . . . . . . . . . 0.000233 99,227 23 99,216 7,298,187 73.6 4–5 . . . . . . . . . . . . . . . . . . . . 0.000174 99,204 17 99,195 7,198,972 72.6 5–6 . . . . . . . . . . . . . . . . . . . . 0.000164 99,187 16 99,179 7,099,776 71.6 6–7 . . . . . . . . . . . . . . . . . . . . 0.000149 99,171 15 99,163 7,000,598 70.6 7–8 . . . . . . . . . . . . . . . . . . . . 0.000135 99,156 13 99,149 6,901,435 69.6 8–9 . . . . . . . . . . . . . . . . . . . . 0.000117 99,142 12 99,137 6,802,286 68.6 9–10 . . . . . . . . . . . . . . . . . . . 0.000097 99,131 10 99,126 6,703,149 67.6
10–11 . . . . . . . . . . . . . . . . . . . 0.000082 99,121 8 99,117 6,604,023 66.6 11–12 . . . . . . . . . . . . . . . . . . . 0.000089 99,113 9 99,109 6,504,906 65.6 12–13 . . . . . . . . . . . . . . . . . . . 0.000136 99,104 14 99,097 6,405,797 64.6 13–14 . . . . . . . . . . . . . . . . . . . 0.000232 99,091 23 99,079 6,306,700 63.6 14–15 . . . . . . . . . . . . . . . . . . . 0.000359 99,068 36 99,050 6,207,621 62.7 15–16 . . . . . . . . . . . . . . . . . . . 0.000490 99,032 49 99,008 6,108,571 61.7 16–17 . . . . . . . . . . . . . . . . . . . 0.000613 98,984 61 98,953 6,009,563 60.7 17–18 . . . . . . . . . . . . . . . . . . . 0.000737 98,923 73 98,886 5,910,610 59.7 18–19 . . . . . . . . . . . . . . . . . . . 0.000861 98,850 85 98,807 5,811,724 58.8 19–20 . . . . . . . . . . . . . . . . . . . 0.000984 98,765 97 98,716 5,712,916 57.8 20–21 . . . . . . . . . . . . . . . . . . . 0.001116 98,668 110 98,613 5,614,200 56.9 21–22 . . . . . . . . . . . . . . . . . . . 0.001238 98,557 122 98,496 5,515,588 56.0 22–23 . . . . . . . . . . . . . . . . . . . 0.001322 98,435 130 98,370 5,417,091 55.0 23–24 . . . . . . . . . . . . . . . . . . . 0.001351 98,305 133 98,239 5,318,721 54.1 24–25 . . . . . . . . . . . . . . . . . . . 0.001341 98,172 132 98,107 5,220,482 53.2 25–26 . . . . . . . . . . . . . . . . . . . 0.001317 98,041 129 97,976 5,122,375 52.2 26–27 . . . . . . . . . . . . . . . . . . . 0.001302 97,912 128 97,848 5,024,399 51.3 27–28 . . . . . . . . . . . . . . . . . . . 0.001296 97,784 127 97,721 4,926,551 50.4 28–29 . . . . . . . . . . . . . . . . . . . 0.001306 97,657 128 97,594 4,828,830 49.4 29–30 . . . . . . . . . . . . . . . . . . . 0.001331 97,530 130 97,465 4,731,236 48.5 30–31 . . . . . . . . . . . . . . . . . . . 0.001363 97,400 133 97,334 4,633,771 47.6 31–32 . . . . . . . . . . . . . . . . . . . 0.001399 97,267 136 97,199 4,536,438 46.6 32–33 . . . . . . . . . . . . . . . . . . . 0.001441 97,131 140 97,061 4,439,238 45.7 33–34 . . . . . . . . . . . . . . . . . . . 0.001489 96,991 144 96,919 4,342,177 44.8 34–35 . . . . . . . . . . . . . . . . . . . 0.001544 96,847 150 96,772 4,245,258 43.8 35–36 . . . . . . . . . . . . . . . . . . . 0.001612 96,698 156 96,620 4,148,485 42.9 36–37 . . . . . . . . . . . . . . . . . . . 0.001696 96,542 164 96,460 4,051,866 42.0 37–38 . . . . . . . . . . . . . . . . . . . 0.001794 96,378 173 96,291 3,955,406 41.0 38–39 . . . . . . . . . . . . . . . . . . . 0.001910 96,205 184 96,113 3,859,114 40.1 39–40 . . . . . . . . . . . . . . . . . . . 0.002047 96,021 197 95,923 3,763,001 39.2 40–41 . . . . . . . . . . . . . . . . . . . 0.002203 95,825 211 95,719 3,667,078 38.3 41–42 . . . . . . . . . . . . . . . . . . . 0.002384 95,614 228 95,500 3,571,359 37.4 42–43 . . . . . . . . . . . . . . . . . . . 0.002602 95,386 248 95,262 3,475,859 36.4 43–44 . . . . . . . . . . . . . . . . . . . 0.002855 95,137 272 95,002 3,380,598 35.5 44–45 . . . . . . . . . . . . . . . . . . . 0.003133 94,866 297 94,717 3,285,596 34.6 45–46 . . . . . . . . . . . . . . . . . . . 0.003412 94,569 323 94,407 3,190,879 33.7 46–47 . . . . . . . . . . . . . . . . . . . 0.003702 94,246 349 94,072 3,096,471 32.9 47–48 . . . . . . . . . . . . . . . . . . . 0.004036 93,897 379 93,708 3,002,400 32.0 48–49 . . . . . . . . . . . . . . . . . . . 0.004434 93,518 415 93,311 2,908,692 31.1 49–50 . . . . . . . . . . . . . . . . . . . 0.004891 93,103 455 92,876 2,815,381 30.2 50–51 . . . . . . . . . . . . . . . . . . . 0.005388 92,648 499 92,399 2,722,506 29.4 51–52 . . . . . . . . . . . . . . . . . . . 0.005898 92,149 543 91,877 2,630,107 28.5 52–53 . . . . . . . . . . . . . . . . . . . 0.006413 91,605 588 91,312 2,538,230 27.7 53–54 . . . . . . . . . . . . . . . . . . . 0.006924 91,018 630 90,703 2,446,918 26.9 54–55 . . . . . . . . . . . . . . . . . . . 0.007440 90,388 672 90,051 2,356,216 26.1 55–56 . . . . . . . . . . . . . . . . . . . 0.007994 89,715 717 89,357 2,266,164 25.3 56–57 . . . . . . . . . . . . . . . . . . . 0.008599 88,998 765 88,615 2,176,807 24.5 57–58 . . . . . . . . . . . . . . . . . . . 0.009234 88,233 815 87,825 2,088,192 23.7 58–59 . . . . . . . . . . . . . . . . . . . 0.009893 87,418 865 86,986 2,000,366 22.9 59–60 . . . . . . . . . . . . . . . . . . . 0.010579 86,553 916 86,095 1,913,381 22.1 60–61 . . . . . . . . . . . . . . . . . . . 0.011303 85,638 968 85,154 1,827,285 21.3 61–62 . . . . . . . . . . . . . . . . . . . 0.012087 84,670 1,023 84,158 1,742,132 20.6
See footnote at end of table.
12 National Vital Statistics Reports, Vol. 62, No. 7, January 6, 2014
Table 2. Life table for males: United States, 2009—Con. Spreadsheet version available from: ftp://ftp.cdc.gov/pub/Health_Statistics/NCHS/Publications/NVSR/62_07/Table02.xls.
Age (years)
Probability of dying between
ages x and x + 1
Number surviving to
age x
Number dying
between ages x and x + 1
Person-years lived
between ages x and x + 1
Total number of
person-years lived above
age x
Expectation of life
at age x
qx lx dx Lx Tx ex
62–63 . . . . . . . . . . . . . . . . . . . 0.012952 83,646 1,083 83,105 1,657,974 19.8 63–64 . . . . . . . . . . . . . . . . . . . 0.013937 82,563 1,151 81,988 1,574,870 19.1 64–65 . . . . . . . . . . . . . . . . . . . 0.015068 81,412 1,227 80,799 1,492,882 18.3 65–66 . . . . . . . . . . . . . . . . . . . 0.016389 80,185 1,314 79,528 1,412,083 17.6 66–67 . . . . . . . . . . . . . . . . . . . 0.017866 78,871 1,409 78,167 1,332,555 16.9 67–68 . . . . . . . . . . . . . . . . . . . 0.019423 77,462 1,505 76,710 1,254,388 16.2 68–69 . . . . . . . . . . . . . . . . . . . 0.021006 75,958 1,596 75,160 1,177,678 15.5 69–70 . . . . . . . . . . . . . . . . . . . 0.022610 74,362 1,681 73,521 1,102,518 14.8 70–71 . . . . . . . . . . . . . . . . . . . 0.024369 72,681 1,771 71,795 1,028,997 14.2 71–72 . . . . . . . . . . . . . . . . . . . 0.026382 70,910 1,871 69,974 957,202 13.5 72–73 . . . . . . . . . . . . . . . . . . . 0.028664 69,039 1,979 68,049 887,227 12.9 73–74 . . . . . . . . . . . . . . . . 0.031394 67,060 2,105 66,007 819,178 12.2 74–75 . . . . . . . . . . . . . . . . . . . 0.034398 64,955 2,234 63,838 753,171 11.6 75–76 . . . . . . . . . . . . . . . . . . . 0.037521 62,720 2,353 61,544 689,333 11.0 76–77 . . . . . . . . . . . . . . . . . . . 0.041012 60,367 2,476 59,129 627,789 10.4 77–78 . . . . . . . . . . . . . . . . . . . 0.045093 57,891 2,610 56,586 568,660 9.8 78–79 . . . . . . . . . . . . . . . . . . . 0.049743 55,281 2,750 53,906 512,074 9.3 79–80 . . . . . . . . . . . . . . . . . . . 0.054791 52,531 2,878 51,092 458,168 8.7 80–81 . . . . . . . . . . . . . . . . . . . 0.060380 49,653 2,998 48,154 407,076 8.2 81–82 . . . . . . . . . . . . . . . . . . . 0.066415 46,655 3,099 45,105 358,923 7.7 82–83 . . . . . . . . . . . . . . . . . . . 0.073358 43,556 3,195 41,959 313,817 7.2 83–84 . . . . . . . . . . . . . . . . . . . 0.081063 40,361 3,272 38,725 271,859 6.7 84–85 . . . . . . . . . . . . . . . . . . . 0.089641 37,089 3,325 35,427 233,134 6.3 85–86 . . . . . . . . . . . . . . . . . . . 0.101322 33,764 3,421 32,054 197,707 5.9 86–87 . . . . . . . . . . . . . . . . . . . 0.112341 30,343 3,409 28,639 165,653 5.5 87–88 . . . . . . . . . . . . . . . . . . . 0.124296 26,935 3,348 25,261 137,014 5.1 88–89 . . . . . . . . . . . . . . . . . . . 0.137207 23,587 3,236 21,969 111,753 4.7 89–90 . . . . . . . . . . . . . . . . . . . 0.151086 20,350 3,075 18,813 89,785 4.4 90–91 . . . . . . . . . . . . . . . . . . . 0.165929 17,276 2,867 15,843 70,972 4.1 91–92 . . . . . . . . . . . . . . . . . . . 0.181716 14,409 2,618 13,100 55,129 3.8 92–93 . . . . . . . . . . . . . . . . . . . 0.198410 11,791 2,339 10,621 42,029 3.6 93–94 . . . . . . . . . . . . . . . . . . . 0.215955 9,451 2,041 8,431 31,408 3.3 94–95 . . . . . . . . . . . . . . . . . . . 0.234275 7,410 1,736 6,542 22,977 3.1 95–96 . . . . . . . . . . . . . . . . . . . 0.253276 5,674 1,437 4,956 16,435 2.9 96–97 . . . . . . . . . . . . . . . . . . . 0.272845 4,237 1,156 3,659 11,479 2.7 97–98 . . . . . . . . . . . . . . . . . . . 0.292856 3,081 902 2,630 7,820 2.5 98–99 . . . . . . . . . . . . . . . . . . . 0.313166 2,179 682 1,838 5,190 2.4 99–100. . . . . . . . . . . . . . . . . . . 0.333629 1,496 499 1,247 3,352 2.2 100 and over . . . . . . . . . . . . . . . 1.000000 997 997 2,106 2,106 2.1
SOURCE: CDC/NCHS, National Vital Statistics System.
National Vital Statistics Reports, Vol. 62, No. 7, January 6, 2014 13
Table 3. Life table for females: United States, 2009 Spreadsheet version available from: ftp://ftp.cdc.gov/pub/Health_Statistics/NCHS/Publications/NVSR/62_07/Table03.xls.
Age (years)
Probability of dying between
ages x and x + 1
Number surviving to
age x
Number dying
between ages x and x + 1
Person-years lived
between ages x and x + 1
Total number of
person-years lived above
age x
Expectation of life
at age x
qx lx dx Lx Tx ex
0–1 . . . . . . . . . . . . . . . . . . . . 0.005726 100,000 573 99,500 8,088,922 80.9 1–2 . . . . . . . . . . . . . . . . . . . . 0.000369 99,427 37 99,409 7,989,422 80.4 2–3 . . . . . . . . . . . . . . . . . . . . 0.000243 99,391 24 99,379 7,890,013 79.4 3–4 . . . . . . . . . . . . . . . . . . . . 0.000185 99,367 18 99,357 7,790,634 78.4 4–5 . . . . . . . . . . . . . . . . . . . . 0.000147 99,348 15 99,341 7,691,277 77.4 5–6 . . . . . . . . . . . . . . . . . . . . 0.000134 99,334 13 99,327 7,591,936 76.4 6–7 . . . . . . . . . . . . . . . . . . . . 0.000120 99,320 12 99,314 7,492,609 75.4 7–8 . . . . . . . . . . . . . . . . . . . . 0.000109 99,308 11 99,303 7,393,295 74.4 8–9 . . . . . . . . . . . . . . . . . . . . 0.000101 99,298 10 99,293 7,293,992 73.5 9–10 . . . . . . . . . . . . . . . . . . . 0.000094 99,288 9 99,283 7,194,699 72.5
10–11 . . . . . . . . . . . . . . . . . . . 0.000092 99,278 9 99,274 7,095,416 71.5 11–12 . . . . . . . . . . . . . . . . . . . 0.000098 99,269 10 99,264 6,996,143 70.5 12–13 . . . . . . . . . . . . . . . . . . . 0.000117 99,259 12 99,254 6,896,878 69.5 13–14 . . . . . . . . . . . . . . . . . . . 0.000151 99,248 15 99,240 6,797,625 68.5 14–15 . . . . . . . . . . . . . . . . . . . 0.000195 99,233 19 99,223 6,698,385 67.5 15–16 . . . . . . . . . . . . . . . . . . . 0.000242 99,213 24 99,201 6,599,162 66.5 16–17 . . . . . . . . . . . . . . . . . . . 0.000287 99,189 28 99,175 6,499,960 65.5 17–18 . . . . . . . . . . . . . . . . . . . 0.000326 99,161 32 99,145 6,400,785 64.5 18–19 . . . . . . . . . . . . . . . . . . . 0.000356 99,129 35 99,111 6,301,640 63.6 19–20 . . . . . . . . . . . . . . . . . . . 0.000380 99,093 38 99,074 6,202,529 62.6 20–21 . . . . . . . . . . . . . . . . . . . 0.000405 99,056 40 99,036 6,103,455 61.6 21–22 . . . . . . . . . . . . . . . . . . . 0.000432 99,015 43 98,994 6,004,419 60.6 22–23 . . . . . . . . . . . . . . . . . . . 0.000458 98,973 45 98,950 5,905,425 59.7 23–24 . . . . . . . . . . . . . . . . . . . 0.000481 98,927 48 98,904 5,806,475 58.7 24–25 . . . . . . . . . . . . . . . . . . . 0.000502 98,880 50 98,855 5,707,572 57.7 25–26 . . . . . . . . . . . . . . . . . . . 0.000524 98,830 52 98,804 5,608,717 56.8 26–27 . . . . . . . . . . . . . . . . . . . 0.000548 98,778 54 98,751 5,509,912 55.8 27–28 . . . . . . . . . . . . . . . . . . . 0.000571 98,724 56 98,696 5,411,161 54.8 28–29 . . . . . . . . . . . . . . . . . . . 0.000595 98,668 59 98,639 5,312,465 53.8 29–30 . . . . . . . . . . . . . . . . . . . 0.000622 98,609 61 98,578 5,213,826 52.9 30–31 . . . . . . . . . . . . . . . . . . . 0.000655 98,548 65 98,515 5,115,248 51.9 31–32 . . . . . . . . . . . . . . . . . . . 0.000695 98,483 68 98,449 5,016,733 50.9 32–33 . . . . . . . . . . . . . . . . . . . 0.000738 98,415 73 98,378 4,918,284 50.0 33–34 . . . . . . . . . . . . . . . . . . . 0.000786 98,342 77 98,303 4,819,905 49.0 34–35 . . . . . . . . . . . . . . . . . . . 0.000837 98,265 82 98,224 4,721,602 48.0 35–36 . . . . . . . . . . . . . . . . . . . 0.000894 98,182 88 98,139 4,623,378 47.1 36–37 . . . . . . . . . . . . . . . . . . . 0.000962 98,095 94 98,047 4,525,240 46.1 37–38 . . . . . . . . . . . . . . . . . . . 0.001039 98,000 102 97,949 4,427,192 45.2 38–39 . . . . . . . . . . . . . . . . . . . 0.001129 97,898 111 97,843 4,329,243 44.2 39–40 . . . . . . . . . . . . . . . . . . . 0.001234 97,788 121 97,728 4,231,400 43.3 40–41 . . . . . . . . . . . . . . . . . . . 0.001348 97,667 132 97,601 4,133,672 42.3 41–42 . . . . . . . . . . . . . . . . . . . 0.001476 97,536 144 97,464 4,036,071 41.4 42–43 . . . . . . . . . . . . . . . . . . . 0.001629 97,392 159 97,312 3,938,607 40.4 43–44 . . . . . . . . . . . . . . . . . . . 0.001806 97,233 176 97,145 3,841,294 39.5 44–45 . . . . . . . . . . . . . . . . . . . 0.001996 97,057 194 96,961 3,744,149 38.6 45–46 . . . . . . . . . . . . . . . . . . . 0.002186 96,864 212 96,758 3,647,189 37.7 46–47 . . . . . . . . . . . . . . . . . . . 0.002375 96,652 230 96,537 3,550,431 36.7 47–48 . . . . . . . . . . . . . . . . . . . 0.002577 96,422 249 96,298 3,453,894 35.8 48–49 . . . . . . . . . . . . . . . . . . . 0.002801 96,174 269 96,039 3,357,595 34.9 49–50 . . . . . . . . . . . . . . . . . . . 0.003046 95,905 292 95,758 3,261,556 34.0 50–51 . . . . . . . . . . . . . . . . . . . 0.003317 95,612 317 95,454 3,165,798 33.1 51–52 . . . . . . . . . . . . . . . . . . . 0.003596 95,295 343 95,124 3,070,344 32.2 52–53 . . . . . . . . . . . . . . . . . . . 0.003868 94,953 367 94,769 2,975,220 31.3 53–54 . . . . . . . . . . . . . . . . . . . 0.004124 94,585 390 94,390 2,880,451 30.5 54–55 . . . . . . . . . . . . . . . . . . . 0.004376 94,195 412 93,989 2,786,061 29.6 55–56 . . . . . . . . . . . . . . . . . . . 0.004641 93,783 435 93,565 2,692,072 28.7 56–57 . . . . . . . . . . . . . . . . . . . 0.004947 93,348 462 93,117 2,598,506 27.8 57–58 . . . . . . . . . . . . . . . . . . . 0.005313 92,886 493 92,639 2,505,389 27.0 58–59 . . . . . . . . . . . . . . . . . . . 0.005753 92,392 532 92,127 2,412,750 26.1 59–60 . . . . . . . . . . . . . . . . . . . 0.006262 91,861 575 91,573 2,320,623 25.3 60–61 . . . . . . . . . . . . . . . . . . . 0.006826 91,286 623 90,974 2,229,050 24.4 61–62 . . . . . . . . . . . . . . . . . . . 0.007429 90,663 674 90,326 2,138,076 23.6
See footnote at end of table.
14 National Vital Statistics Reports, Vol. 62, No. 7, January 6, 2014
Table 3. Life table for females: United States, 2009—Con. Spreadsheet version available from: ftp://ftp.cdc.gov/pub/Health_Statistics/NCHS/Publications/NVSR/62_07/Table03.xls.
Age (years)
Probability of dying between
ages x and x + 1
Number surviving to
age x
Number dying
between ages x and x + 1
Person-years lived
between ages x and x + 1
Total number of
person-years lived above
age x
Expectation of life
at age x
qx lx dx Lx Tx ex
62–63 . . . . . . . . . . . . . . . . . . . 0.008073 89,989 726 89,626 2,047,750 22.8 63–64 . . . . . . . . . . . . . . . . . . . 0.008763 89,263 782 88,872 1,958,124 21.9 64–65 . . . . . . . . . . . . . . . . . . . 0.009524 88,480 843 88,059 1,869,253 21.1 65–66 . . . . . . . . . . . . . . . . . . . 0.010410 87,638 912 87,182 1,781,194 20.3 66–67 . . . . . . . . . . . . . . . . . . . 0.011422 86,725 991 86,230 1,694,012 19.5 67–68 . . . . . . . . . . . . . . . . . . . 0.012511 85,735 1,073 85,199 1,607,782 18.8 68–69 . . . . . . . . . . . . . . . . . . . 0.013652 84,662 1,156 84,084 1,522,583 18.0 69–70 . . . . . . . . . . . . . . . . . . . 0.014847 83,506 1,240 82,887 1,438,499 17.2 70–71 . . . . . . . . . . . . . . . . . . . 0.016200 82,267 1,333 81,600 1,355,612 16.5 71–72 . . . . . . . . . . . . . . . . . . . 0.017783 80,934 1,439 80,214 1,274,012 15.7 72–73 . . . . . . . . . . . . . . . . . . . 0.019504 79,495 1,550 78,719 1,193,798 15.0 73–74 . . . . . . . . . . . . . . . . . . . 0.021466 77,944 1,673 77,108 1,115,078 14.3 74–75 . . . . . . . . . . . . . . . . . . . 0.023697 76,271 1,807 75,367 1,037,971 13.6 75–76 . . . . . . . . . . . . . . . . . . . 0.025997 74,464 1,936 73,496 962,603 12.9 76–77 . . . . . . . . . . . . . . . . . . . 0.028517 72,528 2,068 71,494 889,107 12.3 77–78 . . . . . . . . . . . . . . . . . . . 0.031445 70,460 2,216 69,352 817,614 11.6 78–79 . . . . . . . . . . . . . . . . . . . 0.034904 68,244 2,382 67,053 748,262 11.0 79–80 . . . . . . . . . . . . . . . . . . . 0.038790 65,862 2,555 64,585 681,209 10.3 80–81 . . . . . . . . . . . . . . . . . . . 0.042869 63,307 2,714 61,950 616,624 9.7 81–82 . . . . . . . . . . . . . . . . . . . 0.047338 60,593 2,868 59,159 554,674 9.2 82–83 . . . . . . . . . . . . . . . . . . . 0.052844 57,725 3,050 56,200 495,515 8.6 83–84 . . . . . . . . . . . . . . . . . . . 0.059186 54,675 3,236 53,057 439,315 8.0 84–85 . . . . . . . . . . . . . . . . . . . 0.066164 51,439 3,403 49,737 386,258 7.5 85–86 . . . . . . . . . . . . . . . . . . . 0.074211 48,035 3,565 46,253 336,522 7.0 86–87 . . . . . . . . . . . . . . . . . . . 0.083667 44,470 3,721 42,610 290,269 6.5 87–88 . . . . . . . . . . . . . . . . . . . 0.093608 40,750 3,815 38,843 247,659 6.1 88–89 . . . . . . . . . . . . . . . . . . . 0.104520 36,935 3,860 35,005 208,816 5.7 89–90 . . . . . . . . . . . . . . . . . . . 0.116444 33,075 3,851 31,149 173,811 5.3 90–91 . . . . . . . . . . . . . . . . . . . 0.129416 29,223 3,782 27,332 142,662 4.9 91–92 . . . . . . . . . . . . . . . . . . . 0.143456 25,441 3,650 23,617 115,329 4.5 92–93 . . . . . . . . . . . . . . . . . . . 0.158570 21,792 3,456 20,064 91,713 4.2 93–94 . . . . . . . . . . . . . . . . . . . 0.174744 18,336 3,204 16,734 71,649 3.9 94–95 . . . . . . . . . . . . . . . . . . . 0.191945 15,132 2,905 13,680 54,915 3.6 95–96 . . . . . . . . . . . . . . . . . . . 0.210116 12,228 2,569 10,943 41,235 3.4 96–97 . . . . . . . . . . . . . . . . . . . 0.229176 9,658 2,213 8,552 30,292 3.1 97–98 . . . . . . . . . . . . . . . . . . . 0.249023 7,445 1,854 6,518 21,740 2.9 98–99 . . . . . . . . . . . . . . . . . . . 0.269529 5,591 1,507 4,837 15,222 2.7 99–100. . . . . . . . . . . . . . . . . . . 0.290550 4,084 1,187 3,491 10,385 2.5 100 and over . . . . . . . . . . . . . . . 1.000000 2,897 2,897 6,894 6,894 2.4
SOURCE: CDC/NCHS, National Vital Statistics System.

National Vital Statistics Reports, Vol. 62, No. 7, January 6, 2014 15
Table 4. Life table for the white population: United States, 2009 Spreadsheet version available from: ftp://ftp.cdc.gov/pub/Health_Statistics/NCHS/Publications/NVSR/62_07/Table04.xls.
Age (years)
Probability of dying between
ages x and x + 1
Number surviving to
age x
Number dying
between ages x and x + 1
Person-years lived
between ages x and x + 1
Total number of
person-years lived above
age x
Expectation of life
at age x
qx lx dx Lx Tx ex
0–1 . . . . . . . . . . . . . . . . . . . . 0.005279 100,000 528 99,540 7,883,419 78.8 1–2 . . . . . . . . . . . . . . . . . . . . 0.000373 99,472 37 99,454 7,783,879 78.3 2–3 . . . . . . . . . . . . . . . . . . . . 0.000252 99,435 25 99,422 7,684,426 77.3 3–4 . . . . . . . . . . . . . . . . . . . . 0.000195 99,410 19 99,400 7,585,003 76.3 4–5 . . . . . . . . . . . . . . . . . . . . 0.000148 99,391 15 99,383 7,485,603 75.3 5–6 . . . . . . . . . . . . . . . . . . . . 0.000136 99,376 14 99,369 7,386,220 74.3 6–7 . . . . . . . . . . . . . . . . . . . . 0.000122 99,362 12 99,356 7,286,851 73.3 7–8 . . . . . . . . . . . . . . . . . . . . 0.000110 99,350 11 99,345 7,187,495 72.3 8–9 . . . . . . . . . . . . . . . . . . . . 0.000098 99,339 10 99,334 7,088,150 71.4 9–10 . . . . . . . . . . . . . . . . . . . 0.000085 99,330 8 99,325 6,988,816 70.4
10–11 . . . . . . . . . . . . . . . . . . . 0.000078 99,321 8 99,317 6,889,490 69.4 11–12 . . . . . . . . . . . . . . . . . . . 0.000084 99,313 8 99,309 6,790,173 68.4 12–13 . . . . . . . . . . . . . . . . . . . 0.000116 99,305 12 99,299 6,690,864 67.4 13–14 . . . . . . . . . . . . . . . . . . . 0.000179 99,293 18 99,285 6,591,565 66.4 14–15 . . . . . . . . . . . . . . . . . . . 0.000261 99,276 26 99,263 6,492,280 65.4 15–16 . . . . . . . . . . . . . . . . . . . 0.000348 99,250 35 99,232 6,393,018 64.4 16–17 . . . . . . . . . . . . . . . . . . . 0.000429 99,215 43 99,194 6,293,785 63.4 17–18 . . . . . . . . . . . . . . . . . . . 0.000507 99,173 50 99,147 6,194,591 62.5 18–19 . . . . . . . . . . . . . . . . . . . 0.000581 99,122 58 99,093 6,095,444 61.5 19–20 . . . . . . . . . . . . . . . . . . . 0.000651 99,065 64 99,032 5,996,350 60.5 20–21 . . . . . . . . . . . . . . . . . . . 0.000724 99,000 72 98,964 5,897,318 59.6 21–22 . . . . . . . . . . . . . . . . . . . 0.000794 98,929 79 98,889 5,798,354 58.6 22–23 . . . . . . . . . . . . . . . . . . . 0.000845 98,850 84 98,808 5,699,464 57.7 23–24 . . . . . . . . . . . . . . . . . . . 0.000870 98,766 86 98,723 5,600,656 56.7 24–25 . . . . . . . . . . . . . . . . . . . 0.000877 98,681 87 98,637 5,501,933 55.8 25–26 . . . . . . . . . . . . . . . . . . . 0.000878 98,594 87 98,551 5,403,296 54.8 26–27 . . . . . . . . . . . . . . . . . . . 0.000883 98,507 87 98,464 5,304,745 53.9 27–28 . . . . . . . . . . . . . . . . . . . 0.000892 98,421 88 98,377 5,206,281 52.9 28–29 . . . . . . . . . . . . . . . . . . . 0.000909 98,333 89 98,288 5,107,904 51.9 29–30 . . . . . . . . . . . . . . . . . . . 0.000934 98,243 92 98,198 5,009,616 51.0 30–31 . . . . . . . . . . . . . . . . . . . 0.000966 98,152 95 98,104 4,911,418 50.0 31–32 . . . . . . . . . . . . . . . . . . . 0.001003 98,057 98 98,008 4,813,314 49.1 32–33 . . . . . . . . . . . . . . . . . . . 0.001043 97,959 102 97,907 4,715,306 48.1 33–34 . . . . . . . . . . . . . . . . . . . 0.001087 97,856 106 97,803 4,617,399 47.2 34–35 . . . . . . . . . . . . . . . . . . . 0.001134 97,750 111 97,695 4,519,596 46.2 35–36 . . . . . . . . . . . . . . . . . . . 0.001191 97,639 116 97,581 4,421,901 45.3 36–37 . . . . . . . . . . . . . . . . . . . 0.001261 97,523 123 97,461 4,324,320 44.3 37–38 . . . . . . . . . . . . . . . . . . . 0.001343 97,400 131 97,334 4,226,859 43.4 38–39 . . . . . . . . . . . . . . . . . . . 0.001441 97,269 140 97,199 4,129,525 42.5 39–40 . . . . . . . . . . . . . . . . . . . 0.001556 97,129 151 97,053 4,032,326 41.5 40–41 . . . . . . . . . . . . . . . . . . . 0.001684 96,978 163 96,896 3,935,272 40.6 41–42 . . . . . . . . . . . . . . . . . . . 0.001830 96,814 177 96,726 3,838,376 39.6 42–43 . . . . . . . . . . . . . . . . . . . 0.002008 96,637 194 96,540 3,741,650 38.7 43–44 . . . . . . . . . . . . . . . . . . . 0.002216 96,443 214 96,336 3,645,110 37.8 44–45 . . . . . . . . . . . . . . . . . . . 0.002443 96,229 235 96,112 3,548,774 36.9 45–46 . . . . . . . . . . . . . . . . . . . 0.002670 95,994 256 95,866 3,452,662 36.0 46–47 . . . . . . . . . . . . . . . . . . . 0.002900 95,738 278 95,599 3,356,796 35.1 47–48 . . . . . . . . . . . . . . . . . . . 0.003153 95,460 301 95,310 3,261,197 34.2 48–49 . . . . . . . . . . . . . . . . . . . 0.003441 95,159 327 94,996 3,165,887 33.3 49–50 . . . . . . . . . . . . . . . . . . . 0.003763 94,832 357 94,654 3,070,891 32.4 50–51 . . . . . . . . . . . . . . . . . . . 0.004116 94,475 389 94,281 2,976,237 31.5 51–52 . . . . . . . . . . . . . . . . . . . 0.004480 94,086 421 93,876 2,881,957 30.6 52–53 . . . . . . . . . . . . . . . . . . . 0.004840 93,665 453 93,438 2,788,081 29.8 53–54 . . . . . . . . . . . . . . . . . . . 0.005188 93,211 484 92,970 2,694,643 28.9 54–55 . . . . . . . . . . . . . . . . . . . 0.005537 92,728 513 92,471 2,601,673 28.1 55–56 . . . . . . . . . . . . . . . . . . . 0.005907 92,214 545 91,942 2,509,202 27.2 56–57 . . . . . . . . . . . . . . . . . . . 0.006324 91,670 580 91,380 2,417,260 26.4 57–58 . . . . . . . . . . . . . . . . . . . 0.006796 91,090 619 90,780 2,325,880 25.5 58–59 . . . . . . . . . . . . . . . . . . . 0.007334 90,471 663 90,139 2,235,100 24.7 59–60 . . . . . . . . . . . . . . . . . . . 0.007928 89,807 712 89,451 2,144,960 23.9 60–61 . . . . . . . . . . . . . . . . . . . 0.008573 89,095 764 88,714 2,055,509 23.1 61–62 . . . . . . . . . . . . . . . . . . . 0.009260 88,332 818 87,923 1,966,795 22.3
See footnote at end of table.
16 National Vital Statistics Reports, Vol. 62, No. 7, January 6, 2014
Table 4. Life table for the white population: United States, 2009—Con. Spreadsheet version available from: ftp://ftp.cdc.gov/pub/Health_Statistics/NCHS/Publications/NVSR/62_07/Table04.xls.
Age (years)
Probability of dying between
ages x and x + 1
Number surviving to
age x
Number dying
between ages x and x + 1
Person-years lived
between ages x and x + 1
Total number of
person-years lived above
age x
Expectation of life
at age x
qx lx dx Lx Tx ex
62–63 . . . . . . . . . . . . . . . . . . . 0.010002 87,514 875 87,076 1,878,873 21.5 63–64 . . . . . . . . . . . . . . . . . . . 0.010816 86,638 937 86,170 1,791,797 20.7 64–65 . . . . . . . . . . . . . . . . . . . 0.011731 85,701 1,005 85,199 1,705,627 19.9 65–66 . . . . . . . . . . . . . . . . . . . 0.012801 84,696 1,084 84,154 1,620,428 19.1 66–67 . . . . . . . . . . . . . . . . . . . 0.014012 83,612 1,172 83,026 1,536,274 18.4 67–68 . . . . . . . . . . . . . . . . . . . 0.015305 82,440 1,262 81,809 1,453,248 17.6 68–69 . . . . . . . . . . . . . . . . . . . 0.016642 81,178 1,351 80,503 1,371,439 16.9 69–70 . . . . . . . . . . . . . . . . . . . 0.018028 79,828 1,439 79,108 1,290,936 16.2 70–71 . . . . . . . . . . . . . . . . . . . 0.019590 78,388 1,536 77,621 1,211,828 15.5 71–72 . . . . . . . . . . . . . . . . . . . 0.021390 76,853 1,644 76,031 1,134,207 14.8 72–73 . . . . . . . . . . . . . . . . . . . 0.023393 75,209 1,759 74,329 1,058,176 14.1 73–74 . . . . . . . . . . . . . . . . . . . 0.025713 73,450 1,889 72,505 983,847 13.4 74–75 . . . . . . . . . . . . . . . . . . . 0.028278 71,561 2,024 70,549 911,342 12.7 75–76 . . . . . . . . . . . . . . . . . . . 0.030898 69,537 2,149 68,463 840,793 12.1 76–77 . . . . . . . . . . . . . . . . . . . 0.033816 67,389 2,279 66,249 772,330 11.5 77–78 . . . . . . . . . . . . . . . . . . . 0.037278 65,110 2,427 63,896 706,080 10.8 78–79 . . . . . . . . . . . . . . . . . . . 0.041233 62,683 2,585 61,391 642,184 10.2 79–80 . . . . . . . . . . . . . . . . . . . 0.045514 60,098 2,735 58,731 580,793 9.7 80–81 . . . . . . . . . . . . . . . . . . . 0.050183 57,363 2,879 55,924 522,063 9.1 81–82 . . . . . . . . . . . . . . . . . . . 0.055227 54,484 3,009 52,980 466,139 8.6 82–83 . . . . . . . . . . . . . . . . . . . 0.061137 51,475 3,147 49,902 413,159 8.0 83–84 . . . . . . . . . . . . . . . . . . . 0.067865 48,328 3,280 46,688 363,258 7.5 84–85 . . . . . . . . . . . . . . . . . . . 0.075368 45,048 3,395 43,351 316,569 7.0 85–86 . . . . . . . . . . . . . . . . . . . 0.084360 41,653 3,514 39,896 273,219 6.6 86–87 . . . . . . . . . . . . . . . . . . . 0.094035 38,139 3,586 36,346 233,322 6.1 87–88 . . . . . . . . . . . . . . . . . . . 0.104620 34,553 3,615 32,745 196,976 5.7 88–89 . . . . . . . . . . . . . . . . . . . 0.116155 30,938 3,594 29,141 164,231 5.3 89–90 . . . . . . . . . . . . . . . . . . . 0.128670 27,344 3,518 25,585 135,090 4.9 90–91 . . . . . . . . . . . . . . . . . . . 0.142186 23,826 3,388 22,132 109,504 4.6 91–92 . . . . . . . . . . . . . . . . . . . 0.156707 20,438 3,203 18,837 87,372 4.3 92–93 . . . . . . . . . . . . . . . . . . . 0.172225 17,235 2,968 15,751 68,535 4.0 93–94 . . . . . . . . . . . . . . . . . . . 0.188711 14,267 2,692 12,921 52,784 3.7 94–95 . . . . . . . . . . . . . . . . . . . 0.206117 11,575 2,386 10,382 39,863 3.4 95–96 . . . . . . . . . . . . . . . . . . . 0.224375 9,189 2,062 8,158 29,481 3.2 96–97 . . . . . . . . . . . . . . . . . . . 0.243396 7,127 1,735 6,260 21,323 3.0 97–98 . . . . . . . . . . . . . . . . . . . 0.263070 5,392 1,419 4,683 15,064 2.8 98–99 . . . . . . . . . . . . . . . . . . . 0.283270 3,974 1,126 3,411 10,380 2.6 99–100. . . . . . . . . . . . . . . . . . . 0.303853 2,848 865 2,415 6,969 2.4 100 and over . . . . . . . . . . . . . . . 1.000000 1,983 1,983 4,554 4,554 2.3
SOURCE: CDC/NCHS, National Vital Statistics System.
National Vital Statistics Reports, Vol. 62, No. 7, January 6, 2014 17
Table 5. Life table for white males: United States, 2009 Spreadsheet version available from: ftp://ftp.cdc.gov/pub/Health_Statistics/NCHS/Publications/NVSR/62_07/Table05.xls.
Age (years)
Probability of dying between
ages x and x + 1
Number surviving to
age x
Number dying
between ages x and x + 1
Person-years lived
between ages x and x + 1
Total number of
person-years lived above
age x
Expectation of life
at age x
qx lx dx Lx Tx ex
0–1 . . . . . . . . . . . . . . . . . . . . 0.005773 100,000 577 99,498 7,641,039 76.4 1–2 . . . . . . . . . . . . . . . . . . . . 0.000412 99,423 41 99,402 7,541,541 75.9 2–3 . . . . . . . . . . . . . . . . . . . . 0.000275 99,382 27 99,368 7,442,139 74.9 3–4 . . . . . . . . . . . . . . . . . . . . 0.000218 99,354 22 99,344 7,342,771 73.9 4–5 . . . . . . . . . . . . . . . . . . . . 0.000167 99,333 17 99,325 7,243,427 72.9 5–6 . . . . . . . . . . . . . . . . . . . . 0.000152 99,316 15 99,309 7,144,103 71.9 6–7 . . . . . . . . . . . . . . . . . . . . 0.000136 99,301 14 99,294 7,044,794 70.9 7–8 . . . . . . . . . . . . . . . . . . . . 0.000123 99,288 12 99,282 6,945,500 70.0 8–9 . . . . . . . . . . . . . . . . . . . . 0.000106 99,275 11 99,270 6,846,218 69.0 9–10 . . . . . . . . . . . . . . . . . . . 0.000088 99,265 9 99,261 6,746,948 68.0
10–11 . . . . . . . . . . . . . . . . . . . 0.000075 99,256 7 99,252 6,647,688 67.0 11–12 . . . . . . . . . . . . . . . . . . . 0.000082 99,249 8 99,245 6,548,435 66.0 12–13 . . . . . . . . . . . . . . . . . . . 0.000126 99,241 12 99,234 6,449,191 65.0 13–14 . . . . . . . . . . . . . . . . . . . 0.000213 99,228 21 99,218 6,349,956 64.0 14–15 . . . . . . . . . . . . . . . . . . . 0.000330 99,207 33 99,191 6,250,739 63.0 15–16 . . . . . . . . . . . . . . . . . . . 0.000450 99,174 45 99,152 6,151,548 62.0 16–17 . . . . . . . . . . . . . . . . . . . 0.000564 99,130 56 99,102 6,052,396 61.1 17–18 . . . . . . . . . . . . . . . . . . . 0.000680 99,074 67 99,040 5,953,295 60.1 18–19 . . . . . . . . . . . . . . . . . . . 0.000799 99,006 79 98,967 5,854,255 59.1 19–20 . . . . . . . . . . . . . . . . . . . 0.000917 98,927 91 98,882 5,755,288 58.2 20–21 . . . . . . . . . . . . . . . . . . . 0.001042 98,836 103 98,785 5,656,406 57.2 21–22 . . . . . . . . . . . . . . . . . . . 0.001157 98,734 114 98,676 5,557,621 56.3 22–23 . . . . . . . . . . . . . . . . . . . 0.001237 98,619 122 98,558 5,458,945 55.4 23–24 . . . . . . . . . . . . . . . . . . . 0.001266 98,497 125 98,435 5,360,387 54.4 24–25 . . . . . . . . . . . . . . . . . . . 0.001258 98,373 124 98,311 5,261,952 53.5 25–26 . . . . . . . . . . . . . . . . . . . 0.001239 98,249 122 98,188 5,163,641 52.6 26–27 . . . . . . . . . . . . . . . . . . . 0.001228 98,127 120 98,067 5,065,453 51.6 27–28 . . . . . . . . . . . . . . . . . . . 0.001223 98,007 120 97,947 4,967,386 50.7 28–29 . . . . . . . . . . . . . . . . . . . 0.001234 97,887 121 97,826 4,869,439 49.7 29–30 . . . . . . . . . . . . . . . . . . . 0.001258 97,766 123 97,705 4,771,613 48.8 30–31 . . . . . . . . . . . . . . . . . . . 0.001289 97,643 126 97,580 4,673,909 47.9 31–32 . . . . . . . . . . . . . . . . . . . 0.001323 97,517 129 97,453 4,576,328 46.9 32–33 . . . . . . . . . . . . . . . . . . . 0.001362 97,388 133 97,322 4,478,876 46.0 33–34 . . . . . . . . . . . . . . . . . . . 0.001408 97,256 137 97,187 4,381,554 45.1 34–35 . . . . . . . . . . . . . . . . . . . 0.001458 97,119 142 97,048 4,284,367 44.1 35–36 . . . . . . . . . . . . . . . . . . . 0.001522 96,977 148 96,903 4,187,319 43.2 36–37 . . . . . . . . . . . . . . . . . . . 0.001603 96,829 155 96,752 4,090,416 42.2 37–38 . . . . . . . . . . . . . . . . . . . 0.001697 96,674 164 96,592 3,993,664 41.3 38–39 . . . . . . . . . . . . . . . . . . . 0.001808 96,510 174 96,423 3,897,072 40.4 39–40 . . . . . . . . . . . . . . . . . . . 0.001940 96,336 187 96,242 3,800,649 39.5 40–41 . . . . . . . . . . . . . . . . . . . 0.002089 96,149 201 96,048 3,704,407 38.5 41–42 . . . . . . . . . . . . . . . . . . . 0.002263 95,948 217 95,839 3,608,358 37.6 42–43 . . . . . . . . . . . . . . . . . . . 0.002475 95,731 237 95,612 3,512,519 36.7 43–44 . . . . . . . . . . . . . . . . . . . 0.002727 95,494 260 95,364 3,416,907 35.8 44–45 . . . . . . . . . . . . . . . . . . . 0.003003 95,233 286 95,090 3,321,543 34.9 45–46 . . . . . . . . . . . . . . . . . . . 0.003281 94,947 312 94,792 3,226,453 34.0 46–47 . . . . . . . . . . . . . . . . . . . 0.003566 94,636 338 94,467 3,131,661 33.1 47–48 . . . . . . . . . . . . . . . . . . . 0.003887 94,298 367 94,115 3,037,194 32.2 48–49 . . . . . . . . . . . . . . . . . . . 0.004259 93,932 400 93,732 2,943,079 31.3 49–50 . . . . . . . . . . . . . . . . . . . 0.004680 93,532 438 93,313 2,849,347 30.5 50–51 . . . . . . . . . . . . . . . . . . . 0.005139 93,094 478 92,855 2,756,034 29.6 51–52 . . . . . . . . . . . . . . . . . . . 0.005610 92,616 520 92,356 2,663,179 28.8 52–53 . . . . . . . . . . . . . . . . . . . 0.006083 92,096 560 91,816 2,570,824 27.9 53–54 . . . . . . . . . . . . . . . . . . . 0.006547 91,536 599 91,236 2,479,008 27.1 54–55 . . . . . . . . . . . . . . . . . . . 0.007015 90,937 638 90,618 2,387,772 26.3 55–56 . . . . . . . . . . . . . . . . . . . 0.007514 90,299 679 89,959 2,297,154 25.4 56–57 . . . . . . . . . . . . . . . . . . . 0.008066 89,620 723 89,259 2,207,195 24.6 57–58 . . . . . . . . . . . . . . . . . . . 0.008664 88,897 770 88,512 2,117,936 23.8 58–59 . . . . . . . . . . . . . . . . . . . 0.009307 88,127 820 87,717 2,029,424 23.0 59–60 . . . . . . . . . . . . . . . . . . . 0.009993 87,307 872 86,871 1,941,707 22.2 60–61 . . . . . . . . . . . . . . . . . . . 0.010723 86,434 927 85,971 1,854,836 21.5 61–62 . . . . . . . . . . . . . . . . . . . 0.011507 85,508 984 85,016 1,768,865 20.7
See footnote at end of table.

18 National Vital Statistics Reports, Vol. 62, No. 7, January 6, 2014
Table 5. Life table for white males: United States, 2009—Con. Spreadsheet version available from: ftp://ftp.cdc.gov/pub/Health_Statistics/NCHS/Publications/NVSR/62_07/Table05.xls.
Age (years)
Probability of dying between
ages x and x + 1
Number surviving to
age x
Number dying
between ages x and x + 1
Person-years lived
between ages x and x + 1
Total number of
person-years lived above
age x
Expectation of life
at age x
qx lx dx Lx Tx ex
62–63 . . . . . . . . . . . . . . . . . . . 0.012365 84,524 1,045 84,001 1,683,849 19.9 63–64 . . . . . . . . . . . . . . . . . . . 0.013333 83,479 1,113 82,922 1,599,848 19.2 64–65 . . . . . . . . . . . . . . . . . . . 0.014442 82,366 1,190 81,771 1,516,926 18.4 65–66 . . . . . . . . . . . . . . . . . . . 0.015741 81,176 1,278 80,537 1,435,155 17.7 66–67 . . . . . . . . . . . . . . . . . . . 0.017204 79,898 1,375 79,211 1,354,618 17.0 67–68 . . . . . . . . . . . . . . . . . . . 0.018761 78,524 1,473 77,787 1,275,407 16.2 68–69 . . . . . . . . . . . . . . . . . . . 0.020355 77,051 1,568 76,266 1,197,620 15.5 69–70 . . . . . . . . . . . . . . . . . . . 0.021987 75,482 1,660 74,652 1,121,353 14.9 70–71 . . . . . . . . . . . . . . . . . . . 0.023814 73,823 1,758 72,944 1,046,701 14.2 71–72 . . . . . . . . . . . . . . . . . . . 0.025894 72,065 1,866 71,132 973,757 13.5 72–73 . . . . . . . . . . . . . . . . . . . 0.028246 70,199 1,983 69,207 902,626 12.9 73–74 . . . . . . . . . . . . . . . . . . . 0.031028 68,216 2,117 67,157 833,419 12.2 74–75 . . . . . . . . . . . . . . . . . . . 0.034068 66,099 2,252 64,973 766,261 11.6 75–76 . . . . . . . . . . . . . . . . . . . 0.037198 63,847 2,375 62,660 701,288 11.0 76–77 . . . . . . . . . . . . . . . . . . . 0.040676 61,472 2,500 60,222 638,628 10.4 77–78 . . . . . . . . . . . . . . . . . . . 0.044832 58,972 2,644 57,650 578,406 9.8 78–79 . . . . . . . . . . . . . . . . . . . 0.049554 56,328 2,791 54,932 520,756 9.2 79–80 . . . . . . . . . . . . . . . . . . . 0.054616 53,537 2,924 52,075 465,824 8.7 80–81 . . . . . . . . . . . . . . . . . . . 0.060338 50,613 3,054 49,086 413,749 8.2 81–82 . . . . . . . . . . . . . . . . . . . 0.066513 47,559 3,163 45,977 364,664 7.7 82–83 . . . . . . . . . . . . . . . . . . . 0.073450 44,396 3,261 42,765 318,686 7.2 83–84 . . . . . . . . . . . . . . . . . . . 0.081179 41,135 3,339 39,465 275,921 6.7 84–85 . . . . . . . . . . . . . . . . . . . 0.089905 37,795 3,398 36,096 236,456 6.3 85–86 . . . . . . . . . . . . . . . . . . . 0.100809 34,397 3,468 32,664 200,360 5.8 86–87 . . . . . . . . . . . . . . . . . . . 0.112144 30,930 3,469 29,196 167,696 5.4 87–88 . . . . . . . . . . . . . . . . . . . 0.124473 27,461 3,418 25,752 138,501 5.0 88–89 . . . . . . . . . . . . . . . . . . . 0.137821 24,043 3,314 22,386 112,749 4.7 89–90 . . . . . . . . . . . . . . . . . . . 0.152198 20,729 3,155 19,152 90,362 4.4 90–91 . . . . . . . . . . . . . . . . . . . 0.167600 17,574 2,945 16,102 71,211 4.1 91–92 . . . . . . . . . . . . . . . . . . . 0.184003 14,629 2,692 13,283 55,109 3.8 92–93 . . . . . . . . . . . . . . . . . . . 0.201364 11,937 2,404 10,735 41,826 3.5 93–94 . . . . . . . . . . . . . . . . . . . 0.219617 9,533 2,094 8,487 31,091 3.3 94–95 . . . . . . . . . . . . . . . . . . . 0.238676 7,440 1,776 6,552 22,604 3.0 95–96 . . . . . . . . . . . . . . . . . . . 0.258433 5,664 1,464 4,932 16,052 2.8 96–97 . . . . . . . . . . . . . . . . . . . 0.278760 4,200 1,171 3,615 11,120 2.6 97–98 . . . . . . . . . . . . . . . . . . . 0.299513 3,029 907 2,576 7,505 2.5 98–99 . . . . . . . . . . . . . . . . . . . 0.320535 2,122 680 1,782 4,929 2.3 99–100. . . . . . . . . . . . . . . . . . . 0.341658 1,442 493 1,196 3,147 2.2 100 and over . . . . . . . . . . . . . . . 1.000000 949 949 1,952 1,952 2.1
SOURCE: CDC/NCHS, National Vital Statistics System.
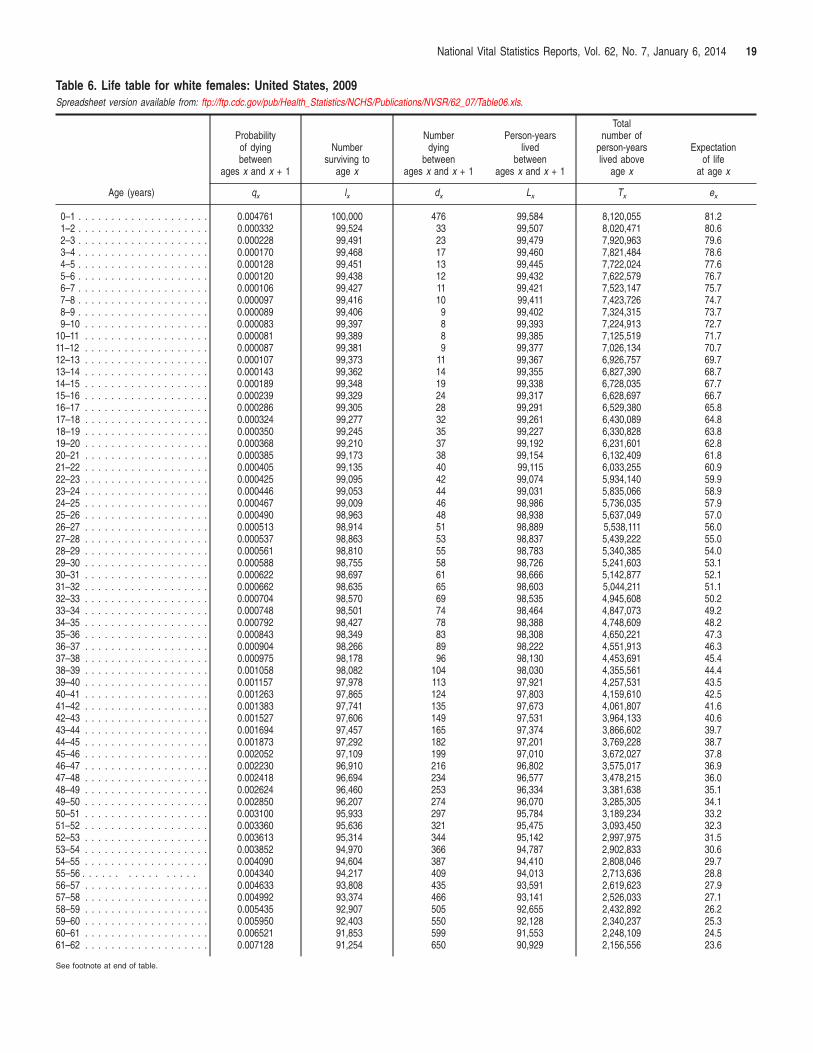
National Vital Statistics Reports, Vol. 62, No. 7, January 6, 2014 19
Table 6. Life table for white females: United States, 2009 Spreadsheet version available from: ftp://ftp.cdc.gov/pub/Health_Statistics/NCHS/Publications/NVSR/62_07/Table06.xls.
Age (years)
Probability of dying between
ages x and x + 1
Number surviving to
age x
Number dying
between ages x and x + 1
Person-years lived
between ages x and x + 1
Total number of
person-years lived above
age x
Expectation of life
at age x
qx lx dx Lx Tx ex
0–1 . . . . . . . . . . . . . . . . . . . . 0.004761 100,000 476 99,584 8,120,055 81.2 1–2 . . . . . . . . . . . . . . . . . . . . 0.000332 99,524 33 99,507 8,020,471 80.6 2–3 . . . . . . . . . . . . . . . . . . . . 0.000228 99,491 23 99,479 7,920,963 79.6 3–4 . . . . . . . . . . . . . . . . . . . . 0.000170 99,468 17 99,460 7,821,484 78.6 4–5 . . . . . . . . . . . . . . . . . . . . 0.000128 99,451 13 99,445 7,722,024 77.6 5–6 . . . . . . . . . . . . . . . . . . . . 0.000120 99,438 12 99,432 7,622,579 76.7 6–7 . . . . . . . . . . . . . . . . . . . . 0.000106 99,427 11 99,421 7,523,147 75.7 7–8 . . . . . . . . . . . . . . . . . . . . 0.000097 99,416 10 99,411 7,423,726 74.7 8–9 . . . . . . . . . . . . . . . . . . . . 0.000089 99,406 9 99,402 7,324,315 73.7 9–10 . . . . . . . . . . . . . . . . . . . 0.000083 99,397 8 99,393 7,224,913 72.7
10–11 . . . . . . . . . . . . . . . . . . . 0.000081 99,389 8 99,385 7,125,519 71.7 11–12 . . . . . . . . . . . . . . . . . . . 0.000087 99,381 9 99,377 7,026,134 70.7 12–13 . . . . . . . . . . . . . . . . . . . 0.000107 99,373 11 99,367 6,926,757 69.7 13–14 . . . . . . . . . . . . . . . . . . . 0.000143 99,362 14 99,355 6,827,390 68.7 14–15 . . . . . . . . . . . . . . . . . . . 0.000189 99,348 19 99,338 6,728,035 67.7 15–16 . . . . . . . . . . . . . . . . . . . 0.000239 99,329 24 99,317 6,628,697 66.7 16–17 . . . . . . . . . . . . . . . . . . . 0.000286 99,305 28 99,291 6,529,380 65.8 17–18 . . . . . . . . . . . . . . . . . . . 0.000324 99,277 32 99,261 6,430,089 64.8 18–19 . . . . . . . . . . . . . . . . . . . 0.000350 99,245 35 99,227 6,330,828 63.8 19–20 . . . . . . . . . . . . . . . . . . . 0.000368 99,210 37 99,192 6,231,601 62.8 20–21 . . . . . . . . . . . . . . . . . . . 0.000385 99,173 38 99,154 6,132,409 61.8 21–22 . . . . . . . . . . . . . . . . . . . 0.000405 99,135 40 99,115 6,033,255 60.9 22–23 . . . . . . . . . . . . . . . . . . . 0.000425 99,095 42 99,074 5,934,140 59.9 23–24 . . . . . . . . . . . . . . . . . . . 0.000446 99,053 44 99,031 5,835,066 58.9 24–25 . . . . . . . . . . . . . . . . . . . 0.000467 99,009 46 98,986 5,736,035 57.9 25–26 . . . . . . . . . . . . . . . . . . . 0.000490 98,963 48 98,938 5,637,049 57.0 26–27 . . . . . . . . . . . . . . . . . . . 0.000513 98,914 51 98,889 5,538,111 56.0 27–28 . . . . . . . . . . . . . . . . . . . 0.000537 98,863 53 98,837 5,439,222 55.0 28–29 . . . . . . . . . . . . . . . . . . . 0.000561 98,810 55 98,783 5,340,385 54.0 29–30 . . . . . . . . . . . . . . . . . . . 0.000588 98,755 58 98,726 5,241,603 53.1 30–31 . . . . . . . . . . . . . . . . . . . 0.000622 98,697 61 98,666 5,142,877 52.1 31–32 . . . . . . . . . . . . . . . . . . . 0.000662 98,635 65 98,603 5,044,211 51.1 32–33 . . . . . . . . . . . . . . . . . . . 0.000704 98,570 69 98,535 4,945,608 50.2 33–34 . . . . . . . . . . . . . . . . . . . 0.000748 98,501 74 98,464 4,847,073 49.2 34–35 . . . . . . . . . . . . . . . . . . . 0.000792 98,427 78 98,388 4,748,609 48.2 35–36 . . . . . . . . . . . . . . . . . . . 0.000843 98,349 83 98,308 4,650,221 47.3 36–37 . . . . . . . . . . . . . . . . . . . 0.000904 98,266 89 98,222 4,551,913 46.3 37–38 . . . . . . . . . . . . . . . . . . . 0.000975 98,178 96 98,130 4,453,691 45.4 38–39 . . . . . . . . . . . . . . . . . . . 0.001058 98,082 104 98,030 4,355,561 44.4 39–40 . . . . . . . . . . . . . . . . . . . 0.001157 97,978 113 97,921 4,257,531 43.5 40–41 . . . . . . . . . . . . . . . . . . . 0.001263 97,865 124 97,803 4,159,610 42.5 41–42 . . . . . . . . . . . . . . . . . . . 0.001383 97,741 135 97,673 4,061,807 41.6 42–43 . . . . . . . . . . . . . . . . . . . 0.001527 97,606 149 97,531 3,964,133 40.6 43–44 . . . . . . . . . . . . . . . . . . . 0.001694 97,457 165 97,374 3,866,602 39.7 44–45 . . . . . . . . . . . . . . . . . . . 0.001873 97,292 182 97,201 3,769,228 38.7 45–46 . . . . . . . . . . . . . . . . . . . 0.002052 97,109 199 97,010 3,672,027 37.8 46–47 . . . . . . . . . . . . . . . . . . . 0.002230 96,910 216 96,802 3,575,017 36.9 47–48 . . . . . . . . . . . . . . . . . . . 0.002418 96,694 234 96,577 3,478,215 36.0 48–49 . . . . . . . . . . . . . . . . . . . 0.002624 96,460 253 96,334 3,381,638 35.1 49–50 . . . . . . . . . . . . . . . . . . . 0.002850 96,207 274 96,070 3,285,305 34.1 50–51 . . . . . . . . . . . . . . . . . . . 0.003100 95,933 297 95,784 3,189,234 33.2 51–52 . . . . . . . . . . . . . . . . . . . 0.003360 95,636 321 95,475 3,093,450 32.3 52–53 . . . . . . . . . . . . . . . . . . . 0.003613 95,314 344 95,142 2,997,975 31.5 53–54 . . . . . . . . . . . . . . . . . . . 0.003852 94,970 366 94,787 2,902,833 30.6 54–55 . . . . . . . . . . . . . . . . . . . 0.004090 94,604 387 94,410 2,808,046 29.7 55–56 . . . . . . . . . . . . . . . . 0.004340 94,217 409 94,013 2,713,636 28.8 56–57 . . . . . . . . . . . . . . . . . . . 0.004633 93,808 435 93,591 2,619,623 27.9 57–58 . . . . . . . . . . . . . . . . . . . 0.004992 93,374 466 93,141 2,526,033 27.1 58–59 . . . . . . . . . . . . . . . . . . . 0.005435 92,907 505 92,655 2,432,892 26.2 59–60 . . . . . . . . . . . . . . . . . . . 0.005950 92,403 550 92,128 2,340,237 25.3 60–61 . . . . . . . . . . . . . . . . . . . 0.006521 91,853 599 91,553 2,248,109 24.5 61–62 . . . . . . . . . . . . . . . . . . . 0.007128 91,254 650 90,929 2,156,556 23.6
See footnote at end of table.

20 National Vital Statistics Reports, Vol. 62, No. 7, January 6, 2014
Table 6. Life table for white females: United States, 2009—Con. Spreadsheet version available from: ftp://ftp.cdc.gov/pub/Health_Statistics/NCHS/Publications/NVSR/62_07/Table06.xls.
Age (years)
Probability of dying between
ages x and x + 1
Number surviving to
age x
Number dying
between ages x and x + 1
Person-years lived
between ages x and x + 1
Total number of
person-years lived above
age x
Expectation of life
at age x
qx lx dx Lx Tx ex
62–63 . . . . . . . . . . . . . . . . . . . 0.007771 90,603 704 90,251 2,065,627 22.8 63–64 . . . . . . . . . . . . . . . . . . . 0.008457 89,899 760 89,519 1,975,376 22.0 64–65 . . . . . . . . . . . . . . . . . . . 0.009214 89,139 821 88,728 1,885,857 21.2 65–66 . . . . . . . . . . . . . . . . . . . 0.010099 88,318 892 87,872 1,797,129 20.3 66–67 . . . . . . . . . . . . . . . . . . . 0.011112 87,426 971 86,940 1,709,257 19.6 67–68 . . . . . . . . . . . . . . . . . . . 0.012198 86,454 1,055 85,927 1,622,317 18.8 68–69 . . . . . . . . . . . . . . . . . . . 0.013336 85,400 1,139 84,830 1,536,390 18.0 69–70 . . . . . . . . . . . . . . . . . . . 0.014535 84,261 1,225 83,648 1,451,559 17.2 70–71 . . . . . . . . . . . . . . . . . . . 0.015898 83,036 1,320 82,376 1,367,911 16.5 71–72 . . . . . . . . . . . . . . . . . . . 0.017498 81,716 1,430 81,001 1,285,535 15.7 72–73 . . . . . . . . . . . . . . . . . . . 0.019253 80,286 1,546 79,513 1,204,534 15.0 73–74 . . . . . . . . . . . . . . . . . . . 0.021246 78,740 1,673 77,904 1,125,021 14.3 74–75 . . . . . . . . . . . . . . . . . . . 0.023491 77,067 1,810 76,162 1,047,117 13.6 75–76 . . . . . . . . . . . . . . . . . . . 0.025776 75,257 1,940 74,287 970,954 12.9 76–77 . . . . . . . . . . . . . . . . . . . 0.028340 73,317 2,078 72,278 896,667 12.2 77–78 . . . . . . . . . . . . . . . . . . . 0.031370 71,240 2,235 70,122 824,389 11.6 78–79 . . . . . . . . . . . . . . . . . . . 0.034871 69,005 2,406 67,802 754,267 10.9 79–80 . . . . . . . . . . . . . . . . . . . 0.038751 66,598 2,581 65,308 686,465 10.3 80–81 . . . . . . . . . . . . . . . . . . . 0.042871 64,018 2,745 62,645 621,157 9.7 81–82 . . . . . . . . . . . . . . . . . . . 0.047353 61,273 2,901 59,822 558,512 9.1 82–83 . . . . . . . . . . . . . . . . . . . 0.052842 58,372 3,084 56,829 498,689 8.5 83–84 . . . . . . . . . . . . . . . . . . . 0.059264 55,287 3,277 53,649 441,860 8.0 84–85 . . . . . . . . . . . . . . . . . . . 0.066393 52,011 3,453 50,284 388,211 7.5 85–86 . . . . . . . . . . . . . . . . . . . 0.074600 48,557 3,622 46,746 337,927 7.0 86–87 . . . . . . . . . . . . . . . . . . . 0.083962 44,935 3,773 43,049 291,181 6.5 87–88 . . . . . . . . . . . . . . . . . . . 0.094104 41,162 3,874 39,225 248,132 6.0 88–89 . . . . . . . . . . . . . . . . . . . 0.105249 37,289 3,925 35,326 208,907 5.6 89–90 . . . . . . . . . . . . . . . . . . . 0.117443 33,364 3,918 31,405 173,580 5.2 90–91 . . . . . . . . . . . . . . . . . . . 0.130721 29,446 3,849 27,521 142,175 4.8 91–92 . . . . . . . . . . . . . . . . . . . 0.145104 25,597 3,714 23,739 114,654 4.5 92–93 . . . . . . . . . . . . . . . . . . . 0.160596 21,882 3,514 20,125 90,915 4.2 93–94 . . . . . . . . . . . . . . . . . . . 0.177179 18,368 3,254 16,741 70,789 3.9 94–95 . . . . . . . . . . . . . . . . . . . 0.194815 15,114 2,944 13,642 54,048 3.6 95–96 . . . . . . . . . . . . . . . . . . . 0.213442 12,169 2,597 10,871 40,407 3.3 96–97 . . . . . . . . . . . . . . . . . . . 0.232970 9,572 2,230 8,457 29,536 3.1 97–98 . . . . . . . . . . . . . . . . . . . 0.253286 7,342 1,860 6,412 21,079 2.9 98–99 . . . . . . . . . . . . . . . . . . . 0.274254 5,482 1,504 4,731 14,667 2.7 99–100. . . . . . . . . . . . . . . . . . . 0.295715 3,979 1,177 3,390 9,937 2.5 100 and over . . . . . . . . . . . . . . . 1.000000 2,802 2,802 6,546 6,546 2.3
SOURCE: CDC/NCHS, National Vital Statistics System.
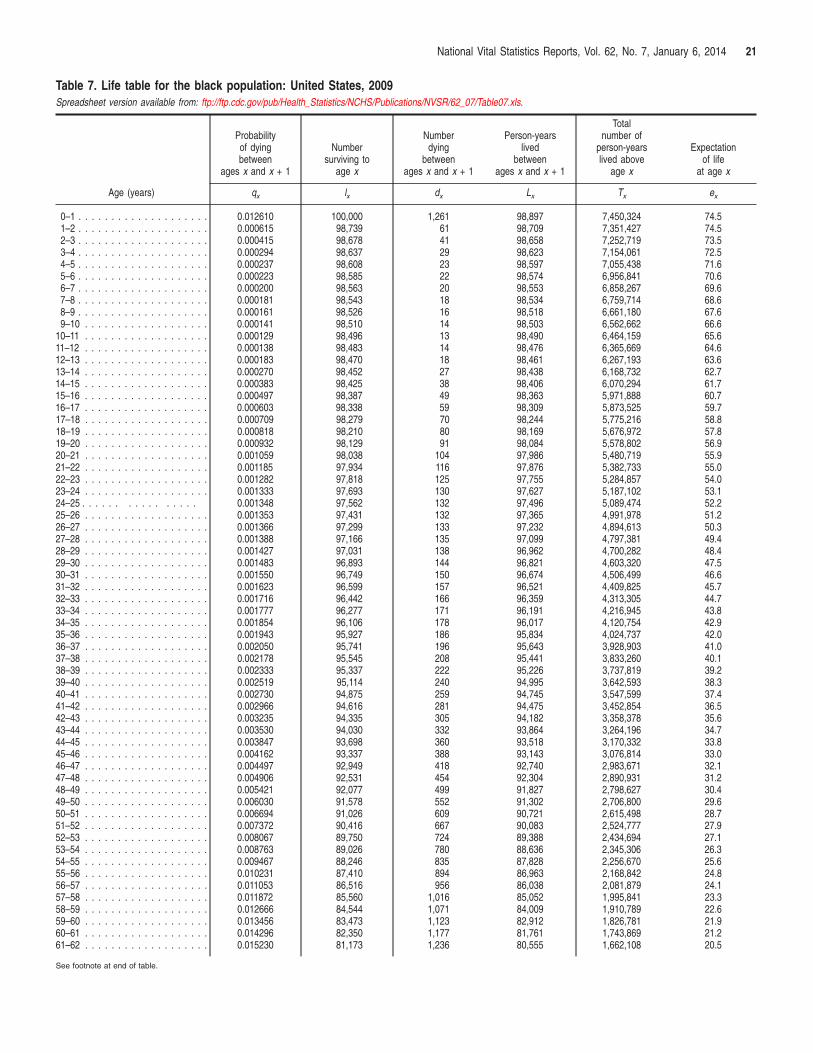
National Vital Statistics Reports, Vol. 62, No. 7, January 6, 2014 21
Table 7. Life table for the black population: United States, 2009 Spreadsheet version available from: ftp://ftp.cdc.gov/pub/Health_Statistics/NCHS/Publications/NVSR/62_07/Table07.xls.
Age (years)
Probability of dying between
ages x and x + 1
Number surviving to
age x
Number dying
between ages x and x + 1
Person-years lived
between ages x and x + 1
Total number of
person-years lived above
age x
Expectation of life
at age x
qx lx dx Lx Tx ex
0–1 . . . . . . . . . . . . . . . . . . . . 0.012610 100,000 1,261 98,897 7,450,324 74.5 1–2 . . . . . . . . . . . . . . . . . . . . 0.000615 98,739 61 98,709 7,351,427 74.5 2–3 . . . . . . . . . . . . . . . . . . . . 0.000415 98,678 41 98,658 7,252,719 73.5 3–4 . . . . . . . . . . . . . . . . . . . . 0.000294 98,637 29 98,623 7,154,061 72.5 4–5 . . . . . . . . . . . . . . . . . . . . 0.000237 98,608 23 98,597 7,055,438 71.6 5–6 . . . . . . . . . . . . . . . . . . . . 0.000223 98,585 22 98,574 6,956,841 70.6 6–7 . . . . . . . . . . . . . . . . . . . . 0.000200 98,563 20 98,553 6,858,267 69.6 7–8 . . . . . . . . . . . . . . . . . . . . 0.000181 98,543 18 98,534 6,759,714 68.6 8–9 . . . . . . . . . . . . . . . . . . . . 0.000161 98,526 16 98,518 6,661,180 67.6 9–10 . . . . . . . . . . . . . . . . . . . 0.000141 98,510 14 98,503 6,562,662 66.6
10–11 . . . . . . . . . . . . . . . . . . . 0.000129 98,496 13 98,490 6,464,159 65.6 11–12 . . . . . . . . . . . . . . . . . . . 0.000138 98,483 14 98,476 6,365,669 64.6 12–13 . . . . . . . . . . . . . . . . . . . 0.000183 98,470 18 98,461 6,267,193 63.6 13–14 . . . . . . . . . . . . . . . . . . . 0.000270 98,452 27 98,438 6,168,732 62.7 14–15 . . . . . . . . . . . . . . . . . . . 0.000383 98,425 38 98,406 6,070,294 61.7 15–16 . . . . . . . . . . . . . . . . . . . 0.000497 98,387 49 98,363 5,971,888 60.7 16–17 . . . . . . . . . . . . . . . . . . . 0.000603 98,338 59 98,309 5,873,525 59.7 17–18 . . . . . . . . . . . . . . . . . . . 0.000709 98,279 70 98,244 5,775,216 58.8 18–19 . . . . . . . . . . . . . . . . . . . 0.000818 98,210 80 98,169 5,676,972 57.8 19–20 . . . . . . . . . . . . . . . . . . . 0.000932 98,129 91 98,084 5,578,802 56.9 20–21 . . . . . . . . . . . . . . . . . . . 0.001059 98,038 104 97,986 5,480,719 55.9 21–22 . . . . . . . . . . . . . . . . . . . 0.001185 97,934 116 97,876 5,382,733 55.0 22–23 . . . . . . . . . . . . . . . . . . . 0.001282 97,818 125 97,755 5,284,857 54.0 23–24 . . . . . . . . . . . . . . . . . . . 0.001333 97,693 130 97,627 5,187,102 53.1 24–25 . . . . . . . . . . . . . . . . 0.001348 97,562 132 97,496 5,089,474 52.2 25–26 . . . . . . . . . . . . . . . . . . . 0.001353 97,431 132 97,365 4,991,978 51.2 26–27 . . . . . . . . . . . . . . . . . . . 0.001366 97,299 133 97,232 4,894,613 50.3 27–28 . . . . . . . . . . . . . . . . . . . 0.001388 97,166 135 97,099 4,797,381 49.4 28–29 . . . . . . . . . . . . . . . . . . . 0.001427 97,031 138 96,962 4,700,282 48.4 29–30 . . . . . . . . . . . . . . . . . . . 0.001483 96,893 144 96,821 4,603,320 47.5 30–31 . . . . . . . . . . . . . . . . . . . 0.001550 96,749 150 96,674 4,506,499 46.6 31–32 . . . . . . . . . . . . . . . . . . . 0.001623 96,599 157 96,521 4,409,825 45.7 32–33 . . . . . . . . . . . . . . . . . . . 0.001716 96,442 166 96,359 4,313,305 44.7 33–34 . . . . . . . . . . . . . . . . . . . 0.001777 96,277 171 96,191 4,216,945 43.8 34–35 . . . . . . . . . . . . . . . . . . . 0.001854 96,106 178 96,017 4,120,754 42.9 35–36 . . . . . . . . . . . . . . . . . . . 0.001943 95,927 186 95,834 4,024,737 42.0 36–37 . . . . . . . . . . . . . . . . . . . 0.002050 95,741 196 95,643 3,928,903 41.0 37–38 . . . . . . . . . . . . . . . . . . . 0.002178 95,545 208 95,441 3,833,260 40.1 38–39 . . . . . . . . . . . . . . . . . . . 0.002333 95,337 222 95,226 3,737,819 39.2 39–40 . . . . . . . . . . . . . . . . . . . 0.002519 95,114 240 94,995 3,642,593 38.3 40–41 . . . . . . . . . . . . . . . . . . . 0.002730 94,875 259 94,745 3,547,599 37.4 41–42 . . . . . . . . . . . . . . . . . . . 0.002966 94,616 281 94,475 3,452,854 36.5 42–43 . . . . . . . . . . . . . . . . . . . 0.003235 94,335 305 94,182 3,358,378 35.6 43–44 . . . . . . . . . . . . . . . . . . . 0.003530 94,030 332 93,864 3,264,196 34.7 44–45 . . . . . . . . . . . . . . . . . . . 0.003847 93,698 360 93,518 3,170,332 33.8 45–46 . . . . . . . . . . . . . . . . . . . 0.004162 93,337 388 93,143 3,076,814 33.0 46–47 . . . . . . . . . . . . . . . . . . . 0.004497 92,949 418 92,740 2,983,671 32.1 47–48 . . . . . . . . . . . . . . . . . . . 0.004906 92,531 454 92,304 2,890,931 31.2 48–49 . . . . . . . . . . . . . . . . . . . 0.005421 92,077 499 91,827 2,798,627 30.4 49–50 . . . . . . . . . . . . . . . . . . . 0.006030 91,578 552 91,302 2,706,800 29.6 50–51 . . . . . . . . . . . . . . . . . . . 0.006694 91,026 609 90,721 2,615,498 28.7 51–52 . . . . . . . . . . . . . . . . . . . 0.007372 90,416 667 90,083 2,524,777 27.9 52–53 . . . . . . . . . . . . . . . . . . . 0.008067 89,750 724 89,388 2,434,694 27.1 53–54 . . . . . . . . . . . . . . . . . . . 0.008763 89,026 780 88,636 2,345,306 26.3 54–55 . . . . . . . . . . . . . . . . . . . 0.009467 88,246 835 87,828 2,256,670 25.6 55–56 . . . . . . . . . . . . . . . . . . . 0.010231 87,410 894 86,963 2,168,842 24.8 56–57 . . . . . . . . . . . . . . . . . . . 0.011053 86,516 956 86,038 2,081,879 24.1 57–58 . . . . . . . . . . . . . . . . . . . 0.011872 85,560 1,016 85,052 1,995,841 23.3 58–59 . . . . . . . . . . . . . . . . . . . 0.012666 84,544 1,071 84,009 1,910,789 22.6 59–60 . . . . . . . . . . . . . . . . . . . 0.013456 83,473 1,123 82,912 1,826,781 21.9 60–61 . . . . . . . . . . . . . . . . . . . 0.014296 82,350 1,177 81,761 1,743,869 21.2 61–62 . . . . . . . . . . . . . . . . . . . 0.015230 81,173 1,236 80,555 1,662,108 20.5
See footnote at end of table.
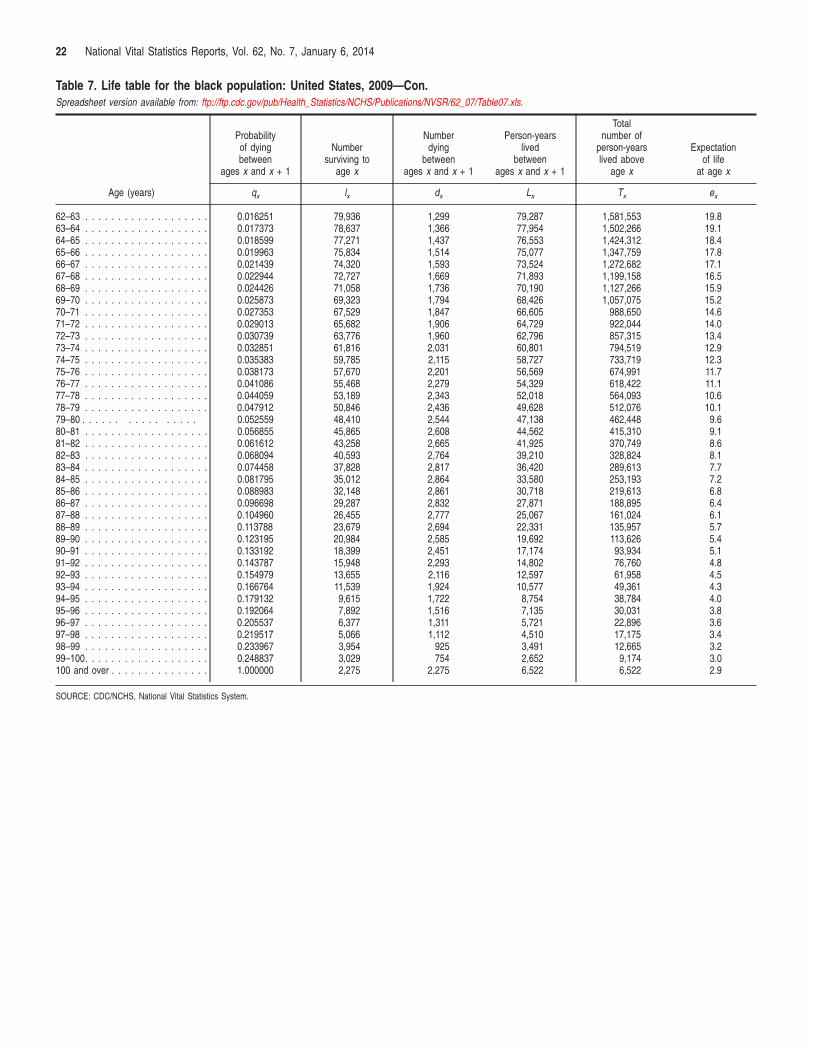
22 National Vital Statistics Reports, Vol. 62, No. 7, January 6, 2014
Table 7. Life table for the black population: United States, 2009—Con. Spreadsheet version available from: ftp://ftp.cdc.gov/pub/Health_Statistics/NCHS/Publications/NVSR/62_07/Table07.xls.
Age (years)
Probability of dying between
ages x and x + 1
Number surviving to
age x
Number dying
between ages x and x + 1
Person-years lived
between ages x and x + 1
Total number of
person-years lived above
age x
Expectation of life
at age x
qx lx dx Lx Tx ex
62–63 . . . . . . . . . . . . . . . . . . . 0.016251 79,936 1,299 79,287 1,581,553 19.8 63–64 . . . . . . . . . . . . . . . . . . . 0.017373 78,637 1,366 77,954 1,502,266 19.1 64–65 . . . . . . . . . . . . . . . . . . . 0.018599 77,271 1,437 76,553 1,424,312 18.4 65–66 . . . . . . . . . . . . . . . . . . . 0.019963 75,834 1,514 75,077 1,347,759 17.8 66–67 . . . . . . . . . . . . . . . . . . . 0.021439 74,320 1,593 73,524 1,272,682 17.1 67–68 . . . . . . . . . . . . . . . . . . . 0.022944 72,727 1,669 71,893 1,199,158 16.5 68–69 . . . . . . . . . . . . . . . . . . . 0.024426 71,058 1,736 70,190 1,127,266 15.9 69–70 . . . . . . . . . . . . . . . . . . . 0.025873 69,323 1,794 68,426 1,057,075 15.2 70–71 . . . . . . . . . . . . . . . . . . . 0.027353 67,529 1,847 66,605 988,650 14.6 71–72 . . . . . . . . . . . . . . . . . . . 0.029013 65,682 1,906 64,729 922,044 14.0 72–73 . . . . . . . . . . . . . . . . . . . 0.030739 63,776 1,960 62,796 857,315 13.4 73–74 . . . . . . . . . . . . . . . . . . . 0.032851 61,816 2,031 60,801 794,519 12.9 74–75 . . . . . . . . . . . . . . . . . . . 0.035383 59,785 2,115 58,727 733,719 12.3 75–76 . . . . . . . . . . . . . . . . . . . 0.038173 57,670 2,201 56,569 674,991 11.7 76–77 . . . . . . . . . . . . . . . . . . . 0.041086 55,468 2,279 54,329 618,422 11.1 77–78 . . . . . . . . . . . . . . . . . . . 0.044059 53,189 2,343 52,018 564,093 10.6 78–79 . . . . . . . . . . . . . . . . . . . 0.047912 50,846 2,436 49,628 512,076 10.1 79–80 . . . . . . . . . . . . . . . . 0.052559 48,410 2,544 47,138 462,448 9.6 80–81 . . . . . . . . . . . . . . . . . . . 0.056855 45,865 2,608 44,562 415,310 9.1 81–82 . . . . . . . . . . . . . . . . . . . 0.061612 43,258 2,665 41,925 370,749 8.6 82–83 . . . . . . . . . . . . . . . . . . . 0.068094 40,593 2,764 39,210 328,824 8.1 83–84 . . . . . . . . . . . . . . . . . . . 0.074458 37,828 2,817 36,420 289,613 7.7 84–85 . . . . . . . . . . . . . . . . . . . 0.081795 35,012 2,864 33,580 253,193 7.2 85–86 . . . . . . . . . . . . . . . . . . . 0.088983 32,148 2,861 30,718 219,613 6.8 86–87 . . . . . . . . . . . . . . . . . . . 0.096698 29,287 2,832 27,871 188,895 6.4 87–88 . . . . . . . . . . . . . . . . . . . 0.104960 26,455 2,777 25,067 161,024 6.1 88–89 . . . . . . . . . . . . . . . . . . . 0.113788 23,679 2,694 22,331 135,957 5.7 89–90 . . . . . . . . . . . . . . . . . . . 0.123195 20,984 2,585 19,692 113,626 5.4 90–91 . . . . . . . . . . . . . . . . . . . 0.133192 18,399 2,451 17,174 93,934 5.1 91–92 . . . . . . . . . . . . . . . . . . . 0.143787 15,948 2,293 14,802 76,760 4.8 92–93 . . . . . . . . . . . . . . . . . . . 0.154979 13,655 2,116 12,597 61,958 4.5 93–94 . . . . . . . . . . . . . . . . . . . 0.166764 11,539 1,924 10,577 49,361 4.3 94–95 . . . . . . . . . . . . . . . . . . . 0.179132 9,615 1,722 8,754 38,784 4.0 95–96 . . . . . . . . . . . . . . . . . . . 0.192064 7,892 1,516 7,135 30,031 3.8 96–97 . . . . . . . . . . . . . . . . . . . 0.205537 6,377 1,311 5,721 22,896 3.6 97–98 . . . . . . . . . . . . . . . . . . . 0.219517 5,066 1,112 4,510 17,175 3.4 98–99 . . . . . . . . . . . . . . . . . . . 0.233967 3,954 925 3,491 12,665 3.2 99–100. . . . . . . . . . . . . . . . . . . 0.248837 3,029 754 2,652 9,174 3.0 100 and over . . . . . . . . . . . . . . . 1.000000 2,275 2,275 6,522 6,522 2.9
SOURCE: CDC/NCHS, National Vital Statistics System.
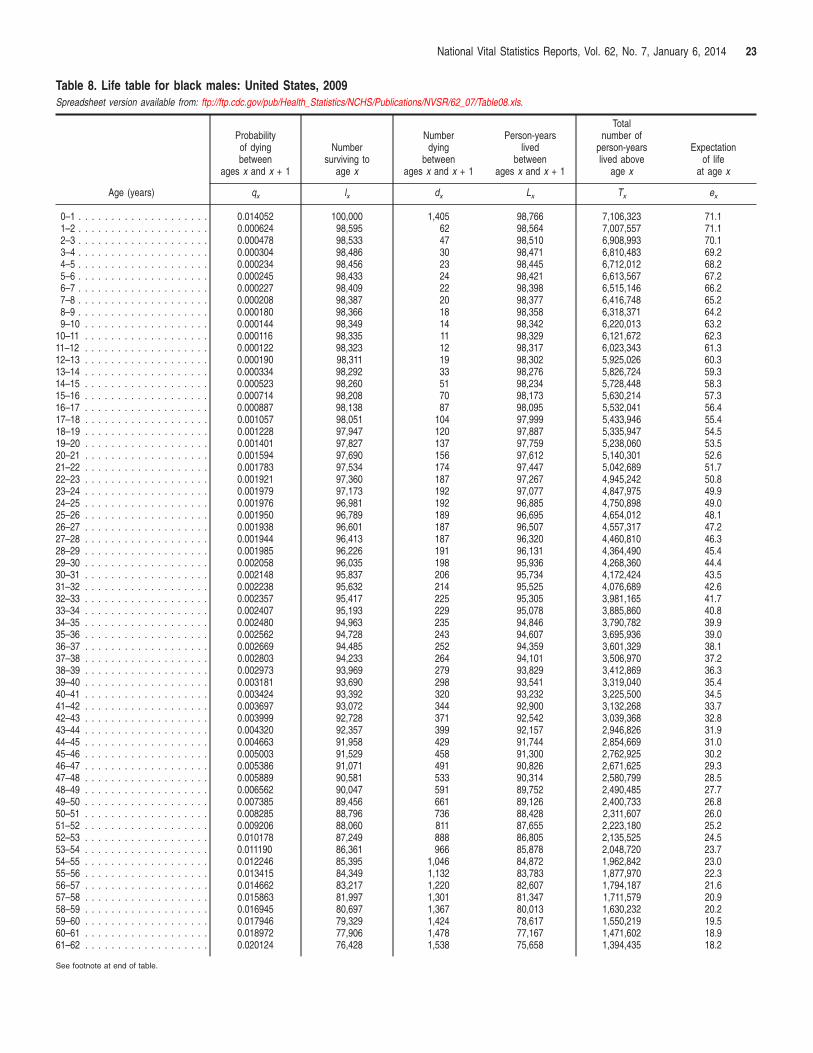
National Vital Statistics Reports, Vol. 62, No. 7, January 6, 2014 23
Table 8. Life table for black males: United States, 2009 Spreadsheet version available from: ftp://ftp.cdc.gov/pub/Health_Statistics/NCHS/Publications/NVSR/62_07/Table08.xls.
Age (years)
Probability of dying between
ages x and x + 1
Number surviving to
age x
Number dying
between ages x and x + 1
Person-years lived
between ages x and x + 1
Total number of
person-years lived above
age x
Expectation of life
at age x
qx lx dx Lx Tx ex
0–1 . . . . . . . . . . . . . . . . . . . . 0.014052 100,000 1,405 98,766 7,106,323 71.1 1–2 . . . . . . . . . . . . . . . . . . . . 0.000624 98,595 62 98,564 7,007,557 71.1 2–3 . . . . . . . . . . . . . . . . . . . . 0.000478 98,533 47 98,510 6,908,993 70.1 3–4 . . . . . . . . . . . . . . . . . . . . 0.000304 98,486 30 98,471 6,810,483 69.2 4–5 . . . . . . . . . . . . . . . . . . . . 0.000234 98,456 23 98,445 6,712,012 68.2 5–6 . . . . . . . . . . . . . . . . . . . . 0.000245 98,433 24 98,421 6,613,567 67.2 6–7 . . . . . . . . . . . . . . . . . . . . 0.000227 98,409 22 98,398 6,515,146 66.2 7–8 . . . . . . . . . . . . . . . . . . . . 0.000208 98,387 20 98,377 6,416,748 65.2 8–9 . . . . . . . . . . . . . . . . . . . . 0.000180 98,366 18 98,358 6,318,371 64.2 9–10 . . . . . . . . . . . . . . . . . . . 0.000144 98,349 14 98,342 6,220,013 63.2
10–11 . . . . . . . . . . . . . . . . . . . 0.000116 98,335 11 98,329 6,121,672 62.3 11–12 . . . . . . . . . . . . . . . . . . . 0.000122 98,323 12 98,317 6,023,343 61.3 12–13 . . . . . . . . . . . . . . . . . . . 0.000190 98,311 19 98,302 5,925,026 60.3 13–14 . . . . . . . . . . . . . . . . . . . 0.000334 98,292 33 98,276 5,826,724 59.3 14–15 . . . . . . . . . . . . . . . . . . . 0.000523 98,260 51 98,234 5,728,448 58.3 15–16 . . . . . . . . . . . . . . . . . . . 0.000714 98,208 70 98,173 5,630,214 57.3 16–17 . . . . . . . . . . . . . . . . . . . 0.000887 98,138 87 98,095 5,532,041 56.4 17–18 . . . . . . . . . . . . . . . . . . . 0.001057 98,051 104 97,999 5,433,946 55.4 18–19 . . . . . . . . . . . . . . . . . . . 0.001228 97,947 120 97,887 5,335,947 54.5 19–20 . . . . . . . . . . . . . . . . . . . 0.001401 97,827 137 97,759 5,238,060 53.5 20–21 . . . . . . . . . . . . . . . . . . . 0.001594 97,690 156 97,612 5,140,301 52.6 21–22 . . . . . . . . . . . . . . . . . . . 0.001783 97,534 174 97,447 5,042,689 51.7 22–23 . . . . . . . . . . . . . . . . . . . 0.001921 97,360 187 97,267 4,945,242 50.8 23–24 . . . . . . . . . . . . . . . . . . . 0.001979 97,173 192 97,077 4,847,975 49.9 24–25 . . . . . . . . . . . . . . . . . . . 0.001976 96,981 192 96,885 4,750,898 49.0 25–26 . . . . . . . . . . . . . . . . . . . 0.001950 96,789 189 96,695 4,654,012 48.1 26–27 . . . . . . . . . . . . . . . . . . . 0.001938 96,601 187 96,507 4,557,317 47.2 27–28 . . . . . . . . . . . . . . . . . . . 0.001944 96,413 187 96,320 4,460,810 46.3 28–29 . . . . . . . . . . . . . . . . . . . 0.001985 96,226 191 96,131 4,364,490 45.4 29–30 . . . . . . . . . . . . . . . . . . . 0.002058 96,035 198 95,936 4,268,360 44.4 30–31 . . . . . . . . . . . . . . . . . . . 0.002148 95,837 206 95,734 4,172,424 43.5 31–32 . . . . . . . . . . . . . . . . . . . 0.002238 95,632 214 95,525 4,076,689 42.6 32–33 . . . . . . . . . . . . . . . . . . . 0.002357 95,417 225 95,305 3,981,165 41.7 33–34 . . . . . . . . . . . . . . . . . . . 0.002407 95,193 229 95,078 3,885,860 40.8 34–35 . . . . . . . . . . . . . . . . . . . 0.002480 94,963 235 94,846 3,790,782 39.9 35–36 . . . . . . . . . . . . . . . . . . . 0.002562 94,728 243 94,607 3,695,936 39.0 36–37 . . . . . . . . . . . . . . . . . . . 0.002669 94,485 252 94,359 3,601,329 38.1 37–38 . . . . . . . . . . . . . . . . . . . 0.002803 94,233 264 94,101 3,506,970 37.2 38–39 . . . . . . . . . . . . . . . . . . . 0.002973 93,969 279 93,829 3,412,869 36.3 39–40 . . . . . . . . . . . . . . . . . . . 0.003181 93,690 298 93,541 3,319,040 35.4 40–41 . . . . . . . . . . . . . . . . . . . 0.003424 93,392 320 93,232 3,225,500 34.5 41–42 . . . . . . . . . . . . . . . . . . . 0.003697 93,072 344 92,900 3,132,268 33.7 42–43 . . . . . . . . . . . . . . . . . . . 0.003999 92,728 371 92,542 3,039,368 32.8 43–44 . . . . . . . . . . . . . . . . . . . 0.004320 92,357 399 92,157 2,946,826 31.9 44–45 . . . . . . . . . . . . . . . . . . . 0.004663 91,958 429 91,744 2,854,669 31.0 45–46 . . . . . . . . . . . . . . . . . . . 0.005003 91,529 458 91,300 2,762,925 30.2 46–47 . . . . . . . . . . . . . . . . . . . 0.005386 91,071 491 90,826 2,671,625 29.3 47–48 . . . . . . . . . . . . . . . . . . . 0.005889 90,581 533 90,314 2,580,799 28.5 48–49 . . . . . . . . . . . . . . . . . . . 0.006562 90,047 591 89,752 2,490,485 27.7 49–50 . . . . . . . . . . . . . . . . . . . 0.007385 89,456 661 89,126 2,400,733 26.8 50–51 . . . . . . . . . . . . . . . . . . . 0.008285 88,796 736 88,428 2,311,607 26.0 51–52 . . . . . . . . . . . . . . . . . . . 0.009206 88,060 811 87,655 2,223,180 25.2 52–53 . . . . . . . . . . . . . . . . . . . 0.010178 87,249 888 86,805 2,135,525 24.5 53–54 . . . . . . . . . . . . . . . . . . . 0.011190 86,361 966 85,878 2,048,720 23.7 54–55 . . . . . . . . . . . . . . . . . . . 0.012246 85,395 1,046 84,872 1,962,842 23.0 55–56 . . . . . . . . . . . . . . . . . . . 0.013415 84,349 1,132 83,783 1,877,970 22.3 56–57 . . . . . . . . . . . . . . . . . . . 0.014662 83,217 1,220 82,607 1,794,187 21.6 57–58 . . . . . . . . . . . . . . . . . . . 0.015863 81,997 1,301 81,347 1,711,579 20.9 58–59 . . . . . . . . . . . . . . . . . . . 0.016945 80,697 1,367 80,013 1,630,232 20.2 59–60 . . . . . . . . . . . . . . . . . . . 0.017946 79,329 1,424 78,617 1,550,219 19.5 60–61 . . . . . . . . . . . . . . . . . . . 0.018972 77,906 1,478 77,167 1,471,602 18.9 61–62 . . . . . . . . . . . . . . . . . . . 0.020124 76,428 1,538 75,658 1,394,435 18.2
See footnote at end of table.
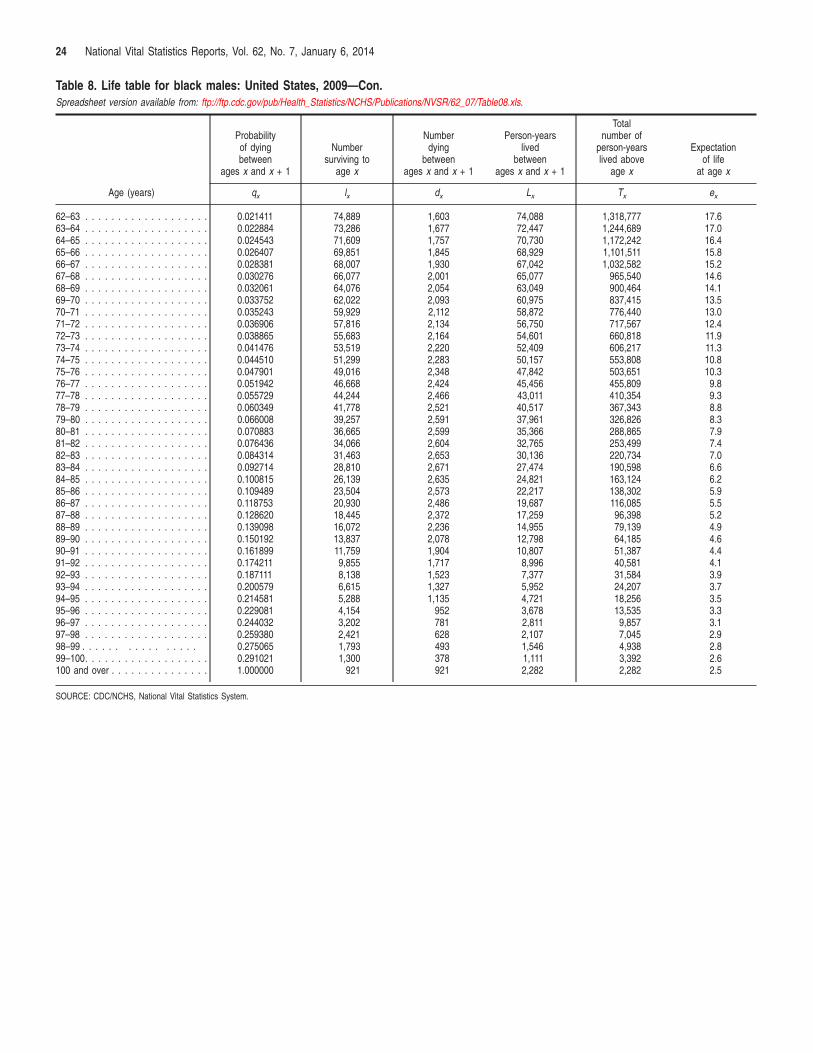
24 National Vital Statistics Reports, Vol. 62, No. 7, January 6, 2014
Table 8. Life table for black males: United States, 2009—Con. Spreadsheet version available from: ftp://ftp.cdc.gov/pub/Health_Statistics/NCHS/Publications/NVSR/62_07/Table08.xls.
Age (years)
Probability of dying between
ages x and x + 1
Number surviving to
age x
Number dying
between ages x and x + 1
Person-years lived
between ages x and x + 1
Total number of
person-years lived above
age x
Expectation of life
at age x
qx lx dx Lx Tx ex
62–63 . . . . . . . . . . . . . . . . . . . 0.021411 74,889 1,603 74,088 1,318,777 17.6 63–64 . . . . . . . . . . . . . . . . . . . 0.022884 73,286 1,677 72,447 1,244,689 17.0 64–65 . . . . . . . . . . . . . . . . . . . 0.024543 71,609 1,757 70,730 1,172,242 16.4 65–66 . . . . . . . . . . . . . . . . . . . 0.026407 69,851 1,845 68,929 1,101,511 15.8 66–67 . . . . . . . . . . . . . . . . . . . 0.028381 68,007 1,930 67,042 1,032,582 15.2 67–68 . . . . . . . . . . . . . . . . . . . 0.030276 66,077 2,001 65,077 965,540 14.6 68–69 . . . . . . . . . . . . . . . . . . . 0.032061 64,076 2,054 63,049 900,464 14.1 69–70 . . . . . . . . . . . . . . . . . . . 0.033752 62,022 2,093 60,975 837,415 13.5 70–71 . . . . . . . . . . . . . . . . . . . 0.035243 59,929 2,112 58,872 776,440 13.0 71–72 . . . . . . . . . . . . . . . . . . . 0.036906 57,816 2,134 56,750 717,567 12.4 72–73 . . . . . . . . . . . . . . . . . . . 0.038865 55,683 2,164 54,601 660,818 11.9 73–74 . . . . . . . . . . . . . . . . . . . 0.041476 53,519 2,220 52,409 606,217 11.3 74–75 . . . . . . . . . . . . . . . . . . . 0.044510 51,299 2,283 50,157 553,808 10.8 75–76 . . . . . . . . . . . . . . . . . . . 0.047901 49,016 2,348 47,842 503,651 10.3 76–77 . . . . . . . . . . . . . . . . . . . 0.051942 46,668 2,424 45,456 455,809 9.8 77–78 . . . . . . . . . . . . . . . . . . . 0.055729 44,244 2,466 43,011 410,354 9.3 78–79 . . . . . . . . . . . . . . . . . . . 0.060349 41,778 2,521 40,517 367,343 8.8 79–80 . . . . . . . . . . . . . . . . . . . 0.066008 39,257 2,591 37,961 326,826 8.3 80–81 . . . . . . . . . . . . . . . . . . . 0.070883 36,665 2,599 35,366 288,865 7.9 81–82 . . . . . . . . . . . . . . . . . . . 0.076436 34,066 2,604 32,765 253,499 7.4 82–83 . . . . . . . . . . . . . . . . . . . 0.084314 31,463 2,653 30,136 220,734 7.0 83–84 . . . . . . . . . . . . . . . . . . . 0.092714 28,810 2,671 27,474 190,598 6.6 84–85 . . . . . . . . . . . . . . . . . . . 0.100815 26,139 2,635 24,821 163,124 6.2 85–86 . . . . . . . . . . . . . . . . . . . 0.109489 23,504 2,573 22,217 138,302 5.9 86–87 . . . . . . . . . . . . . . . . . . . 0.118753 20,930 2,486 19,687 116,085 5.5 87–88 . . . . . . . . . . . . . . . . . . . 0.128620 18,445 2,372 17,259 96,398 5.2 88–89 . . . . . . . . . . . . . . . . . . . 0.139098 16,072 2,236 14,955 79,139 4.9 89–90 . . . . . . . . . . . . . . . . . . . 0.150192 13,837 2,078 12,798 64,185 4.6 90–91 . . . . . . . . . . . . . . . . . . . 0.161899 11,759 1,904 10,807 51,387 4.4 91–92 . . . . . . . . . . . . . . . . . . . 0.174211 9,855 1,717 8,996 40,581 4.1 92–93 . . . . . . . . . . . . . . . . . . . 0.187111 8,138 1,523 7,377 31,584 3.9 93–94 . . . . . . . . . . . . . . . . . . . 0.200579 6,615 1,327 5,952 24,207 3.7 94–95 . . . . . . . . . . . . . . . . . . . 0.214581 5,288 1,135 4,721 18,256 3.5 95–96 . . . . . . . . . . . . . . . . . . . 0.229081 4,154 952 3,678 13,535 3.3 96–97 . . . . . . . . . . . . . . . . . . . 0.244032 3,202 781 2,811 9,857 3.1 97–98 . . . . . . . . . . . . . . . . . . . 0.259380 2,421 628 2,107 7,045 2.9 98–99 . . . . . . . . . . . . . . . . 0.275065 1,793 493 1,546 4,938 2.8 99–100. . . . . . . . . . . . . . . . . . . 0.291021 1,300 378 1,111 3,392 2.6 100 and over . . . . . . . . . . . . . . . 1.000000 921 921 2,282 2,282 2.5
SOURCE: CDC/NCHS, National Vital Statistics System.
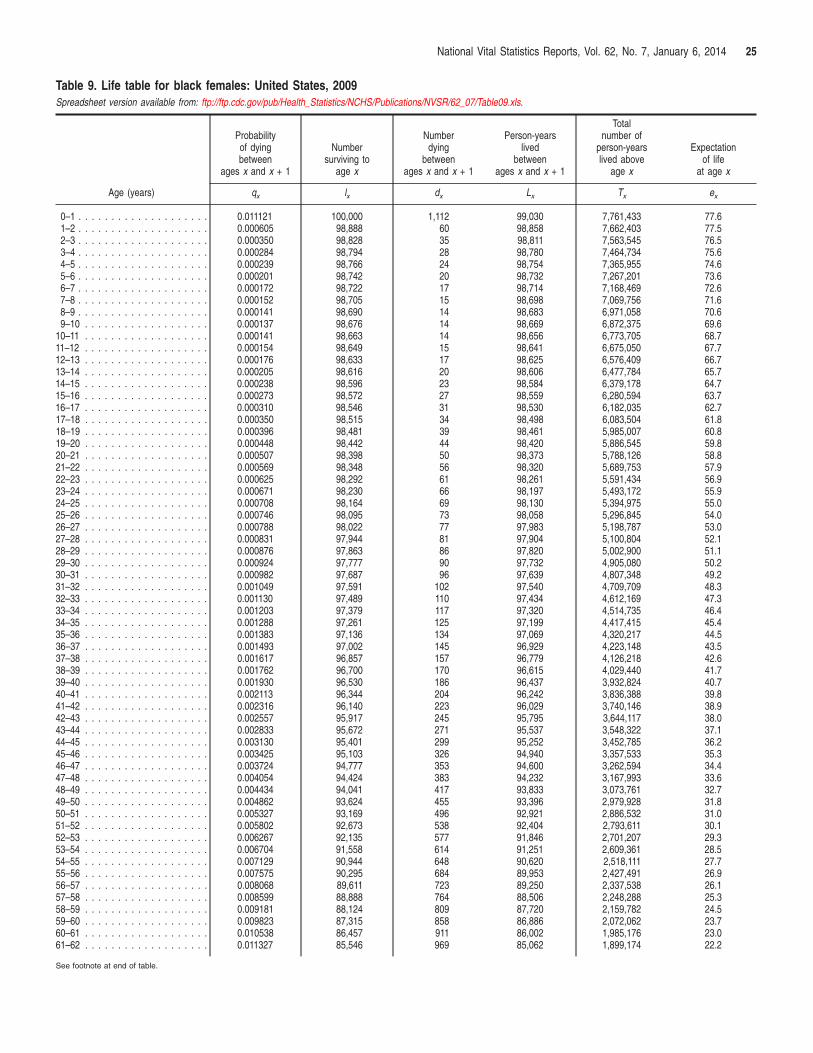
National Vital Statistics Reports, Vol. 62, No. 7, January 6, 2014 25
Table 9. Life table for black females: United States, 2009 Spreadsheet version available from: ftp://ftp.cdc.gov/pub/Health_Statistics/NCHS/Publications/NVSR/62_07/Table09.xls.
Age (years)
Probability of dying between
ages x and x + 1
Number surviving to
age x
Number dying
between ages x and x + 1
Person-years lived
between ages x and x + 1
Total number of
person-years lived above
age x
Expectation of life
at age x
qx lx dx Lx Tx ex
0–1 . . . . . . . . . . . . . . . . . . . . 0.011121 100,000 1,112 99,030 7,761,433 77.6 1–2 . . . . . . . . . . . . . . . . . . . . 0.000605 98,888 60 98,858 7,662,403 77.5 2–3 . . . . . . . . . . . . . . . . . . . . 0.000350 98,828 35 98,811 7,563,545 76.5 3–4 . . . . . . . . . . . . . . . . . . . . 0.000284 98,794 28 98,780 7,464,734 75.6 4–5 . . . . . . . . . . . . . . . . . . . . 0.000239 98,766 24 98,754 7,365,955 74.6 5–6 . . . . . . . . . . . . . . . . . . . . 0.000201 98,742 20 98,732 7,267,201 73.6 6–7 . . . . . . . . . . . . . . . . . . . . 0.000172 98,722 17 98,714 7,168,469 72.6 7–8 . . . . . . . . . . . . . . . . . . . . 0.000152 98,705 15 98,698 7,069,756 71.6 8–9 . . . . . . . . . . . . . . . . . . . . 0.000141 98,690 14 98,683 6,971,058 70.6 9–10 . . . . . . . . . . . . . . . . . . . 0.000137 98,676 14 98,669 6,872,375 69.6
10–11 . . . . . . . . . . . . . . . . . . . 0.000141 98,663 14 98,656 6,773,705 68.7 11–12 . . . . . . . . . . . . . . . . . . . 0.000154 98,649 15 98,641 6,675,050 67.7 12–13 . . . . . . . . . . . . . . . . . . . 0.000176 98,633 17 98,625 6,576,409 66.7 13–14 . . . . . . . . . . . . . . . . . . . 0.000205 98,616 20 98,606 6,477,784 65.7 14–15 . . . . . . . . . . . . . . . . . . . 0.000238 98,596 23 98,584 6,379,178 64.7 15–16 . . . . . . . . . . . . . . . . . . . 0.000273 98,572 27 98,559 6,280,594 63.7 16–17 . . . . . . . . . . . . . . . . . . . 0.000310 98,546 31 98,530 6,182,035 62.7 17–18 . . . . . . . . . . . . . . . . . . . 0.000350 98,515 34 98,498 6,083,504 61.8 18–19 . . . . . . . . . . . . . . . . . . . 0.000396 98,481 39 98,461 5,985,007 60.8 19–20 . . . . . . . . . . . . . . . . . . . 0.000448 98,442 44 98,420 5,886,545 59.8 20–21 . . . . . . . . . . . . . . . . . . . 0.000507 98,398 50 98,373 5,788,126 58.8 21–22 . . . . . . . . . . . . . . . . . . . 0.000569 98,348 56 98,320 5,689,753 57.9 22–23 . . . . . . . . . . . . . . . . . . . 0.000625 98,292 61 98,261 5,591,434 56.9 23–24 . . . . . . . . . . . . . . . . . . . 0.000671 98,230 66 98,197 5,493,172 55.9 24–25 . . . . . . . . . . . . . . . . . . . 0.000708 98,164 69 98,130 5,394,975 55.0 25–26 . . . . . . . . . . . . . . . . . . . 0.000746 98,095 73 98,058 5,296,845 54.0 26–27 . . . . . . . . . . . . . . . . . . . 0.000788 98,022 77 97,983 5,198,787 53.0 27–28 . . . . . . . . . . . . . . . . . . . 0.000831 97,944 81 97,904 5,100,804 52.1 28–29 . . . . . . . . . . . . . . . . . . . 0.000876 97,863 86 97,820 5,002,900 51.1 29–30 . . . . . . . . . . . . . . . . . . . 0.000924 97,777 90 97,732 4,905,080 50.2 30–31 . . . . . . . . . . . . . . . . . . . 0.000982 97,687 96 97,639 4,807,348 49.2 31–32 . . . . . . . . . . . . . . . . . . . 0.001049 97,591 102 97,540 4,709,709 48.3 32–33 . . . . . . . . . . . . . . . . . . . 0.001130 97,489 110 97,434 4,612,169 47.3 33–34 . . . . . . . . . . . . . . . . . . . 0.001203 97,379 117 97,320 4,514,735 46.4 34–35 . . . . . . . . . . . . . . . . . . . 0.001288 97,261 125 97,199 4,417,415 45.4 35–36 . . . . . . . . . . . . . . . . . . . 0.001383 97,136 134 97,069 4,320,217 44.5 36–37 . . . . . . . . . . . . . . . . . . . 0.001493 97,002 145 96,929 4,223,148 43.5 37–38 . . . . . . . . . . . . . . . . . . . 0.001617 96,857 157 96,779 4,126,218 42.6 38–39 . . . . . . . . . . . . . . . . . . . 0.001762 96,700 170 96,615 4,029,440 41.7 39–40 . . . . . . . . . . . . . . . . . . . 0.001930 96,530 186 96,437 3,932,824 40.7 40–41 . . . . . . . . . . . . . . . . . . . 0.002113 96,344 204 96,242 3,836,388 39.8 41–42 . . . . . . . . . . . . . . . . . . . 0.002316 96,140 223 96,029 3,740,146 38.9 42–43 . . . . . . . . . . . . . . . . . . . 0.002557 95,917 245 95,795 3,644,117 38.0 43–44 . . . . . . . . . . . . . . . . . . . 0.002833 95,672 271 95,537 3,548,322 37.1 44–45 . . . . . . . . . . . . . . . . . . . 0.003130 95,401 299 95,252 3,452,785 36.2 45–46 . . . . . . . . . . . . . . . . . . . 0.003425 95,103 326 94,940 3,357,533 35.3 46–47 . . . . . . . . . . . . . . . . . . . 0.003724 94,777 353 94,600 3,262,594 34.4 47–48 . . . . . . . . . . . . . . . . . . . 0.004054 94,424 383 94,232 3,167,993 33.6 48–49 . . . . . . . . . . . . . . . . . . . 0.004434 94,041 417 93,833 3,073,761 32.7 49–50 . . . . . . . . . . . . . . . . . . . 0.004862 93,624 455 93,396 2,979,928 31.8 50–51 . . . . . . . . . . . . . . . . . . . 0.005327 93,169 496 92,921 2,886,532 31.0 51–52 . . . . . . . . . . . . . . . . . . . 0.005802 92,673 538 92,404 2,793,611 30.1 52–53 . . . . . . . . . . . . . . . . . . . 0.006267 92,135 577 91,846 2,701,207 29.3 53–54 . . . . . . . . . . . . . . . . . . . 0.006704 91,558 614 91,251 2,609,361 28.5 54–55 . . . . . . . . . . . . . . . . . . . 0.007129 90,944 648 90,620 2,518,111 27.7 55–56 . . . . . . . . . . . . . . . . . . . 0.007575 90,295 684 89,953 2,427,491 26.9 56–57 . . . . . . . . . . . . . . . . . . . 0.008068 89,611 723 89,250 2,337,538 26.1 57–58 . . . . . . . . . . . . . . . . . . . 0.008599 88,888 764 88,506 2,248,288 25.3 58–59 . . . . . . . . . . . . . . . . . . . 0.009181 88,124 809 87,720 2,159,782 24.5 59–60 . . . . . . . . . . . . . . . . . . . 0.009823 87,315 858 86,886 2,072,062 23.7 60–61 . . . . . . . . . . . . . . . . . . . 0.010538 86,457 911 86,002 1,985,176 23.0 61–62 . . . . . . . . . . . . . . . . . . . 0.011327 85,546 969 85,062 1,899,174 22.2
See footnote at end of table.
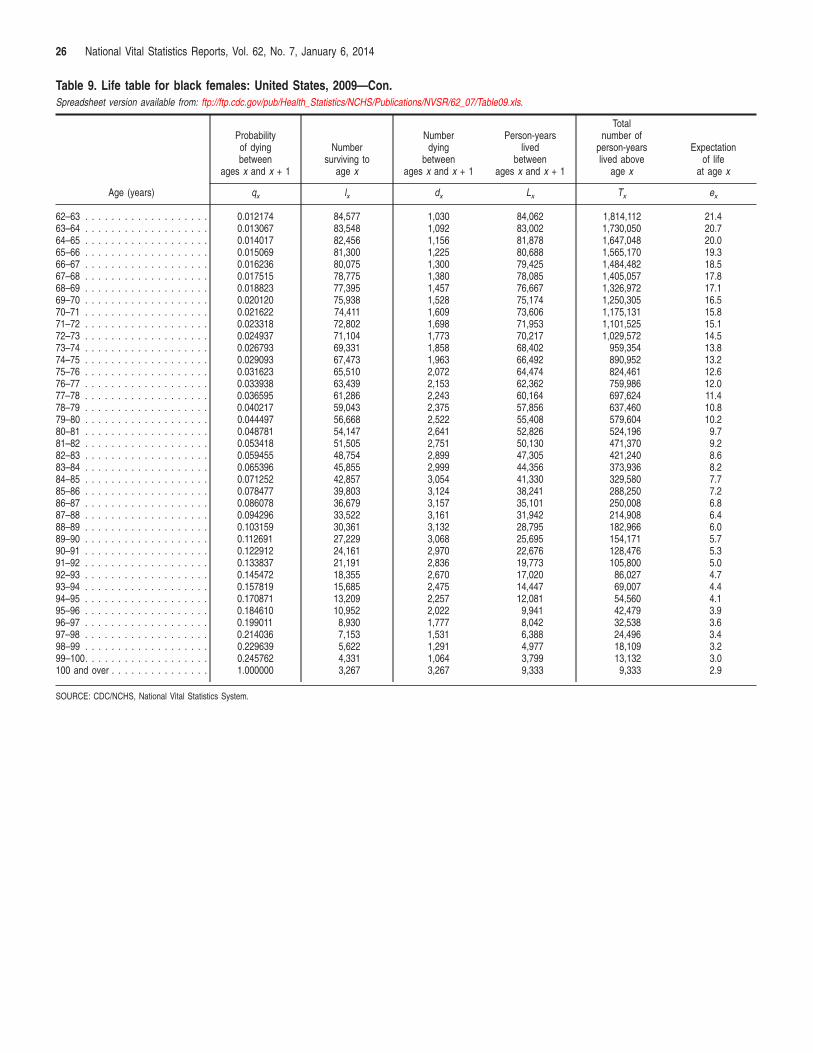
26 National Vital Statistics Reports, Vol. 62, No. 7, January 6, 2014
Table 9. Life table for black females: United States, 2009—Con. Spreadsheet version available from: ftp://ftp.cdc.gov/pub/Health_Statistics/NCHS/Publications/NVSR/62_07/Table09.xls.
Age (years)
Probability of dying between
ages x and x + 1
Number surviving to
age x
Number dying
between ages x and x + 1
Person-years lived
between ages x and x + 1
Total number of
person-years lived above
age x
Expectation of life
at age x
qx lx dx Lx Tx ex
62–63 . . . . . . . . . . . . . . . . . . . 0.012174 84,577 1,030 84,062 1,814,112 21.4 63–64 . . . . . . . . . . . . . . . . . . . 0.013067 83,548 1,092 83,002 1,730,050 20.7 64–65 . . . . . . . . . . . . . . . . . . . 0.014017 82,456 1,156 81,878 1,647,048 20.0 65–66 . . . . . . . . . . . . . . . . . . . 0.015069 81,300 1,225 80,688 1,565,170 19.3 66–67 . . . . . . . . . . . . . . . . . . . 0.016236 80,075 1,300 79,425 1,484,482 18.5 67–68 . . . . . . . . . . . . . . . . . . . 0.017515 78,775 1,380 78,085 1,405,057 17.8 68–69 . . . . . . . . . . . . . . . . . . . 0.018823 77,395 1,457 76,667 1,326,972 17.1 69–70 . . . . . . . . . . . . . . . . . . . 0.020120 75,938 1,528 75,174 1,250,305 16.5 70–71 . . . . . . . . . . . . . . . . . . . 0.021622 74,411 1,609 73,606 1,175,131 15.8 71–72 . . . . . . . . . . . . . . . . . . . 0.023318 72,802 1,698 71,953 1,101,525 15.1 72–73 . . . . . . . . . . . . . . . . . . . 0.024937 71,104 1,773 70,217 1,029,572 14.5 73–74 . . . . . . . . . . . . . . . . . . . 0.026793 69,331 1,858 68,402 959,354 13.8 74–75 . . . . . . . . . . . . . . . . . . . 0.029093 67,473 1,963 66,492 890,952 13.2 75–76 . . . . . . . . . . . . . . . . . . . 0.031623 65,510 2,072 64,474 824,461 12.6 76–77 . . . . . . . . . . . . . . . . . . . 0.033938 63,439 2,153 62,362 759,986 12.0 77–78 . . . . . . . . . . . . . . . . . . . 0.036595 61,286 2,243 60,164 697,624 11.4 78–79 . . . . . . . . . . . . . . . . . . . 0.040217 59,043 2,375 57,856 637,460 10.8 79–80 . . . . . . . . . . . . . . . . . . . 0.044497 56,668 2,522 55,408 579,604 10.2 80–81 . . . . . . . . . . . . . . . . . . . 0.048781 54,147 2,641 52,826 524,196 9.7 81–82 . . . . . . . . . . . . . . . . . . . 0.053418 51,505 2,751 50,130 471,370 9.2 82–83 . . . . . . . . . . . . . . . . . . . 0.059455 48,754 2,899 47,305 421,240 8.6 83–84 . . . . . . . . . . . . . . . . . . . 0.065396 45,855 2,999 44,356 373,936 8.2 84–85 . . . . . . . . . . . . . . . . . . . 0.071252 42,857 3,054 41,330 329,580 7.7 85–86 . . . . . . . . . . . . . . . . . . . 0.078477 39,803 3,124 38,241 288,250 7.2 86–87 . . . . . . . . . . . . . . . . . . . 0.086078 36,679 3,157 35,101 250,008 6.8 87–88 . . . . . . . . . . . . . . . . . . . 0.094296 33,522 3,161 31,942 214,908 6.4 88–89 . . . . . . . . . . . . . . . . . . . 0.103159 30,361 3,132 28,795 182,966 6.0 89–90 . . . . . . . . . . . . . . . . . . . 0.112691 27,229 3,068 25,695 154,171 5.7 90–91 . . . . . . . . . . . . . . . . . . . 0.122912 24,161 2,970 22,676 128,476 5.3 91–92 . . . . . . . . . . . . . . . . . . . 0.133837 21,191 2,836 19,773 105,800 5.0 92–93 . . . . . . . . . . . . . . . . . . . 0.145472 18,355 2,670 17,020 86,027 4.7 93–94 . . . . . . . . . . . . . . . . . . . 0.157819 15,685 2,475 14,447 69,007 4.4 94–95 . . . . . . . . . . . . . . . . . . . 0.170871 13,209 2,257 12,081 54,560 4.1 95–96 . . . . . . . . . . . . . . . . . . . 0.184610 10,952 2,022 9,941 42,479 3.9 96–97 . . . . . . . . . . . . . . . . . . . 0.199011 8,930 1,777 8,042 32,538 3.6 97–98 . . . . . . . . . . . . . . . . . . . 0.214036 7,153 1,531 6,388 24,496 3.4 98–99 . . . . . . . . . . . . . . . . . . . 0.229639 5,622 1,291 4,977 18,109 3.2 99–100. . . . . . . . . . . . . . . . . . . 0.245762 4,331 1,064 3,799 13,132 3.0 100 and over . . . . . . . . . . . . . . . 1.000000 3,267 3,267 9,333 9,333 2.9
SOURCE: CDC/NCHS, National Vital Statistics System.

National Vital Statistics Reports, Vol. 62, No. 7, January 6, 2014 27
Table 10. Life table for the Hispanic population: United States, 2009 Spreadsheet version available from: ftp://ftp.cdc.gov/pub/Health_Statistics/NCHS/Publications/NVSR/62_07/Table10.xls.
Age (years)
Probability of dying between
ages x and x + 1
Number surviving to
age x
Number dying
between ages x and x + 1
Person-years lived
between ages x and x + 1
Total number of
person-years lived above
age x
Expectation of life
at age x
qx lx dx Lx Tx ex
0–1 . . . . . . . . . . . . . . . . . . . . 0.005261 100,000 526 99,541 8,121,408 81.2 1–2 . . . . . . . . . . . . . . . . . . . . 0.000359 99,474 36 99,456 8,021,867 80.6 2–3 . . . . . . . . . . . . . . . . . . . . 0.000254 99,438 25 99,426 7,922,411 79.7 3–4 . . . . . . . . . . . . . . . . . . . . 0.000178 99,413 18 99,404 7,822,986 78.7 4–5 . . . . . . . . . . . . . . . . . . . . 0.000129 99,395 13 99,389 7,723,582 77.7 5–6 . . . . . . . . . . . . . . . . . . . . 0.000136 99,382 13 99,376 7,624,193 76.7 6–7 . . . . . . . . . . . . . . . . . . . . 0.000124 99,369 12 99,363 7,524,817 75.7 7–8 . . . . . . . . . . . . . . . . . . . . 0.000114 99,357 11 99,351 7,425,454 74.7 8–9 . . . . . . . . . . . . . . . . . . . . 0.000105 99,345 10 99,340 7,326,103 73.7 9–10 . . . . . . . . . . . . . . . . . . . 0.000095 99,335 9 99,330 7,226,763 72.8
10–11 . . . . . . . . . . . . . . . . . . . 0.000090 99,325 9 99,321 7,127,433 71.8 11–12 . . . . . . . . . . . . . . . . . . . 0.000097 99,316 10 99,312 7,028,112 70.8 12–13 . . . . . . . . . . . . . . . . . . . 0.000128 99,307 13 99,300 6,928,800 69.8 13–14 . . . . . . . . . . . . . . . . . . . 0.000188 99,294 19 99,285 6,829,500 68.8 14–15 . . . . . . . . . . . . . . . . . . . 0.000267 99,276 26 99,262 6,730,215 67.8 15–16 . . . . . . . . . . . . . . . . . . . 0.000352 99,249 35 99,232 6,630,953 66.8 16–17 . . . . . . . . . . . . . . . . . . . 0.000433 99,214 43 99,193 6,531,721 65.8 17–18 . . . . . . . . . . . . . . . . . . . 0.000507 99,171 50 99,146 6,432,529 64.9 18–19 . . . . . . . . . . . . . . . . . . . 0.000574 99,121 57 99,092 6,333,383 63.9 19–20 . . . . . . . . . . . . . . . . . . . 0.000633 99,064 63 99,033 6,234,290 62.9 20–21 . . . . . . . . . . . . . . . . . . . 0.000695 99,001 69 98,967 6,135,258 62.0 21–22 . . . . . . . . . . . . . . . . . . . 0.000754 98,932 75 98,895 6,036,291 61.0 22–23 . . . . . . . . . . . . . . . . . . . 0.000794 98,858 79 98,819 5,937,396 60.1 23–24 . . . . . . . . . . . . . . . . . . . 0.000807 98,779 80 98,739 5,838,577 59.1 24–25 . . . . . . . . . . . . . . . . . . . 0.000799 98,700 79 98,660 5,739,838 58.2 25–26 . . . . . . . . . . . . . . . . . . . 0.000786 98,621 78 98,582 5,641,178 57.2 26–27 . . . . . . . . . . . . . . . . . . . 0.000776 98,543 77 98,505 5,542,596 56.2 27–28 . . . . . . . . . . . . . . . . . . . 0.000769 98,467 76 98,429 5,444,091 55.3 28–29 . . . . . . . . . . . . . . . . . . . 0.000767 98,391 75 98,353 5,345,662 54.3 29–30 . . . . . . . . . . . . . . . . . . . 0.000770 98,315 76 98,278 5,247,309 53.4 30–31 . . . . . . . . . . . . . . . . . . . 0.000774 98,240 76 98,202 5,149,031 52.4 31–32 . . . . . . . . . . . . . . . . . . . 0.000781 98,164 77 98,125 5,050,830 51.5 32–33 . . . . . . . . . . . . . . . . . . . 0.000793 98,087 78 98,048 4,952,704 50.5 33–34 . . . . . . . . . . . . . . . . . . . 0.000834 98,009 82 97,968 4,854,656 49.5 34–35 . . . . . . . . . . . . . . . . . . . 0.000881 97,928 86 97,884 4,756,688 48.6 35–36 . . . . . . . . . . . . . . . . . . . 0.000936 97,841 92 97,795 4,658,803 47.6 36–37 . . . . . . . . . . . . . . . . . . . 0.000999 97,750 98 97,701 4,561,008 46.7 37–38 . . . . . . . . . . . . . . . . . . . 0.001069 97,652 104 97,600 4,463,307 45.7 38–39 . . . . . . . . . . . . . . . . . . . 0.001149 97,548 112 97,492 4,365,707 44.8 39–40 . . . . . . . . . . . . . . . . . . . 0.001240 97,436 121 97,375 4,268,216 43.8 40–41 . . . . . . . . . . . . . . . . . . . 0.001340 97,315 130 97,250 4,170,840 42.9 41–42 . . . . . . . . . . . . . . . . . . . 0.001455 97,184 141 97,114 4,073,591 41.9 42–43 . . . . . . . . . . . . . . . . . . . 0.001588 97,043 154 96,966 3,976,477 41.0 43–44 . . . . . . . . . . . . . . . . . . . 0.001741 96,889 169 96,805 3,879,511 40.0 44–45 . . . . . . . . . . . . . . . . . . . 0.001909 96,720 185 96,628 3,782,707 39.1 45–46 . . . . . . . . . . . . . . . . . . . 0.002088 96,536 202 96,435 3,686,079 38.2 46–47 . . . . . . . . . . . . . . . . . . . 0.002277 96,334 219 96,224 3,589,644 37.3 47–48 . . . . . . . . . . . . . . . . . . . 0.002484 96,115 239 95,995 3,493,420 36.3 48–49 . . . . . . . . . . . . . . . . . . . 0.002715 95,876 260 95,746 3,397,425 35.4 49–50 . . . . . . . . . . . . . . . . . . . 0.002974 95,615 284 95,473 3,301,679 34.5 50–51 . . . . . . . . . . . . . . . . . . . 0.003265 95,331 311 95,175 3,206,206 33.6 51–52 . . . . . . . . . . . . . . . . . . . 0.003578 95,020 340 94,850 3,111,030 32.7 52–53 . . . . . . . . . . . . . . . . . . . 0.003893 94,680 369 94,496 3,016,181 31.9 53–54 . . . . . . . . . . . . . . . . . . . 0.004193 94,311 395 94,114 2,921,685 31.0 54–55 . . . . . . . . . . . . . . . . . . . 0.004485 93,916 421 93,705 2,827,571 30.1 55–56 . . . . . . . . . . . . . . . . . . . 0.004794 93,495 448 93,270 2,733,866 29.2 56–57 . . . . . . . . . . . . . . . . . . . 0.005141 93,046 478 92,807 2,640,596 28.4 57–58 . . . . . . . . . . . . . . . . . . . 0.005519 92,568 511 92,313 2,547,789 27.5 58–59 . . . . . . . . . . . . . . . . . . . 0.005933 92,057 546 91,784 2,455,476 26.7 59–60 . . . . . . . . . . . . . . . . . . . 0.006386 91,511 584 91,219 2,363,692 25.8 60–61 . . . . . . . . . . . . . . . . . . . 0.006874 90,927 625 90,614 2,272,473 25.0 61–62 . . . . . . . . . . . . . . . . . . . 0.007408 90,302 669 89,967 2,181,859 24.2
See footnote at end of table.
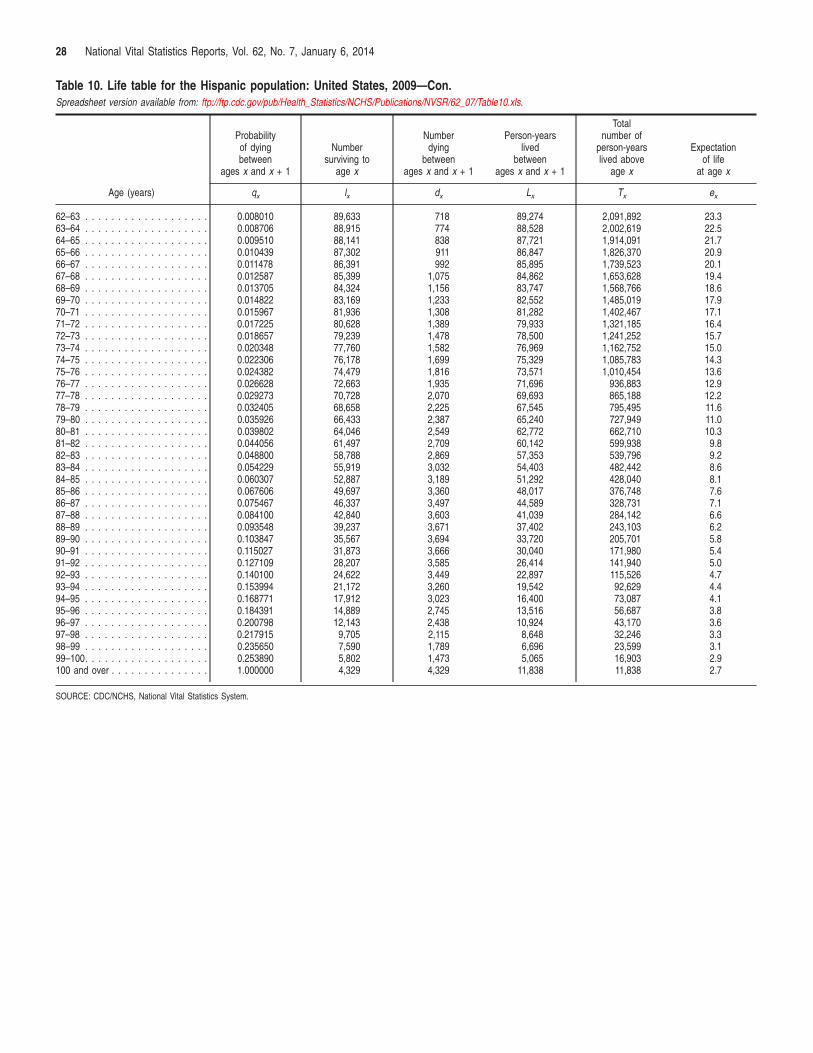
28 National Vital Statistics Reports, Vol. 62, No. 7, January 6, 2014
Table 10. Life table for the Hispanic population: United States, 2009—Con. Spreadsheet version available from: ftp://ftp.cdc.gov/pub/Health_Statistics/NCHS/Publications/NVSR/62_07/Table10.xls.
Age (years)
Probability of dying between
ages x and x + 1
Number surviving to
age x
Number dying
between ages x and x + 1
Person-years lived
between ages x and x + 1
Total number of
person-years lived above
age x
Expectation of life
at age x
qx lx dx Lx Tx ex
62–63 . . . . . . . . . . . . . . . . . . . 0.008010 89,633 718 89,274 2,091,892 23.3 63–64 . . . . . . . . . . . . . . . . . . . 0.008706 88,915 774 88,528 2,002,619 22.5 64–65 . . . . . . . . . . . . . . . . . . . 0.009510 88,141 838 87,721 1,914,091 21.7 65–66 . . . . . . . . . . . . . . . . . . . 0.010439 87,302 911 86,847 1,826,370 20.9 66–67 . . . . . . . . . . . . . . . . . . . 0.011478 86,391 992 85,895 1,739,523 20.1 67–68 . . . . . . . . . . . . . . . . . . . 0.012587 85,399 1,075 84,862 1,653,628 19.4 68–69 . . . . . . . . . . . . . . . . . . . 0.013705 84,324 1,156 83,747 1,568,766 18.6 69–70 . . . . . . . . . . . . . . . . . . . 0.014822 83,169 1,233 82,552 1,485,019 17.9 70–71 . . . . . . . . . . . . . . . . . . . 0.015967 81,936 1,308 81,282 1,402,467 17.1 71–72 . . . . . . . . . . . . . . . . . . . 0.017225 80,628 1,389 79,933 1,321,185 16.4 72–73 . . . . . . . . . . . . . . . . . . . 0.018657 79,239 1,478 78,500 1,241,252 15.7 73–74 . . . . . . . . . . . . . . . . . . . 0.020348 77,760 1,582 76,969 1,162,752 15.0 74–75 . . . . . . . . . . . . . . . . . . . 0.022306 76,178 1,699 75,329 1,085,783 14.3 75–76 . . . . . . . . . . . . . . . . . . . 0.024382 74,479 1,816 73,571 1,010,454 13.6 76–77 . . . . . . . . . . . . . . . . . . . 0.026628 72,663 1,935 71,696 936,883 12.9 77–78 . . . . . . . . . . . . . . . . . . . 0.029273 70,728 2,070 69,693 865,188 12.2 78–79 . . . . . . . . . . . . . . . . . . . 0.032405 68,658 2,225 67,545 795,495 11.6 79–80 . . . . . . . . . . . . . . . . . . . 0.035926 66,433 2,387 65,240 727,949 11.0 80–81 . . . . . . . . . . . . . . . . . . . 0.039802 64,046 2,549 62,772 662,710 10.3 81–82 . . . . . . . . . . . . . . . . . . . 0.044056 61,497 2,709 60,142 599,938 9.8 82–83 . . . . . . . . . . . . . . . . . . . 0.048800 58,788 2,869 57,353 539,796 9.2 83–84 . . . . . . . . . . . . . . . . . . . 0.054229 55,919 3,032 54,403 482,442 8.6 84–85 . . . . . . . . . . . . . . . . . . . 0.060307 52,887 3,189 51,292 428,040 8.1 85–86 . . . . . . . . . . . . . . . . . . . 0.067606 49,697 3,360 48,017 376,748 7.6 86–87 . . . . . . . . . . . . . . . . . . . 0.075467 46,337 3,497 44,589 328,731 7.1 87–88 . . . . . . . . . . . . . . . . . . . 0.084100 42,840 3,603 41,039 284,142 6.6 88–89 . . . . . . . . . . . . . . . . . . . 0.093548 39,237 3,671 37,402 243,103 6.2 89–90 . . . . . . . . . . . . . . . . . . . 0.103847 35,567 3,694 33,720 205,701 5.8 90–91 . . . . . . . . . . . . . . . . . . . 0.115027 31,873 3,666 30,040 171,980 5.4 91–92 . . . . . . . . . . . . . . . . . . . 0.127109 28,207 3,585 26,414 141,940 5.0 92–93 . . . . . . . . . . . . . . . . . . . 0.140100 24,622 3,449 22,897 115,526 4.7 93–94 . . . . . . . . . . . . . . . . . . . 0.153994 21,172 3,260 19,542 92,629 4.4 94–95 . . . . . . . . . . . . . . . . . . . 0.168771 17,912 3,023 16,400 73,087 4.1 95–96 . . . . . . . . . . . . . . . . . . . 0.184391 14,889 2,745 13,516 56,687 3.8 96–97 . . . . . . . . . . . . . . . . . . . 0.200798 12,143 2,438 10,924 43,170 3.6 97–98 . . . . . . . . . . . . . . . . . . . 0.217915 9,705 2,115 8,648 32,246 3.3 98–99 . . . . . . . . . . . . . . . . . . . 0.235650 7,590 1,789 6,696 23,599 3.1 99–100. . . . . . . . . . . . . . . . . . . 0.253890 5,802 1,473 5,065 16,903 2.9 100 and over . . . . . . . . . . . . . . . 1.000000 4,329 4,329 11,838 11,838 2.7
SOURCE: CDC/NCHS, National Vital Statistics System.
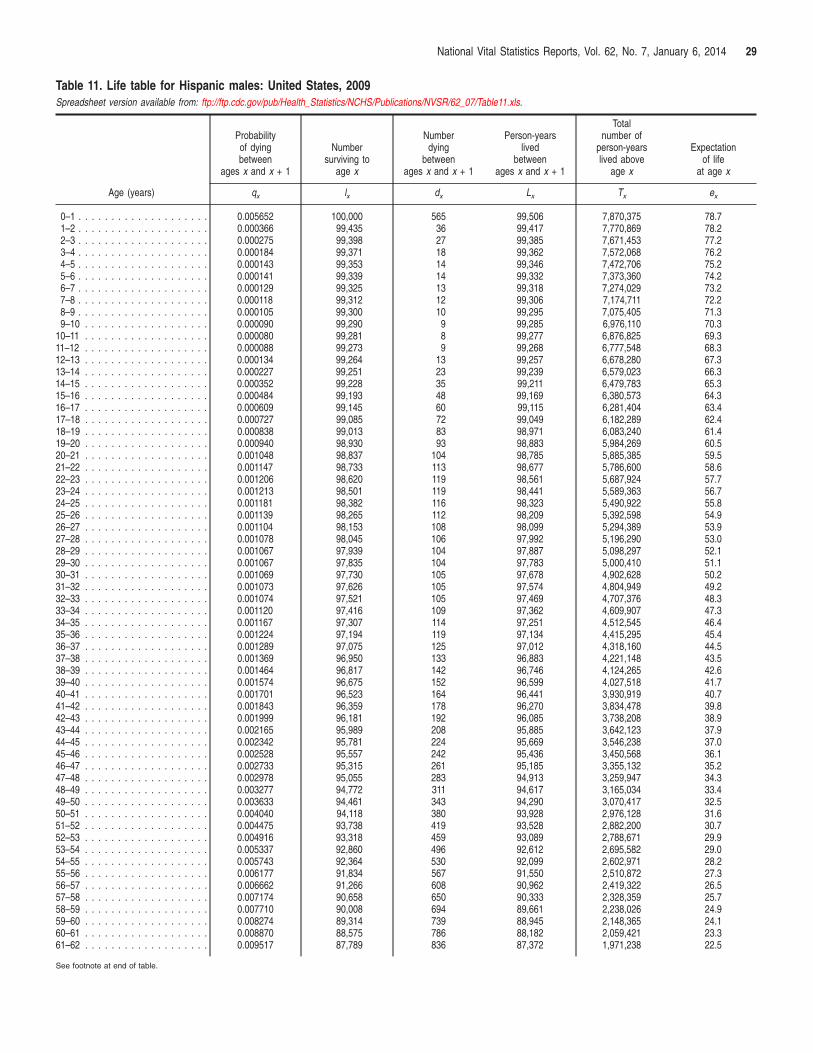
National Vital Statistics Reports, Vol. 62, No. 7, January 6, 2014 29
Table 11. Life table for Hispanic males: United States, 2009 Spreadsheet version available from: ftp://ftp.cdc.gov/pub/Health_Statistics/NCHS/Publications/NVSR/62_07/Table11.xls.
Age (years)
Probability of dying between
ages x and x + 1
Number surviving to
age x
Number dying
between ages x and x + 1
Person-years lived
between ages x and x + 1
Total number of
person-years lived above
age x
Expectation of life
at age x
qx lx dx Lx Tx ex
0–1 . . . . . . . . . . . . . . . . . . . . 0.005652 100,000 565 99,506 7,870,375 78.7 1–2 . . . . . . . . . . . . . . . . . . . . 0.000366 99,435 36 99,417 7,770,869 78.2 2–3 . . . . . . . . . . . . . . . . . . . . 0.000275 99,398 27 99,385 7,671,453 77.2 3–4 . . . . . . . . . . . . . . . . . . . . 0.000184 99,371 18 99,362 7,572,068 76.2 4–5 . . . . . . . . . . . . . . . . . . . . 0.000143 99,353 14 99,346 7,472,706 75.2 5–6 . . . . . . . . . . . . . . . . . . . . 0.000141 99,339 14 99,332 7,373,360 74.2 6–7 . . . . . . . . . . . . . . . . . . . . 0.000129 99,325 13 99,318 7,274,029 73.2 7–8 . . . . . . . . . . . . . . . . . . . . 0.000118 99,312 12 99,306 7,174,711 72.2 8–9 . . . . . . . . . . . . . . . . . . . . 0.000105 99,300 10 99,295 7,075,405 71.3 9–10 . . . . . . . . . . . . . . . . . . . 0.000090 99,290 9 99,285 6,976,110 70.3
10–11 . . . . . . . . . . . . . . . . . . . 0.000080 99,281 8 99,277 6,876,825 69.3 11–12 . . . . . . . . . . . . . . . . . . . 0.000088 99,273 9 99,268 6,777,548 68.3 12–13 . . . . . . . . . . . . . . . . . . . 0.000134 99,264 13 99,257 6,678,280 67.3 13–14 . . . . . . . . . . . . . . . . . . . 0.000227 99,251 23 99,239 6,579,023 66.3 14–15 . . . . . . . . . . . . . . . . . . . 0.000352 99,228 35 99,211 6,479,783 65.3 15–16 . . . . . . . . . . . . . . . . . . . 0.000484 99,193 48 99,169 6,380,573 64.3 16–17 . . . . . . . . . . . . . . . . . . . 0.000609 99,145 60 99,115 6,281,404 63.4 17–18 . . . . . . . . . . . . . . . . . . . 0.000727 99,085 72 99,049 6,182,289 62.4 18–19 . . . . . . . . . . . . . . . . . . . 0.000838 99,013 83 98,971 6,083,240 61.4 19–20 . . . . . . . . . . . . . . . . . . . 0.000940 98,930 93 98,883 5,984,269 60.5 20–21 . . . . . . . . . . . . . . . . . . . 0.001048 98,837 104 98,785 5,885,385 59.5 21–22 . . . . . . . . . . . . . . . . . . . 0.001147 98,733 113 98,677 5,786,600 58.6 22–23 . . . . . . . . . . . . . . . . . . . 0.001206 98,620 119 98,561 5,687,924 57.7 23–24 . . . . . . . . . . . . . . . . . . . 0.001213 98,501 119 98,441 5,589,363 56.7 24–25 . . . . . . . . . . . . . . . . . . . 0.001181 98,382 116 98,323 5,490,922 55.8 25–26 . . . . . . . . . . . . . . . . . . . 0.001139 98,265 112 98,209 5,392,598 54.9 26–27 . . . . . . . . . . . . . . . . . . . 0.001104 98,153 108 98,099 5,294,389 53.9 27–28 . . . . . . . . . . . . . . . . . . . 0.001078 98,045 106 97,992 5,196,290 53.0 28–29 . . . . . . . . . . . . . . . . . . . 0.001067 97,939 104 97,887 5,098,297 52.1 29–30 . . . . . . . . . . . . . . . . . . . 0.001067 97,835 104 97,783 5,000,410 51.1 30–31 . . . . . . . . . . . . . . . . . . . 0.001069 97,730 105 97,678 4,902,628 50.2 31–32 . . . . . . . . . . . . . . . . . . . 0.001073 97,626 105 97,574 4,804,949 49.2 32–33 . . . . . . . . . . . . . . . . . . . 0.001074 97,521 105 97,469 4,707,376 48.3 33–34 . . . . . . . . . . . . . . . . . . . 0.001120 97,416 109 97,362 4,609,907 47.3 34–35 . . . . . . . . . . . . . . . . . . . 0.001167 97,307 114 97,251 4,512,545 46.4 35–36 . . . . . . . . . . . . . . . . . . . 0.001224 97,194 119 97,134 4,415,295 45.4 36–37 . . . . . . . . . . . . . . . . . . . 0.001289 97,075 125 97,012 4,318,160 44.5 37–38 . . . . . . . . . . . . . . . . . . . 0.001369 96,950 133 96,883 4,221,148 43.5 38–39 . . . . . . . . . . . . . . . . . . . 0.001464 96,817 142 96,746 4,124,265 42.6 39–40 . . . . . . . . . . . . . . . . . . . 0.001574 96,675 152 96,599 4,027,518 41.7 40–41 . . . . . . . . . . . . . . . . . . . 0.001701 96,523 164 96,441 3,930,919 40.7 41–42 . . . . . . . . . . . . . . . . . . . 0.001843 96,359 178 96,270 3,834,478 39.8 42–43 . . . . . . . . . . . . . . . . . . . 0.001999 96,181 192 96,085 3,738,208 38.9 43–44 . . . . . . . . . . . . . . . . . . . 0.002165 95,989 208 95,885 3,642,123 37.9 44–45 . . . . . . . . . . . . . . . . . . . 0.002342 95,781 224 95,669 3,546,238 37.0 45–46 . . . . . . . . . . . . . . . . . . . 0.002528 95,557 242 95,436 3,450,568 36.1 46–47 . . . . . . . . . . . . . . . . . . . 0.002733 95,315 261 95,185 3,355,132 35.2 47–48 . . . . . . . . . . . . . . . . . . . 0.002978 95,055 283 94,913 3,259,947 34.3 48–49 . . . . . . . . . . . . . . . . . . . 0.003277 94,772 311 94,617 3,165,034 33.4 49–50 . . . . . . . . . . . . . . . . . . . 0.003633 94,461 343 94,290 3,070,417 32.5 50–51 . . . . . . . . . . . . . . . . . . . 0.004040 94,118 380 93,928 2,976,128 31.6 51–52 . . . . . . . . . . . . . . . . . . . 0.004475 93,738 419 93,528 2,882,200 30.7 52–53 . . . . . . . . . . . . . . . . . . . 0.004916 93,318 459 93,089 2,788,671 29.9 53–54 . . . . . . . . . . . . . . . . . . . 0.005337 92,860 496 92,612 2,695,582 29.0 54–55 . . . . . . . . . . . . . . . . . . . 0.005743 92,364 530 92,099 2,602,971 28.2 55–56 . . . . . . . . . . . . . . . . . . . 0.006177 91,834 567 91,550 2,510,872 27.3 56–57 . . . . . . . . . . . . . . . . . . . 0.006662 91,266 608 90,962 2,419,322 26.5 57–58 . . . . . . . . . . . . . . . . . . . 0.007174 90,658 650 90,333 2,328,359 25.7 58–59 . . . . . . . . . . . . . . . . . . . 0.007710 90,008 694 89,661 2,238,026 24.9 59–60 . . . . . . . . . . . . . . . . . . . 0.008274 89,314 739 88,945 2,148,365 24.1 60–61 . . . . . . . . . . . . . . . . . . . 0.008870 88,575 786 88,182 2,059,421 23.3 61–62 . . . . . . . . . . . . . . . . . . . 0.009517 87,789 836 87,372 1,971,238 22.5
See footnote at end of table.
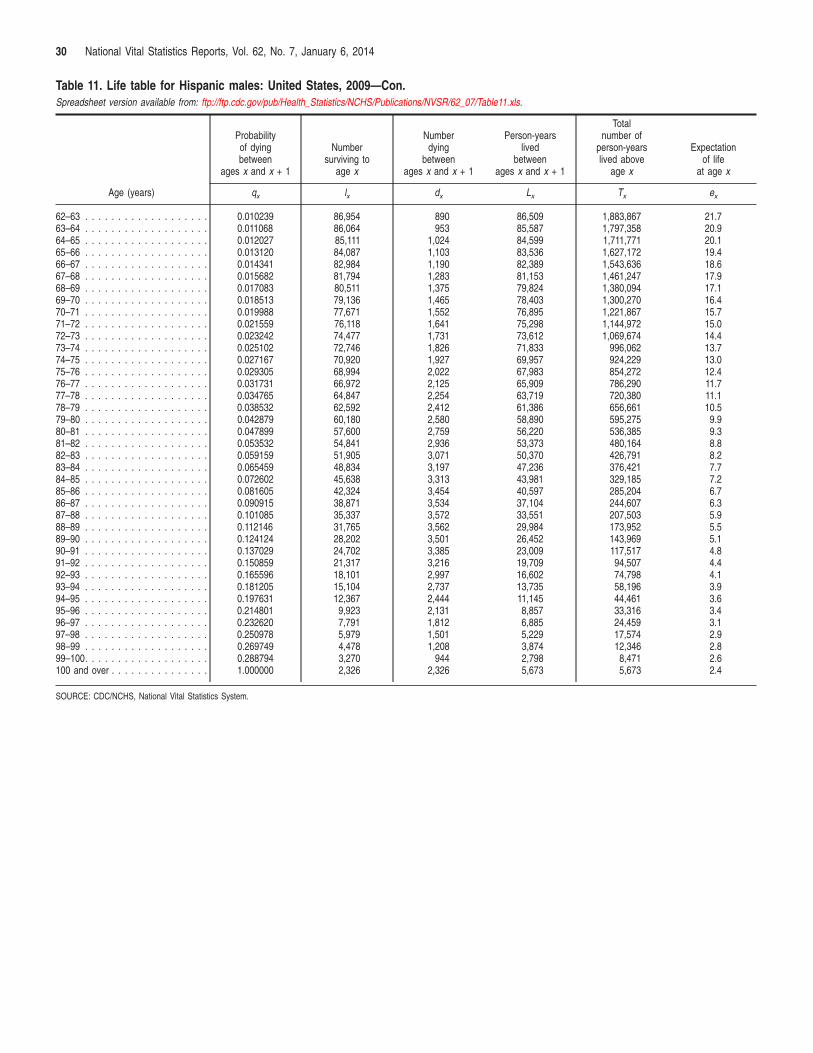
30 National Vital Statistics Reports, Vol. 62, No. 7, January 6, 2014
Table 11. Life table for Hispanic males: United States, 2009—Con. Spreadsheet version available from: ftp://ftp.cdc.gov/pub/Health_Statistics/NCHS/Publications/NVSR/62_07/Table11.xls.
Age (years)
Probability of dying between
ages x and x + 1
Number surviving to
age x
Number dying
between ages x and x + 1
Person-years lived
between ages x and x + 1
Total number of
person-years lived above
age x
Expectation of life
at age x
qx lx dx Lx Tx ex
62–63 . . . . . . . . . . . . . . . . . . . 0.010239 86,954 890 86,509 1,883,867 21.7 63–64 . . . . . . . . . . . . . . . . . . . 0.011068 86,064 953 85,587 1,797,358 20.9 64–65 . . . . . . . . . . . . . . . . . . . 0.012027 85,111 1,024 84,599 1,711,771 20.1 65–66 . . . . . . . . . . . . . . . . . . . 0.013120 84,087 1,103 83,536 1,627,172 19.4 66–67 . . . . . . . . . . . . . . . . . . . 0.014341 82,984 1,190 82,389 1,543,636 18.6 67–68 . . . . . . . . . . . . . . . . . . . 0.015682 81,794 1,283 81,153 1,461,247 17.9 68–69 . . . . . . . . . . . . . . . . . . . 0.017083 80,511 1,375 79,824 1,380,094 17.1 69–70 . . . . . . . . . . . . . . . . . . . 0.018513 79,136 1,465 78,403 1,300,270 16.4 70–71 . . . . . . . . . . . . . . . . . . . 0.019988 77,671 1,552 76,895 1,221,867 15.7 71–72 . . . . . . . . . . . . . . . . . . . 0.021559 76,118 1,641 75,298 1,144,972 15.0 72–73 . . . . . . . . . . . . . . . . . . . 0.023242 74,477 1,731 73,612 1,069,674 14.4 73–74 . . . . . . . . . . . . . . . . . . . 0.025102 72,746 1,826 71,833 996,062 13.7 74–75 . . . . . . . . . . . . . . . . . . . 0.027167 70,920 1,927 69,957 924,229 13.0 75–76 . . . . . . . . . . . . . . . . . . . 0.029305 68,994 2,022 67,983 854,272 12.4 76–77 . . . . . . . . . . . . . . . . . . . 0.031731 66,972 2,125 65,909 786,290 11.7 77–78 . . . . . . . . . . . . . . . . . . . 0.034765 64,847 2,254 63,719 720,380 11.1 78–79 . . . . . . . . . . . . . . . . . . . 0.038532 62,592 2,412 61,386 656,661 10.5 79–80 . . . . . . . . . . . . . . . . . . . 0.042879 60,180 2,580 58,890 595,275 9.9 80–81 . . . . . . . . . . . . . . . . . . . 0.047899 57,600 2,759 56,220 536,385 9.3 81–82 . . . . . . . . . . . . . . . . . . . 0.053532 54,841 2,936 53,373 480,164 8.8 82–83 . . . . . . . . . . . . . . . . . . . 0.059159 51,905 3,071 50,370 426,791 8.2 83–84 . . . . . . . . . . . . . . . . . . . 0.065459 48,834 3,197 47,236 376,421 7.7 84–85 . . . . . . . . . . . . . . . . . . . 0.072602 45,638 3,313 43,981 329,185 7.2 85–86 . . . . . . . . . . . . . . . . . . . 0.081605 42,324 3,454 40,597 285,204 6.7 86–87 . . . . . . . . . . . . . . . . . . . 0.090915 38,871 3,534 37,104 244,607 6.3 87–88 . . . . . . . . . . . . . . . . . . . 0.101085 35,337 3,572 33,551 207,503 5.9 88–89 . . . . . . . . . . . . . . . . . . . 0.112146 31,765 3,562 29,984 173,952 5.5 89–90 . . . . . . . . . . . . . . . . . . . 0.124124 28,202 3,501 26,452 143,969 5.1 90–91 . . . . . . . . . . . . . . . . . . . 0.137029 24,702 3,385 23,009 117,517 4.8 91–92 . . . . . . . . . . . . . . . . . . . 0.150859 21,317 3,216 19,709 94,507 4.4 92–93 . . . . . . . . . . . . . . . . . . . 0.165596 18,101 2,997 16,602 74,798 4.1 93–94 . . . . . . . . . . . . . . . . . . . 0.181205 15,104 2,737 13,735 58,196 3.9 94–95 . . . . . . . . . . . . . . . . . . . 0.197631 12,367 2,444 11,145 44,461 3.6 95–96 . . . . . . . . . . . . . . . . . . . 0.214801 9,923 2,131 8,857 33,316 3.4 96–97 . . . . . . . . . . . . . . . . . . . 0.232620 7,791 1,812 6,885 24,459 3.1 97–98 . . . . . . . . . . . . . . . . . . . 0.250978 5,979 1,501 5,229 17,574 2.9 98–99 . . . . . . . . . . . . . . . . . . . 0.269749 4,478 1,208 3,874 12,346 2.8 99–100. . . . . . . . . . . . . . . . . . . 0.288794 3,270 944 2,798 8,471 2.6 100 and over . . . . . . . . . . . . . . . 1.000000 2,326 2,326 5,673 5,673 2.4
SOURCE: CDC/NCHS, National Vital Statistics System.
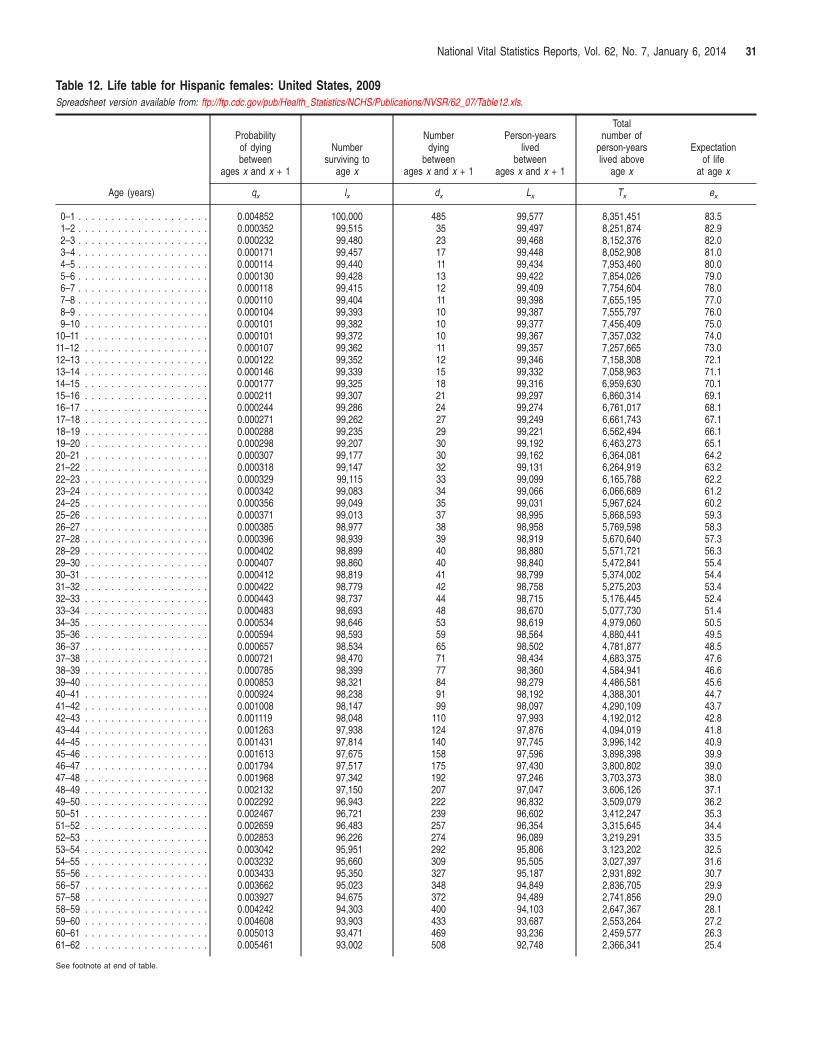
National Vital Statistics Reports, Vol. 62, No. 7, January 6, 2014 31
Table 12. Life table for Hispanic females: United States, 2009 Spreadsheet version available from: ftp://ftp.cdc.gov/pub/Health_Statistics/NCHS/Publications/NVSR/62_07/Table12.xls.
Age (years)
Probability of dying between
ages x and x + 1
Number surviving to
age x
Number dying
between ages x and x + 1
Person-years lived
between ages x and x + 1
Total number of
person-years lived above
age x
Expectation of life
at age x
qx lx dx Lx Tx ex
0–1 . . . . . . . . . . . . . . . . . . . . 0.004852 100,000 485 99,577 8,351,451 83.5 1–2 . . . . . . . . . . . . . . . . . . . . 0.000352 99,515 35 99,497 8,251,874 82.9 2–3 . . . . . . . . . . . . . . . . . . . . 0.000232 99,480 23 99,468 8,152,376 82.0 3–4 . . . . . . . . . . . . . . . . . . . . 0.000171 99,457 17 99,448 8,052,908 81.0 4–5 . . . . . . . . . . . . . . . . . . . . 0.000114 99,440 11 99,434 7,953,460 80.0 5–6 . . . . . . . . . . . . . . . . . . . . 0.000130 99,428 13 99,422 7,854,026 79.0 6–7 . . . . . . . . . . . . . . . . . . . . 0.000118 99,415 12 99,409 7,754,604 78.0 7–8 . . . . . . . . . . . . . . . . . . . . 0.000110 99,404 11 99,398 7,655,195 77.0 8–9 . . . . . . . . . . . . . . . . . . . . 0.000104 99,393 10 99,387 7,555,797 76.0 9–10 . . . . . . . . . . . . . . . . . . . 0.000101 99,382 10 99,377 7,456,409 75.0
10–11 . . . . . . . . . . . . . . . . . . . 0.000101 99,372 10 99,367 7,357,032 74.0 11–12 . . . . . . . . . . . . . . . . . . . 0.000107 99,362 11 99,357 7,257,665 73.0 12–13 . . . . . . . . . . . . . . . . . . . 0.000122 99,352 12 99,346 7,158,308 72.1 13–14 . . . . . . . . . . . . . . . . . . . 0.000146 99,339 15 99,332 7,058,963 71.1 14–15 . . . . . . . . . . . . . . . . . . . 0.000177 99,325 18 99,316 6,959,630 70.1 15–16 . . . . . . . . . . . . . . . . . . . 0.000211 99,307 21 99,297 6,860,314 69.1 16–17 . . . . . . . . . . . . . . . . . . . 0.000244 99,286 24 99,274 6,761,017 68.1 17–18 . . . . . . . . . . . . . . . . . . . 0.000271 99,262 27 99,249 6,661,743 67.1 18–19 . . . . . . . . . . . . . . . . . . . 0.000288 99,235 29 99,221 6,562,494 66.1 19–20 . . . . . . . . . . . . . . . . . . . 0.000298 99,207 30 99,192 6,463,273 65.1 20–21 . . . . . . . . . . . . . . . . . . . 0.000307 99,177 30 99,162 6,364,081 64.2 21–22 . . . . . . . . . . . . . . . . . . . 0.000318 99,147 32 99,131 6,264,919 63.2 22–23 . . . . . . . . . . . . . . . . . . . 0.000329 99,115 33 99,099 6,165,788 62.2 23–24 . . . . . . . . . . . . . . . . . . . 0.000342 99,083 34 99,066 6,066,689 61.2 24–25 . . . . . . . . . . . . . . . . . . . 0.000356 99,049 35 99,031 5,967,624 60.2 25–26 . . . . . . . . . . . . . . . . . . . 0.000371 99,013 37 98,995 5,868,593 59.3 26–27 . . . . . . . . . . . . . . . . . . . 0.000385 98,977 38 98,958 5,769,598 58.3 27–28 . . . . . . . . . . . . . . . . . . . 0.000396 98,939 39 98,919 5,670,640 57.3 28–29 . . . . . . . . . . . . . . . . . . . 0.000402 98,899 40 98,880 5,571,721 56.3 29–30 . . . . . . . . . . . . . . . . . . . 0.000407 98,860 40 98,840 5,472,841 55.4 30–31 . . . . . . . . . . . . . . . . . . . 0.000412 98,819 41 98,799 5,374,002 54.4 31–32 . . . . . . . . . . . . . . . . . . . 0.000422 98,779 42 98,758 5,275,203 53.4 32–33 . . . . . . . . . . . . . . . . . . . 0.000443 98,737 44 98,715 5,176,445 52.4 33–34 . . . . . . . . . . . . . . . . . . . 0.000483 98,693 48 98,670 5,077,730 51.4 34–35 . . . . . . . . . . . . . . . . . . . 0.000534 98,646 53 98,619 4,979,060 50.5 35–36 . . . . . . . . . . . . . . . . . . . 0.000594 98,593 59 98,564 4,880,441 49.5 36–37 . . . . . . . . . . . . . . . . . . . 0.000657 98,534 65 98,502 4,781,877 48.5 37–38 . . . . . . . . . . . . . . . . . . . 0.000721 98,470 71 98,434 4,683,375 47.6 38–39 . . . . . . . . . . . . . . . . . . . 0.000785 98,399 77 98,360 4,584,941 46.6 39–40 . . . . . . . . . . . . . . . . . . . 0.000853 98,321 84 98,279 4,486,581 45.6 40–41 . . . . . . . . . . . . . . . . . . . 0.000924 98,238 91 98,192 4,388,301 44.7 41–42 . . . . . . . . . . . . . . . . . . . 0.001008 98,147 99 98,097 4,290,109 43.7 42–43 . . . . . . . . . . . . . . . . . . . 0.001119 98,048 110 97,993 4,192,012 42.8 43–44 . . . . . . . . . . . . . . . . . . . 0.001263 97,938 124 97,876 4,094,019 41.8 44–45 . . . . . . . . . . . . . . . . . . . 0.001431 97,814 140 97,745 3,996,142 40.9 45–46 . . . . . . . . . . . . . . . . . . . 0.001613 97,675 158 97,596 3,898,398 39.9 46–47 . . . . . . . . . . . . . . . . . . . 0.001794 97,517 175 97,430 3,800,802 39.0 47–48 . . . . . . . . . . . . . . . . . . . 0.001968 97,342 192 97,246 3,703,373 38.0 48–49 . . . . . . . . . . . . . . . . . . . 0.002132 97,150 207 97,047 3,606,126 37.1 49–50 . . . . . . . . . . . . . . . . . . . 0.002292 96,943 222 96,832 3,509,079 36.2 50–51 . . . . . . . . . . . . . . . . . . . 0.002467 96,721 239 96,602 3,412,247 35.3 51–52 . . . . . . . . . . . . . . . . . . . 0.002659 96,483 257 96,354 3,315,645 34.4 52–53 . . . . . . . . . . . . . . . . . . . 0.002853 96,226 274 96,089 3,219,291 33.5 53–54 . . . . . . . . . . . . . . . . . . . 0.003042 95,951 292 95,806 3,123,202 32.5 54–55 . . . . . . . . . . . . . . . . . . . 0.003232 95,660 309 95,505 3,027,397 31.6 55–56 . . . . . . . . . . . . . . . . . . . 0.003433 95,350 327 95,187 2,931,892 30.7 56–57 . . . . . . . . . . . . . . . . . . . 0.003662 95,023 348 94,849 2,836,705 29.9 57–58 . . . . . . . . . . . . . . . . . . . 0.003927 94,675 372 94,489 2,741,856 29.0 58–59 . . . . . . . . . . . . . . . . . . . 0.004242 94,303 400 94,103 2,647,367 28.1 59–60 . . . . . . . . . . . . . . . . . . . 0.004608 93,903 433 93,687 2,553,264 27.2 60–61 . . . . . . . . . . . . . . . . . . . 0.005013 93,471 469 93,236 2,459,577 26.3 61–62 . . . . . . . . . . . . . . . . . . . 0.005461 93,002 508 92,748 2,366,341 25.4
See footnote at end of table.
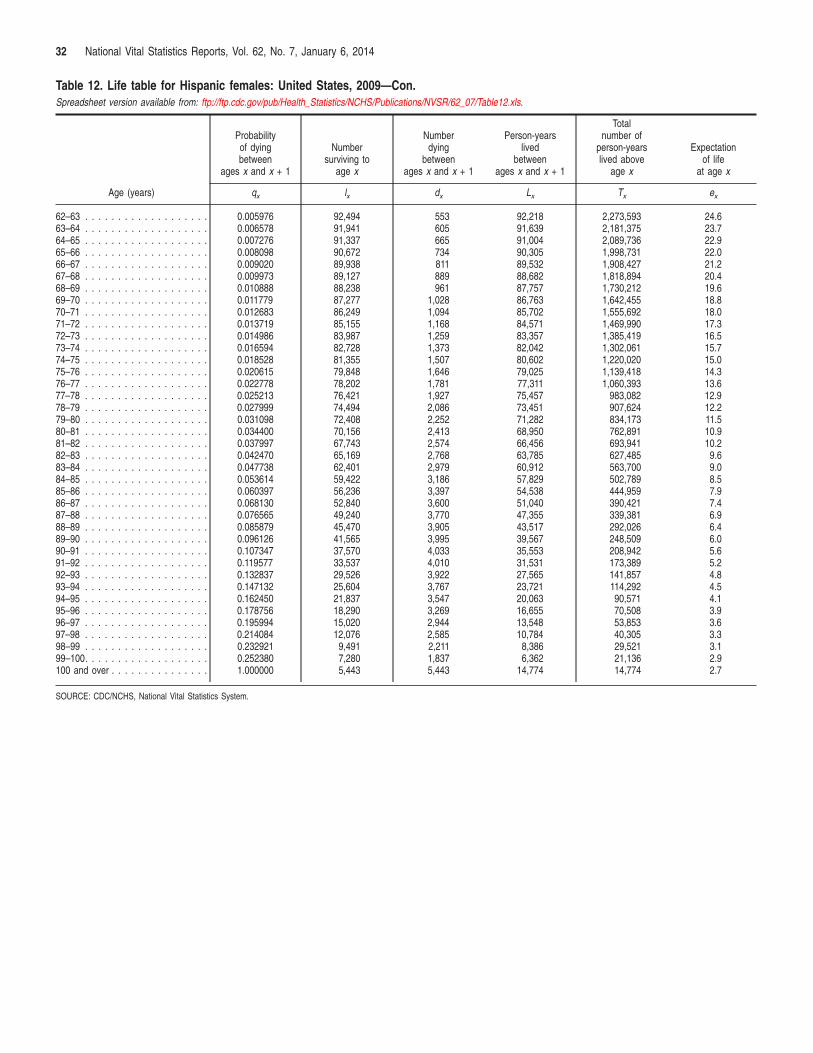
32 National Vital Statistics Reports, Vol. 62, No. 7, January 6, 2014
Table 12. Life table for Hispanic females: United States, 2009—Con. Spreadsheet version available from: ftp://ftp.cdc.gov/pub/Health_Statistics/NCHS/Publications/NVSR/62_07/Table12.xls.
Age (years)
Probability of dying between
ages x and x + 1
Number surviving to
age x
Number dying
between ages x and x + 1
Person-years lived
between ages x and x + 1
Total number of
person-years lived above
age x
Expectation of life
at age x
qx lx dx Lx Tx ex
62–63 . . . . . . . . . . . . . . . . . . . 0.005976 92,494 553 92,218 2,273,593 24.6 63–64 . . . . . . . . . . . . . . . . . . . 0.006578 91,941 605 91,639 2,181,375 23.7 64–65 . . . . . . . . . . . . . . . . . . . 0.007276 91,337 665 91,004 2,089,736 22.9 65–66 . . . . . . . . . . . . . . . . . . . 0.008098 90,672 734 90,305 1,998,731 22.0 66–67 . . . . . . . . . . . . . . . . . . . 0.009020 89,938 811 89,532 1,908,427 21.2 67–68 . . . . . . . . . . . . . . . . . . . 0.009973 89,127 889 88,682 1,818,894 20.4 68–69 . . . . . . . . . . . . . . . . . . . 0.010888 88,238 961 87,757 1,730,212 19.6 69–70 . . . . . . . . . . . . . . . . . . . 0.011779 87,277 1,028 86,763 1,642,455 18.8 70–71 . . . . . . . . . . . . . . . . . . . 0.012683 86,249 1,094 85,702 1,555,692 18.0 71–72 . . . . . . . . . . . . . . . . . . . 0.013719 85,155 1,168 84,571 1,469,990 17.3 72–73 . . . . . . . . . . . . . . . . . . . 0.014986 83,987 1,259 83,357 1,385,419 16.5 73–74 . . . . . . . . . . . . . . . . . . . 0.016594 82,728 1,373 82,042 1,302,061 15.7 74–75 . . . . . . . . . . . . . . . . . . . 0.018528 81,355 1,507 80,602 1,220,020 15.0 75–76 . . . . . . . . . . . . . . . . . . . 0.020615 79,848 1,646 79,025 1,139,418 14.3 76–77 . . . . . . . . . . . . . . . . . . . 0.022778 78,202 1,781 77,311 1,060,393 13.6 77–78 . . . . . . . . . . . . . . . . . . . 0.025213 76,421 1,927 75,457 983,082 12.9 78–79 . . . . . . . . . . . . . . . . . . . 0.027999 74,494 2,086 73,451 907,624 12.2 79–80 . . . . . . . . . . . . . . . . . . . 0.031098 72,408 2,252 71,282 834,173 11.5 80–81 . . . . . . . . . . . . . . . . . . . 0.034400 70,156 2,413 68,950 762,891 10.9 81–82 . . . . . . . . . . . . . . . . . . . 0.037997 67,743 2,574 66,456 693,941 10.2 82–83 . . . . . . . . . . . . . . . . . . . 0.042470 65,169 2,768 63,785 627,485 9.6 83–84 . . . . . . . . . . . . . . . . . . . 0.047738 62,401 2,979 60,912 563,700 9.0 84–85 . . . . . . . . . . . . . . . . . . . 0.053614 59,422 3,186 57,829 502,789 8.5 85–86 . . . . . . . . . . . . . . . . . . . 0.060397 56,236 3,397 54,538 444,959 7.9 86–87 . . . . . . . . . . . . . . . . . . . 0.068130 52,840 3,600 51,040 390,421 7.4 87–88 . . . . . . . . . . . . . . . . . . . 0.076565 49,240 3,770 47,355 339,381 6.9 88–89 . . . . . . . . . . . . . . . . . . . 0.085879 45,470 3,905 43,517 292,026 6.4 89–90 . . . . . . . . . . . . . . . . . . . 0.096126 41,565 3,995 39,567 248,509 6.0 90–91 . . . . . . . . . . . . . . . . . . . 0.107347 37,570 4,033 35,553 208,942 5.6 91–92 . . . . . . . . . . . . . . . . . . . 0.119577 33,537 4,010 31,531 173,389 5.2 92–93 . . . . . . . . . . . . . . . . . . . 0.132837 29,526 3,922 27,565 141,857 4.8 93–94 . . . . . . . . . . . . . . . . . . . 0.147132 25,604 3,767 23,721 114,292 4.5 94–95 . . . . . . . . . . . . . . . . . . . 0.162450 21,837 3,547 20,063 90,571 4.1 95–96 . . . . . . . . . . . . . . . . . . . 0.178756 18,290 3,269 16,655 70,508 3.9 96–97 . . . . . . . . . . . . . . . . . . . 0.195994 15,020 2,944 13,548 53,853 3.6 97–98 . . . . . . . . . . . . . . . . . . . 0.214084 12,076 2,585 10,784 40,305 3.3 98–99 . . . . . . . . . . . . . . . . . . . 0.232921 9,491 2,211 8,386 29,521 3.1 99–100. . . . . . . . . . . . . . . . . . . 0.252380 7,280 1,837 6,362 21,136 2.9 100 and over . . . . . . . . . . . . . . . 1.000000 5,443 5,443 14,774 14,774 2.7
SOURCE: CDC/NCHS, National Vital Statistics System.
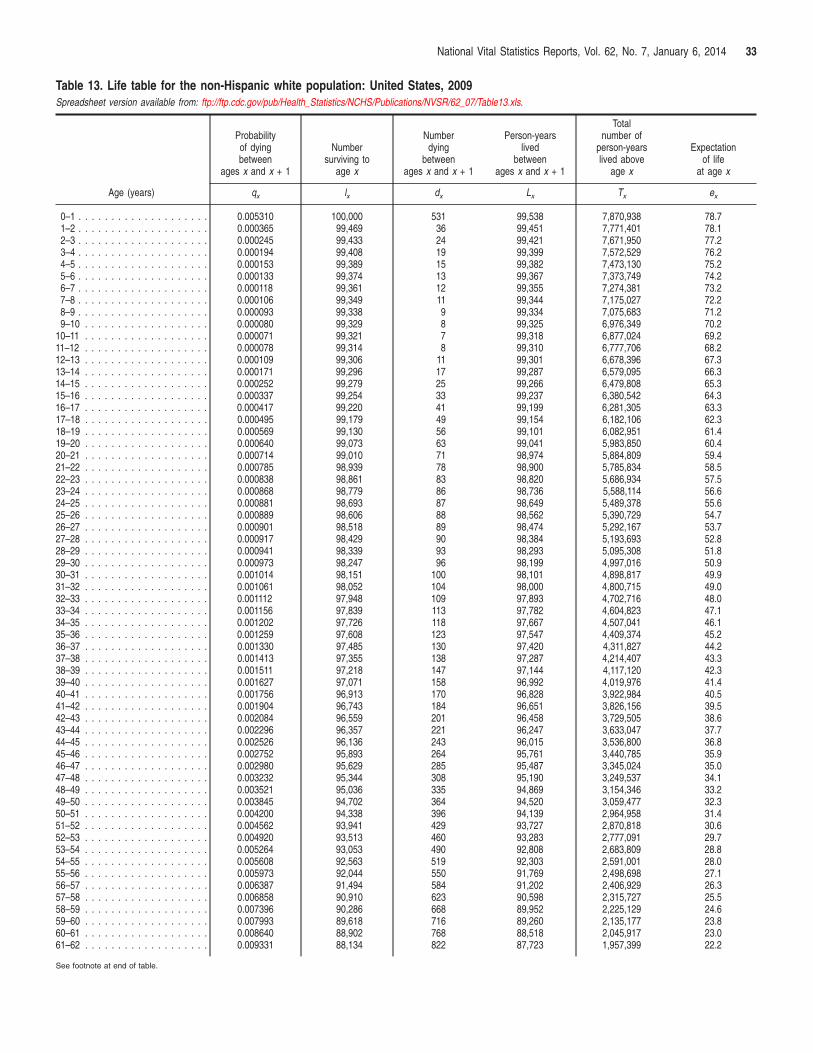
Table 13. Life table for the non-Hispanic white population: United States, 2009 Spreadsheet version available from: ftp://ftp.cdc.gov/pub/Health_Statistics/NCHS/Publications/NVSR/62_07/Table13.xls.
Age (years)
Probability of dying between
ages x and x + 1
Number surviving to
age x
Number dying
between ages x and x + 1
Person-years lived
between ages x and x + 1
Total number of
person-years lived above
age x
Expectation of life
at age x
qx lx dx Lx Tx ex
0–1 . . . . . . . . . . . . . . . . . . . . 0.005310 100,000 531 99,538 7,870,938 78.7 1–2 . . . . . . . . . . . . . . . . . . . . 0.000365 99,469 36 99,451 7,771,401 78.1 2–3 . . . . . . . . . . . . . . . . . . . . 0.000245 99,433 24 99,421 7,671,950 77.2 3–4 . . . . . . . . . . . . . . . . . . . . 0.000194 99,408 19 99,399 7,572,529 76.2 4–5 . . . . . . . . . . . . . . . . . . . . 0.000153 99,389 15 99,382 7,473,130 75.2 5–6 . . . . . . . . . . . . . . . . . . . . 0.000133 99,374 13 99,367 7,373,749 74.2 6–7 . . . . . . . . . . . . . . . . . . . . 0.000118 99,361 12 99,355 7,274,381 73.2 7–8 . . . . . . . . . . . . . . . . . . . . 0.000106 99,349 11 99,344 7,175,027 72.2 8–9 . . . . . . . . . . . . . . . . . . . . 0.000093 99,338 9 99,334 7,075,683 71.2 9–10 . . . . . . . . . . . . . . . . . . . 0.000080 99,329 8 99,325 6,976,349 70.2
10–11 . . . . . . . . . . . . . . . . . . . 0.000071 99,321 7 99,318 6,877,024 69.2 11–12 . . . . . . . . . . . . . . . . . . . 0.000078 99,314 8 99,310 6,777,706 68.2 12–13 . . . . . . . . . . . . . . . . . . . 0.000109 99,306 11 99,301 6,678,396 67.3 13–14 . . . . . . . . . . . . . . . . . . . 0.000171 99,296 17 99,287 6,579,095 66.3 14–15 . . . . . . . . . . . . . . . . . . . 0.000252 99,279 25 99,266 6,479,808 65.3 15–16 . . . . . . . . . . . . . . . . . . . 0.000337 99,254 33 99,237 6,380,542 64.3 16–17 . . . . . . . . . . . . . . . . . . . 0.000417 99,220 41 99,199 6,281,305 63.3 17–18 . . . . . . . . . . . . . . . . . . . 0.000495 99,179 49 99,154 6,182,106 62.3 18–19 . . . . . . . . . . . . . . . . . . . 0.000569 99,130 56 99,101 6,082,951 61.4 19–20 . . . . . . . . . . . . . . . . . . . 0.000640 99,073 63 99,041 5,983,850 60.4 20–21 . . . . . . . . . . . . . . . . . . . 0.000714 99,010 71 98,974 5,884,809 59.4 21–22 . . . . . . . . . . . . . . . . . . . 0.000785 98,939 78 98,900 5,785,834 58.5 22–23 . . . . . . . . . . . . . . . . . . . 0.000838 98,861 83 98,820 5,686,934 57.5 23–24 . . . . . . . . . . . . . . . . . . . 0.000868 98,779 86 98,736 5,588,114 56.6 24–25 . . . . . . . . . . . . . . . . . . . 0.000881 98,693 87 98,649 5,489,378 55.6 25–26 . . . . . . . . . . . . . . . . . . . 0.000889 98,606 88 98,562 5,390,729 54.7 26–27 . . . . . . . . . . . . . . . . . . . 0.000901 98,518 89 98,474 5,292,167 53.7 27–28 . . . . . . . . . . . . . . . . . . . 0.000917 98,429 90 98,384 5,193,693 52.8 28–29 . . . . . . . . . . . . . . . . . . . 0.000941 98,339 93 98,293 5,095,308 51.8 29–30 . . . . . . . . . . . . . . . . . . . 0.000973 98,247 96 98,199 4,997,016 50.9 30–31 . . . . . . . . . . . . . . . . . . . 0.001014 98,151 100 98,101 4,898,817 49.9 31–32 . . . . . . . . . . . . . . . . . . . 0.001061 98,052 104 98,000 4,800,715 49.0 32–33 . . . . . . . . . . . . . . . . . . . 0.001112 97,948 109 97,893 4,702,716 48.0 33–34 . . . . . . . . . . . . . . . . . . . 0.001156 97,839 113 97,782 4,604,823 47.1 34–35 . . . . . . . . . . . . . . . . . . . 0.001202 97,726 118 97,667 4,507,041 46.1 35–36 . . . . . . . . . . . . . . . . . . . 0.001259 97,608 123 97,547 4,409,374 45.2 36–37 . . . . . . . . . . . . . . . . . . . 0.001330 97,485 130 97,420 4,311,827 44.2 37–38 . . . . . . . . . . . . . . . . . . . 0.001413 97,355 138 97,287 4,214,407 43.3 38–39 . . . . . . . . . . . . . . . . . . . 0.001511 97,218 147 97,144 4,117,120 42.3 39–40 . . . . . . . . . . . . . . . . . . . 0.001627 97,071 158 96,992 4,019,976 41.4 40–41 . . . . . . . . . . . . . . . . . . . 0.001756 96,913 170 96,828 3,922,984 40.5 41–42 . . . . . . . . . . . . . . . . . . . 0.001904 96,743 184 96,651 3,826,156 39.5 42–43 . . . . . . . . . . . . . . . . . . . 0.002084 96,559 201 96,458 3,729,505 38.6 43–44 . . . . . . . . . . . . . . . . . . . 0.002296 96,357 221 96,247 3,633,047 37.7 44–45 . . . . . . . . . . . . . . . . . . . 0.002526 96,136 243 96,015 3,536,800 36.8 45–46 . . . . . . . . . . . . . . . . . . . 0.002752 95,893 264 95,761 3,440,785 35.9 46–47 . . . . . . . . . . . . . . . . . . . 0.002980 95,629 285 95,487 3,345,024 35.0 47–48 . . . . . . . . . . . . . . . . . . . 0.003232 95,344 308 95,190 3,249,537 34.1 48–49 . . . . . . . . . . . . . . . . . . . 0.003521 95,036 335 94,869 3,154,346 33.2 49–50 . . . . . . . . . . . . . . . . . . . 0.003845 94,702 364 94,520 3,059,477 32.3 50–51 . . . . . . . . . . . . . . . . . . . 0.004200 94,338 396 94,139 2,964,958 31.4 51–52 . . . . . . . . . . . . . . . . . . . 0.004562 93,941 429 93,727 2,870,818 30.6 52–53 . . . . . . . . . . . . . . . . . . . 0.004920 93,513 460 93,283 2,777,091 29.7 53–54 . . . . . . . . . . . . . . . . . . . 0.005264 93,053 490 92,808 2,683,809 28.8 54–55 . . . . . . . . . . . . . . . . . . . 0.005608 92,563 519 92,303 2,591,001 28.0 55–56 . . . . . . . . . . . . . . . . . . . 0.005973 92,044 550 91,769 2,498,698 27.1 56–57 . . . . . . . . . . . . . . . . . . . 0.006387 91,494 584 91,202 2,406,929 26.3 57–58 . . . . . . . . . . . . . . . . . . . 0.006858 90,910 623 90,598 2,315,727 25.5 58–59 . . . . . . . . . . . . . . . . . . . 0.007396 90,286 668 89,952 2,225,129 24.6 59–60 . . . . . . . . . . . . . . . . . . . 0.007993 89,618 716 89,260 2,135,177 23.8 60–61 . . . . . . . . . . . . . . . . . . . 0.008640 88,902 768 88,518 2,045,917 23.0 61–62 . . . . . . . . . . . . . . . . . . . 0.009331 88,134 822 87,723 1,957,399 22.2
See footnote at end of table.
National Vital Statistics Reports, Vol. 62, No. 7, January 6, 2014 33

34 National Vital Statistics Reports, Vol. 62, No. 7, January 6, 2014
Table 13. Life table for the non-Hispanic white population: United States, 2009—Con. Spreadsheet version available from: ftp://ftp.cdc.gov/pub/Health_Statistics/NCHS/Publications/NVSR/62_07/Table13.xls.
Age (years)
Probability of dying between
ages x and x + 1
Number surviving to
age x
Number dying
between ages x and x + 1
Person-years lived
between ages x and x + 1
Total number of
person-years lived above
age x
Expectation of life
at age x
qx lx dx Lx Tx ex
62–63 . . . . . . . . . . . . . . . . . . . 0.010077 87,312 880 86,872 1,869,676 21.4 63–64 . . . . . . . . . . . . . . . . . . . 0.010902 86,432 942 85,961 1,782,804 20.6 64–65 . . . . . . . . . . . . . . . . . . . 0.011832 85,489 1,012 84,984 1,696,844 19.8 65–66 . . . . . . . . . . . . . . . . . . . 0.012923 84,478 1,092 83,932 1,611,860 19.1 66–67 . . . . . . . . . . . . . . . . . . . 0.014154 83,386 1,180 82,796 1,527,928 18.3 67–68 . . . . . . . . . . . . . . . . . . . 0.015463 82,206 1,271 81,570 1,445,132 17.6 68–69 . . . . . . . . . . . . . . . . . . . 0.016810 80,935 1,361 80,255 1,363,562 16.8 69–70 . . . . . . . . . . . . . . . . . . . 0.018204 79,574 1,449 78,850 1,283,307 16.1 70–71 . . . . . . . . . . . . . . . . . . . 0.019780 78,126 1,545 77,353 1,204,457 15.4 71–72 . . . . . . . . . . . . . . . . . . . 0.021603 76,580 1,654 75,753 1,127,104 14.7 72–73 . . . . . . . . . . . . . . . . . . . 0.023629 74,926 1,770 74,041 1,051,351 14.0 73–74 . . . . . . . . . . . . . . . . . . . 0.025966 73,156 1,900 72,206 977,310 13.4 74–75 . . . . . . . . . . . . . . . . . . . 0.028541 71,256 2,034 70,239 905,104 12.7 75–76 . . . . . . . . . . . . . . . . . . . 0.031167 69,222 2,157 68,144 834,864 12.1 76–77 . . . . . . . . . . . . . . . . . . . 0.034091 67,065 2,286 65,922 766,721 11.4 77–78 . . . . . . . . . . . . . . . . . . . 0.037561 64,779 2,433 63,562 700,799 10.8 78–79 . . . . . . . . . . . . . . . . . . . 0.041526 62,345 2,589 61,051 637,237 10.2 79–80 . . . . . . . . . . . . . . . . . . . 0.045818 59,756 2,738 58,388 576,186 9.6 80–81 . . . . . . . . . . . . . . . . . . . 0.050483 57,019 2,878 55,579 517,798 9.1 81–82 . . . . . . . . . . . . . . . . . . . 0.055518 54,140 3,006 52,637 462,219 8.5 82–83 . . . . . . . . . . . . . . . . . . . 0.061433 51,134 3,141 49,564 409,582 8.0 83–84 . . . . . . . . . . . . . . . . . . . 0.068184 47,993 3,272 46,357 360,018 7.5 84–85 . . . . . . . . . . . . . . . . . . . 0.075721 44,721 3,386 43,027 313,661 7.0 85–86 . . . . . . . . . . . . . . . . . . . 0.084742 41,334 3,503 39,583 270,634 6.5 86–87 . . . . . . . . . . . . . . . . . . . 0.094419 37,832 3,572 36,046 231,051 6.1 87–88 . . . . . . . . . . . . . . . . . . . 0.105002 34,260 3,597 32,461 195,006 5.7 88–89 . . . . . . . . . . . . . . . . . . . 0.116529 30,662 3,573 28,876 162,545 5.3 89–90 . . . . . . . . . . . . . . . . . . . 0.129032 27,089 3,495 25,341 133,669 4.9 90–91 . . . . . . . . . . . . . . . . . . . 0.142528 23,594 3,363 21,912 108,328 4.6 91–92 . . . . . . . . . . . . . . . . . . . 0.157023 20,231 3,177 18,643 86,415 4.3 92–93 . . . . . . . . . . . . . . . . . . . 0.172507 17,054 2,942 15,583 67,772 4.0 93–94 . . . . . . . . . . . . . . . . . . . 0.188952 14,112 2,667 12,779 52,189 3.7 94–95 . . . . . . . . . . . . . . . . . . . 0.206311 11,446 2,361 10,265 39,410 3.4 95–96 . . . . . . . . . . . . . . . . . . . 0.224514 9,084 2,040 8,065 29,145 3.2 96–97 . . . . . . . . . . . . . . . . . . . 0.243474 7,045 1,715 6,187 21,081 3.0 97–98 . . . . . . . . . . . . . . . . . . . 0.263083 5,330 1,402 4,629 14,893 2.8 98–99 . . . . . . . . . . . . . . . . . . . 0.283214 3,927 1,112 3,371 10,265 2.6 99–100. . . . . . . . . . . . . . . . . . . 0.303726 2,815 855 2,388 6,894 2.4 100 and over . . . . . . . . . . . . . . . 1.000000 1,960 1,960 4,506 4,506 2.3
SOURCE: CDC/NCHS, National Vital Statistics System.
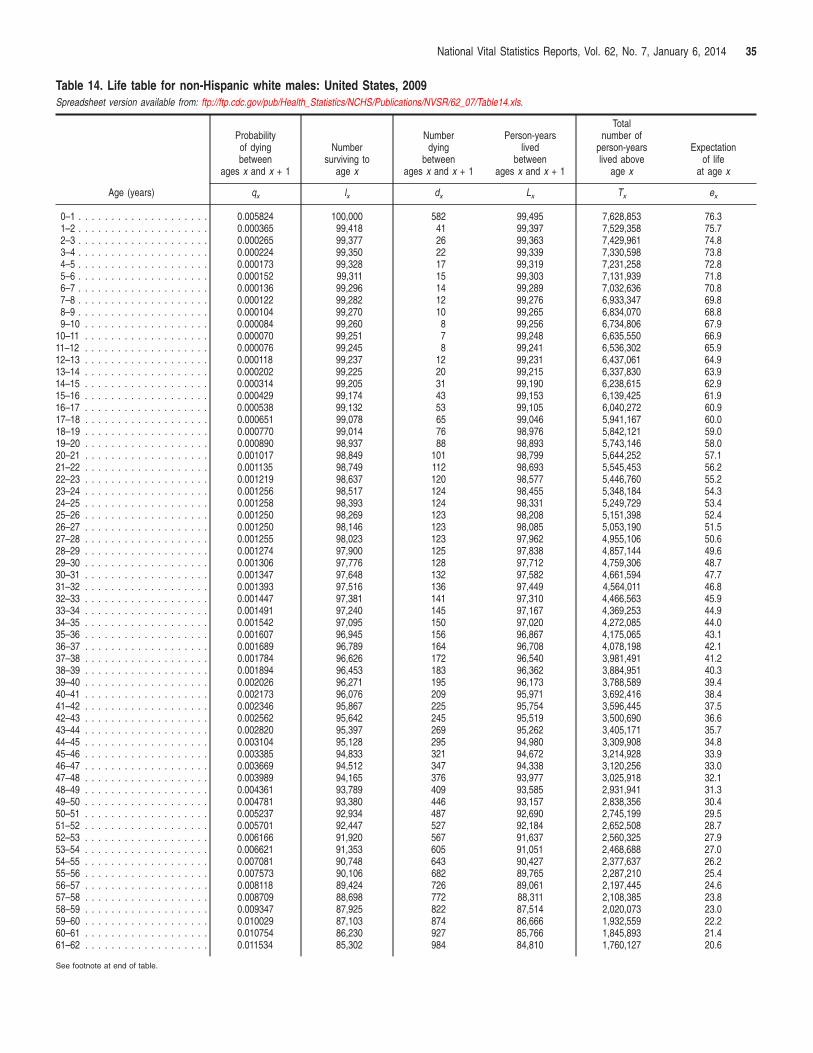
National Vital Statistics Reports, Vol. 62, No. 7, January 6, 2014 35
Table 14. Life table for non-Hispanic white males: United States, 2009 Spreadsheet version available from: ftp://ftp.cdc.gov/pub/Health_Statistics/NCHS/Publications/NVSR/62_07/Table14.xls.
Age (years)
Probability of dying between
ages x and x + 1
Number surviving to
age x
Number dying
between ages x and x + 1
Person-years lived
between ages x and x + 1
Total number of
person-years lived above
age x
Expectation of life
at age x
qx lx dx Lx Tx ex
0–1 . . . . . . . . . . . . . . . . . . . . 0.005824 100,000 582 99,495 7,628,853 76.3 1–2 . . . . . . . . . . . . . . . . . . . . 0.000365 99,418 41 99,397 7,529,358 75.7 2–3 . . . . . . . . . . . . . . . . . . . . 0.000265 99,377 26 99,363 7,429,961 74.8 3–4 . . . . . . . . . . . . . . . . . . . . 0.000224 99,350 22 99,339 7,330,598 73.8 4–5 . . . . . . . . . . . . . . . . . . . . 0.000173 99,328 17 99,319 7,231,258 72.8 5–6 . . . . . . . . . . . . . . . . . . . . 0.000152 99,311 15 99,303 7,131,939 71.8 6–7 . . . . . . . . . . . . . . . . . . . . 0.000136 99,296 14 99,289 7,032,636 70.8 7–8 . . . . . . . . . . . . . . . . . . . . 0.000122 99,282 12 99,276 6,933,347 69.8 8–9 . . . . . . . . . . . . . . . . . . . . 0.000104 99,270 10 99,265 6,834,070 68.8 9–10 . . . . . . . . . . . . . . . . . . . 0.000084 99,260 8 99,256 6,734,806 67.9
10–11 . . . . . . . . . . . . . . . . . . . 0.000070 99,251 7 99,248 6,635,550 66.9 11–12 . . . . . . . . . . . . . . . . . . . 0.000076 99,245 8 99,241 6,536,302 65.9 12–13 . . . . . . . . . . . . . . . . . . . 0.000118 99,237 12 99,231 6,437,061 64.9 13–14 . . . . . . . . . . . . . . . . . . . 0.000202 99,225 20 99,215 6,337,830 63.9 14–15 . . . . . . . . . . . . . . . . . . . 0.000314 99,205 31 99,190 6,238,615 62.9 15–16 . . . . . . . . . . . . . . . . . . . 0.000429 99,174 43 99,153 6,139,425 61.9 16–17 . . . . . . . . . . . . . . . . . . . 0.000538 99,132 53 99,105 6,040,272 60.9 17–18 . . . . . . . . . . . . . . . . . . . 0.000651 99,078 65 99,046 5,941,167 60.0 18–19 . . . . . . . . . . . . . . . . . . . 0.000770 99,014 76 98,976 5,842,121 59.0 19–20 . . . . . . . . . . . . . . . . . . . 0.000890 98,937 88 98,893 5,743,146 58.0 20–21 . . . . . . . . . . . . . . . . . . . 0.001017 98,849 101 98,799 5,644,252 57.1 21–22 . . . . . . . . . . . . . . . . . . . 0.001135 98,749 112 98,693 5,545,453 56.2 22–23 . . . . . . . . . . . . . . . . . . . 0.001219 98,637 120 98,577 5,446,760 55.2 23–24 . . . . . . . . . . . . . . . . . . . 0.001256 98,517 124 98,455 5,348,184 54.3 24–25 . . . . . . . . . . . . . . . . . . . 0.001258 98,393 124 98,331 5,249,729 53.4 25–26 . . . . . . . . . . . . . . . . . . . 0.001250 98,269 123 98,208 5,151,398 52.4 26–27 . . . . . . . . . . . . . . . . . . . 0.001250 98,146 123 98,085 5,053,190 51.5 27–28 . . . . . . . . . . . . . . . . . . . 0.001255 98,023 123 97,962 4,955,106 50.6 28–29 . . . . . . . . . . . . . . . . . . . 0.001274 97,900 125 97,838 4,857,144 49.6 29–30 . . . . . . . . . . . . . . . . . . . 0.001306 97,776 128 97,712 4,759,306 48.7 30–31 . . . . . . . . . . . . . . . . . . . 0.001347 97,648 132 97,582 4,661,594 47.7 31–32 . . . . . . . . . . . . . . . . . . . 0.001393 97,516 136 97,449 4,564,011 46.8 32–33 . . . . . . . . . . . . . . . . . . . 0.001447 97,381 141 97,310 4,466,563 45.9 33–34 . . . . . . . . . . . . . . . . . . . 0.001491 97,240 145 97,167 4,369,253 44.9 34–35 . . . . . . . . . . . . . . . . . . . 0.001542 97,095 150 97,020 4,272,085 44.0 35–36 . . . . . . . . . . . . . . . . . . . 0.001607 96,945 156 96,867 4,175,065 43.1 36–37 . . . . . . . . . . . . . . . . . . . 0.001689 96,789 164 96,708 4,078,198 42.1 37–38 . . . . . . . . . . . . . . . . . . . 0.001784 96,626 172 96,540 3,981,491 41.2 38–39 . . . . . . . . . . . . . . . . . . . 0.001894 96,453 183 96,362 3,884,951 40.3 39–40 . . . . . . . . . . . . . . . . . . . 0.002026 96,271 195 96,173 3,788,589 39.4 40–41 . . . . . . . . . . . . . . . . . . . 0.002173 96,076 209 95,971 3,692,416 38.4 41–42 . . . . . . . . . . . . . . . . . . . 0.002346 95,867 225 95,754 3,596,445 37.5 42–43 . . . . . . . . . . . . . . . . . . . 0.002562 95,642 245 95,519 3,500,690 36.6 43–44 . . . . . . . . . . . . . . . . . . . 0.002820 95,397 269 95,262 3,405,171 35.7 44–45 . . . . . . . . . . . . . . . . . . . 0.003104 95,128 295 94,980 3,309,908 34.8 45–46 . . . . . . . . . . . . . . . . . . . 0.003385 94,833 321 94,672 3,214,928 33.9 46–47 . . . . . . . . . . . . . . . . . . . 0.003669 94,512 347 94,338 3,120,256 33.0 47–48 . . . . . . . . . . . . . . . . . . . 0.003989 94,165 376 93,977 3,025,918 32.1 48–49 . . . . . . . . . . . . . . . . . . . 0.004361 93,789 409 93,585 2,931,941 31.3 49–50 . . . . . . . . . . . . . . . . . . . 0.004781 93,380 446 93,157 2,838,356 30.4 50–51 . . . . . . . . . . . . . . . . . . . 0.005237 92,934 487 92,690 2,745,199 29.5 51–52 . . . . . . . . . . . . . . . . . . . 0.005701 92,447 527 92,184 2,652,508 28.7 52–53 . . . . . . . . . . . . . . . . . . . 0.006166 91,920 567 91,637 2,560,325 27.9 53–54 . . . . . . . . . . . . . . . . . . . 0.006621 91,353 605 91,051 2,468,688 27.0 54–55 . . . . . . . . . . . . . . . . . . . 0.007081 90,748 643 90,427 2,377,637 26.2 55–56 . . . . . . . . . . . . . . . . . . . 0.007573 90,106 682 89,765 2,287,210 25.4 56–57 . . . . . . . . . . . . . . . . . . . 0.008118 89,424 726 89,061 2,197,445 24.6 57–58 . . . . . . . . . . . . . . . . . . . 0.008709 88,698 772 88,311 2,108,385 23.8 58–59 . . . . . . . . . . . . . . . . . . . 0.009347 87,925 822 87,514 2,020,073 23.0 59–60 . . . . . . . . . . . . . . . . . . . 0.010029 87,103 874 86,666 1,932,559 22.2 60–61 . . . . . . . . . . . . . . . . . . . 0.010754 86,230 927 85,766 1,845,893 21.4 61–62 . . . . . . . . . . . . . . . . . . . 0.011534 85,302 984 84,810 1,760,127 20.6
See footnote at end of table.
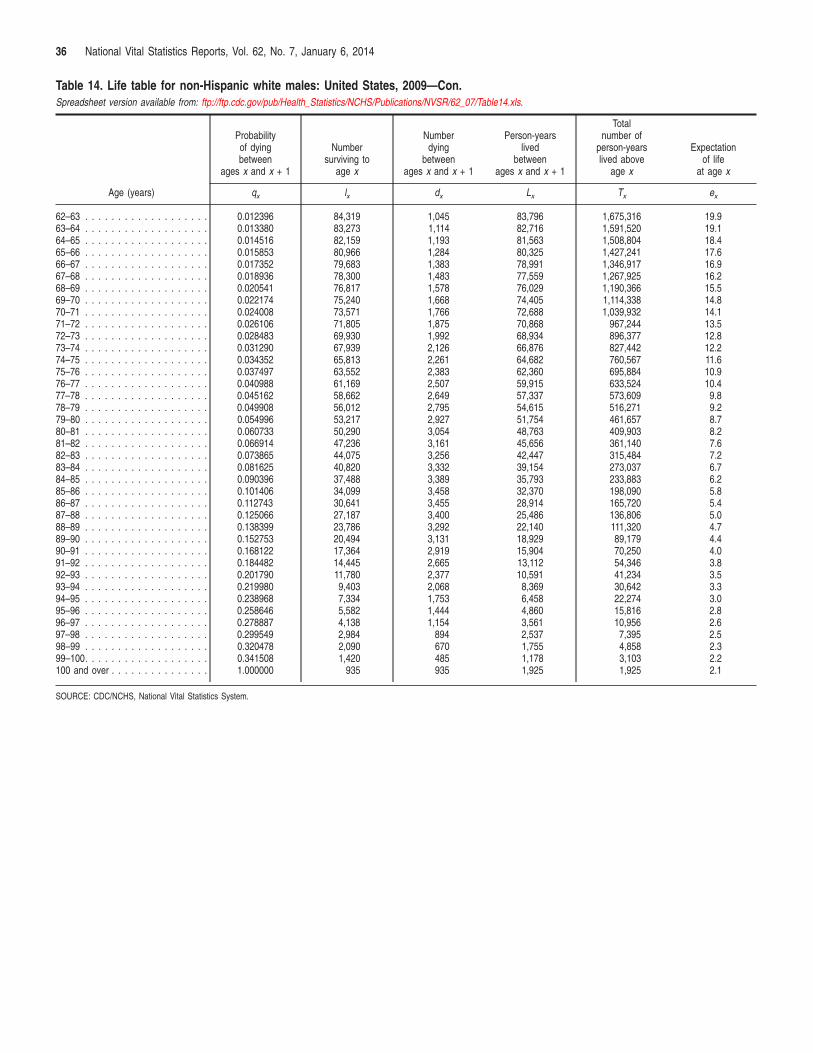
36 National Vital Statistics Reports, Vol. 62, No. 7, January 6, 2014
Table 14. Life table for non-Hispanic white males: United States, 2009—Con. Spreadsheet version available from: ftp://ftp.cdc.gov/pub/Health_Statistics/NCHS/Publications/NVSR/62_07/Table14.xls.
Age (years)
Probability of dying between
ages x and x + 1
Number surviving to
age x
Number dying
between ages x and x + 1
Person-years lived
between ages x and x + 1
Total number of
person-years lived above
age x
Expectation of life
at age x
qx lx dx Lx Tx ex
62–63 . . . . . . . . . . . . . . . . . . . 0.012396 84,319 1,045 83,796 1,675,316 19.9 63–64 . . . . . . . . . . . . . . . . . . . 0.013380 83,273 1,114 82,716 1,591,520 19.1 64–65 . . . . . . . . . . . . . . . . . . . 0.014516 82,159 1,193 81,563 1,508,804 18.4 65–66 . . . . . . . . . . . . . . . . . . . 0.015853 80,966 1,284 80,325 1,427,241 17.6 66–67 . . . . . . . . . . . . . . . . . . . 0.017352 79,683 1,383 78,991 1,346,917 16.9 67–68 . . . . . . . . . . . . . . . . . . . 0.018936 78,300 1,483 77,559 1,267,925 16.2 68–69 . . . . . . . . . . . . . . . . . . . 0.020541 76,817 1,578 76,029 1,190,366 15.5 69–70 . . . . . . . . . . . . . . . . . . . 0.022174 75,240 1,668 74,405 1,114,338 14.8 70–71 . . . . . . . . . . . . . . . . . . . 0.024008 73,571 1,766 72,688 1,039,932 14.1 71–72 . . . . . . . . . . . . . . . . . . . 0.026106 71,805 1,875 70,868 967,244 13.5 72–73 . . . . . . . . . . . . . . . . . . . 0.028483 69,930 1,992 68,934 896,377 12.8 73–74 . . . . . . . . . . . . . . . . . . . 0.031290 67,939 2,126 66,876 827,442 12.2 74–75 . . . . . . . . . . . . . . . . . . . 0.034352 65,813 2,261 64,682 760,567 11.6 75–76 . . . . . . . . . . . . . . . . . . . 0.037497 63,552 2,383 62,360 695,884 10.9 76–77 . . . . . . . . . . . . . . . . . . . 0.040988 61,169 2,507 59,915 633,524 10.4 77–78 . . . . . . . . . . . . . . . . . . . 0.045162 58,662 2,649 57,337 573,609 9.8 78–79 . . . . . . . . . . . . . . . . . . . 0.049908 56,012 2,795 54,615 516,271 9.2 79–80 . . . . . . . . . . . . . . . . . . . 0.054996 53,217 2,927 51,754 461,657 8.7 80–81 . . . . . . . . . . . . . . . . . . . 0.060733 50,290 3,054 48,763 409,903 8.2 81–82 . . . . . . . . . . . . . . . . . . . 0.066914 47,236 3,161 45,656 361,140 7.6 82–83 . . . . . . . . . . . . . . . . . . . 0.073865 44,075 3,256 42,447 315,484 7.2 83–84 . . . . . . . . . . . . . . . . . . . 0.081625 40,820 3,332 39,154 273,037 6.7 84–85 . . . . . . . . . . . . . . . . . . . 0.090396 37,488 3,389 35,793 233,883 6.2 85–86 . . . . . . . . . . . . . . . . . . . 0.101406 34,099 3,458 32,370 198,090 5.8 86–87 . . . . . . . . . . . . . . . . . . . 0.112743 30,641 3,455 28,914 165,720 5.4 87–88 . . . . . . . . . . . . . . . . . . . 0.125066 27,187 3,400 25,486 136,806 5.0 88–89 . . . . . . . . . . . . . . . . . . . 0.138399 23,786 3,292 22,140 111,320 4.7 89–90 . . . . . . . . . . . . . . . . . . . 0.152753 20,494 3,131 18,929 89,179 4.4 90–91 . . . . . . . . . . . . . . . . . . . 0.168122 17,364 2,919 15,904 70,250 4.0 91–92 . . . . . . . . . . . . . . . . . . . 0.184482 14,445 2,665 13,112 54,346 3.8 92–93 . . . . . . . . . . . . . . . . . . . 0.201790 11,780 2,377 10,591 41,234 3.5 93–94 . . . . . . . . . . . . . . . . . . . 0.219980 9,403 2,068 8,369 30,642 3.3 94–95 . . . . . . . . . . . . . . . . . . . 0.238968 7,334 1,753 6,458 22,274 3.0 95–96 . . . . . . . . . . . . . . . . . . . 0.258646 5,582 1,444 4,860 15,816 2.8 96–97 . . . . . . . . . . . . . . . . . . . 0.278887 4,138 1,154 3,561 10,956 2.6 97–98 . . . . . . . . . . . . . . . . . . . 0.299549 2,984 894 2,537 7,395 2.5 98–99 . . . . . . . . . . . . . . . . . . . 0.320478 2,090 670 1,755 4,858 2.3 99–100. . . . . . . . . . . . . . . . . . . 0.341508 1,420 485 1,178 3,103 2.2 100 and over . . . . . . . . . . . . . . . 1.000000 935 935 1,925 1,925 2.1
SOURCE: CDC/NCHS, National Vital Statistics System.

National Vital Statistics Reports, Vol. 62, No. 7, January 6, 2014 37
Table 15. Life table for non-Hispanic white females: United States, 2009 Spreadsheet version available from: ftp://ftp.cdc.gov/pub/Health_Statistics/NCHS/Publications/NVSR/62_07/Table15.xls.
Age (years)
Probability of dying between
ages x and x + 1
Number surviving to
age x
Number dying
between ages x and x + 1
Person-years lived
between ages x and x + 1
Total number of
person-years lived above
age x
Expectation of life
at age x
qx lx dx Lx Tx ex
0–1 . . . . . . . . . . . . . . . . . . . . 0.004769 100,000 477 99,582 8,105,843 81.1 1–2 . . . . . . . . . . . . . . . . . . . . 0.000315 99,523 31 99,507 8,006,261 80.4 2–3 . . . . . . . . . . . . . . . . . . . . 0.000224 99,492 22 99,481 7,906,754 79.5 3–4 . . . . . . . . . . . . . . . . . . . . 0.000162 99,470 16 99,461 7,906,754 78.5 4–5 . . . . . . . . . . . . . . . . . . . . 0.000132 99,453 13 99,447 7,707,811 77.5 5–6 . . . . . . . . . . . . . . . . . . . . 0.000113 99,440 11 99,435 7,608,365 76.5 6–7 . . . . . . . . . . . . . . . . . . . . 0.000099 99,429 10 99,424 7,508,930 75.5 7–8 . . . . . . . . . . . . . . . . . . . . 0.000090 99,419 9 99,415 7,409,506 74.5 8–9 . . . . . . . . . . . . . . . . . . . . 0.000082 99,410 8 99,406 7,310,091 73.5 9–10 . . . . . . . . . . . . . . . . . . . 0.000075 99,402 7 99,398 7,210,685 72.5
10–11 . . . . . . . . . . . . . . . . . . . 0.000072 99,395 7 99,391 7,111,287 71.5 11–12 . . . . . . . . . . . . . . . . . . . 0.000079 99,387 8 99,384 7,011,896 70.6 12–13 . . . . . . . . . . . . . . . . . . . 0.000100 99,380 10 99,375 6,912,512 69.6 13–14 . . . . . . . . . . . . . . . . . . . 0.000139 99,370 14 99,363 6,813,138 68.6 14–15 . . . . . . . . . . . . . . . . . . . 0.000187 99,356 19 99,347 6,713,775 67.6 15–16 . . . . . . . . . . . . . . . . . . . 0.000241 99,337 24 99,325 6,614,428 66.6 16–17 . . . . . . . . . . . . . . . . . . . 0.000290 99,313 29 99,299 6,515,103 65.6 17–18 . . . . . . . . . . . . . . . . . . . 0.000330 99,285 33 99,268 6,415,804 64.6 18–19 . . . . . . . . . . . . . . . . . . . 0.000357 99,252 35 99,234 6,316,536 63.6 19–20 . . . . . . . . . . . . . . . . . . . 0.000376 99,216 37 99,198 6,217,302 62.7 20–21 . . . . . . . . . . . . . . . . . . . 0.000393 99,179 39 99,160 6,118,104 61.7 21–22 . . . . . . . . . . . . . . . . . . . 0.000414 99,140 41 99,120 6,018,945 60.7 22–23 . . . . . . . . . . . . . . . . . . . 0.000436 99,099 43 99,077 5,919,825 59.7 23–24 . . . . . . . . . . . . . . . . . . . 0.000460 99,056 46 99,033 5,820,748 58.8 24–25 . . . . . . . . . . . . . . . . . . . 0.000486 99,010 48 98,986 5,721,715 57.8 25–26 . . . . . . . . . . . . . . . . . . . 0.000513 98,962 51 98,937 5,622,729 56.8 26–27 . . . . . . . . . . . . . . . . . . . 0.000541 98,911 54 98,884 5,523,792 55.8 27–28 . . . . . . . . . . . . . . . . . . . 0.000570 98,858 56 98,830 5,424,908 54.9 28–29 . . . . . . . . . . . . . . . . . . . 0.000600 98,801 59 98,772 5,326,078 53.9 29–30 . . . . . . . . . . . . . . . . . . . 0.000635 98,742 63 98,711 5,227,306 52.9 30–31 . . . . . . . . . . . . . . . . . . . 0.000678 98,679 67 98,646 5,128,596 52.0 31–32 . . . . . . . . . . . . . . . . . . . 0.000728 98,613 72 98,577 5,029,950 51.0 32–33 . . . . . . . . . . . . . . . . . . . 0.000777 98,541 77 98,503 4,931,373 50.0 33–34 . . . . . . . . . . . . . . . . . . . 0.000821 98,464 81 98,424 4,832,870 49.1 34–35 . . . . . . . . . . . . . . . . . . . 0.000862 98,383 85 98,341 4,734,447 48.1 35–36 . . . . . . . . . . . . . . . . . . . 0.000909 98,299 89 98,254 4,636,106 47.2 36–37 . . . . . . . . . . . . . . . . . . . 0.000968 98,209 95 98,162 4,537,852 46.2 37–38 . . . . . . . . . . . . . . . . . . . 0.001038 98,114 102 98,063 4,439,690 45.3 38–39 . . . . . . . . . . . . . . . . . . . 0.001124 98,012 110 97,957 4,341,626 44.3 39–40 . . . . . . . . . . . . . . . . . . . 0.001226 97,902 120 97,842 4,243,669 43.3 40–41 . . . . . . . . . . . . . . . . . . . 0.001337 97,782 131 97,717 4,145,826 42.4 41–42 . . . . . . . . . . . . . . . . . . . 0.001461 97,652 143 97,580 4,048,110 41.5 42–43 . . . . . . . . . . . . . . . . . . . 0.001607 97,509 157 97,431 3,950,529 40.5 43–44 . . . . . . . . . . . . . . . . . . . 0.001773 97,352 173 97,266 3,853,099 39.6 44–45 . . . . . . . . . . . . . . . . . . . 0.001950 97,180 190 97,085 3,755,833 38.6 45–46 . . . . . . . . . . . . . . . . . . . 0.002124 96,990 206 96,887 3,658,748 37.7 46–47 . . . . . . . . . . . . . . . . . . . 0.002297 96,784 222 96,673 3,561,861 36.8 47–48 . . . . . . . . . . . . . . . . . . . 0.002483 96,562 240 96,442 3,465,188 35.9 48–49 . . . . . . . . . . . . . . . . . . . 0.002692 96,322 259 96,192 3,368,746 35.0 49–50 . . . . . . . . . . . . . . . . . . . 0.002923 96,063 281 95,922 3,272,554 34.1 50–51 . . . . . . . . . . . . . . . . . . . 0.003179 95,782 305 95,630 3,176,631 33.2 51–52 . . . . . . . . . . . . . . . . . . . 0.003443 95,478 329 95,313 3,081,001 32.3 52–53 . . . . . . . . . . . . . . . . . . . 0.003698 95,149 352 94,973 2,985,688 31.4 53–54 . . . . . . . . . . . . . . . . . . . 0.003935 94,797 373 94,610 2,890,716 30.5 54–55 . . . . . . . . . . . . . . . . . . . 0.004169 94,424 394 94,227 2,796,105 29.6 55–56 . . . . . . . . . . . . . . . . . . . 0.004416 94,030 415 93,823 2,701,878 28.7 56–57 . . . . . . . . . . . . . . . . . . . 0.004706 93,615 441 93,395 2,608,055 27.9 57–58 . . . . . . . . . . . . . . . . . . . 0.005067 93,174 472 92,938 2,514,661 27.0 58–59 . . . . . . . . . . . . . . . . . . . 0.005516 92,702 511 92,447 2,421,722 26.1 59–60 . . . . . . . . . . . . . . . . . . . 0.006039 92,191 557 91,913 2,329,276 25.3 60–61 . . . . . . . . . . . . . . . . . . . 0.006619 91,634 607 91,331 2,237,363 24.4 61–62 . . . . . . . . . . . . . . . . . . . 0.007234 91,028 658 90,698 2,146,032 23.6
See footnote at end of table.
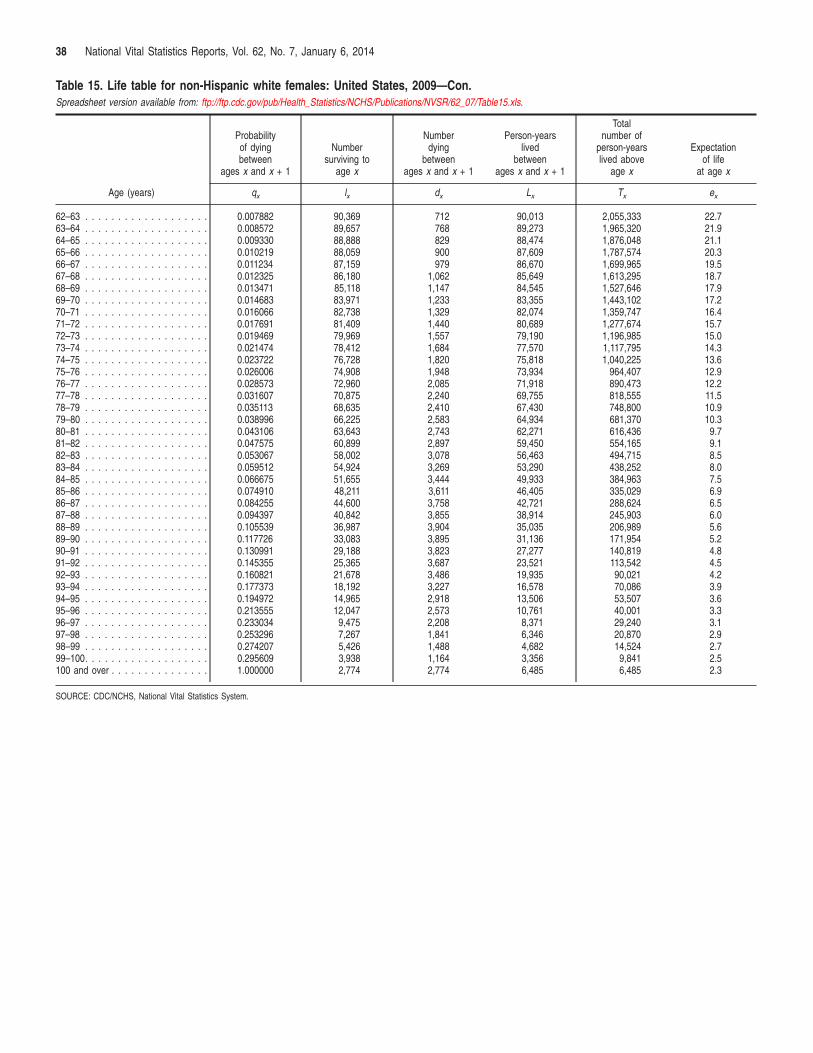
38 National Vital Statistics Reports, Vol. 62, No. 7, January 6, 2014
Table 15. Life table for non-Hispanic white females: United States, 2009—Con. Spreadsheet version available from: ftp://ftp.cdc.gov/pub/Health_Statistics/NCHS/Publications/NVSR/62_07/Table15.xls.
Age (years)
Probability of dying between
ages x and x + 1
Number surviving to
age x
Number dying
between ages x and x + 1
Person-years lived
between ages x and x + 1
Total number of
person-years lived above
age x
Expectation of life
at age x
qx lx dx Lx Tx ex
62–63 . . . . . . . . . . . . . . . . . . . 0.007882 90,369 712 90,013 2,055,333 22.7 63–64 . . . . . . . . . . . . . . . . . . . 0.008572 89,657 768 89,273 1,965,320 21.9 64–65 . . . . . . . . . . . . . . . . . . . 0.009330 88,888 829 88,474 1,876,048 21.1 65–66 . . . . . . . . . . . . . . . . . . . 0.010219 88,059 900 87,609 1,787,574 20.3 66–67 . . . . . . . . . . . . . . . . . . . 0.011234 87,159 979 86,670 1,699,965 19.5 67–68 . . . . . . . . . . . . . . . . . . . 0.012325 86,180 1,062 85,649 1,613,295 18.7 68–69 . . . . . . . . . . . . . . . . . . . 0.013471 85,118 1,147 84,545 1,527,646 17.9 69–70 . . . . . . . . . . . . . . . . . . . 0.014683 83,971 1,233 83,355 1,443,102 17.2 70–71 . . . . . . . . . . . . . . . . . . . 0.016066 82,738 1,329 82,074 1,359,747 16.4 71–72 . . . . . . . . . . . . . . . . . . . 0.017691 81,409 1,440 80,689 1,277,674 15.7 72–73 . . . . . . . . . . . . . . . . . . . 0.019469 79,969 1,557 79,190 1,196,985 15.0 73–74 . . . . . . . . . . . . . . . . . . . 0.021474 78,412 1,684 77,570 1,117,795 14.3 74–75 . . . . . . . . . . . . . . . . . . . 0.023722 76,728 1,820 75,818 1,040,225 13.6 75–76 . . . . . . . . . . . . . . . . . . . 0.026006 74,908 1,948 73,934 964,407 12.9 76–77 . . . . . . . . . . . . . . . . . . . 0.028573 72,960 2,085 71,918 890,473 12.2 77–78 . . . . . . . . . . . . . . . . . . . 0.031607 70,875 2,240 69,755 818,555 11.5 78–79 . . . . . . . . . . . . . . . . . . . 0.035113 68,635 2,410 67,430 748,800 10.9 79–80 . . . . . . . . . . . . . . . . . . . 0.038996 66,225 2,583 64,934 681,370 10.3 80–81 . . . . . . . . . . . . . . . . . . . 0.043106 63,643 2,743 62,271 616,436 9.7 81–82 . . . . . . . . . . . . . . . . . . . 0.047575 60,899 2,897 59,450 554,165 9.1 82–83 . . . . . . . . . . . . . . . . . . . 0.053067 58,002 3,078 56,463 494,715 8.5 83–84 . . . . . . . . . . . . . . . . . . . 0.059512 54,924 3,269 53,290 438,252 8.0 84–85 . . . . . . . . . . . . . . . . . . . 0.066675 51,655 3,444 49,933 384,963 7.5 85–86 . . . . . . . . . . . . . . . . . . . 0.074910 48,211 3,611 46,405 335,029 6.9 86–87 . . . . . . . . . . . . . . . . . . . 0.084255 44,600 3,758 42,721 288,624 6.5 87–88 . . . . . . . . . . . . . . . . . . . 0.094397 40,842 3,855 38,914 245,903 6.0 88–89 . . . . . . . . . . . . . . . . . . . 0.105539 36,987 3,904 35,035 206,989 5.6 89–90 . . . . . . . . . . . . . . . . . . . 0.117726 33,083 3,895 31,136 171,954 5.2 90–91 . . . . . . . . . . . . . . . . . . . 0.130991 29,188 3,823 27,277 140,819 4.8 91–92 . . . . . . . . . . . . . . . . . . . 0.145355 25,365 3,687 23,521 113,542 4.5 92–93 . . . . . . . . . . . . . . . . . . . 0.160821 21,678 3,486 19,935 90,021 4.2 93–94 . . . . . . . . . . . . . . . . . . . 0.177373 18,192 3,227 16,578 70,086 3.9 94–95 . . . . . . . . . . . . . . . . . . . 0.194972 14,965 2,918 13,506 53,507 3.6 95–96 . . . . . . . . . . . . . . . . . . . 0.213555 12,047 2,573 10,761 40,001 3.3 96–97 . . . . . . . . . . . . . . . . . . . 0.233034 9,475 2,208 8,371 29,240 3.1 97–98 . . . . . . . . . . . . . . . . . . . 0.253296 7,267 1,841 6,346 20,870 2.9 98–99 . . . . . . . . . . . . . . . . . . . 0.274207 5,426 1,488 4,682 14,524 2.7 99–100. . . . . . . . . . . . . . . . . . . 0.295609 3,938 1,164 3,356 9,841 2.5 100 and over . . . . . . . . . . . . . . . 1.000000 2,774 2,774 6,485 6,485 2.3
SOURCE: CDC/NCHS, National Vital Statistics System.

National Vital Statistics Reports, Vol. 62, No. 7, January 6, 2014 39
Table 16. Life table for the non-Hispanic black population: United States, 2009 Spreadsheet version available from: ftp://ftp.cdc.gov/pub/Health_Statistics/NCHS/Publications/NVSR/62_07/Table16.xls.
Age (years)
Probability of dying between
ages x and x + 1
Number surviving to
age x
Number dying
between ages x and x + 1
Person-years lived
between ages x and x + 1
Total number of
person-years lived above
age x
Expectation of life
at age x
qx lx dx Lx Tx ex
0–1 . . . . . . . . . . . . . . . . . . . . 0.012368 100,000 1,237 98,919 7,420,036 74.2 1–2 . . . . . . . . . . . . . . . . . . . . 0.000681 98,763 67 98,730 7,321,116 74.1 2–3 . . . . . . . . . . . . . . . . . . . . 0.000443 98,696 44 98,674 7,222,387 73.2 3–4 . . . . . . . . . . . . . . . . . . . . 0.000327 98,652 32 98,636 7,123,713 72.2 4–5 . . . . . . . . . . . . . . . . . . . . 0.000255 98,620 25 98,607 7,025,077 71.2 5–6 . . . . . . . . . . . . . . . . . . . . 0.000238 98,595 23 98,583 6,926,469 70.3 6–7 . . . . . . . . . . . . . . . . . . . . 0.000211 98,571 21 98,561 6,827,886 69.3 7–8 . . . . . . . . . . . . . . . . . . . . 0.000190 98,551 19 98,541 6,729,325 68.3 8–9 . . . . . . . . . . . . . . . . . . . . 0.000169 98,532 17 98,524 6,630,784 67.3 9–10 . . . . . . . . . . . . . . . . . . . 0.000150 98,515 15 98,508 6,532,260 66.3
10–11 . . . . . . . . . . . . . . . . . . . 0.000139 98,500 14 98,494 6,433,753 65.3 11–12 . . . . . . . . . . . . . . . . . . . 0.000150 98,487 15 98,479 6,335,259 64.3 12–13 . . . . . . . . . . . . . . . . . . . 0.000197 98,472 19 98,462 6,236,780 63.3 13–14 . . . . . . . . . . . . . . . . . . . 0.000285 98,452 28 98,438 6,138,318 62.3 14–15 . . . . . . . . . . . . . . . . . . . 0.000399 98,424 39 98,405 6,039,879 61.4 15–16 . . . . . . . . . . . . . . . . . . . 0.000513 98,385 50 98,360 5,941,474 60.4 16–17 . . . . . . . . . . . . . . . . . . . 0.000619 98,335 61 98,304 5,843,114 59.4 17–18 . . . . . . . . . . . . . . . . . . . 0.000727 98,274 71 98,238 5,744,810 58.5 18–19 . . . . . . . . . . . . . . . . . . . 0.000839 98,202 82 98,161 5,646,572 57.5 19–20 . . . . . . . . . . . . . . . . . . . 0.000958 98,120 94 98,073 5,548,411 56.5 20–21 . . . . . . . . . . . . . . . . . . . 0.001091 98,026 107 97,973 5,450,338 55.6 21–22 . . . . . . . . . . . . . . . . . . . 0.001222 97,919 120 97,859 5,352,365 54.7 22–23 . . . . . . . . . . . . . . . . . . . 0.001323 97,800 129 97,735 5,254,506 53.7 23–24 . . . . . . . . . . . . . . . . . . . 0.001377 97,670 135 97,603 5,156,771 52.8 24–25 . . . . . . . . . . . . . . . . . . . 0.001394 97,536 136 97,468 5,059,168 51.9 25–26 . . . . . . . . . . . . . . . . . . . 0.001401 97,400 136 97,331 4,961,700 50.9 26–27 . . . . . . . . . . . . . . . . . . . 0.001416 97,263 138 97,194 4,864,369 50.0 27–28 . . . . . . . . . . . . . . . . . . . 0.001441 97,125 140 97,055 4,767,175 49.1 28–29 . . . . . . . . . . . . . . . . . . . 0.001484 96,985 144 96,914 4,670,119 48.2 29–30 . . . . . . . . . . . . . . . . . . . 0.001545 96,842 150 96,767 4,573,206 47.2 30–31 . . . . . . . . . . . . . . . . . . . 0.001619 96,692 157 96,614 4,476,439 46.3 31–32 . . . . . . . . . . . . . . . . . . . 0.001699 96,535 164 96,453 4,379,825 45.4 32–33 . . . . . . . . . . . . . . . . . . . 0.001799 96,371 173 96,285 4,283,372 44.4 33–34 . . . . . . . . . . . . . . . . . . . 0.001862 96,198 179 96,108 4,187,087 43.5 34–35 . . . . . . . . . . . . . . . . . . . 0.001941 96,019 186 95,926 4,090,979 42.6 35–36 . . . . . . . . . . . . . . . . . . . 0.002030 95,832 195 95,735 3,995,053 41.7 36–37 . . . . . . . . . . . . . . . . . . . 0.002139 95,638 205 95,536 3,899,318 40.8 37–38 . . . . . . . . . . . . . . . . . . . 0.002272 95,433 217 95,325 3,803,782 39.9 38–39 . . . . . . . . . . . . . . . . . . . 0.002437 95,217 232 95,101 3,708,457 38.9 39–40 . . . . . . . . . . . . . . . . . . . 0.002635 94,985 250 94,859 3,613,357 38.0 40–41 . . . . . . . . . . . . . . . . . . . 0.002859 94,734 271 94,599 3,518,497 37.1 41–42 . . . . . . . . . . . . . . . . . . . 0.003108 94,463 294 94,317 3,423,899 36.2 42–43 . . . . . . . . . . . . . . . . . . . 0.003386 94,170 319 94,010 3,329,582 35.4 43–44 . . . . . . . . . . . . . . . . . . . 0.003686 93,851 346 93,678 3,235,572 34.5 44–45 . . . . . . . . . . . . . . . . . . . 0.004003 93,505 374 93,318 3,141,894 33.6 45–46 . . . . . . . . . . . . . . . . . . . 0.004317 93,131 402 92,930 3,048,576 32.7 46–47 . . . . . . . . . . . . . . . . . . . 0.004653 92,729 432 92,513 2,955,646 31.9 47–48 . . . . . . . . . . . . . . . . . . . 0.005065 92,297 468 92,063 2,863,133 31.0 48–49 . . . . . . . . . . . . . . . . . . . 0.005586 91,830 513 91,573 2,771,070 30.2 49–50 . . . . . . . . . . . . . . . . . . . 0.006204 91,317 567 91,034 2,679,496 29.3 50–51 . . . . . . . . . . . . . . . . . . . 0.006876 90,750 624 90,438 2,588,463 28.5 51–52 . . . . . . . . . . . . . . . . . . . 0.007564 90,126 682 89,785 2,498,024 27.7 52–53 . . . . . . . . . . . . . . . . . . . 0.008277 89,445 740 89,074 2,408,239 26.9 53–54 . . . . . . . . . . . . . . . . . . . 0.009003 88,704 799 88,305 2,319,165 26.1 54–55 . . . . . . . . . . . . . . . . . . . 0.009749 87,906 857 87,477 2,230,860 25.4 55–56 . . . . . . . . . . . . . . . . . . . 0.010561 87,049 919 86,589 2,143,382 24.6 56–57 . . . . . . . . . . . . . . . . . . . 0.011430 86,129 984 85,637 2,056,793 23.9 57–58 . . . . . . . . . . . . . . . . . . . 0.012294 85,145 1,047 84,622 1,971,156 23.2 58–59 . . . . . . . . . . . . . . . . . . . 0.013126 84,098 1,104 83,546 1,886,535 22.4 59–60 . . . . . . . . . . . . . . . . . . . 0.013948 82,994 1,158 82,416 1,802,988 21.7 60–61 . . . . . . . . . . . . . . . . . . . 0.014824 81,837 1,213 81,230 1,720,573 21.0 61–62 . . . . . . . . . . . . . . . . . . . 0.015796 80,624 1,274 79,987 1,639,343 20.3
See footnote at end of table.
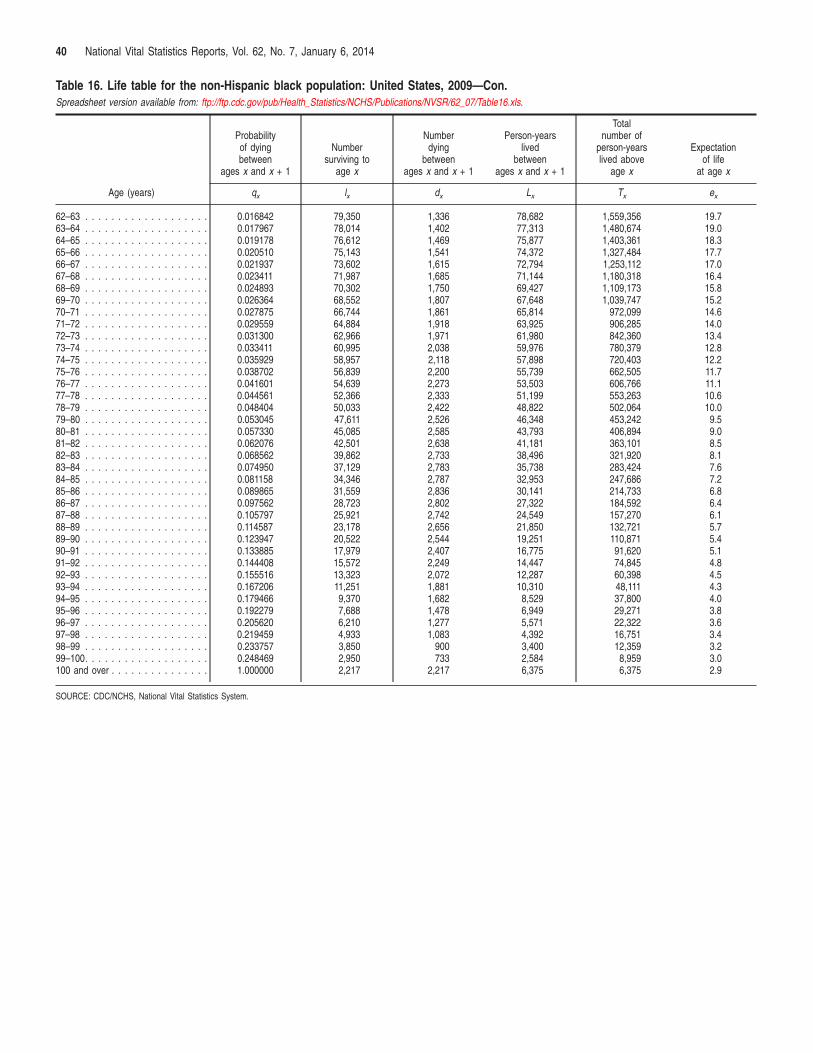
40 National Vital Statistics Reports, Vol. 62, No. 7, January 6, 2014
Table 16. Life table for the non-Hispanic black population: United States, 2009—Con. Spreadsheet version available from: ftp://ftp.cdc.gov/pub/Health_Statistics/NCHS/Publications/NVSR/62_07/Table16.xls.
Age (years)
Probability of dying between
ages x and x + 1
Number surviving to
age x
Number dying
between ages x and x + 1
Person-years lived
between ages x and x + 1
Total number of
person-years lived above
age x
Expectation of life
at age x
qx lx dx Lx Tx ex
62–63 . . . . . . . . . . . . . . . . . . . 0.016842 79,350 1,336 78,682 1,559,356 19.7 63–64 . . . . . . . . . . . . . . . . . . . 0.017967 78,014 1,402 77,313 1,480,674 19.0 64–65 . . . . . . . . . . . . . . . . . . . 0.019178 76,612 1,469 75,877 1,403,361 18.3 65–66 . . . . . . . . . . . . . . . . . . . 0.020510 75,143 1,541 74,372 1,327,484 17.7 66–67 . . . . . . . . . . . . . . . . . . . 0.021937 73,602 1,615 72,794 1,253,112 17.0 67–68 . . . . . . . . . . . . . . . . . . . 0.023411 71,987 1,685 71,144 1,180,318 16.4 68–69 . . . . . . . . . . . . . . . . . . . 0.024893 70,302 1,750 69,427 1,109,173 15.8 69–70 . . . . . . . . . . . . . . . . . . . 0.026364 68,552 1,807 67,648 1,039,747 15.2 70–71 . . . . . . . . . . . . . . . . . . . 0.027875 66,744 1,861 65,814 972,099 14.6 71–72 . . . . . . . . . . . . . . . . . . . 0.029559 64,884 1,918 63,925 906,285 14.0 72–73 . . . . . . . . . . . . . . . . . . . 0.031300 62,966 1,971 61,980 842,360 13.4 73–74 . . . . . . . . . . . . . . . . . . . 0.033411 60,995 2,038 59,976 780,379 12.8 74–75 . . . . . . . . . . . . . . . . . . . 0.035929 58,957 2,118 57,898 720,403 12.2 75–76 . . . . . . . . . . . . . . . . . . . 0.038702 56,839 2,200 55,739 662,505 11.7 76–77 . . . . . . . . . . . . . . . . . . . 0.041601 54,639 2,273 53,503 606,766 11.1 77–78 . . . . . . . . . . . . . . . . . . . 0.044561 52,366 2,333 51,199 553,263 10.6 78–79 . . . . . . . . . . . . . . . . . . . 0.048404 50,033 2,422 48,822 502,064 10.0 79–80 . . . . . . . . . . . . . . . . . . . 0.053045 47,611 2,526 46,348 453,242 9.5 80–81 . . . . . . . . . . . . . . . . . . . 0.057330 45,085 2,585 43,793 406,894 9.0 81–82 . . . . . . . . . . . . . . . . . . . 0.062076 42,501 2,638 41,181 363,101 8.5 82–83 . . . . . . . . . . . . . . . . . . . 0.068562 39,862 2,733 38,496 321,920 8.1 83–84 . . . . . . . . . . . . . . . . . . . 0.074950 37,129 2,783 35,738 283,424 7.6 84–85 . . . . . . . . . . . . . . . . . . . 0.081158 34,346 2,787 32,953 247,686 7.2 85–86 . . . . . . . . . . . . . . . . . . . 0.089865 31,559 2,836 30,141 214,733 6.8 86–87 . . . . . . . . . . . . . . . . . . . 0.097562 28,723 2,802 27,322 184,592 6.4 87–88 . . . . . . . . . . . . . . . . . . . 0.105797 25,921 2,742 24,549 157,270 6.1 88–89 . . . . . . . . . . . . . . . . . . . 0.114587 23,178 2,656 21,850 132,721 5.7 89–90 . . . . . . . . . . . . . . . . . . . 0.123947 20,522 2,544 19,251 110,871 5.4 90–91 . . . . . . . . . . . . . . . . . . . 0.133885 17,979 2,407 16,775 91,620 5.1 91–92 . . . . . . . . . . . . . . . . . . . 0.144408 15,572 2,249 14,447 74,845 4.8 92–93 . . . . . . . . . . . . . . . . . . . 0.155516 13,323 2,072 12,287 60,398 4.5 93–94 . . . . . . . . . . . . . . . . . . . 0.167206 11,251 1,881 10,310 48,111 4.3 94–95 . . . . . . . . . . . . . . . . . . . 0.179466 9,370 1,682 8,529 37,800 4.0 95–96 . . . . . . . . . . . . . . . . . . . 0.192279 7,688 1,478 6,949 29,271 3.8 96–97 . . . . . . . . . . . . . . . . . . . 0.205620 6,210 1,277 5,571 22,322 3.6 97–98 . . . . . . . . . . . . . . . . . . . 0.219459 4,933 1,083 4,392 16,751 3.4 98–99 . . . . . . . . . . . . . . . . . . . 0.233757 3,850 900 3,400 12,359 3.2 99–100. . . . . . . . . . . . . . . . . . . 0.248469 2,950 733 2,584 8,959 3.0 100 and over . . . . . . . . . . . . . . . 1.000000 2,217 2,217 6,375 6,375 2.9
SOURCE: CDC/NCHS, National Vital Statistics System.

National Vital Statistics Reports, Vol. 62, No. 7, January 6, 2014 41
Table 17. Life table for non-Hispanic black males: United States, 2009 Spreadsheet version available from: ftp://ftp.cdc.gov/pub/Health_Statistics/NCHS/Publications/NVSR/62_07/Table17.xls.
Age (years)
Probability of dying between
ages x and x + 1
Number surviving to
age x
Number dying
between ages x and x + 1
Person-years lived
between ages x and x + 1
Total number of
person-years lived above
age x
Expectation of life
at age x
qx lx dx Lx Tx ex
0–1 . . . . . . . . . . . . . . . . . . . . 0.013788 100,000 1,379 98,791 7,070,649 70.7 1–2 . . . . . . . . . . . . . . . . . . . . 0.000688 98,621 68 98,587 6,971,859 70.7 2–3 . . . . . . . . . . . . . . . . . . . . 0.000506 98,553 50 98,528 6,873,271 69.7 3–4 . . . . . . . . . . . . . . . . . . . . 0.000331 98,503 33 98,487 6,774,743 68.8 4–5 . . . . . . . . . . . . . . . . . . . . 0.000249 98,471 25 98,459 6,676,256 67.8 5–6 . . . . . . . . . . . . . . . . . . . . 0.000255 98,446 25 98,434 6,577,797 66.8 6–7 . . . . . . . . . . . . . . . . . . . . 0.000234 98,421 23 98,410 6,479,363 65.8 7–8 . . . . . . . . . . . . . . . . . . . . 0.000213 98,398 21 98,388 6,380,954 64.8 8–9 . . . . . . . . . . . . . . . . . . . . 0.000184 98,377 18 98,368 6,282,566 63.9 9–10 . . . . . . . . . . . . . . . . . . . 0.000149 98,359 15 98,352 6,184,198 62.9
10–11 . . . . . . . . . . . . . . . . . . . 0.000121 98,344 12 98,338 6,085,846 61.9 11–12 . . . . . . . . . . . . . . . . . . . 0.000129 98,333 13 98,326 5,987,508 60.9 12–13 . . . . . . . . . . . . . . . . . . . 0.000201 98,320 20 98,310 5,889,181 59.9 13–14 . . . . . . . . . . . . . . . . . . . 0.000349 98,300 34 98,283 5,790,871 58.9 14–15 . . . . . . . . . . . . . . . . . . . 0.000543 98,266 53 98,239 5,692,588 57.9 15–16 . . . . . . . . . . . . . . . . . . . 0.000738 98,212 73 98,176 5,594,349 57.0 16–17 . . . . . . . . . . . . . . . . . . . 0.000915 98,140 90 98,095 5,496,173 56.0 17–18 . . . . . . . . . . . . . . . . . . . 0.001089 98,050 107 97,997 5,398,078 55.1 18–19 . . . . . . . . . . . . . . . . . . . 0.001264 97,943 124 97,881 5,300,081 54.1 19–20 . . . . . . . . . . . . . . . . . . . 0.001443 97,820 141 97,749 5,202,200 53.2 20–21 . . . . . . . . . . . . . . . . . . . 0.001642 97,678 160 97,598 5,104,451 52.3 21–22 . . . . . . . . . . . . . . . . . . . 0.001837 97,518 179 97,428 5,006,853 51.3 22–23 . . . . . . . . . . . . . . . . . . . 0.001980 97,339 193 97,242 4,909,425 50.4 23–24 . . . . . . . . . . . . . . . . . . . 0.002042 97,146 198 97,047 4,812,182 49.5 24–25 . . . . . . . . . . . . . . . . . . . 0.002042 96,948 198 96,849 4,715,135 48.6 25–26 . . . . . . . . . . . . . . . . . . . 0.002019 96,750 195 96,652 4,618,287 47.7 26–27 . . . . . . . . . . . . . . . . . . . 0.002010 96,554 194 96,457 4,521,635 46.8 27–28 . . . . . . . . . . . . . . . . . . . 0.002020 96,360 195 96,263 4,425,177 45.9 28–29 . . . . . . . . . . . . . . . . . . . 0.002065 96,166 199 96,066 4,328,915 45.0 29–30 . . . . . . . . . . . . . . . . . . . 0.002143 95,967 206 95,864 4,232,848 44.1 30–31 . . . . . . . . . . . . . . . . . . . 0.002239 95,761 214 95,654 4,136,984 43.2 31–32 . . . . . . . . . . . . . . . . . . . 0.002337 95,547 223 95,435 4,041,330 42.3 32–33 . . . . . . . . . . . . . . . . . . . 0.002466 95,324 235 95,206 3,945,895 41.4 33–34 . . . . . . . . . . . . . . . . . . . 0.002518 95,089 239 94,969 3,850,689 40.5 34–35 . . . . . . . . . . . . . . . . . . . 0.002595 94,849 246 94,726 3,755,720 39.6 35–36 . . . . . . . . . . . . . . . . . . . 0.002682 94,603 254 94,476 3,660,994 38.7 36–37 . . . . . . . . . . . . . . . . . . . 0.002794 94,349 264 94,217 3,566,518 37.8 37–38 . . . . . . . . . . . . . . . . . . . 0.002934 94,086 276 93,948 3,472,300 36.9 38–39 . . . . . . . . . . . . . . . . . . . 0.003112 93,810 292 93,664 3,378,353 36.0 39–40 . . . . . . . . . . . . . . . . . . . 0.003329 93,518 311 93,362 3,284,689 35.1 40–41 . . . . . . . . . . . . . . . . . . . 0.003584 93,206 334 93,039 3,191,327 34.2 41–42 . . . . . . . . . . . . . . . . . . . 0.003869 92,872 359 92,693 3,098,288 33.4 42–43 . . . . . . . . . . . . . . . . . . . 0.004185 92,513 387 92,319 3,005,595 32.5 43–44 . . . . . . . . . . . . . . . . . . . 0.004523 92,126 417 91,918 2,913,276 31.6 44–45 . . . . . . . . . . . . . . . . . . . 0.004884 91,709 448 91,485 2,821,358 30.8 45–46 . . . . . . . . . . . . . . . . . . . 0.005242 91,261 478 91,022 2,729,873 29.9 46–47 . . . . . . . . . . . . . . . . . . . 0.005642 90,783 512 90,527 2,638,851 29.1 47–48 . . . . . . . . . . . . . . . . . . . 0.006163 90,271 556 89,993 2,548,324 28.2 48–49 . . . . . . . . . . . . . . . . . . . 0.006855 89,714 615 89,407 2,458,331 27.4 49–50 . . . . . . . . . . . . . . . . . . . 0.007699 89,099 686 88,756 2,368,924 26.6 50–51 . . . . . . . . . . . . . . . . . . . 0.008620 88,413 762 88,032 2,280,168 25.8 51–52 . . . . . . . . . . . . . . . . . . . 0.009562 87,651 838 87,232 2,192,136 25.0 52–53 . . . . . . . . . . . . . . . . . . . 0.010560 86,813 917 86,355 2,104,904 24.2 53–54 . . . . . . . . . . . . . . . . . . . 0.011606 85,896 997 85,398 2,018,549 23.5 54–55 . . . . . . . . . . . . . . . . . . . 0.012704 84,899 1,079 84,360 1,933,151 22.8 55–56 . . . . . . . . . . . . . . . . . . . 0.013917 83,821 1,167 83,238 1,848,791 22.1 56–57 . . . . . . . . . . . . . . . . . . . 0.015210 82,654 1,257 82,026 1,765,553 21.4 57–58 . . . . . . . . . . . . . . . . . . . 0.016460 81,397 1,340 80,727 1,683,527 20.7 58–59 . . . . . . . . . . . . . . . . . . . 0.017597 80,057 1,409 79,353 1,602,800 20.0 59–60 . . . . . . . . . . . . . . . . . . . 0.018655 78,649 1,467 77,915 1,523,447 19.4 60–61 . . . . . . . . . . . . . . . . . . . 0.019749 77,181 1,524 76,419 1,445,532 18.7 61–62 . . . . . . . . . . . . . . . . . . . 0.020970 75,657 1,587 74,864 1,369,113 18.1
See footnote at end of table.
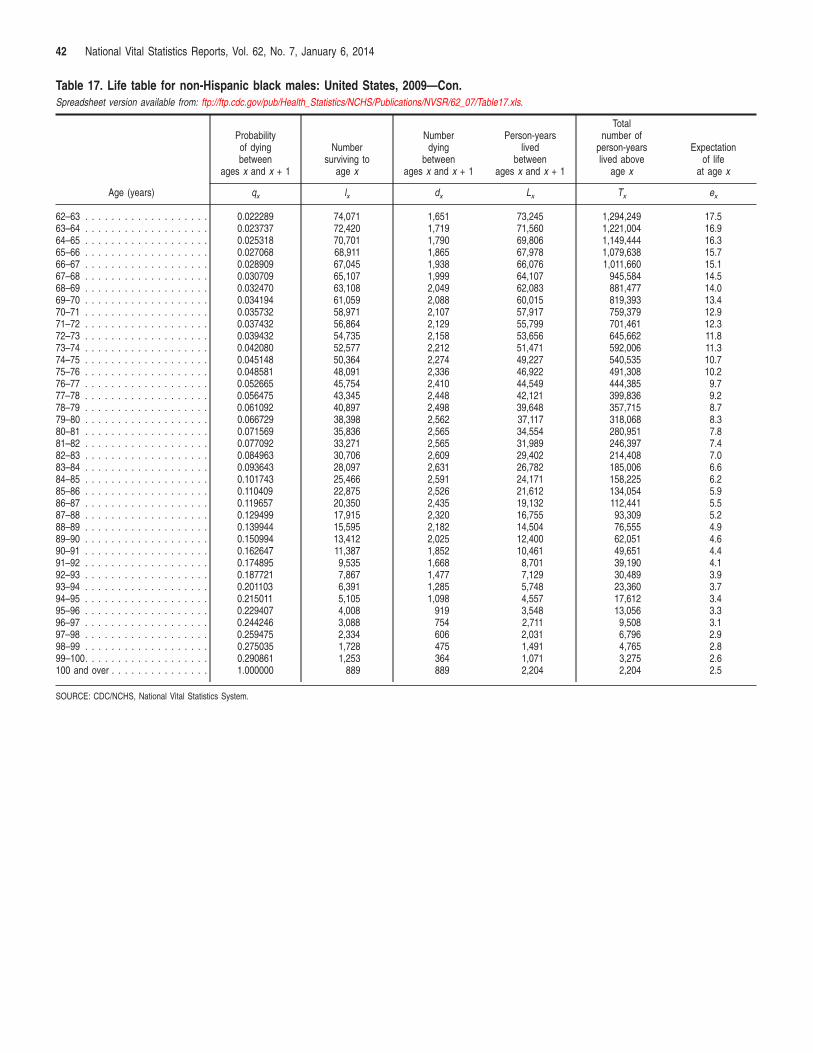
42 National Vital Statistics Reports, Vol. 62, No. 7, January 6, 2014
Table 17. Life table for non-Hispanic black males: United States, 2009—Con. Spreadsheet version available from: ftp://ftp.cdc.gov/pub/Health_Statistics/NCHS/Publications/NVSR/62_07/Table17.xls.
Age (years)
Probability of dying between
ages x and x + 1
Number surviving to
age x
Number dying
between ages x and x + 1
Person-years lived
between ages x and x + 1
Total number of
person-years lived above
age x
Expectation of life
at age x
qx lx dx Lx Tx ex
62–63 . . . . . . . . . . . . . . . . . . . 0.022289 74,071 1,651 73,245 1,294,249 17.5 63–64 . . . . . . . . . . . . . . . . . . . 0.023737 72,420 1,719 71,560 1,221,004 16.9 64–65 . . . . . . . . . . . . . . . . . . . 0.025318 70,701 1,790 69,806 1,149,444 16.3 65–66 . . . . . . . . . . . . . . . . . . . 0.027068 68,911 1,865 67,978 1,079,638 15.7 66–67 . . . . . . . . . . . . . . . . . . . 0.028909 67,045 1,938 66,076 1,011,660 15.1 67–68 . . . . . . . . . . . . . . . . . . . 0.030709 65,107 1,999 64,107 945,584 14.5 68–69 . . . . . . . . . . . . . . . . . . . 0.032470 63,108 2,049 62,083 881,477 14.0 69–70 . . . . . . . . . . . . . . . . . . . 0.034194 61,059 2,088 60,015 819,393 13.4 70–71 . . . . . . . . . . . . . . . . . . . 0.035732 58,971 2,107 57,917 759,379 12.9 71–72 . . . . . . . . . . . . . . . . . . . 0.037432 56,864 2,129 55,799 701,461 12.3 72–73 . . . . . . . . . . . . . . . . . . . 0.039432 54,735 2,158 53,656 645,662 11.8 73–74 . . . . . . . . . . . . . . . . . . . 0.042080 52,577 2,212 51,471 592,006 11.3 74–75 . . . . . . . . . . . . . . . . . . . 0.045148 50,364 2,274 49,227 540,535 10.7 75–76 . . . . . . . . . . . . . . . . . . . 0.048581 48,091 2,336 46,922 491,308 10.2 76–77 . . . . . . . . . . . . . . . . . . . 0.052665 45,754 2,410 44,549 444,385 9.7 77–78 . . . . . . . . . . . . . . . . . . . 0.056475 43,345 2,448 42,121 399,836 9.2 78–79 . . . . . . . . . . . . . . . . . . . 0.061092 40,897 2,498 39,648 357,715 8.7 79–80 . . . . . . . . . . . . . . . . . . . 0.066729 38,398 2,562 37,117 318,068 8.3 80–81 . . . . . . . . . . . . . . . . . . . 0.071569 35,836 2,565 34,554 280,951 7.8 81–82 . . . . . . . . . . . . . . . . . . . 0.077092 33,271 2,565 31,989 246,397 7.4 82–83 . . . . . . . . . . . . . . . . . . . 0.084963 30,706 2,609 29,402 214,408 7.0 83–84 . . . . . . . . . . . . . . . . . . . 0.093643 28,097 2,631 26,782 185,006 6.6 84–85 . . . . . . . . . . . . . . . . . . . 0.101743 25,466 2,591 24,171 158,225 6.2 85–86 . . . . . . . . . . . . . . . . . . . 0.110409 22,875 2,526 21,612 134,054 5.9 86–87 . . . . . . . . . . . . . . . . . . . 0.119657 20,350 2,435 19,132 112,441 5.5 87–88 . . . . . . . . . . . . . . . . . . . 0.129499 17,915 2,320 16,755 93,309 5.2 88–89 . . . . . . . . . . . . . . . . . . . 0.139944 15,595 2,182 14,504 76,555 4.9 89–90 . . . . . . . . . . . . . . . . . . . 0.150994 13,412 2,025 12,400 62,051 4.6 90–91 . . . . . . . . . . . . . . . . . . . 0.162647 11,387 1,852 10,461 49,651 4.4 91–92 . . . . . . . . . . . . . . . . . . . 0.174895 9,535 1,668 8,701 39,190 4.1 92–93 . . . . . . . . . . . . . . . . . . . 0.187721 7,867 1,477 7,129 30,489 3.9 93–94 . . . . . . . . . . . . . . . . . . . 0.201103 6,391 1,285 5,748 23,360 3.7 94–95 . . . . . . . . . . . . . . . . . . . 0.215011 5,105 1,098 4,557 17,612 3.4 95–96 . . . . . . . . . . . . . . . . . . . 0.229407 4,008 919 3,548 13,056 3.3 96–97 . . . . . . . . . . . . . . . . . . . 0.244246 3,088 754 2,711 9,508 3.1 97–98 . . . . . . . . . . . . . . . . . . . 0.259475 2,334 606 2,031 6,796 2.9 98–99 . . . . . . . . . . . . . . . . . . . 0.275035 1,728 475 1,491 4,765 2.8 99–100. . . . . . . . . . . . . . . . . . . 0.290861 1,253 364 1,071 3,275 2.6 100 and over . . . . . . . . . . . . . . . 1.000000 889 889 2,204 2,204 2.5
SOURCE: CDC/NCHS, National Vital Statistics System.
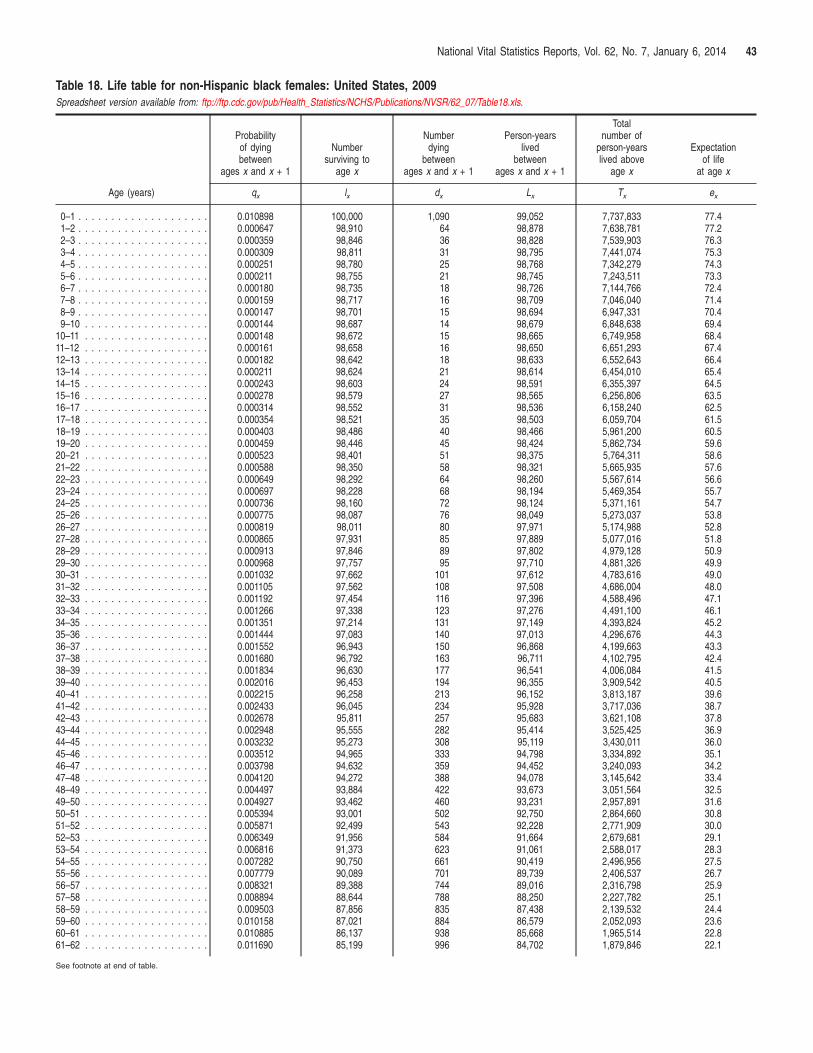
National Vital Statistics Reports, Vol. 62, No. 7, January 6, 2014 43
Table 18. Life table for non-Hispanic black females: United States, 2009 Spreadsheet version available from: ftp://ftp.cdc.gov/pub/Health_Statistics/NCHS/Publications/NVSR/62_07/Table18.xls.
Age (years)
Probability of dying between
ages x and x + 1
Number surviving to
age x
Number dying
between ages x and x + 1
Person-years lived
between ages x and x + 1
Total number of
person-years lived above
age x
Expectation of life
at age x
qx lx dx Lx Tx ex
0–1 . . . . . . . . . . . . . . . . . . . . 0.010898 100,000 1,090 99,052 7,737,833 77.4 1–2 . . . . . . . . . . . . . . . . . . . . 0.000647 98,910 64 98,878 7,638,781 77.2 2–3 . . . . . . . . . . . . . . . . . . . . 0.000359 98,846 36 98,828 7,539,903 76.3 3–4 . . . . . . . . . . . . . . . . . . . . 0.000309 98,811 31 98,795 7,441,074 75.3 4–5 . . . . . . . . . . . . . . . . . . . . 0.000251 98,780 25 98,768 7,342,279 74.3 5–6 . . . . . . . . . . . . . . . . . . . . 0.000211 98,755 21 98,745 7,243,511 73.3 6–7 . . . . . . . . . . . . . . . . . . . . 0.000180 98,735 18 98,726 7,144,766 72.4 7–8 . . . . . . . . . . . . . . . . . . . . 0.000159 98,717 16 98,709 7,046,040 71.4 8–9 . . . . . . . . . . . . . . . . . . . . 0.000147 98,701 15 98,694 6,947,331 70.4 9–10 . . . . . . . . . . . . . . . . . . . 0.000144 98,687 14 98,679 6,848,638 69.4
10–11 . . . . . . . . . . . . . . . . . . . 0.000148 98,672 15 98,665 6,749,958 68.4 11–12 . . . . . . . . . . . . . . . . . . . 0.000161 98,658 16 98,650 6,651,293 67.4 12–13 . . . . . . . . . . . . . . . . . . . 0.000182 98,642 18 98,633 6,552,643 66.4 13–14 . . . . . . . . . . . . . . . . . . . 0.000211 98,624 21 98,614 6,454,010 65.4 14–15 . . . . . . . . . . . . . . . . . . . 0.000243 98,603 24 98,591 6,355,397 64.5 15–16 . . . . . . . . . . . . . . . . . . . 0.000278 98,579 27 98,565 6,256,806 63.5 16–17 . . . . . . . . . . . . . . . . . . . 0.000314 98,552 31 98,536 6,158,240 62.5 17–18 . . . . . . . . . . . . . . . . . . . 0.000354 98,521 35 98,503 6,059,704 61.5 18–19 . . . . . . . . . . . . . . . . . . . 0.000403 98,486 40 98,466 5,961,200 60.5 19–20 . . . . . . . . . . . . . . . . . . . 0.000459 98,446 45 98,424 5,862,734 59.6 20–21 . . . . . . . . . . . . . . . . . . . 0.000523 98,401 51 98,375 5,764,311 58.6 21–22 . . . . . . . . . . . . . . . . . . . 0.000588 98,350 58 98,321 5,665,935 57.6 22–23 . . . . . . . . . . . . . . . . . . . 0.000649 98,292 64 98,260 5,567,614 56.6 23–24 . . . . . . . . . . . . . . . . . . . 0.000697 98,228 68 98,194 5,469,354 55.7 24–25 . . . . . . . . . . . . . . . . . . . 0.000736 98,160 72 98,124 5,371,161 54.7 25–26 . . . . . . . . . . . . . . . . . . . 0.000775 98,087 76 98,049 5,273,037 53.8 26–27 . . . . . . . . . . . . . . . . . . . 0.000819 98,011 80 97,971 5,174,988 52.8 27–28 . . . . . . . . . . . . . . . . . . . 0.000865 97,931 85 97,889 5,077,016 51.8 28–29 . . . . . . . . . . . . . . . . . . . 0.000913 97,846 89 97,802 4,979,128 50.9 29–30 . . . . . . . . . . . . . . . . . . . 0.000968 97,757 95 97,710 4,881,326 49.9 30–31 . . . . . . . . . . . . . . . . . . . 0.001032 97,662 101 97,612 4,783,616 49.0 31–32 . . . . . . . . . . . . . . . . . . . 0.001105 97,562 108 97,508 4,686,004 48.0 32–33 . . . . . . . . . . . . . . . . . . . 0.001192 97,454 116 97,396 4,588,496 47.1 33–34 . . . . . . . . . . . . . . . . . . . 0.001266 97,338 123 97,276 4,491,100 46.1 34–35 . . . . . . . . . . . . . . . . . . . 0.001351 97,214 131 97,149 4,393,824 45.2 35–36 . . . . . . . . . . . . . . . . . . . 0.001444 97,083 140 97,013 4,296,676 44.3 36–37 . . . . . . . . . . . . . . . . . . . 0.001552 96,943 150 96,868 4,199,663 43.3 37–38 . . . . . . . . . . . . . . . . . . . 0.001680 96,792 163 96,711 4,102,795 42.4 38–39 . . . . . . . . . . . . . . . . . . . 0.001834 96,630 177 96,541 4,006,084 41.5 39–40 . . . . . . . . . . . . . . . . . . . 0.002016 96,453 194 96,355 3,909,542 40.5 40–41 . . . . . . . . . . . . . . . . . . . 0.002215 96,258 213 96,152 3,813,187 39.6 41–42 . . . . . . . . . . . . . . . . . . . 0.002433 96,045 234 95,928 3,717,036 38.7 42–43 . . . . . . . . . . . . . . . . . . . 0.002678 95,811 257 95,683 3,621,108 37.8 43–44 . . . . . . . . . . . . . . . . . . . 0.002948 95,555 282 95,414 3,525,425 36.9 44–45 . . . . . . . . . . . . . . . . . . . 0.003232 95,273 308 95,119 3,430,011 36.0 45–46 . . . . . . . . . . . . . . . . . . . 0.003512 94,965 333 94,798 3,334,892 35.1 46–47 . . . . . . . . . . . . . . . . . . . 0.003798 94,632 359 94,452 3,240,093 34.2 47–48 . . . . . . . . . . . . . . . . . . . 0.004120 94,272 388 94,078 3,145,642 33.4 48–49 . . . . . . . . . . . . . . . . . . . 0.004497 93,884 422 93,673 3,051,564 32.5 49–50 . . . . . . . . . . . . . . . . . . . 0.004927 93,462 460 93,231 2,957,891 31.6 50–51 . . . . . . . . . . . . . . . . . . . 0.005394 93,001 502 92,750 2,864,660 30.8 51–52 . . . . . . . . . . . . . . . . . . . 0.005871 92,499 543 92,228 2,771,909 30.0 52–53 . . . . . . . . . . . . . . . . . . . 0.006349 91,956 584 91,664 2,679,681 29.1 53–54 . . . . . . . . . . . . . . . . . . . 0.006816 91,373 623 91,061 2,588,017 28.3 54–55 . . . . . . . . . . . . . . . . . . . 0.007282 90,750 661 90,419 2,496,956 27.5 55–56 . . . . . . . . . . . . . . . . . . . 0.007779 90,089 701 89,739 2,406,537 26.7 56–57 . . . . . . . . . . . . . . . . . . . 0.008321 89,388 744 89,016 2,316,798 25.9 57–58 . . . . . . . . . . . . . . . . . . . 0.008894 88,644 788 88,250 2,227,782 25.1 58–59 . . . . . . . . . . . . . . . . . . . 0.009503 87,856 835 87,438 2,139,532 24.4 59–60 . . . . . . . . . . . . . . . . . . . 0.010158 87,021 884 86,579 2,052,093 23.6 60–61 . . . . . . . . . . . . . . . . . . . 0.010885 86,137 938 85,668 1,965,514 22.8 61–62 . . . . . . . . . . . . . . . . . . . 0.011690 85,199 996 84,702 1,879,846 22.1
See footnote at end of table.
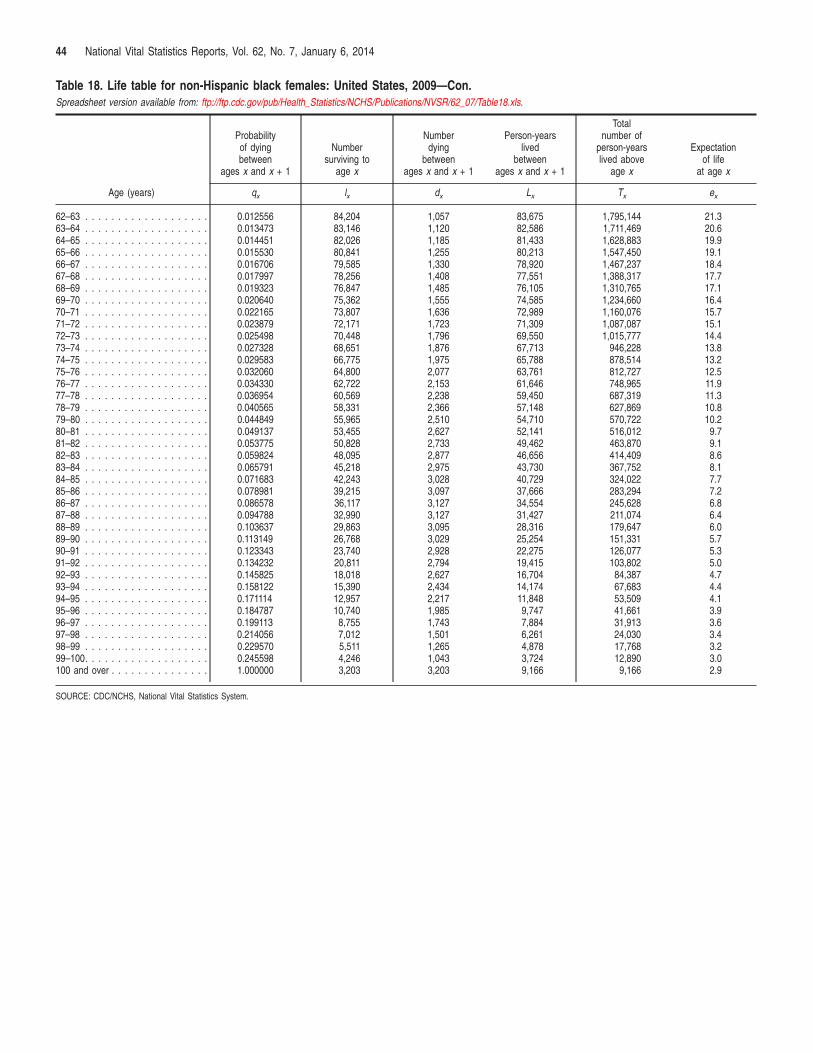
44 National Vital Statistics Reports, Vol. 62, No. 7, January 6, 2014
Table 18. Life table for non-Hispanic black females: United States, 2009—Con. Spreadsheet version available from: ftp://ftp.cdc.gov/pub/Health_Statistics/NCHS/Publications/NVSR/62_07/Table18.xls.
Age (years)
Probability of dying between
ages x and x + 1
Number surviving to
age x
Number dying
between ages x and x + 1
Person-years lived
between ages x and x + 1
Total number of
person-years lived above
age x
Expectation of life
at age x
qx lx dx Lx Tx ex
62–63 . . . . . . . . . . . . . . . . . . . 0.012556 84,204 1,057 83,675 1,795,144 21.3 63–64 . . . . . . . . . . . . . . . . . . . 0.013473 83,146 1,120 82,586 1,711,469 20.6 64–65 . . . . . . . . . . . . . . . . . . . 0.014451 82,026 1,185 81,433 1,628,883 19.9 65–66 . . . . . . . . . . . . . . . . . . . 0.015530 80,841 1,255 80,213 1,547,450 19.1 66–67 . . . . . . . . . . . . . . . . . . . 0.016706 79,585 1,330 78,920 1,467,237 18.4 67–68 . . . . . . . . . . . . . . . . . . . 0.017997 78,256 1,408 77,551 1,388,317 17.7 68–69 . . . . . . . . . . . . . . . . . . . 0.019323 76,847 1,485 76,105 1,310,765 17.1 69–70 . . . . . . . . . . . . . . . . . . . 0.020640 75,362 1,555 74,585 1,234,660 16.4 70–71 . . . . . . . . . . . . . . . . . . . 0.022165 73,807 1,636 72,989 1,160,076 15.7 71–72 . . . . . . . . . . . . . . . . . . . 0.023879 72,171 1,723 71,309 1,087,087 15.1 72–73 . . . . . . . . . . . . . . . . . . . 0.025498 70,448 1,796 69,550 1,015,777 14.4 73–74 . . . . . . . . . . . . . . . . . . . 0.027328 68,651 1,876 67,713 946,228 13.8 74–75 . . . . . . . . . . . . . . . . . . . 0.029583 66,775 1,975 65,788 878,514 13.2 75–76 . . . . . . . . . . . . . . . . . . . 0.032060 64,800 2,077 63,761 812,727 12.5 76–77 . . . . . . . . . . . . . . . . . . . 0.034330 62,722 2,153 61,646 748,965 11.9 77–78 . . . . . . . . . . . . . . . . . . . 0.036954 60,569 2,238 59,450 687,319 11.3 78–79 . . . . . . . . . . . . . . . . . . . 0.040565 58,331 2,366 57,148 627,869 10.8 79–80 . . . . . . . . . . . . . . . . . . . 0.044849 55,965 2,510 54,710 570,722 10.2 80–81 . . . . . . . . . . . . . . . . . . . 0.049137 53,455 2,627 52,141 516,012 9.7 81–82 . . . . . . . . . . . . . . . . . . . 0.053775 50,828 2,733 49,462 463,870 9.1 82–83 . . . . . . . . . . . . . . . . . . . 0.059824 48,095 2,877 46,656 414,409 8.6 83–84 . . . . . . . . . . . . . . . . . . . 0.065791 45,218 2,975 43,730 367,752 8.1 84–85 . . . . . . . . . . . . . . . . . . . 0.071683 42,243 3,028 40,729 324,022 7.7 85–86 . . . . . . . . . . . . . . . . . . . 0.078981 39,215 3,097 37,666 283,294 7.2 86–87 . . . . . . . . . . . . . . . . . . . 0.086578 36,117 3,127 34,554 245,628 6.8 87–88 . . . . . . . . . . . . . . . . . . . 0.094788 32,990 3,127 31,427 211,074 6.4 88–89 . . . . . . . . . . . . . . . . . . . 0.103637 29,863 3,095 28,316 179,647 6.0 89–90 . . . . . . . . . . . . . . . . . . . 0.113149 26,768 3,029 25,254 151,331 5.7 90–91 . . . . . . . . . . . . . . . . . . . 0.123343 23,740 2,928 22,275 126,077 5.3 91–92 . . . . . . . . . . . . . . . . . . . 0.134232 20,811 2,794 19,415 103,802 5.0 92–93 . . . . . . . . . . . . . . . . . . . 0.145825 18,018 2,627 16,704 84,387 4.7 93–94 . . . . . . . . . . . . . . . . . . . 0.158122 15,390 2,434 14,174 67,683 4.4 94–95 . . . . . . . . . . . . . . . . . . . 0.171114 12,957 2,217 11,848 53,509 4.1 95–96 . . . . . . . . . . . . . . . . . . . 0.184787 10,740 1,985 9,747 41,661 3.9 96–97 . . . . . . . . . . . . . . . . . . . 0.199113 8,755 1,743 7,884 31,913 3.6 97–98 . . . . . . . . . . . . . . . . . . . 0.214056 7,012 1,501 6,261 24,030 3.4 98–99 . . . . . . . . . . . . . . . . . . . 0.229570 5,511 1,265 4,878 17,768 3.2 99–100. . . . . . . . . . . . . . . . . . . 0.245598 4,246 1,043 3,724 12,890 3.0 100 and over . . . . . . . . . . . . . . . 1.000000 3,203 3,203 9,166 9,166 2.9
SOURCE: CDC/NCHS, National Vital Statistics System.
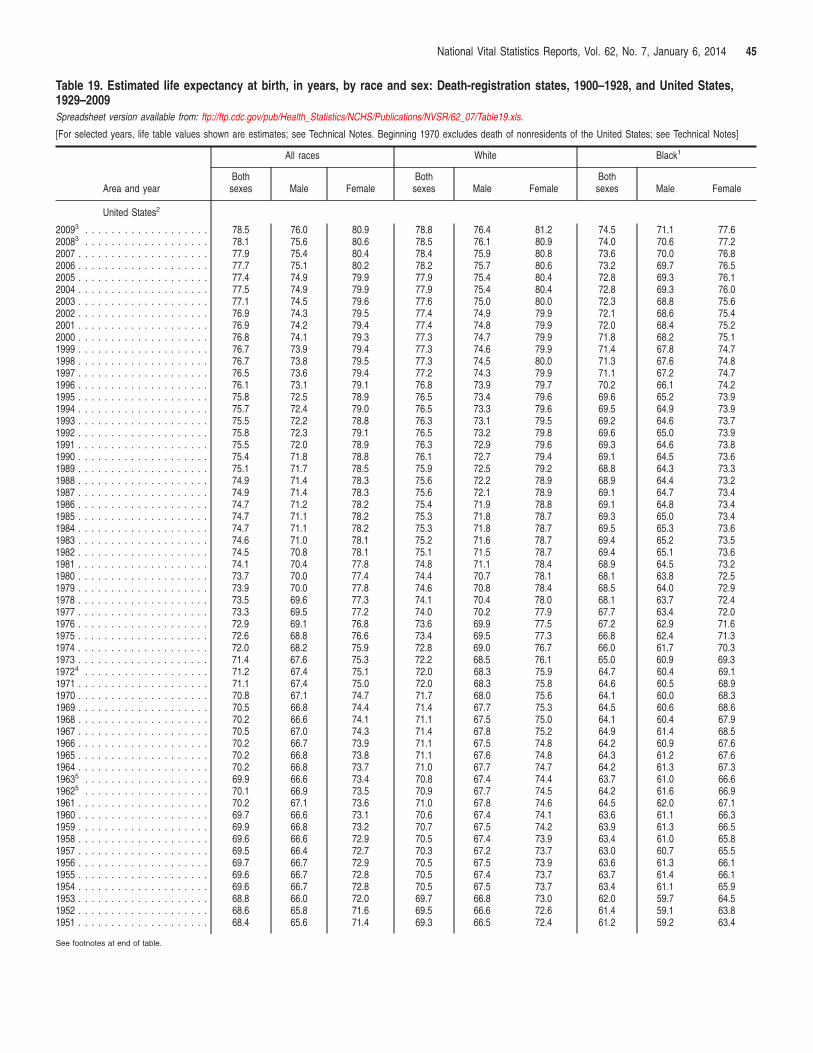
National Vital Statistics Reports, Vol. 62, No. 7, January 6, 2014 45
Table 19. Estimated life expectancy at birth, in years, by race and sex: Death-registration states, 1900–1928, and United States, 1929–2009 Spreadsheet version available from: ftp://ftp.cdc.gov/pub/Health_Statistics/NCHS/Publications/NVSR/62_07/Table19.xls.
[For selected years, life table values shown are estimates; see Technical Notes. Beginning 1970 excludes death of nonresidents of the United States; see Technical Notes]
Area and year
All races White Black1
Both sexes Male Female
Both sexes Male Female
Both sexes Male Female
United States2
20093 . . . . . . . . . . . . . . . . . . . 78.5 76.0 80.9 78.8 76.4 81.2 74.5 71.1 77.6 20083 . . . . . . . . . . . . . . . . . . . 78.1 75.6 80.6 78.5 76.1 80.9 74.0 70.6 77.2 2007 . . . . . . . . . . . . . . . . . . . . 77.9 75.4 80.4 78.4 75.9 80.8 73.6 70.0 76.8 2006 . . . . . . . . . . . . . . . . . . . . 77.7 75.1 80.2 78.2 75.7 80.6 73.2 69.7 76.5 2005 . . . . . . . . . . . . . . . . . . . . 77.4 74.9 79.9 77.9 75.4 80.4 72.8 69.3 76.1 2004 . . . . . . . . . . . . . . . . . . . . 77.5 74.9 79.9 77.9 75.4 80.4 72.8 69.3 76.0 2003 . . . . . . . . . . . . . . . . . . . . 77.1 74.5 79.6 77.6 75.0 80.0 72.3 68.8 75.6 2002 . . . . . . . . . . . . . . . . . . . . 76.9 74.3 79.5 77.4 74.9 79.9 72.1 68.6 75.4 2001 . . . . . . . . . . . . . . . . . . . . 76.9 74.2 79.4 77.4 74.8 79.9 72.0 68.4 75.2 2000 . . . . . . . . . . . . . . . . . . . . 76.8 74.1 79.3 77.3 74.7 79.9 71.8 68.2 75.1 1999 . . . . . . . . . . . . . . . . . . . . 76.7 73.9 79.4 77.3 74.6 79.9 71.4 67.8 74.7 1998 . . . . . . . . . . . . . . . . . . . . 76.7 73.8 79.5 77.3 74.5 80.0 71.3 67.6 74.8 1997 . . . . . . . . . . . . . . . . . . . . 76.5 73.6 79.4 77.2 74.3 79.9 71.1 67.2 74.7 1996 . . . . . . . . . . . . . . . . . . . . 76.1 73.1 79.1 76.8 73.9 79.7 70.2 66.1 74.2 1995 . . . . . . . . . . . . . . . . . . . . 75.8 72.5 78.9 76.5 73.4 79.6 69.6 65.2 73.9 1994 . . . . . . . . . . . . . . . . . . . . 75.7 72.4 79.0 76.5 73.3 79.6 69.5 64.9 73.9 1993 . . . . . . . . . . . . . . . . . . . . 75.5 72.2 78.8 76.3 73.1 79.5 69.2 64.6 73.7 1992 . . . . . . . . . . . . . . . . . . . . 75.8 72.3 79.1 76.5 73.2 79.8 69.6 65.0 73.9 1991 . . . . . . . . . . . . . . . . . . . . 75.5 72.0 78.9 76.3 72.9 79.6 69.3 64.6 73.8 1990 . . . . . . . . . . . . . . . . . . . . 75.4 71.8 78.8 76.1 72.7 79.4 69.1 64.5 73.6 1989 . . . . . . . . . . . . . . . . . . . . 75.1 71.7 78.5 75.9 72.5 79.2 68.8 64.3 73.3 1988 . . . . . . . . . . . . . . . . . . . . 74.9 71.4 78.3 75.6 72.2 78.9 68.9 64.4 73.2 1987 . . . . . . . . . . . . . . . . . . . . 74.9 71.4 78.3 75.6 72.1 78.9 69.1 64.7 73.4 1986 . . . . . . . . . . . . . . . . . . . . 74.7 71.2 78.2 75.4 71.9 78.8 69.1 64.8 73.4 1985 . . . . . . . . . . . . . . . . . . . . 74.7 71.1 78.2 75.3 71.8 78.7 69.3 65.0 73.4 1984 . . . . . . . . . . . . . . . . . . . . 74.7 71.1 78.2 75.3 71.8 78.7 69.5 65.3 73.6 1983 . . . . . . . . . . . . . . . . . . . . 74.6 71.0 78.1 75.2 71.6 78.7 69.4 65.2 73.5 1982 . . . . . . . . . . . . . . . . . . . . 74.5 70.8 78.1 75.1 71.5 78.7 69.4 65.1 73.6 1981 . . . . . . . . . . . . . . . . . . . . 74.1 70.4 77.8 74.8 71.1 78.4 68.9 64.5 73.2 1980 . . . . . . . . . . . . . . . . . . . . 73.7 70.0 77.4 74.4 70.7 78.1 68.1 63.8 72.5 1979 . . . . . . . . . . . . . . . . . . . . 73.9 70.0 77.8 74.6 70.8 78.4 68.5 64.0 72.9 1978 . . . . . . . . . . . . . . . . . . . . 73.5 69.6 77.3 74.1 70.4 78.0 68.1 63.7 72.4 1977 . . . . . . . . . . . . . . . . . . . . 73.3 69.5 77.2 74.0 70.2 77.9 67.7 63.4 72.0 1976 . . . . . . . . . . . . . . . . . . . . 72.9 69.1 76.8 73.6 69.9 77.5 67.2 62.9 71.6 1975 . . . . . . . . . . . . . . . . . . . . 72.6 68.8 76.6 73.4 69.5 77.3 66.8 62.4 71.3 1974 . . . . . . . . . . . . . . . . . . . . 72.0 68.2 75.9 72.8 69.0 76.7 66.0 61.7 70.3 1973 . . . . . . . . . . . . . . . . . . . . 71.4 67.6 75.3 72.2 68.5 76.1 65.0 60.9 69.3 19724 . . . . . . . . . . . . . . . . . . . 71.2 67.4 75.1 72.0 68.3 75.9 64.7 60.4 69.1 1971 . . . . . . . . . . . . . . . . . . . . 71.1 67.4 75.0 72.0 68.3 75.8 64.6 60.5 68.9 1970 . . . . . . . . . . . . . . . . . . . . 70.8 67.1 74.7 71.7 68.0 75.6 64.1 60.0 68.3 1969 . . . . . . . . . . . . . . . . . . . . 70.5 66.8 74.4 71.4 67.7 75.3 64.5 60.6 68.6 1968 . . . . . . . . . . . . . . . . . . . . 70.2 66.6 74.1 71.1 67.5 75.0 64.1 60.4 67.9 1967 . . . . . . . . . . . . . . . . . . . . 70.5 67.0 74.3 71.4 67.8 75.2 64.9 61.4 68.5 1966 . . . . . . . . . . . . . . . . . . . . 70.2 66.7 73.9 71.1 67.5 74.8 64.2 60.9 67.6 1965 . . . . . . . . . . . . . . . . . . . . 70.2 66.8 73.8 71.1 67.6 74.8 64.3 61.2 67.6 1964 . . . . . . . . . . . . . . . . . . . . 70.2 66.8 73.7 71.0 67.7 74.7 64.2 61.3 67.3 19635 . . . . . . . . . . . . . . . . . . . 69.9 66.6 73.4 70.8 67.4 74.4 63.7 61.0 66.6 19625 . . . . . . . . . . . . . . . . . . . 70.1 66.9 73.5 70.9 67.7 74.5 64.2 61.6 66.9 1961 . . . . . . . . . . . . . . . . . . . . 70.2 67.1 73.6 71.0 67.8 74.6 64.5 62.0 67.1 1960 . . . . . . . . . . . . . . . . . . . . 69.7 66.6 73.1 70.6 67.4 74.1 63.6 61.1 66.3 1959 . . . . . . . . . . . . . . . . . . . . 69.9 66.8 73.2 70.7 67.5 74.2 63.9 61.3 66.5 1958 . . . . . . . . . . . . . . . . . . . . 69.6 66.6 72.9 70.5 67.4 73.9 63.4 61.0 65.8 1957 . . . . . . . . . . . . . . . . . . . . 69.5 66.4 72.7 70.3 67.2 73.7 63.0 60.7 65.5 1956 . . . . . . . . . . . . . . . . . . . . 69.7 66.7 72.9 70.5 67.5 73.9 63.6 61.3 66.1 1955 . . . . . . . . . . . . . . . . . . . . 69.6 66.7 72.8 70.5 67.4 73.7 63.7 61.4 66.1 1954 . . . . . . . . . . . . . . . . . . . . 69.6 66.7 72.8 70.5 67.5 73.7 63.4 61.1 65.9 1953 . . . . . . . . . . . . . . . . . . . . 68.8 66.0 72.0 69.7 66.8 73.0 62.0 59.7 64.5 1952 . . . . . . . . . . . . . . . . . . . . 68.6 65.8 71.6 69.5 66.6 72.6 61.4 59.1 63.8 1951 . . . . . . . . . . . . . . . . . . . . 68.4 65.6 71.4 69.3 66.5 72.4 61.2 59.2 63.4
See footnotes at end of table.
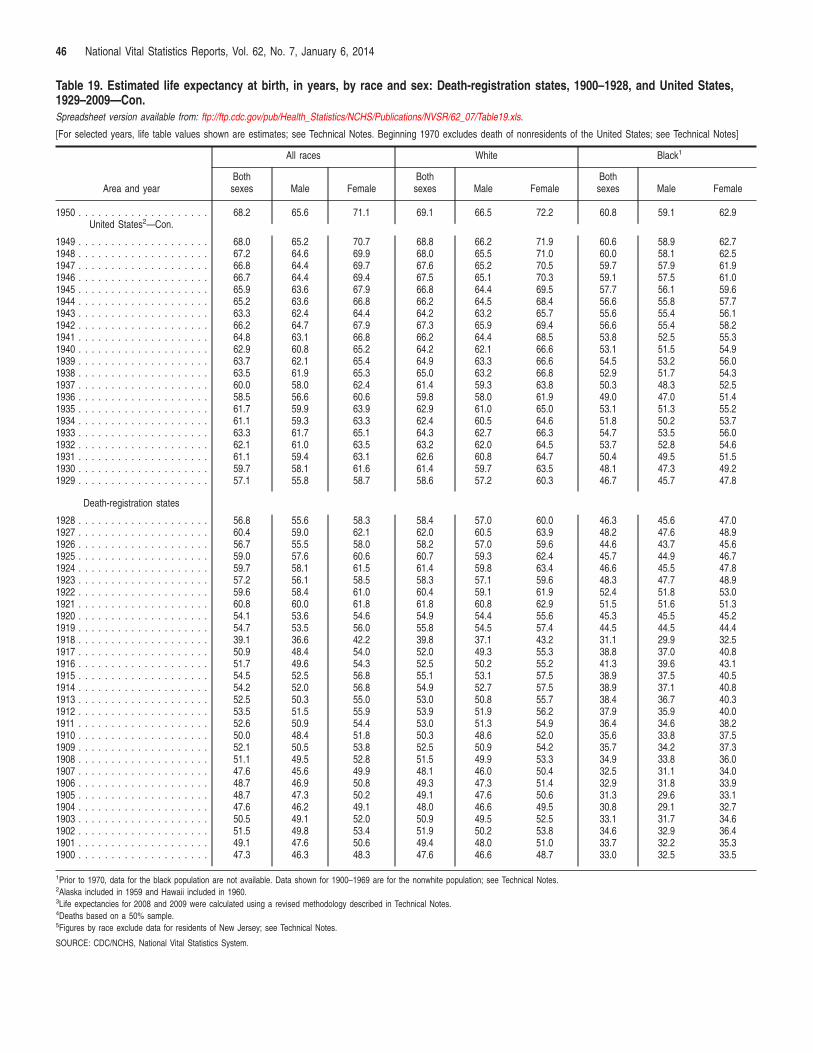
46 National Vital Statistics Reports, Vol. 62, No. 7, January 6, 2014
Table 19. Estimated life expectancy at birth, in years, by race and sex: Death-registration states, 1900–1928, and United States, 1929–2009—Con. Spreadsheet version available from: ftp://ftp.cdc.gov/pub/Health_Statistics/NCHS/Publications/NVSR/62_07/Table19.xls.
[For selected years, life table values shown are estimates; see Technical Notes. Beginning 1970 excludes death of nonresidents of the United States; see Technical Notes]
Area and year
All races White Black1
Both sexes Male Female
Both sexes Male Female
Both sexes Male Female
1950 . . . . . . . . . . . . . . . . . . . . United States2—Con.
68.2 65.6 71.1 69.1 66.5 72.2 60.8 59.1 62.9
1949 . . . . . . . . . . . . . . . . . . . . 68.0 65.2 70.7 68.8 66.2 71.9 60.6 58.9 62.7 1948 . . . . . . . . . . . . . . . . . . . . 67.2 64.6 69.9 68.0 65.5 71.0 60.0 58.1 62.5 1947 . . . . . . . . . . . . . . . . . . . . 66.8 64.4 69.7 67.6 65.2 70.5 59.7 57.9 61.9 1946 . . . . . . . . . . . . . . . . . . . . 66.7 64.4 69.4 67.5 65.1 70.3 59.1 57.5 61.0 1945 . . . . . . . . . . . . . . . . . . . . 65.9 63.6 67.9 66.8 64.4 69.5 57.7 56.1 59.6 1944 . . . . . . . . . . . . . . . . . . . . 65.2 63.6 66.8 66.2 64.5 68.4 56.6 55.8 57.7 1943 . . . . . . . . . . . . . . . . . . . . 63.3 62.4 64.4 64.2 63.2 65.7 55.6 55.4 56.1 1942 . . . . . . . . . . . . . . . . . . . . 66.2 64.7 67.9 67.3 65.9 69.4 56.6 55.4 58.2 1941 . . . . . . . . . . . . . . . . . . . . 64.8 63.1 66.8 66.2 64.4 68.5 53.8 52.5 55.3 1940 . . . . . . . . . . . . . . . . . . . . 62.9 60.8 65.2 64.2 62.1 66.6 53.1 51.5 54.9 1939 . . . . . . . . . . . . . . . . . . . . 63.7 62.1 65.4 64.9 63.3 66.6 54.5 53.2 56.0 1938 . . . . . . . . . . . . . . . . . . . . 63.5 61.9 65.3 65.0 63.2 66.8 52.9 51.7 54.3 1937 . . . . . . . . . . . . . . . . . . . . 60.0 58.0 62.4 61.4 59.3 63.8 50.3 48.3 52.5 1936 . . . . . . . . . . . . . . . . . . . . 58.5 56.6 60.6 59.8 58.0 61.9 49.0 47.0 51.4 1935 . . . . . . . . . . . . . . . . . . . . 61.7 59.9 63.9 62.9 61.0 65.0 53.1 51.3 55.2 1934 . . . . . . . . . . . . . . . . . . . . 61.1 59.3 63.3 62.4 60.5 64.6 51.8 50.2 53.7 1933 . . . . . . . . . . . . . . . . . . . . 63.3 61.7 65.1 64.3 62.7 66.3 54.7 53.5 56.0 1932 . . . . . . . . . . . . . . . . . . . . 62.1 61.0 63.5 63.2 62.0 64.5 53.7 52.8 54.6 1931 . . . . . . . . . . . . . . . . . . . . 61.1 59.4 63.1 62.6 60.8 64.7 50.4 49.5 51.5 1930 . . . . . . . . . . . . . . . . . . . . 59.7 58.1 61.6 61.4 59.7 63.5 48.1 47.3 49.2 1929 . . . . . . . . . . . . . . . . . . . .
Death-registration states
57.1 55.8 58.7 58.6 57.2 60.3 46.7 45.7 47.8
1928 . . . . . . . . . . . . . . . . . . . . 56.8 55.6 58.3 58.4 57.0 60.0 46.3 45.6 47.0 1927 . . . . . . . . . . . . . . . . . . . . 60.4 59.0 62.1 62.0 60.5 63.9 48.2 47.6 48.9 1926 . . . . . . . . . . . . . . . . . . . . 56.7 55.5 58.0 58.2 57.0 59.6 44.6 43.7 45.6 1925 . . . . . . . . . . . . . . . . . . . . 59.0 57.6 60.6 60.7 59.3 62.4 45.7 44.9 46.7 1924 . . . . . . . . . . . . . . . . . . . . 59.7 58.1 61.5 61.4 59.8 63.4 46.6 45.5 47.8 1923 . . . . . . . . . . . . . . . . . . . . 57.2 56.1 58.5 58.3 57.1 59.6 48.3 47.7 48.9 1922 . . . . . . . . . . . . . . . . . . . . 59.6 58.4 61.0 60.4 59.1 61.9 52.4 51.8 53.0 1921 . . . . . . . . . . . . . . . . . . . . 60.8 60.0 61.8 61.8 60.8 62.9 51.5 51.6 51.3 1920 . . . . . . . . . . . . . . . . . . . . 54.1 53.6 54.6 54.9 54.4 55.6 45.3 45.5 45.2 1919 . . . . . . . . . . . . . . . . . . . . 54.7 53.5 56.0 55.8 54.5 57.4 44.5 44.5 44.4 1918 . . . . . . . . . . . . . . . . . . . . 39.1 36.6 42.2 39.8 37.1 43.2 31.1 29.9 32.5 1917 . . . . . . . . . . . . . . . . . . . . 50.9 48.4 54.0 52.0 49.3 55.3 38.8 37.0 40.8 1916 . . . . . . . . . . . . . . . . . . . . 51.7 49.6 54.3 52.5 50.2 55.2 41.3 39.6 43.1 1915 . . . . . . . . . . . . . . . . . . . . 54.5 52.5 56.8 55.1 53.1 57.5 38.9 37.5 40.5 1914 . . . . . . . . . . . . . . . . . . . . 54.2 52.0 56.8 54.9 52.7 57.5 38.9 37.1 40.8 1913 . . . . . . . . . . . . . . . . . . . . 52.5 50.3 55.0 53.0 50.8 55.7 38.4 36.7 40.3 1912 . . . . . . . . . . . . . . . . . . . . 53.5 51.5 55.9 53.9 51.9 56.2 37.9 35.9 40.0 1911 . . . . . . . . . . . . . . . . . . . . 52.6 50.9 54.4 53.0 51.3 54.9 36.4 34.6 38.2 1910 . . . . . . . . . . . . . . . . . . . . 50.0 48.4 51.8 50.3 48.6 52.0 35.6 33.8 37.5 1909 . . . . . . . . . . . . . . . . . . . . 52.1 50.5 53.8 52.5 50.9 54.2 35.7 34.2 37.3 1908 . . . . . . . . . . . . . . . . . . . . 51.1 49.5 52.8 51.5 49.9 53.3 34.9 33.8 36.0 1907 . . . . . . . . . . . . . . . . . . . . 47.6 45.6 49.9 48.1 46.0 50.4 32.5 31.1 34.0 1906 . . . . . . . . . . . . . . . . . . . . 48.7 46.9 50.8 49.3 47.3 51.4 32.9 31.8 33.9 1905 . . . . . . . . . . . . . . . . . . . . 48.7 47.3 50.2 49.1 47.6 50.6 31.3 29.6 33.1 1904 . . . . . . . . . . . . . . . . . . . . 47.6 46.2 49.1 48.0 46.6 49.5 30.8 29.1 32.7 1903 . . . . . . . . . . . . . . . . . . . . 50.5 49.1 52.0 50.9 49.5 52.5 33.1 31.7 34.6 1902 . . . . . . . . . . . . . . . . . . . . 51.5 49.8 53.4 51.9 50.2 53.8 34.6 32.9 36.4 1901 . . . . . . . . . . . . . . . . . . . . 49.1 47.6 50.6 49.4 48.0 51.0 33.7 32.2 35.3 1900 . . . . . . . . . . . . . . . . . . . . 47.3 46.3 48.3 47.6 46.6 48.7 33.0 32.5 33.5
1Prior to 1970, data for the black population are not available. Data shown for 1900–1969 are for the nonwhite population; see Technical Notes. 2Alaska included in 1959 and Hawaii included in 1960. 3Life expectancies for 2008 and 2009 were calculated using a revised methodology described in Technical Notes. 4Deaths based on a 50% sample. 5Figures by race exclude data for residents of New Jersey; see Technical Notes.
SOURCE: CDC/NCHS, National Vital Statistics System.
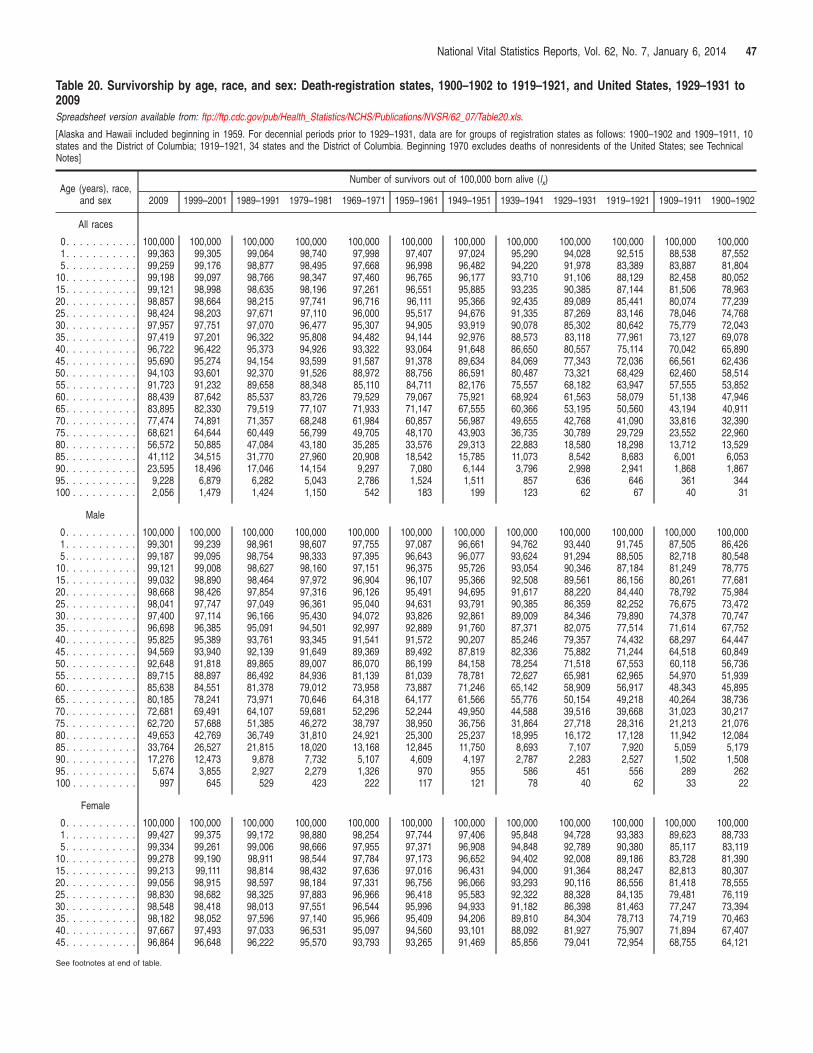
National Vital Statistics Reports, Vol. 62, No. 7, January 6, 2014 47
Table 20. Survivorship by age, race, and sex: Death-registration states, 1900–1902 to 1919–1921, and United States, 1929–1931 to 2009 Spreadsheet version available from: ftp://ftp.cdc.gov/pub/Health_Statistics/NCHS/Publications/NVSR/62_07/Table20.xls.
[Alaska and Hawaii included beginning in 1959. For decennial periods prior to 1929–1931, data are for groups of registration states as follows: 1900–1902 and 1909–1911, 10 states and the District of Columbia; 1919–1921, 34 states and the District of Columbia. Beginning 1970 excludes deaths of nonresidents of the United States; see Technical Notes]
Age (years), race, and sex
Number of survivors out of 100,000 born alive (lx)
2009 1999–2001 1989–1991 1979–1981 1969–1971 1959–1961 1949–1951 1939–1941 1929–1931 1919–1921 1909–1911 1900–1902
All races
0 . . . . . . . . . . . 100,000 100,000 100,000 100,000 100,000 100,000 100,000 100,000 100,000 100,000 100,000 100,000 1 . . . . . . . . . . . 99,363 99,305 99,064 98,740 97,998 97,407 97,024 95,290 94,028 92,515 88,538 87,552 5 . . . . . . . . . . . 99,259 99,176 98,877 98,495 97,668 96,998 96,482 94,220 91,978 83,389 83,887 81,804
10 . . . . . . . . . . . 99,198 99,097 98,766 98,347 97,460 96,765 96,177 93,710 91,106 88,129 82,458 80,052 15 . . . . . . . . . . . 99,121 98,998 98,635 98,196 97,261 96,551 95,885 93,235 90,385 87,144 81,506 78,963 20 . . . . . . . . . . . 98,857 98,664 98,215 97,741 96,716 96,111 95,366 92,435 89,089 85,441 80,074 77,239 25 . . . . . . . . . . . 98,424 98,203 97,671 97,110 96,000 95,517 94,676 91,335 87,269 83,146 78,046 74,768 30 . . . . . . . . . . . 97,957 97,751 97,070 96,477 95,307 94,905 93,919 90,078 85,302 80,642 75,779 72,043 35 . . . . . . . . . . . 97,419 97,201 96,322 95,808 94,482 94,144 92,976 88,573 83,118 77,961 73,127 69,078 40 . . . . . . . . . . . 96,722 96,422 95,373 94,926 93,322 93,064 91,648 86,650 80,557 75,114 70,042 65,890 45 . . . . . . . . . . . 95,690 95,274 94,154 93,599 91,587 91,378 89,634 84,069 77,343 72,036 66,561 62,436 50 . . . . . . . . . . . 94,103 93,601 92,370 91,526 88,972 88,756 86,591 80,487 73,321 68,429 62,460 58,514 55 . . . . . . . . . . . 91,723 91,232 89,658 88,348 85,110 84,711 82,176 75,557 68,182 63,947 57,555 53,852 60 . . . . . . . . . . . 88,439 87,642 85,537 83,726 79,529 79,067 75,921 68,924 61,563 58,079 51,138 47,946 65 . . . . . . . . . . . 83,895 82,330 79,519 77,107 71,933 71,147 67,555 60,366 53,195 50,560 43,194 40,911 70 . . . . . . . . . . . 77,474 74,891 71,357 68,248 61,984 60,857 56,987 49,655 42,768 41,090 33,816 32,390 75 . . . . . . . . . . . 68,621 64,644 60,449 56,799 49,705 48,170 43,903 36,735 30,789 29,729 23,552 22,960 80 . . . . . . . . . . . 56,572 50,885 47,084 43,180 35,285 33,576 29,313 22,883 18,580 18,298 13,712 13,529 85 . . . . . . . . . . . 41,112 34,515 31,770 27,960 20,908 18,542 15,785 11,073 8,542 8,683 6,001 6,053 90 . . . . . . . . . . . 23,595 18,496 17,046 14,154 9,297 7,080 6,144 3,796 2,998 2,941 1,868 1,867 95 . . . . . . . . . . . 9,228 6,879 6,282 5,043 2,786 1,524 1,511 857 636 646 361 344 100 . . . . . . . . . .
Male
2,056 1,479 1,424 1,150 542 183 199 123 62 67 40 31
0 . . . . . . . . . . . 100,000 100,000 100,000 100,000 100,000 100,000 100,000 100,000 100,000 100,000 100,000 100,000 1 . . . . . . . . . . . 99,301 99,239 98,961 98,607 97,755 97,087 96,661 94,762 93,440 91,745 87,505 86,426 5 . . . . . . . . . . . 99,187 99,095 98,754 98,333 97,395 96,643 96,077 93,624 91,294 88,505 82,718 80,548
10 . . . . . . . . . . . 99,121 99,008 98,627 98,160 97,151 96,375 95,726 93,054 90,346 87,184 81,249 78,775 15 . . . . . . . . . . . 99,032 98,890 98,464 97,972 96,904 96,107 95,366 92,508 89,561 86,156 80,261 77,681 20 . . . . . . . . . . . 98,668 98,426 97,854 97,316 96,126 95,491 94,695 91,617 88,220 84,440 78,792 75,984 25 . . . . . . . . . . . 98,041 97,747 97,049 96,361 95,040 94,631 93,791 90,385 86,359 82,252 76,675 73,472 30 . . . . . . . . . . . 97,400 97,114 96,166 95,430 94,072 93,826 92,861 89,009 84,346 79,890 74,378 70,747 35 . . . . . . . . . . . 96,698 96,385 95,091 94,501 92,997 92,889 91,760 87,371 82,075 77,514 71,614 67,752 40 . . . . . . . . . . . 95,825 95,389 93,761 93,345 91,541 91,572 90,207 85,246 79,357 74,432 68,297 64,447 45 . . . . . . . . . . . 94,569 93,940 92,139 91,649 89,369 89,492 87,819 82,336 75,882 71,244 64,518 60,849 50 . . . . . . . . . . . 92,648 91,818 89,865 89,007 86,070 86,199 84,158 78,254 71,518 67,553 60,118 56,736 55 . . . . . . . . . . . 89,715 88,897 86,492 84,936 81,139 81,039 78,781 72,627 65,981 62,965 54,970 51,939 60 . . . . . . . . . . . 85,638 84,551 81,378 79,012 73,958 73,887 71,246 65,142 58,909 56,917 48,343 45,895 65 . . . . . . . . . . . 80,185 78,241 73,971 70,646 64,318 64,177 61,566 55,776 50,154 49,218 40,264 38,736 70 . . . . . . . . . . . 72,681 69,491 64,107 59,681 52,296 52,244 49,950 44,588 39,516 39,668 31,023 30,217 75 . . . . . . . . . . . 62,720 57,688 51,385 46,272 38,797 38,950 36,756 31,864 27,718 28,316 21,213 21,076 80 . . . . . . . . . . . 49,653 42,769 36,749 31,810 24,921 25,300 25,237 18,995 16,172 17,128 11,942 12,084 85 . . . . . . . . . . . 33,764 26,527 21,815 18,020 13,168 12,845 11,750 8,693 7,107 7,920 5,059 5,179 90 . . . . . . . . . . . 17,276 12,473 9,878 7,732 5,107 4,609 4,197 2,787 2,283 2,527 1,502 1,508 95 . . . . . . . . . . . 5,674 3,855 2,927 2,279 1,326 970 955 586 451 556 289 262 100 . . . . . . . . . .
Female
997 645 529 423 222 117 121 78 40 62 33 22
0 . . . . . . . . . . . 100,000 100,000 100,000 100,000 100,000 100,000 100,000 100,000 100,000 100,000 100,000 100,000 1 . . . . . . . . . . . 99,427 99,375 99,172 98,880 98,254 97,744 97,406 95,848 94,728 93,383 89,623 88,733 5 . . . . . . . . . . . 99,334 99,261 99,006 98,666 97,955 97,371 96,908 94,848 92,789 90,380 85,117 83,119
10 . . . . . . . . . . . 99,278 99,190 98,911 98,544 97,784 97,173 96,652 94,402 92,008 89,186 83,728 81,390 15 . . . . . . . . . . . 99,213 99,111 98,814 98,432 97,636 97,016 96,431 94,000 91,364 88,247 82,813 80,307 20 . . . . . . . . . . . 99,056 98,915 98,597 98,184 97,331 96,756 96,066 93,293 90,116 86,556 81,418 78,555 25 . . . . . . . . . . . 98,830 98,682 98,325 97,883 96,966 96,418 95,583 92,322 88,328 84,135 79,481 76,119 30 . . . . . . . . . . . 98,548 98,418 98,013 97,551 96,544 95,996 94,933 91,182 86,398 81,463 77,247 73,394 35 . . . . . . . . . . . 98,182 98,052 97,596 97,140 95,966 95,409 94,206 89,810 84,304 78,713 74,719 70,463 40 . . . . . . . . . . . 97,667 97,493 97,033 96,531 95,097 94,560 93,101 88,092 81,927 75,907 71,894 67,407 45 . . . . . . . . . . . 96,864 96,648 96,222 95,570 93,793 93,265 91,469 85,856 79,041 72,954 68,755 64,121
See footnotes at end of table.
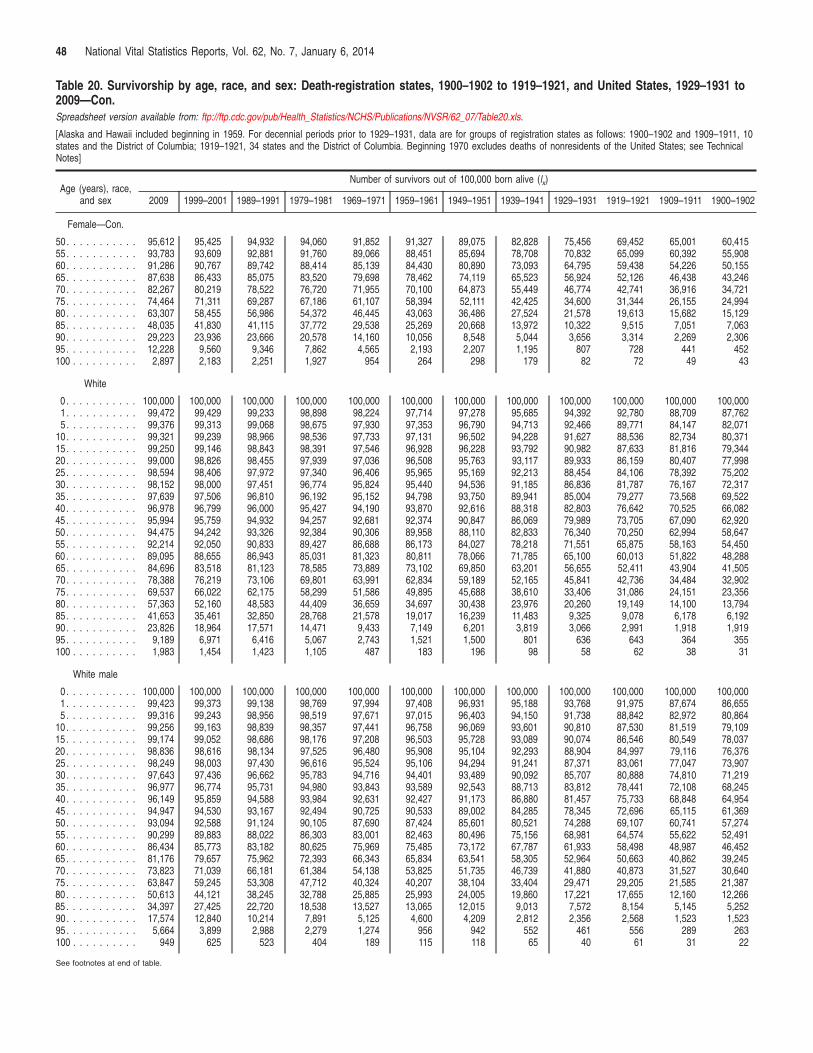
48 National Vital Statistics Reports, Vol. 62, No. 7, January 6, 2014
Table 20. Survivorship by age, race, and sex: Death-registration states, 1900–1902 to 1919–1921, and United States, 1929–1931 to 2009—Con. Spreadsheet version available from: ftp://ftp.cdc.gov/pub/Health_Statistics/NCHS/Publications/NVSR/62_07/Table20.xls.
[Alaska and Hawaii included beginning in 1959. For decennial periods prior to 1929–1931, data are for groups of registration states as follows: 1900–1902 and 1909–1911, 10 states and the District of Columbia; 1919–1921, 34 states and the District of Columbia. Beginning 1970 excludes deaths of nonresidents of the United States; see Technical Notes]
Age (years), race, and sex
Number of survivors out of 100,000 born alive (lx)
2009 1999–2001 1989–1991 1979–1981 1969–1971 1959–1961 1949–1951 1939–1941 1929–1931 1919–1921 1909–1911 1900–1902
Female—Con.
50 . . . . . . . . . . . 95,612 95,425 94,932 94,060 91,852 91,327 89,075 82,828 75,456 69,452 65,001 60,415 55 . . . . . . . . . . . 93,783 93,609 92,881 91,760 89,066 88,451 85,694 78,708 70,832 65,099 60,392 55,908 60 . . . . . . . . . . . 91,286 90,767 89,742 88,414 85,139 84,430 80,890 73,093 64,795 59,438 54,226 50,155 65 . . . . . . . . . . . 87,638 86,433 85,075 83,520 79,698 78,462 74,119 65,523 56,924 52,126 46,438 43,246 70 . . . . . . . . . . . 82,267 80,219 78,522 76,720 71,955 70,100 64,873 55,449 46,774 42,741 36,916 34,721 75 . . . . . . . . . . . 74,464 71,311 69,287 67,186 61,107 58,394 52,111 42,425 34,600 31,344 26,155 24,994 80 . . . . . . . . . . . 63,307 58,455 56,986 54,372 46,445 43,063 36,486 27,524 21,578 19,613 15,682 15,129 85 . . . . . . . . . . . 48,035 41,830 41,115 37,772 29,538 25,269 20,668 13,972 10,322 9,515 7,051 7,063 90 . . . . . . . . . . . 29,223 23,936 23,666 20,578 14,160 10,056 8,548 5,044 3,656 3,314 2,269 2,306 95 . . . . . . . . . . . 12,228 9,560 9,346 7,862 4,565 2,193 2,207 1,195 807 728 441 452 100 . . . . . . . . . .
White
2,897 2,183 2,251 1,927 954 264 298 179 82 72 49 43
0 . . . . . . . . . . . 100,000 100,000 100,000 100,000 100,000 100,000 100,000 100,000 100,000 100,000 100,000 100,000 1 . . . . . . . . . . . 99,472 99,429 99,233 98,898 98,224 97,714 97,278 95,685 94,392 92,780 88,709 87,762 5 . . . . . . . . . . . 99,376 99,313 99,068 98,675 97,930 97,353 96,790 94,713 92,466 89,771 84,147 82,071
10 . . . . . . . . . . . 99,321 99,239 98,966 98,536 97,733 97,131 96,502 94,228 91,627 88,536 82,734 80,371 15 . . . . . . . . . . . 99,250 99,146 98,843 98,391 97,546 96,928 96,228 93,792 90,982 87,633 81,816 79,344 20 . . . . . . . . . . . 99,000 98,826 98,455 97,939 97,036 96,508 95,763 93,117 89,933 86,159 80,407 77,998 25 . . . . . . . . . . . 98,594 98,406 97,972 97,340 96,406 95,965 95,169 92,213 88,454 84,106 78,392 75,202 30 . . . . . . . . . . . 98,152 98,000 97,451 96,774 95,824 95,440 94,536 91,185 86,836 81,787 76,167 72,317 35 . . . . . . . . . . . 97,639 97,506 96,810 96,192 95,152 94,798 93,750 89,941 85,004 79,277 73,568 69,522 40 . . . . . . . . . . . 96,978 96,799 96,000 95,427 94,190 93,870 92,616 88,318 82,803 76,642 70,525 66,082 45 . . . . . . . . . . . 95,994 95,759 94,932 94,257 92,681 92,374 90,847 86,069 79,989 73,705 67,090 62,920 50 . . . . . . . . . . . 94,475 94,242 93,326 92,384 90,306 89,958 88,110 82,833 76,340 70,250 62,994 58,647 55 . . . . . . . . . . . 92,214 92,050 90,833 89,427 86,688 86,173 84,027 78,218 71,551 65,875 58,163 54,450 60 . . . . . . . . . . . 89,095 88,655 86,943 85,031 81,323 80,811 78,066 71,785 65,100 60,013 51,822 48,288 65 . . . . . . . . . . . 84,696 83,518 81,123 78,585 73,889 73,102 69,850 63,201 56,655 52,411 43,904 41,505 70 . . . . . . . . . . . 78,388 76,219 73,106 69,801 63,991 62,834 59,189 52,165 45,841 42,736 34,484 32,902 75 . . . . . . . . . . . 69,537 66,022 62,175 58,299 51,586 49,895 45,688 38,610 33,406 31,086 24,151 23,356 80 . . . . . . . . . . . 57,363 52,160 48,583 44,409 36,659 34,697 30,438 23,976 20,260 19,149 14,100 13,794 85 . . . . . . . . . . . 41,653 35,461 32,850 28,768 21,578 19,017 16,239 11,483 9,325 9,078 6,178 6,192 90 . . . . . . . . . . . 23,826 18,964 17,571 14,471 9,433 7,149 6,201 3,819 3,066 2,991 1,918 1,919 95 . . . . . . . . . . . 9,189 6,971 6,416 5,067 2,743 1,521 1,500 801 636 643 364 355 100 . . . . . . . . . .
White male
1,983 1,454 1,423 1,105 487 183 196 98 58 62 38 31
0 . . . . . . . . . . . 100,000 100,000 100,000 100,000 100,000 100,000 100,000 100,000 100,000 100,000 100,000 100,000 1 . . . . . . . . . . . 99,423 99,373 99,138 98,769 97,994 97,408 96,931 95,188 93,768 91,975 87,674 86,655 5 . . . . . . . . . . . 99,316 99,243 98,956 98,519 97,671 97,015 96,403 94,150 91,738 88,842 82,972 80,864
10 . . . . . . . . . . . 99,256 99,163 98,839 98,357 97,441 96,758 96,069 93,601 90,810 87,530 81,519 79,109 15 . . . . . . . . . . . 99,174 99,052 98,686 98,176 97,208 96,503 95,728 93,089 90,074 86,546 80,549 78,037 20 . . . . . . . . . . . 98,836 98,616 98,134 97,525 96,480 95,908 95,104 92,293 88,904 84,997 79,116 76,376 25 . . . . . . . . . . . 98,249 98,003 97,430 96,616 95,524 95,106 94,294 91,241 87,371 83,061 77,047 73,907 30 . . . . . . . . . . . 97,643 97,436 96,662 95,783 94,716 94,401 93,489 90,092 85,707 80,888 74,810 71,219 35 . . . . . . . . . . . 96,977 96,774 95,731 94,980 93,843 93,589 92,543 88,713 83,812 78,441 72,108 68,245 40 . . . . . . . . . . . 96,149 95,859 94,588 93,984 92,631 92,427 91,173 86,880 81,457 75,733 68,848 64,954 45 . . . . . . . . . . . 94,947 94,530 93,167 92,494 90,725 90,533 89,002 84,285 78,345 72,696 65,115 61,369 50 . . . . . . . . . . . 93,094 92,588 91,124 90,105 87,690 87,424 85,601 80,521 74,288 69,107 60,741 57,274 55 . . . . . . . . . . . 90,299 89,883 88,022 86,303 83,001 82,463 80,496 75,156 68,981 64,574 55,622 52,491 60 . . . . . . . . . . . 86,434 85,773 83,182 80,625 75,969 75,485 73,172 67,787 61,933 58,498 48,987 46,452 65 . . . . . . . . . . . 81,176 79,657 75,962 72,393 66,343 65,834 63,541 58,305 52,964 50,663 40,862 39,245 70 . . . . . . . . . . . 73,823 71,039 66,181 61,384 54,138 53,825 51,735 46,739 41,880 40,873 31,527 30,640 75 . . . . . . . . . . . 63,847 59,245 53,308 47,712 40,324 40,207 38,104 33,404 29,471 29,205 21,585 21,387 80 . . . . . . . . . . . 50,613 44,121 38,245 32,788 25,885 25,993 24,005 19,860 17,221 17,655 12,160 12,266 85 . . . . . . . . . . . 34,397 27,425 22,720 18,538 13,527 13,065 12,015 9,013 7,572 8,154 5,145 5,252 90 . . . . . . . . . . . 17,574 12,840 10,214 7,891 5,125 4,600 4,209 2,812 2,356 2,568 1,523 1,523 95 . . . . . . . . . . . 5,664 3,899 2,988 2,279 1,274 956 942 552 461 556 289 263 100 . . . . . . . . . . 949 625 523 404 189 115 118 65 40 61 31 22
See footnotes at end of table.
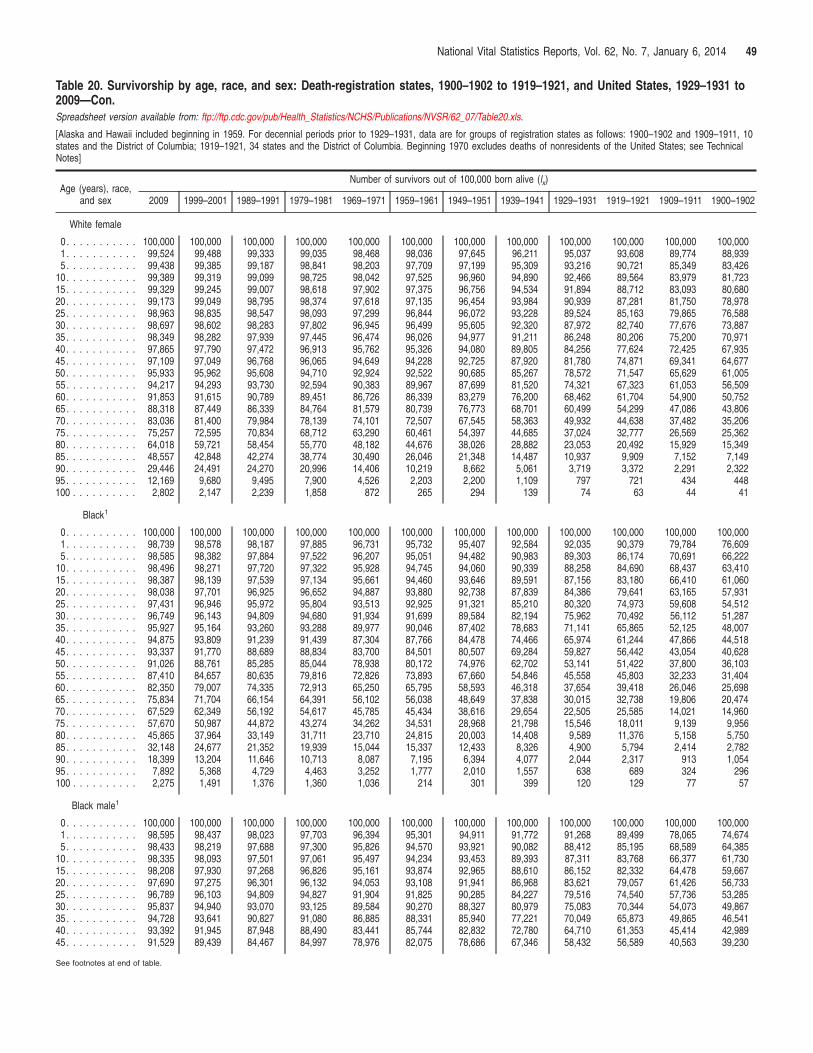
National Vital Statistics Reports, Vol. 62, No. 7, January 6, 2014 49
Table 20. Survivorship by age, race, and sex: Death-registration states, 1900–1902 to 1919–1921, and United States, 1929–1931 to 2009—Con. Spreadsheet version available from: ftp://ftp.cdc.gov/pub/Health_Statistics/NCHS/Publications/NVSR/62_07/Table20.xls.
[Alaska and Hawaii included beginning in 1959. For decennial periods prior to 1929–1931, data are for groups of registration states as follows: 1900–1902 and 1909–1911, 10 states and the District of Columbia; 1919–1921, 34 states and the District of Columbia. Beginning 1970 excludes deaths of nonresidents of the United States; see Technical Notes]
Age (years), race, and sex
Number of survivors out of 100,000 born alive (lx)
2009 1999–2001 1989–1991 1979–1981 1969–1971 1959–1961 1949–1951 1939–1941 1929–1931 1919–1921 1909–1911 1900–1902
White female
0 . . . . . . . . . . . 100,000 100,000 100,000 100,000 100,000 100,000 100,000 100,000 100,000 100,000 100,000 100,000 1 . . . . . . . . . . . 99,524 99,488 99,333 99,035 98,468 98,036 97,645 96,211 95,037 93,608 89,774 88,939 5 . . . . . . . . . . . 99,438 99,385 99,187 98,841 98,203 97,709 97,199 95,309 93,216 90,721 85,349 83,426
10 . . . . . . . . . . . 99,389 99,319 99,099 98,725 98,042 97,525 96,960 94,890 92,466 89,564 83,979 81,723 15 . . . . . . . . . . . 99,329 99,245 99,007 98,618 97,902 97,375 96,756 94,534 91,894 88,712 83,093 80,680 20 . . . . . . . . . . . 99,173 99,049 98,795 98,374 97,618 97,135 96,454 93,984 90,939 87,281 81,750 78,978 25 . . . . . . . . . . . 98,963 98,835 98,547 98,093 97,299 96,844 96,072 93,228 89,524 85,163 79,865 76,588 30 . . . . . . . . . . . 98,697 98,602 98,283 97,802 96,945 96,499 95,605 92,320 87,972 82,740 77,676 73,887 35 . . . . . . . . . . . 98,349 98,282 97,939 97,445 96,474 96,026 94,977 91,211 86,248 80,206 75,200 70,971 40 . . . . . . . . . . . 97,865 97,790 97,472 96,913 95,762 95,326 94,080 89,805 84,256 77,624 72,425 67,935 45 . . . . . . . . . . . 97,109 97,049 96,768 96,065 94,649 94,228 92,725 87,920 81,780 74,871 69,341 64,677 50 . . . . . . . . . . . 95,933 95,962 95,608 94,710 92,924 92,522 90,685 85,267 78,572 71,547 65,629 61,005 55 . . . . . . . . . . . 94,217 94,293 93,730 92,594 90,383 89,967 87,699 81,520 74,321 67,323 61,053 56,509 60 . . . . . . . . . . . 91,853 91,615 90,789 89,451 86,726 86,339 83,279 76,200 68,462 61,704 54,900 50,752 65 . . . . . . . . . . . 88,318 87,449 86,339 84,764 81,579 80,739 76,773 68,701 60,499 54,299 47,086 43,806 70 . . . . . . . . . . . 83,036 81,400 79,984 78,139 74,101 72,507 67,545 58,363 49,932 44,638 37,482 35,206 75 . . . . . . . . . . . 75,257 72,595 70,834 68,712 63,290 60,461 54,397 44,685 37,024 32,777 26,569 25,362 80 . . . . . . . . . . . 64,018 59,721 58,454 55,770 48,182 44,676 38,026 28,882 23,053 20,492 15,929 15,349 85 . . . . . . . . . . . 48,557 42,848 42,274 38,774 30,490 26,046 21,348 14,487 10,937 9,909 7,152 7,149 90 . . . . . . . . . . . 29,446 24,491 24,270 20,996 14,406 10,219 8,662 5,061 3,719 3,372 2,291 2,322 95 . . . . . . . . . . . 12,169 9,680 9,495 7,900 4,526 2,203 2,200 1,109 797 721 434 448 100 . . . . . . . . . . 2,802 2,147 2,239 1,858 872 265 294 139 74 63 44 41
Black1
0 . . . . . . . . . . . 100,000 100,000 100,000 100,000 100,000 100,000 100,000 100,000 100,000 100,000 100,000 100,000 1 . . . . . . . . . . . 98,739 98,578 98,187 97,885 96,731 95,732 95,407 92,584 92,035 90,379 79,784 76,609 5 . . . . . . . . . . . 98,585 98,382 97,884 97,522 96,207 95,051 94,482 90,983 89,303 86,174 70,691 66,222
10 . . . . . . . . . . . 98,496 98,271 97,720 97,322 95,928 94,745 94,060 90,339 88,258 84,690 68,437 63,410 15 . . . . . . . . . . . 98,387 98,139 97,539 97,134 95,661 94,460 93,646 89,591 87,156 83,180 66,410 61,060 20 . . . . . . . . . . . 98,038 97,701 96,925 96,652 94,887 93,880 92,738 87,839 84,386 79,641 63,165 57,931 25 . . . . . . . . . . . 97,431 96,946 95,972 95,804 93,513 92,925 91,321 85,210 80,320 74,973 59,608 54,512 30 . . . . . . . . . . . 96,749 96,143 94,809 94,680 91,934 91,699 89,584 82,194 75,962 70,492 56,112 51,287 35 . . . . . . . . . . . 95,927 95,164 93,260 93,288 89,977 90,046 87,402 78,683 71,141 65,865 52,125 48,007 40 . . . . . . . . . . . 94,875 93,809 91,239 91,439 87,304 87,766 84,478 74,466 65,974 61,244 47,866 44,518 45 . . . . . . . . . . . 93,337 91,770 88,689 88,834 83,700 84,501 80,507 69,284 59,827 56,442 43,054 40,628 50 . . . . . . . . . . . 91,026 88,761 85,285 85,044 78,938 80,172 74,976 62,702 53,141 51,422 37,800 36,103 55 . . . . . . . . . . . 87,410 84,657 80,635 79,816 72,826 73,893 67,660 54,846 45,558 45,803 32,233 31,404 60 . . . . . . . . . . . 82,350 79,007 74,335 72,913 65,250 65,795 58,593 46,318 37,654 39,418 26,046 25,698 65 . . . . . . . . . . . 75,834 71,704 66,154 64,391 56,102 56,038 48,649 37,838 30,015 32,738 19,806 20,474 70 . . . . . . . . . . . 67,529 62,349 56,192 54,617 45,785 45,434 38,616 29,654 22,505 25,585 14,021 14,960 75 . . . . . . . . . . . 57,670 50,987 44,872 43,274 34,262 34,531 28,968 21,798 15,546 18,011 9,139 9,956 80 . . . . . . . . . . . 45,865 37,964 33,149 31,711 23,710 24,815 20,003 14,408 9,589 11,376 5,158 5,750 85 . . . . . . . . . . . 32,148 24,677 21,352 19,939 15,044 15,337 12,433 8,326 4,900 5,794 2,414 2,782 90 . . . . . . . . . . . 18,399 13,204 11,646 10,713 8,087 7,195 6,394 4,077 2,044 2,317 913 1,054 95 . . . . . . . . . . . 7,892 5,368 4,729 4,463 3,252 1,777 2,010 1,557 638 689 324 296 100 . . . . . . . . . . 2,275 1,491 1,376 1,360 1,036 214 301 399 120 129 77 57
Black male1
0 . . . . . . . . . . . 100,000 100,000 100,000 100,000 100,000 100,000 100,000 100,000 100,000 100,000 100,000 100,000 1 . . . . . . . . . . . 98,595 98,437 98,023 97,703 96,394 95,301 94,911 91,772 91,268 89,499 78,065 74,674 5 . . . . . . . . . . . 98,433 98,219 97,688 97,300 95,826 94,570 93,921 90,082 88,412 85,195 68,589 64,385
10 . . . . . . . . . . . 98,335 98,093 97,501 97,061 95,497 94,234 93,453 89,393 87,311 83,768 66,377 61,730 15 . . . . . . . . . . . 98,208 97,930 97,268 96,826 95,161 93,874 92,965 88,610 86,152 82,332 64,478 59,667 20 . . . . . . . . . . . 97,690 97,275 96,301 96,132 94,053 93,108 91,941 86,968 83,621 79,057 61,426 56,733 25 . . . . . . . . . . . 96,789 96,103 94,809 94,827 91,904 91,825 90,285 84,227 79,516 74,540 57,736 53,285 30 . . . . . . . . . . . 95,837 94,940 93,070 93,125 89,584 90,270 88,327 80,979 75,083 70,344 54,073 49,867 35 . . . . . . . . . . . 94,728 93,641 90,827 91,080 86,885 88,331 85,940 77,221 70,049 65,873 49,865 46,541 40 . . . . . . . . . . . 93,392 91,945 87,948 88,490 83,441 85,744 82,832 72,780 64,710 61,353 45,414 42,989 45 . . . . . . . . . . . 91,529 89,439 84,467 84,997 78,976 82,075 78,686 67,346 58,432 56,589 40,563 39,230
See footnotes at end of table.
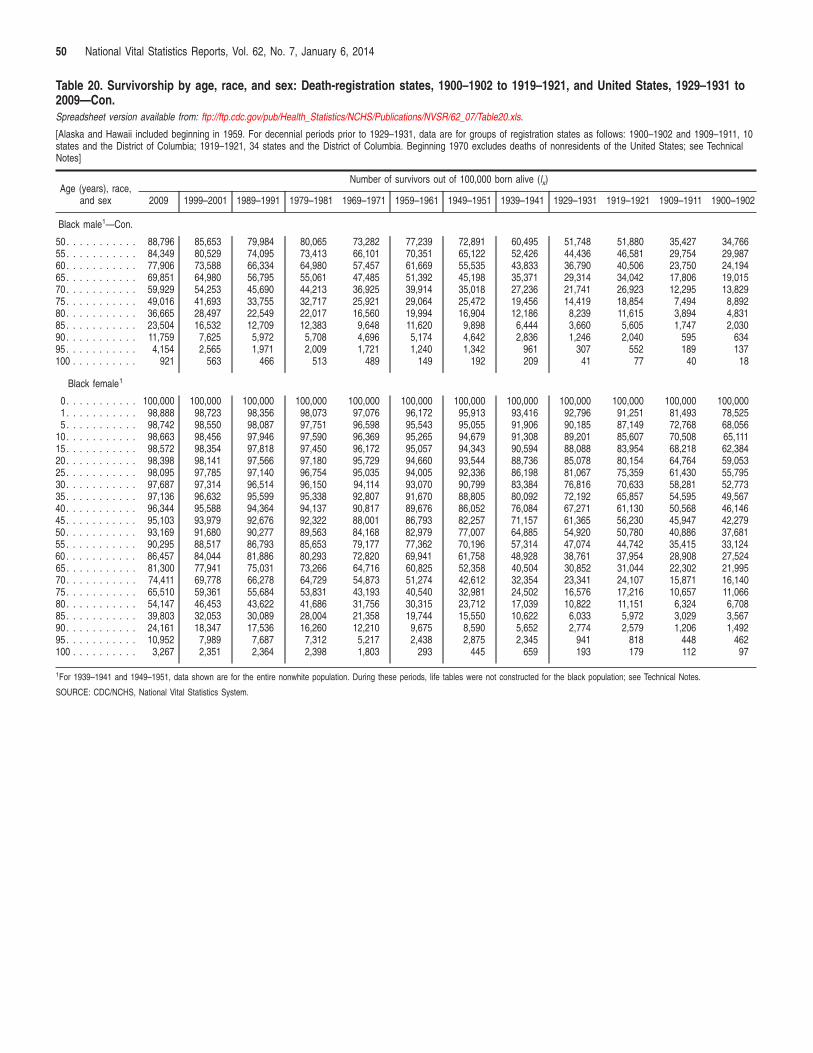
50 National Vital Statistics Reports, Vol. 62, No. 7, January 6, 2014
Table 20. Survivorship by age, race, and sex: Death-registration states, 1900–1902 to 1919–1921, and United States, 1929–1931 to 2009—Con. Spreadsheet version available from: ftp://ftp.cdc.gov/pub/Health_Statistics/NCHS/Publications/NVSR/62_07/Table20.xls.
[Alaska and Hawaii included beginning in 1959. For decennial periods prior to 1929–1931, data are for groups of registration states as follows: 1900–1902 and 1909–1911, 10 states and the District of Columbia; 1919–1921, 34 states and the District of Columbia. Beginning 1970 excludes deaths of nonresidents of the United States; see Technical Notes]
Age (years), race, and sex
Number of survivors out of 100,000 born alive (lx)
2009 1999–2001 1989–1991 1979–1981 1969–1971 1959–1961 1949–1951 1939–1941 1929–1931 1919–1921 1909–1911 1900–1902
Black male1—Con.
50 . . . . . . . . . . . 88,796 85,653 79,984 80,065 73,282 77,239 72,891 60,495 51,748 51,880 35,427 34,766 55 . . . . . . . . . . . 84,349 80,529 74,095 73,413 66,101 70,351 65,122 52,426 44,436 46,581 29,754 29,987 60 . . . . . . . . . . . 77,906 73,588 66,334 64,980 57,457 61,669 55,535 43,833 36,790 40,506 23,750 24,194 65 . . . . . . . . . . . 69,851 64,980 56,795 55,061 47,485 51,392 45,198 35,371 29,314 34,042 17,806 19,015 70 . . . . . . . . . . . 59,929 54,253 45,690 44,213 36,925 39,914 35,018 27,236 21,741 26,923 12,295 13,829 75 . . . . . . . . . . . 49,016 41,693 33,755 32,717 25,921 29,064 25,472 19,456 14,419 18,854 7,494 8,892 80 . . . . . . . . . . . 36,665 28,497 22,549 22,017 16,560 19,994 16,904 12,186 8,239 11,615 3,894 4,831 85 . . . . . . . . . . . 23,504 16,532 12,709 12,383 9,648 11,620 9,898 6,444 3,660 5,605 1,747 2,030 90 . . . . . . . . . . . 11,759 7,625 5,972 5,708 4,696 5,174 4,642 2,836 1,246 2,040 595 634 95 . . . . . . . . . . . 4,154 2,565 1,971 2,009 1,721 1,240 1,342 961 307 552 189 137 100 . . . . . . . . . .
Black female1
921 563 466 513 489 149 192 209 41 77 40 18
0 . . . . . . . . . . . 100,000 100,000 100,000 100,000 100,000 100,000 100,000 100,000 100,000 100,000 100,000 100,000 1 . . . . . . . . . . . 98,888 98,723 98,356 98,073 97,076 96,172 95,913 93,416 92,796 91,251 81,493 78,525 5 . . . . . . . . . . . 98,742 98,550 98,087 97,751 96,598 95,543 95,055 91,906 90,185 87,149 72,768 68,056
10 . . . . . . . . . . . 98,663 98,456 97,946 97,590 96,369 95,265 94,679 91,308 89,201 85,607 70,508 65,111 15 . . . . . . . . . . . 98,572 98,354 97,818 97,450 96,172 95,057 94,343 90,594 88,088 83,954 68,218 62,384 20 . . . . . . . . . . . 98,398 98,141 97,566 97,180 95,729 94,660 93,544 88,736 85,078 80,154 64,764 59,053 25 . . . . . . . . . . . 98,095 97,785 97,140 96,754 95,035 94,005 92,336 86,198 81,067 75,359 61,430 55,795 30 . . . . . . . . . . . 97,687 97,314 96,514 96,150 94,114 93,070 90,799 83,384 76,816 70,633 58,281 52,773 35 . . . . . . . . . . . 97,136 96,632 95,599 95,338 92,807 91,670 88,805 80,092 72,192 65,857 54,595 49,567 40 . . . . . . . . . . . 96,344 95,588 94,364 94,137 90,817 89,676 86,052 76,084 67,271 61,130 50,568 46,146 45 . . . . . . . . . . . 95,103 93,979 92,676 92,322 88,001 86,793 82,257 71,157 61,365 56,230 45,947 42,279 50 . . . . . . . . . . . 93,169 91,680 90,277 89,563 84,168 82,979 77,007 64,885 54,920 50,780 40,886 37,681 55 . . . . . . . . . . . 90,295 88,517 86,793 85,653 79,177 77,362 70,196 57,314 47,074 44,742 35,415 33,124 60 . . . . . . . . . . . 86,457 84,044 81,886 80,293 72,820 69,941 61,758 48,928 38,761 37,954 28,908 27,524 65 . . . . . . . . . . . 81,300 77,941 75,031 73,266 64,716 60,825 52,358 40,504 30,852 31,044 22,302 21,995 70 . . . . . . . . . . . 74,411 69,778 66,278 64,729 54,873 51,274 42,612 32,354 23,341 24,107 15,871 16,140 75 . . . . . . . . . . . 65,510 59,361 55,684 53,831 43,193 40,540 32,981 24,502 16,576 17,216 10,657 11,066 80 . . . . . . . . . . . 54,147 46,453 43,622 41,686 31,756 30,315 23,712 17,039 10,822 11,151 6,324 6,708 85 . . . . . . . . . . . 39,803 32,053 30,089 28,004 21,358 19,744 15,550 10,622 6,033 5,972 3,029 3,567 90 . . . . . . . . . . . 24,161 18,347 17,536 16,260 12,210 9,675 8,590 5,652 2,774 2,579 1,206 1,492 95 . . . . . . . . . . . 10,952 7,989 7,687 7,312 5,217 2,438 2,875 2,345 941 818 448 462 100 . . . . . . . . . . 3,267 2,351 2,364 2,398 1,803 293 445 659 193 179 112 97
1For 1939–1941 and 1949–1951, data shown are for the entire nonwhite population. During these periods, life tables were not constructed for the black population; see Technical Notes.
SOURCE: CDC/NCHS, National Vital Statistics System.
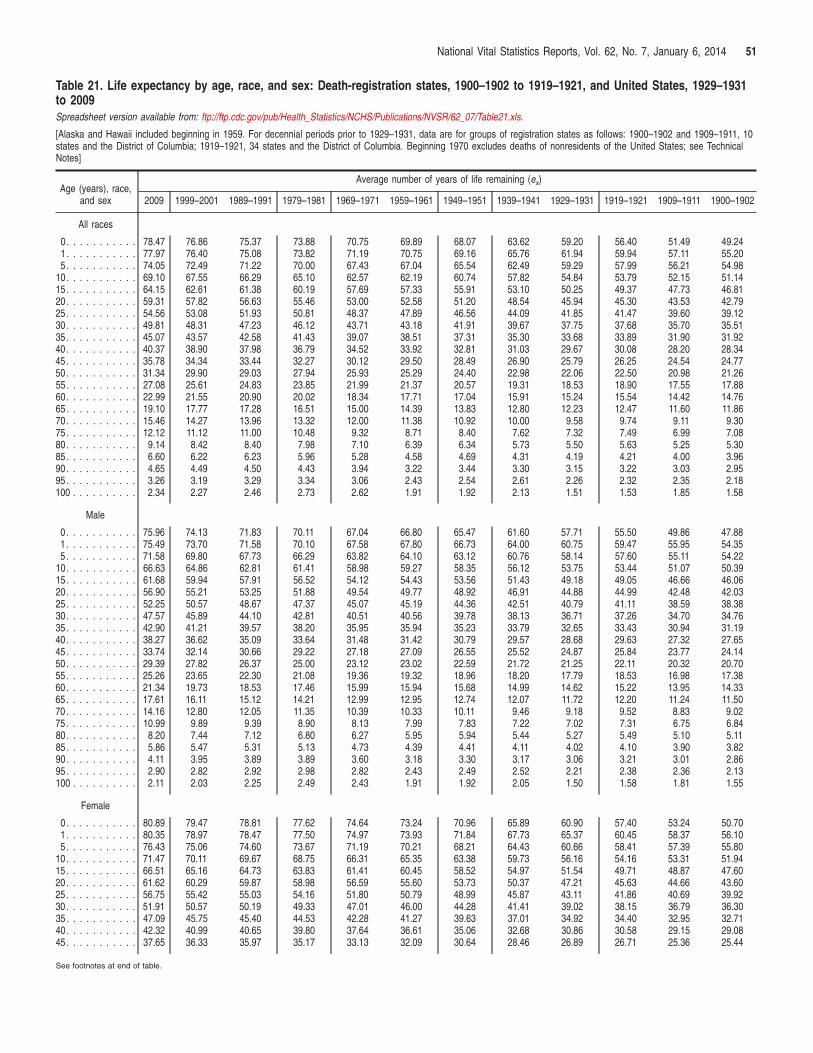
National Vital Statistics Reports, Vol. 62, No. 7, January 6, 2014 51
Table 21. Life expectancy by age, race, and sex: Death-registration states, 1900–1902 to 1919–1921, and United States, 1929–1931 to 2009 Spreadsheet version available from: ftp://ftp.cdc.gov/pub/Health_Statistics/NCHS/Publications/NVSR/62_07/Table21.xls.
[Alaska and Hawaii included beginning in 1959. For decennial periods prior to 1929–1931, data are for groups of registration states as follows: 1900–1902 and 1909–1911, 10 states and the District of Columbia; 1919–1921, 34 states and the District of Columbia. Beginning 1970 excludes deaths of nonresidents of the United States; see Technical Notes]
Age (years), race, and sex
Average number of years of life remaining (ex)
2009 1999–2001 1989–1991 1979–1981 1969–1971 1959–1961 1949–1951 1939–1941 1929–1931 1919–1921 1909–1911 1900–1902
All races
0 . . . . . . . . . . . 78.47 76.86 75.37 73.88 70.75 69.89 68.07 63.62 59.20 56.40 51.49 49.24 1 . . . . . . . . . . . 77.97 76.40 75.08 73.82 71.19 70.75 69.16 65.76 61.94 59.94 57.11 55.20 5 . . . . . . . . . . . 74.05 72.49 71.22 70.00 67.43 67.04 65.54 62.49 59.29 57.99 56.21 54.98
10 . . . . . . . . . . . 69.10 67.55 66.29 65.10 62.57 62.19 60.74 57.82 54.84 53.79 52.15 51.14 15 . . . . . . . . . . . 64.15 62.61 61.38 60.19 57.69 57.33 55.91 53.10 50.25 49.37 47.73 46.81 20 . . . . . . . . . . . 59.31 57.82 56.63 55.46 53.00 52.58 51.20 48.54 45.94 45.30 43.53 42.79 25 . . . . . . . . . . . 54.56 53.08 51.93 50.81 48.37 47.89 46.56 44.09 41.85 41.47 39.60 39.12 30 . . . . . . . . . . . 49.81 48.31 47.23 46.12 43.71 43.18 41.91 39.67 37.75 37.68 35.70 35.51 35 . . . . . . . . . . . 45.07 43.57 42.58 41.43 39.07 38.51 37.31 35.30 33.68 33.89 31.90 31.92 40 . . . . . . . . . . . 40.37 38.90 37.98 36.79 34.52 33.92 32.81 31.03 29.67 30.08 28.20 28.34 45 . . . . . . . . . . . 35.78 34.34 33.44 32.27 30.12 29.50 28.49 26.90 25.79 26.25 24.54 24.77 50 . . . . . . . . . . . 31.34 29.90 29.03 27.94 25.93 25.29 24.40 22.98 22.06 22.50 20.98 21.26 55 . . . . . . . . . . . 27.08 25.61 24.83 23.85 21.99 21.37 20.57 19.31 18.53 18.90 17.55 17.88 60 . . . . . . . . . . . 22.99 21.55 20.90 20.02 18.34 17.71 17.04 15.91 15.24 15.54 14.42 14.76 65 . . . . . . . . . . . 19.10 17.77 17.28 16.51 15.00 14.39 13.83 12.80 12.23 12.47 11.60 11.86 70 . . . . . . . . . . . 15.46 14.27 13.96 13.32 12.00 11.38 10.92 10.00 9.58 9.74 9.11 9.30 75 . . . . . . . . . . . 12.12 11.12 11.00 10.48 9.32 8.71 8.40 7.62 7.32 7.49 6.99 7.08 80 . . . . . . . . . . . 9.14 8.42 8.40 7.98 7.10 6.39 6.34 5.73 5.50 5.63 5.25 5.30 85 . . . . . . . . . . . 6.60 6.22 6.23 5.96 5.28 4.58 4.69 4.31 4.19 4.21 4.00 3.96 90 . . . . . . . . . . . 4.65 4.49 4.50 4.43 3.94 3.22 3.44 3.30 3.15 3.22 3.03 2.95 95 . . . . . . . . . . . 3.26 3.19 3.29 3.34 3.06 2.43 2.54 2.61 2.26 2.32 2.35 2.18 100 . . . . . . . . . . 2.34 2.27 2.46 2.73 2.62 1.91 1.92 2.13 1.51 1.53 1.85 1.58
Male
0 . . . . . . . . . . . 75.96 74.13 71.83 70.11 67.04 66.80 65.47 61.60 57.71 55.50 49.86 47.88 1 . . . . . . . . . . . 75.49 73.70 71.58 70.10 67.58 67.80 66.73 64.00 60.75 59.47 55.95 54.35 5 . . . . . . . . . . . 71.58 69.80 67.73 66.29 63.82 64.10 63.12 60.76 58.14 57.60 55.11 54.22
10 . . . . . . . . . . . 66.63 64.86 62.81 61.41 58.98 59.27 58.35 56.12 53.75 53.44 51.07 50.39 15 . . . . . . . . . . . 61.68 59.94 57.91 56.52 54.12 54.43 53.56 51.43 49.18 49.05 46.66 46.06 20 . . . . . . . . . . . 56.90 55.21 53.25 51.88 49.54 49.77 48.92 46.91 44.88 44.99 42.48 42.03 25 . . . . . . . . . . . 52.25 50.57 48.67 47.37 45.07 45.19 44.36 42.51 40.79 41.11 38.59 38.38 30 . . . . . . . . . . . 47.57 45.89 44.10 42.81 40.51 40.56 39.78 38.13 36.71 37.26 34.70 34.76 35 . . . . . . . . . . . 42.90 41.21 39.57 38.20 35.95 35.94 35.23 33.79 32.65 33.43 30.94 31.19 40 . . . . . . . . . . . 38.27 36.62 35.09 33.64 31.48 31.42 30.79 29.57 28.68 29.63 27.32 27.65 45 . . . . . . . . . . . 33.74 32.14 30.66 29.22 27.18 27.09 26.55 25.52 24.87 25.84 23.77 24.14 50 . . . . . . . . . . . 29.39 27.82 26.37 25.00 23.12 23.02 22.59 21.72 21.25 22.11 20.32 20.70 55 . . . . . . . . . . . 25.26 23.65 22.30 21.08 19.36 19.32 18.96 18.20 17.79 18.53 16.98 17.38 60 . . . . . . . . . . . 21.34 19.73 18.53 17.46 15.99 15.94 15.68 14.99 14.62 15.22 13.95 14.33 65 . . . . . . . . . . . 17.61 16.11 15.12 14.21 12.99 12.95 12.74 12.07 11.72 12.20 11.24 11.50 70 . . . . . . . . . . . 14.16 12.80 12.05 11.35 10.39 10.33 10.11 9.46 9.18 9.52 8.83 9.02 75 . . . . . . . . . . . 10.99 9.89 9.39 8.90 8.13 7.99 7.83 7.22 7.02 7.31 6.75 6.84 80 . . . . . . . . . . . 8.20 7.44 7.12 6.80 6.27 5.95 5.94 5.44 5.27 5.49 5.10 5.11 85 . . . . . . . . . . . 5.86 5.47 5.31 5.13 4.73 4.39 4.41 4.11 4.02 4.10 3.90 3.82 90 . . . . . . . . . . . 4.11 3.95 3.89 3.89 3.60 3.18 3.30 3.17 3.06 3.21 3.01 2.86 95 . . . . . . . . . . . 2.90 2.82 2.92 2.98 2.82 2.43 2.49 2.52 2.21 2.38 2.36 2.13 100 . . . . . . . . . . 2.11 2.03 2.25 2.49 2.43 1.91 1.92 2.05 1.50 1.58 1.81 1.55
Female
0 . . . . . . . . . . . 80.89 79.47 78.81 77.62 74.64 73.24 70.96 65.89 60.90 57.40 53.24 50.70 1 . . . . . . . . . . . 80.35 78.97 78.47 77.50 74.97 73.93 71.84 67.73 65.37 60.45 58.37 56.10 5 . . . . . . . . . . . 76.43 75.06 74.60 73.67 71.19 70.21 68.21 64.43 60.66 58.41 57.39 55.80
10 . . . . . . . . . . . 71.47 70.11 69.67 68.75 66.31 65.35 63.38 59.73 56.16 54.16 53.31 51.94 15 . . . . . . . . . . . 66.51 65.16 64.73 63.83 61.41 60.45 58.52 54.97 51.54 49.71 48.87 47.60 20 . . . . . . . . . . . 61.62 60.29 59.87 58.98 56.59 55.60 53.73 50.37 47.21 45.63 44.66 43.60 25 . . . . . . . . . . . 56.75 55.42 55.03 54.16 51.80 50.79 48.99 45.87 43.11 41.86 40.69 39.92 30 . . . . . . . . . . . 51.91 50.57 50.19 49.33 47.01 46.00 44.28 41.41 39.02 38.15 36.79 36.30 35 . . . . . . . . . . . 47.09 45.75 45.40 44.53 42.28 41.27 39.63 37.01 34.92 34.40 32.95 32.71 40 . . . . . . . . . . . 42.32 40.99 40.65 39.80 37.64 36.61 35.06 32.68 30.86 30.58 29.15 29.08 45 . . . . . . . . . . . 37.65 36.33 35.97 35.17 33.13 32.09 30.64 28.46 26.89 26.71 25.36 25.44
See footnotes at end of table.
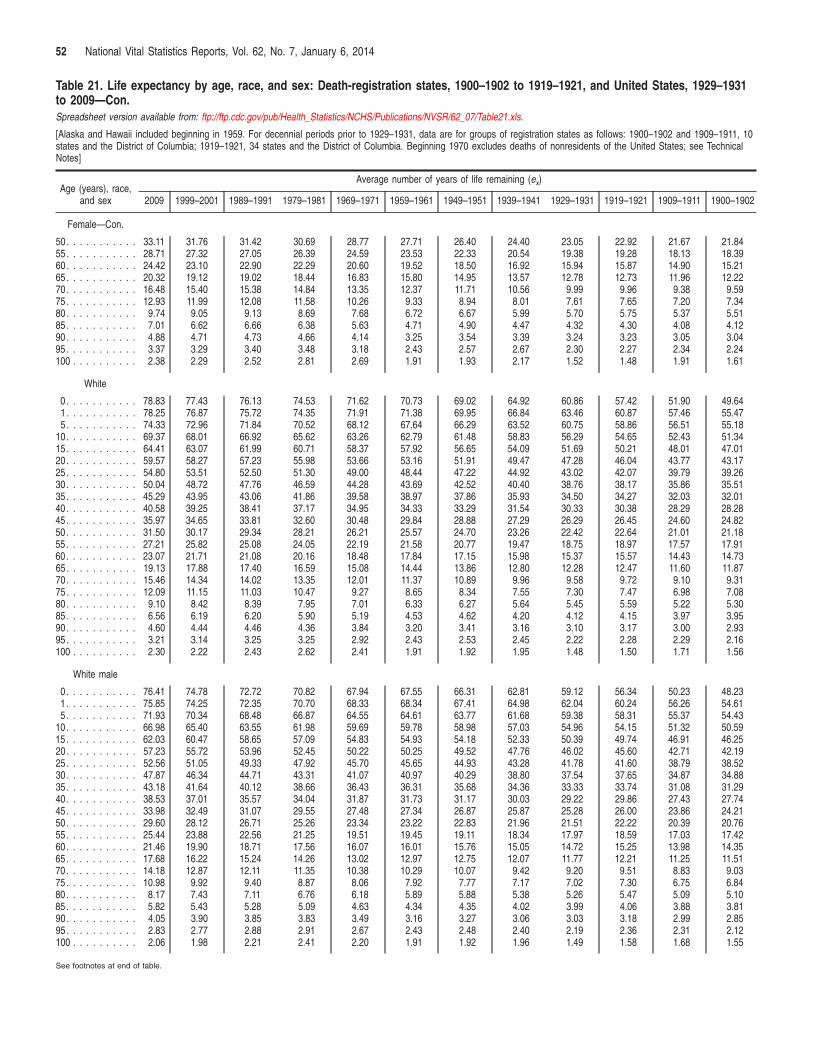
52 National Vital Statistics Reports, Vol. 62, No. 7, January 6, 2014
Table 21. Life expectancy by age, race, and sex: Death-registration states, 1900–1902 to 1919–1921, and United States, 1929–1931 to 2009—Con. Spreadsheet version available from: ftp://ftp.cdc.gov/pub/Health_Statistics/NCHS/Publications/NVSR/62_07/Table21.xls.
[Alaska and Hawaii included beginning in 1959. For decennial periods prior to 1929–1931, data are for groups of registration states as follows: 1900–1902 and 1909–1911, 10 states and the District of Columbia; 1919–1921, 34 states and the District of Columbia. Beginning 1970 excludes deaths of nonresidents of the United States; see Technical Notes]
Age (years), race, and sex
Average number of years of life remaining (ex)
2009 1999–2001 1989–1991 1979–1981 1969–1971 1959–1961 1949–1951 1939–1941 1929–1931 1919–1921 1909–1911 1900–1902
Female—Con.
50 . . . . . . . . . . . 33.11 31.76 31.42 30.69 28.77 27.71 26.40 24.40 23.05 22.92 21.67 21.84 55 . . . . . . . . . . . 28.71 27.32 27.05 26.39 24.59 23.53 22.33 20.54 19.38 19.28 18.13 18.39 60 . . . . . . . . . . . 24.42 23.10 22.90 22.29 20.60 19.52 18.50 16.92 15.94 15.87 14.90 15.21 65 . . . . . . . . . . . 20.32 19.12 19.02 18.44 16.83 15.80 14.95 13.57 12.78 12.73 11.96 12.22 70 . . . . . . . . . . . 16.48 15.40 15.38 14.84 13.35 12.37 11.71 10.56 9.99 9.96 9.38 9.59 75 . . . . . . . . . . . 12.93 11.99 12.08 11.58 10.26 9.33 8.94 8.01 7.61 7.65 7.20 7.34 80 . . . . . . . . . . . 9.74 9.05 9.13 8.69 7.68 6.72 6.67 5.99 5.70 5.75 5.37 5.51 85 . . . . . . . . . . . 7.01 6.62 6.66 6.38 5.63 4.71 4.90 4.47 4.32 4.30 4.08 4.12 90 . . . . . . . . . . . 4.88 4.71 4.73 4.66 4.14 3.25 3.54 3.39 3.24 3.23 3.05 3.04 95 . . . . . . . . . . . 3.37 3.29 3.40 3.48 3.18 2.43 2.57 2.67 2.30 2.27 2.34 2.24 100 . . . . . . . . . . 2.38 2.29 2.52 2.81 2.69 1.91 1.93 2.17 1.52 1.48 1.91 1.61
White
0 . . . . . . . . . . . 78.83 77.43 76.13 74.53 71.62 70.73 69.02 64.92 60.86 57.42 51.90 49.64 1 . . . . . . . . . . . 78.25 76.87 75.72 74.35 71.91 71.38 69.95 66.84 63.46 60.87 57.46 55.47 5 . . . . . . . . . . . 74.33 72.96 71.84 70.52 68.12 67.64 66.29 63.52 60.75 58.86 56.51 55.18
10 . . . . . . . . . . . 69.37 68.01 66.92 65.62 63.26 62.79 61.48 58.83 56.29 54.65 52.43 51.34 15 . . . . . . . . . . . 64.41 63.07 61.99 60.71 58.37 57.92 56.65 54.09 51.69 50.21 48.01 47.01 20 . . . . . . . . . . . 59.57 58.27 57.23 55.98 53.66 53.16 51.91 49.47 47.28 46.04 43.77 43.17 25 . . . . . . . . . . . 54.80 53.51 52.50 51.30 49.00 48.44 47.22 44.92 43.02 42.07 39.79 39.26 30 . . . . . . . . . . . 50.04 48.72 47.76 46.59 44.28 43.69 42.52 40.40 38.76 38.17 35.86 35.51 35 . . . . . . . . . . . 45.29 43.95 43.06 41.86 39.58 38.97 37.86 35.93 34.50 34.27 32.03 32.01 40 . . . . . . . . . . . 40.58 39.25 38.41 37.17 34.95 34.33 33.29 31.54 30.33 30.38 28.29 28.28 45 . . . . . . . . . . . 35.97 34.65 33.81 32.60 30.48 29.84 28.88 27.29 26.29 26.45 24.60 24.82 50 . . . . . . . . . . . 31.50 30.17 29.34 28.21 26.21 25.57 24.70 23.26 22.42 22.64 21.01 21.18 55 . . . . . . . . . . . 27.21 25.82 25.08 24.05 22.19 21.58 20.77 19.47 18.75 18.97 17.57 17.91 60 . . . . . . . . . . . 23.07 21.71 21.08 20.16 18.48 17.84 17.15 15.98 15.37 15.57 14.43 14.73 65 . . . . . . . . . . . 19.13 17.88 17.40 16.59 15.08 14.44 13.86 12.80 12.28 12.47 11.60 11.87 70 . . . . . . . . . . . 15.46 14.34 14.02 13.35 12.01 11.37 10.89 9.96 9.58 9.72 9.10 9.31 75 . . . . . . . . . . . 12.09 11.15 11.03 10.47 9.27 8.65 8.34 7.55 7.30 7.47 6.98 7.08 80 . . . . . . . . . . . 9.10 8.42 8.39 7.95 7.01 6.33 6.27 5.64 5.45 5.59 5.22 5.30 85 . . . . . . . . . . . 6.56 6.19 6.20 5.90 5.19 4.53 4.62 4.20 4.12 4.15 3.97 3.95 90 . . . . . . . . . . . 4.60 4.44 4.46 4.36 3.84 3.20 3.41 3.16 3.10 3.17 3.00 2.93 95 . . . . . . . . . . . 3.21 3.14 3.25 3.25 2.92 2.43 2.53 2.45 2.22 2.28 2.29 2.16 100 . . . . . . . . . . 2.30 2.22 2.43 2.62 2.41 1.91 1.92 1.95 1.48 1.50 1.71 1.56
White male
0 . . . . . . . . . . . 76.41 74.78 72.72 70.82 67.94 67.55 66.31 62.81 59.12 56.34 50.23 48.23 1 . . . . . . . . . . . 75.85 74.25 72.35 70.70 68.33 68.34 67.41 64.98 62.04 60.24 56.26 54.61 5 . . . . . . . . . . . 71.93 70.34 68.48 66.87 64.55 64.61 63.77 61.68 59.38 58.31 55.37 54.43
10 . . . . . . . . . . . 66.98 65.40 63.55 61.98 59.69 59.78 58.98 57.03 54.96 54.15 51.32 50.59 15 . . . . . . . . . . . 62.03 60.47 58.65 57.09 54.83 54.93 54.18 52.33 50.39 49.74 46.91 46.25 20 . . . . . . . . . . . 57.23 55.72 53.96 52.45 50.22 50.25 49.52 47.76 46.02 45.60 42.71 42.19 25 . . . . . . . . . . . 52.56 51.05 49.33 47.92 45.70 45.65 44.93 43.28 41.78 41.60 38.79 38.52 30 . . . . . . . . . . . 47.87 46.34 44.71 43.31 41.07 40.97 40.29 38.80 37.54 37.65 34.87 34.88 35 . . . . . . . . . . . 43.18 41.64 40.12 38.66 36.43 36.31 35.68 34.36 33.33 33.74 31.08 31.29 40 . . . . . . . . . . . 38.53 37.01 35.57 34.04 31.87 31.73 31.17 30.03 29.22 29.86 27.43 27.74 45 . . . . . . . . . . . 33.98 32.49 31.07 29.55 27.48 27.34 26.87 25.87 25.28 26.00 23.86 24.21 50 . . . . . . . . . . . 29.60 28.12 26.71 25.26 23.34 23.22 22.83 21.96 21.51 22.22 20.39 20.76 55 . . . . . . . . . . . 25.44 23.88 22.56 21.25 19.51 19.45 19.11 18.34 17.97 18.59 17.03 17.42 60 . . . . . . . . . . . 21.46 19.90 18.71 17.56 16.07 16.01 15.76 15.05 14.72 15.25 13.98 14.35 65 . . . . . . . . . . . 17.68 16.22 15.24 14.26 13.02 12.97 12.75 12.07 11.77 12.21 11.25 11.51 70 . . . . . . . . . . . 14.18 12.87 12.11 11.35 10.38 10.29 10.07 9.42 9.20 9.51 8.83 9.03 75 . . . . . . . . . . . 10.98 9.92 9.40 8.87 8.06 7.92 7.77 7.17 7.02 7.30 6.75 6.84 80 . . . . . . . . . . . 8.17 7.43 7.11 6.76 6.18 5.89 5.88 5.38 5.26 5.47 5.09 5.10 85 . . . . . . . . . . . 5.82 5.43 5.28 5.09 4.63 4.34 4.35 4.02 3.99 4.06 3.88 3.81 90 . . . . . . . . . . . 4.05 3.90 3.85 3.83 3.49 3.16 3.27 3.06 3.03 3.18 2.99 2.85 95 . . . . . . . . . . . 2.83 2.77 2.88 2.91 2.67 2.43 2.48 2.40 2.19 2.36 2.31 2.12 100 . . . . . . . . . . 2.06 1.98 2.21 2.41 2.20 1.91 1.92 1.96 1.49 1.58 1.68 1.55
See footnotes at end of table.
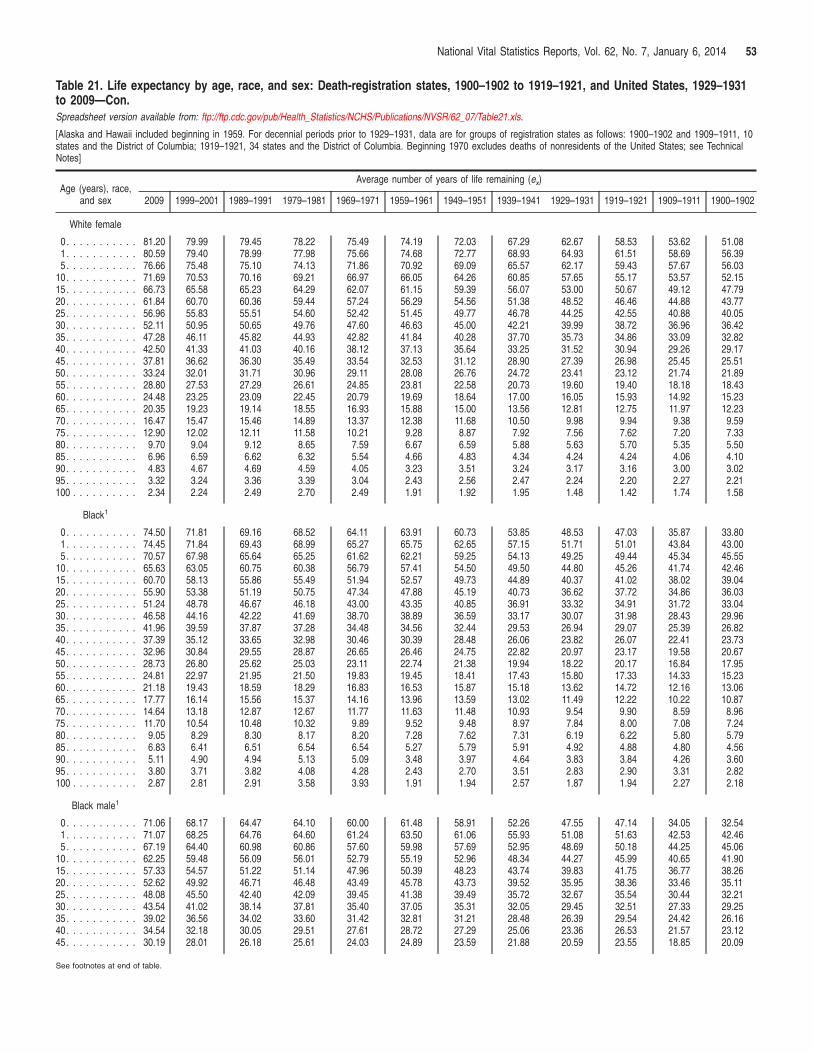
National Vital Statistics Reports, Vol. 62, No. 7, January 6, 2014 53
Table 21. Life expectancy by age, race, and sex: Death-registration states, 1900–1902 to 1919–1921, and United States, 1929–1931 to 2009—Con. Spreadsheet version available from: ftp://ftp.cdc.gov/pub/Health_Statistics/NCHS/Publications/NVSR/62_07/Table21.xls.
[Alaska and Hawaii included beginning in 1959. For decennial periods prior to 1929–1931, data are for groups of registration states as follows: 1900–1902 and 1909–1911, 10 states and the District of Columbia; 1919–1921, 34 states and the District of Columbia. Beginning 1970 excludes deaths of nonresidents of the United States; see Technical Notes]
Age (years), race, and sex
Average number of years of life remaining (ex)
2009 1999–2001 1989–1991 1979–1981 1969–1971 1959–1961 1949–1951 1939–1941 1929–1931 1919–1921 1909–1911 1900–1902
White female
0 . . . . . . . . . . . 81.20 79.99 79.45 78.22 75.49 74.19 72.03 67.29 62.67 58.53 53.62 51.08 1 . . . . . . . . . . . 80.59 79.40 78.99 77.98 75.66 74.68 72.77 68.93 64.93 61.51 58.69 56.39 5 . . . . . . . . . . . 76.66 75.48 75.10 74.13 71.86 70.92 69.09 65.57 62.17 59.43 57.67 56.03
10 . . . . . . . . . . . 71.69 70.53 70.16 69.21 66.97 66.05 64.26 60.85 57.65 55.17 53.57 52.15 15 . . . . . . . . . . . 66.73 65.58 65.23 64.29 62.07 61.15 59.39 56.07 53.00 50.67 49.12 47.79 20 . . . . . . . . . . . 61.84 60.70 60.36 59.44 57.24 56.29 54.56 51.38 48.52 46.46 44.88 43.77 25 . . . . . . . . . . . 56.96 55.83 55.51 54.60 52.42 51.45 49.77 46.78 44.25 42.55 40.88 40.05 30 . . . . . . . . . . . 52.11 50.95 50.65 49.76 47.60 46.63 45.00 42.21 39.99 38.72 36.96 36.42 35 . . . . . . . . . . . 47.28 46.11 45.82 44.93 42.82 41.84 40.28 37.70 35.73 34.86 33.09 32.82 40 . . . . . . . . . . . 42.50 41.33 41.03 40.16 38.12 37.13 35.64 33.25 31.52 30.94 29.26 29.17 45 . . . . . . . . . . . 37.81 36.62 36.30 35.49 33.54 32.53 31.12 28.90 27.39 26.98 25.45 25.51 50 . . . . . . . . . . . 33.24 32.01 31.71 30.96 29.11 28.08 26.76 24.72 23.41 23.12 21.74 21.89 55 . . . . . . . . . . . 28.80 27.53 27.29 26.61 24.85 23.81 22.58 20.73 19.60 19.40 18.18 18.43 60 . . . . . . . . . . . 24.48 23.25 23.09 22.45 20.79 19.69 18.64 17.00 16.05 15.93 14.92 15.23 65 . . . . . . . . . . . 20.35 19.23 19.14 18.55 16.93 15.88 15.00 13.56 12.81 12.75 11.97 12.23 70 . . . . . . . . . . . 16.47 15.47 15.46 14.89 13.37 12.38 11.68 10.50 9.98 9.94 9.38 9.59 75 . . . . . . . . . . . 12.90 12.02 12.11 11.58 10.21 9.28 8.87 7.92 7.56 7.62 7.20 7.33 80 . . . . . . . . . . . 9.70 9.04 9.12 8.65 7.59 6.67 6.59 5.88 5.63 5.70 5.35 5.50 85 . . . . . . . . . . . 6.96 6.59 6.62 6.32 5.54 4.66 4.83 4.34 4.24 4.24 4.06 4.10 90 . . . . . . . . . . . 4.83 4.67 4.69 4.59 4.05 3.23 3.51 3.24 3.17 3.16 3.00 3.02 95 . . . . . . . . . . . 3.32 3.24 3.36 3.39 3.04 2.43 2.56 2.47 2.24 2.20 2.27 2.21 100 . . . . . . . . . . 2.34 2.24 2.49 2.70 2.49 1.91 1.92 1.95 1.48 1.42 1.74 1.58
Black1
0 . . . . . . . . . . . 74.50 71.81 69.16 68.52 64.11 63.91 60.73 53.85 48.53 47.03 35.87 33.80 1 . . . . . . . . . . . 74.45 71.84 69.43 68.99 65.27 65.75 62.65 57.15 51.71 51.01 43.84 43.00 5 . . . . . . . . . . . 70.57 67.98 65.64 65.25 61.62 62.21 59.25 54.13 49.25 49.44 45.34 45.55
10 . . . . . . . . . . . 65.63 63.05 60.75 60.38 56.79 57.41 54.50 49.50 44.80 45.26 41.74 42.46 15 . . . . . . . . . . . 60.70 58.13 55.86 55.49 51.94 52.57 49.73 44.89 40.37 41.02 38.02 39.04 20 . . . . . . . . . . . 55.90 53.38 51.19 50.75 47.34 47.88 45.19 40.73 36.62 37.72 34.86 36.03 25 . . . . . . . . . . . 51.24 48.78 46.67 46.18 43.00 43.35 40.85 36.91 33.32 34.91 31.72 33.04 30 . . . . . . . . . . . 46.58 44.16 42.22 41.69 38.70 38.89 36.59 33.17 30.07 31.98 28.43 29.96 35 . . . . . . . . . . . 41.96 39.59 37.87 37.28 34.48 34.56 32.44 29.53 26.94 29.07 25.39 26.82 40 . . . . . . . . . . . 37.39 35.12 33.65 32.98 30.46 30.39 28.48 26.06 23.82 26.07 22.41 23.73 45 . . . . . . . . . . . 32.96 30.84 29.55 28.87 26.65 26.46 24.75 22.82 20.97 23.17 19.58 20.67 50 . . . . . . . . . . . 28.73 26.80 25.62 25.03 23.11 22.74 21.38 19.94 18.22 20.17 16.84 17.95 55 . . . . . . . . . . . 24.81 22.97 21.95 21.50 19.83 19.45 18.41 17.43 15.80 17.33 14.33 15.23 60 . . . . . . . . . . . 21.18 19.43 18.59 18.29 16.83 16.53 15.87 15.18 13.62 14.72 12.16 13.06 65 . . . . . . . . . . . 17.77 16.14 15.56 15.37 14.16 13.96 13.59 13.02 11.49 12.22 10.22 10.87 70 . . . . . . . . . . . 14.64 13.18 12.87 12.67 11.77 11.63 11.48 10.93 9.54 9.90 8.59 8.96 75 . . . . . . . . . . . 11.70 10.54 10.48 10.32 9.89 9.52 9.48 8.97 7.84 8.00 7.08 7.24 80 . . . . . . . . . . . 9.05 8.29 8.30 8.17 8.20 7.28 7.62 7.31 6.19 6.22 5.80 5.79 85 . . . . . . . . . . . 6.83 6.41 6.51 6.54 6.54 5.27 5.79 5.91 4.92 4.88 4.80 4.56 90 . . . . . . . . . . . 5.11 4.90 4.94 5.13 5.09 3.48 3.97 4.64 3.83 3.84 4.26 3.60 95 . . . . . . . . . . . 3.80 3.71 3.82 4.08 4.28 2.43 2.70 3.51 2.83 2.90 3.31 2.82 100 . . . . . . . . . . 2.87 2.81 2.91 3.58 3.93 1.91 1.94 2.57 1.87 1.94 2.27 2.18
Black male1
0 . . . . . . . . . . . 71.06 68.17 64.47 64.10 60.00 61.48 58.91 52.26 47.55 47.14 34.05 32.54 1 . . . . . . . . . . . 71.07 68.25 64.76 64.60 61.24 63.50 61.06 55.93 51.08 51.63 42.53 42.46 5 . . . . . . . . . . . 67.19 64.40 60.98 60.86 57.60 59.98 57.69 52.95 48.69 50.18 44.25 45.06
10 . . . . . . . . . . . 62.25 59.48 56.09 56.01 52.79 55.19 52.96 48.34 44.27 45.99 40.65 41.90 15 . . . . . . . . . . . 57.33 54.57 51.22 51.14 47.96 50.39 48.23 43.74 39.83 41.75 36.77 38.26 20 . . . . . . . . . . . 52.62 49.92 46.71 46.48 43.49 45.78 43.73 39.52 35.95 38.36 33.46 35.11 25 . . . . . . . . . . . 48.08 45.50 42.40 42.09 39.45 41.38 39.49 35.72 32.67 35.54 30.44 32.21 30 . . . . . . . . . . . 43.54 41.02 38.14 37.81 35.40 37.05 35.31 32.05 29.45 32.51 27.33 29.25 35 . . . . . . . . . . . 39.02 36.56 34.02 33.60 31.42 32.81 31.21 28.48 26.39 29.54 24.42 26.16 40 . . . . . . . . . . . 34.54 32.18 30.05 29.51 27.61 28.72 27.29 25.06 23.36 26.53 21.57 23.12 45 . . . . . . . . . . . 30.19 28.01 26.18 25.61 24.03 24.89 23.59 21.88 20.59 23.55 18.85 20.09
See footnotes at end of table.
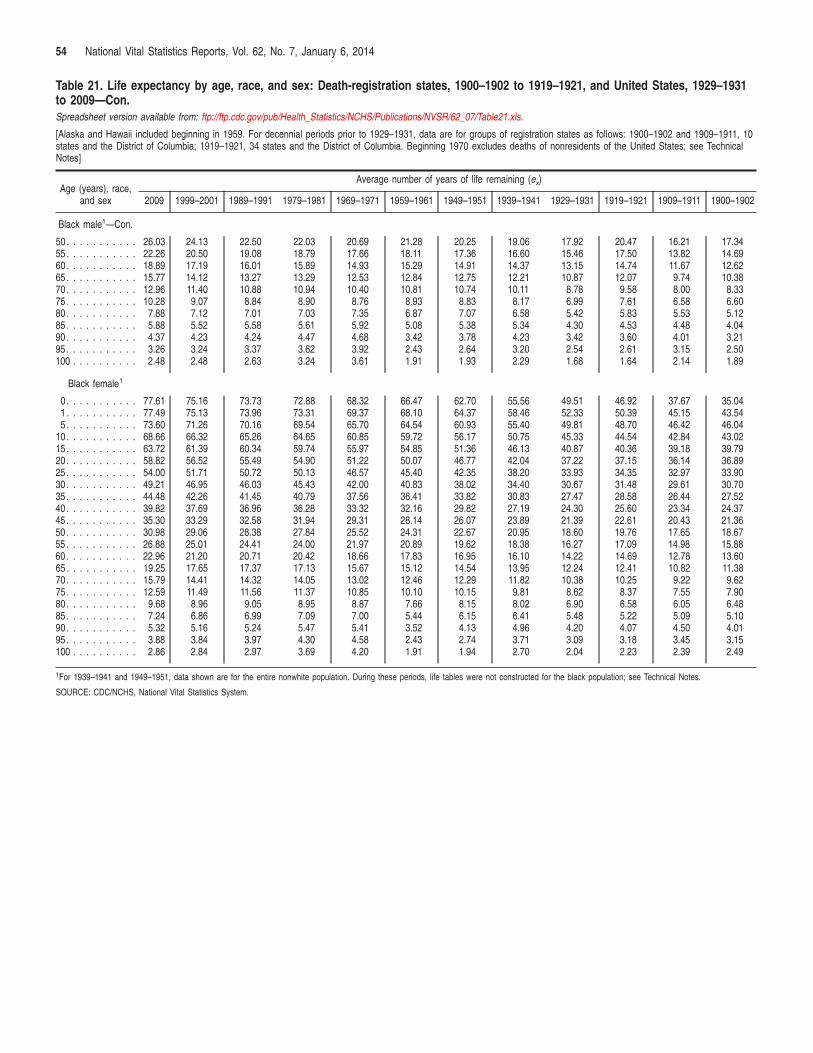
54 National Vital Statistics Reports, Vol. 62, No. 7, January 6, 2014
Table 21. Life expectancy by age, race, and sex: Death-registration states, 1900–1902 to 1919–1921, and United States, 1929–1931 to 2009—Con. Spreadsheet version available from: ftp://ftp.cdc.gov/pub/Health_Statistics/NCHS/Publications/NVSR/62_07/Table21.xls.
[Alaska and Hawaii included beginning in 1959. For decennial periods prior to 1929–1931, data are for groups of registration states as follows: 1900–1902 and 1909–1911, 10 states and the District of Columbia; 1919–1921, 34 states and the District of Columbia. Beginning 1970 excludes deaths of nonresidents of the United States; see Technical Notes]
Age (years), race, and sex
Average number of years of life remaining (ex)
2009 1999–2001 1989–1991 1979–1981 1969–1971 1959–1961 1949–1951 1939–1941 1929–1931 1919–1921 1909–1911 1900–1902
Black male1—Con.
50 . . . . . . . . . . . 26.03 24.13 22.50 22.03 20.69 21.28 20.25 19.06 17.92 20.47 16.21 17.34 55 . . . . . . . . . . . 22.26 20.50 19.08 18.79 17.66 18.11 17.36 16.60 15.46 17.50 13.82 14.69 60 . . . . . . . . . . . 18.89 17.19 16.01 15.89 14.93 15.29 14.91 14.37 13.15 14.74 11.67 12.62 65 . . . . . . . . . . . 15.77 14.12 13.27 13.29 12.53 12.84 12.75 12.21 10.87 12.07 9.74 10.38 70 . . . . . . . . . . . 12.96 11.40 10.88 10.94 10.40 10.81 10.74 10.11 8.78 9.58 8.00 8.33 75 . . . . . . . . . . . 10.28 9.07 8.84 8.90 8.76 8.93 8.83 8.17 6.99 7.61 6.58 6.60 80 . . . . . . . . . . . 7.88 7.12 7.01 7.03 7.35 6.87 7.07 6.58 5.42 5.83 5.53 5.12 85 . . . . . . . . . . . 5.88 5.52 5.58 5.61 5.92 5.08 5.38 5.34 4.30 4.53 4.48 4.04 90 . . . . . . . . . . . 4.37 4.23 4.24 4.47 4.68 3.42 3.78 4.23 3.42 3.60 4.01 3.21 95 . . . . . . . . . . . 3.26 3.24 3.37 3.62 3.92 2.43 2.64 3.20 2.54 2.61 3.15 2.50 100 . . . . . . . . . . 2.48 2.48 2.63 3.24 3.61 1.91 1.93 2.29 1.68 1.64 2.14 1.89
Black female1
0 . . . . . . . . . . . 77.61 75.16 73.73 72.88 68.32 66.47 62.70 55.56 49.51 46.92 37.67 35.04 1 . . . . . . . . . . . 77.49 75.13 73.96 73.31 69.37 68.10 64.37 58.46 52.33 50.39 45.15 43.54 5 . . . . . . . . . . . 73.60 71.26 70.16 69.54 65.70 64.54 60.93 55.40 49.81 48.70 46.42 46.04
10 . . . . . . . . . . . 68.66 66.32 65.26 64.65 60.85 59.72 56.17 50.75 45.33 44.54 42.84 43.02 15 . . . . . . . . . . . 63.72 61.39 60.34 59.74 55.97 54.85 51.36 46.13 40.87 40.36 39.18 39.79 20 . . . . . . . . . . . 58.82 56.52 55.49 54.90 51.22 50.07 46.77 42.04 37.22 37.15 36.14 36.89 25 . . . . . . . . . . . 54.00 51.71 50.72 50.13 46.57 45.40 42.35 38.20 33.93 34.35 32.97 33.90 30 . . . . . . . . . . . 49.21 46.95 46.03 45.43 42.00 40.83 38.02 34.40 30.67 31.48 29.61 30.70 35 . . . . . . . . . . . 44.48 42.26 41.45 40.79 37.56 36.41 33.82 30.83 27.47 28.58 26.44 27.52 40 . . . . . . . . . . . 39.82 37.69 36.96 36.28 33.32 32.16 29.82 27.19 24.30 25.60 23.34 24.37 45 . . . . . . . . . . . 35.30 33.29 32.58 31.94 29.31 28.14 26.07 23.89 21.39 22.61 20.43 21.36 50 . . . . . . . . . . . 30.98 29.06 28.38 27.84 25.52 24.31 22.67 20.95 18.60 19.76 17.65 18.67 55 . . . . . . . . . . . 26.88 25.01 24.41 24.00 21.97 20.89 19.62 18.38 16.27 17.09 14.98 15.88 60 . . . . . . . . . . . 22.96 21.20 20.71 20.42 18.66 17.83 16.95 16.10 14.22 14.69 12.78 13.60 65 . . . . . . . . . . . 19.25 17.65 17.37 17.13 15.67 15.12 14.54 13.95 12.24 12.41 10.82 11.38 70 . . . . . . . . . . . 15.79 14.41 14.32 14.05 13.02 12.46 12.29 11.82 10.38 10.25 9.22 9.62 75 . . . . . . . . . . . 12.59 11.49 11.56 11.37 10.85 10.10 10.15 9.81 8.62 8.37 7.55 7.90 80 . . . . . . . . . . . 9.68 8.96 9.05 8.95 8.87 7.66 8.15 8.02 6.90 6.58 6.05 6.48 85 . . . . . . . . . . . 7.24 6.86 6.99 7.09 7.00 5.44 6.15 6.41 5.48 5.22 5.09 5.10 90 . . . . . . . . . . . 5.32 5.16 5.24 5.47 5.41 3.52 4.13 4.96 4.20 4.07 4.50 4.01 95 . . . . . . . . . . . 3.88 3.84 3.97 4.30 4.58 2.43 2.74 3.71 3.09 3.18 3.45 3.15 100 . . . . . . . . . . 2.86 2.84 2.97 3.69 4.20 1.91 1.94 2.70 2.04 2.23 2.39 2.49
1For 1939–1941 and 1949–1951, data shown are for the entire nonwhite population. During these periods, life tables were not constructed for the black population; see Technical Notes.
SOURCE: CDC/NCHS, National Vital Statistics System.
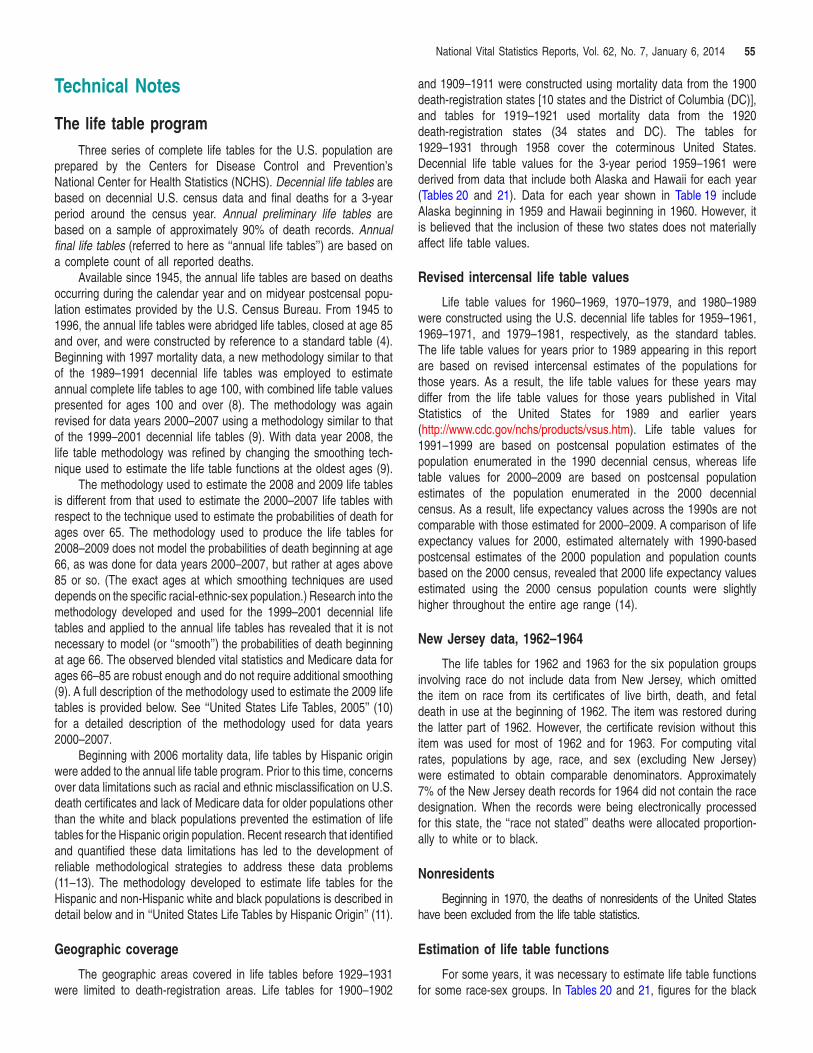
National Vital Statistics Reports, Vol. 62, No. 7, January 6, 2014 55
Technical Notes
The life table program
Three series of complete life tables for the U.S. population are prepared by the Centers for Disease Control and Prevention’s National Center for Health Statistics (NCHS). Decennial life tables are based on decennial U.S. census data and final deaths for a 3-year period around the census year. Annual preliminary life tables are based on a sample of approximately 90% of death records. Annual final life tables (referred to here as ‘‘annual life tables’’) are based on a complete count of all reported deaths.
Available since 1945, the annual life tables are based on deaths occurring during the calendar year and on midyear postcensal population estimates provided by the U.S. Census Bureau. From 1945 to 1996, the annual life tables were abridged life tables, closed at age 85 and over, and were constructed by reference to a standard table (4). Beginning with 1997 mortality data, a new methodology similar to that of the 1989–1991 decennial life tables was employed to estimate annual complete life tables to age 100, with combined life table values presented for ages 100 and over (8). The methodology was again revised for data years 2000–2007 using a methodology similar to that of the 1999–2001 decennial life tables (9). With data year 2008, the life table methodology was refined by changing the smoothing technique used to estimate the life table functions at the oldest ages (9).
The methodology used to estimate the 2008 and 2009 life tables is different from that used to estimate the 2000–2007 life tables with respect to the technique used to estimate the probabilities of death for ages over 65. The methodology used to produce the life tables for 2008–2009 does not model the probabilities of death beginning at age 66, as was done for data years 2000–2007, but rather at ages above 85 or so. (The exact ages at which smoothing techniques are used depends on the specific racial-ethnic-sex population.) Research into the methodology developed and used for the 1999–2001 decennial life tables and applied to the annual life tables has revealed that it is not necessary to model (or ‘‘smooth’’) the probabilities of death beginning at age 66. The observed blended vital statistics and Medicare data for ages 66–85 are robust enough and do not require additional smoothing (9). A full description of the methodology used to estimate the 2009 life tables is provided below. See ‘‘United States Life Tables, 2005’’ (10) for a detailed description of the methodology used for data years 2000–2007.
Beginning with 2006 mortality data, life tables by Hispanic origin were added to the annual life table program. Prior to this time, concerns over data limitations such as racial and ethnic misclassification on U.S. death certificates and lack of Medicare data for older populations other than the white and black populations prevented the estimation of life tables for the Hispanic origin population. Recent research that identified and quantified these data limitations has led to the development of reliable methodological strategies to address these data problems (11–13). The methodology developed to estimate life tables for the Hispanic and non-Hispanic white and black populations is described in detail below and in ‘‘United States Life Tables by Hispanic Origin’’ (11).
Geographic coverage
The geographic areas covered in life tables before 1929–1931 were limited to death-registration areas. Life tables for 1900–1902
and 1909–1911 were constructed using mortality data from the 1900 death-registration states [10 states and the District of Columbia (DC)], and tables for 1919–1921 used mortality data from the 1920 death-registration states (34 states and DC). The tables for 1929–1931 through 1958 cover the coterminous United States. Decennial life table values for the 3-year period 1959–1961 were derived from data that include both Alaska and Hawaii for each year (Tables 20 and 21). Data for each year shown in Table 19 include Alaska beginning in 1959 and Hawaii beginning in 1960. However, it is believed that the inclusion of these two states does not materially affect life table values.
Revised intercensal life table values
Life table values for 1960–1969, 1970–1979, and 1980–1989 were constructed using the U.S. decennial life tables for 1959–1961, 1969–1971, and 1979–1981, respectively, as the standard tables. The life table values for years prior to 1989 appearing in this report are based on revised intercensal estimates of the populations for those years. As a result, the life table values for these years may differ from the life table values for those years published in Vital Statistics of the United States for 1989 and earlier years (http://www.cdc.gov/nchs/products/vsus.htm). Life table values for 1991–1999 are based on postcensal population estimates of the population enumerated in the 1990 decennial census, whereas life table values for 2000–2009 are based on postcensal population estimates of the population enumerated in the 2000 decennial census. As a result, life expectancy values across the 1990s are not comparable with those estimated for 2000–2009. A comparison of life expectancy values for 2000, estimated alternately with 1990-based postcensal estimates of the 2000 population and population counts based on the 2000 census, revealed that 2000 life expectancy values estimated using the 2000 census population counts were slightly higher throughout the entire age range (14).
New Jersey data, 1962–1964
The life tables for 1962 and 1963 for the six population groups involving race do not include data from New Jersey, which omitted the item on race from its certificates of live birth, death, and fetal death in use at the beginning of 1962. The item was restored during the latter part of 1962. However, the certificate revision without this item was used for most of 1962 and for 1963. For computing vital rates, populations by age, race, and sex (excluding New Jersey) were estimated to obtain comparable denominators. Approximately 7% of the New Jersey death records for 1964 did not contain the race designation. When the records were being electronically processed for this state, the ‘‘race not stated’’ deaths were allocated proportionally to white or to black.
Nonresidents
Beginning in 1970, the deaths of nonresidents of the United States have been excluded from the life table statistics.
Estimation of life table functions
For some years, it was necessary to estimate life table functions for some race-sex groups. In Tables 20 and 21, figures for the black
56 National Vital Statistics Reports, Vol. 62, No. 7, January 6, 2014
population during the periods 1939–1941 and 1949–1951 were estimated using figures for the nonwhite population. Life table functions also were missing in Tables 20 and 21 for some race-sex groups for the periods from 1900–1902 to 1939–1941. Figures were missing for the following groups:
These missing figures were estimated by weighted averages using population distributions as the weights. For example, life expectancy at age 20 for the total black population was estimated by a weighted average of black male and black female life expectancies at age 20, using as weights the population distribution by sex of the black population aged 20.
Annual life tables were initiated in 1945 for white males, white females, all other males, and all other females. The figures in Table 19 by race and sex for the following years were estimated using a procedure other than the abridged life table methodology (15):
Years Race and sex
1900–1945 . . . . . . . . . . . . . . . . . Total 1900–1947 . . . . . . . . . . . . . . . . . Male 1900–1947 . . . . . . . . . . . . . . . . . Female 1900–1950 . . . . . . . . . . . . . . . . . White 1900–1944 . . . . . . . . . . . . . . . . . White male 1900–1944 . . . . . . . . . . . . . . . . . White female
Annual life table functions were not calculated for the black population prior to 1970. In Table 19, life expectancy for the black population for years prior to 1970 is estimated using figures for the total nonwhite population.
Data for calculating life table functions
The data used to prepare the U.S. life tables include final death counts from the National Vital Statistics System (NVSS), population estimates from the U.S. Census Bureau, and death and population counts for Medicare beneficiaries aged 66–99 from the Centers for Medicare & Medicaid Services (CMS).
Vital statistics data
Death counts used for computing the life tables presented in this report are final numbers of deaths for 2009 collected from death certificates filed in state vital statistics offices and reported to NCHS as part of NVSS. Race and Hispanic origin are reported separately on the death certificate.
The U.S. Standard Certificate of Death was revised in 2003, and its race and Hispanic origin items reflect the mandate of the 1997 Office of Management and Budget (OMB) standards (16). This revision allowed individuals to report more than one race and increased the race choices from four to five by separating the Asian and Pacific Islander groups. In 2009, 30 states and DC had adopted the 1997 OMB standards, while 20 others continued to collect race and ethnicity data
Years Race and sex
1900–1902 . . . . . . . . Total white, total black 1909–1911 . . . . . . . . Total white, total black 1919–1921 . . . . . . . . Total, male, female, total white, total black 1929–1931 . . . . . . . . Total, male, female, total white, total black
according to the 1977 OMB standards (17). To attain uniformity and comparability during the transition period until all states implement the 1997 standards, multiple-race responses are ‘‘bridged’’ back to the 1977 single-race standard, and Asian and Pacific Islander groups are combined according to the 1977 standards. The bridging procedure is the same as that used to bridge multiple-race population estimates, as discussed below (18).
Census population data
The population data used to estimate the life tables shown in this report were produced under a collaborative agreement with the U.S. Census Bureau and are consistent with the postcensal estimates of the 2000 census. Reflecting the 1997 OMB guidelines on race and ethnicity reporting (16), the 2000 census included an option for individuals to report more than one race and provided for the reporting of Asian persons separately from Native Hawaiian or other Pacific Islander persons. Death certificate data by race for states that have not yet implemented the 1997 OMB standards are thus currently incompatible with the population data collected in the 2000 census (the denominators for the rates). To produce death rates for 2009, it was necessary to bridge the reported population data for multiple-race persons back to single-race categories. In addition, the 2000 census counts were modified to be consistent with the 1977 OMB race categories, that is, to report the data for Asian persons and Native Hawaiian or other Pacific Islander persons as a combined category (Asian or Pacific Islander) and to reflect age as of the census reference date (19). The procedures used to produce the bridged populations are described elsewhere (18).
Medicare data
Medicare data have traditionally been employed in the estimation of U.S. decennial life tables and in the estimation of U.S. annual life tables since 1997 (8). Medicare data are considered to be more accurate than vital statistics and census data at the oldest ages because Medicare enrollees must have proof of age in order to enroll (20). However, the reliability of Medicare data beyond age 100 declines because of the small percentage of persons who enrolled at the start of the Medicare program in 1965 and for whom it was not possible to verify exact age (20). Further, the Medicare race and ethnicity classification system makes it impossible to correctly identify the Hispanic, American Indian or Alaska Native, or Asian or Pacific Islander populations (11,21). It is, however, possible to use Medicare data to estimate old-age mortality for both the white and black race groups, irrespective of Hispanic origin, as has been done traditionally, and to estimate old-age mortality for the non-Hispanic segments of these populations (11). As a result, data from the Medicare program are used to supplement vital statistics and census data for ages 66–99 for the total population and for the white, black, non-Hispanic white, and non-Hispanic black populations (11).
To estimate death rates for the Medicare white, black, non-Hispanic white, and non-Hispanic black populations in 2009, age-specific numbers of deaths and population counts by sex and race for the population aged 66–99 from the 2011 and 2012 Medicare files were used. The data files are created by CMS for the Social Security Administration, which shares the files with NCHS under a special agreement. The 2011 file contains final Medicare population counts as
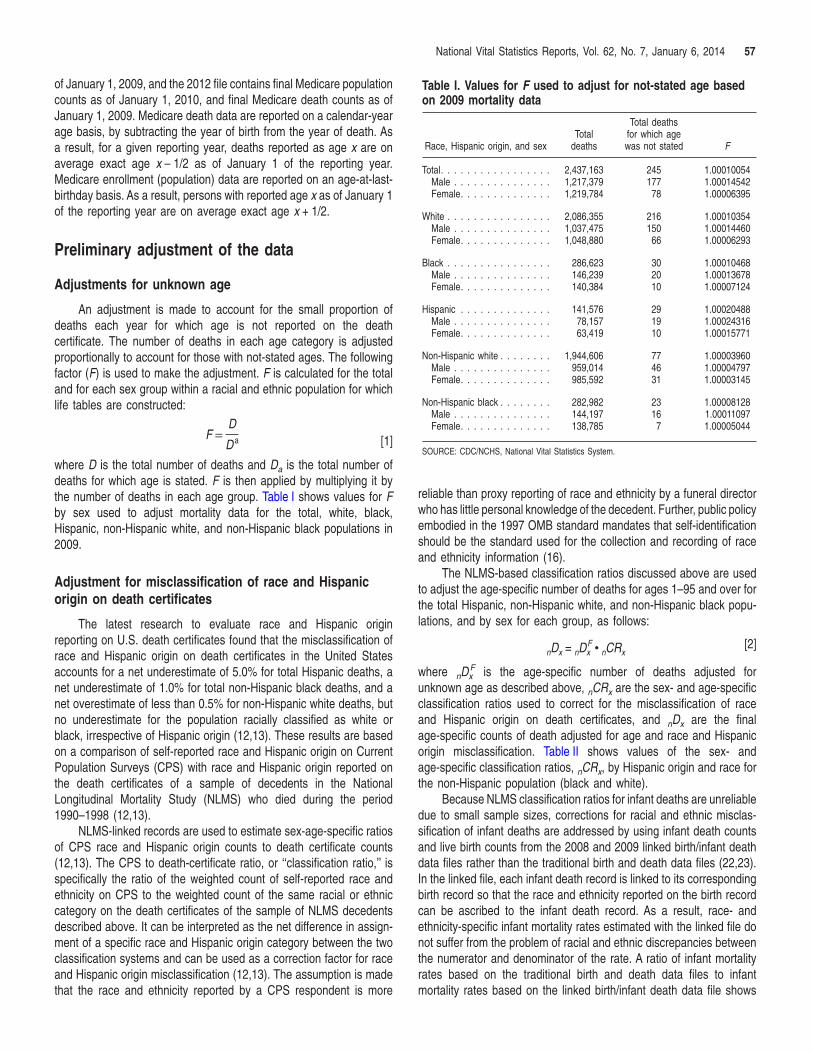
National Vital Statistics Reports, Vol. 62, No. 7, January 6, 2014 57
SOURCE: CDC/NCHS, National Vital Statistics System.
Table I. Values for F used to adjust for not-stated age based on 2009 mortality data
Total deaths Total for which age
Race, Hispanic origin, and sex deaths was not stated F
Total. . . . . . . . . . . . . . . . . 2,437,163 245 1.00010054 Male . . . . . . . . . . . . . . . 1,217,379 177 1.00014542 Female. . . . . . . . . . . . . . 1,219,784 78 1.00006395
White . . . . . . . . . . . . . . . . 2,086,355 216 1.00010354 Male . . . . . . . . . . . . . . . 1,037,475 150 1.00014460 Female. . . . . . . . . . . . . . 1,048,880 66 1.00006293
Black . . . . . . . . . . . . . . . . 286,623 30 1.00010468 Male . . . . . . . . . . . . . . . 146,239 20 1.00013678 Female. . . . . . . . . . . . . . 140,384 10 1.00007124
Hispanic . . . . . . . . . . . . . . 141,576 29 1.00020488 Male . . . . . . . . . . . . . . . 78,157 19 1.00024316 Female. . . . . . . . . . . . . . 63,419 10 1.00015771
Non-Hispanic white . . . . . . . . 1,944,606 77 1.00003960 Male . . . . . . . . . . . . . . . 959,014 46 1.00004797 Female. . . . . . . . . . . . . . 985,592 31 1.00003145
Non-Hispanic black . . . . . . . . 282,982 23 1.00008128 Male . . . . . . . . . . . . . . . 144,197 16 1.00011097 Female. . . . . . . . . . . . . . 138,785 7 1.00005044
of January 1, 2009, and the 2012 file contains final Medicare population counts as of January 1, 2010, and final Medicare death counts as of January 1, 2009. Medicare death data are reported on a calendar-year age basis, by subtracting the year of birth from the year of death. As a result, for a given reporting year, deaths reported as age x are on average exact age x – 1/2 as of January 1 of the reporting year. Medicare enrollment (population) data are reported on an age-at-lastbirthday basis. As a result, persons with reported age x as of January 1 of the reporting year are on average exact age x + 1/2.
Preliminary adjustment of the data
Adjustments for unknown age
An adjustment is made to account for the small proportion of deaths each year for which age is not reported on the death certificate. The number of deaths in each age category is adjusted proportionally to account for those with not-stated ages. The following factor (F) is used to make the adjustment. F is calculated for the total and for each sex group within a racial and ethnic population for which life tables are constructed:
D F =
D a [1]
where D is the total number of deaths and Da is the total number of deaths for which age is stated. F is then applied by multiplying it by the number of deaths in each age group. Table I shows values for F by sex used to adjust mortality data for the total, white, black, Hispanic, non-Hispanic white, and non-Hispanic black populations in 2009.
Adjustment for misclassification of race and Hispanic origin on death certificates
The latest research to evaluate race and Hispanic origin reporting on U.S. death certificates found that the misclassification of race and Hispanic origin on death certificates in the United States accounts for a net underestimate of 5.0% for total Hispanic deaths, a net underestimate of 1.0% for total non-Hispanic black deaths, and a net overestimate of less than 0.5% for non-Hispanic white deaths, but no underestimate for the population racially classified as white or black, irrespective of Hispanic origin (12,13). These results are based on a comparison of self-reported race and Hispanic origin on Current Population Surveys (CPS) with race and Hispanic origin reported on the death certificates of a sample of decedents in the National Longitudinal Mortality Study (NLMS) who died during the period 1990–1998 (12,13).
NLMS-linked records are used to estimate sex-age-specific ratios of CPS race and Hispanic origin counts to death certificate counts (12,13). The CPS to death-certificate ratio, or ‘‘classification ratio,’’ is specifically the ratio of the weighted count of self-reported race and ethnicity on CPS to the weighted count of the same racial or ethnic category on the death certificates of the sample of NLMS decedents described above. It can be interpreted as the net difference in assignment of a specific race and Hispanic origin category between the two classification systems and can be used as a correction factor for race and Hispanic origin misclassification (12,13). The assumption is made that the race and ethnicity reported by a CPS respondent is more
reliable than proxy reporting of race and ethnicity by a funeral director who has little personal knowledge of the decedent. Further, public policy embodied in the 1997 OMB standard mandates that self-identification should be the standard used for the collection and recording of race and ethnicity information (16).
The NLMS-based classification ratios discussed above are used to adjust the age-specific number of deaths for ages 1–95 and over for the total Hispanic, non-Hispanic white, and non-Hispanic black populations, and by sex for each group, as follows:
[2]D F n x = nDx c nCRx
where nD F x is the age-specific number of deaths adjusted for
unknown age as described above, nCRx are the sex- and age-specific classification ratios used to correct for the misclassification of race and Hispanic origin on death certificates, and nDx are the final age-specific counts of death adjusted for age and race and Hispanic origin misclassification. Table II shows values of the sex- and age-specific classification ratios, nCRx, by Hispanic origin and race for the non-Hispanic population (black and white).
Because NLMS classification ratios for infant deaths are unreliable due to small sample sizes, corrections for racial and ethnic misclassification of infant deaths are addressed by using infant death counts and live birth counts from the 2008 and 2009 linked birth/infant death data files rather than the traditional birth and death data files (22,23). In the linked file, each infant death record is linked to its corresponding birth record so that the race and ethnicity reported on the birth record can be ascribed to the infant death record. As a result, race- and ethnicity-specific infant mortality rates estimated with the linked file do not suffer from the problem of racial and ethnic discrepancies between the numerator and denominator of the rate. A ratio of infant mortality rates based on the traditional birth and death data files to infant mortality rates based on the linked birth/infant death data file shows
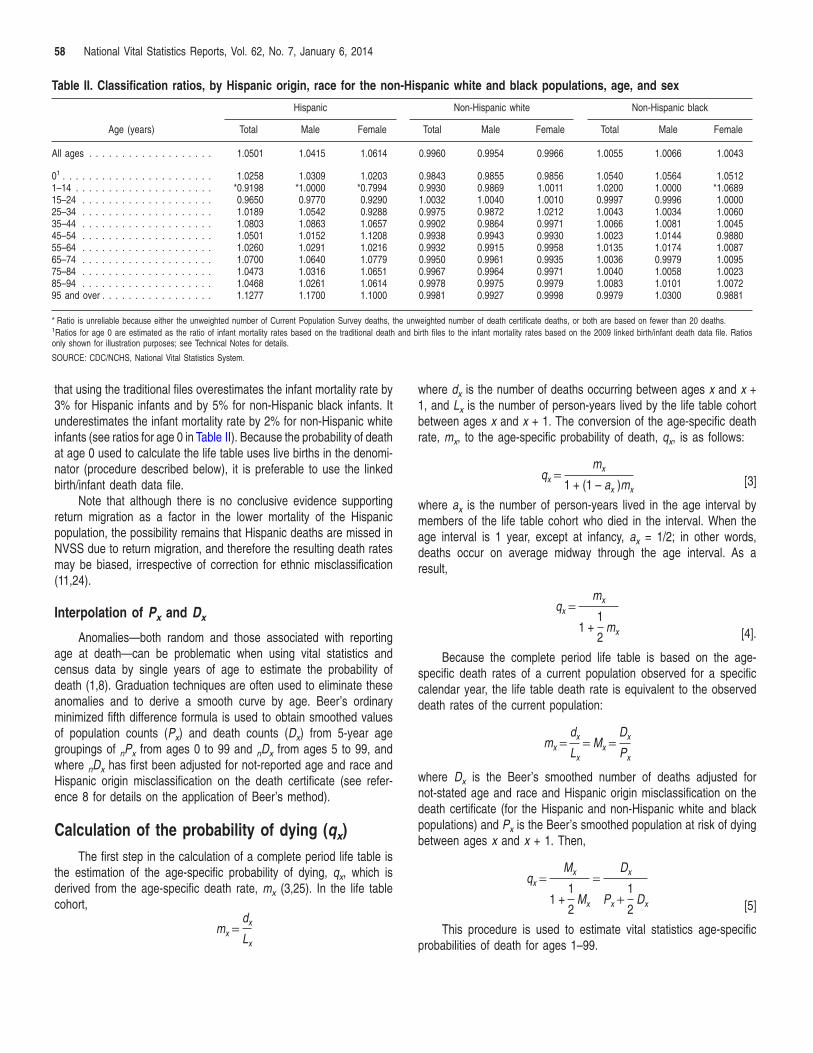
58 National Vital Statistics Reports, Vol. 62, No. 7, January 6, 2014
Table II. Classification ratios, by Hispanic origin, race for the non-Hispanic white and black populations, age, and sex
Hispanic Non-Hispanic white Non-Hispanic black
Age (years) Total Male Female Total Male Female Total Male Female
All ages . . . . . . . . . . . . . . . . . . . 1.0501 1.0415 1.0614 0.9960 0.9954 0.9966 1.0055 1.0066 1.0043
01 . . . . . . . . . . . . . . . . . . . . . . . 1.0258 1.0309 1.0203 0.9843 0.9855 0.9856 1.0540 1.0564 1.0512 1–14 . . . . . . . . . . . . . . . . . . . . . *0.9198 *1.0000 *0.7994 0.9930 0.9869 1.0011 1.0200 1.0000 *1.0689 15–24 . . . . . . . . . . . . . . . . . . . . 0.9650 0.9770 0.9290 1.0032 1.0040 1.0010 0.9997 0.9996 1.0000 25–34 . . . . . . . . . . . . . . . . . . . . 1.0189 1.0542 0.9288 0.9975 0.9872 1.0212 1.0043 1.0034 1.0060 35–44 . . . . . . . . . . . . . . . . . . . . 1.0803 1.0863 1.0657 0.9902 0.9864 0.9971 1.0066 1.0081 1.0045 45–54 . . . . . . . . . . . . . . . . . . . . 1.0501 1.0152 1.1208 0.9938 0.9943 0.9930 1.0023 1.0144 0.9880 55–64 . . . . . . . . . . . . . . . . . . . . 1.0260 1.0291 1.0216 0.9932 0.9915 0.9958 1.0135 1.0174 1.0087 65–74 . . . . . . . . . . . . . . . . . . . . 1.0700 1.0640 1.0779 0.9950 0.9961 0.9935 1.0036 0.9979 1.0095 75–84 . . . . . . . . . . . . . . . . . . . . 1.0473 1.0316 1.0651 0.9967 0.9964 0.9971 1.0040 1.0058 1.0023 85–94 . . . . . . . . . . . . . . . . . . . . 1.0468 1.0261 1.0614 0.9978 0.9975 0.9979 1.0083 1.0101 1.0072 95 and over . . . . . . . . . . . . . . . . . 1.1277 1.1700 1.1000 0.9981 0.9927 0.9998 0.9979 1.0300 0.9881
* Ratio is unreliable because either the unweighted number of Current Population Survey deaths, the unweighted number of death certificate deaths, or both are based on fewer than 20 deaths. 1Ratios for age 0 are estimated as the ratio of infant mortality rates based on the traditional death and birth files to the infant mortality rates based on the 2009 linked birth/infant death data file. Ratios only shown for illustration purposes; see Technical Notes for details.
SOURCE: CDC/NCHS, National Vital Statistics System.
that using the traditional files overestimates the infant mortality rate by 3% for Hispanic infants and by 5% for non-Hispanic black infants. It underestimates the infant mortality rate by 2% for non-Hispanic white infants (see ratios for age 0 in Table II). Because the probability of death at age 0 used to calculate the life table uses live births in the denominator (procedure described below), it is preferable to use the linked birth/infant death data file.
Note that although there is no conclusive evidence supporting return migration as a factor in the lower mortality of the Hispanic population, the possibility remains that Hispanic deaths are missed in NVSS due to return migration, and therefore the resulting death rates may be biased, irrespective of correction for ethnic misclassification (11,24).
Interpolation of Px and Dx
Anomalies—both random and those associated with reporting age at death—can be problematic when using vital statistics and census data by single years of age to estimate the probability of death (1,8). Graduation techniques are often used to eliminate these anomalies and to derive a smooth curve by age. Beer’s ordinary minimized fifth difference formula is used to obtain smoothed values of population counts (Px) and death counts (Dx) from 5-year age groupings of nPx from ages 0 to 99 and nDx from ages 5 to 99, and where nDx has first been adjusted for not-reported age and race and Hispanic origin misclassification on the death certificate (see reference 8 for details on the application of Beer’s method).
Calculation of the probability of dying (qx) The first step in the calculation of a complete period life table is
the estimation of the age-specific probability of dying, qx, which is derived from the age-specific death rate, mx (3,25). In the life table cohort,
dx =mx Lx
where dx is the number of deaths occurring between ages x and x + 1, and Lx is the number of person-years lived by the life table cohort between ages x and x + 1. The conversion of the age-specific death rate, mx, to the age-specific probability of death, qx, is as follows:
mx q = [3]x 1 + (1 – ax )mx
where ax is the number of person-years lived in the age interval by members of the life table cohort who died in the interval. When the age interval is 1 year, except at infancy, ax = 1/2; in other words, deaths occur on average midway through the age interval. As a result,
mx =qx 1 1 + m [4].2 x
Because the complete period life table is based on the age-specific death rates of a current population observed for a specific calendar year, the life table death rate is equivalent to the observed death rates of the current population:
dx Dx mx = = Mx = Lx Px
where Dx is the Beer’s smoothed number of deaths adjusted for not-stated age and race and Hispanic origin misclassification on the death certificate (for the Hispanic and non-Hispanic white and black populations) and Px is the Beer’s smoothed population at risk of dying between ages x and x + 1. Then,
Mx Dx qx = = 1 1
1 + Mx Px + Dx [5]2 2
This procedure is used to estimate vital statistics age-specific probabilities of death for ages 1–99.
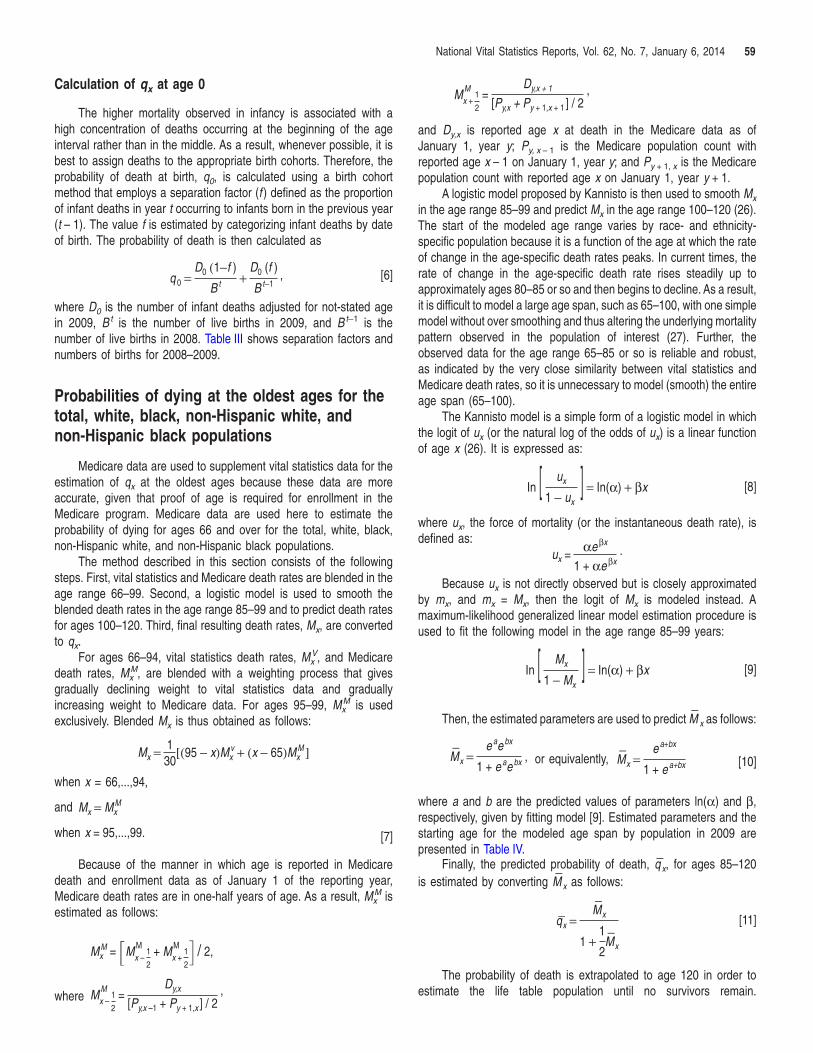
National Vital Statistics Reports, Vol. 62, No. 7, January 6, 2014 59
Calculation of qx at age 0
The higher mortality observed in infancy is associated with a high concentration of deaths occurring at the beginning of the age interval rather than in the middle. As a result, whenever possible, it is best to assign deaths to the appropriate birth cohorts. Therefore, the probability of death at birth, q0, is calculated using a birth cohort method that employs a separation factor (f ) defined as the proportion of infant deaths in year t occurring to infants born in the previous year (t – 1). The value f is estimated by categorizing infant deaths by date of birth. The probability of death is then calculated as
where D0 is the number of infant deaths adjusted for not-stated age in 2009, B t is the number of live births in 2009, and B t−1 is the number of live births in 2008. Table III shows separation factors and numbers of births for 2008–2009.
Probabilities of dying at the oldest ages for the total, white, black, non-Hispanic white, and non-Hispanic black populations
Medicare data are used to supplement vital statistics data for the estimation of qx at the oldest ages because these data are more accurate, given that proof of age is required for enrollment in the Medicare program. Medicare data are used here to estimate the probability of dying for ages 66 and over for the total, white, black, non-Hispanic white, and non-Hispanic black populations.
The method described in this section consists of the following steps. First, vital statistics and Medicare death rates are blended in the age range 66–99. Second, a logistic model is used to smooth the blended death rates in the age range 85–99 and to predict death rates for ages 100–120. Third, final resulting death rates, Mx, are converted to qx.
For ages 66–94, vital statistics death rates, M Vx , and Medicare
death rates, M Mx , are blended with a weighting process that gives
gradually declining weight to vital statistics data and gradually increasing weight to Medicare data. For ages 95–99, M M
x is used exclusively. Blended Mx is thus obtained as follows:
1
Because of the manner in which age is reported in Medicare death and enrollment data as of January 1 of the reporting year, Medicare death rates are in one-half years of age. As a result, M M
x is estimated as follows:
M Dy,x ,
[6]D0 (1−f ) D0 (f ) q 0 = + ,
B t B t−1
Mx = [(95 − x)M v + (x − 65)M M x x ]
30
when x = 66,...,94,
and Mx = M M x
when x = 95,...,99. [7]
M M F Mx = M
1
x – + M M 1x + G / 2,
2 2
Mwhere
1 x – =
2 [Py,x –1 + Py + 1,x ] / 2
1 = x +
2 [Py,x + Py + 1,x + 1 ] / 2
DM M y,x + 1 ,
and Dy,x is reported age x at death in the Medicare data as of January 1, year y; Py, x – 1 is the Medicare population count with reported age x – 1 on January 1, year y; and Py + 1, x is the Medicare population count with reported age x on January 1, year y + 1.
A logistic model proposed by Kannisto is then used to smooth Mx
in the age range 85–99 and predict Mx in the age range 100–120 (26). The start of the modeled age range varies by race- and ethnicity-specific population because it is a function of the age at which the rate of change in the age-specific death rates peaks. In current times, the rate of change in the age-specific death rate rises steadily up to approximately ages 80–85 or so and then begins to decline. As a result, it is difficult to model a large age span, such as 65–100, with one simple model without over smoothing and thus altering the underlying mortality pattern observed in the population of interest (27). Further, the observed data for the age range 65–85 or so is reliable and robust, as indicated by the very close similarity between vital statistics and Medicare death rates, so it is unnecessary to model (smooth) the entire age span (65–100).
The Kannisto model is a simple form of a logistic model in which the logit of ux (or the natural log of the odds of ux) is a linear function of age x (26). It is expressed as:
[ ]In ux = In(α) + βx [8]x
where ux, the force of mortality (or the instantaneous death rate), is defined as:
ααe βx
.u = x
1 + e βx
Because ux is not directly observed but is closely approximated by mx, and mx = Mx, then the logit of Mx is modeled instead. A maximum-likelihood generalized linear model estimation procedure is used to fit the following model in the age range 85–99 years:
[ ] [9]
−Then, the estimated parameters are used to predict M x as follows:
[10]
where a and b are the predicted values of parameters ln(α) and β, respectively, given by fitting model [9]. Estimated parameters and the starting age for the modeled age span by population in 2009 are presented in Table IV. −Finally, the predicted probability of death, q , for ages 85–120 − x
is estimated by converting M x as follows: −
[11]
The probability of death is extrapolated to age 120 in order to estimate the life table population until no survivors remain.
1 − u
MIn x
= In(α) + βx 1 − Mx
− e ae bx − e a+bx
Mx = a bx , or equivalently, Me x = 1 + e 1 + e a+bx
M− q = x x 1 −
1 + M2 x
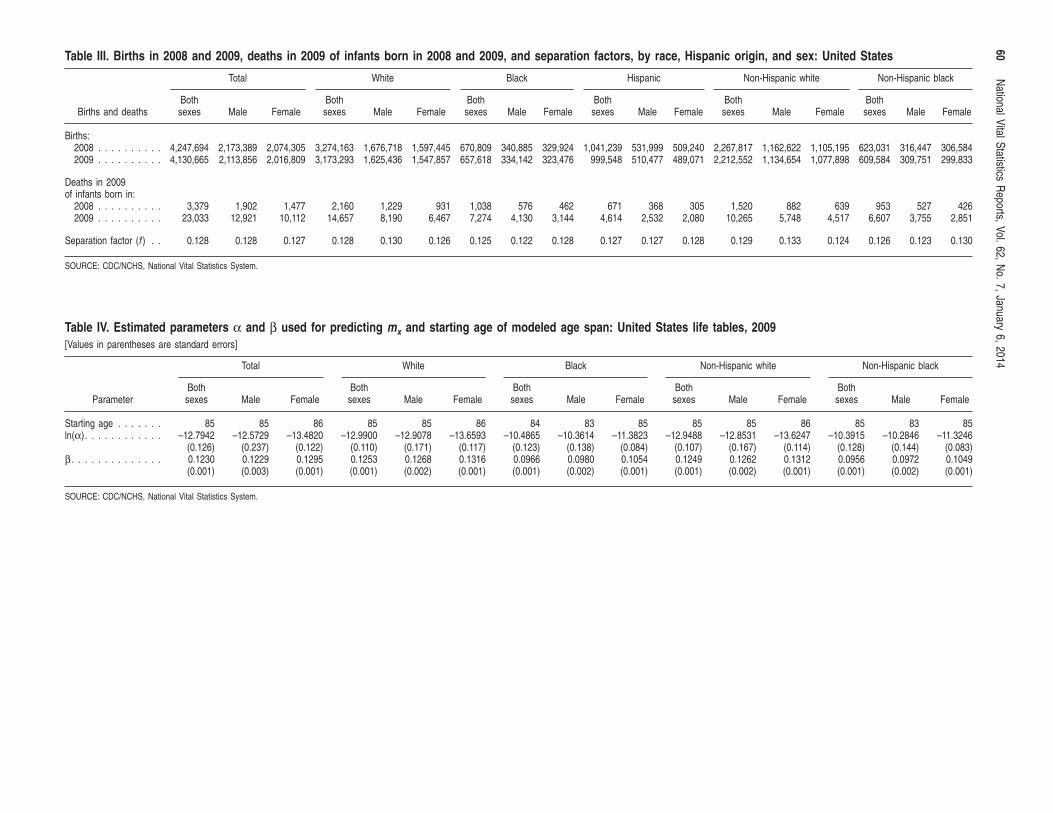
Table III. Births in 2008 and 2009, deaths in 2009 of infants born in 2008 and 2009, and separation factors, by race, Hispanic origin, and sex: United States
Total White Black Hispanic Non-Hispanic white Non-Hispanic black
Both Both Both Both Both Both Births and deaths sexes Male Female sexes Male Female sexes Male Female sexes Male Female sexes Male Female sexes Male Female
Births: 2008 . . . . . . . . . . 4,247,694 2,173,389 2,074,305 3,274,163 1,676,718 1,597,445 670,809 340,885 329,924 1,041,239 531,999 509,240 2,267,817 1,162,622 1,105,195 623,031 316,447 306,584 2009 . . . . . . . . . . 4,130,665 2,113,856 2,016,809 3,173,293 1,625,436 1,547,857 657,618 334,142 323,476 999,548 510,477 489,071 2,212,552 1,134,654 1,077,898 609,584 309,751 299,833
Deaths in 2009 of infants born in:
2008 . . . . . . . . . . 3,379 1,902 1,477 2,160 1,229 931 1,038 576 462 671 368 305 1,520 882 639 953 527 426 2009 . . . . . . . . . . 23,033 12,921 10,112 14,657 8,190 6,467 7,274 4,130 3,144 4,614 2,532 2,080 10,265 5,748 4,517 6,607 3,755 2,851
Separation factor (f ) . . 0.128 0.128 0.127 0.128 0.130 0.126 0.125 0.122 0.128 0.127 0.127 0.128 0.129 0.133 0.124 0.126 0.123 0.130
SOURCE: CDC/NCHS, National Vital Statistics System.
Table IV. Estimated parameters α and β used for predicting mx and starting age of modeled age span: United States life tables, 2009
[Values in parentheses are standard errors]
Total White Black Non-Hispanic white Non-Hispanic black
Both Both Both Both Both Parameter sexes Male Female sexes Male Female sexes Male Female sexes Male Female sexes Male Female
Starting age . . . . . . . 85 85 86 85 85 86 84 83 85 85 85 86 85 83 85 ln(α) . . . . . . . . . . . . –12.7942 –12.5729 –13.4820 –12.9900 –12.9078 –13.6593 –10.4865 –10.3614 –11.3823 –12.9488 –12.8531 –13.6247 –10.3915 –10.2846 –11.3246
(0.126) (0.237) (0.122) (0.110) (0.171) (0.117) (0.123) (0.138) (0.084) (0.107) (0.167) (0.114) (0.128) (0.144) (0.083) β . . . . . . . . . . . . . . 0.1230 0.1229 0.1295 0.1253 0.1268 0.1316 0.0966 0.0980 0.1054 0.1249 0.1262 0.1312 0.0956 0.0972 0.1049
(0.001) (0.003) (0.001) (0.001) (0.002) (0.001) (0.001) (0.002) (0.001) (0.001) (0.002) (0.001) (0.001) (0.002) (0.001)
SOURCE: CDC/NCHS, National Vital Statistics System.
60 N
ational Vital Statistics Reports, Vol. 62, N
o. 7, January 6, 2014
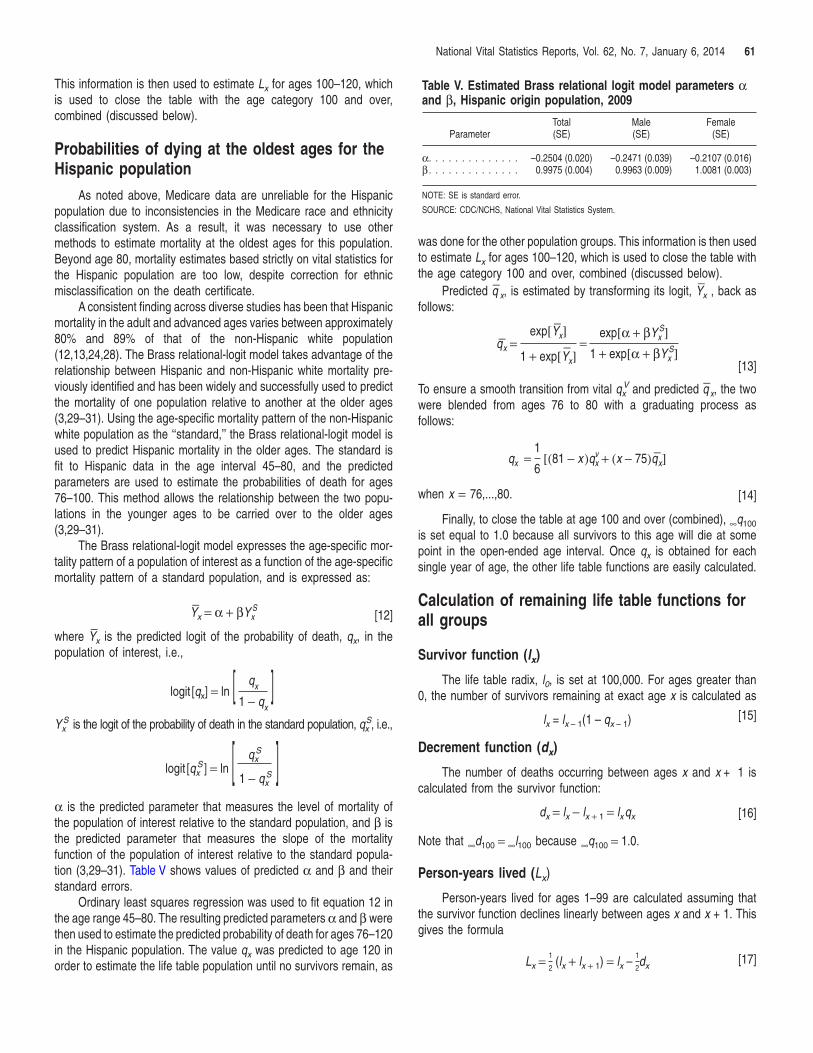
National Vital Statistics Reports, Vol. 62, No. 7, January 6, 2014 61
NOTE: SE is standard error.
SOURCE: CDC/NCHS, National Vital Statistics System.
Table V. Estimated Brass relational logit model parameters α and β, Hispanic origin population, 2009
Parameter Total (SE)
Male (SE)
Female (SE)
α. . . . . . . . . . . . . . β . . . . . . . . . . . . . .
–0.2504 (0.020) 0.9975 (0.004)
–0.2471 (0.039) 0.9963 (0.009)
–0.2107 (0.016) 1.0081 (0.003)
This information is then used to estimate Lx for ages 100–120, which is used to close the table with the age category 100 and over, combined (discussed below).
Probabilities of dying at the oldest ages for the Hispanic population
As noted above, Medicare data are unreliable for the Hispanic population due to inconsistencies in the Medicare race and ethnicity classification system. As a result, it was necessary to use other methods to estimate mortality at the oldest ages for this population. Beyond age 80, mortality estimates based strictly on vital statistics for the Hispanic population are too low, despite correction for ethnic misclassification on the death certificate.
A consistent finding across diverse studies has been that Hispanic mortality in the adult and advanced ages varies between approximately 80% and 89% of that of the non-Hispanic white population (12,13,24,28). The Brass relational-logit model takes advantage of the relationship between Hispanic and non-Hispanic white mortality previously identified and has been widely and successfully used to predict the mortality of one population relative to another at the older ages (3,29–31). Using the age-specific mortality pattern of the non-Hispanic white population as the ‘‘standard,’’ the Brass relational-logit model is used to predict Hispanic mortality in the older ages. The standard is fit to Hispanic data in the age interval 45–80, and the predicted parameters are used to estimate the probabilities of death for ages 76–100. This method allows the relationship between the two populations in the younger ages to be carried over to the older ages (3,29–31).
The Brass relational-logit model expresses the age-specific mortality pattern of a population of interest as a function of the age-specific mortality pattern of a standard population, and is expressed as:
Y−
x = α + βYx S
[12] −
where Yx is the predicted logit of the probability of death, qx, in the population of interest, i.e.,
qxlogit [q ] = ln [ ]x 1 − qx
S
logit [qx S ] = ln
qx
S1 − qx
Yx S is the logit of the probability of death in the standard population, qx
S, i.e.,
[ ]α is the predicted parameter that measures the level of mortality of the population of interest relative to the standard population, and β is the predicted parameter that measures the slope of the mortality function of the population of interest relative to the standard population (3,29–31). Table V shows values of predicted α and β and their standard errors.
Ordinary least squares regression was used to fit equation 12 in the age range 45–80. The resulting predicted parameters α and β were then used to estimate the predicted probability of death for ages 76–120 in the Hispanic population. The value qx was predicted to age 120 in order to estimate the life table population until no survivors remain, as
was done for the other population groups. This information is then used to estimate Lx for ages 100–120, which is used to close the table with the age category 100 and over, combined (discussed below).
− −Predicted q x, is estimated by transforming its logit, Yx , back as
follows:
exp[Y− x] exp[α + βYx
S]− x − S]
q = 1 + exp[Y ]
= 1 + exp[α + βYxx [13]
−To ensure a smooth transition from vital qx V and predicted q x, the two
were blended from ages 76 to 80 with a graduating process as follows:
1 − q = [(81 − x )qv + (x − 75)q ]x x x6
when x = 76,...,80. [14]
Finally, to close the table at age 100 and over (combined), ∞q100
is set equal to 1.0 because all survivors to this age will die at some point in the open-ended age interval. Once qx is obtained for each single year of age, the other life table functions are easily calculated.
Calculation of remaining life table functions for all groups
Survivor function (lx)
The life table radix, l0, is set at 100,000. For ages greater than 0, the number of survivors remaining at exact age x is calculated as
[15]lx = lx – 1(1 – qx – 1)
Decrement function (dx)
The number of deaths occurring between ages x and x + 1 is calculated from the survivor function:
d = l − lx + 1 = l q [16]x x x x
Note that ∞d100 = ∞l100 because ∞q100 = 1.0.
Person-years lived (Lx)
Person-years lived for ages 1–99 are calculated assuming that the survivor function declines linearly between ages x and x + 1. This gives the formula
L = 1
2 (l + lx + 1) = l –
1
2d [17]
x x x x
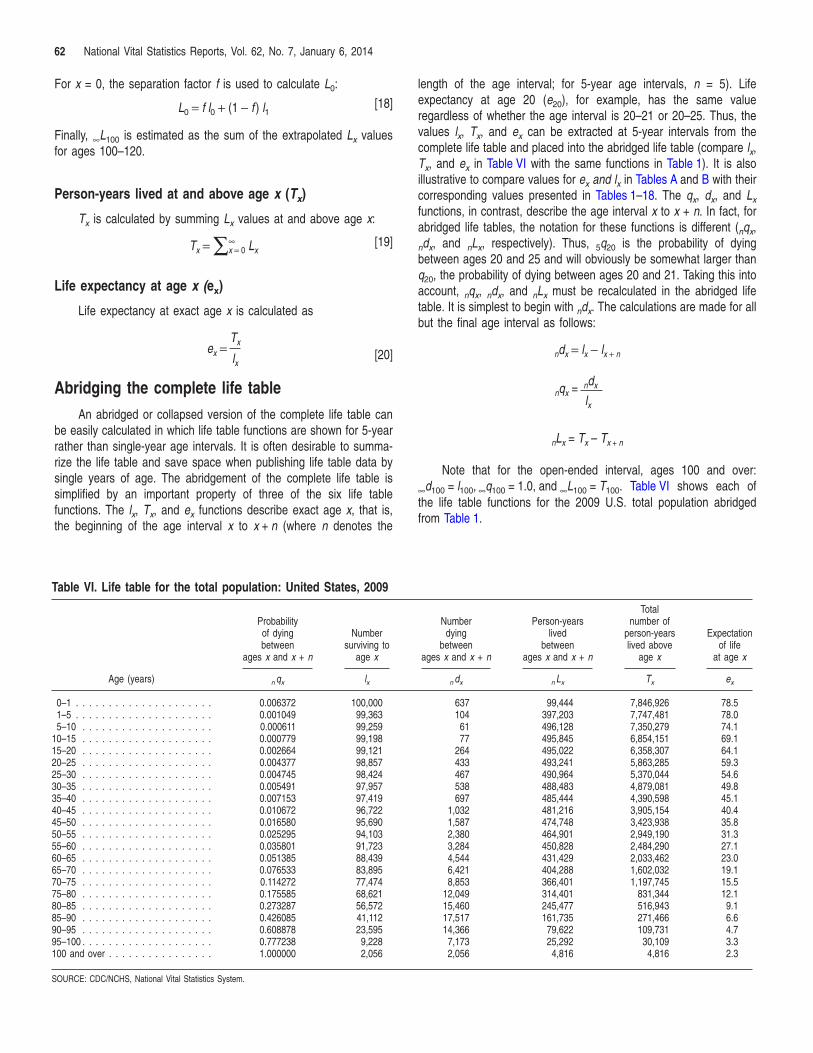
62 National Vital Statistics Reports, Vol. 62, No. 7, January 6, 2014
For x = 0, the separation factor f is used to calculate L0:
[18]L0 = f l0 + (1 − f ) l1
Finally, ∞L100 is estimated as the sum of the extrapolated Lx values for ages 100–120.
Person-years lived at and above age x (Tx)
Tx is calculated by summing Lx values at and above age x:
∞ [19]Tx = ∑x = 0 Lx
Life expectancy at age x (ex)
Life expectancy at exact age x is calculated as
Abridging the complete life table
An abridged or collapsed version of the complete life table can be easily calculated in which life table functions are shown for 5-year rather than single-year age intervals. It is often desirable to summarize the life table and save space when publishing life table data by single years of age. The abridgement of the complete life table is simplified by an important property of three of the six life table functions. The lx, Tx, and ex functions describe exact age x, that is, the beginning of the age interval x to x + n (where n denotes the
Te = x
x [20]lx
Table VI. Life table for the total population: United States, 2009
Probability of dying Number between surviving to
ages x and x + n age x
Age (years) n qx lx
0–1 . . . . . . . . . . . . . . . . . . . . . 0.006372 100,000 1–5 . . . . . . . . . . . . . . . . . . . . . 0.001049 99,363 5–10 . . . . . . . . . . . . . . . . . . . . 0.000611 99,259
10–15 . . . . . . . . . . . . . . . . . . . . 0.000779 99,198 15–20 . . . . . . . . . . . . . . . . . . . . 0.002664 99,121 20–25 . . . . . . . . . . . . . . . . . . . . 0.004377 98,857 25–30 . . . . . . . . . . . . . . . . . . . . 0.004745 98,424 30–35 . . . . . . . . . . . . . . . . . . . . 0.005491 97,957 35–40 . . . . . . . . . . . . . . . . . . . . 0.007153 97,419 40–45 . . . . . . . . . . . . . . . . . . . . 0.010672 96,722 45–50 . . . . . . . . . . . . . . . . . . . . 0.016580 95,690 50–55 . . . . . . . . . . . . . . . . . . . . 0.025295 94,103 55–60 . . . . . . . . . . . . . . . . . . . . 0.035801 91,723 60–65 . . . . . . . . . . . . . . . . . . . . 0.051385 88,439 65–70 . . . . . . . . . . . . . . . . . . . . 0.076533 83,895 70–75 . . . . . . . . . . . . . . . . . . . . 0.114272 77,474 75–80 . . . . . . . . . . . . . . . . . . . . 0.175585 68,621 80–85 . . . . . . . . . . . . . . . . . . . . 0.273287 56,572 85–90 . . . . . . . . . . . . . . . . . . . . 0.426085 41,112 90–95 . . . . . . . . . . . . . . . . . . . . 0.608878 23,595 95–100 . . . . . . . . . . . . . . . . . . . . 0.777238 9,228 100 and over . . . . . . . . . . . . . . . . 1.000000 2,056
SOURCE: CDC/NCHS, National Vital Statistics System.
length of the age interval; for 5-year age intervals, n = 5). Life expectancy at age 20 (e20), for example, has the same value regardless of whether the age interval is 20–21 or 20–25. Thus, the values lx, Tx, and ex can be extracted at 5-year intervals from the complete life table and placed into the abridged life table (compare lx, Tx, and ex in Table VI with the same functions in Table 1). It is also illustrative to compare values for ex and lx in Tables A and B with their corresponding values presented in Tables 1–18. The qx, dx, and Lx
functions, in contrast, describe the age interval x to x + n. In fact, for abridged life tables, the notation for these functions is different (nqx, ndx, and nLx, respectively). Thus, 5q20 is the probability of dying between ages 20 and 25 and will obviously be somewhat larger than q20, the probability of dying between ages 20 and 21. Taking this into account, q , d , and L must be recalculated in the abridged life n x n x n x
table. It is simplest to begin with ndx. The calculations are made for all but the final age interval as follows:
d = l − ln x x x + n
ndx nqx =
lx
L = T – Tn x x x + n
Note that for the open-ended interval, ages 100 and over: ∞d100 = l100, ∞q100 = 1.0, and ∞L100 = T100. Table VI shows each of the life table functions for the 2009 U.S. total population abridged from Table 1.
Total Number Person-years number of
dying lived person-years Expectation between between lived above of life
ages x and x + n ages x and x + n age x at age x
n dx n Lx Tx ex
637 99,444 7,846,926 78.5 104 397,203 7,747,481 78.0
61 496,128 7,350,279 74.1 77 495,845 6,854,151 69.1
264 495,022 6,358,307 64.1 433 493,241 5,863,285 59.3 467 490,964 5,370,044 54.6 538 488,483 4,879,081 49.8 697 485,444 4,390,598 45.1
1,032 481,216 3,905,154 40.4 1,587 474,748 3,423,938 35.8 2,380 464,901 2,949,190 31.3 3,284 450,828 2,484,290 27.1 4,544 431,429 2,033,462 23.0 6,421 404,288 1,602,032 19.1 8,853 366,401 1,197,745 15.5
12,049 314,401 831,344 12.1 15,460 245,477 516,943 9.1 17,517 161,735 271,466 6.6 14,366 79,622 109,731 4.7
7,173 25,292 30,109 3.3 2,056 4,816 4,816 2.3
U.S. DEPARTMENT OF HEALTH & HUMAN SERVICES
Centers for Disease Control and Prevention National Center for Health Statistics 3311 Toledo Road, Room 5419 Hyattsville, MD 20782
FIRST CLASS MAIL POSTAGE & FEES PAID
CDC/NCHS PERMIT NO. G-284
OFFICIAL BUSINESS PENALTY FOR PRIVATE USE, $ 300
National Vital Statistics Reports, Vol. 62, No. 7, January 6, 2014
Contents
Abstract . . . . . . . . . . . . . . . . . . . . . . . . . . . . . . . . . . . . . . . . . . . . 1 Introduction . . . . . . . . . . . . . . . . . . . . . . . . . . . . . . . . . . . . . . . . . . 1 Data and Methods . . . . . . . . . . . . . . . . . . . . . . . . . . . . . . . . . . . . . . 1
Expectation of life . . . . . . . . . . . . . . . . . . . . . . . . . . . . . . . . . . . . . 2 Survivors to specified ages . . . . . . . . . . . . . . . . . . . . . . . . . . . . . . . . 2 Explanation of the columns of the life table . . . . . . . . . . . . . . . . . . . . . . 2
Results . . . . . . . . . . . . . . . . . . . . . . . . . . . . . . . . . . . . . . . . . . . . . 2 Life expectancy in the United States . . . . . . . . . . . . . . . . . . . . . . . . . . 2 Survivorship in the United States . . . . . . . . . . . . . . . . . . . . . . . . . . . . 6
References . . . . . . . . . . . . . . . . . . . . . . . . . . . . . . . . . . . . . . . . . . 7 List of Detailed Tables . . . . . . . . . . . . . . . . . . . . . . . . . . . . . . . . . . . . 8 Technical Notes . . . . . . . . . . . . . . . . . . . . . . . . . . . . . . . . . . . . . . . 55
Acknowledgments
The author is grateful for the helpful comments provided by Robert N. Anderson, Mortality Statistics Branch (MSB), Division of Vital Statistics (DVS); and Jennifer Madans, Office of the Director. This report was prepared under the general direction of Delton Atkinson, Acting Director, DVS; and Robert N. Anderson, Chief, MSB. Content review was provided by Angel Liu and Betzaida Tejada Vera, MSB. This report was edited and produced by NCHS Office of Information Services, Information Design and Publishing Staff: Danielle Woods edited the report; typesetting was done by Jacqueline M. Davis; and graphics were produced by Kyung Park.
This document is hereby certified as an official federal document and is fully admissible as evidence in federal court. Under Federal Rule of Evidence 902: ‘‘Self-authentication,’’ (FED.R.EVID.902), no extrinsic evidence of authenticity, that is, seal or stamp, is required as a condition for admissibility of this document as evidence in court.
Suggested citation
Arias E. United States life tables, 2009. National vital statistics reports; vol 62 no 7. Hyattsville, MD: National Center for Health Statistics. 2014.
Copyright information
All material appearing in this report is in the public domain and may be reproduced or copied without permission; citation as to source, however, is appreciated.
National Center for Health Statistics
Charles J. Rothwell, M.S., Director Jennifer H. Madans, Ph.D., Associate Director
for Science
Division of Vital Statistics Delton Atkinson, M.P.H., M.P.H., P.M.P.,
Acting Director
For e-mail updates on NCHS publication releases, subscribe online at: http://www.cdc.gov/nchs/govdelivery.htm. For questions or general information about NCHS: Tel: 1–800–CDC–INFO (1–800–232–4636) • TTY: 1–888–232–6348
Internet: http://www.cdc.gov/nchs • Online request form: http://www.cdc.gov/cdc-info/requestform.html
DHHS Publication No. 2014–1120 • CS243816