Embed Size (px)
Citation preview
Natural Gas Hydrates Research Portfolio
Quarterly Progress Report FY15-Q2
Yongkoo Seol, Technical Portfolio Lead
Delivery Date: April 30, 2015
Prepared by U.S. Department of Energy National Energy Technology Laboratory Office of Research and Development
Prepared for U.S. Department of Energy National Energy Technology Laboratory Strategic Center for Natural Gas and Oil

FY15-Q2 Progress Report Natural Gas Hydrates Research Portfolio January 1, 2015 – March 31, 2015 FWP Number: Hydrates_FY15
List of Authors
Yongkoo Seol, ORD Technical Portfolio Lead
Gary Sames, ORD Project Coordinator
Cynthia Powell, ORD Focus Area Lead (Acting)
Jeffery Ilconich, Activity Manager
-ii-
FY15-Q2 Progress Report Natural Gas Hydrates Research Portfolio January 1, 2015 – March 31, 2015 FWP Number: Hydrates_FY15
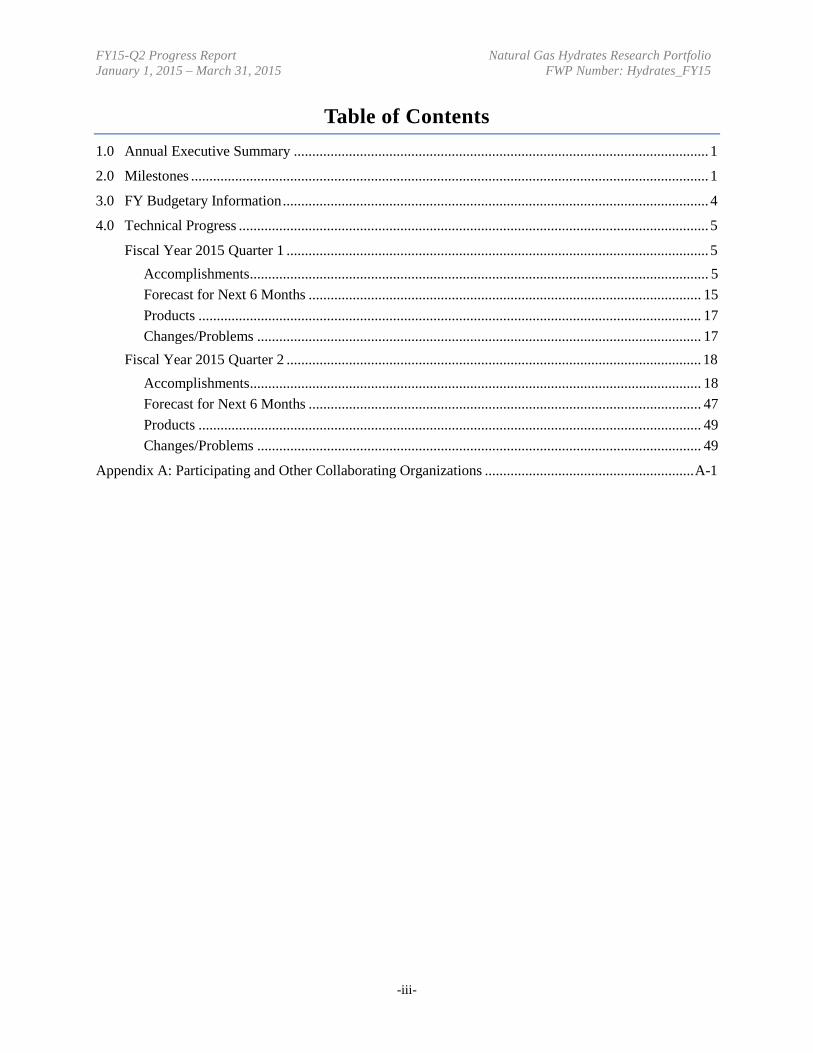
Table of Contents 1.0 Annual Executive Summary ................................................................................................................. 1
2.0 Milestones ............................................................................................................................................. 1
3.0 FY Budgetary Information .................................................................................................................... 4
4.0 Technical Progress ................................................................................................................................ 5
Fiscal Year 2015 Quarter 1 ................................................................................................................... 5
Accomplishments ............................................................................................................................. 5 Forecast for Next 6 Months ........................................................................................................... 15 Products ......................................................................................................................................... 17 Changes/Problems ......................................................................................................................... 17
Fiscal Year 2015 Quarter 2 ................................................................................................................. 18
Accomplishments ........................................................................................................................... 18 Forecast for Next 6 Months ........................................................................................................... 47 Products ......................................................................................................................................... 49 Changes/Problems ......................................................................................................................... 49
Appendix A: Participating and Other Collaborating Organizations ......................................................... A-1
-iii-
FY15-Q2 Progress Report Natural Gas Hydrates Research Portfolio January 1, 2015 – March 31, 2015 FWP Number: Hydrates_FY15
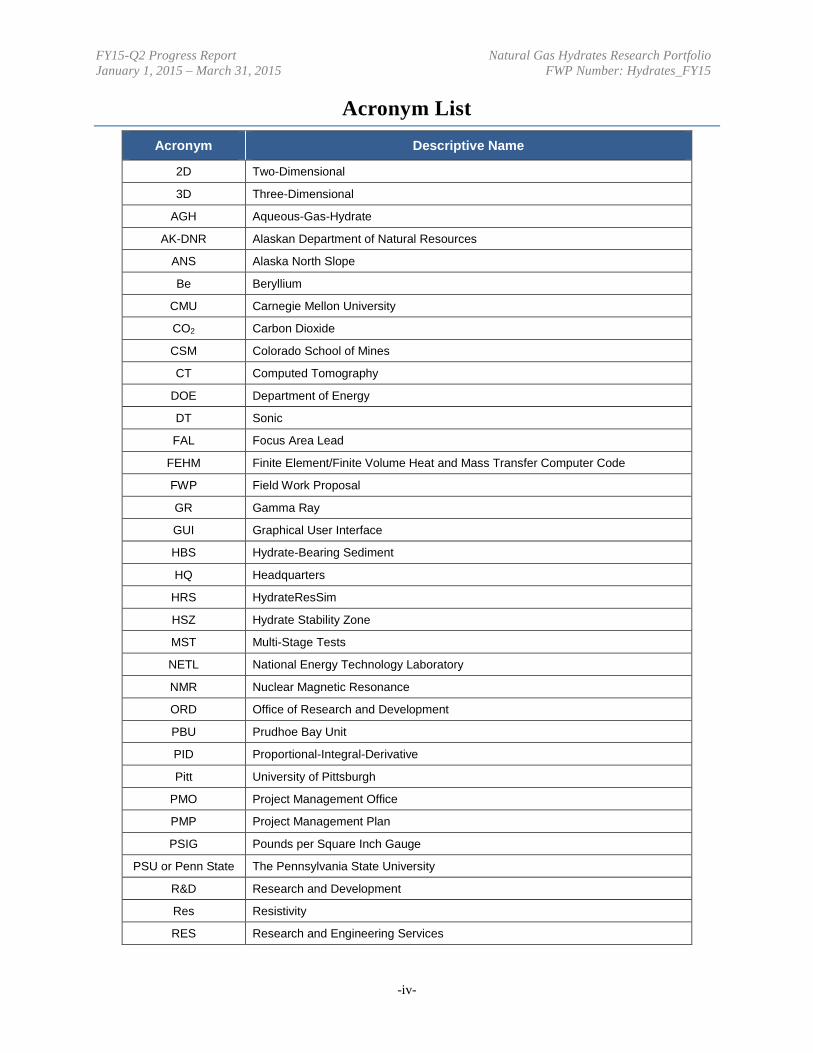
Acronym List Acronym Descriptive Name
2D Two-Dimensional
3D Three-Dimensional
AGH Aqueous-Gas-Hydrate
AK-DNR Alaskan Department of Natural Resources
ANS Alaska North Slope
Be Beryllium
CMU Carnegie Mellon University
CO2 Carbon Dioxide
CSM Colorado School of Mines
CT Computed Tomography
DOE Department of Energy
DT Sonic
FAL Focus Area Lead
FEHM Finite Element/Finite Volume Heat and Mass Transfer Computer Code
FWP Field Work Proposal
GR Gamma Ray
GUI Graphical User Interface
HBS Hydrate-Bearing Sediment
HQ Headquarters
HRS HydrateResSim
HSZ Hydrate Stability Zone
MST Multi-Stage Tests
NETL National Energy Technology Laboratory
NMR Nuclear Magnetic Resonance
ORD Office of Research and Development
PBU Prudhoe Bay Unit
PID Proportional-Integral-Derivative
Pitt University of Pittsburgh
PMO Project Management Office
PMP Project Management Plan
PSIG Pounds per Square Inch Gauge
PSU or Penn State The Pennsylvania State University
R&D Research and Development
Res Resistivity
RES Research and Engineering Services
-iv-
FY15-Q2 Progress Report Natural Gas Hydrates Research Portfolio January 1, 2015 – March 31, 2015 FWP Number: Hydrates_FY15
Acronym Descriptive Name
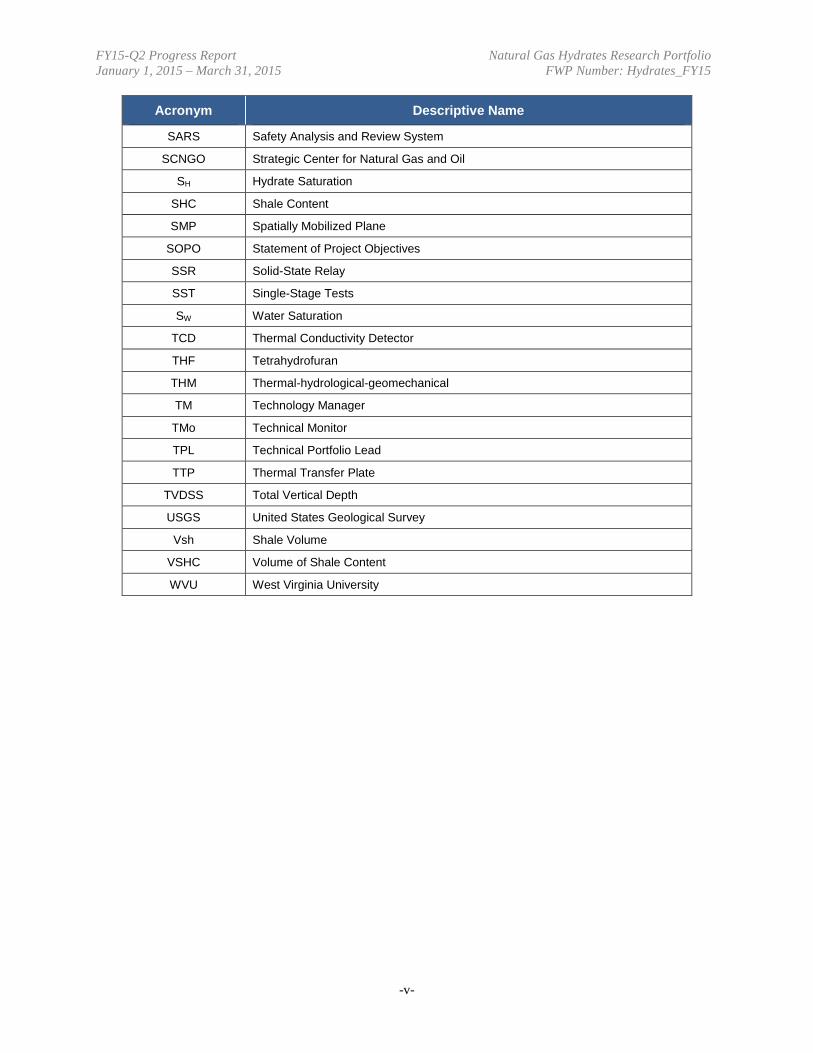
SARS Safety Analysis and Review System
SCNGO Strategic Center for Natural Gas and Oil
SH Hydrate Saturation
SHC Shale Content
SMP Spatially Mobilized Plane
SOPO Statement of Project Objectives
SSR Solid-State Relay
SST Single-Stage Tests
SW Water Saturation
TCD Thermal Conductivity Detector
THF Tetrahydrofuran
THM Thermal-hydrological-geomechanical
TM Technology Manager
TMo Technical Monitor
TPL Technical Portfolio Lead
TTP Thermal Transfer Plate
TVDSS Total Vertical Depth
USGS United States Geological Survey
Vsh Shale Volume
VSHC Volume of Shale Content
WVU West Virginia University
-v-
FY15-Q2 Progress Report Natural Gas Hydrates Research Portfolio January 1, 2015 – March 31, 2015 FWP Number: Hydrates_FY15 1.0 Annual Executive Summary The Annual Executive Summary will be provided in the FY15-Q4 Report.
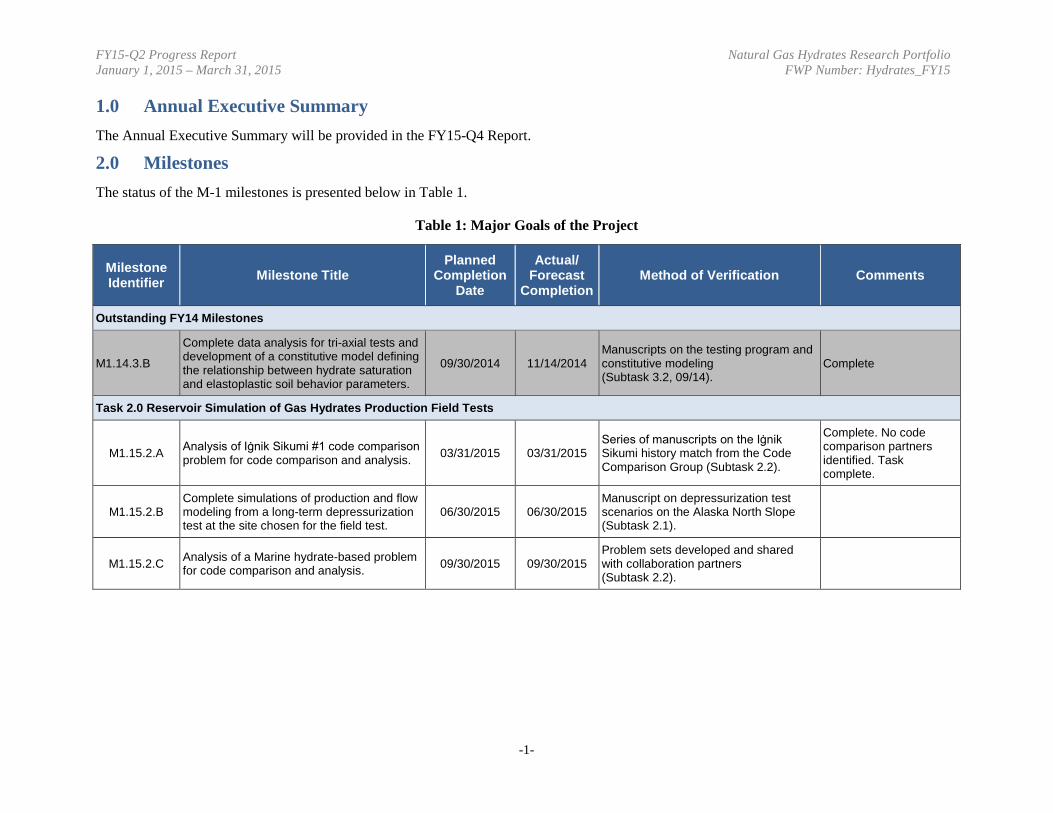
2.0 Milestones The status of the M-1 milestones is presented below in Table 1.
Table 1: Major Goals of the Project
Milestone Identifier Milestone Title
Planned Completion
Date
Actual/ Forecast
Completion Method of Verification Comments
Outstanding FY14 Milestones
M1.14.3.B
Complete data analysis for tri-axial tests and development of a constitutive model defining the relationship between hydrate saturation and elastoplastic soil behavior parameters.
09/30/2014 11/14/2014 Manuscripts on the testing program and constitutive modeling (Subtask 3.2, 09/14).
Complete
Task 2.0 Reservoir Simulation of Gas Hydrates Production Field Tests
M1.15.2.A Analysis of Iġnik Sikumi #1 code comparison problem for code comparison and analysis. 03/31/2015 03/31/2015
Series of manuscripts on the Iġnik Sikumi history match from the Code Comparison Group (Subtask 2.2).
Complete. No code comparison partners identified. Task complete.
M1.15.2.B Complete simulations of production and flow modeling from a long-term depressurization test at the site chosen for the field test.
06/30/2015 06/30/2015 Manuscript on depressurization test scenarios on the Alaska North Slope (Subtask 2.1).
M1.15.2.C Analysis of a Marine hydrate-based problem for code comparison and analysis. 09/30/2015 09/30/2015
Problem sets developed and shared with collaboration partners (Subtask 2.2).
-1-
FY15-Q2 Progress Report Natural Gas Hydrates Research Portfolio January 1, 2015 – March 31, 2015 FWP Number: Hydrates_FY15
Milestone Identifier Milestone Title
Planned Completion
Date
Actual/ Forecast
Completion Method of Verification Comments
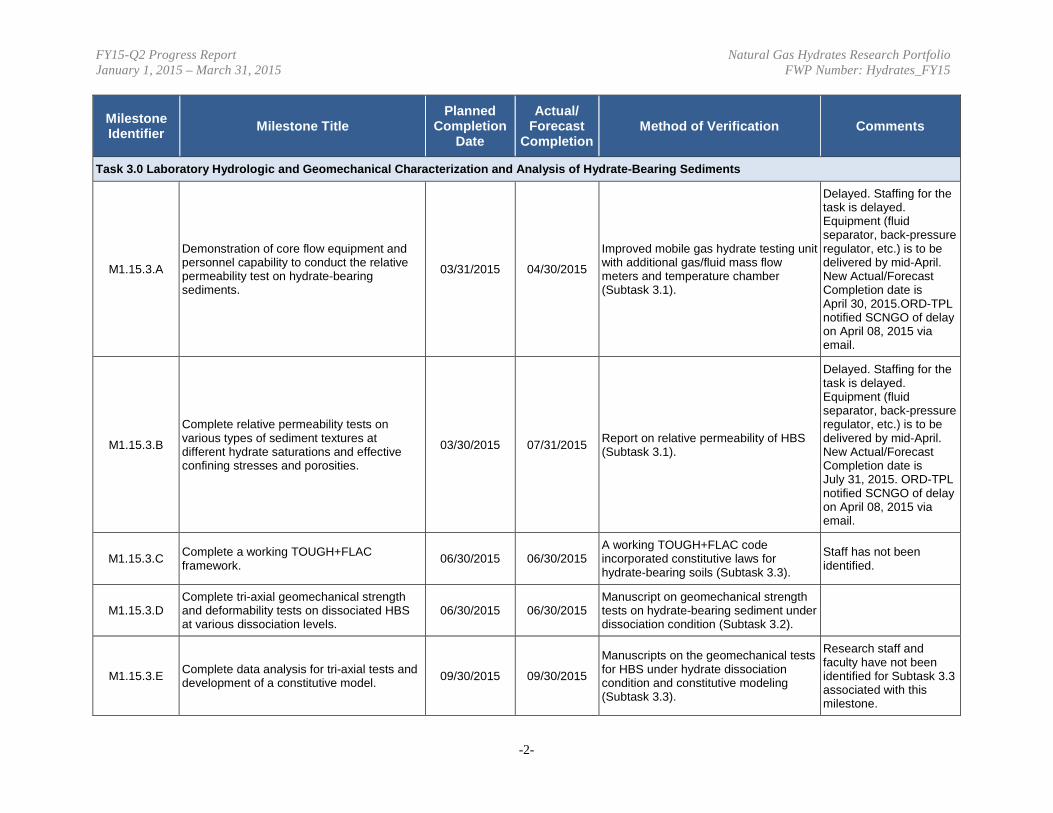
Task 3.0 Laboratory Hydrologic and Geomechanical Characterization and Analysis of Hydrate-Bearing Sediments
M1.15.3.A
Demonstration of core flow equipment and personnel capability to conduct the relative permeability test on hydrate-bearing sediments.
03/31/2015 04/30/2015
Improved mobile gas hydrate testing unit with additional gas/fluid mass flow meters and temperature chamber (Subtask 3.1).
Delayed. Staffing for the task is delayed. Equipment (fluid separator, back-pressure regulator, etc.) is to be delivered by mid-April. New Actual/Forecast Completion date is April 30, 2015.ORD-TPL notified SCNGO of delay on April 08, 2015 via email.
M1.15.3.B
Complete relative permeability tests on various types of sediment textures at different hydrate saturations and effective confining stresses and porosities.
03/30/2015 07/31/2015 Report on relative permeability of HBS (Subtask 3.1).
Delayed. Staffing for the task is delayed. Equipment (fluid separator, back-pressure regulator, etc.) is to be delivered by mid-April. New Actual/Forecast Completion date is July 31, 2015. ORD-TPL notified SCNGO of delay on April 08, 2015 via email.
M1.15.3.C Complete a working TOUGH+FLAC framework. 06/30/2015 06/30/2015
A working TOUGH+FLAC code incorporated constitutive laws for hydrate-bearing soils (Subtask 3.3).
Staff has not been identified.
M1.15.3.D Complete tri-axial geomechanical strength and deformability tests on dissociated HBS at various dissociation levels.
06/30/2015 06/30/2015 Manuscript on geomechanical strength tests on hydrate-bearing sediment under dissociation condition (Subtask 3.2).
M1.15.3.E Complete data analysis for tri-axial tests and development of a constitutive model. 09/30/2015 09/30/2015
Manuscripts on the geomechanical tests for HBS under hydrate dissociation condition and constitutive modeling (Subtask 3.3).
Research staff and faculty have not been identified for Subtask 3.3 associated with this milestone.
-2-
FY15-Q2 Progress Report Natural Gas Hydrates Research Portfolio January 1, 2015 – March 31, 2015 FWP Number: Hydrates_FY15
Milestone Identifier Milestone Title
Planned Completion
Date
Actual/ Forecast
Completion Method of Verification Comments
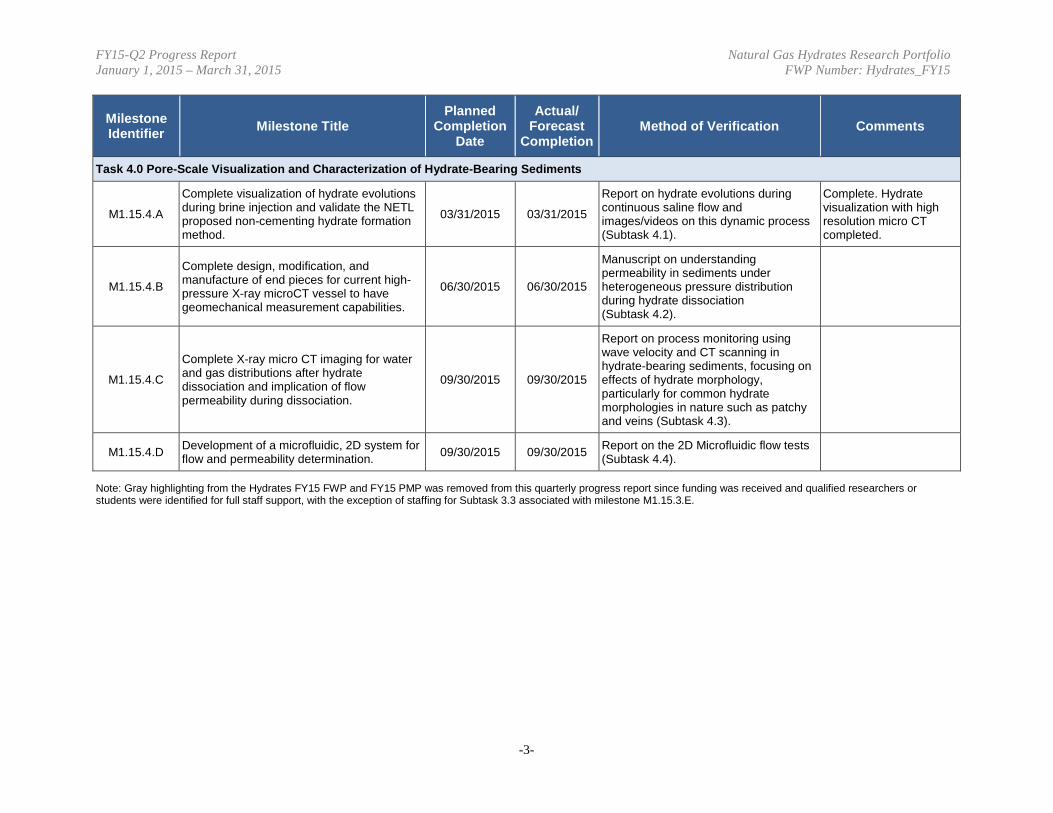
Task 4.0 Pore-Scale Visualization and Characterization of Hydrate-Bearing Sediments
M1.15.4.A
Complete visualization of hydrate evolutions during brine injection and validate the NETL proposed non-cementing hydrate formation method.
03/31/2015 03/31/2015
Report on hydrate evolutions during continuous saline flow and images/videos on this dynamic process (Subtask 4.1).
Complete. Hydrate visualization with high resolution micro CT completed.
M1.15.4.B
Complete design, modification, and manufacture of end pieces for current high-pressure X-ray microCT vessel to have geomechanical measurement capabilities.
06/30/2015 06/30/2015
Manuscript on understanding permeability in sediments under heterogeneous pressure distribution during hydrate dissociation (Subtask 4.2).
M1.15.4.C
Complete X-ray micro CT imaging for water and gas distributions after hydrate dissociation and implication of flow permeability during dissociation.
09/30/2015 09/30/2015
Report on process monitoring using wave velocity and CT scanning in hydrate-bearing sediments, focusing on effects of hydrate morphology, particularly for common hydrate morphologies in nature such as patchy and veins (Subtask 4.3).
M1.15.4.D Development of a microfluidic, 2D system for flow and permeability determination. 09/30/2015 09/30/2015 Report on the 2D Microfluidic flow tests
(Subtask 4.4).
Note: Gray highlighting from the Hydrates FY15 FWP and FY15 PMP was removed from this quarterly progress report since funding was received and qualified researchers or students were identified for full staff support, with the exception of staffing for Subtask 3.3 associated with milestone M1.15.3.E.
-3-
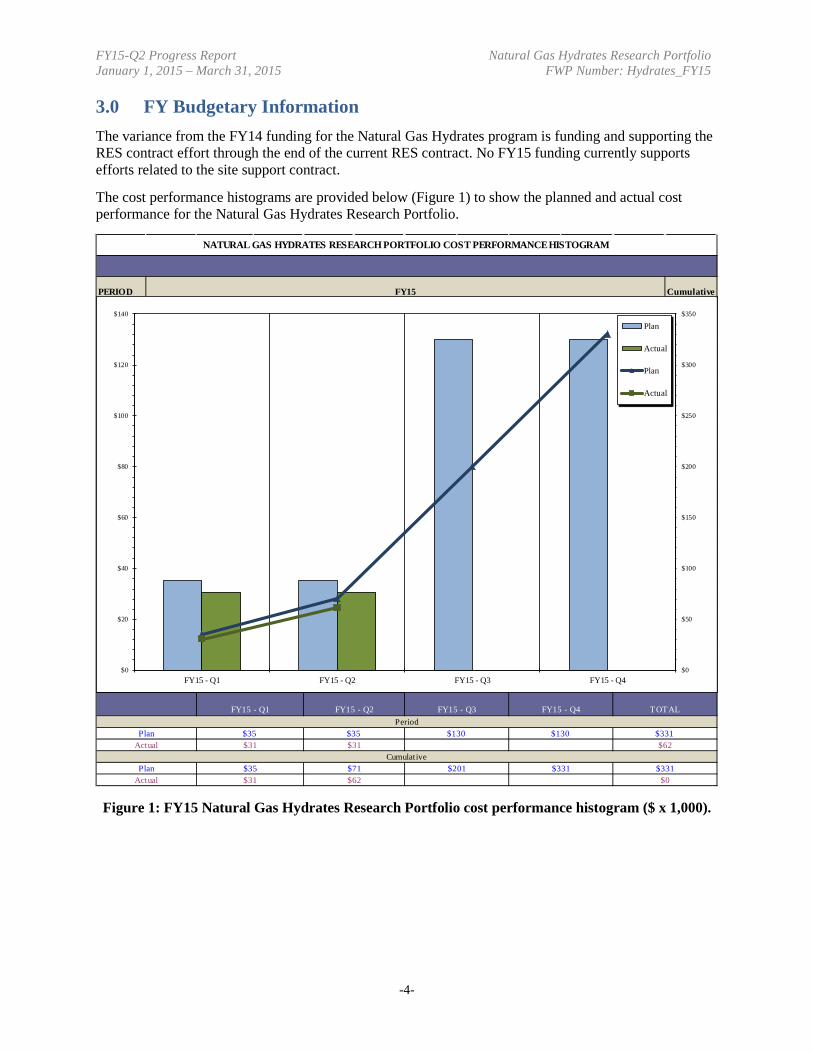
FY15-Q2 Progress Report Natural Gas Hydrates Research Portfolio January 1, 2015 – March 31, 2015 FWP Number: Hydrates_FY15 3.0 FY Budgetary Information The variance from the FY14 funding for the Natural Gas Hydrates program is funding and supporting the RES contract effort through the end of the current RES contract. No FY15 funding currently supports efforts related to the site support contract.
The cost performance histograms are provided below (Figure 1) to show the planned and actual cost performance for the Natural Gas Hydrates Research Portfolio.
Figure 1: FY15 Natural Gas Hydrates Research Portfolio cost performance histogram ($ x 1,000).
PERIOD Cumulative
NATURAL GAS HYDRATES RESEARCH PORTFOLIO COST PERFORMANCE HISTOGRAM
FY15
FY15 - Q1 FY15 - Q2 FY15 - Q3 FY15 - Q4 TOTAL
$62
PeriodPlan $35 $35 $130 $130 $331
Actual $31 $31
$0
CumulativePlan $35 $71 $201 $331 $331
Actual $31 $62
$0
$50
$100
$150
$200
$250
$300
$350
$0
$20
$40
$60
$80
$100
$120
$140
FY15 - Q1 FY15 - Q2 FY15 - Q3 FY15 - Q4
Plan
Actual
Plan
Actual
-4-
FY15-Q2 Progress Report Natural Gas Hydrates Research Portfolio January 1, 2015 – March 31, 2015 FWP Number: Hydrates_FY15 4.0 Technical Progress
Fiscal Year 2015 Quarter 1
Accomplishments
Task 1.0 Project Management and Outreach
All project management deliverables from the NETL Office of Research and Development (ORD) to the Strategic Center for Natural Gas and Oil (SCNGO) were delivered on time with support from the Project Management Office (PMO). Deliverables inclusive of reports to SCNGO, task and subtask meetings, monthly invoice reviews with URS/AECOM, and milestone tracking were all met within the scheduled timeframe. SCNGO can access their required deliverables via SharePoint at: http://prod65-share4.netl.doe.gov/sites/ORD-PMO/Pages/SCNGO.aspx.
The FY15-Q1 deliverables included:
• The FY14-Q4 Report was submitted to SCNGO on November 20, 2014.
• As per new SCNGO guidance, the progress reports for Q1, Q2, Q3, and Q4 were cumulated with an annual executive summary to serve as the annual report deliverable.
Technical writing, deliverable coordination, and project controls support were provided by the PMO.
Task 2.0 Reservoir Simulation of Gas Hydrates Production Field Tests
Subtask 2.1 Alaska North Slope Production Test Simulation Assistance
• A 3D heterogeneous Site 2 model was constructed. Site 2 is a theoretically deeper Mt. Elbert-like deposit which might be encountered within the Milne point unit. Since the reservoir depth of Site 2 is yet unknown, a series of simulations were run with a range of reservoir depths varying from 570 – 670 m. Gas rate profiles show that higher gas rates are obtained with an increase in reservoir depth. These results are reasonable because the relatively higher temperatures of deeper reservoirs increase instability of the hydrates which make them dissociate readily.
• A framework for conducting flow assurance studies in production wellbore was designed. This was done by developing a transient 2D temperature model in a two-phase vertical wellbore water+gas system with hydrate formation using the approach of computational fluid dynamics. An annulus growth of the hydrate propensity field was observed within the wellbore.
• The next steps will involve conducting sensitivity runs and uncertainty analyses on Site 2 with respect to the distribution of hydrate saturation and porosity.
The wellbore models will be refined by relaxing some of the assumptions to improve on their validity and accuracy.
-5-
FY15-Q2 Progress Report Natural Gas Hydrates Research Portfolio January 1, 2015 – March 31, 2015 FWP Number: Hydrates_FY15
Subtask 2.2 International Code Comparison Continuation – Iġnik Sikumi History Match Analysis and Marine Deposit Based on the 2013 Nankai Trough Test or Other Marine Sites
Different numerical simulation scenarios were considered with a focus on understanding the CO2 injection into the hydrate bearing sands of the permafrost regions. The recent, primary focus is on the formations of the Prudhoe-Bay L-Pad regions.
Summary of work completed in FY14-Q4:
• Numerical simulations were done to study the migration of CO2 in the hydrate formations of the Prudhoe Bay site. CO2-Hydrate is more stable than CH4-Hydrate only at lower pressures (until 285 K); therefore, the top of HSZ (Hydrate Stability Zone) of CH4 was deeper than the top of HSZ of CO2. The reservoir domains were considered as two different zones, Zone-1 being CH4-CO2 Hydrate (AGH state variable was assigned) and Zone-2 as CH4-CO2-Hydrate. In these simulations: (1) gaseous CO2 was injected near the top of CH4 HSZ at a particular pressure and temperature conditions and (2) CH4 production well was modeled as a surface boundary nearly 50 m away from the origin. CH4 production is achieved by depressurizing the domain. Different numerical simulations were performed by changing the state variables of Zones 1 and 2.
• The accomplishments primarily involved studying the CO2 flow in an inclined reservoir modeling the reservoir conditions of the Prudhoe Bay L-Pad region. The trend of the pressure, temperature, and CH4-CO2-Hydrate compositional changes in the formations due to the injection of CO2(g) and CO2(AqG) at the top of the hydrate stability zone of CH4 hydrate was studied.
Task 3.0 Laboratory Hydrologic and Geomechanical Characterization and Analysis of Hydrate-Bearing Sediments
Subtask 3.1 Laboratory Measurement of Relative Permeability of CH4 Gas in Brine-Saturated Hydrate-Bearing Sediments
Relative permeability of CH4 gas in hydrate-bearing sediments (HBS) is a key parameter for numerical simulations and is yet to be determined with relevant samples. In FY15-Q1, this task focused mainly on the planning and development of a new experimental setup to properly measure the relative permeability based on existing mobile carts.
• A literature review was conducted. Few studies, regarding “gas-water” relative permeability in hydrate-bearing sediments, were found. The lack of studies in this particular issue was most likely due to difficulties in inhibiting hydrate phase change (hydrate formation/dissociation) during gas/water flooding. Most relevant studies were more related to effective permeability measurements of hydrate-bearing sediments during water flooding.
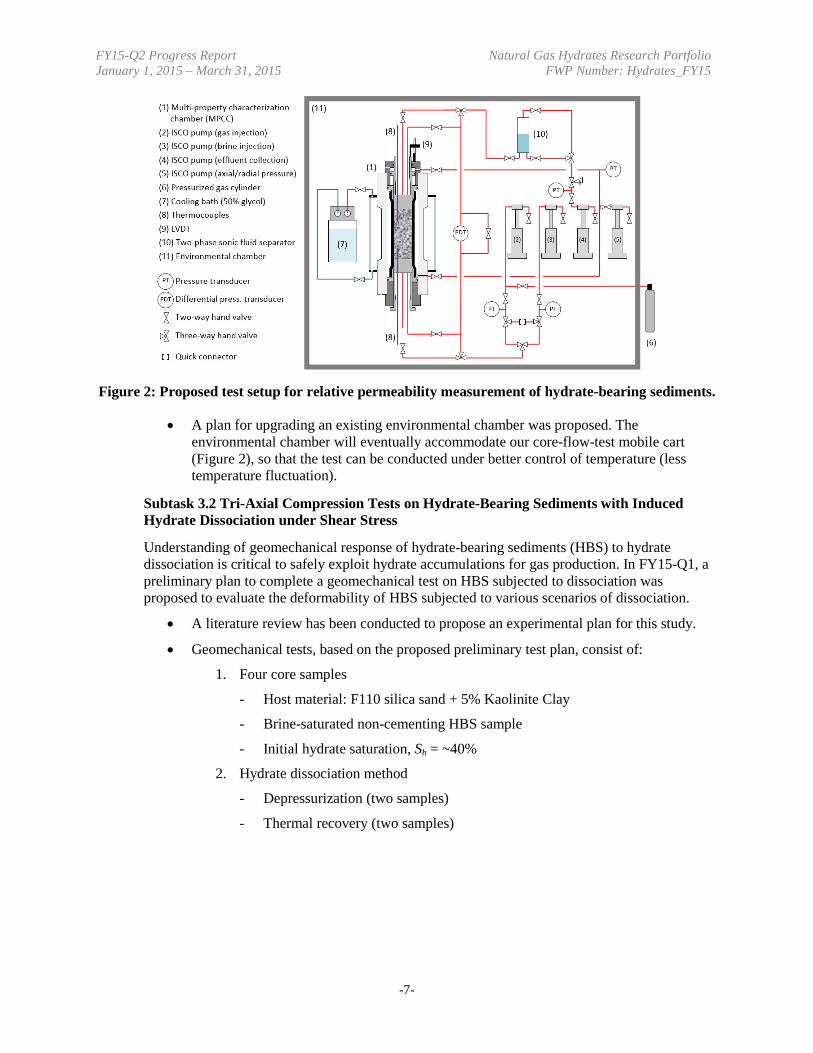
• Preliminary design of test setup was proposed (Figure 2). The validity of the design will be examined in consideration of targeted data collection for gas-water relative permeability measurement in hydrate-bearing sediments. Test equipment and parts, which also includes an electronically-controlled back pressure regulator and a two-phase sonic fluid separator, are to be accordingly obtained.
-6-
FY15-Q2 Progress Report Natural Gas Hydrates Research Portfolio January 1, 2015 – March 31, 2015 FWP Number: Hydrates_FY15
Figure 2: Proposed test setup for relative permeability measurement of hydrate-bearing sediments.
• A plan for upgrading an existing environmental chamber was proposed. The environmental chamber will eventually accommodate our core-flow-test mobile cart (Figure 2), so that the test can be conducted under better control of temperature (less temperature fluctuation).
Subtask 3.2 Tri-Axial Compression Tests on Hydrate-Bearing Sediments with Induced Hydrate Dissociation under Shear Stress
Understanding of geomechanical response of hydrate-bearing sediments (HBS) to hydrate dissociation is critical to safely exploit hydrate accumulations for gas production. In FY15-Q1, a preliminary plan to complete a geomechanical test on HBS subjected to dissociation was proposed to evaluate the deformability of HBS subjected to various scenarios of dissociation.
• A literature review has been conducted to propose an experimental plan for this study.
• Geomechanical tests, based on the proposed preliminary test plan, consist of:
1. Four core samples
- Host material: F110 silica sand + 5% Kaolinite Clay
- Brine-saturated non-cementing HBS sample
- Initial hydrate saturation, Sh = ~40%
2. Hydrate dissociation method
- Depressurization (two samples)
- Thermal recovery (two samples)
-7-
FY15-Q2 Progress Report Natural Gas Hydrates Research Portfolio January 1, 2015 – March 31, 2015 FWP Number: Hydrates_FY15
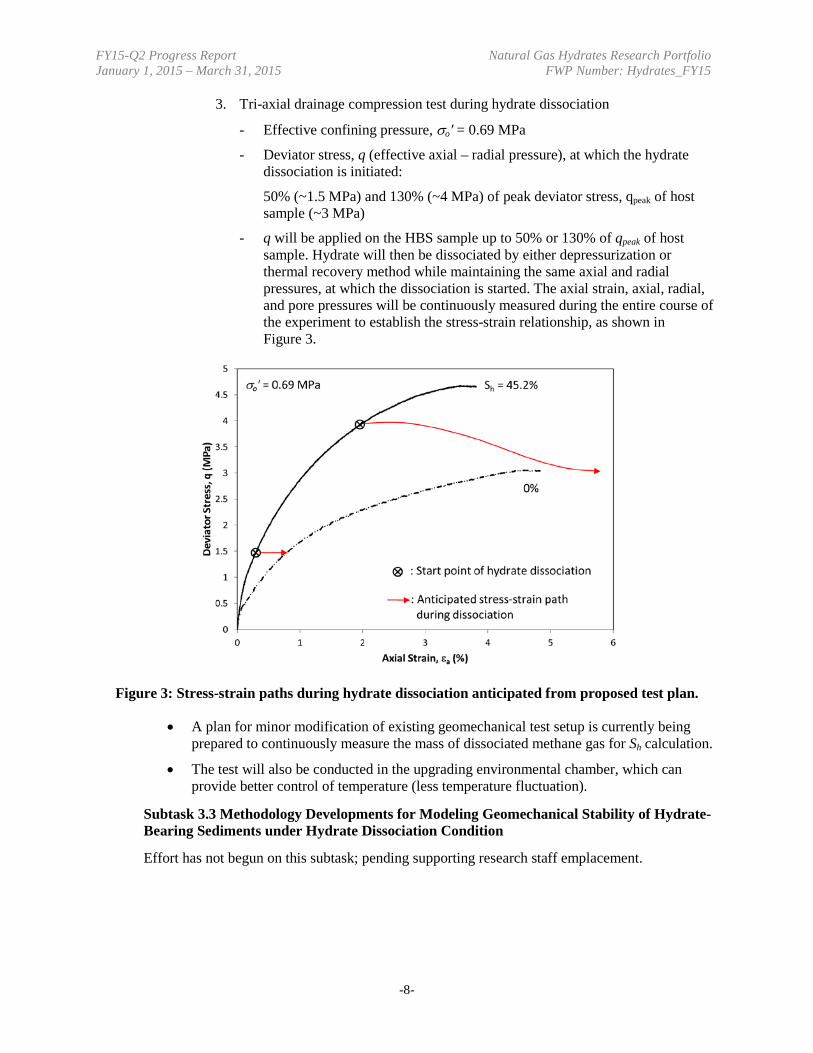
3. Tri-axial drainage compression test during hydrate dissociation
- Effective confining pressure, σo′ = 0.69 MPa
- Deviator stress, q (effective axial – radial pressure), at which the hydrate dissociation is initiated:
50% (~1.5 MPa) and 130% (~4 MPa) of peak deviator stress, qpeak of host sample (~3 MPa)
- q will be applied on the HBS sample up to 50% or 130% of qpeak of host sample. Hydrate will then be dissociated by either depressurization or thermal recovery method while maintaining the same axial and radial pressures, at which the dissociation is started. The axial strain, axial, radial, and pore pressures will be continuously measured during the entire course of the experiment to establish the stress-strain relationship, as shown in Figure 3.
Figure 3: Stress-strain paths during hydrate dissociation anticipated from proposed test plan.
• A plan for minor modification of existing geomechanical test setup is currently being prepared to continuously measure the mass of dissociated methane gas for Sh calculation.
• The test will also be conducted in the upgrading environmental chamber, which can provide better control of temperature (less temperature fluctuation).
Subtask 3.3 Methodology Developments for Modeling Geomechanical Stability of Hydrate-Bearing Sediments under Hydrate Dissociation Condition
Effort has not begun on this subtask; pending supporting research staff emplacement.
-8-
FY15-Q2 Progress Report Natural Gas Hydrates Research Portfolio January 1, 2015 – March 31, 2015 FWP Number: Hydrates_FY15 Task 4.0 Pore-Scale Visualization and Characterization of Hydrate-Bearing Sediments
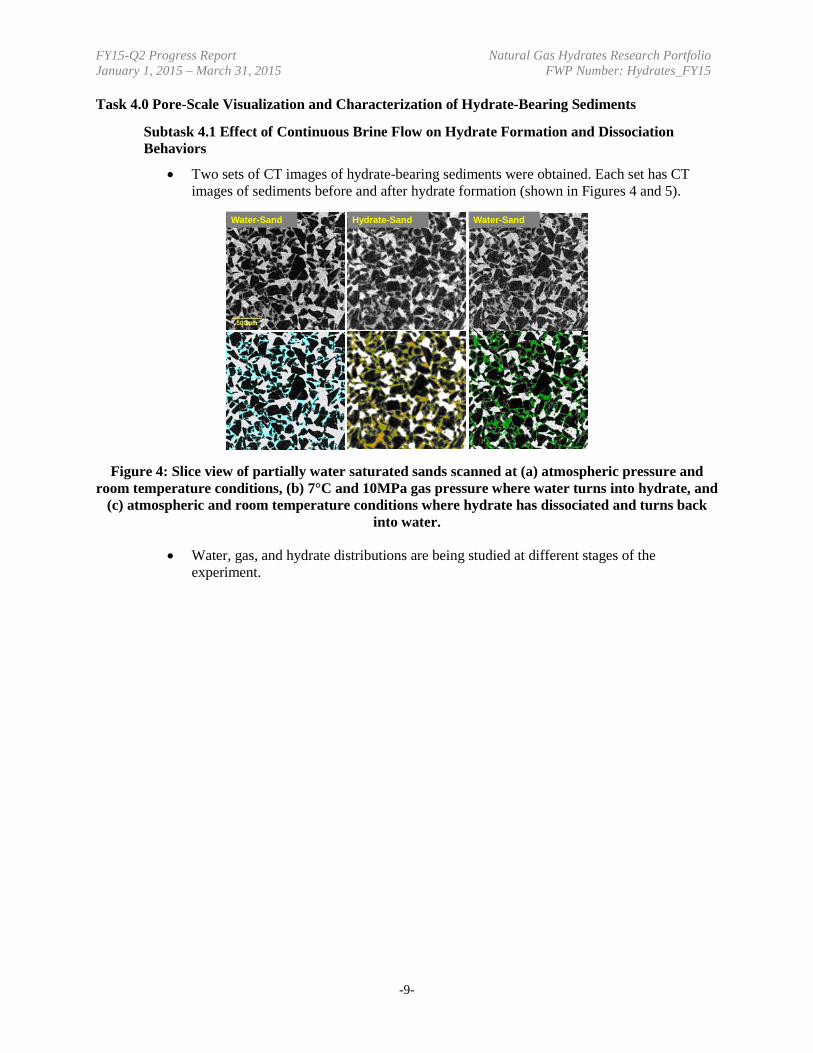
Subtask 4.1 Effect of Continuous Brine Flow on Hydrate Formation and Dissociation Behaviors
• Two sets of CT images of hydrate-bearing sediments were obtained. Each set has CT images of sediments before and after hydrate formation (shown in Figures 4 and 5).
Figure 4: Slice view of partially water saturated sands scanned at (a) atmospheric pressure and room temperature conditions, (b) 7°C and 10MPa gas pressure where water turns into hydrate, and
(c) atmospheric and room temperature conditions where hydrate has dissociated and turns back into water.
• Water, gas, and hydrate distributions are being studied at different stages of the experiment.
Water-Sand Hydrate-Sand Water-Sand
-9-
FY15-Q2 Progress Report Natural Gas Hydrates Research Portfolio January 1, 2015 – March 31, 2015 FWP Number: Hydrates_FY15
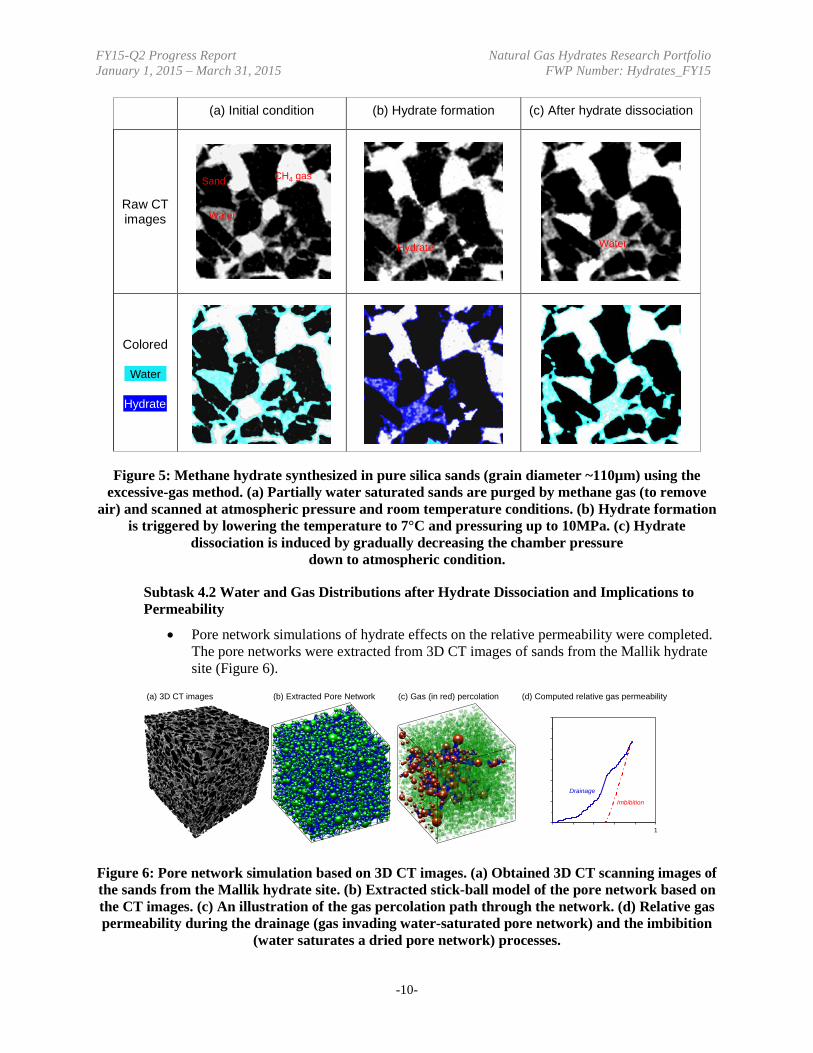
Figure 5: Methane hydrate synthesized in pure silica sands (grain diameter ~110µm) using the excessive-gas method. (a) Partially water saturated sands are purged by methane gas (to remove
air) and scanned at atmospheric pressure and room temperature conditions. (b) Hydrate formation is triggered by lowering the temperature to 7°C and pressuring up to 10MPa. (c) Hydrate
dissociation is induced by gradually decreasing the chamber pressure down to atmospheric condition.
Subtask 4.2 Water and Gas Distributions after Hydrate Dissociation and Implications to Permeability
• Pore network simulations of hydrate effects on the relative permeability were completed. The pore networks were extracted from 3D CT images of sands from the Mallik hydrate site (Figure 6).
Figure 6: Pore network simulation based on 3D CT images. (a) Obtained 3D CT scanning images of the sands from the Mallik hydrate site. (b) Extracted stick-ball model of the pore network based on the CT images. (c) An illustration of the gas percolation path through the network. (d) Relative gas permeability during the drainage (gas invading water-saturated pore network) and the imbibition
(water saturates a dried pore network) processes.
(a) Initial condition (b) Hydrate formation (c) After hydrate dissociation
Raw CT images
Colored
Sand
Water
CH4 gas
Hydrate Water
Water
Hydrate
(a) 3D CT images (b) Extracted Pore Network (c) Gas (in red) percolation
1
Drainage
Imbibition
(d) Computed relative gas permeability
-10-
FY15-Q2 Progress Report Natural Gas Hydrates Research Portfolio January 1, 2015 – March 31, 2015 FWP Number: Hydrates_FY15
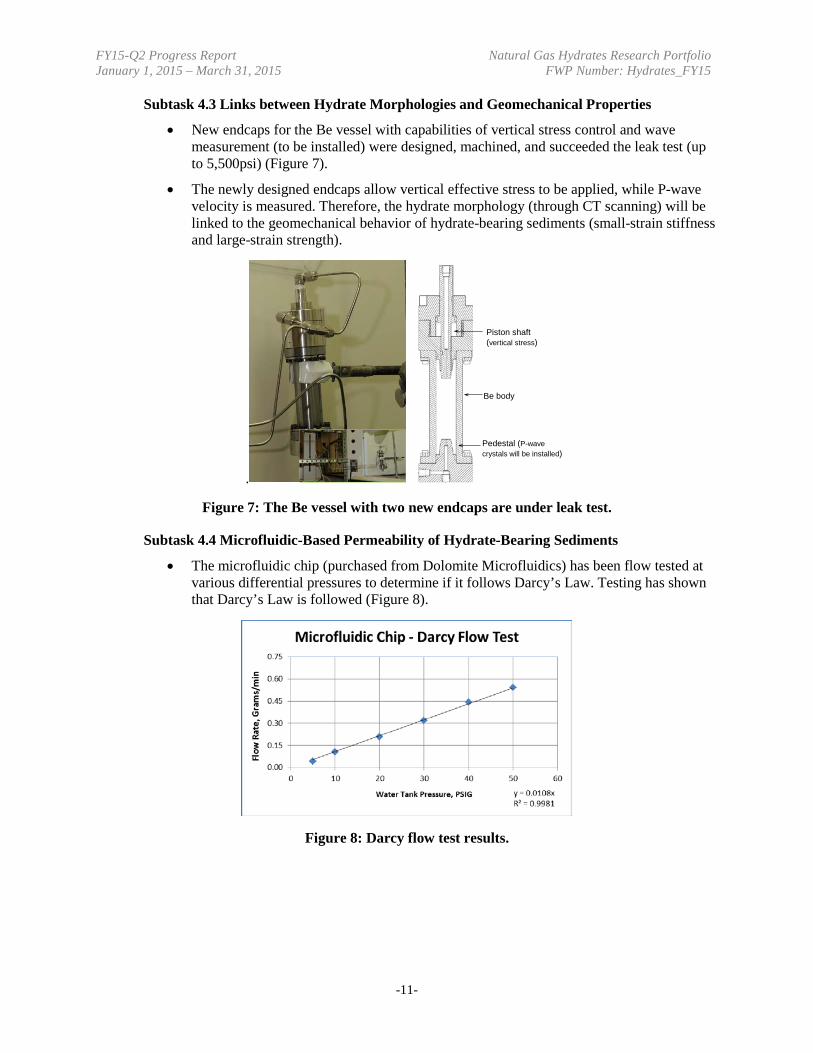
Subtask 4.3 Links between Hydrate Morphologies and Geomechanical Properties
• New endcaps for the Be vessel with capabilities of vertical stress control and wave measurement (to be installed) were designed, machined, and succeeded the leak test (up to 5,500psi) (Figure 7).
• The newly designed endcaps allow vertical effective stress to be applied, while P-wave velocity is measured. Therefore, the hydrate morphology (through CT scanning) will be linked to the geomechanical behavior of hydrate-bearing sediments (small-strain stiffness and large-strain strength).
.
Figure 7: The Be vessel with two new endcaps are under leak test.
Subtask 4.4 Microfluidic-Based Permeability of Hydrate-Bearing Sediments
• The microfluidic chip (purchased from Dolomite Microfluidics) has been flow tested at various differential pressures to determine if it follows Darcy’s Law. Testing has shown that Darcy’s Law is followed (Figure 8).
Figure 8: Darcy flow test results.
Be body
Pedestal (P-wave crystals will be installed)
Piston shaft(vertical stress)
-11-
FY15-Q2 Progress Report Natural Gas Hydrates Research Portfolio January 1, 2015 – March 31, 2015 FWP Number: Hydrates_FY15
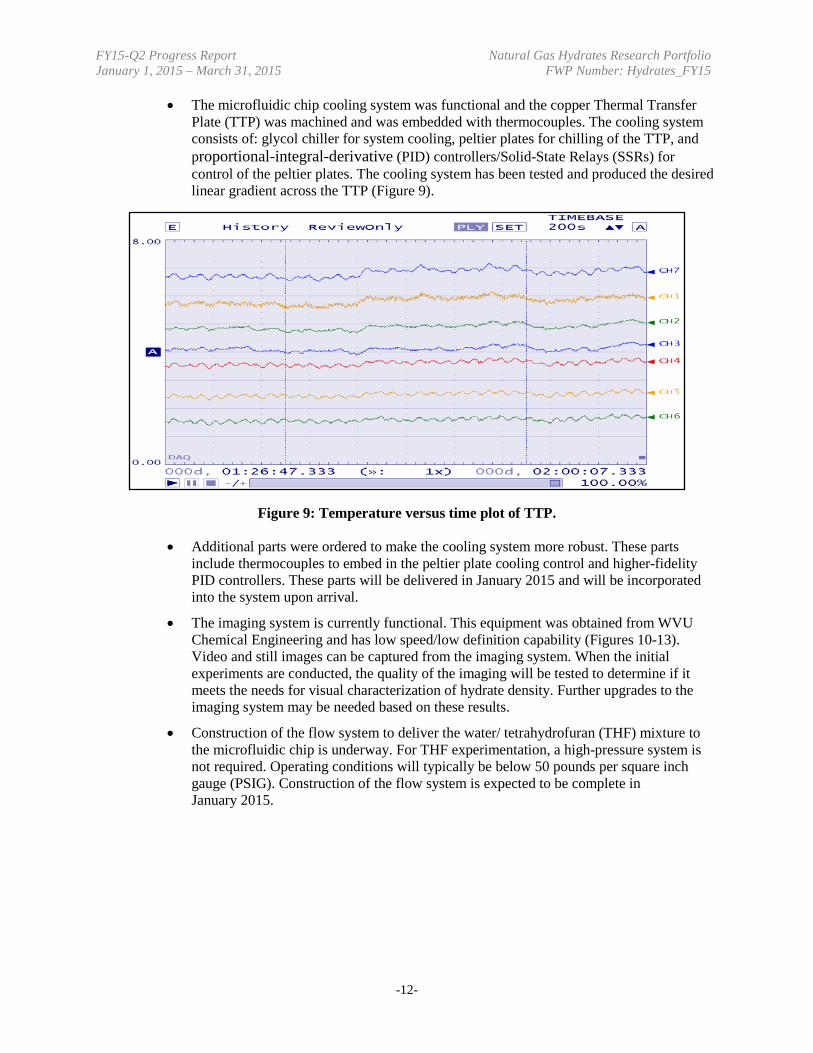
• The microfluidic chip cooling system was functional and the copper Thermal Transfer Plate (TTP) was machined and was embedded with thermocouples. The cooling system consists of: glycol chiller for system cooling, peltier plates for chilling of the TTP, and proportional-integral-derivative (PID) controllers/Solid-State Relays (SSRs) for control of the peltier plates. The cooling system has been tested and produced the desired linear gradient across the TTP (Figure 9).
Figure 9: Temperature versus time plot of TTP.
• Additional parts were ordered to make the cooling system more robust. These parts include thermocouples to embed in the peltier plate cooling control and higher-fidelity PID controllers. These parts will be delivered in January 2015 and will be incorporated into the system upon arrival.
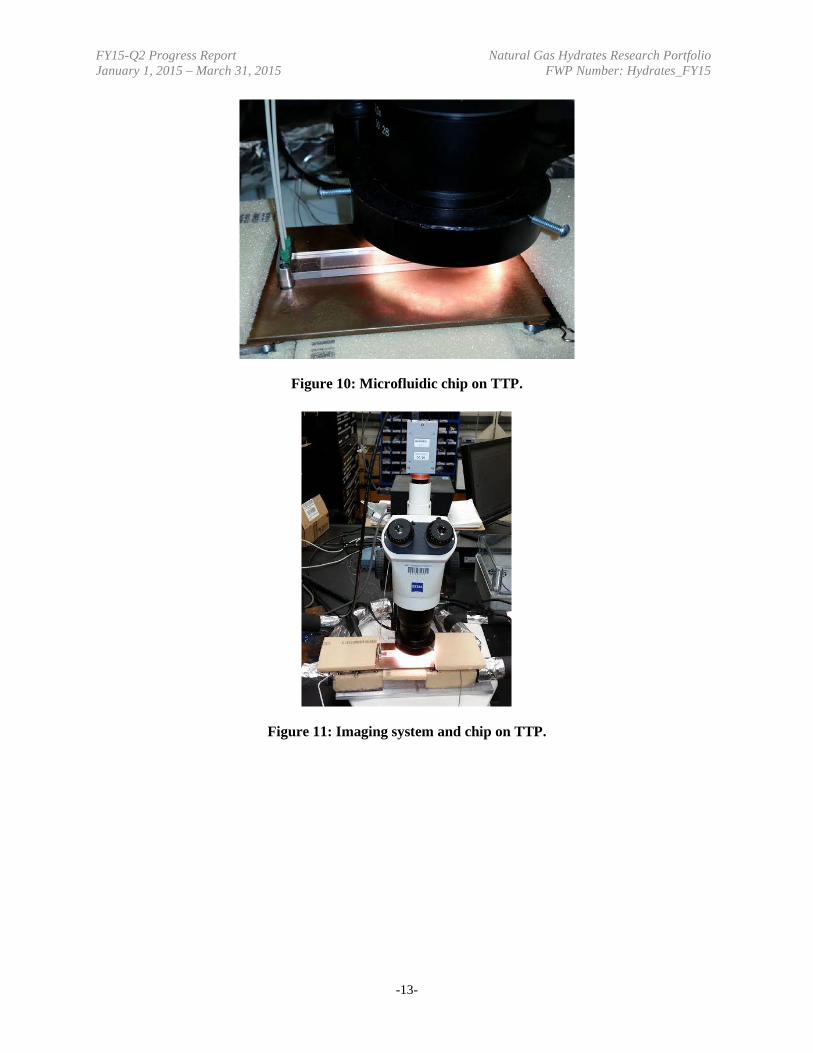
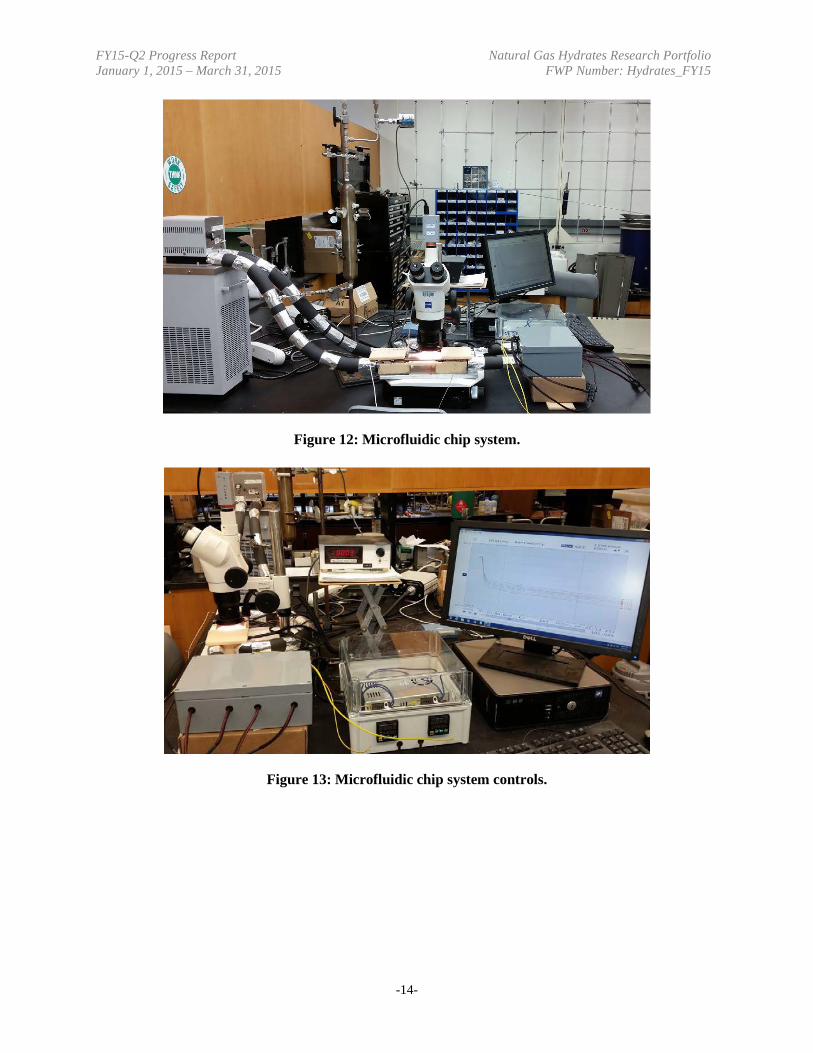
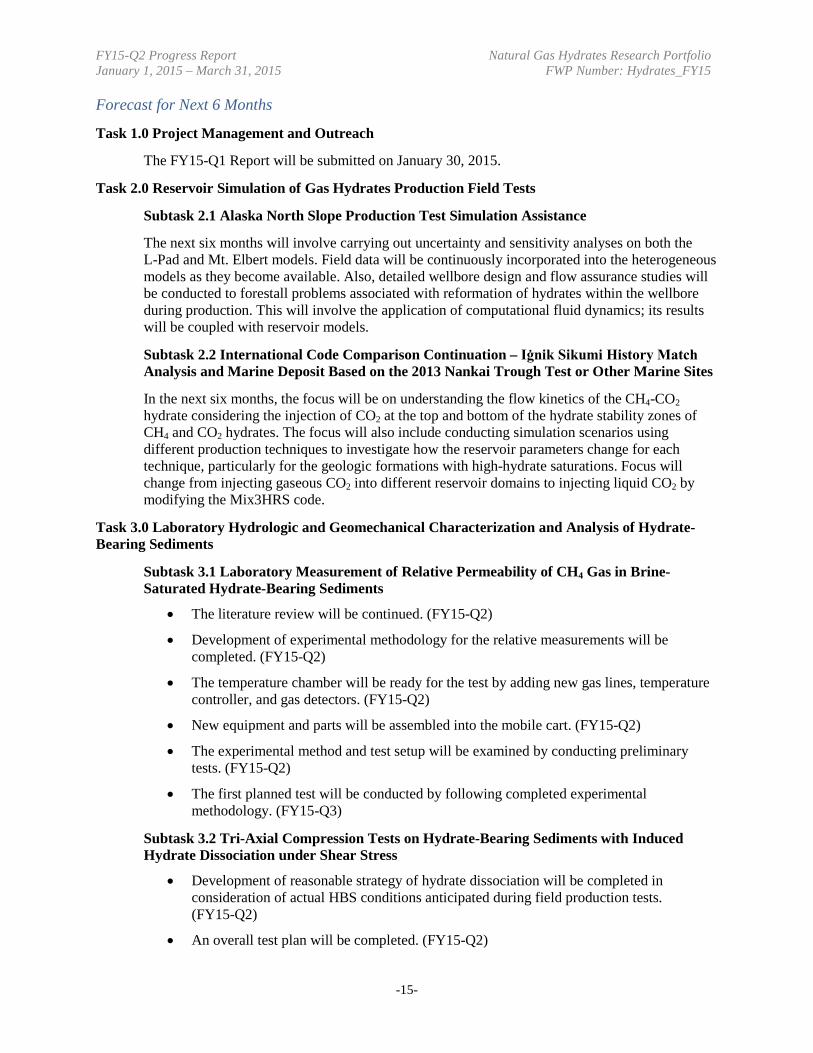
• The imaging system is currently functional. This equipment was obtained from WVU Chemical Engineering and has low speed/low definition capability (Figures 10-13). Video and still images can be captured from the imaging system. When the initial experiments are conducted, the quality of the imaging will be tested to determine if it meets the needs for visual characterization of hydrate density. Further upgrades to the imaging system may be needed based on these results.
• Construction of the flow system to deliver the water/ tetrahydrofuran (THF) mixture to the microfluidic chip is underway. For THF experimentation, a high-pressure system is not required. Operating conditions will typically be below 50 pounds per square inch gauge (PSIG). Construction of the flow system is expected to be complete in January 2015.
-12-
FY15-Q2 Progress Report Natural Gas Hydrates Research Portfolio January 1, 2015 – March 31, 2015 FWP Number: Hydrates_FY15
Figure 10: Microfluidic chip on TTP.
Figure 11: Imaging system and chip on TTP.
-13-
FY15-Q2 Progress Report Natural Gas Hydrates Research Portfolio January 1, 2015 – March 31, 2015 FWP Number: Hydrates_FY15
Figure 12: Microfluidic chip system.
Figure 13: Microfluidic chip system controls.
-14-
FY15-Q2 Progress Report Natural Gas Hydrates Research Portfolio January 1, 2015 – March 31, 2015 FWP Number: Hydrates_FY15 Forecast for Next 6 Months
Task 1.0 Project Management and Outreach
The FY15-Q1 Report will be submitted on January 30, 2015.
Task 2.0 Reservoir Simulation of Gas Hydrates Production Field Tests
Subtask 2.1 Alaska North Slope Production Test Simulation Assistance
The next six months will involve carrying out uncertainty and sensitivity analyses on both the L-Pad and Mt. Elbert models. Field data will be continuously incorporated into the heterogeneous models as they become available. Also, detailed wellbore design and flow assurance studies will be conducted to forestall problems associated with reformation of hydrates within the wellbore during production. This will involve the application of computational fluid dynamics; its results will be coupled with reservoir models.
Subtask 2.2 International Code Comparison Continuation – Iġnik Sikumi History Match Analysis and Marine Deposit Based on the 2013 Nankai Trough Test or Other Marine Sites
In the next six months, the focus will be on understanding the flow kinetics of the CH4-CO2 hydrate considering the injection of CO2 at the top and bottom of the hydrate stability zones of CH4 and CO2 hydrates. The focus will also include conducting simulation scenarios using different production techniques to investigate how the reservoir parameters change for each technique, particularly for the geologic formations with high-hydrate saturations. Focus will change from injecting gaseous CO2 into different reservoir domains to injecting liquid CO2 by modifying the Mix3HRS code.
Task 3.0 Laboratory Hydrologic and Geomechanical Characterization and Analysis of Hydrate-Bearing Sediments
Subtask 3.1 Laboratory Measurement of Relative Permeability of CH4 Gas in Brine-Saturated Hydrate-Bearing Sediments
• The literature review will be continued. (FY15-Q2)
• Development of experimental methodology for the relative measurements will be completed. (FY15-Q2)
• The temperature chamber will be ready for the test by adding new gas lines, temperature controller, and gas detectors. (FY15-Q2)
• New equipment and parts will be assembled into the mobile cart. (FY15-Q2)
• The experimental method and test setup will be examined by conducting preliminary tests. (FY15-Q2)
• The first planned test will be conducted by following completed experimental methodology. (FY15-Q3)
Subtask 3.2 Tri-Axial Compression Tests on Hydrate-Bearing Sediments with Induced Hydrate Dissociation under Shear Stress
• Development of reasonable strategy of hydrate dissociation will be completed in consideration of actual HBS conditions anticipated during field production tests. (FY15-Q2)
• An overall test plan will be completed. (FY15-Q2)
-15-
FY15-Q2 Progress Report Natural Gas Hydrates Research Portfolio January 1, 2015 – March 31, 2015 FWP Number: Hydrates_FY15
• Modification of the existing geomechanical test setup will be completed in accordance with the test plan. (FY-Q2)
• An initial compression test will be conducted, simultaneously examining the test plan and setups. (FY15-Q3)
Subtask 3.3 Methodology Developments for Modeling Geomechanical Stability of Hydrate-Bearing Sediments under Hydrate Dissociation Condition
Effort has not begun on this subtask; pending identification of research staff on the task. The team hopes to validate the constitutive model with experimental data on the modeling of dissociation on stress-strain behavior. The team would also conduct and develop benchmark tests for validating the coupling analysis for geomechanics analysis of operational scenarios, for use in such cases as methane extraction from the ground.
Task 4.0 Pore-Scale Visualization and Characterization of Hydrate-Bearing Sediments
Subtask 4.1 Effect of Continuous Brine Flow on Hydrate Formation and Dissociation Behaviors
• To follow the NETL’s recipe of forming noncementing hydrate and obtain CT images of hydrate pore habits at each critical steps using the Be vessel.
Subtask 4.2 Water and Gas Distributions after Hydrate Dissociation and Implications to Permeability
• To obtain CT images of residual water and gas distributions after hydrate distribution.
• To perform pore network modeling to simulate observed processed and extend the model to other conditions (varying in hydrate saturation, hydrate distribution, pore statistics, etc.) relevant to field conditions.
Subtask 4.3 Links between Hydrate Morphologies and Geomechanical Properties
To use the Be vessel with new endcaps to study the effects of hydrate morphologies on the measured stiffness (i.e., wave velocity) and strength of hydrate-bearing sediments.
Subtask 4.4 Microfluidic-Based Permeability of Hydrate-Bearing Sediments
Beginning in January 2015, experiments with THF hydrate will be conducted to test the system and determine the ability to process images from the experiments. Based on this data, further refinements may be needed to parts of the system to move forward. Image processing will be conducted with ImageJ.
The first experiment will produce THF hydrate in the microfluidic chip without using a temperature gradient. The goal of the experimentation will be to correlate hydrate density to flow, which will show how the permeability of the microfluidic chip changes as hydrate density increases. Once initial testing of THF hydrates are complete, a temperature gradient will be induced to increase the density of hydrate formed, attempting to mimic real world hydrate densities.
-16-
FY15-Q2 Progress Report Natural Gas Hydrates Research Portfolio January 1, 2015 – March 31, 2015 FWP Number: Hydrates_FY15 Products
Publications, Conference Papers, and Presentations
Dai, S., Seol, Y., and Choi, J.H., “Impacts of Hydrate Pore Habits on the Physical Properties of Hydrate Bearing Sediments,” AGU Fall Meeting Abstracts, 2014, B11B-0011. (Subtask 4.3)
Mahabadi, N., Dai, S., Seol, Y., and Jang, J., “Water Retention Curve and Relative Permeability for Gas Production from Hydrate-Bearing Sediments,” AGU Fall Meeting Abstracts, 2014, B11B-0019. (Subtask 4.2)
Seol, Y., Choi, J.H., Dai, S., and Jarvis, K., “Understanding the Physical Properties of Hydrate Bearing Sediments at Pore- and Core-Scales,” Fire in the Ice, under internal review. (Tasks 3.0 and 4.0)
Websites or Other Internet Sites
Hydrate research activity was featured in Researchnews, October 2014, Issue 1, p. 3, “Revealed Secrets in Locked in ICE” and “NETL In-House Research Program: Natural Gas Hydrate R&D” page http://www.netl.doe.gov/File%20Library/Library/Newsroom/researchnews/Research_News_October2014_101514.pdf
Changes/Problems
Deploying the Be vessel for hydrate studies may be delayed, as a result of other projects being behind schedule that engage the Be vessel and the micro-XCT. Aluminum core holders are being designed to be used for Industrial CT (Subtasks 4.1 and 4.3).
On October 17, 2014, our site support contractor, URS Corporation, joined resources with AECOM. They now operate as a single company under the name AECOM. In this document, references to the company address the site support contractor as URS/AECOM.
-17-
FY15-Q2 Progress Report Natural Gas Hydrates Research Portfolio January 1, 2015 – March 31, 2015 FWP Number: Hydrates_FY15 Fiscal Year 2015 Quarter 2
Accomplishments
Task 1.0 Project Management and Outreach
The FY15-Q2 deliverables included:
• The FY15-Q1 Report was submitted to SCNGO on January 30, 2015.
Task 2.0 Reservoir Simulation of Gas Hydrates Production Field Tests
Subtask 2.1 Alaska North Slope Production Test Simulation Assistance
Accomplishments:
Based on spatial analysis of porosity distribution, a 3D heterogeneous reservoir model was developed.
Objective
The objective for FY15-Q2 was to build a robust reservoir model of the L-pad region based on available field data. During this period, efforts were made towards building a 3D heterogeneous reservoir model of the L-pad C- and D-sands with respect to porosity and hydrate saturation distributions. As a first step, spatial analysis of porosity distribution was conducted using vertical porosity variations derived from up to 78 well logs and by applying geostatistical techniques. Anisotropic variograms of spatial porosity correlations were developed and used to perform stochastic simulations honoring field data. The 3D porosity realizations which resulted were used as input for production simulations of the L-pad reservoir model.
Reservoir Flow Simulation
Preliminary numerical flow simulations were conducted based on a single realization of the heterogeneous porosity distribution. Simulation objectives predict gas and water production rates, ensure that simulations are running problem-free, and (as a second step) apply a geostatistical hydrate distribution based on the experimental porosity-saturation correlations and stochastic residual distributions. A primary goal was to run a set of realizations (possibly quantifying them in respect to the reservoir quality using one or two integrated parameters) to determine ranges of production volumes, to explore the design and operational factors which would affect production, and to recommend production schemes.
Input Field Data
Data used in this study included density logs for wells L-106 and L-112, and volume of shale logs for 78 L-pad wells (including L-106 and L-112). All well log data were provided by USGS.
Methods
The steps taken in this study are outlined (in order) below:
1. Converted density logs of L-106 and L-112 to porosity.
2. Performed correlation of porosity-shale volume using pooled porosity values from L-106 and L-112.
3. Calculated porosity values of the C- and D-sand interval in other 76 wells in the L-Pad region using the porosity-shale volume correlation.
-18-
FY15-Q2 Progress Report Natural Gas Hydrates Research Portfolio January 1, 2015 – March 31, 2015 FWP Number: Hydrates_FY15
4. Pre-processed data by trimming, declustering, and normalizing the distribution of the well log-derived porosity values.
5. Quantified spatial relationship of porosity by estimating and modeling anisotropic variograms from empirical variograms.
6. Performed ordinary kriging with sequential Gaussian simulation using the modeled variogram as a weighting function to obtain various realizations of porosity distribution
7. Conducted preliminary reservoir flow simulation on a single realization.
Software
Geostatistics: WinGSLIB v.1.5.6 (Full Version)
Reservoir Flow Simulation: CMG STARS 2014
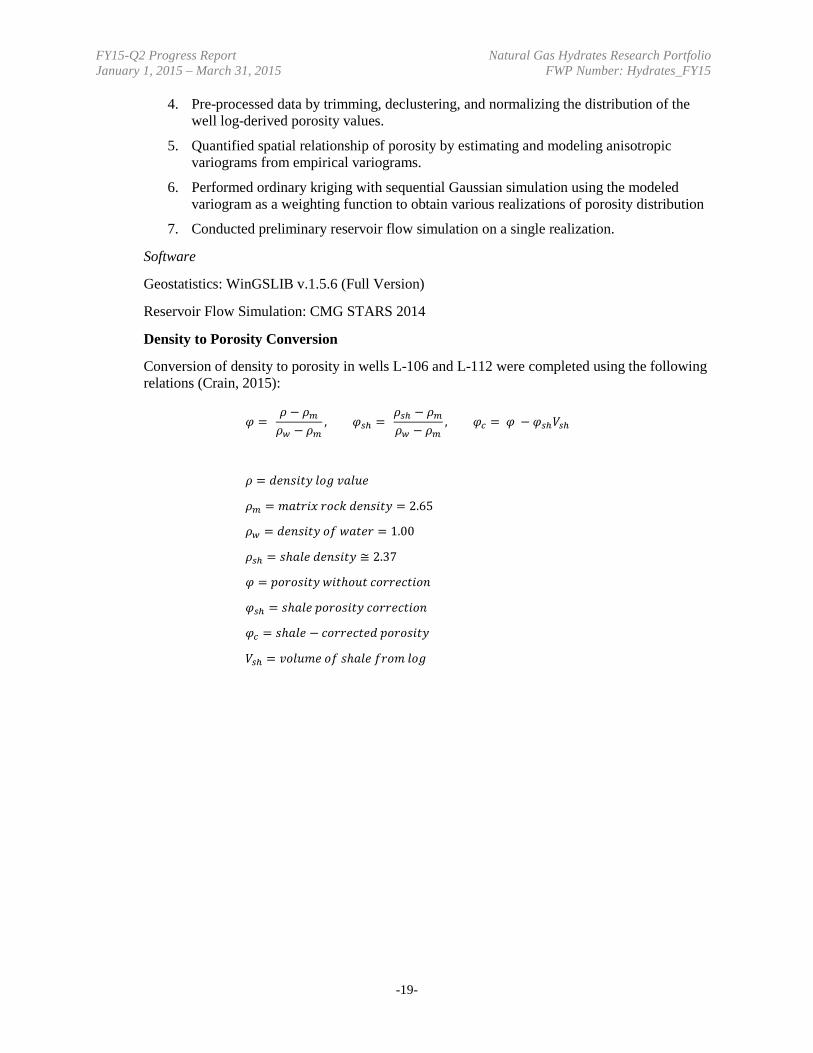
Density to Porosity Conversion
Conversion of density to porosity in wells L-106 and L-112 were completed using the following relations (Crain, 2015):
𝜑 =
𝜌 − 𝜌𝑚𝜌𝑤 − 𝜌𝑚
, 𝜑𝑠ℎ = 𝜌𝑠ℎ − 𝜌𝑚𝜌𝑤 − 𝜌𝑚
, 𝜑𝑐 = 𝜑 − 𝜑𝑠ℎ𝑉𝑉𝑠ℎ
𝜌 = 𝑑𝑑𝑑𝑑𝑑𝑑𝑑𝑑𝑑𝑑𝑑𝑑𝑏𝑏 𝑑𝑑𝑣𝑣𝑙𝑙 𝑣𝑣𝑑𝑑𝑑𝑑𝑁𝑁𝑑𝑑
𝜌𝑚 = 𝑑𝑑𝑑𝑑𝑑𝑑𝑣𝑣𝑑𝑑𝑥𝑥 𝑣𝑣𝑣𝑣𝑑𝑑𝑘 𝑑𝑑𝑑𝑑𝑑𝑑𝑑𝑑𝑑𝑑𝑑𝑑𝑏𝑏 = 2.65
𝜌𝑤 = 𝑑𝑑𝑑𝑑𝑑𝑑𝑑𝑑𝑑𝑑𝑑𝑑𝑏𝑏 𝑣𝑣𝑜𝑜 𝑤𝑤𝑑𝑑𝑑𝑑𝑑𝑑𝑣𝑣 = 1.00
𝜌𝑠ℎ = 𝑑𝑑ℎ𝑑𝑑𝑑𝑑𝑑𝑑 𝑑𝑑𝑑𝑑𝑑𝑑𝑑𝑑𝑑𝑑𝑑𝑑𝑏𝑏 ≅ 2.37
𝜑 = 𝑑𝑑𝑣𝑣𝑣𝑣𝑣𝑣𝑑𝑑𝑑𝑑𝑑𝑑𝑏𝑏 𝑤𝑤𝑑𝑑𝑑𝑑ℎ𝑣𝑣𝑁𝑁𝑑𝑑 𝑑𝑑𝑣𝑣𝑣𝑣𝑣𝑣𝑑𝑑𝑑𝑑𝑑𝑑𝑑𝑑𝑣𝑣𝑑𝑑
𝜑𝑠ℎ = 𝑑𝑑ℎ𝑑𝑑𝑑𝑑𝑑𝑑 𝑑𝑑𝑣𝑣𝑣𝑣𝑣𝑣𝑑𝑑𝑑𝑑𝑑𝑑𝑏𝑏 𝑑𝑑𝑣𝑣𝑣𝑣𝑣𝑣𝑑𝑑𝑑𝑑𝑑𝑑𝑑𝑑𝑣𝑣𝑑𝑑
𝜑𝑐 = 𝑑𝑑ℎ𝑑𝑑𝑑𝑑𝑑𝑑 − 𝑑𝑑𝑣𝑣𝑣𝑣𝑣𝑣𝑑𝑑𝑑𝑑𝑑𝑑𝑑𝑑𝑑𝑑 𝑑𝑑𝑣𝑣𝑣𝑣𝑣𝑣𝑑𝑑𝑑𝑑𝑑𝑑𝑏𝑏
𝑉𝑉𝑠ℎ = 𝑣𝑣𝑣𝑣𝑑𝑑𝑁𝑁𝑑𝑑𝑑𝑑 𝑣𝑣𝑜𝑜 𝑑𝑑ℎ𝑑𝑑𝑑𝑑𝑑𝑑 𝑜𝑜𝑣𝑣𝑣𝑣𝑑𝑑 𝑑𝑑𝑣𝑣𝑙𝑙
-19-
FY15-Q2 Progress Report Natural Gas Hydrates Research Portfolio January 1, 2015 – March 31, 2015 FWP Number: Hydrates_FY15
Porosity-Shale Volume Correlation
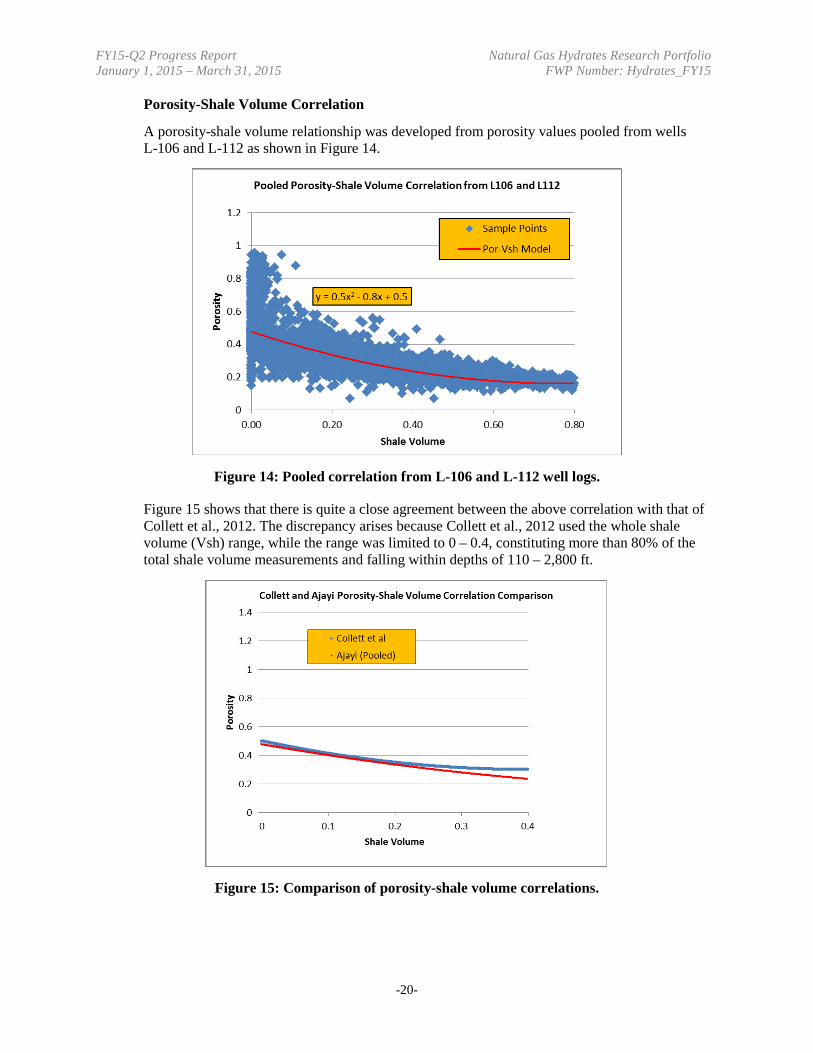
A porosity-shale volume relationship was developed from porosity values pooled from wells L-106 and L-112 as shown in Figure 14.
Figure 14: Pooled correlation from L-106 and L-112 well logs.
Figure 15 shows that there is quite a close agreement between the above correlation with that of Collett et al., 2012. The discrepancy arises because Collett et al., 2012 used the whole shale volume (Vsh) range, while the range was limited to 0 – 0.4, constituting more than 80% of the total shale volume measurements and falling within depths of 110 – 2,800 ft.
Figure 15: Comparison of porosity-shale volume correlations.
-20-
FY15-Q2 Progress Report Natural Gas Hydrates Research Portfolio January 1, 2015 – March 31, 2015 FWP Number: Hydrates_FY15
Estimation of Porosity Values in other Wells
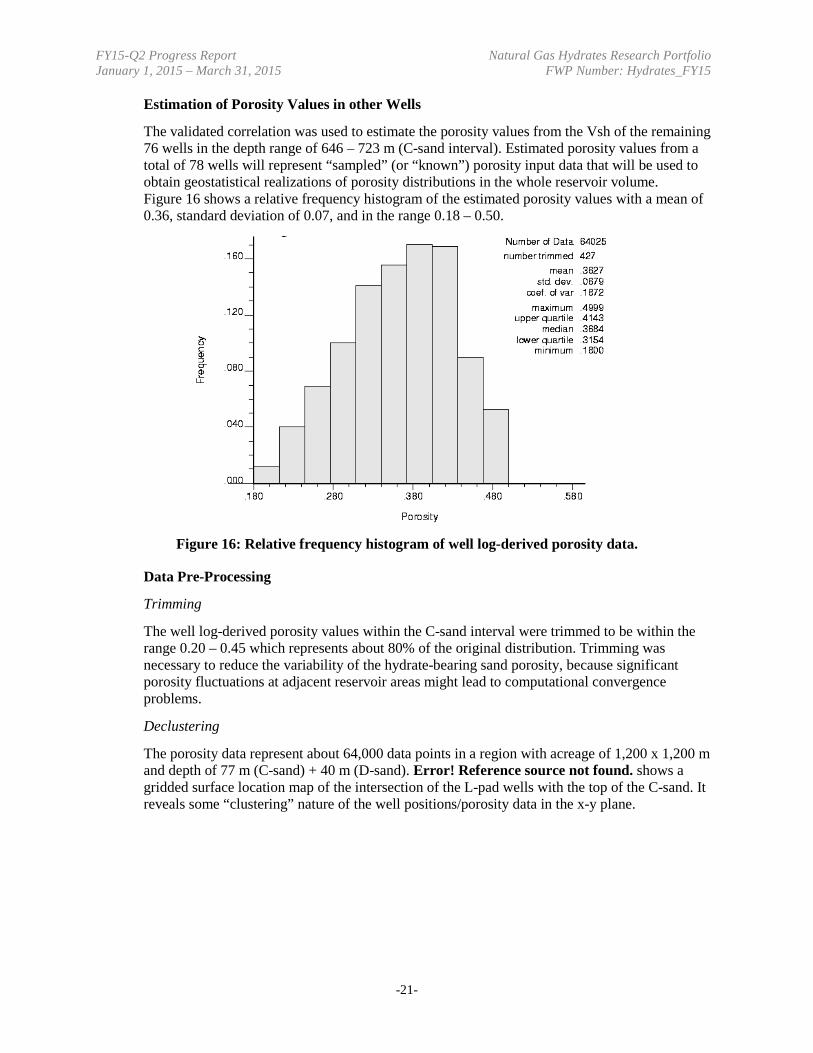
The validated correlation was used to estimate the porosity values from the Vsh of the remaining 76 wells in the depth range of 646 – 723 m (C-sand interval). Estimated porosity values from a total of 78 wells will represent “sampled” (or “known”) porosity input data that will be used to obtain geostatistical realizations of porosity distributions in the whole reservoir volume. Figure 16 shows a relative frequency histogram of the estimated porosity values with a mean of 0.36, standard deviation of 0.07, and in the range 0.18 – 0.50.
Figure 16: Relative frequency histogram of well log-derived porosity data.
Data Pre-Processing
Trimming
The well log-derived porosity values within the C-sand interval were trimmed to be within the range 0.20 – 0.45 which represents about 80% of the original distribution. Trimming was necessary to reduce the variability of the hydrate-bearing sand porosity, because significant porosity fluctuations at adjacent reservoir areas might lead to computational convergence problems.
Declustering
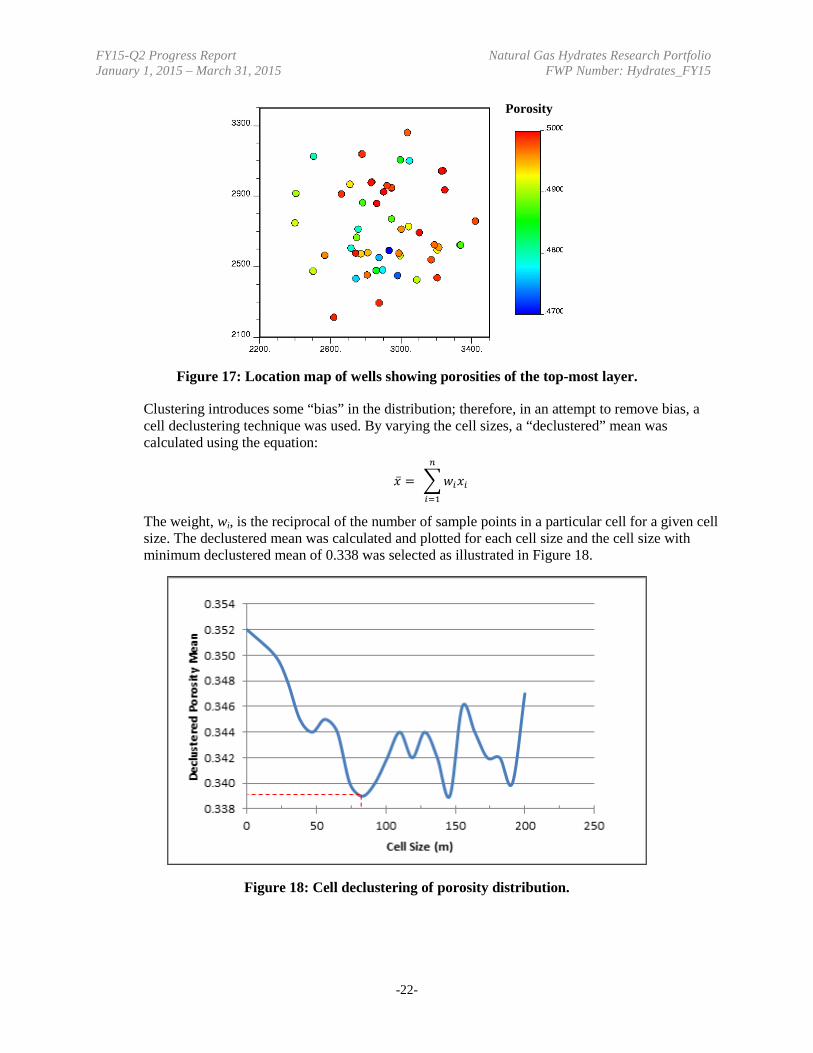
The porosity data represent about 64,000 data points in a region with acreage of 1,200 x 1,200 m and depth of 77 m (C-sand) + 40 m (D-sand). Error! Reference source not found. shows a gridded surface location map of the intersection of the L-pad wells with the top of the C-sand. It reveals some “clustering” nature of the well positions/porosity data in the x-y plane.
-21-
FY15-Q2 Progress Report Natural Gas Hydrates Research Portfolio January 1, 2015 – March 31, 2015 FWP Number: Hydrates_FY15
Figure 17: Location map of wells showing porosities of the top-most layer.
Clustering introduces some “bias” in the distribution; therefore, in an attempt to remove bias, a cell declustering technique was used. By varying the cell sizes, a “declustered” mean was calculated using the equation:
�̅�𝑥 = �𝑤𝑤𝑖𝑖𝑥𝑥𝑖𝑖
𝑛𝑛
𝑖𝑖=1
The weight, wi, is the reciprocal of the number of sample points in a particular cell for a given cell size. The declustered mean was calculated and plotted for each cell size and the cell size with minimum declustered mean of 0.338 was selected as illustrated in Figure 18.
Figure 18: Cell declustering of porosity distribution.
Porosity
-22-
FY15-Q2 Progress Report Natural Gas Hydrates Research Portfolio January 1, 2015 – March 31, 2015 FWP Number: Hydrates_FY15
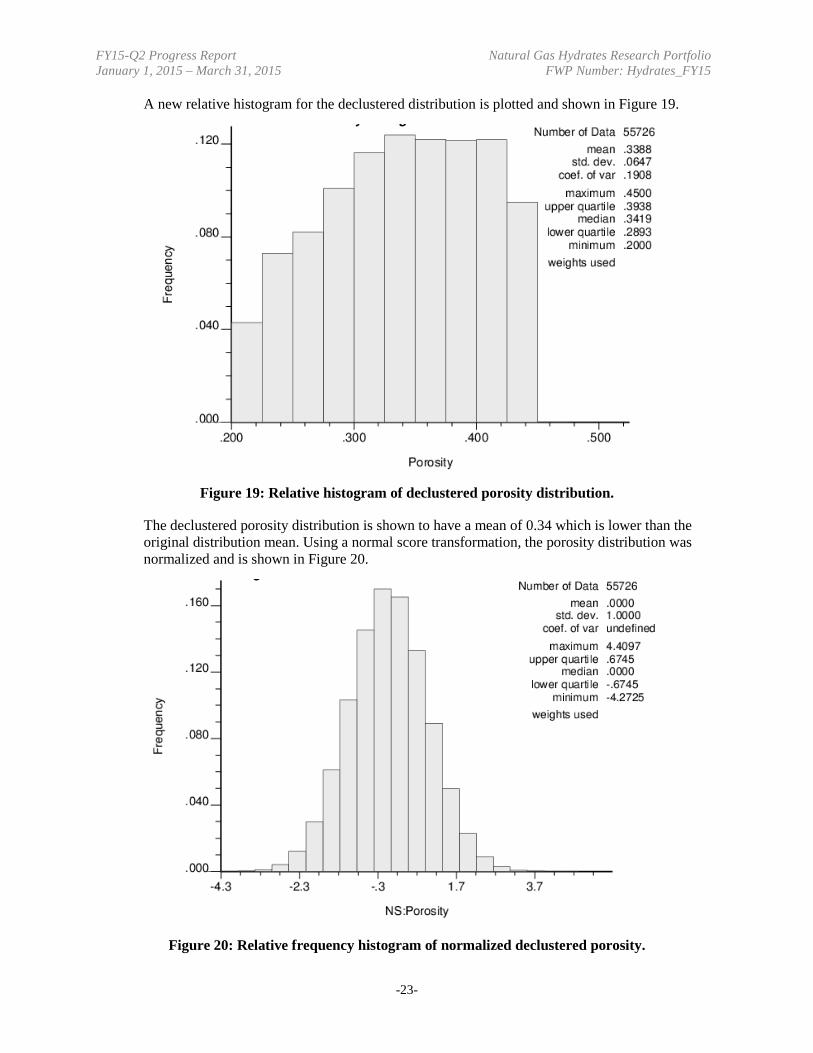
A new relative histogram for the declustered distribution is plotted and shown in Figure 19.
Figure 19: Relative histogram of declustered porosity distribution.
The declustered porosity distribution is shown to have a mean of 0.34 which is lower than the original distribution mean. Using a normal score transformation, the porosity distribution was normalized and is shown in Figure 20.
Figure 20: Relative frequency histogram of normalized declustered porosity.
-23-
FY15-Q2 Progress Report Natural Gas Hydrates Research Portfolio January 1, 2015 – March 31, 2015 FWP Number: Hydrates_FY15
Variogram Estimation and Modelling
Variogram Definition
The variogram is a measure of the variability of a quantity sampled in different locations with respect to spatial coordinates. It is a function of both distance and direction and mathematically defined as:
𝛾𝛾(𝒉𝒉) = 1
2𝑁𝑁(𝒉𝒉)� [𝑧𝑧(𝒙𝒙𝑖𝑖) − 𝑧𝑧(𝒙𝒙𝑖𝑖 + 𝒉𝒉)]2𝑁𝑁(𝒉𝒉)
𝑖𝑖=1
where,
Anisotropic Variograms
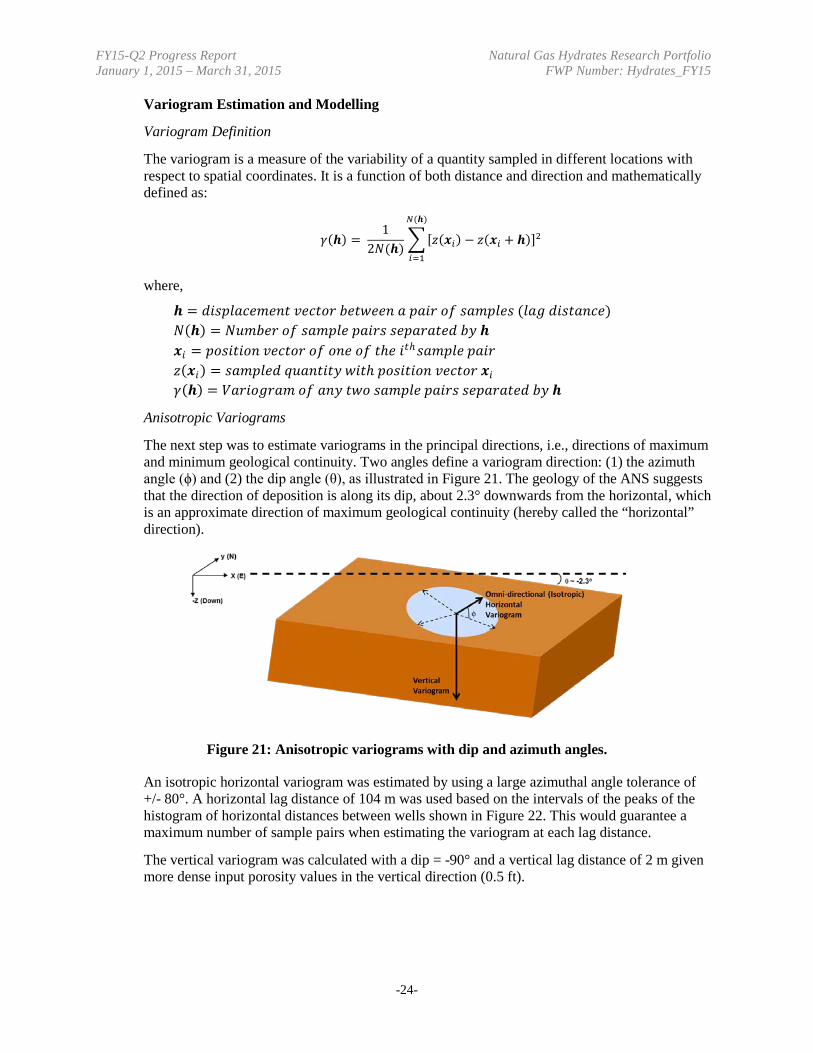
The next step was to estimate variograms in the principal directions, i.e., directions of maximum and minimum geological continuity. Two angles define a variogram direction: (1) the azimuth angle (ϕ) and (2) the dip angle (θ), as illustrated in Figure 21. The geology of the ANS suggests that the direction of deposition is along its dip, about 2.3° downwards from the horizontal, which is an approximate direction of maximum geological continuity (hereby called the “horizontal” direction).
Figure 21: Anisotropic variograms with dip and azimuth angles.
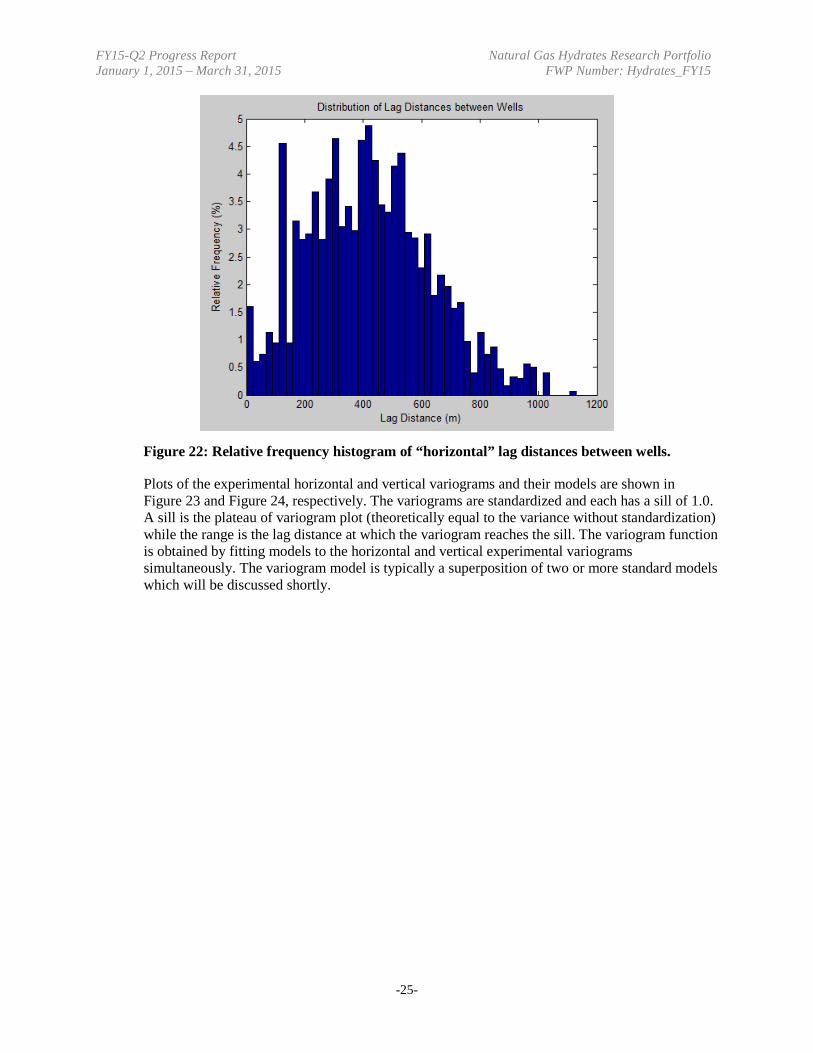
An isotropic horizontal variogram was estimated by using a large azimuthal angle tolerance of +/- 80°. A horizontal lag distance of 104 m was used based on the intervals of the peaks of the histogram of horizontal distances between wells shown in Figure 22. This would guarantee a maximum number of sample pairs when estimating the variogram at each lag distance.
The vertical variogram was calculated with a dip = -90° and a vertical lag distance of 2 m given more dense input porosity values in the vertical direction (0.5 ft).
𝒉𝒉 = 𝑑𝑑𝑑𝑑𝑑𝑑𝑑𝑑𝑑𝑑𝑑𝑑𝑑𝑑𝑑𝑑𝑑𝑑𝑑𝑑𝑑𝑑𝑑𝑑 𝑣𝑣𝑑𝑑𝑑𝑑𝑑𝑑𝑣𝑣𝑣𝑣 𝑏𝑏𝑑𝑑𝑑𝑑𝑤𝑤𝑑𝑑𝑑𝑑𝑑𝑑 𝑑𝑑 𝑑𝑑𝑑𝑑𝑑𝑑𝑣𝑣 𝑣𝑣𝑜𝑜 𝑑𝑑𝑑𝑑𝑑𝑑𝑑𝑑𝑑𝑑𝑑𝑑𝑑𝑑 (𝑑𝑑𝑑𝑑𝑙𝑙 𝑑𝑑𝑑𝑑𝑑𝑑𝑑𝑑𝑑𝑑𝑑𝑑𝑑𝑑𝑑𝑑) 𝑁𝑁(𝒉𝒉) = 𝑁𝑁𝑁𝑁𝑑𝑑𝑏𝑏𝑑𝑑𝑣𝑣 𝑣𝑣𝑜𝑜 𝑑𝑑𝑑𝑑𝑑𝑑𝑑𝑑𝑑𝑑𝑑𝑑 𝑑𝑑𝑑𝑑𝑑𝑑𝑣𝑣𝑑𝑑 𝑑𝑑𝑑𝑑𝑑𝑑𝑑𝑑𝑣𝑣𝑑𝑑𝑑𝑑𝑑𝑑𝑑𝑑 𝑏𝑏𝑏𝑏 𝒉𝒉 𝒙𝒙𝑑𝑑 = 𝑑𝑑𝑣𝑣𝑑𝑑𝑑𝑑𝑑𝑑𝑑𝑑𝑣𝑣𝑑𝑑 𝑣𝑣𝑑𝑑𝑑𝑑𝑑𝑑𝑣𝑣𝑣𝑣 𝑣𝑣𝑜𝑜 𝑣𝑣𝑑𝑑𝑑𝑑 𝑣𝑣𝑜𝑜 𝑑𝑑ℎ𝑑𝑑 𝑑𝑑𝑑𝑑ℎ𝑑𝑑𝑑𝑑𝑑𝑑𝑑𝑑𝑑𝑑𝑑𝑑 𝑑𝑑𝑑𝑑𝑑𝑑𝑣𝑣 𝑧𝑧(𝒙𝒙𝑑𝑑) = 𝑑𝑑𝑑𝑑𝑑𝑑𝑑𝑑𝑑𝑑𝑑𝑑𝑑𝑑 𝑞𝑞𝑁𝑁𝑑𝑑𝑑𝑑𝑑𝑑𝑑𝑑𝑑𝑑𝑏𝑏 𝑤𝑤𝑑𝑑𝑑𝑑ℎ 𝑑𝑑𝑣𝑣𝑑𝑑𝑑𝑑𝑑𝑑𝑑𝑑𝑣𝑣𝑑𝑑 𝑣𝑣𝑑𝑑𝑑𝑑𝑑𝑑𝑣𝑣𝑣𝑣 𝒙𝒙𝑑𝑑 𝛾𝛾(𝒉𝒉) = 𝑉𝑉𝑑𝑑𝑣𝑣𝑑𝑑𝑣𝑣𝑙𝑙𝑣𝑣𝑑𝑑𝑑𝑑 𝑣𝑣𝑜𝑜 𝑑𝑑𝑑𝑑𝑏𝑏 𝑑𝑑𝑤𝑤𝑣𝑣 𝑑𝑑𝑑𝑑𝑑𝑑𝑑𝑑𝑑𝑑𝑑𝑑 𝑑𝑑𝑑𝑑𝑑𝑑𝑣𝑣𝑑𝑑 𝑑𝑑𝑑𝑑𝑑𝑑𝑑𝑑𝑣𝑣𝑑𝑑𝑑𝑑𝑑𝑑𝑑𝑑 𝑏𝑏𝑏𝑏 𝒉𝒉
-24-
FY15-Q2 Progress Report Natural Gas Hydrates Research Portfolio January 1, 2015 – March 31, 2015 FWP Number: Hydrates_FY15
Figure 22: Relative frequency histogram of “horizontal” lag distances between wells.
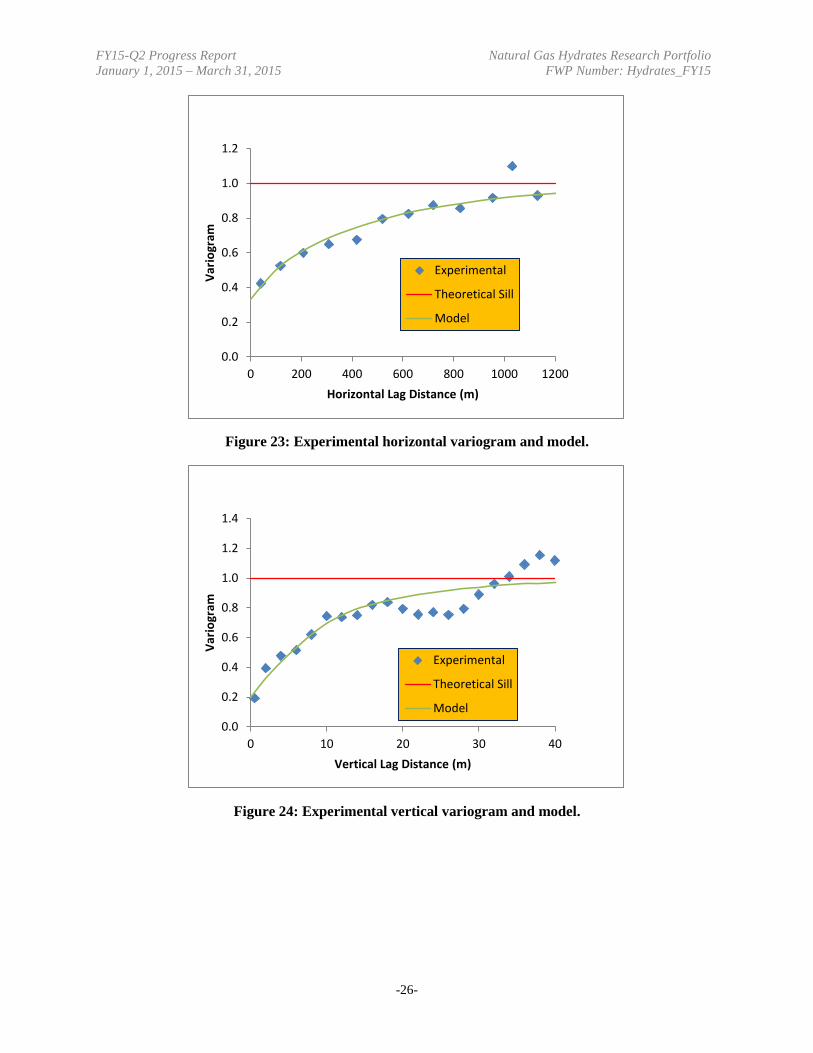
Plots of the experimental horizontal and vertical variograms and their models are shown in Figure 23 and Figure 24, respectively. The variograms are standardized and each has a sill of 1.0. A sill is the plateau of variogram plot (theoretically equal to the variance without standardization) while the range is the lag distance at which the variogram reaches the sill. The variogram function is obtained by fitting models to the horizontal and vertical experimental variograms simultaneously. The variogram model is typically a superposition of two or more standard models which will be discussed shortly.
-25-
FY15-Q2 Progress Report Natural Gas Hydrates Research Portfolio January 1, 2015 – March 31, 2015 FWP Number: Hydrates_FY15
Figure 23: Experimental horizontal variogram and model.
Figure 24: Experimental vertical variogram and model.
0.0
0.2
0.4
0.6
0.8
1.0
1.2
0 200 400 600 800 1000 1200
Vario
gram
Horizontal Lag Distance (m)
Experimental
Theoretical Sill
Model
0.0
0.2
0.4
0.6
0.8
1.0
1.2
1.4
0 10 20 30 40
Vario
gram
Vertical Lag Distance (m)
Experimental
Theoretical Sill
Model
-26-
FY15-Q2 Progress Report Natural Gas Hydrates Research Portfolio January 1, 2015 – March 31, 2015 FWP Number: Hydrates_FY15
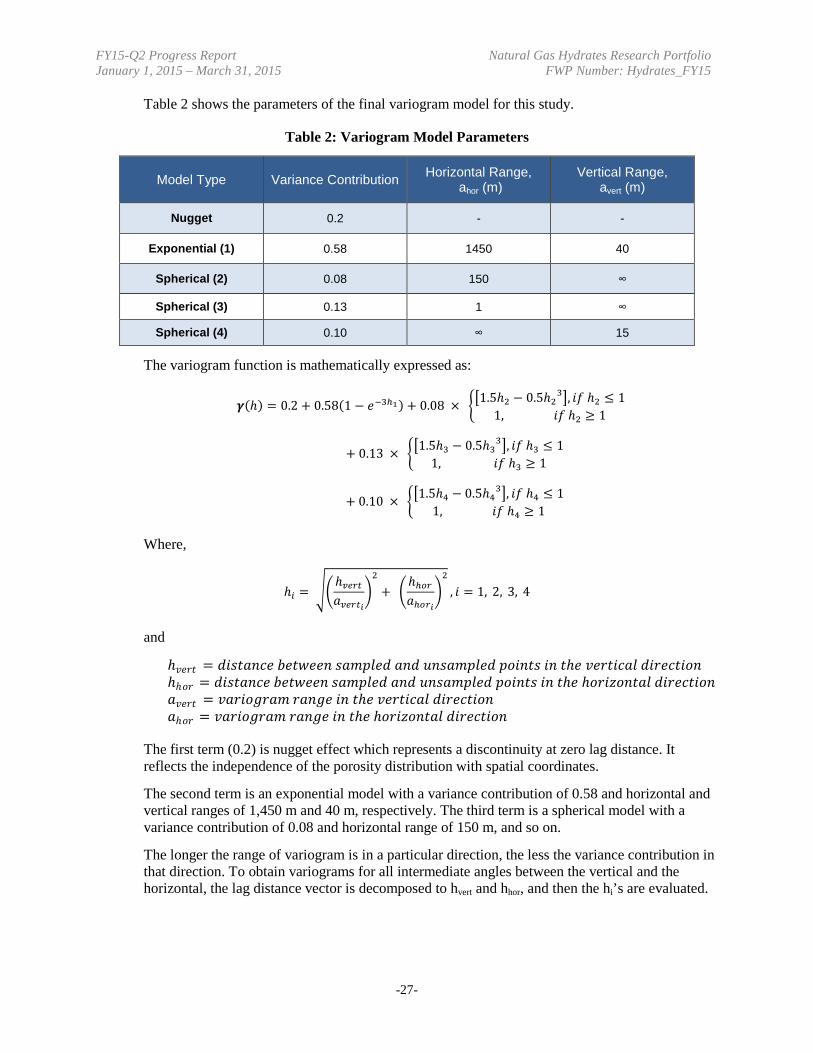
Table 2 shows the parameters of the final variogram model for this study.
Table 2: Variogram Model Parameters
Model Type Variance Contribution Horizontal Range, ahor (m)
Vertical Range, avert (m)
Nugget 0.2 - -
Exponential (1) 0.58 1450 40
Spherical (2) 0.08 150 ∞
Spherical (3) 0.13 1 ∞
Spherical (4) 0.10 ∞ 15
The variogram function is mathematically expressed as:
𝜸𝜸(ℎ) = 0.2 + 0.58(1 − 𝑑𝑑−3ℎ1) + 0.08 × ��1.5ℎ2 − 0.5ℎ23�, 𝑑𝑑𝑜𝑜 ℎ2 ≤ 1
1, 𝑑𝑑𝑜𝑜 ℎ2 ≥ 1
+ 0.13 × ��1.5ℎ3 − 0.5ℎ33�, 𝑑𝑑𝑜𝑜 ℎ3 ≤ 1
1, 𝑑𝑑𝑜𝑜 ℎ3 ≥ 1
+ 0.10 × ��1.5ℎ4 − 0.5ℎ43�, 𝑑𝑑𝑜𝑜 ℎ4 ≤ 1
1, 𝑑𝑑𝑜𝑜 ℎ4 ≥ 1
Where,
ℎ𝑖𝑖 = ��ℎ𝑣𝑣𝑣𝑣𝑣𝑣𝑣𝑣𝑑𝑑𝑣𝑣𝑣𝑣𝑣𝑣𝑣𝑣𝑖𝑖
�2
+ �ℎℎ𝑜𝑜𝑣𝑣𝑑𝑑ℎ𝑜𝑜𝑣𝑣𝑖𝑖
�2
, 𝑑𝑑 = 1, 2, 3, 4
and
The first term (0.2) is nugget effect which represents a discontinuity at zero lag distance. It reflects the independence of the porosity distribution with spatial coordinates.
The second term is an exponential model with a variance contribution of 0.58 and horizontal and vertical ranges of 1,450 m and 40 m, respectively. The third term is a spherical model with a variance contribution of 0.08 and horizontal range of 150 m, and so on.
The longer the range of variogram is in a particular direction, the less the variance contribution in that direction. To obtain variograms for all intermediate angles between the vertical and the horizontal, the lag distance vector is decomposed to hvert and hhor, and then the hi’s are evaluated.
ℎ𝑣𝑣𝑑𝑑𝑣𝑣𝑑𝑑 = 𝑑𝑑𝑑𝑑𝑑𝑑𝑑𝑑𝑑𝑑𝑑𝑑𝑑𝑑𝑑𝑑 𝑏𝑏𝑑𝑑𝑑𝑑𝑤𝑤𝑑𝑑𝑑𝑑𝑑𝑑 𝑑𝑑𝑑𝑑𝑑𝑑𝑑𝑑𝑑𝑑𝑑𝑑𝑑𝑑 𝑑𝑑𝑑𝑑𝑑𝑑 𝑁𝑁𝑑𝑑𝑑𝑑𝑑𝑑𝑑𝑑𝑑𝑑𝑑𝑑𝑑𝑑𝑑𝑑 𝑑𝑑𝑣𝑣𝑑𝑑𝑑𝑑𝑑𝑑𝑑𝑑 𝑑𝑑𝑑𝑑 𝑑𝑑ℎ𝑑𝑑 𝑣𝑣𝑑𝑑𝑣𝑣𝑑𝑑𝑑𝑑𝑑𝑑𝑑𝑑𝑑𝑑 𝑑𝑑𝑑𝑑𝑣𝑣𝑑𝑑𝑑𝑑𝑑𝑑𝑑𝑑𝑣𝑣𝑑𝑑 ℎℎ𝑣𝑣𝑣𝑣 = 𝑑𝑑𝑑𝑑𝑑𝑑𝑑𝑑𝑑𝑑𝑑𝑑𝑑𝑑𝑑𝑑 𝑏𝑏𝑑𝑑𝑑𝑑𝑤𝑤𝑑𝑑𝑑𝑑𝑑𝑑 𝑑𝑑𝑑𝑑𝑑𝑑𝑑𝑑𝑑𝑑𝑑𝑑𝑑𝑑 𝑑𝑑𝑑𝑑𝑑𝑑 𝑁𝑁𝑑𝑑𝑑𝑑𝑑𝑑𝑑𝑑𝑑𝑑𝑑𝑑𝑑𝑑𝑑𝑑 𝑑𝑑𝑣𝑣𝑑𝑑𝑑𝑑𝑑𝑑𝑑𝑑 𝑑𝑑𝑑𝑑 𝑑𝑑ℎ𝑑𝑑 ℎ𝑣𝑣𝑣𝑣𝑑𝑑𝑧𝑧𝑣𝑣𝑑𝑑𝑑𝑑𝑑𝑑𝑑𝑑 𝑑𝑑𝑑𝑑𝑣𝑣𝑑𝑑𝑑𝑑𝑑𝑑𝑑𝑑𝑣𝑣𝑑𝑑 𝑑𝑑𝑣𝑣𝑑𝑑𝑣𝑣𝑑𝑑 = 𝑣𝑣𝑑𝑑𝑣𝑣𝑑𝑑𝑣𝑣𝑙𝑙𝑣𝑣𝑑𝑑𝑑𝑑 𝑣𝑣𝑑𝑑𝑑𝑑𝑙𝑙𝑑𝑑 𝑑𝑑𝑑𝑑 𝑑𝑑ℎ𝑑𝑑 𝑣𝑣𝑑𝑑𝑣𝑣𝑑𝑑𝑑𝑑𝑑𝑑𝑑𝑑𝑑𝑑 𝑑𝑑𝑑𝑑𝑣𝑣𝑑𝑑𝑑𝑑𝑑𝑑𝑑𝑑𝑣𝑣𝑑𝑑 𝑑𝑑ℎ𝑣𝑣𝑣𝑣 = 𝑣𝑣𝑑𝑑𝑣𝑣𝑑𝑑𝑣𝑣𝑙𝑙𝑣𝑣𝑑𝑑𝑑𝑑 𝑣𝑣𝑑𝑑𝑑𝑑𝑙𝑙𝑑𝑑 𝑑𝑑𝑑𝑑 𝑑𝑑ℎ𝑑𝑑 ℎ𝑣𝑣𝑣𝑣𝑑𝑑𝑧𝑧𝑣𝑣𝑑𝑑𝑑𝑑𝑑𝑑𝑑𝑑 𝑑𝑑𝑑𝑑𝑣𝑣𝑑𝑑𝑑𝑑𝑑𝑑𝑑𝑑𝑣𝑣𝑑𝑑
-27-

FY15-Q2 Progress Report Natural Gas Hydrates Research Portfolio January 1, 2015 – March 31, 2015 FWP Number: Hydrates_FY15
Stochastic Simulation
Using the variogram as weighting functions, Ordinary Kriging along with Sequential Gaussian Simulation was performed on a rectangular reservoir grid of 50 x 50 x 200 cells with the size of 25 x 25 x 0.4 m each in the x, y, and z directions, respectively. Sequential Gaussian Simulation ensures that the location of the sample data honor their original values (unlike the case if only Ordinary Kriging was used).
A search ellipsoid with radius of 300 m and depth of 2 m was used. The search was restricted to a maximum of eight nearest points. The output, which is the normal score porosity, was transformed back to actual porosity values populating the simulation inclined grid by means of a code generated in MATLAB .
Results
Horizontal cross sections of porosity distribution for selected layers are shown in Figure 25. These were obtained for a single realization.
-28-

FY15-Q2 Progress Report Natural Gas Hydrates Research Portfolio January 1, 2015 – March 31, 2015 FWP Number: Hydrates_FY15
Figure 25: Horizontal cross sections of porosity distribution.
Layer 70
Layer 20 Layer 30
Layer 50Layer 40 Layer 60
Layer 11
Layer 80
Layer 90 Layer 100
-29-
FY15-Q2 Progress Report Natural Gas Hydrates Research Portfolio January 1, 2015 – March 31, 2015 FWP Number: Hydrates_FY15
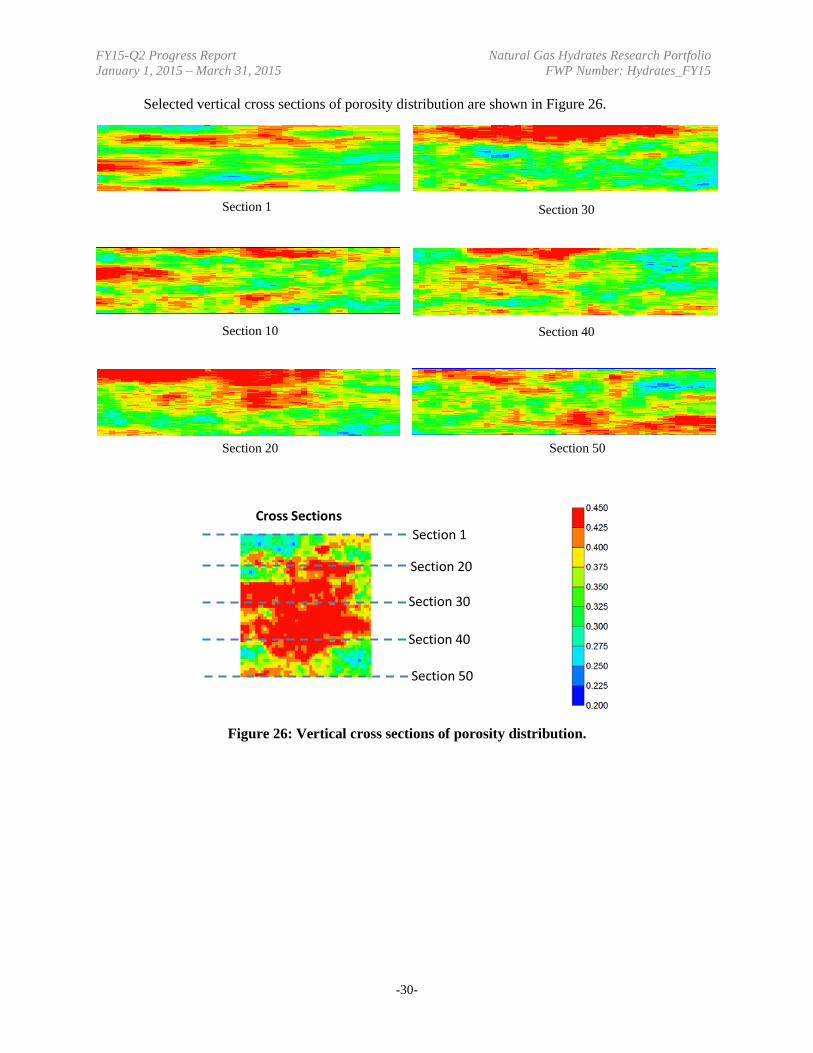
Selected vertical cross sections of porosity distribution are shown in Figure 26.
Figure 26: Vertical cross sections of porosity distribution.
Section 1
Section 10
Section 20
Section 30
Section 40
Section 50
Cross Sections Section 1
Section 30
Section 40
Section 50
Section 20
-30-
FY15-Q2 Progress Report Natural Gas Hydrates Research Portfolio January 1, 2015 – March 31, 2015 FWP Number: Hydrates_FY15
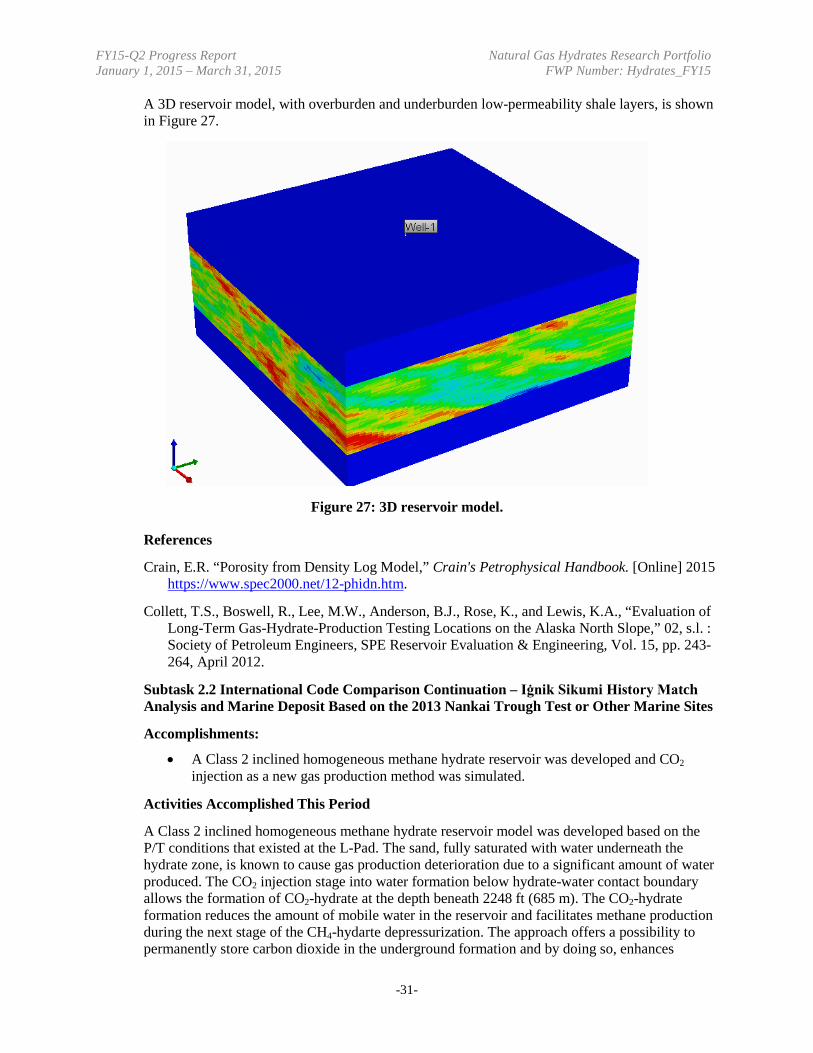
A 3D reservoir model, with overburden and underburden low-permeability shale layers, is shown in Figure 27.
Figure 27: 3D reservoir model.
References
Crain, E.R. “Porosity from Density Log Model,” Crain's Petrophysical Handbook. [Online] 2015 https://www.spec2000.net/12-phidn.htm.
Collett, T.S., Boswell, R., Lee, M.W., Anderson, B.J., Rose, K., and Lewis, K.A., “Evaluation of Long-Term Gas-Hydrate-Production Testing Locations on the Alaska North Slope,” 02, s.l. : Society of Petroleum Engineers, SPE Reservoir Evaluation & Engineering, Vol. 15, pp. 243-264, April 2012.
Subtask 2.2 International Code Comparison Continuation – Iġnik Sikumi History Match Analysis and Marine Deposit Based on the 2013 Nankai Trough Test or Other Marine Sites
Accomplishments:
• A Class 2 inclined homogeneous methane hydrate reservoir was developed and CO2 injection as a new gas production method was simulated.
Activities Accomplished This Period
A Class 2 inclined homogeneous methane hydrate reservoir model was developed based on the P/T conditions that existed at the L-Pad. The sand, fully saturated with water underneath the hydrate zone, is known to cause gas production deterioration due to a significant amount of water produced. The CO2 injection stage into water formation below hydrate-water contact boundary allows the formation of CO2-hydrate at the depth beneath 2248 ft (685 m). The CO2-hydrate formation reduces the amount of mobile water in the reservoir and facilitates methane production during the next stage of the CH4-hydarte depressurization. The approach offers a possibility to permanently store carbon dioxide in the underground formation and by doing so, enhances
-31-
FY15-Q2 Progress Report Natural Gas Hydrates Research Portfolio January 1, 2015 – March 31, 2015 FWP Number: Hydrates_FY15
methane production from the gas hydrate lying above. Different cases are considered which are intended to provide increased hydrate formation during the injection stage, thus enhancing the impermeability of the lower part of the domain.
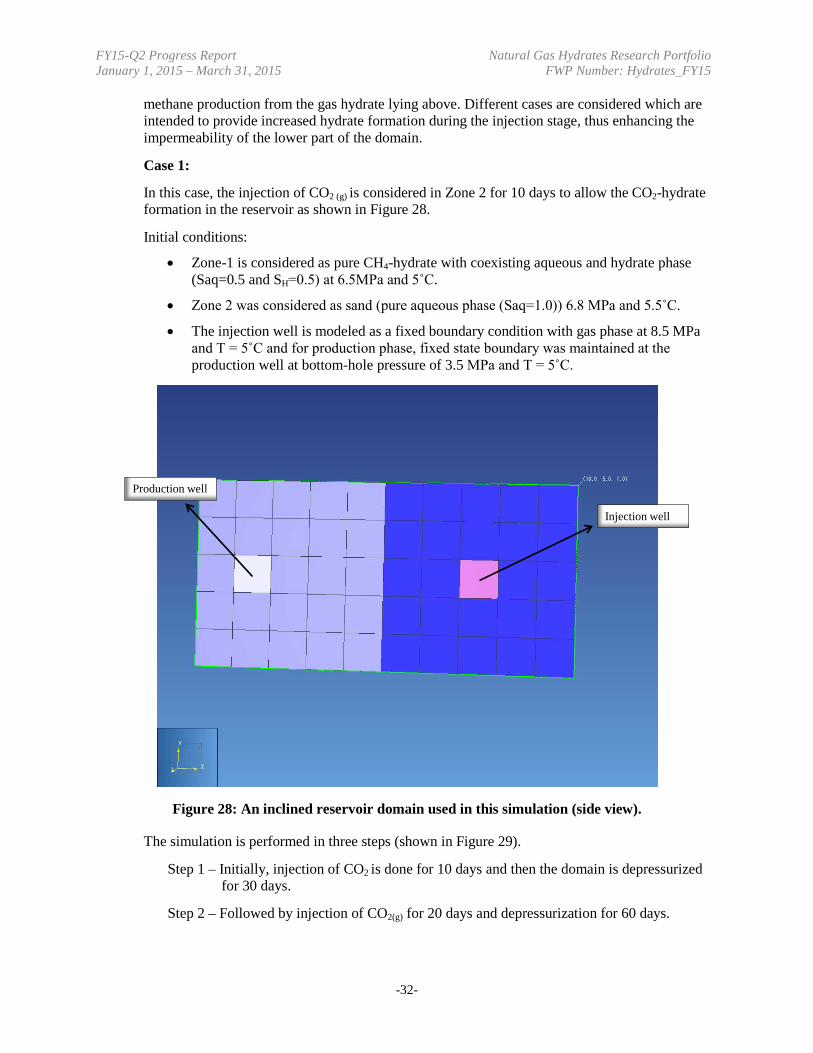
Case 1:
In this case, the injection of CO2 (g) is considered in Zone 2 for 10 days to allow the CO2-hydrate formation in the reservoir as shown in Figure 28.
Initial conditions:
• Zone-1 is considered as pure CH4-hydrate with coexisting aqueous and hydrate phase (Saq=0.5 and SH=0.5) at 6.5MPa and 5˚C.
• Zone 2 was considered as sand (pure aqueous phase (Saq=1.0)) 6.8 MPa and 5.5˚C.
• The injection well is modeled as a fixed boundary condition with gas phase at 8.5 MPa and T = 5˚C and for production phase, fixed state boundary was maintained at the production well at bottom-hole pressure of 3.5 MPa and T = 5˚C.
Figure 28: An inclined reservoir domain used in this simulation (side view).
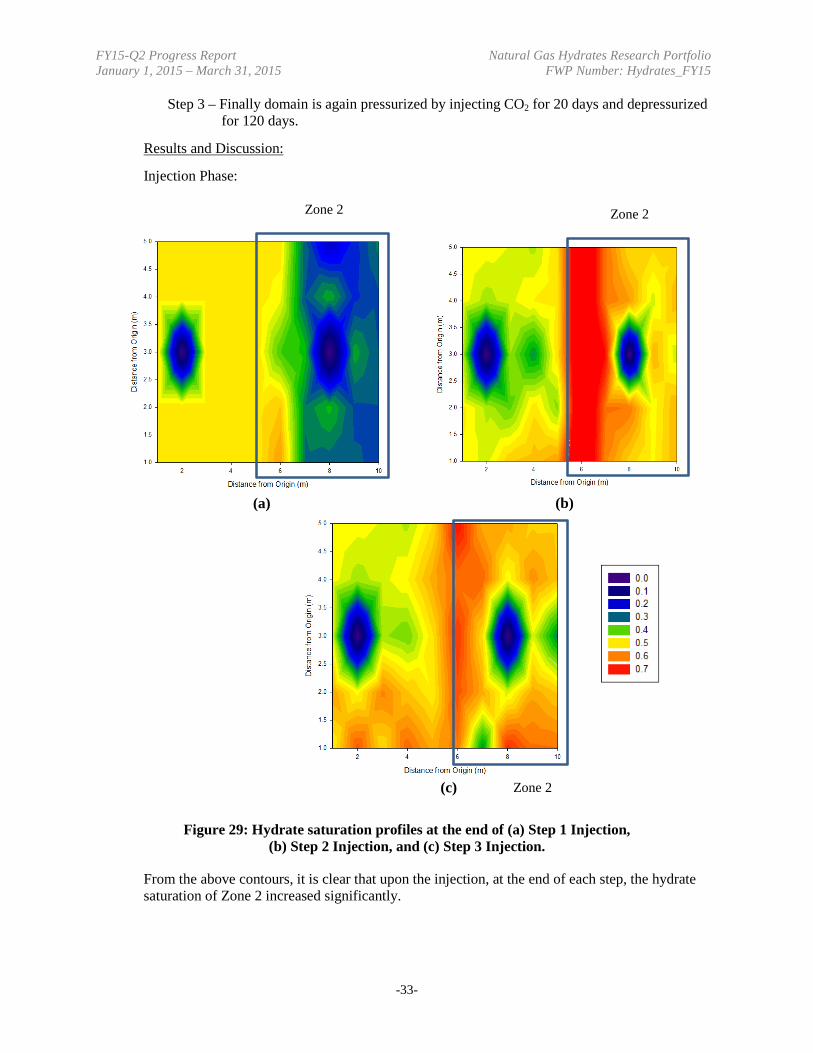
The simulation is performed in three steps (shown in Figure 29).
Step 1 – Initially, injection of CO2 is done for 10 days and then the domain is depressurized for 30 days.
Step 2 – Followed by injection of CO2(g) for 20 days and depressurization for 60 days.
Injection well
Production well
-32-
FY15-Q2 Progress Report Natural Gas Hydrates Research Portfolio January 1, 2015 – March 31, 2015 FWP Number: Hydrates_FY15
Step 3 – Finally domain is again pressurized by injecting CO2 for 20 days and depressurized for 120 days.
Results and Discussion:
Injection Phase:
Figure 29: Hydrate saturation profiles at the end of (a) Step 1 Injection, (b) Step 2 Injection, and (c) Step 3 Injection.
From the above contours, it is clear that upon the injection, at the end of each step, the hydrate saturation of Zone 2 increased significantly.
Zone 2
Zone 2Zone 2
(a)
(c)
(b)
-33-
FY15-Q2 Progress Report Natural Gas Hydrates Research Portfolio January 1, 2015 – March 31, 2015 FWP Number: Hydrates_FY15
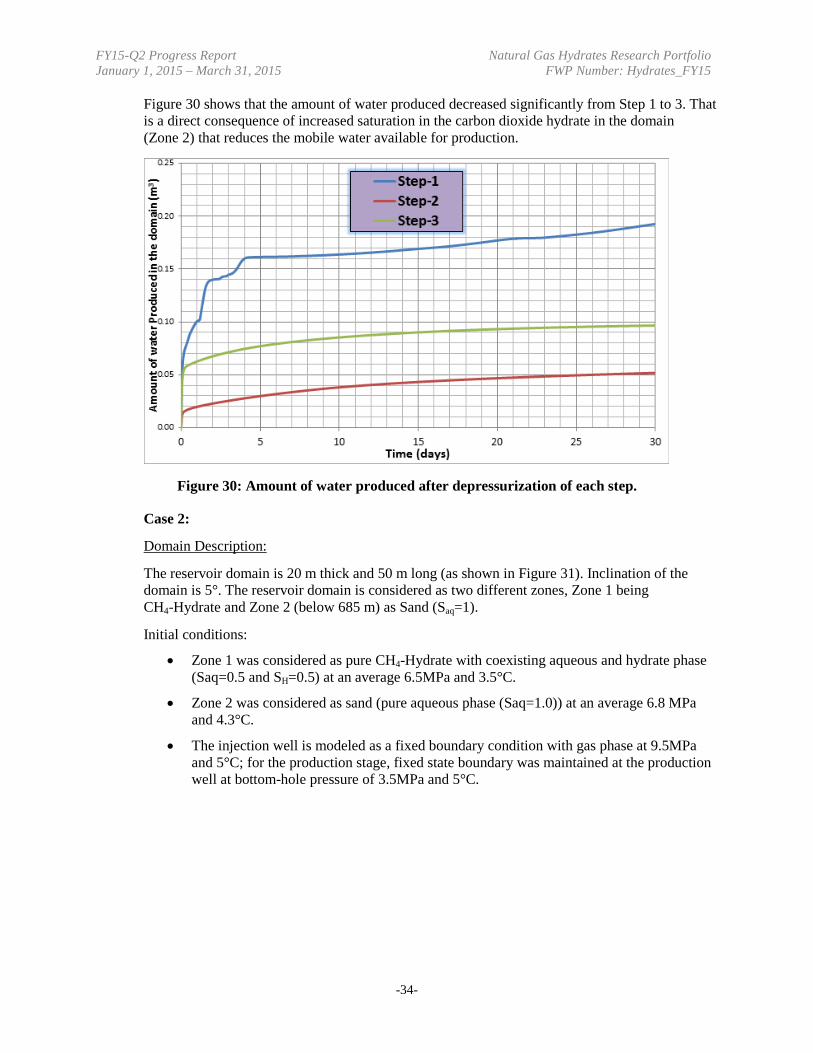
Figure 30 shows that the amount of water produced decreased significantly from Step 1 to 3. That is a direct consequence of increased saturation in the carbon dioxide hydrate in the domain (Zone 2) that reduces the mobile water available for production.
Figure 30: Amount of water produced after depressurization of each step.
Case 2:
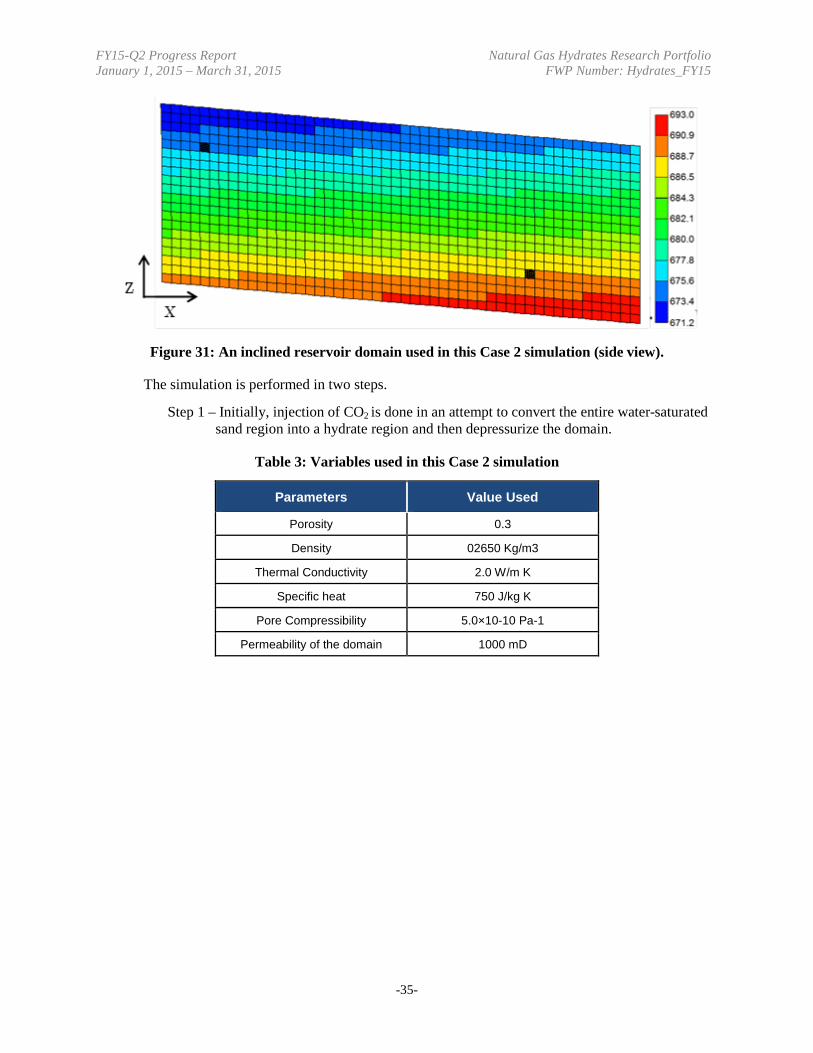
Domain Description:
The reservoir domain is 20 m thick and 50 m long (as shown in Figure 31). Inclination of the domain is 5°. The reservoir domain is considered as two different zones, Zone 1 being CH4-Hydrate and Zone 2 (below 685 m) as Sand (Saq=1).
Initial conditions:
• Zone 1 was considered as pure CH4-Hydrate with coexisting aqueous and hydrate phase (Saq=0.5 and SH=0.5) at an average 6.5MPa and 3.5°C.
• Zone 2 was considered as sand (pure aqueous phase (Saq=1.0)) at an average 6.8 MPa and 4.3°C.
• The injection well is modeled as a fixed boundary condition with gas phase at 9.5MPa and 5°C; for the production stage, fixed state boundary was maintained at the production well at bottom-hole pressure of 3.5MPa and 5°C.
-34-
FY15-Q2 Progress Report Natural Gas Hydrates Research Portfolio January 1, 2015 – March 31, 2015 FWP Number: Hydrates_FY15
Figure 31: An inclined reservoir domain used in this Case 2 simulation (side view).
The simulation is performed in two steps.
Step 1 – Initially, injection of CO2 is done in an attempt to convert the entire water-saturated sand region into a hydrate region and then depressurize the domain.
Table 3: Variables used in this Case 2 simulation
Parameters Value Used
Porosity 0.3
Density 02650 Kg/m3
Thermal Conductivity 2.0 W/m K
Specific heat 750 J/kg K
Pore Compressibility 5.0×10⁻¹⁰ Pa-1
Permeability of the domain 1000 mD
-35-
FY15-Q2 Progress Report Natural Gas Hydrates Research Portfolio January 1, 2015 – March 31, 2015 FWP Number: Hydrates_FY15
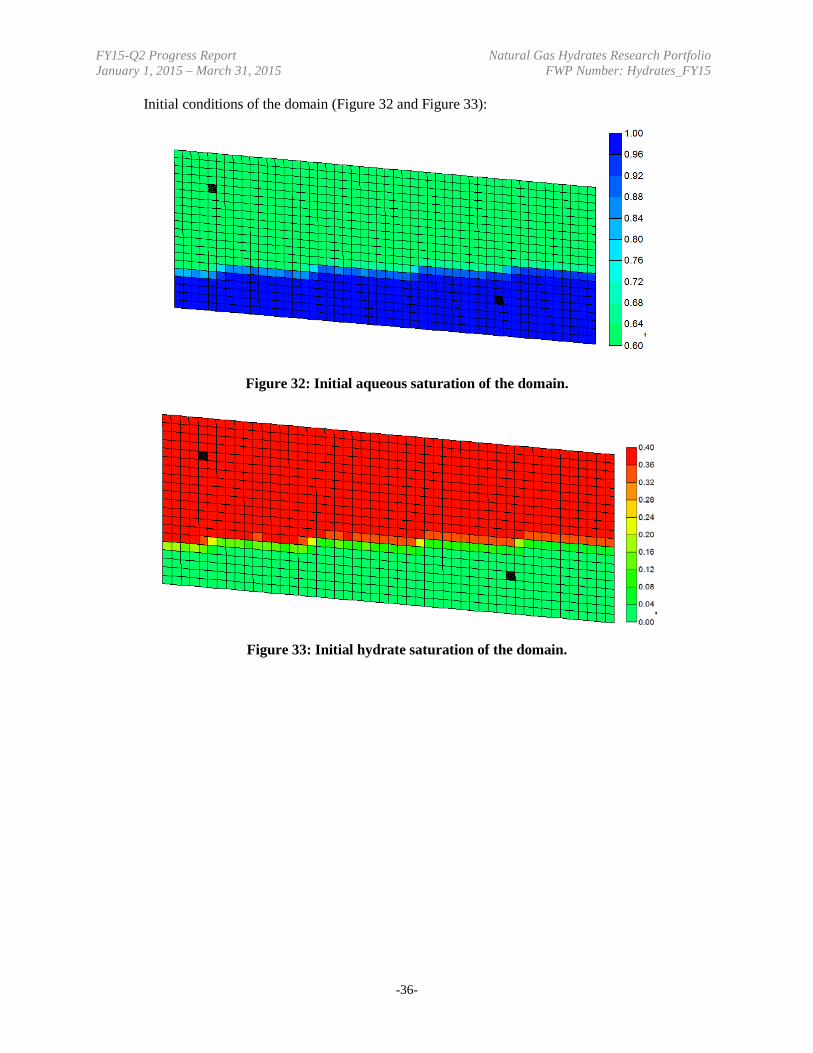
Initial conditions of the domain (Figure 32 and Figure 33):
Figure 32: Initial aqueous saturation of the domain.
Figure 33: Initial hydrate saturation of the domain.
-36-
FY15-Q2 Progress Report Natural Gas Hydrates Research Portfolio January 1, 2015 – March 31, 2015 FWP Number: Hydrates_FY15
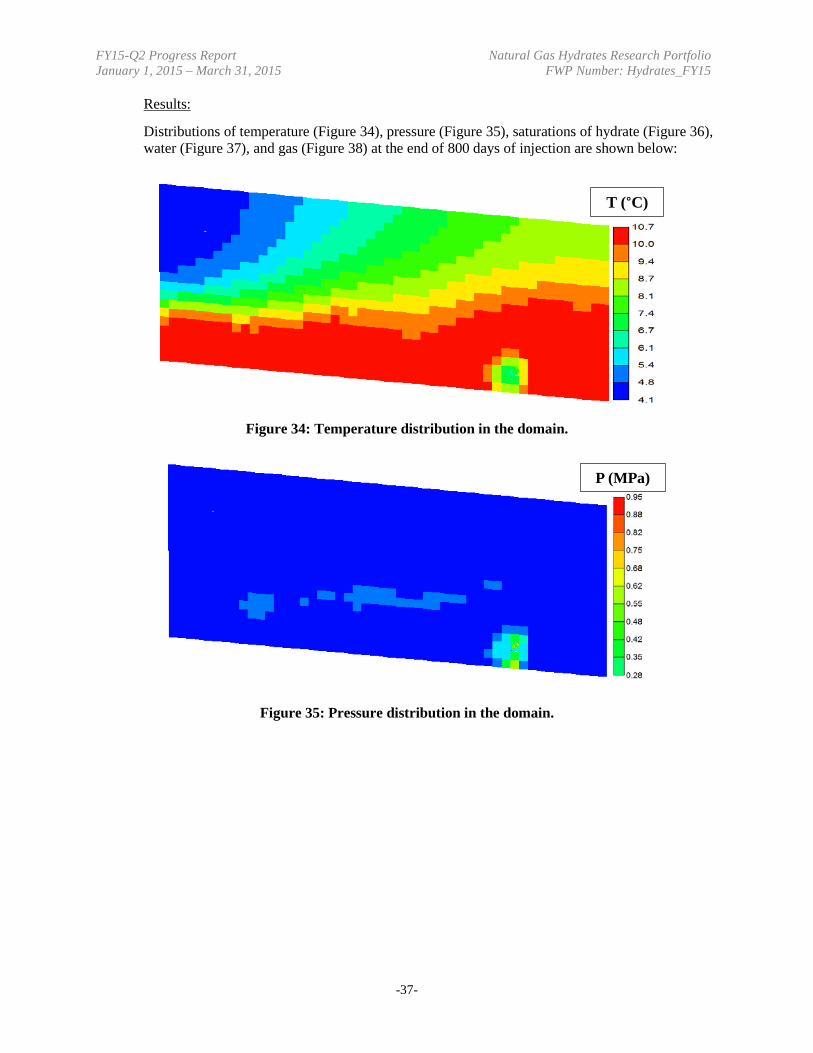
Results:
Distributions of temperature (Figure 34), pressure (Figure 35), saturations of hydrate (Figure 36), water (Figure 37), and gas (Figure 38) at the end of 800 days of injection are shown below:
Figure 34: Temperature distribution in the domain.
Figure 35: Pressure distribution in the domain.
T (°C)
P (MPa)
-37-
FY15-Q2 Progress Report Natural Gas Hydrates Research Portfolio January 1, 2015 – March 31, 2015 FWP Number: Hydrates_FY15
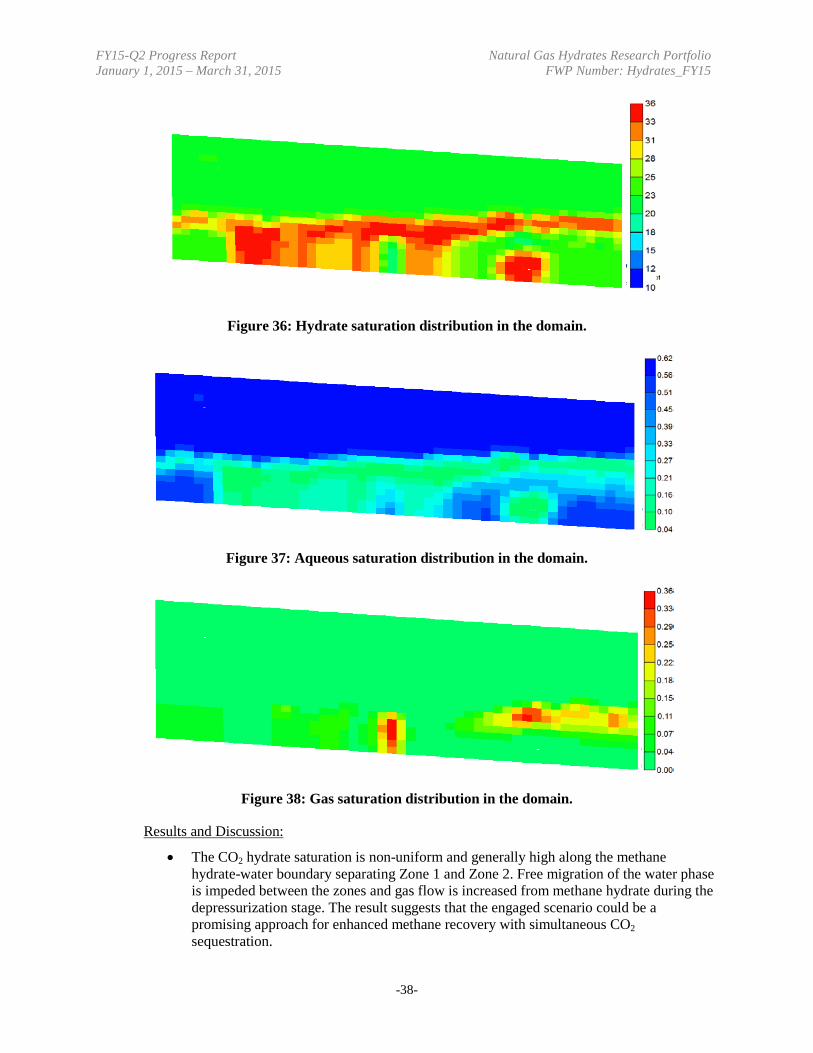
Figure 36: Hydrate saturation distribution in the domain.
Figure 37: Aqueous saturation distribution in the domain.
Figure 38: Gas saturation distribution in the domain.
Results and Discussion:
• The CO2 hydrate saturation is non-uniform and generally high along the methane hydrate-water boundary separating Zone 1 and Zone 2. Free migration of the water phase is impeded between the zones and gas flow is increased from methane hydrate during the depressurization stage. The result suggests that the engaged scenario could be a promising approach for enhanced methane recovery with simultaneous CO2 sequestration.
-38-
FY15-Q2 Progress Report Natural Gas Hydrates Research Portfolio January 1, 2015 – March 31, 2015 FWP Number: Hydrates_FY15
• The temperature of Zone 2 has increased significantly due to the formation of CO2 hydrate combined with the pressure increase during CO2 injection.
• The temperature and pressure conditions in all grid blocks were kept within the stability regions on the phase diagrams for CH4 and CO2 hydrates.
Task 3.0 Laboratory Hydrologic and Geomechanical Characterization and Analysis of Hydrate-Bearing Sediments
Subtask 3.1 Laboratory Measurement of Relative Permeability of CH4 Gas in Brine-Saturated Hydrate-Bearing Sediments
• A literature review was conducted. Experimental studies on “gas-water” relative permeability measurements in hydrate-bearing sediments were found. The studies referred to the difficulties of inhibiting hydrate phase change (hydrate formation/dissociation) during gas flooding. They injected either cold CH4 or N2 gas through water-saturated hydrate bearing samples within the CH4 hydrate stability region but outside the N2 hydrate stability region, to prevent hydrate dissociation or additional hydrate formation, respectively. However, they did not mention the possibility of additional CH4 hydrate formation during the CH4 injection within the CH4 hydrate stability region, and that of CH4 hydrate dissociation from the loss of CH4 partial pressure during the N2 injection.
• Procurement of test equipment and parts is in progress. Particularly, the ordering of the acoustic two-phase sonic fluid separator and back pressure regulators is complete. A design of new end plugs was proposed with larger fluid entrance, to prevent the fluid path from clogging by possible hydrate formation during the test.
• The retrofit of the environmental chamber continued. The installation of new gas lines and safety devises is complete. New electric lines and a temperature controller are being installed.
• A preliminary experimental procedure was developed. Main steps include:
1. Water-saturated sand sample preparation (2-3 samples; F110 silica sand with D50 = 120 µm).
2. Base drainage relative permeability measurement by injecting CH4 gas into water-saturated sand sample (Sh = 0%).
3. Initial cementing hydrate formation at targeted Sh of about 20-50%.
4. Non-cementing hydrate formation by brine injection slightly outside the brine (Lb)-H-V phase stability region and warming/cooling cycle.
5. Drainage relative permeability measurement of brine-saturated hydrate-bearing sand sample (Sh = ~20-50%) by injecting CH4 gas slightly outside the brine (Lb)-H-V phase stability region.
Subtask 3.2 Tri-Axial Compression Tests on Hydrate-Bearing Sediments with Induced Hydrate Dissociation under Shear Stress
• The modification of the test setup (including environmental chamber and mobile cart) was in progress.
• The small-strain mechanical property (acoustic property) of hydrate-bearing sediment during hydrate dissociation by depressurization was studied. The experimental data
-39-
FY15-Q2 Progress Report Natural Gas Hydrates Research Portfolio January 1, 2015 – March 31, 2015 FWP Number: Hydrates_FY15
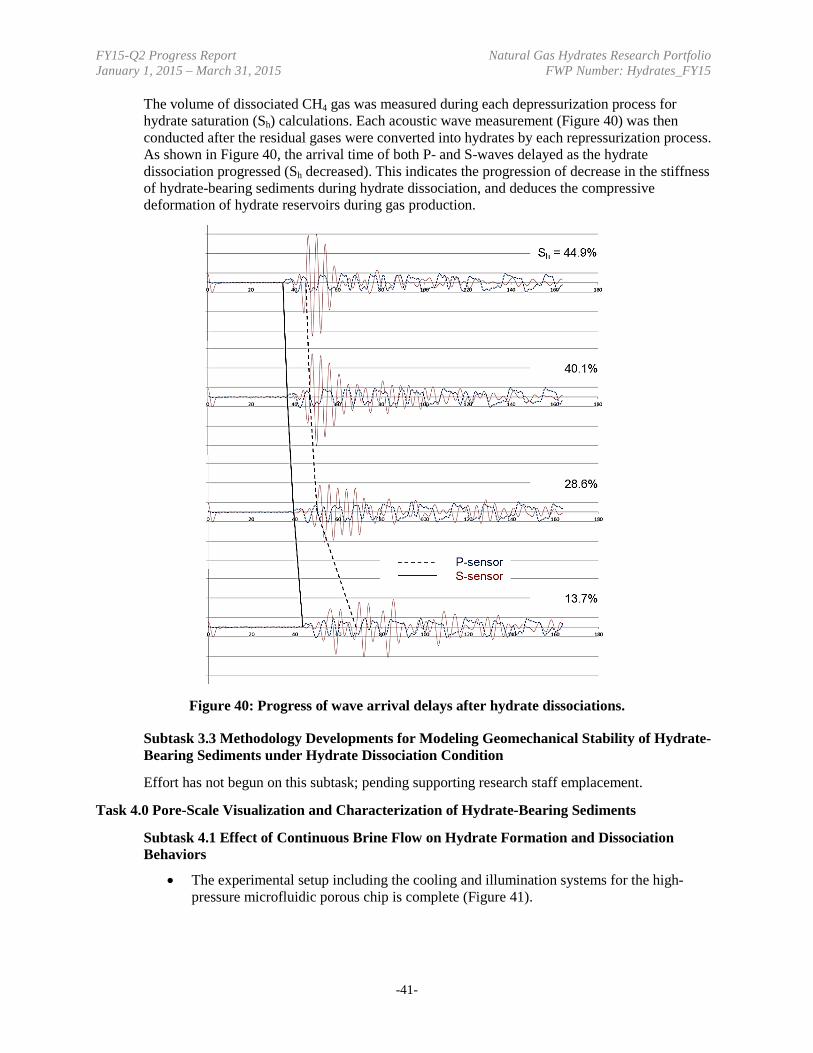
utilized in the study were obtained in FY14, after a geomechanical compression test on a non-cementing hydrate-bearing sample, as an extra data set. The sample, from which the data were obtained, therefore already had the loading history. Table 4shows the length and pore volume of the sample measured before the present study (in red).
Table 4: Changes in length and pore volume of hydrate-bearing sample, utilized in the present study, after the previous geomechanical compression test.
Unit of Measurement
Before Compression Test
After Compression Test and Reconsolidation
Length [mm] 99.6 86.8
Pore Vol. [ml] 75.5 81.7
Hydrate Vol. [ml] 36.7 36.7
Sh
[%] 48.6 44.9
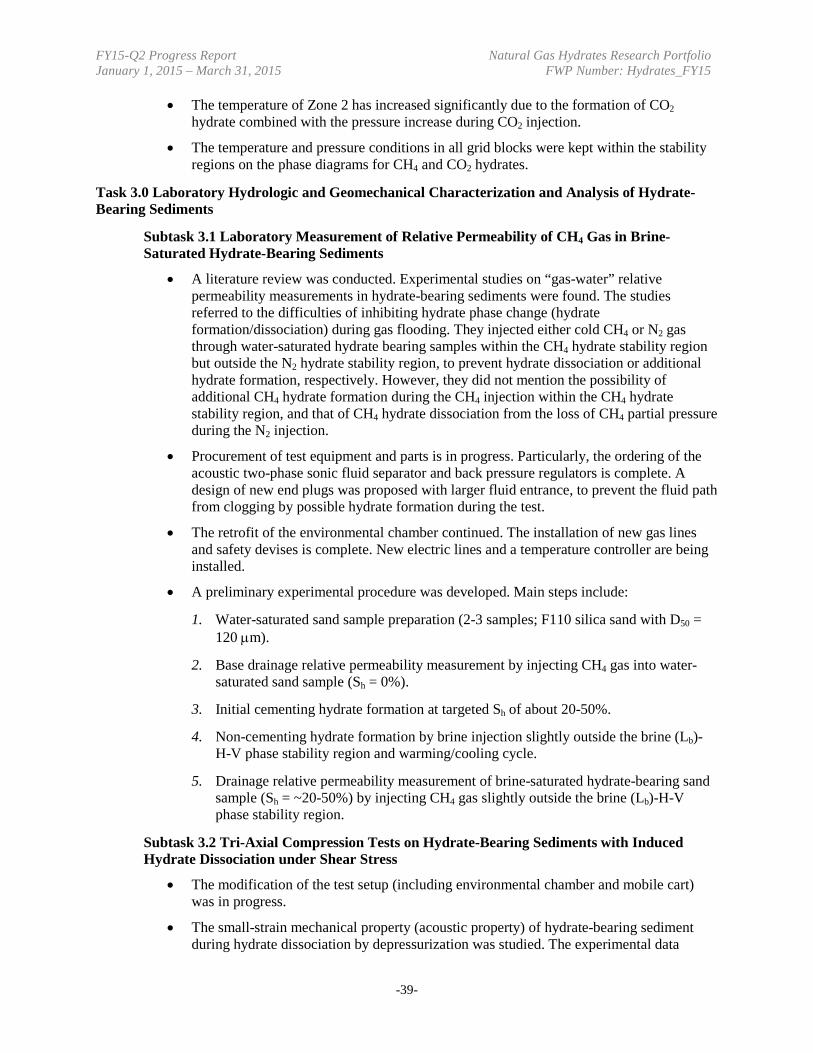
Despite the loading history on the sample, the present study could still reveal the influence of hydrate dissociation on the mechanical behaviors of hydrate-bearing sediments. The sequence of the hydrate dissociation of the sample was: (1) partial hydrate dissociation →( 2) closing outlet valve → (3) P-T stabilization in closed-system → (4) repressurization into hydrate stability zone by injecting CH4-saturated CaCl2 solution (hydrate reformation) → (5) repeat of the same cycle until the complete hydrate dissociation, as shown in Figure 39.
Figure 39: Path of P-T change during hydrate dissociation by depressurization, P-T stabilization in closed system, and hydrate reformation by repressurization.
-40-
FY15-Q2 Progress Report Natural Gas Hydrates Research Portfolio January 1, 2015 – March 31, 2015 FWP Number: Hydrates_FY15
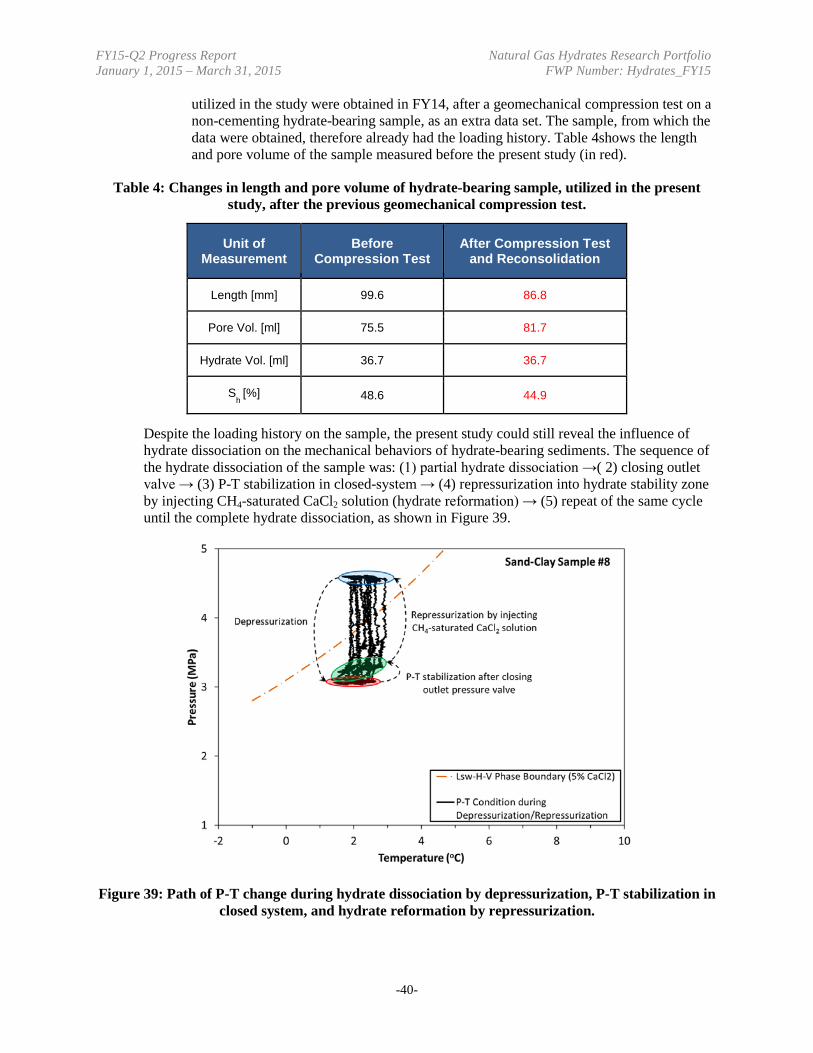
The volume of dissociated CH4 gas was measured during each depressurization process for hydrate saturation (Sh) calculations. Each acoustic wave measurement (Figure 40) was then conducted after the residual gases were converted into hydrates by each repressurization process. As shown in Figure 40, the arrival time of both P- and S-waves delayed as the hydrate dissociation progressed (Sh decreased). This indicates the progression of decrease in the stiffness of hydrate-bearing sediments during hydrate dissociation, and deduces the compressive deformation of hydrate reservoirs during gas production.
Figure 40: Progress of wave arrival delays after hydrate dissociations.
Subtask 3.3 Methodology Developments for Modeling Geomechanical Stability of Hydrate-Bearing Sediments under Hydrate Dissociation Condition
Effort has not begun on this subtask; pending supporting research staff emplacement.
Task 4.0 Pore-Scale Visualization and Characterization of Hydrate-Bearing Sediments
Subtask 4.1 Effect of Continuous Brine Flow on Hydrate Formation and Dissociation Behaviors
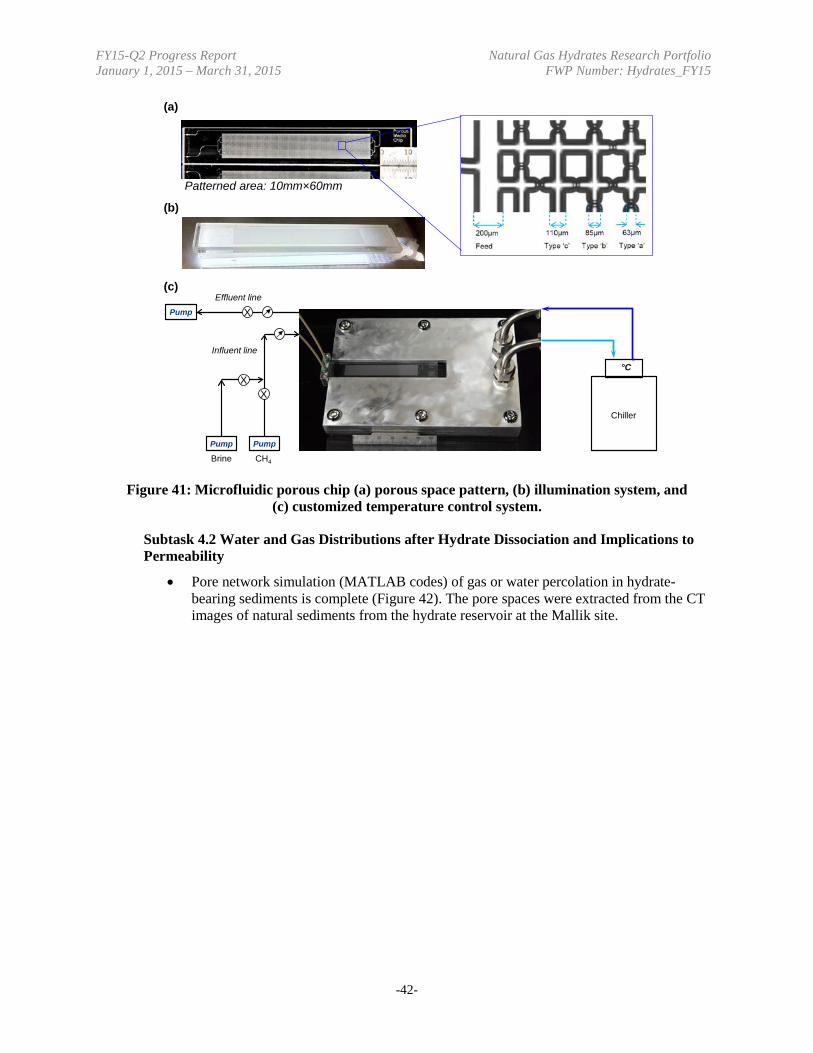
• The experimental setup including the cooling and illumination systems for the high-pressure microfluidic porous chip is complete (Figure 41).
-41-
FY15-Q2 Progress Report Natural Gas Hydrates Research Portfolio January 1, 2015 – March 31, 2015 FWP Number: Hydrates_FY15
Figure 41: Microfluidic porous chip (a) porous space pattern, (b) illumination system, and (c) customized temperature control system.
Subtask 4.2 Water and Gas Distributions after Hydrate Dissociation and Implications to Permeability
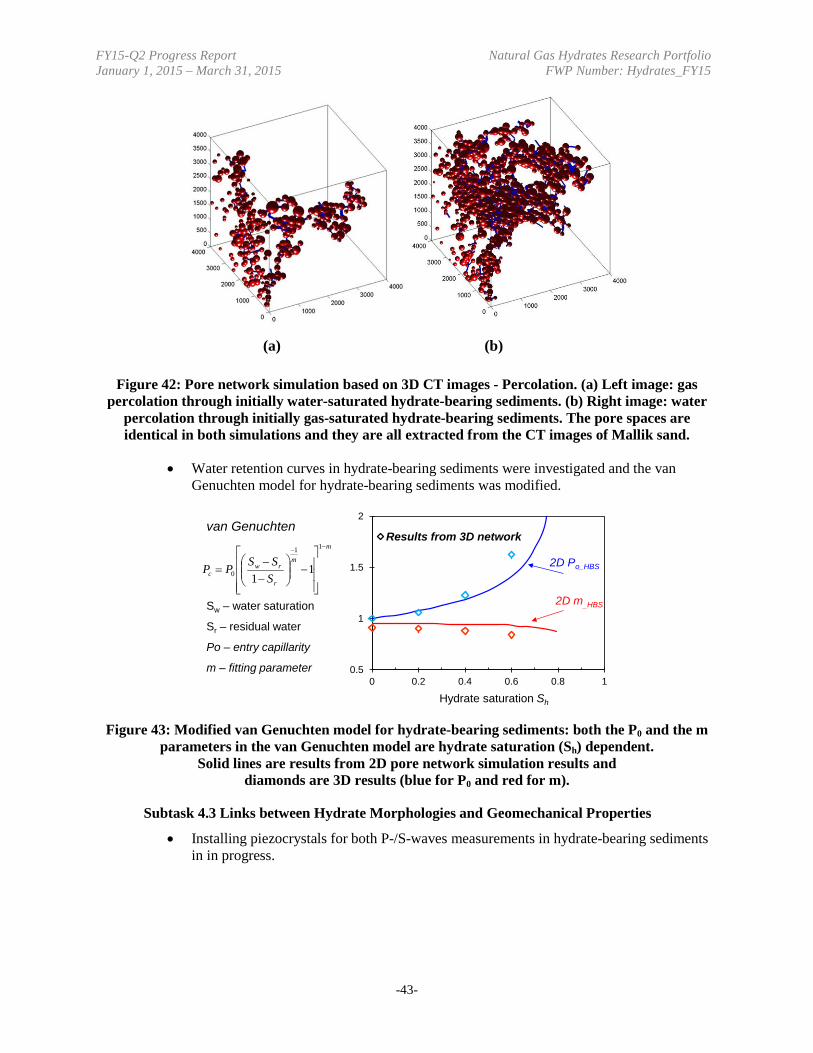
• Pore network simulation (MATLAB codes) of gas or water percolation in hydrate-bearing sediments is complete (Figure 42). The pore spaces were extracted from the CT images of natural sediments from the hydrate reservoir at the Mallik site.
Chiller
°C
XEffluent line
Pump
Influent line
XX
PumpPump
Brine CH4
Patterned area: 10mm×60mm
(a)
(b)
(c)
-42-
FY15-Q2 Progress Report Natural Gas Hydrates Research Portfolio January 1, 2015 – March 31, 2015 FWP Number: Hydrates_FY15
Figure 42: Pore network simulation based on 3D CT images - Percolation. (a) Left image: gas percolation through initially water-saturated hydrate-bearing sediments. (b) Right image: water
percolation through initially gas-saturated hydrate-bearing sediments. The pore spaces are identical in both simulations and they are all extracted from the CT images of Mallik sand.
• Water retention curves in hydrate-bearing sediments were investigated and the van Genuchten model for hydrate-bearing sediments was modified.
Figure 43: Modified van Genuchten model for hydrate-bearing sediments: both the P0 and the m parameters in the van Genuchten model are hydrate saturation (Sh) dependent.
Solid lines are results from 2D pore network simulation results and diamonds are 3D results (blue for P0 and red for m).
Subtask 4.3 Links between Hydrate Morphologies and Geomechanical Properties
• Installing piezocrystals for both P-/S-waves measurements in hydrate-bearing sediments in in progress.
(a) (b)
0.5
1
1.5
2
0 0.2 0.4 0.6 0.8 1
Hydrate saturation Sh
van Genuchtenm
m
r
rwc S
SSPP
−−
−
−−
=
11
0 11
Sw – water saturation
Sr – residual water
Po – entry capillarity
m – fitting parameter
2D Po_HBS
2D m_HBS
Results from 3D network
-43-
FY15-Q2 Progress Report Natural Gas Hydrates Research Portfolio January 1, 2015 – March 31, 2015 FWP Number: Hydrates_FY15
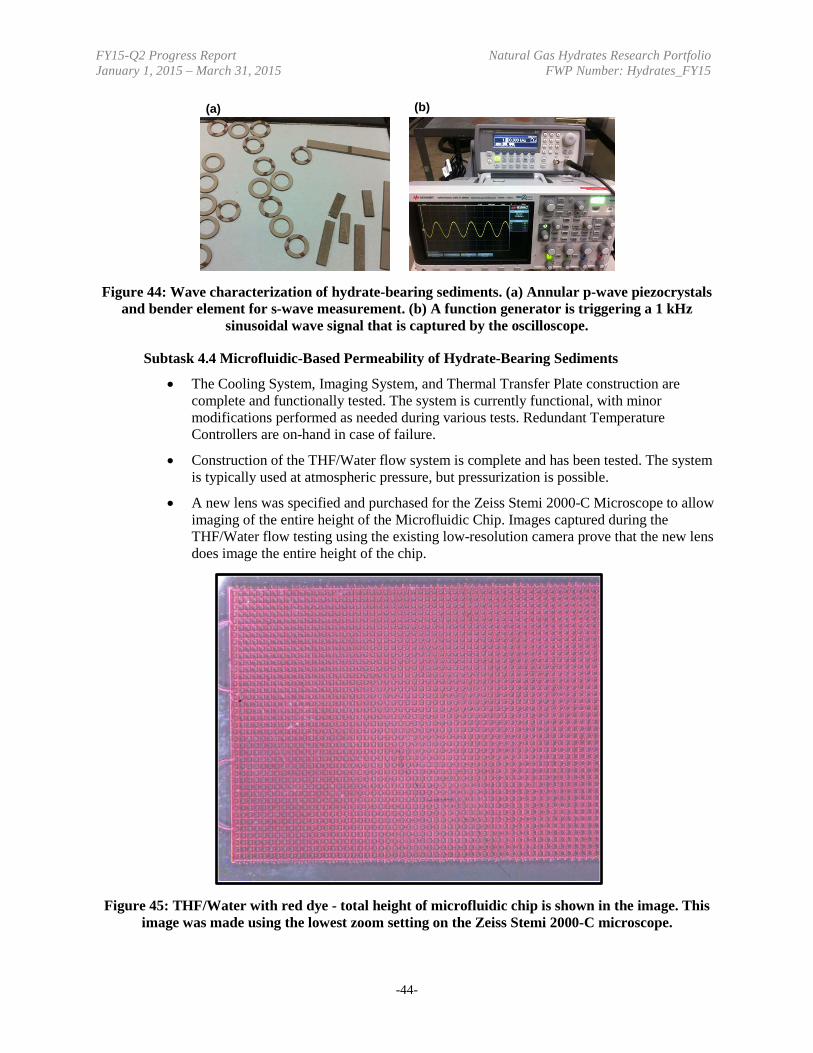
Figure 44: Wave characterization of hydrate-bearing sediments. (a) Annular p-wave piezocrystals and bender element for s-wave measurement. (b) A function generator is triggering a 1 kHz
sinusoidal wave signal that is captured by the oscilloscope.
Subtask 4.4 Microfluidic-Based Permeability of Hydrate-Bearing Sediments
• The Cooling System, Imaging System, and Thermal Transfer Plate construction are complete and functionally tested. The system is currently functional, with minor modifications performed as needed during various tests. Redundant Temperature Controllers are on-hand in case of failure.
• Construction of the THF/Water flow system is complete and has been tested. The system is typically used at atmospheric pressure, but pressurization is possible.
• A new lens was specified and purchased for the Zeiss Stemi 2000-C Microscope to allow imaging of the entire height of the Microfluidic Chip. Images captured during the THF/Water flow testing using the existing low-resolution camera prove that the new lens does image the entire height of the chip.
Figure 45: THF/Water with red dye - total height of microfluidic chip is shown in the image. This image was made using the lowest zoom setting on the Zeiss Stemi 2000-C microscope.
(a) (b)
-44-
FY15-Q2 Progress Report Natural Gas Hydrates Research Portfolio January 1, 2015 – March 31, 2015 FWP Number: Hydrates_FY15
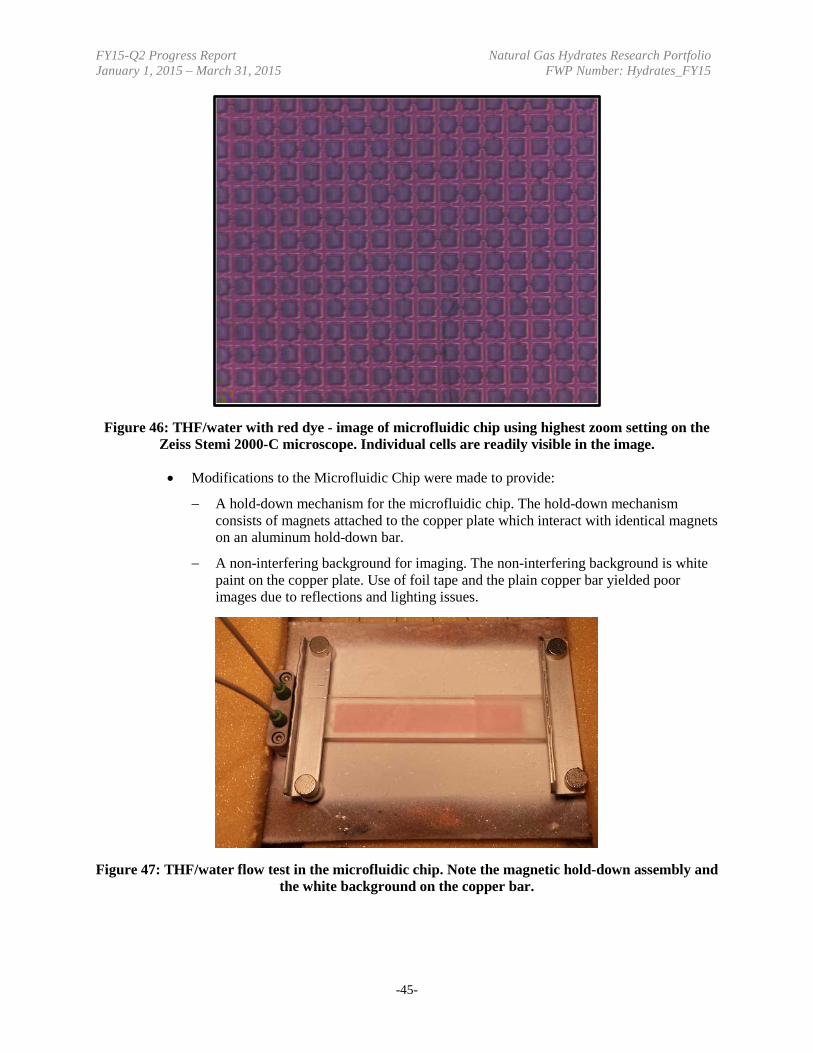
Figure 46: THF/water with red dye - image of microfluidic chip using highest zoom setting on the Zeiss Stemi 2000-C microscope. Individual cells are readily visible in the image.
• Modifications to the Microfluidic Chip were made to provide:
− A hold-down mechanism for the microfluidic chip. The hold-down mechanism consists of magnets attached to the copper plate which interact with identical magnets on an aluminum hold-down bar.
− A non-interfering background for imaging. The non-interfering background is white paint on the copper plate. Use of foil tape and the plain copper bar yielded poor images due to reflections and lighting issues.
Figure 47: THF/water flow test in the microfluidic chip. Note the magnetic hold-down assembly and the white background on the copper bar.
-45-
FY15-Q2 Progress Report Natural Gas Hydrates Research Portfolio January 1, 2015 – March 31, 2015 FWP Number: Hydrates_FY15
• Additional parts were specified and ordered for the imaging and cooling system.
− A new high-resolution camera was ordered to allow detailed imaging of the microfluidic chip. The current camera has low resolution. The new camera is expected to arrive in May 2015.
− A second circulating chiller was ordered to provide separate cooling for the relays. Currently, the Peltier Plates and relays are cooled using the same chiller. During extended runs, the amount of heat produced by the system may overrun the cooling capacity of one chiller. A second chiller will be used to separate the Peltier Plates from the relays to reduce the risk of overheating.
− A spare microfluidic chip was ordered and received. This spare chip will be available to NETL users in case of failure or other issues.
• An attempt to make THF Hydrate was made in the Microfluidic Chip in March 2015. A mixture of 40% THF/60% H2O (by weight) mixed with red food dye was introduced into the chip and cooling was applied. The mixture reached a temperature of less than 1°C for over 24 hours. No hydrate was detected.
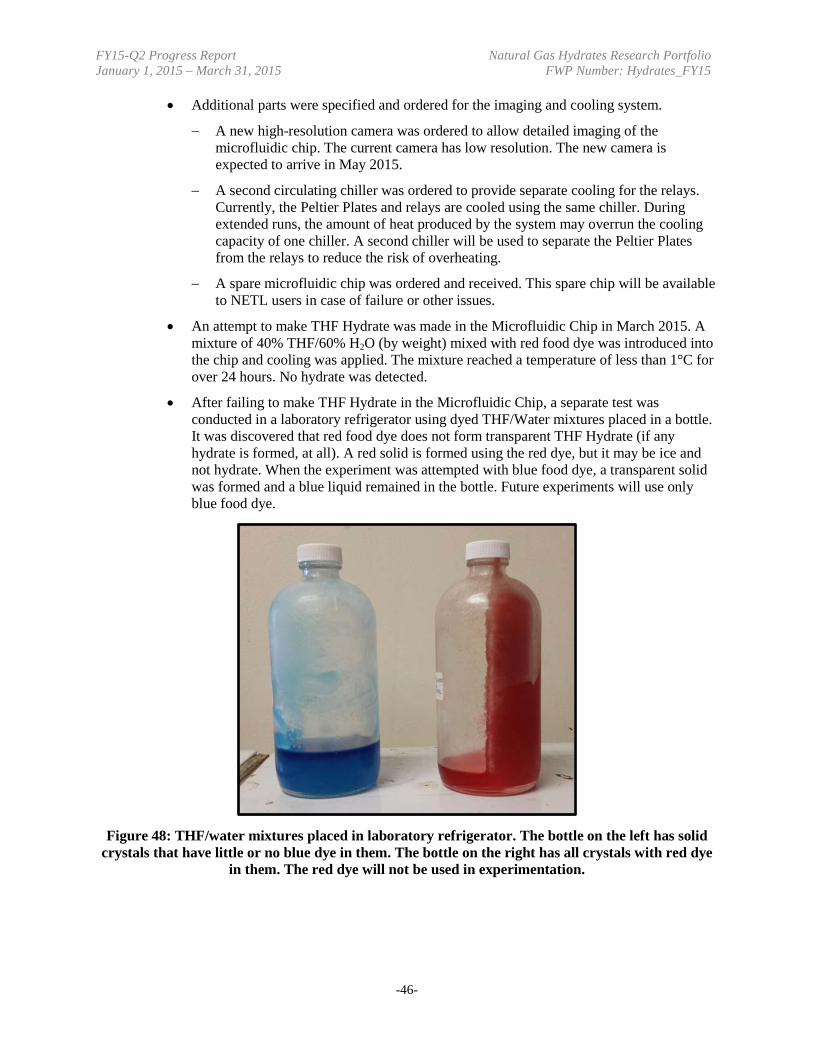
• After failing to make THF Hydrate in the Microfluidic Chip, a separate test was conducted in a laboratory refrigerator using dyed THF/Water mixtures placed in a bottle. It was discovered that red food dye does not form transparent THF Hydrate (if any hydrate is formed, at all). A red solid is formed using the red dye, but it may be ice and not hydrate. When the experiment was attempted with blue food dye, a transparent solid was formed and a blue liquid remained in the bottle. Future experiments will use only blue food dye.
Figure 48: THF/water mixtures placed in laboratory refrigerator. The bottle on the left has solid crystals that have little or no blue dye in them. The bottle on the right has all crystals with red dye
in them. The red dye will not be used in experimentation.
-46-
FY15-Q2 Progress Report Natural Gas Hydrates Research Portfolio January 1, 2015 – March 31, 2015 FWP Number: Hydrates_FY15 Forecast for Next 6 Months
Task 1.0 Project Management and Outreach
The FY15-Q2 Report will be submitted on April 30, 2015.
Task 2.0 Reservoir Simulation of Gas Hydrates Production Field Tests
Subtask 2.1 Alaska North Slope Production Test Simulation Assistance
• The next level of complexity will incorporate a heterogeneous distribution of hydrate saturation which can be obtained from a porosity-hydrate saturation correlation inferred from L106 well logs. Reservoir simulations are in progress for a single realization of porosity distribution with uniform hydrate saturation of 0.5.
• Flow simulations will be conducted for multiple realizations subsequently to predict gas and water production rates and determine the critical design and operational factors that would affect production and thoroughly describe uncertainties in the model predictions.
• Within the next four months, a representative 3D heterogeneous model of the L-pad C and D-sands, with respect to porosity, hydrate saturation, and other intrinsic reservoir properties, will be developed.
• Production test design schemes will be recommended based on the model predictions.
Subtask 2.2 International Code Comparison Continuation – Iġnik Sikumi History Match Analysis and Marine Deposit Based on the 2013 Nankai Trough Test or Other Marine Sites
• An equilibrated domain will be considered before injecting CO2(g) into the reservoir domain. The long term focus is on creating a 3D heterogeneous domain and studying the effect of CO2 hydrate formation on methane production.
Task 3.0 Laboratory Hydrologic and Geomechanical Characterization and Analysis of Hydrate-Bearing Sediments
Subtask 3.1 Laboratory Measurement of Relative Permeability of CH4 Gas in Brine-Saturated Hydrate-Bearing Sediments
• The literature review will continue. (FY15-Q3)
• Preliminary experimental methodology for the relative measurements will be developed, reviewed, and completed. (FY15-Q3)
• The temperature chamber will be ready for the test by adding new gas lines, a temperature controller, and gas detectors. (FY15-Q3)
• New equipment and parts will be assembled into the mobile cart. (FY15-Q3)
• The experimental method and test setup will be examined by conducting preliminary tests. (FY15-Q3)
• The first planned test will be conducted, and its result will be analyzed. (FY15-Q4)
Subtask 3.2 Tri-Axial Compression Tests on Hydrate-Bearing Sediments with Induced Hydrate Dissociation under Shear Stress
• An overall test plan will be completed. (FY15-Q3)
• Modification of the existing geomechanical test setup will be completed in accordance with the test plan. (FY-Q3)
-47-
FY15-Q2 Progress Report Natural Gas Hydrates Research Portfolio January 1, 2015 – March 31, 2015 FWP Number: Hydrates_FY15
• An initial compression test will be conducted, simultaneously examining the test plan and setups. (FY15-Q3)
• Planned tests will be completed and results will be analyzed and reported. (FY15-Q4)
Subtask 3.3 Methodology Developments for Modeling Geomechanical Stability of Hydrate-Bearing Sediments under Hydrate Dissociation Condition
Effort has not begun on this subtask; pending identification of research staff on the task. The team hopes to validate the constitutive model with experimental data on the modeling of dissociation on stress-strain behavior. The team would also conduct and develop benchmark tests for validating the coupling analysis for geomechanics analysis of operational scenarios, for use in such cases as methane extraction from the ground.
Task 4.0 Pore-Scale Visualization and Characterization of Hydrate-Bearing Sediments
Subtask 4.1 Effect of Continuous Brine Flow on Hydrate Formation and Dissociation Behaviors
• To follow the NETL’s recipe of forming noncementing hydrate and obtain CT images of hydrate pore habits at each critical step using the Be vessel.
Subtask 4.2 Water and Gas Distributions after Hydrate Dissociation and Implications to Permeability
• To obtain CT images of residual water and gas distributions after hydrate distribution.
• To simulate the gas percolation process during hydrate dissociation.
Subtask 4.3 Links between Hydrate Morphologies and Geomechanical Properties
• To use the Be-vessel with new endcaps to study effects of hydrate morphologies on the measured p-wave velocity and strength of hydrate-bearing sediments.
• To use Al-vessel to study the hydrate distribution on measurement p- and s-wave characteristics.
Subtask 4.4 Microfluidic-Based Permeability of Hydrate-Bearing Sediments
Continuing during FY15-Q3, experiments with THF hydrate will be conducted to further test the Microfluidic Chip system and determine the ability to process images from the experiments. Initial images will be obtained using the existing low-resolution camera. Additional images will be analyzed using a higher resolution camera that will be delivered and installed during FY15-Q3. Image processing will be conducted with ImageJ to determine the saturation of THF hydrate in the Microfluidic Chip.
The goal of the experimentation will be to correlate hydrate density to flow, which will show how the permeability of the microfluidic chip changes as hydrate density increases. Once initial testing of THF hydrates is complete, a temperature gradient will be induced to increase the density of hydrate formed, attempting to mimic real world hydrate densities.
During FY15-Q4, making CO2 Hydrate will be attempted using the Microfluidic Chip system. The system as constructed can operate under pressure, so a system redesign to handle CO2 should not be needed.
-48-
FY15-Q2 Progress Report Natural Gas Hydrates Research Portfolio January 1, 2015 – March 31, 2015 FWP Number: Hydrates_FY15 Products
Publications, Conference Papers, and Presentations
Seol, Y., Choi, J.H., Dai, S., Jarvis, K., “Recent Advances in NETL's Laboratory Studies of Hydrate-Bearing Sediments,” Fire in the Ice, 15 (1), 5-9, 2015.
Changes/Problems
There is a potential delay in deploying the Be-vessel for hydrate studies, as few other projects behind schedules are engaging the Be vessel and the micro-XCT. Aluminum core holders are being designed to be used for Industrial CT (Subtask 4.1 and Subtask 4.3).
-49-

FY15-Q2 Progress Report Natural Gas Hydrates Research Portfolio January 1, 2015 – March 31, 2015 FWP Number: Hydrates_FY15 Appendix A: Participating and Other Collaborating Organizations Table A-1 includes the name and organization of all federal, URS/AECOM, university, and ORISE participants. Each quarter, changes or additions will be shown in highlighted yellow text.
Table A-1: Natural Gas Hydrates Research Portfolio Participating and Collaborating Organizations
Task/Subtask Number – Name Name Organization
Task 1.0 Project Management and Outreach
Subtasks 1.1-1.4 Project Management and Outreach Gary Sames Yongkoo Seol NETL-ORD
Jeffery Ilconich URS/AECOM
Subtask 1.5 Outreach Yongkoo Seol NETL-ORD
Jeffery Ilconich URS/AECOM
Subtask 1.6 Portfolio Management Yongkoo Seol NETL-ORD
Jeffery Ilconich URS/AECOM
Task 2.0 Reservoir Simulation of Gas Hydrates Production Field Tests
Subtask 2.1 Alaska North Slope Production Test Simulation Assistance Yongkoo Seol NETL-ORD
Taiwo Ajayi Prathyusha Sridhara ORISE
Subtask 2.2 International Code Comparison Continuation – Iġnik Sikumi History Match Analysis and Marine Deposit Based on the 2013 Nankai Trough Test or Other Marine Sites
Yongkoo Seol NETL-ORD
Taiwo Ajayi Prathyusha Sridhara ORISE
Task 3.0 Laboratory Hydrologic and Geomechanical Characterization and Analysis of Hydrate-Bearing Sediments
Subtask 3.1 Laboratory Measurement of Relative Permeability of CH4 Gas in Brine-Saturated Hydrate-Bearing Sediments
Yongkoo Seol NETL-ORD
Jeong-Hoon Choi ORISE
Subtask 3.2 Tri-Axial Compression Tests on Hydrate-Bearing Sediments with Induced Hydrate Dissociation under Shear Stress
Yongkoo Seol NETL-ORD
Jeong-Hoon Choi ORISE
Subtask 3.3 Methodology Developments for Modeling Geomechanical Stability of Hydrate-Bearing Sediments under Hydrate Dissociation Condition
Yongkoo Seol NETL-ORD
TBD TBD
A-1

FY15-Q2 Progress Report Natural Gas Hydrates Research Portfolio January 1, 2015 – March 31, 2015 FWP Number: Hydrates_FY15 Task/Subtask Number – Name Name Organization
Task 4.0 Pore-Scale Visualization and Characterization of Hydrate-Bearing Sediments
Subtask 4.1 Effect of Continuous Brine Flow on Hydrate Formation and Dissociation Behaviors
Yongkoo Seol NETL-ORD
Sheng Dai Terrance Ryan Matthew Tacker
ORISE
Subtask 4.2 Water and Gas Distributions after Hydrate Dissociation and Implications to Permeability
Yongkoo Seol NETL-ORD
Sheng Dai Terrance Ryan Matthew Tacker
ORISE
Subtask 4.3 Links between Hydrate Morphologies and Geomechanical Properties
Yongkoo Seol NETL-ORD
Sheng Dai Terrance Ryan Matthew Tacker
ORISE
Subtask 4.4 Microfluidic-Based Permeability of Hydrate-Bearing Sediments
Yongkoo Seol NETL-ORD
Sheng Dai Terrance Ryan Matthew Tacker
ORISE
A-2


![New Techniques in Corolling Gas Hydrates [Recovered] Techniques in Corolling Gas Hydrates... · New Techniques in Controlling Gas Hydrates ... Ethane Propane ... • When hydrates](https://img.pdfslide.net/doc/110x75/5b865c467f8b9a195a8ca7ef/new-techniques-in-corolling-gas-hydrates-recovered-techniques-in-corolling-gas.jpg)