Embed Size (px)
Citation preview
NATURALLY VENTILATED BUILDING DESIGN UNDER UNCERTAINTY USING DESIGN OF EXPERIMENTS
Jay Dhariwal1, Rangan Banerjee1
1Department of Energy Science and Engineering, IIT Bombay, Mumbai, India
ABSTRACT Appropriate building design for natural ventilation can reduce discomfort, while saving energy on air-conditioning. Parametric building simulation analysis for natural ventilation typically consists of several design variables and input parameters with uncertainty, making it computationally intensive. For optimizing the building design within a reasonable timeframe, design of experiment techniques based methodology is proposed. Firstly, the significant design variables and input parameters are identified. For these significant factors, correlations are formed to predict the statistical distribution of indoor operative temperatures. These correlations are used to find the design, which minimizes discomfort hours, as per adaptive comfort guidelines.
INTRODUCTION Traditionally, the heritage buildings in India have used natural ventilation based design successfully. Foldbjerg et al. (2014) also find ventilative cooling playing an important role in maintaining thermal comfort in three dwellings in Austria, Germany and Denmark. Naturally ventilated buildings have the advantage of a wider temperature range for thermal comfort than air-conditioned buildings (Manu et al., 2014). However, the use of air conditioning has been on the rise in recent times. Air-conditioned buildings provide greater thermal comfort at the expense of consuming much more energy as compared to naturally ventilated buildings. Presently, the penetration of air conditioners in Indian households is low but their rising growth trend could be worrisome for an energy deficient country like India in future (Phadke et al., 2014). In this context, is it possible to design comfortable naturally ventilated buildings to reduce the use of air-conditioning? Crawley et al. (2008) show that EnergyPlus is among the simulation programs having most features to model airflow and its impact on energy use through the computation of zone loads, considering the building envelope and solar gain. Gu (2007) shows that airflow network modelling in EnergyPlus can be used to predict the performance of naturally ventilated buildings accurately. However, each zone is considered to be well mixed at a uniform temperature in EnergyPlus. This may overestimate
the indoor air temperature in case of thermal stratification of air. To overcome this issue, method proposed by Brandan (2012) can be used to find the floor to ceiling temperature profile, depending on the ratio of buoyancy to inertial forces. Jain et al. (2011) suggest that indoor operative temperature is better at estimating human thermal comfort than the indoor air temperature. For optimizing the building design, parametric analyses are required to iterate over combinations of many design variables like overhang depth, window to wall ratio, etc. Moreover, most of the input parameters used for building simulation have uncertainties associated, which can have an impact on design decisions. Hopfe and Hensen (2011) and de Wit (2001) quantify the uncertainties due to natural variability in material properties, different correlations developed for various microclimate variables, scenario uncertainties due to differing occupancy behaviour, etc. Sun et al. (2014) quantify the uncertainty in microclimate variables like wind speed, local temperature, etc. and show that the uncertainty causes the performance indicators to be a distribution, instead of a point estimate. Hence, assuming each simulation for a typical building design to take about 10 seconds, and parametric analyses iterating over a combination of 40 design variables and input parameters, the optimal design may take time of the order of years, on an Intel® Core™ i7-2670QM processor. This suggests the need of more efficient algorithms, which find the solution within a day’s time. Nguyen et al. (2014) provide a review of the building design optimization methods used in literature. Dhariwal and Banerjee (2015) have used design of experiments based techniques to reduce the time taken to couple of hours, for optimizing an air-conditioned building design for minimum life cycle cost. They have not considered the uncertainty in input parameters and therefore, their response variable is just a point estimate and not the distribution of the response. Nguyen et al. (2014) suggest the use of robust design optimization for probabilistic functions of objective functions, which arise in problems dealing with optimization under uncertainty. In literature, there have not been many simulation studies for Indian climates showing the impact of
Proceedings of BS2015: 14th Conference of International Building Performance Simulation Association, Hyderabad, India, Dec. 7-9, 2015.
- 1708 -
natural ventilation based design strategies on reducing discomfort hours and thereby, the energy consumption. This paper proposes a methodology, using design of experiments techniques, to choose the naturally ventilated building design, which minimizes discomfort hours. Fractional factorial design identifies the most significant passive design strategies and uncertainty parameters, affecting the responses, i.e. the mean and variance of indoor operative temperature. For the identified factors, response surface modelling is used to form correlations to find the statistical distribution of indoor operative temperatures. Discomfort hours are estimated for each design, as per ASHRAE standard 55 adaptive comfort guidelines (ASHRAE, 2013). The design, which minimizes the discomfort hours, is selected. This methodology is illustrated using a case study of a single storeyed building for the warm and humid Mumbai climate.
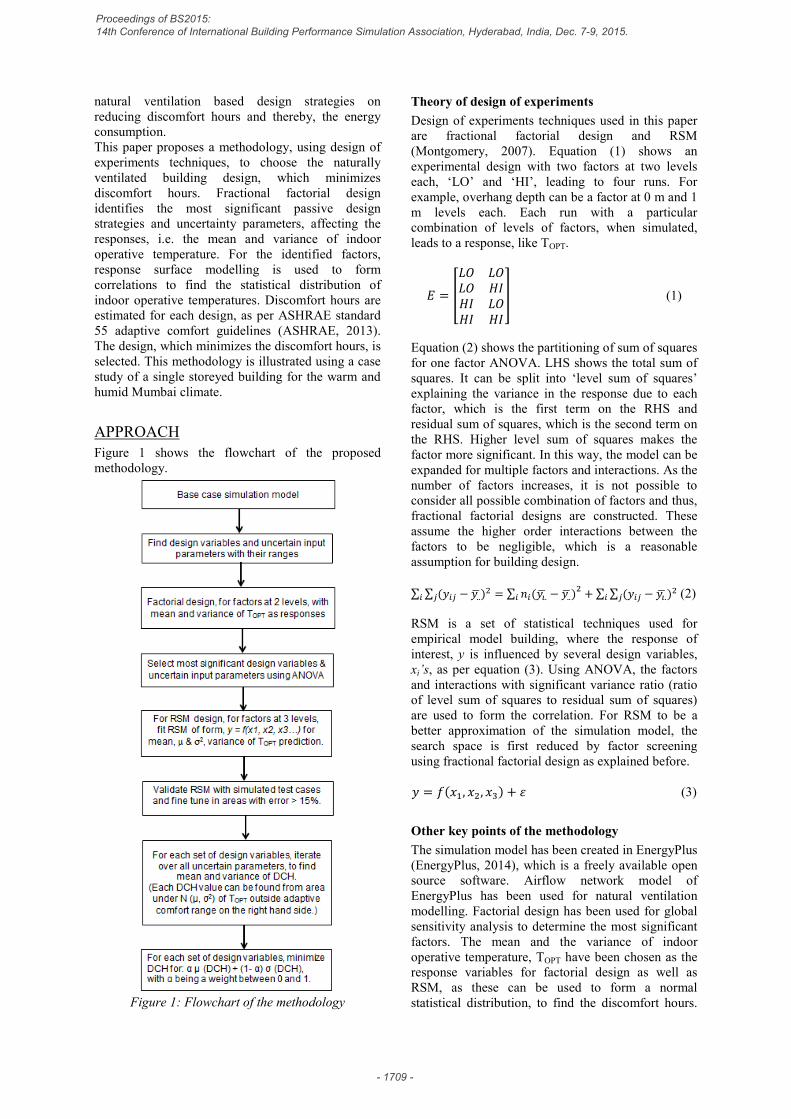
APPROACH Figure 1 shows the flowchart of the proposed methodology.
Figure 1: Flowchart of the methodology
Theory of design of experiments Design of experiments techniques used in this paper are fractional factorial design and RSM (Montgomery, 2007). Equation (1) shows an experimental design with two factors at two levels each, ‘LO’ and ‘HI’, leading to four runs. For example, overhang depth can be a factor at 0 m and 1 m levels each. Each run with a particular combination of levels of factors, when simulated, leads to a response, like TOPT.
𝐸𝐸 = �
𝐿𝐿𝐿𝐿 𝐿𝐿𝐿𝐿𝐿𝐿𝐿𝐿 𝐻𝐻𝐻𝐻𝐻𝐻𝐻𝐻 𝐿𝐿𝐿𝐿𝐻𝐻𝐻𝐻 𝐻𝐻𝐻𝐻
� (1)
Equation (2) shows the partitioning of sum of squares for one factor ANOVA. LHS shows the total sum of squares. It can be split into ‘level sum of squares’ explaining the variance in the response due to each factor, which is the first term on the RHS and residual sum of squares, which is the second term on the RHS. Higher level sum of squares makes the factor more significant. In this way, the model can be expanded for multiple factors and interactions. As the number of factors increases, it is not possible to consider all possible combination of factors and thus, fractional factorial designs are constructed. These assume the higher order interactions between the factors to be negligible, which is a reasonable assumption for building design. ∑ ∑ (𝑦𝑦𝑖𝑖𝑖𝑖𝑖𝑖𝑖𝑖 − 𝑦𝑦..� )2 = ∑ 𝑛𝑛𝑖𝑖(𝑦𝑦𝚤𝚤.� − 𝑦𝑦..� )𝑖𝑖
2 + ∑ ∑ (𝑦𝑦𝑖𝑖𝑖𝑖𝑖𝑖𝑖𝑖 − 𝑦𝑦𝚤𝚤.� )2 (2) RSM is a set of statistical techniques used for empirical model building, where the response of interest, y is influenced by several design variables, xi’s, as per equation (3). Using ANOVA, the factors and interactions with significant variance ratio (ratio of level sum of squares to residual sum of squares) are used to form the correlation. For RSM to be a better approximation of the simulation model, the search space is first reduced by factor screening using fractional factorial design as explained before. 𝑦𝑦 = 𝑓𝑓(𝑥𝑥1, 𝑥𝑥2, 𝑥𝑥3) + 𝜀𝜀 (3)
Other key points of the methodology The simulation model has been created in EnergyPlus (EnergyPlus, 2014), which is a freely available open source software. Airflow network model of EnergyPlus has been used for natural ventilation modelling. Factorial design has been used for global sensitivity analysis to determine the most significant factors. The mean and the variance of indoor operative temperature, TOPT have been chosen as the response variables for factorial design as well as RSM, as these can be used to form a normal statistical distribution, to find the discomfort hours.
Proceedings of BS2015: 14th Conference of International Building Performance Simulation Association, Hyderabad, India, Dec. 7-9, 2015.
- 1709 -
For forming the fractional factorial design, Box-Behnken RSM design and ANOVA, Design-Expert® software (Stat Ease, 2014) has been used. For automating the simulation runs, VBA programming language has been used.
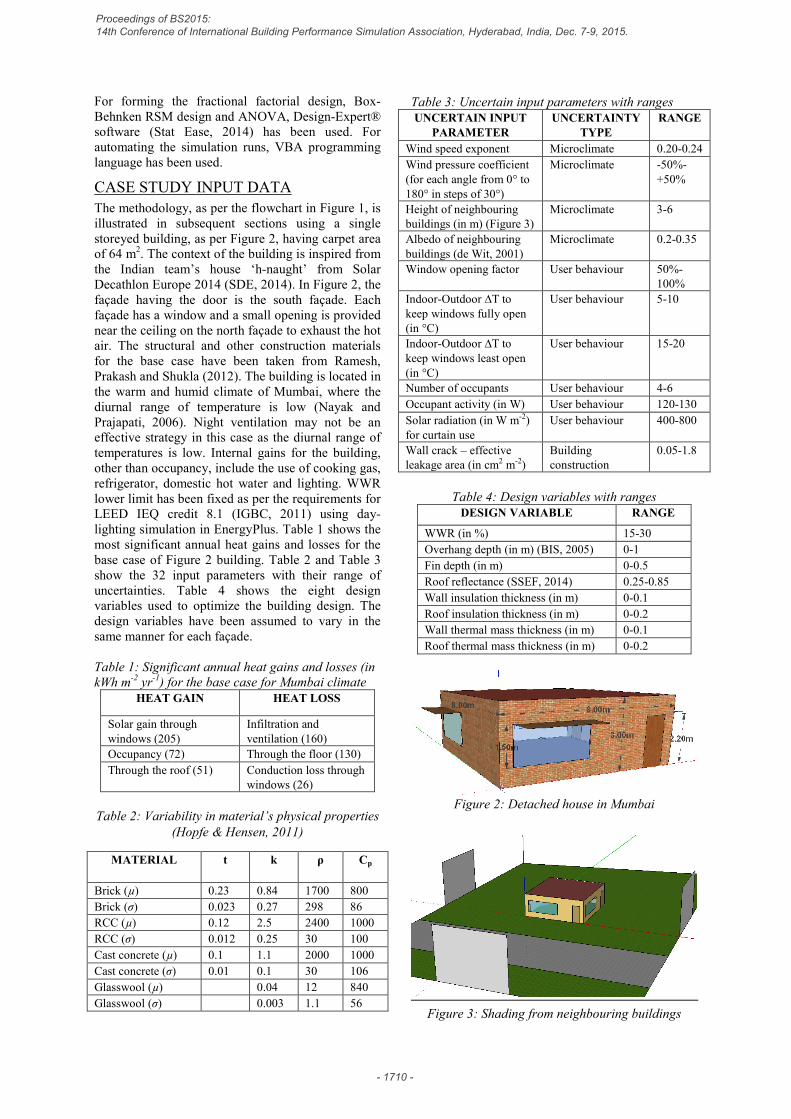
CASE STUDY INPUT DATA The methodology, as per the flowchart in Figure 1, is illustrated in subsequent sections using a single storeyed building, as per Figure 2, having carpet area of 64 m2. The context of the building is inspired from the Indian team’s house ‘h-naught’ from Solar Decathlon Europe 2014 (SDE, 2014). In Figure 2, the façade having the door is the south façade. Each façade has a window and a small opening is provided near the ceiling on the north façade to exhaust the hot air. The structural and other construction materials for the base case have been taken from Ramesh, Prakash and Shukla (2012). The building is located in the warm and humid climate of Mumbai, where the diurnal range of temperature is low (Nayak and Prajapati, 2006). Night ventilation may not be an effective strategy in this case as the diurnal range of temperatures is low. Internal gains for the building, other than occupancy, include the use of cooking gas, refrigerator, domestic hot water and lighting. WWR lower limit has been fixed as per the requirements for LEED IEQ credit 8.1 (IGBC, 2011) using day-lighting simulation in EnergyPlus. Table 1 shows the most significant annual heat gains and losses for the base case of Figure 2 building. Table 2 and Table 3 show the 32 input parameters with their range of uncertainties. Table 4 shows the eight design variables used to optimize the building design. The design variables have been assumed to vary in the same manner for each façade. Table 1: Significant annual heat gains and losses (in kWh m-2 yr-1) for the base case for Mumbai climate
HEAT GAIN HEAT LOSS
Solar gain through windows (205)
Infiltration and ventilation (160)
Occupancy (72) Through the floor (130) Through the roof (51) Conduction loss through
windows (26) Table 2: Variability in material’s physical properties
(Hopfe & Hensen, 2011)
MATERIAL t k ρ Cp
Brick (µ) 0.23 0.84 1700 800 Brick (σ) 0.023 0.27 298 86 RCC (µ) 0.12 2.5 2400 1000 RCC (σ) 0.012 0.25 30 100 Cast concrete (µ) 0.1 1.1 2000 1000 Cast concrete (σ) 0.01 0.1 30 106 Glasswool (µ) 0.04 12 840 Glasswool (σ) 0.003 1.1 56
Table 3: Uncertain input parameters with ranges UNCERTAIN INPUT
PARAMETER UNCERTAINTY
TYPE RANGE
Wind speed exponent Microclimate 0.20-0.24 Wind pressure coefficient (for each angle from 0° to 180° in steps of 30°)
Microclimate -50%-+50%
Height of neighbouring buildings (in m) (Figure 3)
Microclimate 3-6
Albedo of neighbouring buildings (de Wit, 2001)
Microclimate 0.2-0.35
Window opening factor User behaviour 50%-100%
Indoor-Outdoor ∆T to keep windows fully open (in °C)
User behaviour 5-10
Indoor-Outdoor ∆T to keep windows least open (in °C)
User behaviour 15-20
Number of occupants User behaviour 4-6 Occupant activity (in W) User behaviour 120-130 Solar radiation (in W m-2) for curtain use
User behaviour 400-800
Wall crack – effective leakage area (in cm2 m-2)
Building construction
0.05-1.8
Table 4: Design variables with ranges
DESIGN VARIABLE RANGE
WWR (in %) 15-30 Overhang depth (in m) (BIS, 2005) 0-1 Fin depth (in m) 0-0.5 Roof reflectance (SSEF, 2014) 0.25-0.85 Wall insulation thickness (in m) 0-0.1 Roof insulation thickness (in m) 0-0.2 Wall thermal mass thickness (in m) 0-0.1 Roof thermal mass thickness (in m) 0-0.2
Figure 2: Detached house in Mumbai
Figure 3: Shading from neighbouring buildings
Proceedings of BS2015: 14th Conference of International Building Performance Simulation Association, Hyderabad, India, Dec. 7-9, 2015.
- 1710 -
RESULTS Global sensitivity analysis For global SA, the input parameters in Table 3 and the design variables in Table 4 are kept at the two levels corresponding to the lower and upper limits of the range. For the input parameters of Table 2, the two levels for factorial design are chosen to correspond to (µ-2σ) and (µ+2σ). Fractional factorial design for 40 factors (8 design variables and 32 uncertain input parameters) creates 822 runs. These simulation runs have been automated using VBA, calling EnergyPlus batch file for each simulation and took a time of ~3 hours on an Intel® Core™ i7-2670QM processor. The normal probability plots of residuals were well behaved for both the cases of mean and variance of TOPT, suggesting that the normality assumptions hold. Table 5 shows the relative importance of various factors for the mean of TOPT. Table 6 shows the top three significant factors affecting the responses i.e. mean and variance of indoor operative temperature (TOPT). These factors correspond to reducing the most significant heat gains or maximizing the most significant heat losses, as per Table 1. The uncertain input parameters have one common factor and two different factors. Reduced window opening factor prevents ventilation based heat loss. Using curtains differently, leads to changes in solar heat gain ingress. Brick k and brick ρ are much more variable as compared to other envelope materials. Cast concrete thickness variation leads to a significant change in heat loss through the floor. The chosen design variables are the same for both the responses. These variables correspond to reducing the highest component of heat gains i.e. the solar heat gain through the windows and conduction through the roof. Hence, these three design variables and five uncertain input parameters are selected to form an empirical model, as per the flowchart in Figure 1. Table 5: ANOVA table for global SA of µ(TOPT)
FACTOR SUM OF SQUARES
Contribution (%)
SS/ Total SS Model 130 Overhang depth 40 30 Roof reflectivity 30 23 WWR 25 19 Window opening factor
4 3
Curtain use 2 2 Cast concrete t 1 1 Height of neighbouring building
0.2 0.2
Wind speed exponent 0.1 0.1 Brick ρ 0.007 0 Brick k 0.003 0 Residual 1 Total 131
Table 6: Most significant factors for SA (rank wise) INPUT
FACTORS FOR
µ(TOPT)
INPUT FACTORS
FOR σ2(TOPT)
DESIGN FACTORS
FOR µ(TOPT)
DESIGN FACTORS
FOR σ2(TOPT)
Window opening factor
Window opening factor
Overhang depth
WWR
Solar radiation for curtain use
Brick k Roof reflectivity
Overhang depth
Cast concrete thickness
Brick ρ WWR Roof reflectivity
Response surface modelling Box-Behnken RSM design is created in Design-Expert® software using 3 levels for each factor, taking the lower limit, the middle value and upper limit of the range. For example, for the overhang depth, the levels correspond to 0 m, 0.5 m and 1 m. The design leads to 113 simulation runs, taking less than 0.5 hours of computational time. The fitted model on the right hand side (RHS) of equation (4) and equation (5) has linear, quadratic and interaction terms for all the eight factors. The Box-Cox plot in Design-Expert® software recommends a natural log transform for σ2 (TOPT), as shown on the left hand side (LHS) of equation (5), for meeting the normality assumptions for the residuals. Both the fitted models achieve an adjusted R-squared of 0.99, showing a very good fit. µ(TOPT) = f (WWR, overhang, roof reflectivity, window opening factor, curtain use, brick k, brick ρ, cast concrete t) (4) ln (σ2 (TOPT)) = f (WWR, overhang, roof reflectivity, window opening factor, curtain use, brick k, brick ρ, cast concrete t) (5)
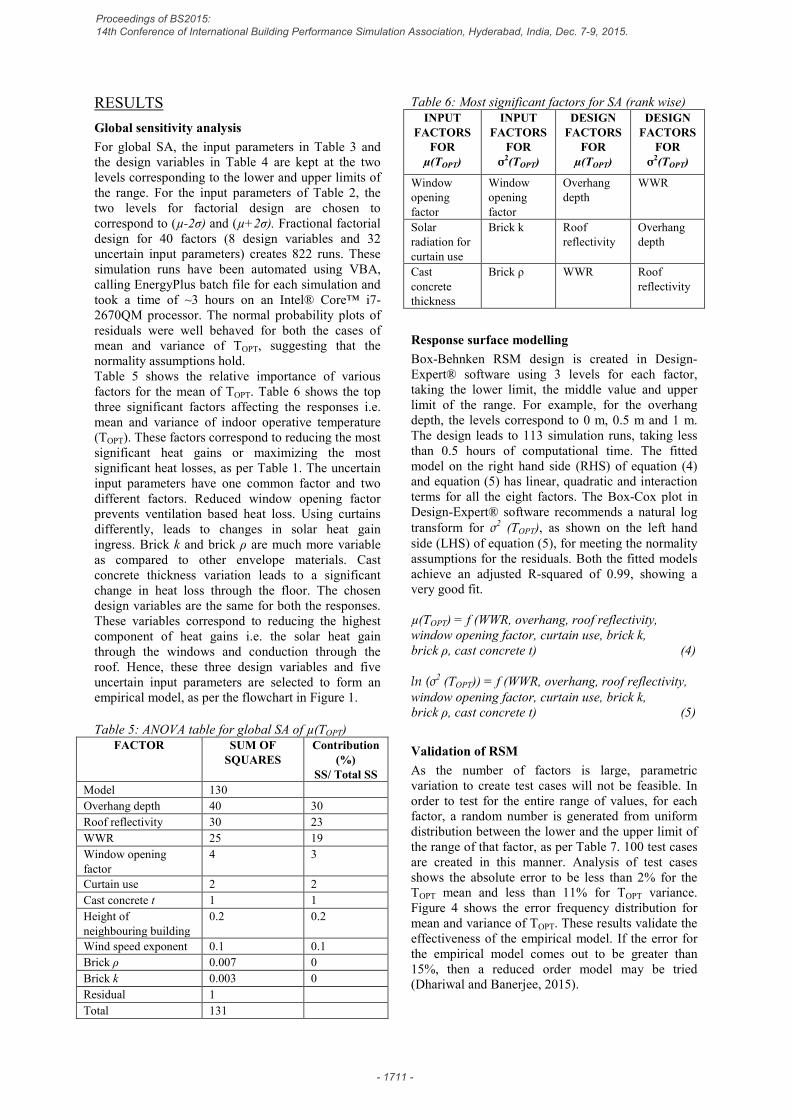
Validation of RSM As the number of factors is large, parametric variation to create test cases will not be feasible. In order to test for the entire range of values, for each factor, a random number is generated from uniform distribution between the lower and the upper limit of the range of that factor, as per Table 7. 100 test cases are created in this manner. Analysis of test cases shows the absolute error to be less than 2% for the TOPT mean and less than 11% for TOPT variance. Figure 4 shows the error frequency distribution for mean and variance of TOPT. These results validate the effectiveness of the empirical model. If the error for the empirical model comes out to be greater than 15%, then a reduced order model may be tried (Dhariwal and Banerjee, 2015).
Proceedings of BS2015: 14th Conference of International Building Performance Simulation Association, Hyderabad, India, Dec. 7-9, 2015.
- 1711 -
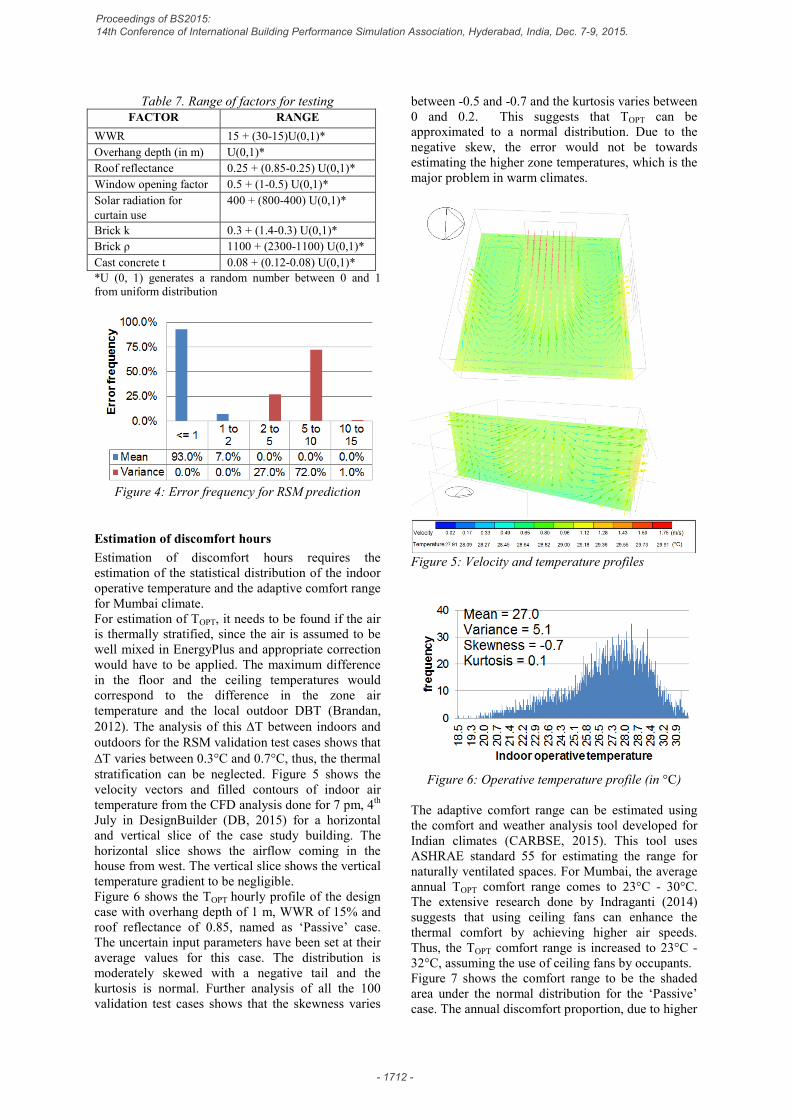
Table 7. Range of factors for testing FACTOR RANGE
WWR 15 + (30-15)U(0,1)* Overhang depth (in m) U(0,1)* Roof reflectance 0.25 + (0.85-0.25) U(0,1)* Window opening factor 0.5 + (1-0.5) U(0,1)* Solar radiation for curtain use
400 + (800-400) U(0,1)*
Brick k 0.3 + (1.4-0.3) U(0,1)* Brick ρ 1100 + (2300-1100) U(0,1)* Cast concrete t 0.08 + (0.12-0.08) U(0,1)* *U (0, 1) generates a random number between 0 and 1 from uniform distribution
Figure 4: Error frequency for RSM prediction
Estimation of discomfort hours Estimation of discomfort hours requires the estimation of the statistical distribution of the indoor operative temperature and the adaptive comfort range for Mumbai climate. For estimation of TOPT, it needs to be found if the air is thermally stratified, since the air is assumed to be well mixed in EnergyPlus and appropriate correction would have to be applied. The maximum difference in the floor and the ceiling temperatures would correspond to the difference in the zone air temperature and the local outdoor DBT (Brandan, 2012). The analysis of this ∆T between indoors and outdoors for the RSM validation test cases shows that ∆T varies between 0.3°C and 0.7°C, thus, the thermal stratification can be neglected. Figure 5 shows the velocity vectors and filled contours of indoor air temperature from the CFD analysis done for 7 pm, 4th July in DesignBuilder (DB, 2015) for a horizontal and vertical slice of the case study building. The horizontal slice shows the airflow coming in the house from west. The vertical slice shows the vertical temperature gradient to be negligible. Figure 6 shows the TOPT hourly profile of the design case with overhang depth of 1 m, WWR of 15% and roof reflectance of 0.85, named as ‘Passive’ case. The uncertain input parameters have been set at their average values for this case. The distribution is moderately skewed with a negative tail and the kurtosis is normal. Further analysis of all the 100 validation test cases shows that the skewness varies
between -0.5 and -0.7 and the kurtosis varies between 0 and 0.2. This suggests that TOPT can be approximated to a normal distribution. Due to the negative skew, the error would not be towards estimating the higher zone temperatures, which is the major problem in warm climates.
Figure 5: Velocity and temperature profiles
Figure 6: Operative temperature profile (in °C)
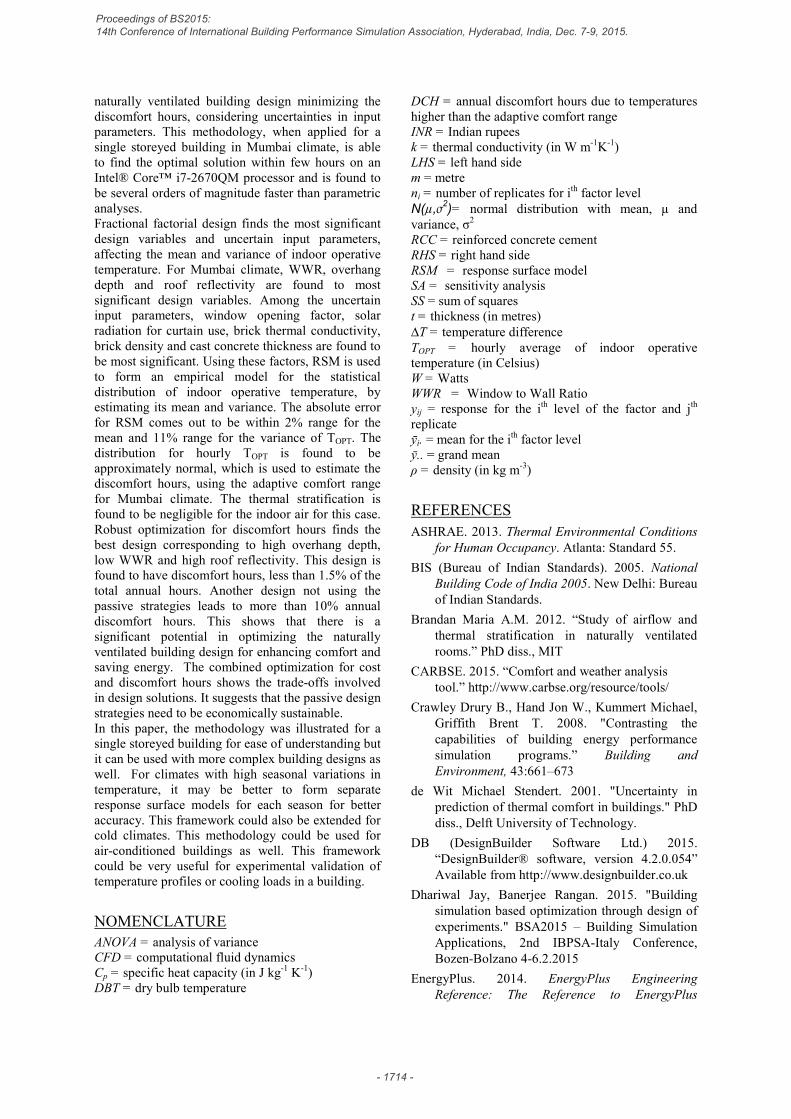
The adaptive comfort range can be estimated using the comfort and weather analysis tool developed for Indian climates (CARBSE, 2015). This tool uses ASHRAE standard 55 for estimating the range for naturally ventilated spaces. For Mumbai, the average annual TOPT comfort range comes to 23°C - 30°C. The extensive research done by Indraganti (2014) suggests that using ceiling fans can enhance the thermal comfort by achieving higher air speeds. Thus, the TOPT comfort range is increased to 23°C - 32°C, assuming the use of ceiling fans by occupants. Figure 7 shows the comfort range to be the shaded area under the normal distribution for the ‘Passive’ case. The annual discomfort proportion, due to higher
Proceedings of BS2015: 14th Conference of International Building Performance Simulation Association, Hyderabad, India, Dec. 7-9, 2015.
- 1712 -
temperatures, can be estimated by finding the unshaded area to the right of the shaded comfort range area and comes out to 1%. The corresponding annual discomfort hours in this case come out to 130 hours. The discomfort caused by cooler temperatures can be taken care by clothing adaptation and has not been considered in this analysis. Table 8 shows the annual predicted and simulated DCH for different design solutions and they are found to be close to each other.
Figure 7: Annual discomfort proportion
Table 8: Comparing predicted and simulated DCH
Design solution (Overhang, WWR, Roof reflectivity)
Predicted DCH from RSM
Simulated DCH
0 m, 30%, 0.25 860 731 1 m, 15%, 0.85 130 0
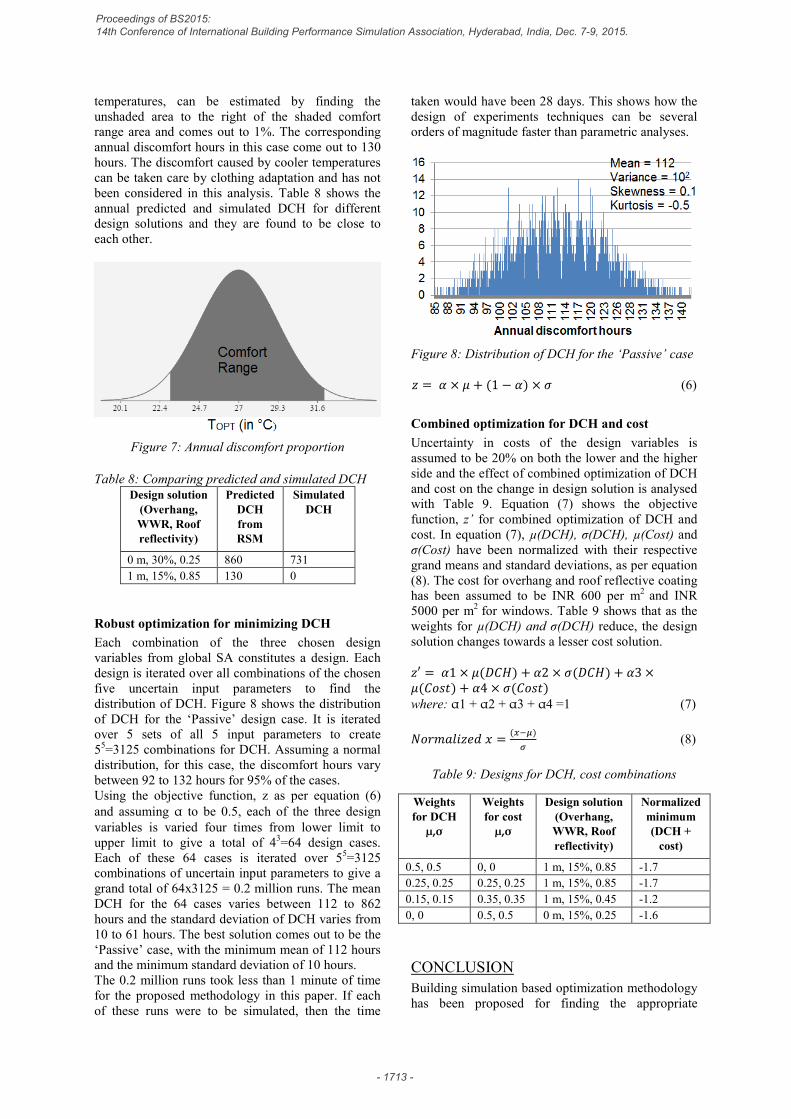
Robust optimization for minimizing DCH Each combination of the three chosen design variables from global SA constitutes a design. Each design is iterated over all combinations of the chosen five uncertain input parameters to find the distribution of DCH. Figure 8 shows the distribution of DCH for the ‘Passive’ design case. It is iterated over 5 sets of all 5 input parameters to create 55=3125 combinations for DCH. Assuming a normal distribution, for this case, the discomfort hours vary between 92 to 132 hours for 95% of the cases. Using the objective function, z as per equation (6) and assuming α to be 0.5, each of the three design variables is varied four times from lower limit to upper limit to give a total of 43=64 design cases. Each of these 64 cases is iterated over 55=3125 combinations of uncertain input parameters to give a grand total of 64x3125 = 0.2 million runs. The mean DCH for the 64 cases varies between 112 to 862 hours and the standard deviation of DCH varies from 10 to 61 hours. The best solution comes out to be the ‘Passive’ case, with the minimum mean of 112 hours and the minimum standard deviation of 10 hours. The 0.2 million runs took less than 1 minute of time for the proposed methodology in this paper. If each of these runs were to be simulated, then the time
taken would have been 28 days. This shows how the design of experiments techniques can be several orders of magnitude faster than parametric analyses.
Figure 8: Distribution of DCH for the ‘Passive’ case 𝑧𝑧 = 𝛼𝛼 × 𝜇𝜇 + (1 − 𝛼𝛼) × 𝜎𝜎 (6)
Combined optimization for DCH and cost Uncertainty in costs of the design variables is assumed to be 20% on both the lower and the higher side and the effect of combined optimization of DCH and cost on the change in design solution is analysed with Table 9. Equation (7) shows the objective function, z’ for combined optimization of DCH and cost. In equation (7), µ(DCH), σ(DCH), µ(Cost) and σ(Cost) have been normalized with their respective grand means and standard deviations, as per equation (8). The cost for overhang and roof reflective coating has been assumed to be INR 600 per m2 and INR 5000 per m2 for windows. Table 9 shows that as the weights for µ(DCH) and σ(DCH) reduce, the design solution changes towards a lesser cost solution. 𝑧𝑧′ = 𝛼𝛼1 × 𝜇𝜇(𝐷𝐷𝐷𝐷𝐻𝐻) + 𝛼𝛼2 × 𝜎𝜎(𝐷𝐷𝐷𝐷𝐻𝐻) + 𝛼𝛼3 ×𝜇𝜇(𝐷𝐷𝐶𝐶𝐶𝐶𝐶𝐶) + 𝛼𝛼4 × 𝜎𝜎(𝐷𝐷𝐶𝐶𝐶𝐶𝐶𝐶) where: α1 + α2 + α3 + α4 =1 (7) 𝑁𝑁𝐶𝐶𝑁𝑁𝑁𝑁𝑁𝑁𝑁𝑁𝑁𝑁𝑧𝑧𝑁𝑁𝑁𝑁 𝑥𝑥 = (𝑥𝑥−𝜇𝜇)
𝜎𝜎 (8)
Table 9: Designs for DCH, cost combinations
Weights for DCH µ,σ
Weights for cost µ,σ
Design solution (Overhang, WWR, Roof reflectivity)
Normalized minimum (DCH +
cost)
0.5, 0.5 0, 0 1 m, 15%, 0.85 -1.7 0.25, 0.25 0.25, 0.25 1 m, 15%, 0.85 -1.7 0.15, 0.15 0.35, 0.35 1 m, 15%, 0.45 -1.2 0, 0 0.5, 0.5 0 m, 15%, 0.25 -1.6
CONCLUSION Building simulation based optimization methodology has been proposed for finding the appropriate
Proceedings of BS2015: 14th Conference of International Building Performance Simulation Association, Hyderabad, India, Dec. 7-9, 2015.
- 1713 -
naturally ventilated building design minimizing the discomfort hours, considering uncertainties in input parameters. This methodology, when applied for a single storeyed building in Mumbai climate, is able to find the optimal solution within few hours on an Intel® Core™ i7-2670QM processor and is found to be several orders of magnitude faster than parametric analyses. Fractional factorial design finds the most significant design variables and uncertain input parameters, affecting the mean and variance of indoor operative temperature. For Mumbai climate, WWR, overhang depth and roof reflectivity are found to most significant design variables. Among the uncertain input parameters, window opening factor, solar radiation for curtain use, brick thermal conductivity, brick density and cast concrete thickness are found to be most significant. Using these factors, RSM is used to form an empirical model for the statistical distribution of indoor operative temperature, by estimating its mean and variance. The absolute error for RSM comes out to be within 2% range for the mean and 11% range for the variance of TOPT. The distribution for hourly TOPT is found to be approximately normal, which is used to estimate the discomfort hours, using the adaptive comfort range for Mumbai climate. The thermal stratification is found to be negligible for the indoor air for this case. Robust optimization for discomfort hours finds the best design corresponding to high overhang depth, low WWR and high roof reflectivity. This design is found to have discomfort hours, less than 1.5% of the total annual hours. Another design not using the passive strategies leads to more than 10% annual discomfort hours. This shows that there is a significant potential in optimizing the naturally ventilated building design for enhancing comfort and saving energy. The combined optimization for cost and discomfort hours shows the trade-offs involved in design solutions. It suggests that the passive design strategies need to be economically sustainable. In this paper, the methodology was illustrated for a single storeyed building for ease of understanding but it can be used with more complex building designs as well. For climates with high seasonal variations in temperature, it may be better to form separate response surface models for each season for better accuracy. This framework could also be extended for cold climates. This methodology could be used for air-conditioned buildings as well. This framework could be very useful for experimental validation of temperature profiles or cooling loads in a building.
NOMENCLATURE ANOVA = analysis of variance CFD = computational fluid dynamics Cp = specific heat capacity (in J kg-1 K-1) DBT = dry bulb temperature
DCH = annual discomfort hours due to temperatures higher than the adaptive comfort range INR = Indian rupees k = thermal conductivity (in W m-1K-1) LHS = left hand side m = metre ni = number of replicates for ith factor level N(µ,σ2)= normal distribution with mean, µ and variance, σ2 RCC = reinforced concrete cement RHS = right hand side RSM = response surface model SA = sensitivity analysis SS = sum of squares t = thickness (in metres) ∆T = temperature difference TOPT = hourly average of indoor operative temperature (in Celsius) W = Watts WWR = Window to Wall Ratio yij = response for the ith level of the factor and jth replicate ȳi. = mean for the ith factor level ȳ.. = grand mean ρ = density (in kg m-3)
REFERENCES ASHRAE. 2013. Thermal Environmental Conditions
for Human Occupancy. Atlanta: Standard 55. BIS (Bureau of Indian Standards). 2005. National
Building Code of India 2005. New Delhi: Bureau of Indian Standards.
Brandan Maria A.M. 2012. “Study of airflow and thermal stratification in naturally ventilated rooms.” PhD diss., MIT
CARBSE. 2015. “Comfort and weather analysis tool.” http://www.carbse.org/resource/tools/
Crawley Drury B., Hand Jon W., Kummert Michael, Griffith Brent T. 2008. "Contrasting the capabilities of building energy performance simulation programs.” Building and Environment, 43:661–673
de Wit Michael Stendert. 2001. "Uncertainty in prediction of thermal comfort in buildings." PhD diss., Delft University of Technology.
DB (DesignBuilder Software Ltd.) 2015. “DesignBuilder® software, version 4.2.0.054” Available from http://www.designbuilder.co.uk
Dhariwal Jay, Banerjee Rangan. 2015. "Building simulation based optimization through design of experiments." BSA2015 – Building Simulation Applications, 2nd IBPSA-Italy Conference, Bozen-Bolzano 4-6.2.2015
EnergyPlus. 2014. EnergyPlus Engineering Reference: The Reference to EnergyPlus
Proceedings of BS2015: 14th Conference of International Building Performance Simulation Association, Hyderabad, India, Dec. 7-9, 2015.
- 1714 -
Calculations. US Department of Energy. http://www.energyplus.gov
Foldbjerg P, Asmussen T, Holzer P. 2014. "Ventilative cooling of residential buildings - strategies, measurement results and lessons learned from three active houses in Austria, Germany and Denmark" International Journal of Ventilation, 13(2): 179-192
Gu Lixing. 2007. "Airflow Network Modeling in EnergyPlus” 10th International Building Performance Simulation Association Conference and Exhibition, September 3-6, 2007 in Beijing, China
Hopfe Christina J., Hensen Jan L.M. 2011. "Uncertainty analysis in building performance simulation for design support." Energy and Buildings 43:2798-2805
IGBC (Indian Green Building Council). 2011. Green Building Rating System for New Construction and Major Renovations, LEED 2011 for India. Hyderabad: IGBC.
Indraganti Madhavi, Ooka Ryozo, Rijal Hom B., Brager Gail S. 2014. “Adaptive model of thermal comfort for offices in hot and humid climates of India.” Building and Environment 74:39-53
Jain Vaibhav, Garg Vishal, Mathur Jyotirmay, Dhaka Shivraj. 2011. “Effect of operative temperature based thermostat control as compared to air temperature based control on energy consumption in highly glazed buildings.” Proceedings of Building Simulation 2011: 12th Conference of International Building Performance Simulation Association, Sydney, 14-16 November.
Manu Sanyogita, Shukla Yash, Rawal Rajan, de Dear Richard, Thomas Leena. 2014. India Model for Adaptive (thermal) Comfort-IMAC 2014. Ahmedabad:CARBSE http://www.carbse.org/wp-content/uploads/2014/09/Introduction_IMAC2014.pdf
Montgomery D.C. (2004) 2007. Design and Analysis of Experiments. Reprint, New Delhi: Wiley India Edition.
Nayak J.K., Prajapati J.A. 2006. Handbook on Energy Conscious Buildings. IIT Bombay and Solar Energy Centre, Ministry of Non-conventional Energy Sources, Governmentt of India: R & D project no. 3/4(03)/99-SEC.
Nguyen A., Reiter S., Rigo P. 2014. “A review on simulation-based optimization methods applied to building performance analysis” Applied Energy 113: 1043–1058
Phadke Amol, Abhyankar Nikit, Shah Nihar. 2014. Avoiding 100 new power plants by increasing efficiency of room air conditioners in India: Opportunities and challenges. LBNL-6674E
Ramesh T., Prakash R., Shukla K.K. 2012. “Life cycle energy analysis of a residential building with different envelopes and climates in Indian context” Applied Energy 89(1): 193–202
SDE (Solar Decathlon Europe). 2014. Documentation. Versailles: Solar Decathlon Europe. http://www.solardecathlon2014.fr/ftp/docs/SHU_PM7.pdf
SSEF (Shakti Sustainable Energy Foundation). 2014. “Cool Roofs for Cool Delhi.” http://shaktifoundation.in/initiative/cool-roofs-for-cool-delhi/
Stat-Ease, Inc., MN, USA. 2014. “Design-Expert® software, version 9.” Available from http://www.statease.com
Sun Y., Heo Y., Tan M., Xie h., Wu C.F. Jeff, Augenbroe Godfried. 2014. “Uncertainty quantification of microclimate variables in building energy models.” Journal of Building Performance Simulation 7(1):17-3
Proceedings of BS2015: 14th Conference of International Building Performance Simulation Association, Hyderabad, India, Dec. 7-9, 2015.
- 1715 -