Embed Size (px)
Citation preview
Wrap up of Topic #12 O Ci l ti on Ocean Circulation
67 i Cl N t
TOPIC #13
pp 67 in Class Notes
TOPIC #13
NATURAL CLIMATIC NATURA C IMATIC FORCING
(& Short-Term Climatic Variability)
pp 69-74 in Class Notes
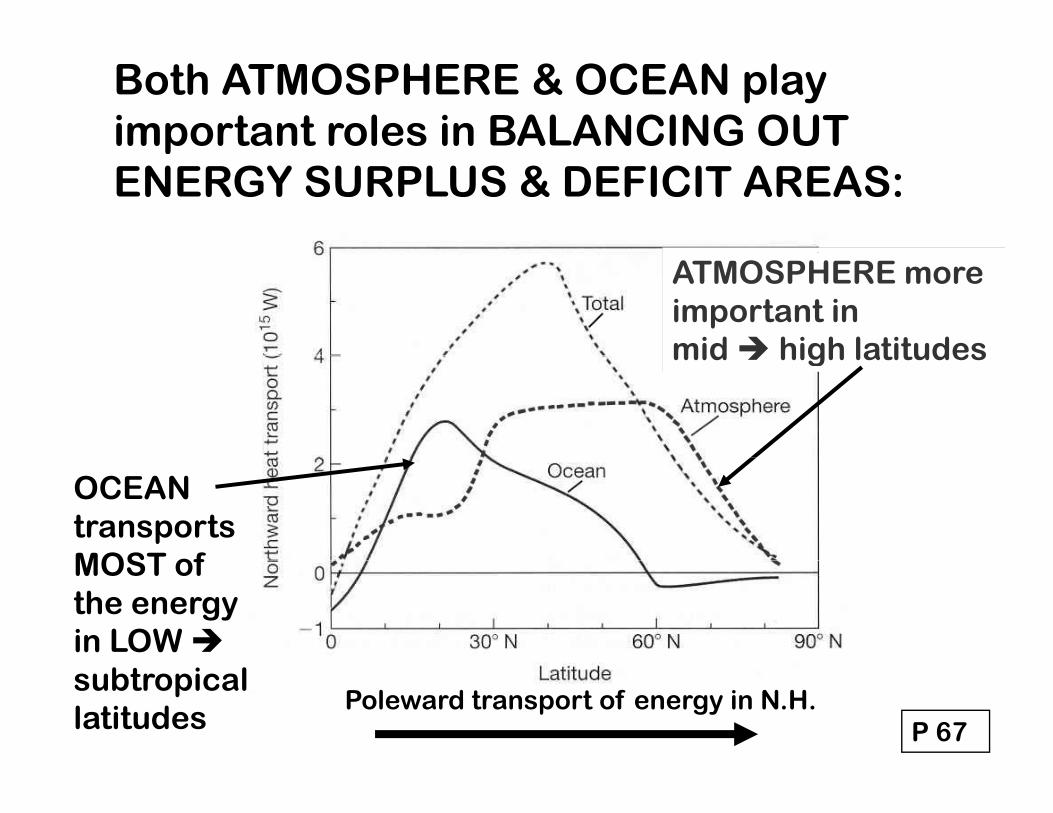
Both ATMOSPHERE & OCEAN play important roles in BALANCING OUT pENERGY SURPLUS & DEFICIT AREAS:
ATMOSPHERE more important in mid high latitudesmid high latitudes
OCEAN transports MOST of MOST of the energy in LOW
P 67
subtropical latitudes
Poleward transport of energy in N.H.

Large OCEAN GYRES = WIND DRIVEN
Trade Winds & Westerlies in Oceanic Subtropical HIGH PRESSURE CELLS (STH)
STH
STH
Winds drive SURFACE ocean currents p 66
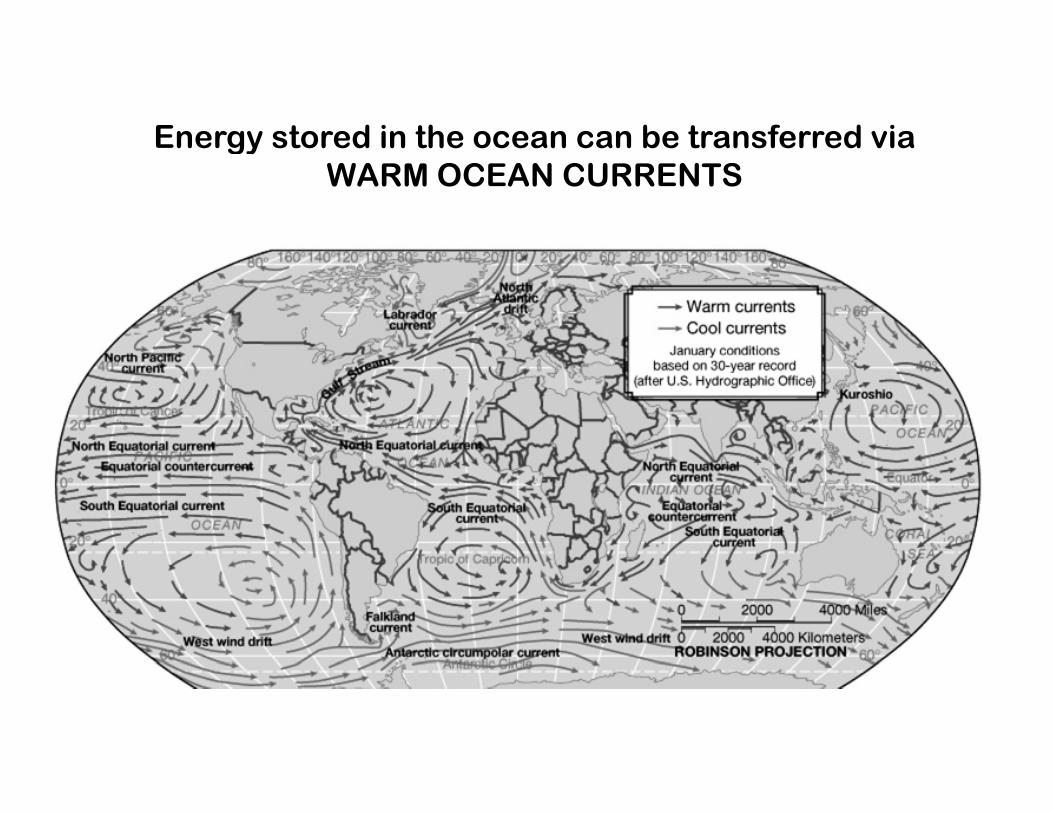
Energy stored in the ocean can be transferred via gyWARM OCEAN CURRENTS

WARM & COLD SURFACE OCEAN CURRENTS:
p 66
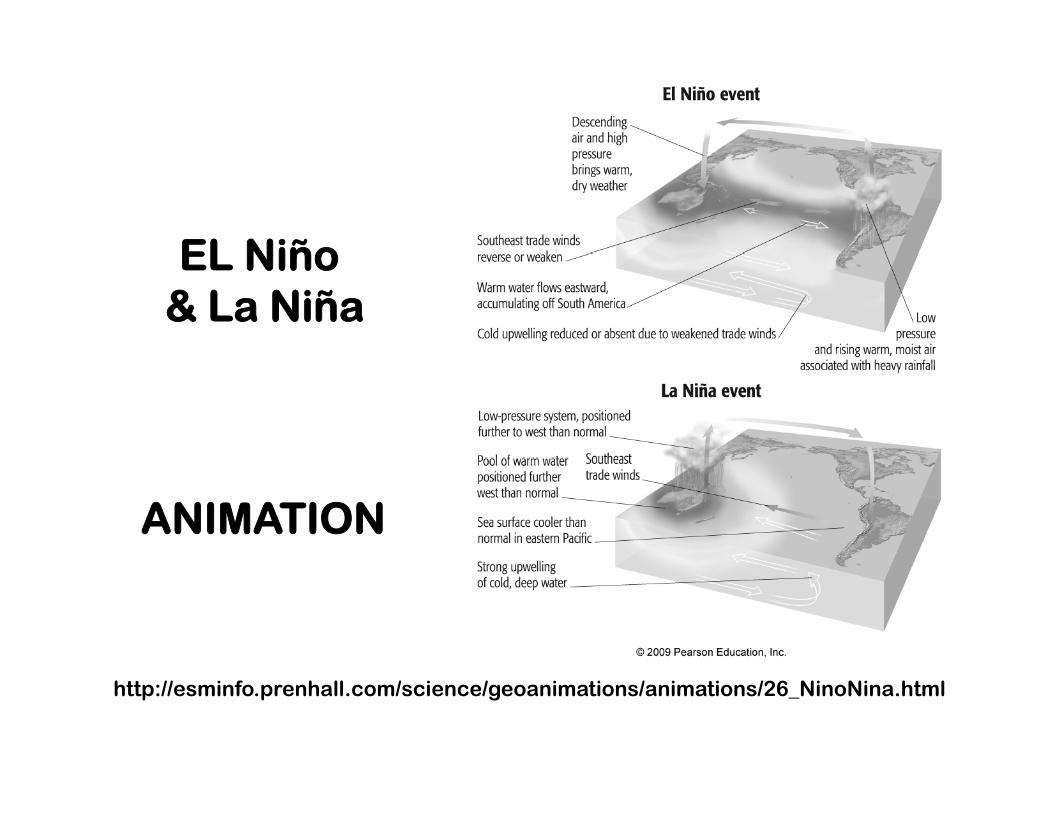
EL NiñoEL Niño& La Niña
ANIMATION
http://esminfo.prenhall.com/science/geoanimations/animations/26_NinoNina.html
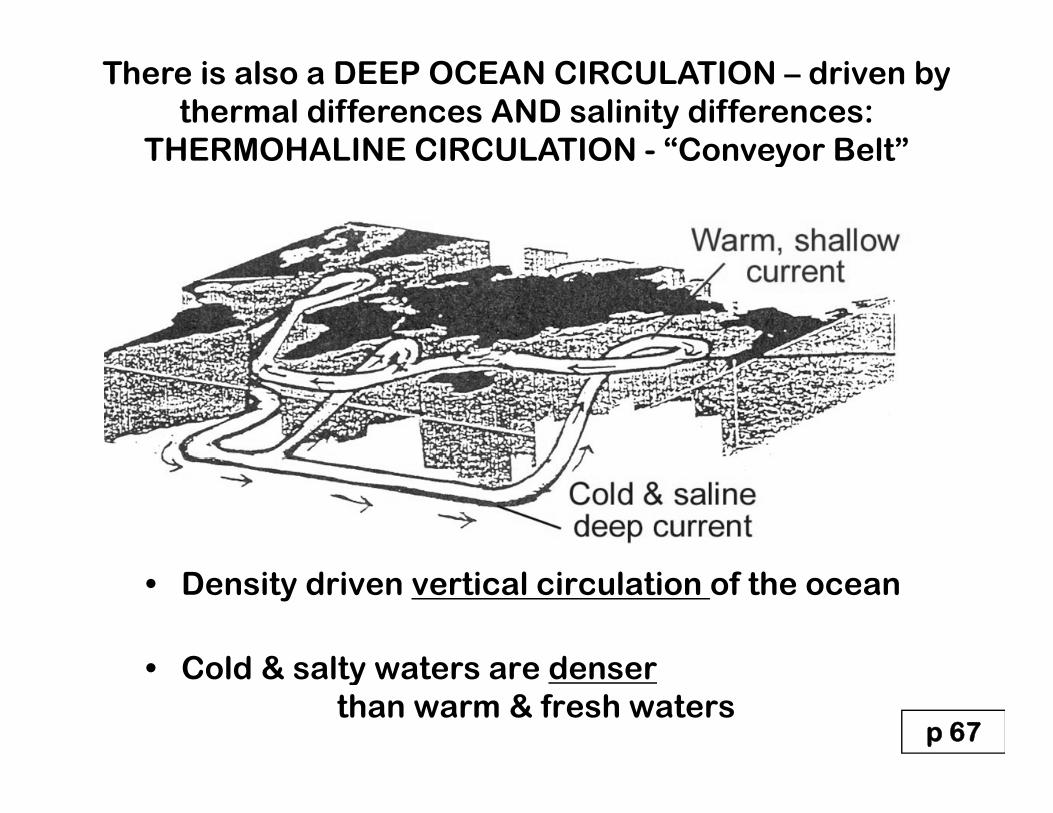
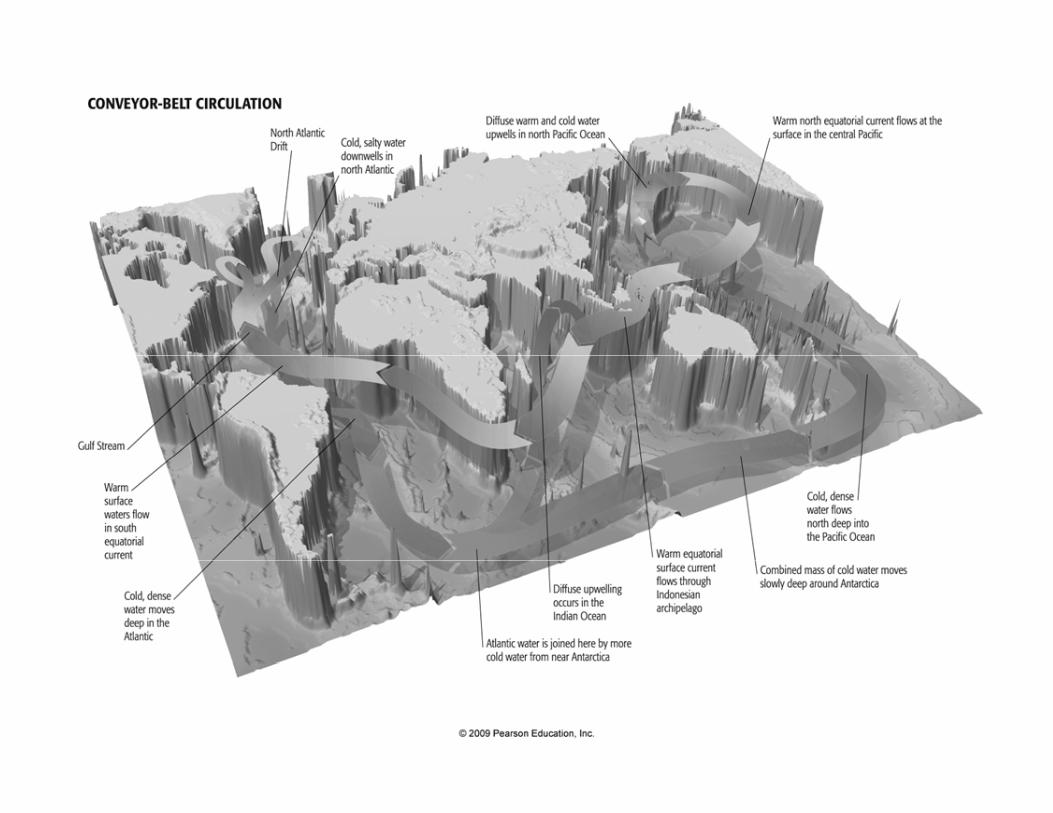
There is also a DEEP OCEAN CIRCULATION – driven by thermal differences AND salinity differences:
THERMOHALINE CIRCULATION “Conveyor Belt”THERMOHALINE CIRCULATION - Conveyor Belt
• Density driven vertical circulation of the ocean
• Cold & salty waters are denser
p 67
• Cold & salty waters are denserthan warm & fresh waters
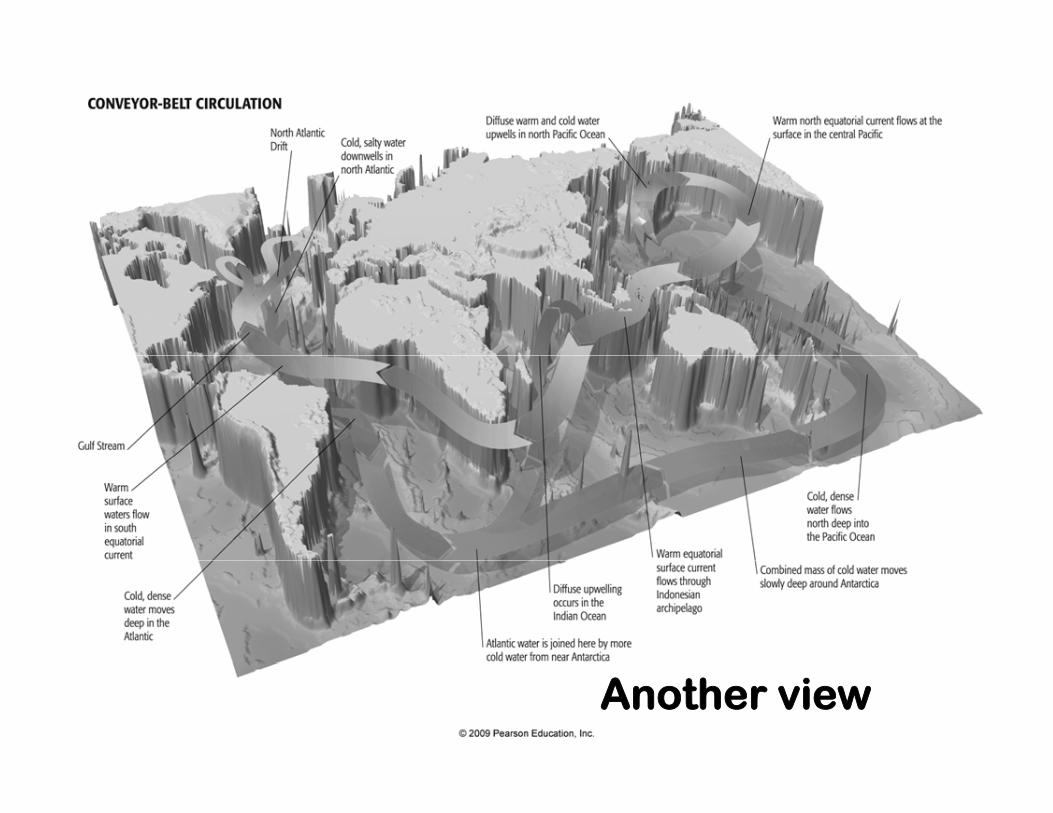
Another view
TOPIC #13TOPIC #13
NATURAL CLIMATIC FORCING
(& Short-Term Climatic Variability)
pp 69-74 in Class Notes
All things are connected. All things are connected. Whatever befalls the earth, befalls the children of the befalls the children of the earth.
~ Chief Seattle
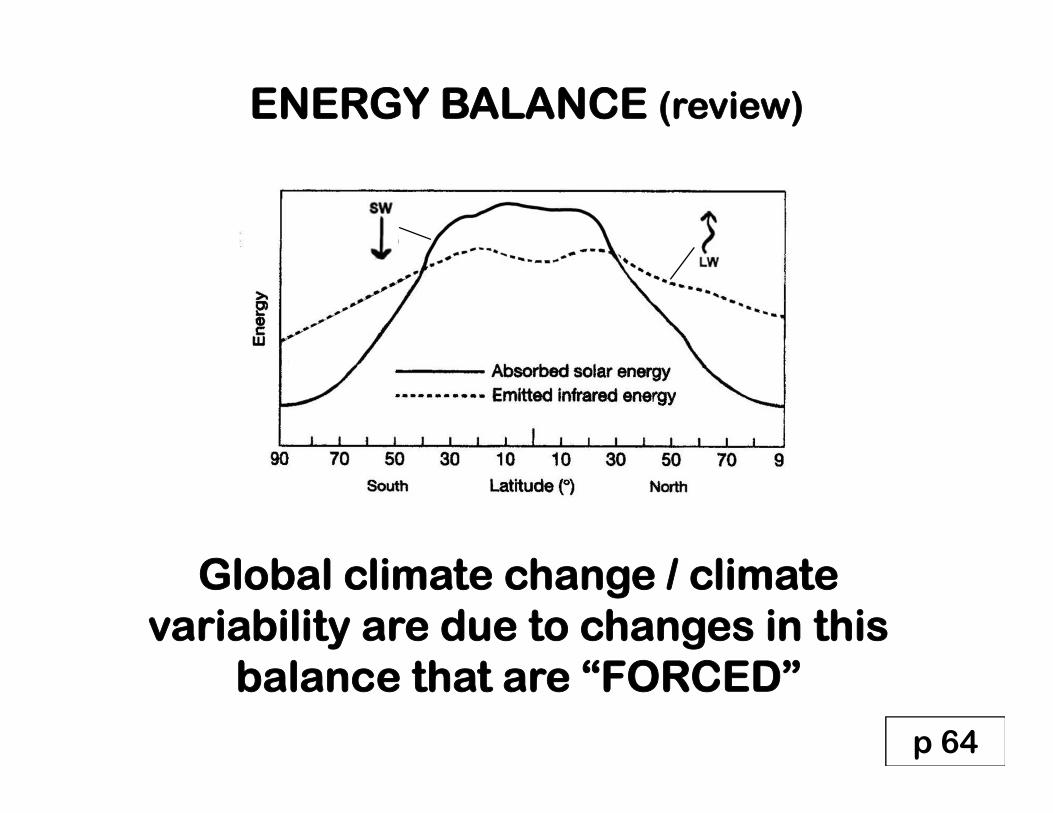
ENERGY BALANCE (review)
Gl b l li t h / li t Global climate change / climate variability are due to changes in this
b l th t “FORCED”balance that are “FORCED”
p 64
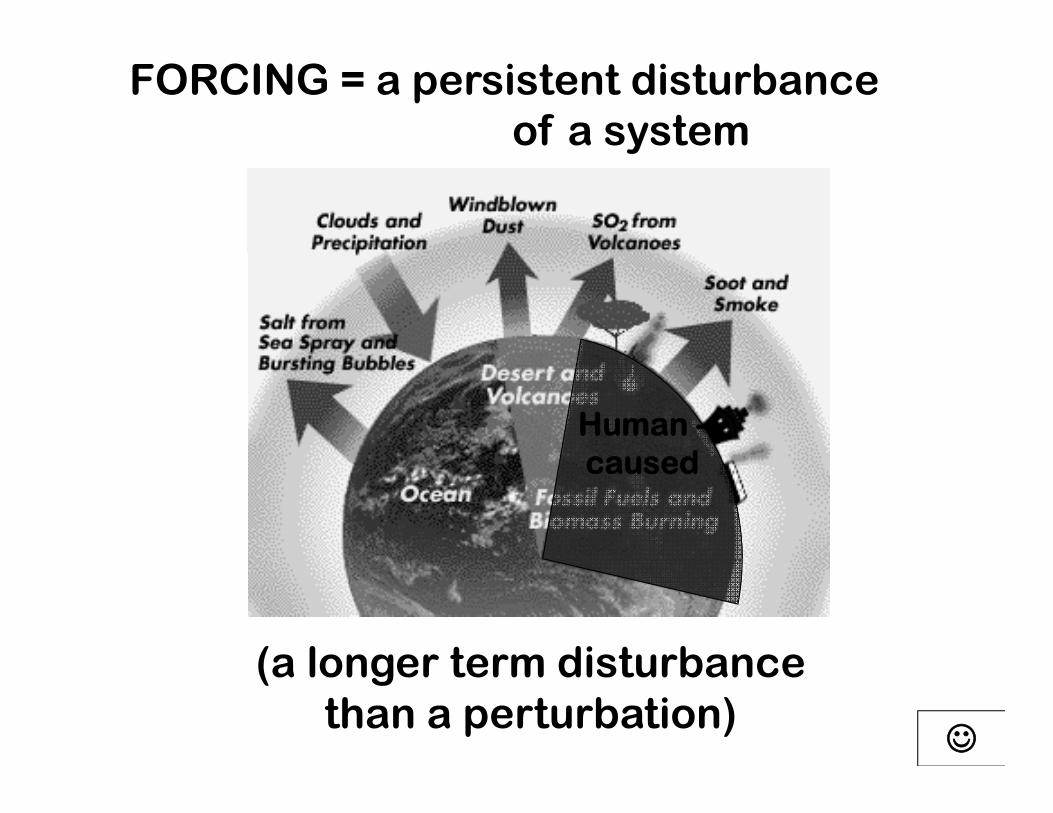
FORCING = a persistent disturbance of a system y
Human -causedcaused
(a longer term disturbance (a longer term disturbance than a perturbation)
NATURAL CLIMATIC FORCING
Earth Sun orbital relationships Earth-Sun orbital relationships, internal atmosphere-ocean variability,
solar variability, volcanic eruptions, etc. solar variability, volcanic eruptions, etc.
vs.
ANTHROPOGENICANTHROPOGENICFORCING FORCING
Human-Enhanced GH Effect, due to fossil fuel burning land use change soot & fuel burning, land use change, soot &
aerosols from industry
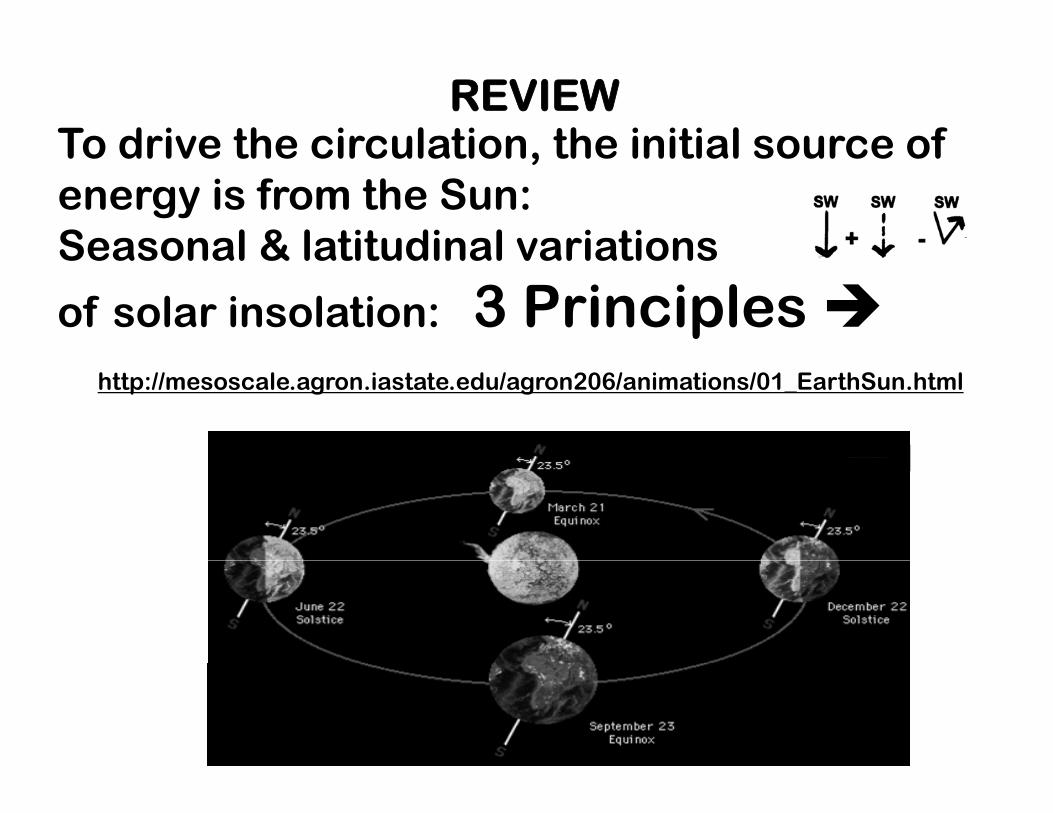
To drive the circulation the initial source of REVIEW
To drive the circulation, the initial source of energy is from the Sun:Seasonal & latitudinal variations Seasonal & latitudinal variations
of solar insolation: 3 Principles http://mesoscale.agron.iastate.edu/agron206/animations/01_EarthSun.html
Not to scale!
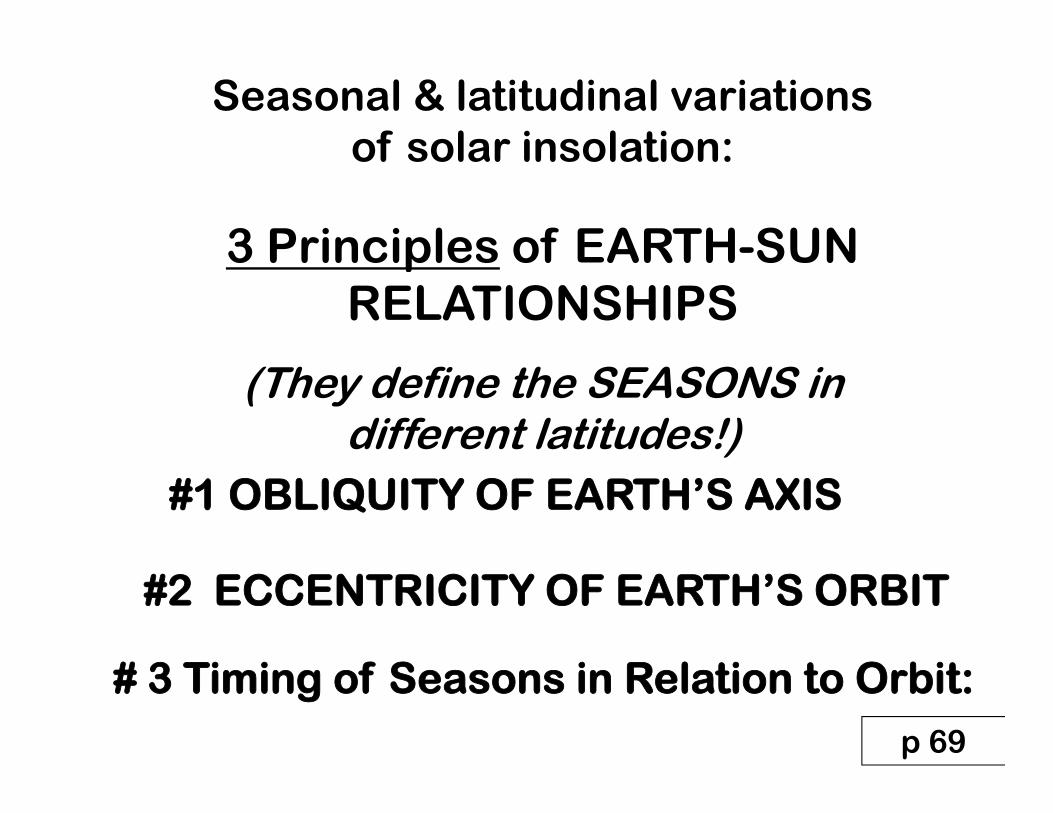
Seasonal & latitudinal variations of solar insolation: of solar insolation:
3 Principles of EARTH-SUN 3 Principles of EARTH SUN RELATIONSHIPS
(They define the SEASONS in different latitudes!)
#1 OBLIQUITY OF EARTH’S AXIS
#2 ECCENTRICITY OF EARTH’S ORBIT
# 3 Ti i f S i R l ti t O bit# 3 Timing of Seasons in Relation to Orbit:p 69
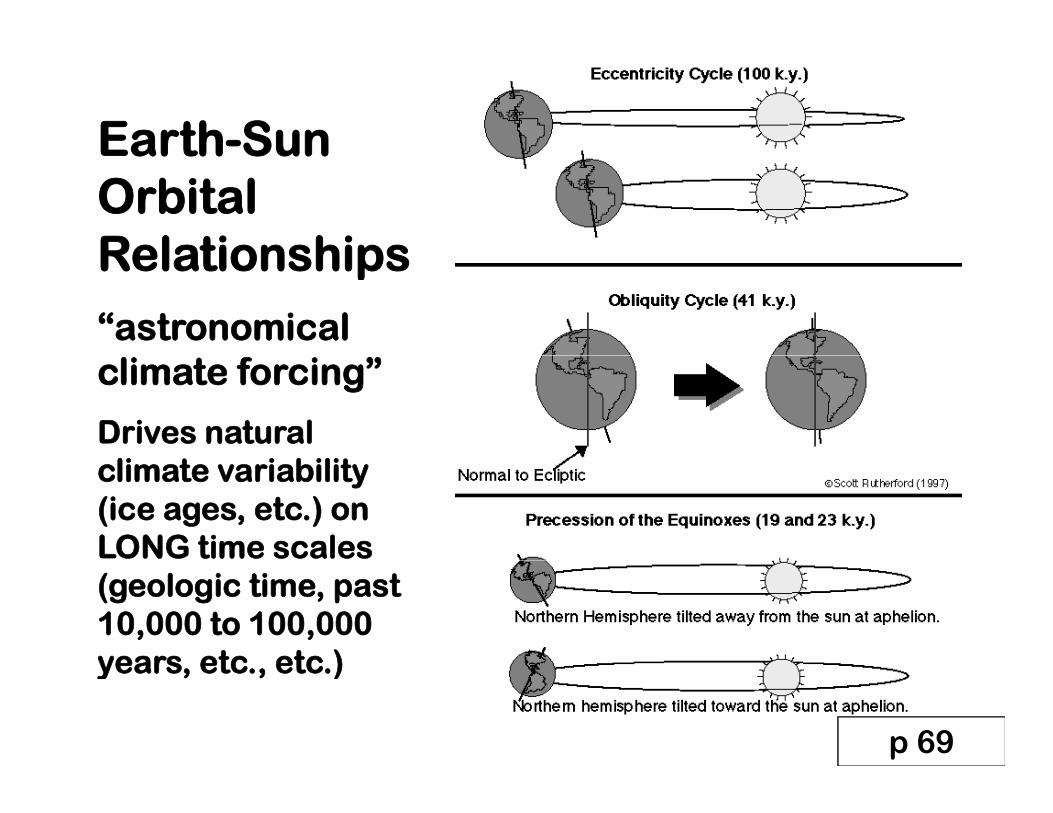
Earth-Sun Earth Sun Orbital RelationshipsRelationships
“astronomical climate forcing”
Drives natural climate variability (ice ages, etc.) on LONG time scales (geologic time, past 10,000 to 100,000 years etc etc ) years, etc., etc.)
p 69
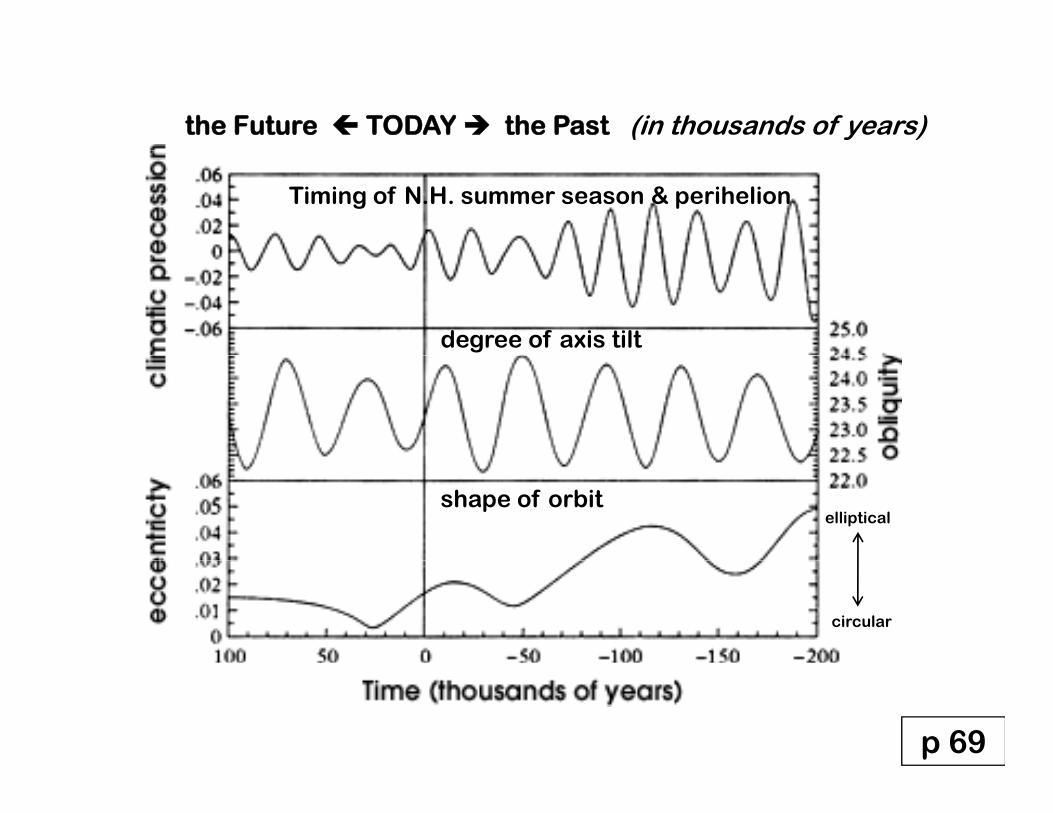
the Future TODAY the Past (in thousands of years)
Timing of N.H. summer season & perihelion
degree of axis tilt
shape of orbitelliptical
circular
p 69
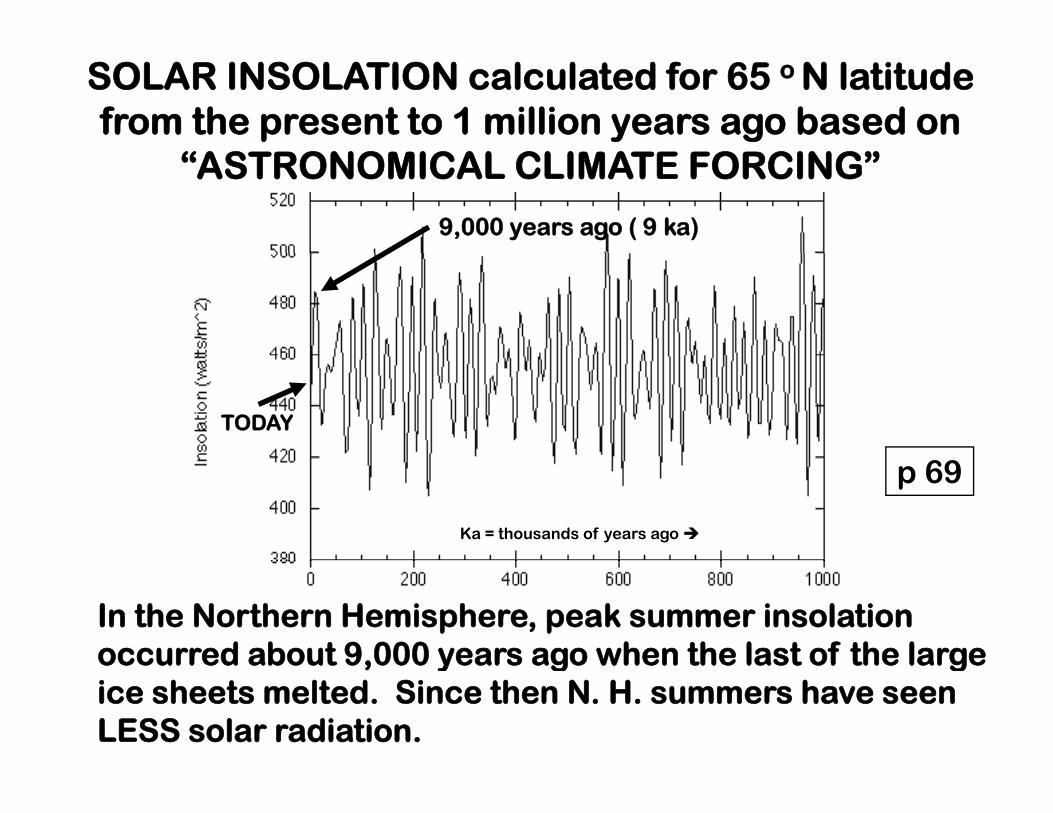
SOLAR INSOLATION calculated for 65 o N latitude from the present to 1 million years ago based on
“ASTRONOMICAL CLIMATE FORCING”
9,000 years ago ( 9 ka)
TODAY
Ka = thousands of years ago
p 69
In the Northern Hemisphere, peak summer insolation occurred about 9,000 years ago when the last of the large occurred about 9,000 years ago when the last of the large ice sheets melted. Since then N. H. summers have seen LESS solar radiation.
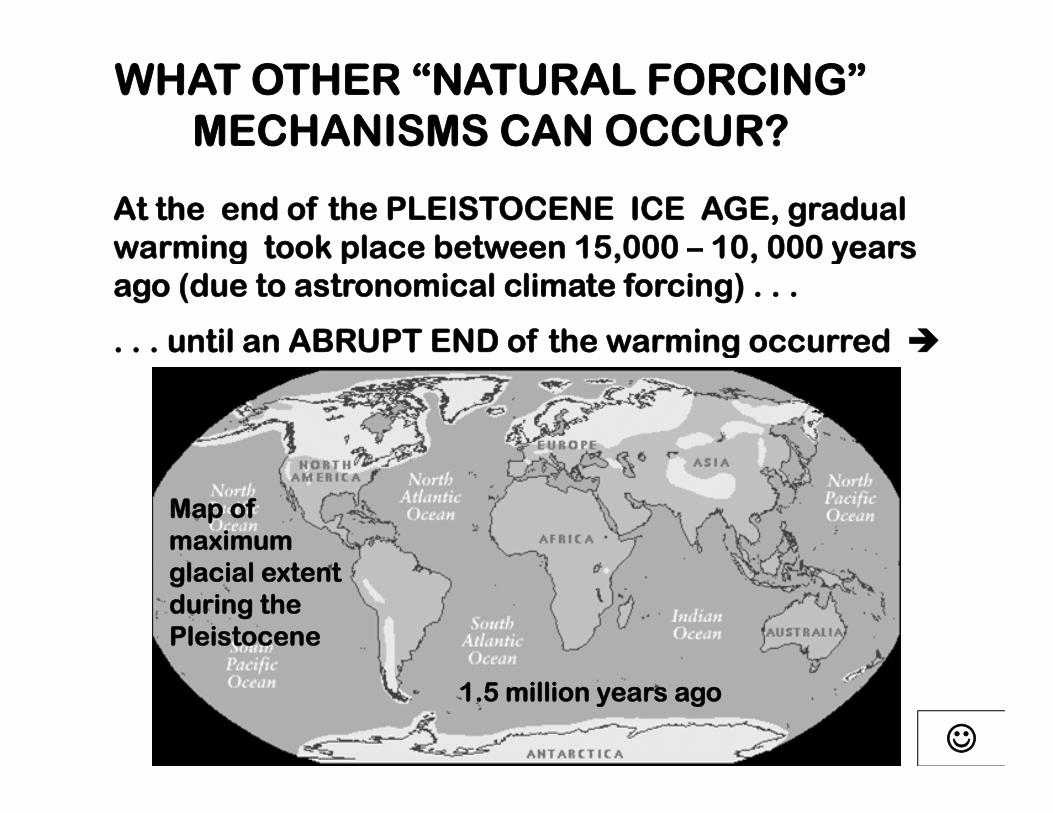
WHAT OTHER “NATURAL FORCING” MECHANISMS CAN OCCUR?
At the end of the PLEISTOCENE ICE AGE, gradual warming took place between 15 000 – 10 000 years warming took place between 15,000 10, 000 years ago (due to astronomical climate forcing) . . .
. . . until an ABRUPT END of the warming occurred g
Map of maximumglacial extent during the Pleistocene
1.5 million years ago
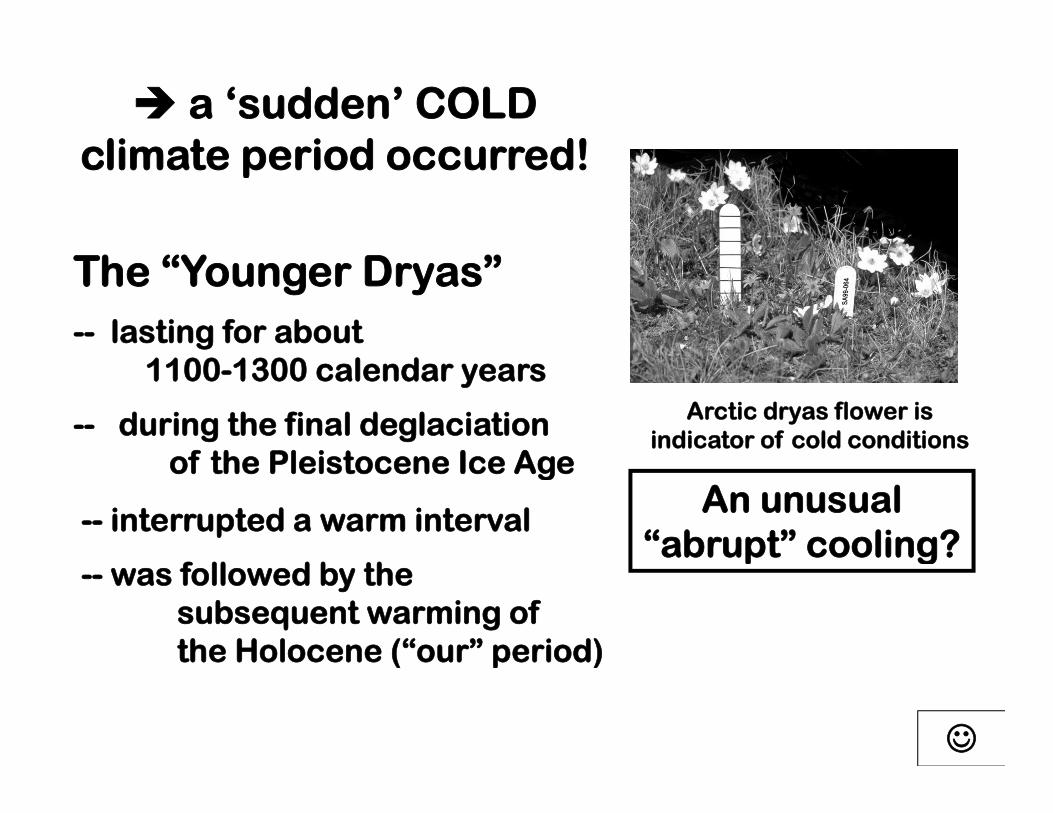
a ‘sudden’ COLD climate period occurred! Named after the
Arctic dryas flower
climate period occurred!
The “Younger Dryas”-- lasting for about
1100-1300 calendar years
-- during the final deglaciation of the Pleistocene Ice Age
Arctic dryas flower is indicator of cold conditions
of the Pleistocene Ice Age An unusual
“abrupt” cooling?-- interrupted a warm interval
p g-- was followed by the
subsequent warming ofthe Holocene (“our” period)
( p )
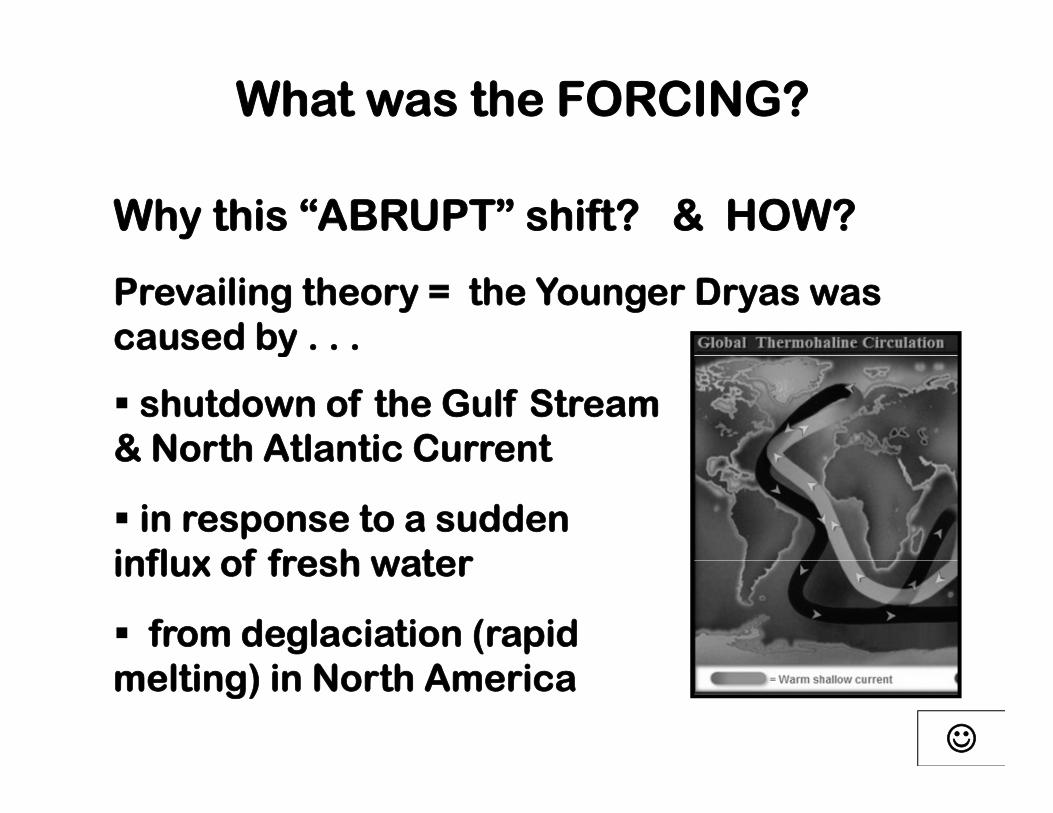
What was the FORCING?
Why this “ABRUPT” shift? & HOW?
Prevailing theory = the Younger Dryas was caused by . . . y
shutdown of the Gulf Stream & North Atlantic Current& North Atlantic Current
in response to a suddeninflux of fresh water influx of fresh water
from deglaciation (rapid
melting) in North America
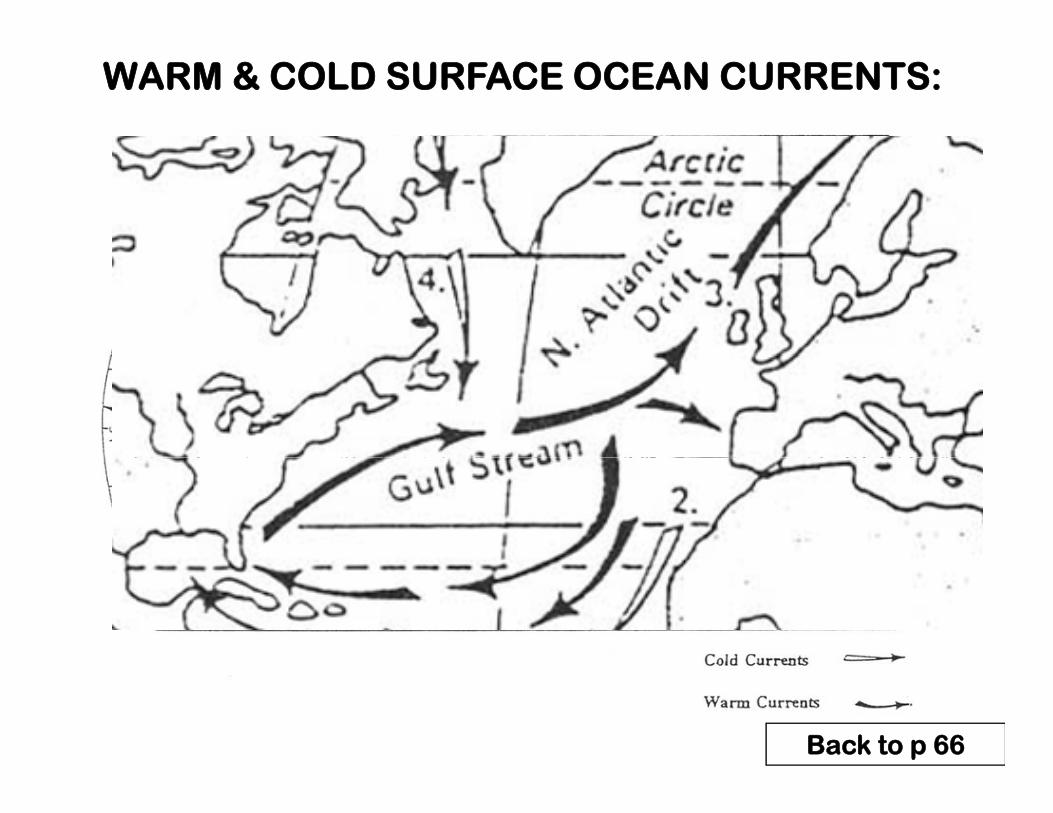
WARM & COLD SURFACE OCEAN CURRENTS:
Back to p 66
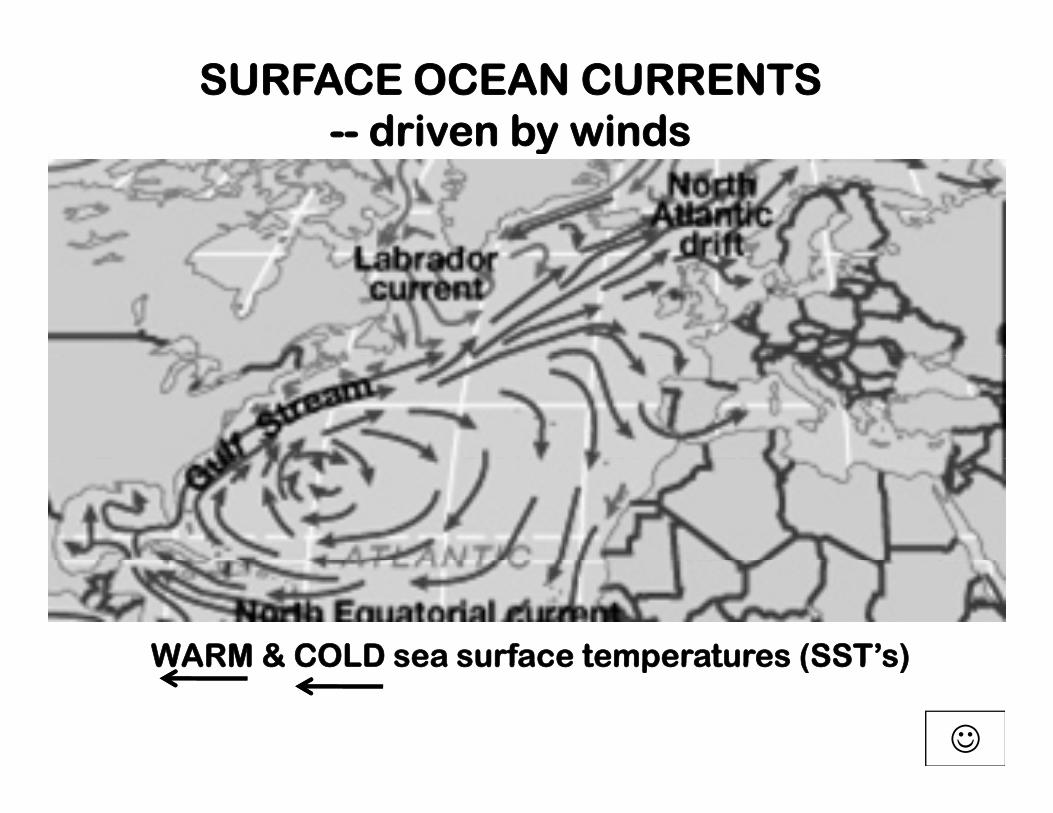
SURFACE OCEAN CURRENTS-- driven by windsy
WARM & COLD sea surface temperatures (SST’s)WARM & COLD sea surface temperatures (SST s)
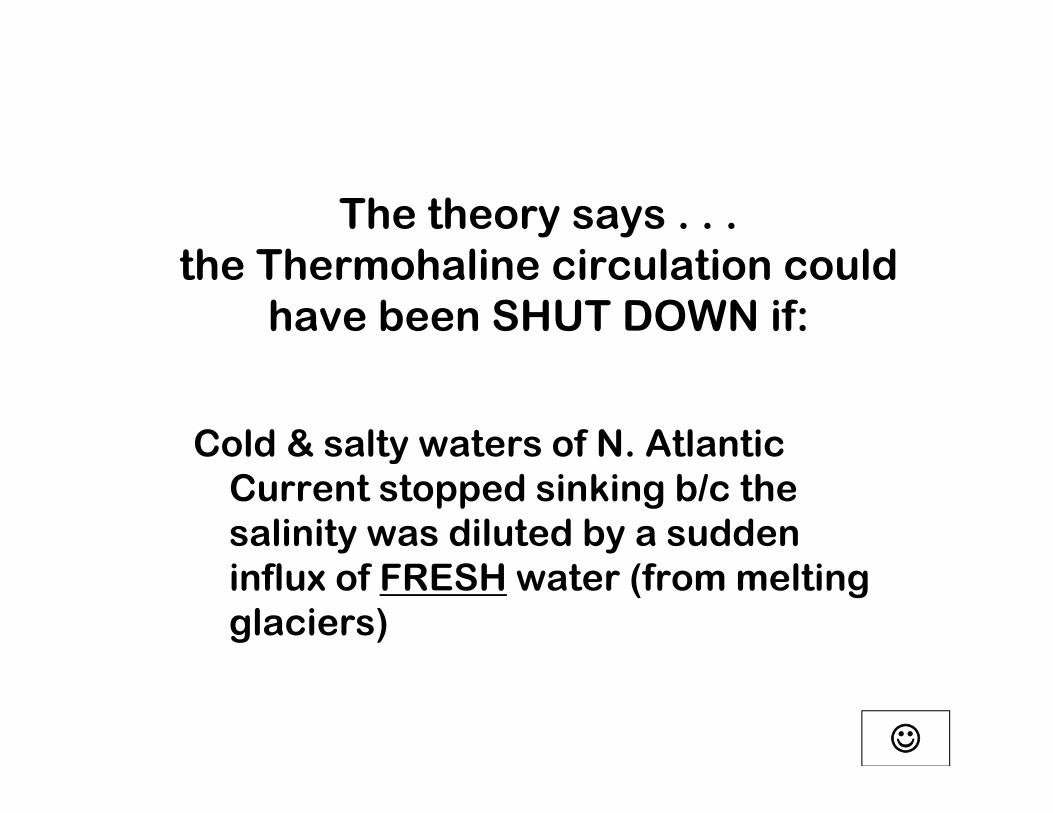
The theory says . . .th Th h li i l ti ld the Thermohaline circulation could
have been SHUT DOWN if:
Cold & salty waters of N. Atlantic yCurrent stopped sinking b/c the salinity was diluted by a sudden influx of FRESH water (from melting glaciers)
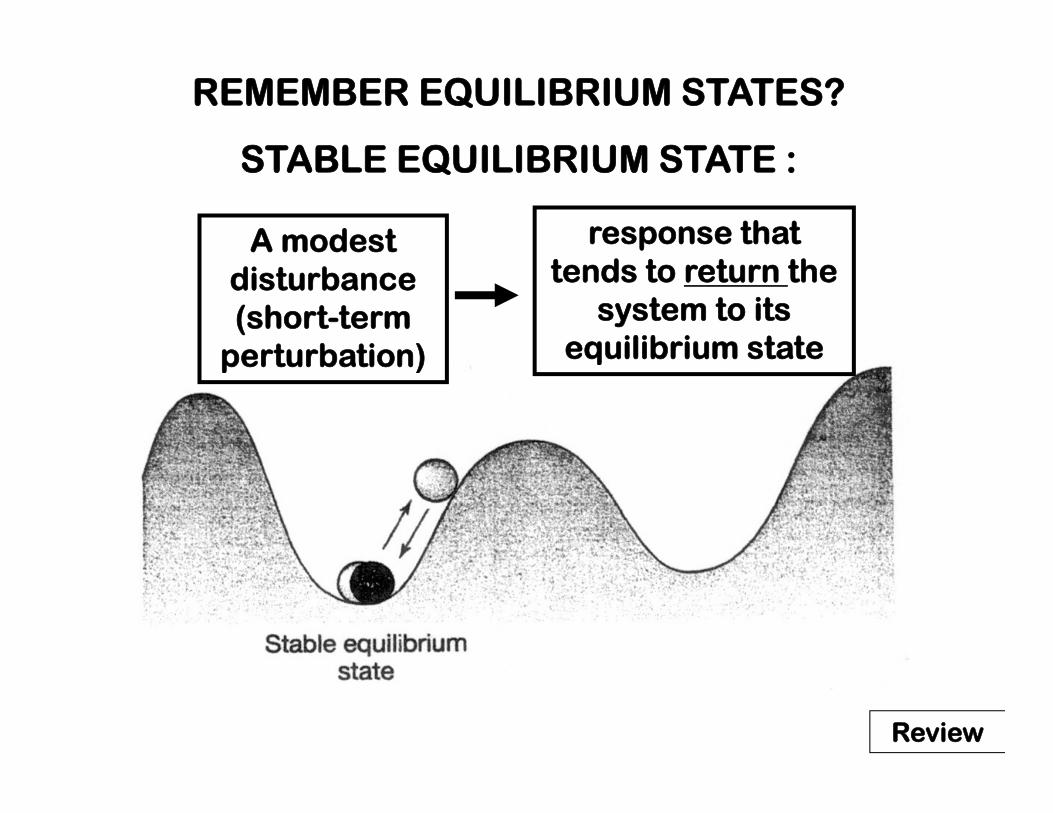
REMEMBER EQUILIBRIUM STATES?
STABLE EQUILIBRIUM STATESTABLE EQUILIBRIUM STATE :
A modest response that
disturbance (short-term
perturbation)
tends to return the system to its
equilibrium stateperturbation) equilibrium state
Review
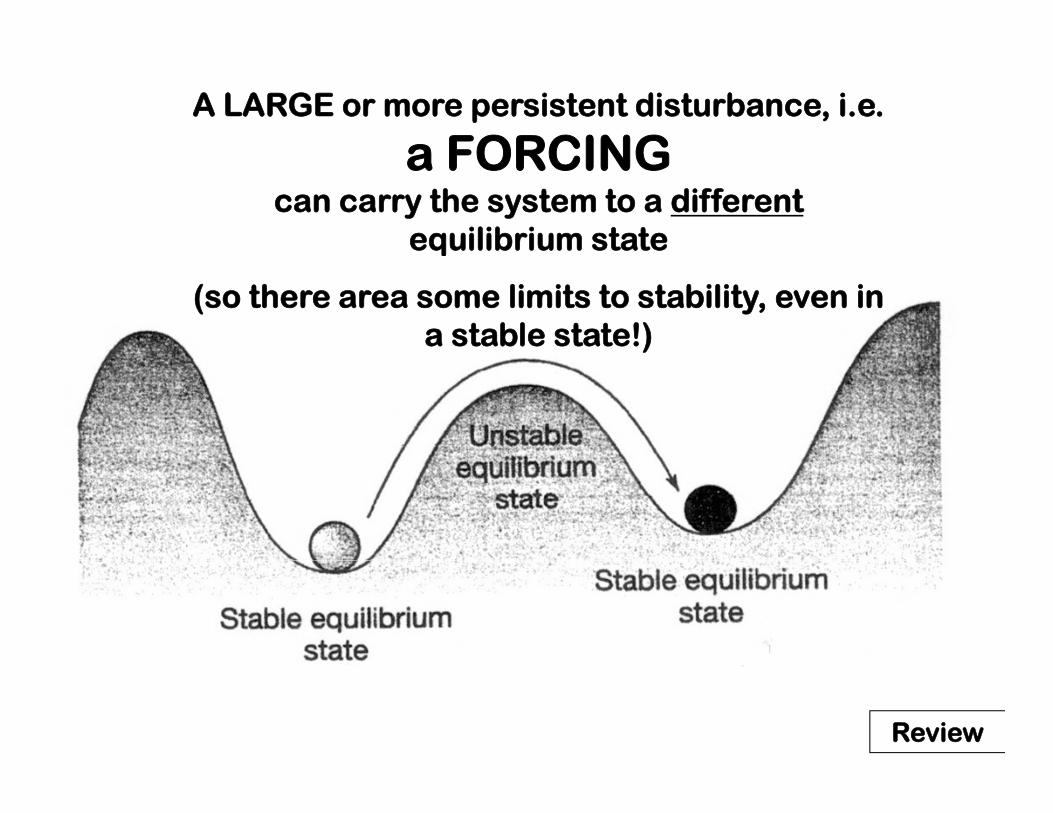
A LARGE or more persistent disturbance, i.e.
a FORCINGa FORCINGcan carry the system to a different
equilibrium stateq
(so there area some limits to stability, even in a stable state!)
Review

AFTER the “SWITCH” the global climate became g“locked into” a new state:
-- Greatest effectin Europe
-- Forest tundra
-- in Scandinavia (dryas plant) in Scandinavia (dryas plant)
-- Glaciation & increased snow i t i in mountain ranges around the world.
then . . . the Younger Dryas ended very “suddenly” ~ 11,570 years BP
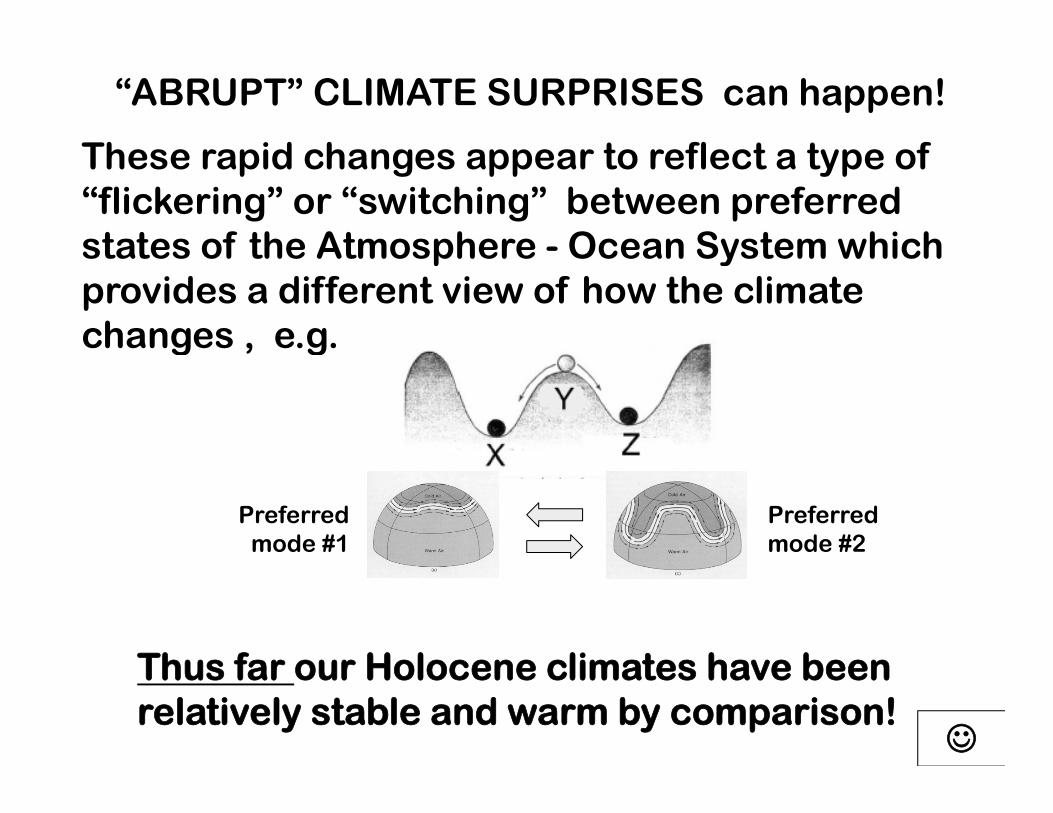
“ABRUPT” CLIMATE SURPRISES can happen!
These rapid changes appear to reflect a type of These rapid changes appear to reflect a type of “flickering” or “switching” between preferred states of the Atmosphere - Ocean System which states of the Atmosphere Ocean System which provides a different view of how the climate changes , e.g. g g
Preferredmode #1
Preferredmode #2
Thus far our Holocene climates have been
Thus far our Holocene climates have been relatively stable and warm by comparison!
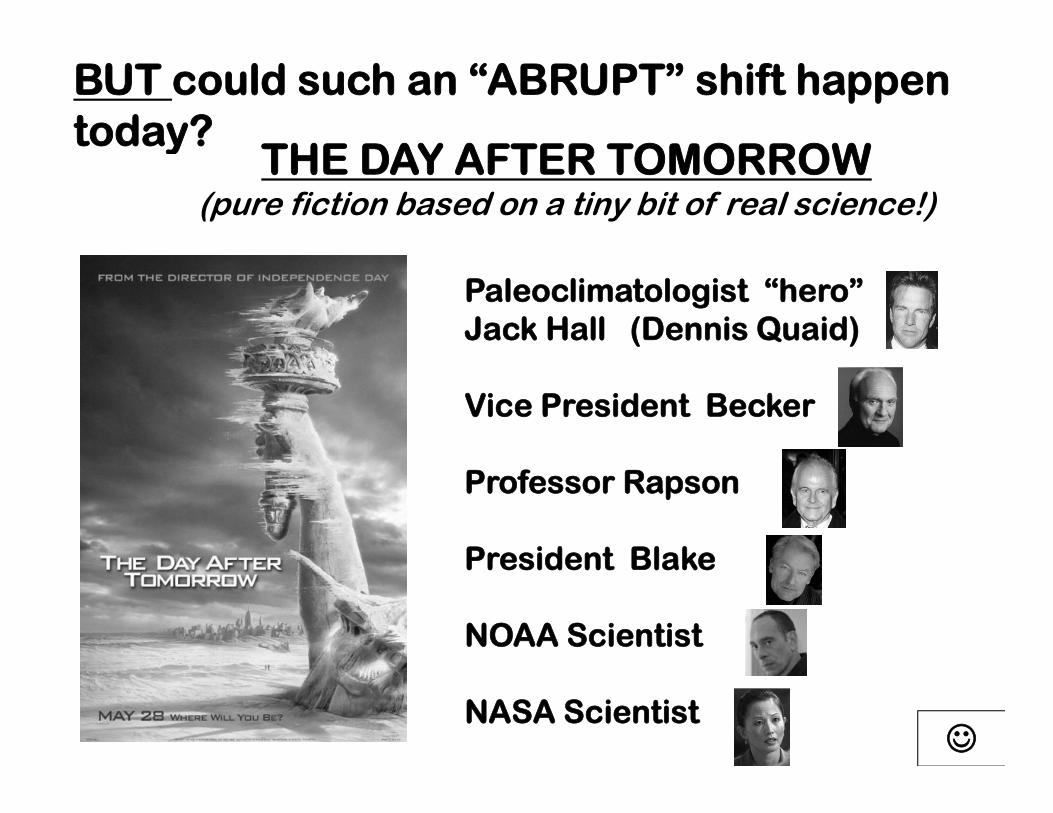
BUT could such an “ABRUPT” shift happen today?
THE DAY AFTER TOMORROW y
THE DAY AFTER TOMORROW (pure fiction based on a tiny bit of real science!)
Paleoclimatologist “hero” Jack Hall (Dennis Quaid)
Vice President Becker
Professor Rapson
President BlakePresident Blake
NOAA Scientist
NASA Scientist

Remember – in today’s class we are focusing on:
NATURAL CLIMATIC
g
NATURAL CLIMATIC FORCING
Earth-Sun orbital relationships, internal atmosphere-ocean variability p y
solar variability, volcanic eruptions
not not ANTHROPOGENIC
FORCING FORCING
Human-Enhanced GH Effect
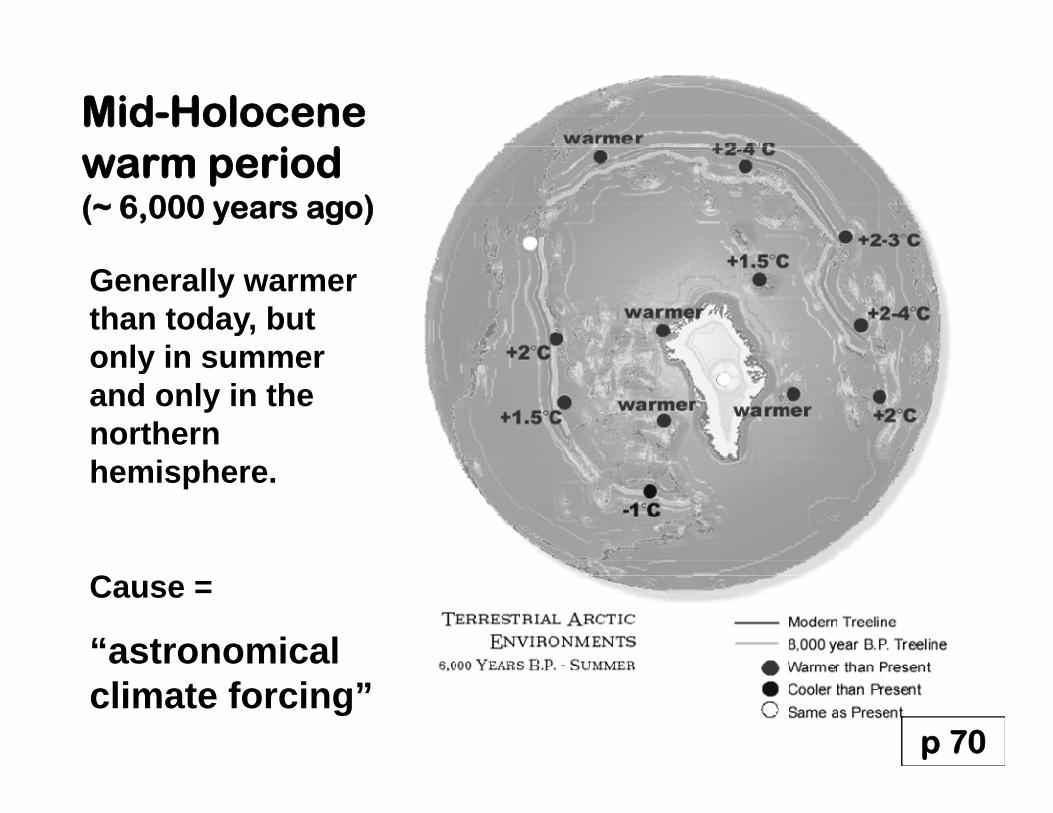
Mid-Holocene i d warm period
(~ 6,000 years ago)
Generally warmer than today, but only in summeronly in summer and only in the northern hemisphere.
Cause =
“astronomicalastronomical climate forcing”
p 70

SHORT-TERM CLIMATE VARIABILITY
(century, decade, inter-annual time scales
of the last 10,000 years – the HOLOCENE.)
Medieval WarmMedieval WarmPeriod (MWP)
9th-14th centuries MWP
Fig 15-1cin SGC
9th-14th centuries (800-1300)
Little Ice Age (LIA)
LIA
Little Ice Age (LIA)
15th – 19th centuries (1400 1800)(1400-1800)esp. 1600 -1800

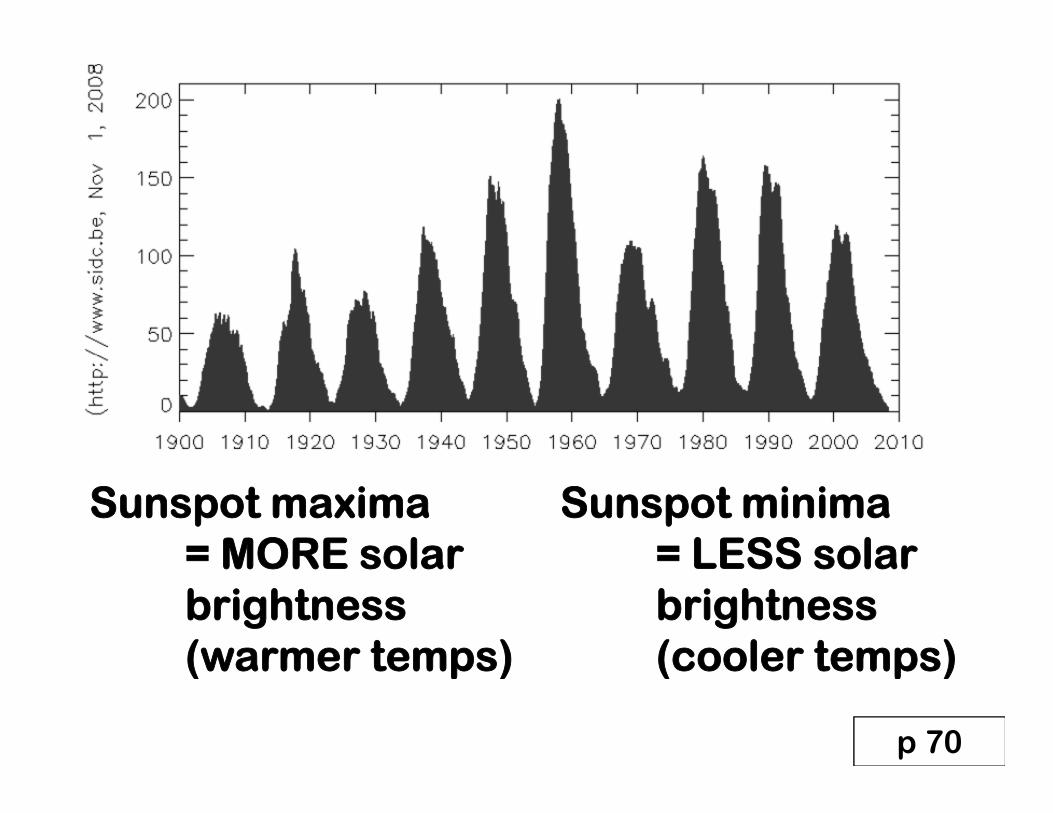
ANOTHER POSSIBLE NATURAL FORCING: SOLAR VARIABILITYFORCING: SOLAR VARIABILITY
Sunspot minima= LESS solar
Sunspot maxima= MORE solar = LESS solar
brightness(cooler temps)
= MORE solar brightness(warmer temps) (cooler temps)(warmer temps)
p 70
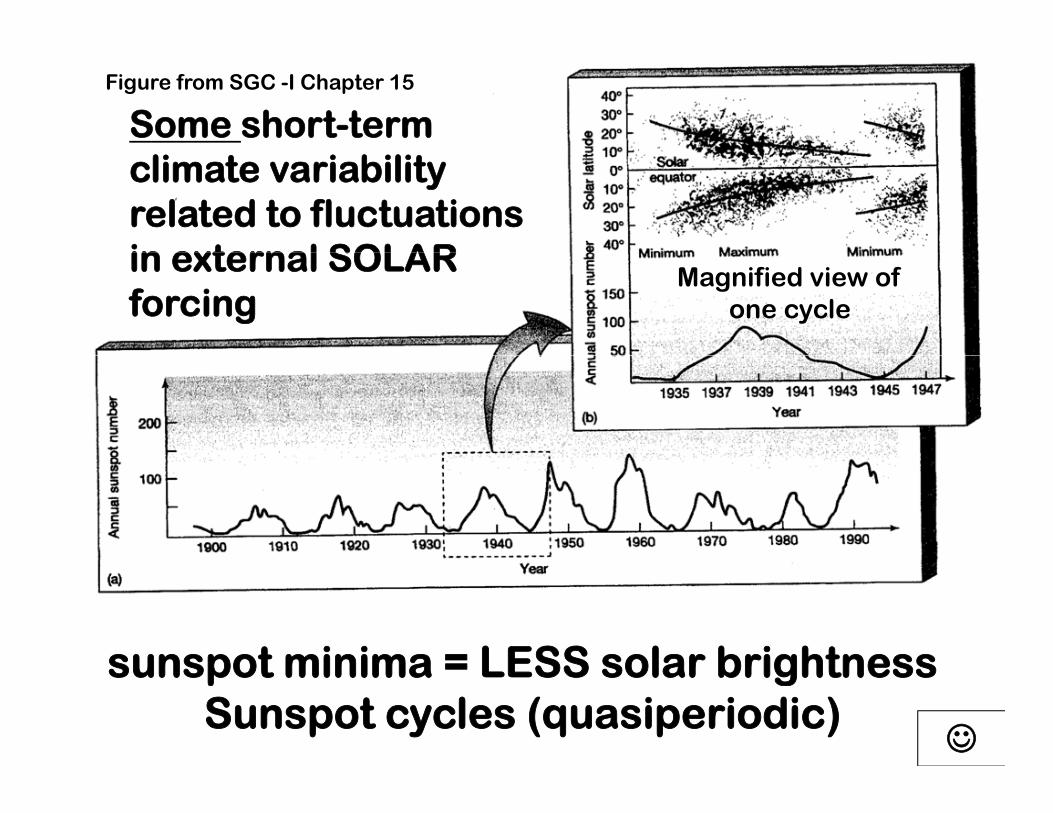
Some short-term Figure from SGC -I Chapter 15
climate variability related to fluctuations in external SOLAR in external SOLAR forcing
Magnified view of one cycle
sunspot minima = LESS solar brightnesssunspot minima = LESS solar brightnessSunspot cycles (quasiperiodic)
ANOTHER POSSIBLE NATURAL FORCING: SOLAR VARIABILITYFORCING: SOLAR VARIABILITY
Sunspot minima= LESS solar
Sunspot maxima= MORE solar = LESS solar
brightness(cooler temps)
= MORE solar brightness(warmer temps) (cooler temps)(warmer temps)
p 70

Maunder Minimum (cooler)(1645 -1715)
linked to “Little Ice Age” (1600-1800)
But uncertainties remain! What MECHANISM transfers b i ht d t l brightness drop to lower temperatures?
Dalton Minimum (1795 – 1825) -- also cooler-- lots of large volcanic eruptions then too
Since the Dalton Minimum, the Sun has gradually
p 70
, g ybrightened – we just came out of a “Modern Maximum” ( max in 2001)
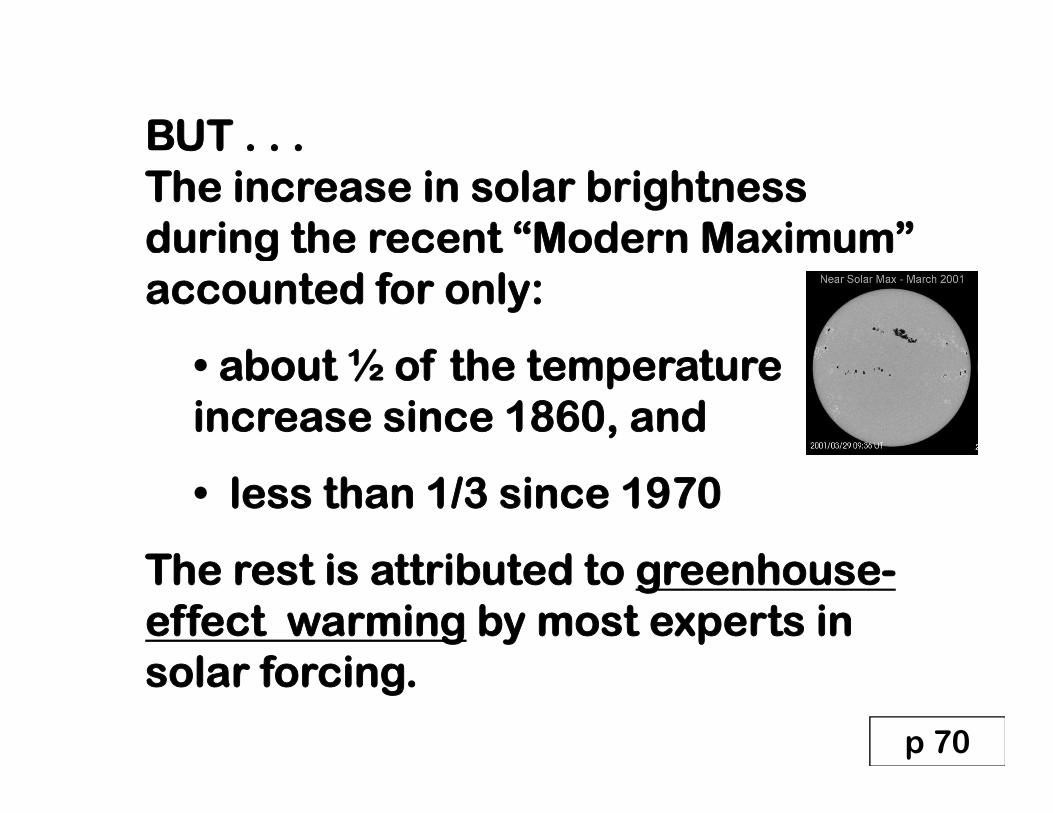
BUT . . .UT . . .The increase in solar brightness during the recent “Modern Maximum” gaccounted for only:
b t ½ f th t t • about ½ of the temperature increase since 1860, and
• less than 1/3 since 1970
Th t i tt ib t d t hThe rest is attributed to greenhouse-effect warming by most experts in
l f isolar forcing.
p 70
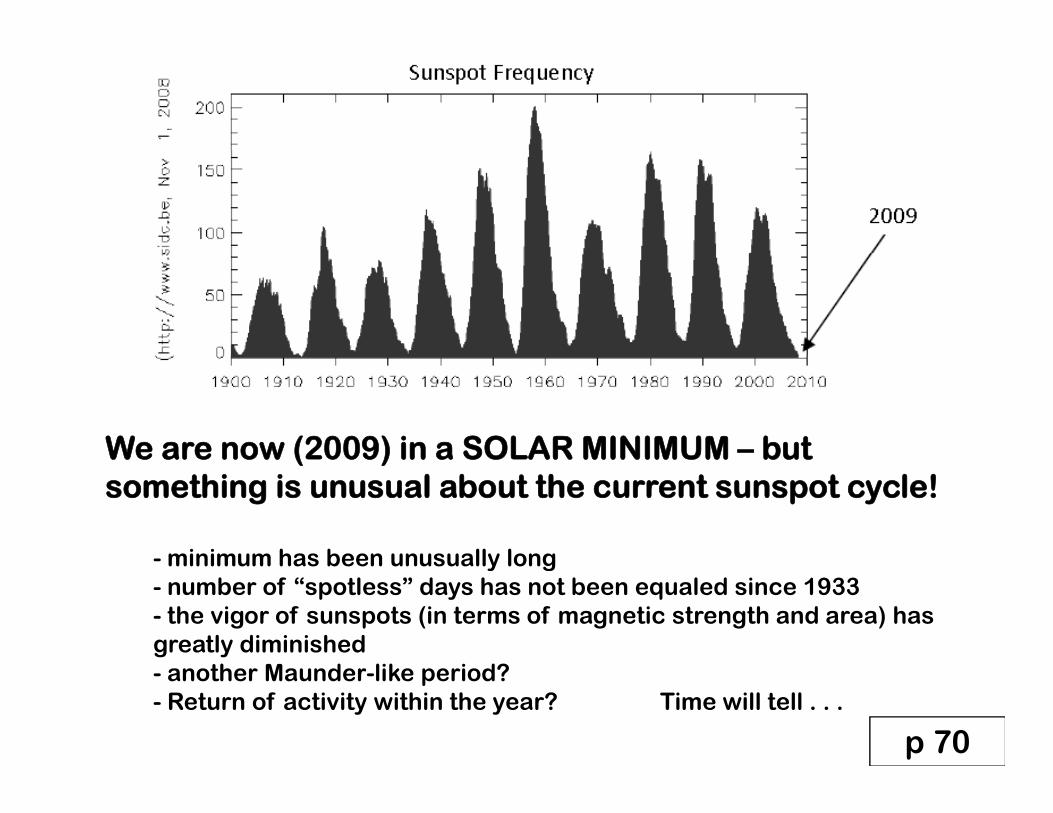
We are now (2009) in a SOLAR MINIMUM – but We are now (2009) in a SOLAR MINIMUM but something is unusual about the current sunspot cycle!
- minimum has been unusually long- minimum has been unusually long- number of “spotless” days has not been equaled since 1933- the vigor of sunspots (in terms of magnetic strength and area) has greatly diminished- another Maunder-like period? - Return of activity within the year? Time will tell . . .
p 70
NEXT:
VOLCANIC FORCING!!!!
(We’ll save that for after TEST #3)( )