Embed Size (px)
Citation preview
Final General Reevaluation Report and
Final Environmental Impact Statement
on
Hurricane Protection and Beach Erosion Control
WEST ONSLOW BEACH AND NEW RIVER INLET (TOPSAIL BEACH), NORTH CAROLINA
Appendix R
Nearshore Hardbottom Survey

-- R - 1 -- West Onslow Beach and New River Inlet (Topsail Beach), NC
Final General Reevaluation Report and Final Environmental Impact Statement
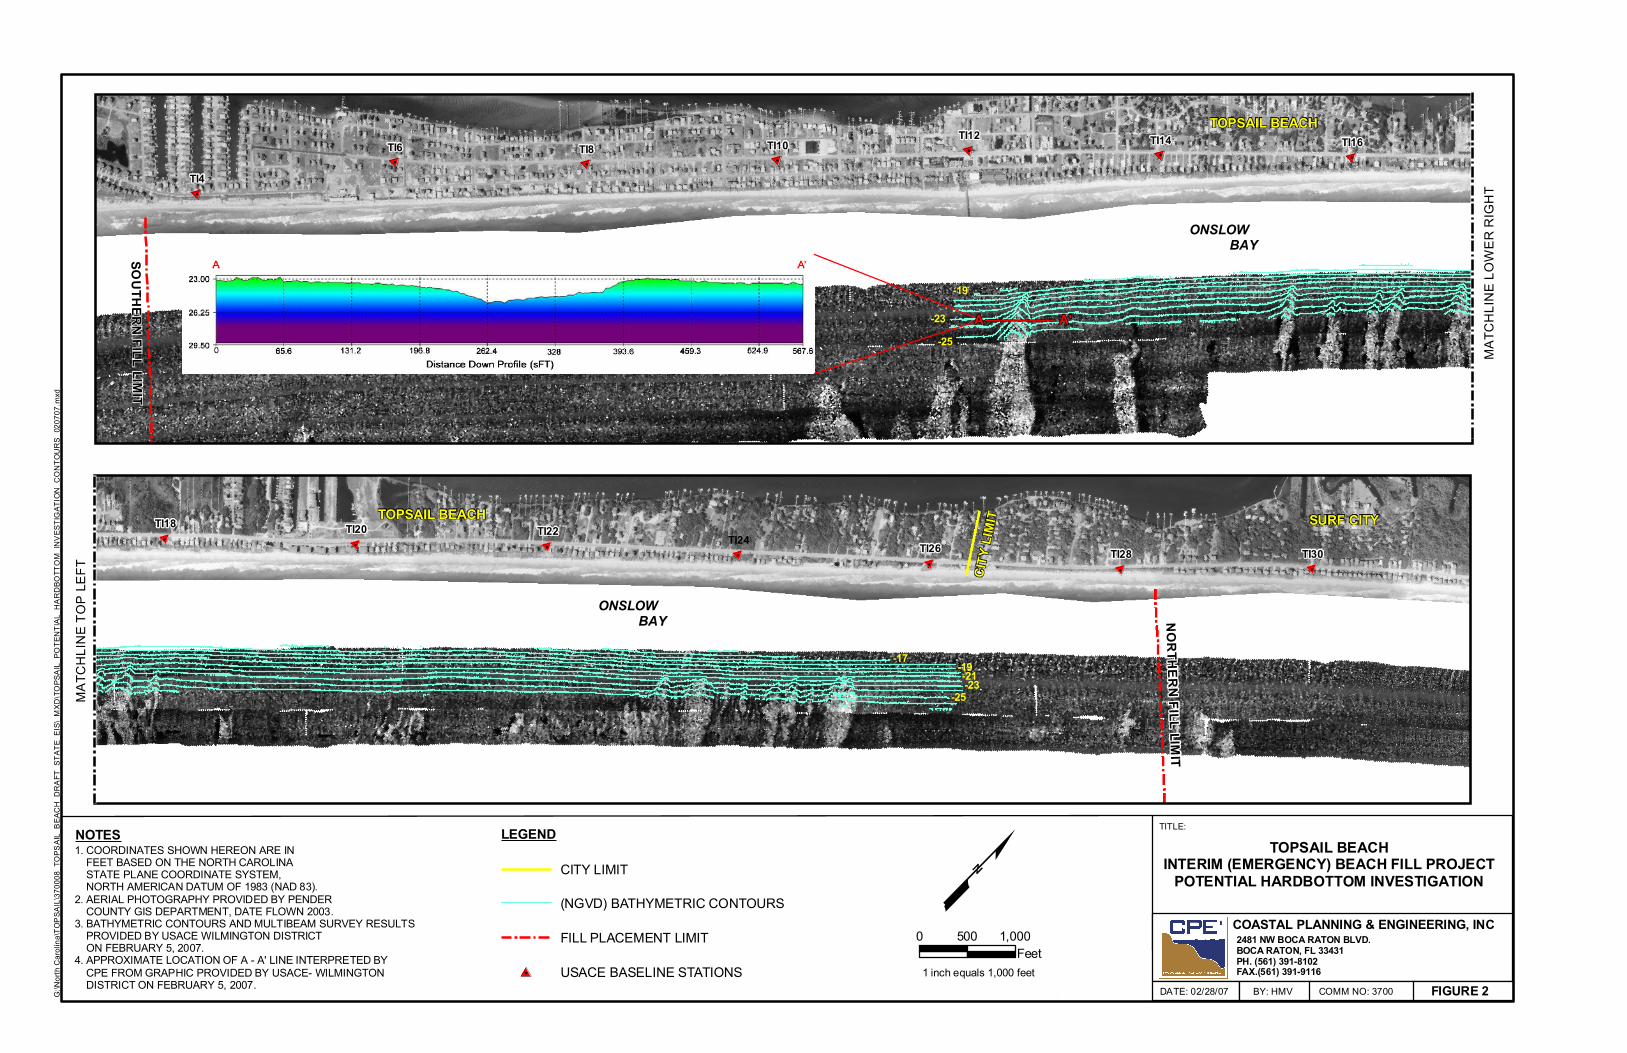
Background As identified in the Draft GRR and EIS for the West Onslow Beach and New River Inlet (Topsail Beach) Shore Protection Project, “shallow limestone and siltstone rock units offshore of Topsail Beach dominate and control the near surface geology and submarine landscape (~>-28 ft). The Topsail Beach shoreface consists of a thin patchy veneer of modern sediments covering the low relief Oligocene limestone and siltstone hard bottoms This thin veneer of sediment is ephemeral and easily reworked during storms; thus, exposing rock units in areas where the sediment cover is thin. The nearshore hard bottom features are generally low relief with isolated scarp formations.” Though the best available data regarding hard bottom resources off of Topsail Island does not suggest the presence of high relief hard bottom within the -23’ depth of closure limits calculated for the project, to more accurately assess potential project impacts to hard bottom resources, a nearshore hard bottom survey was performed. In spring 2006, prior to commencement of the survey contract, a detailed flowchart identifying the order of work and data collection process was submitted to the NMFS and NCDMF for their approval. The contract scope of work consisted of a two phased effort to locate and quantify “potential hard bottom” sites within the project impact area utilizing side scan sonar (phase 1), and if targets were identified, multibeam survey techniques to assess the bathymetry (i.e. relief) (phase 2) (Attachment 1). Methods and Results Phase one – Sidescan survey Phase one of the nearshore survey commenced in July 2006 and was comprised of 6 planned survey lines spaced 320’ apart (100m) in depths ranging from ~5’ MLLW to ~30’ MLLW (Attachment 2). The distance between survey lines was calculated in separate zones of relatively equal depths using 42 times the water depth for multibeam and 394’ swaths (120m) for sidescan as indicated on the NOAA digital nautical chart 11541_4.kap. The total area of the survey encompassed 3.2 square miles. Sidescan sonar is a marine geophysical technique use to map underwater topography and for identifying features on the surface of water body bottoms. Generally, hard materials provide high amplitude echoes and soft, fine grained materials provide weak signals. As a result, side scan sonar provides a visual representation of the change in density of the surface material of a water body bottom. Interpretation of the sidescan sonar data identified several areas which had higher density material than the adjacent area. These high backscatter “finger-like” projections were located cross-shore throughout the survey area (Figure 1). Based on these density differences, the areas of high backscatter were considered “potential hard bottom” and were delineated to calculate total area of each feature. Generally, the “potential hard bottom” targets identified started approximately 800 ft offshore (2004 wet/dry line) and extended to the end of the survey, located approximately 1800 ft offshore (2004 wet/dry line).
-- R - 2 -- West Onslow Beach and New River Inlet (Topsail Beach), NC
Final General Reevaluation Report and Final Environmental Impact Statement
Phase two – Multibeam survey To further investigate the bathymetry of these target areas, the phase two multibeam survey was initiated, extending from January 26 – February 6th 2007. The multibeam survey was comprised of 18 planned survey lines (6 lines per survey area) spaced 70’ to 90’ apart to obtain 100% seafloor coverage (Attachment 3). The total area of the survey encompassed 0.85 square miles with a total of 57 line miles and employed a Simrad EM3002 shallow water multibeam sonar system to collect spatially dense bathymetric data across 0.85 square miles of seafloor for the development of an accurate surface model. Data interpretation of seafloor bathymetry indicated that areas of high backscatter with cross-shore orientation identified in the phase one side scan sonar survey were areas of gradual seafloor depressions with approximately 1.5’ vertical relief per 330’ horizontal distance (Figure 1). Surface Sediment Samples In order to further characterize the substrate of these depressional features, the Corps coordinated with NOAA Fisheries to gather surface sediment grab samples while performing dives as a component of the NOAA Fisheries lionfish study (Figure 2). Samples were retrieved from both within and outside of the identified depressions. Sediment samples retrieved outside of the depressions (areas of low backscatter) were characterized as fine grained sand; whereas samples retrieved from within the depressions (areas of high backscatter) were generally a coarser sandy shell hash and, in two samples, contained small (3.0” x 2.0”) limestone cobbles. According to Dr. Bill Cleary (Personal Communication, March 2007), these small cobbles are likely eroded pieces of known limestone outcrops located further offshore. Divers collecting the sediment samples noted that, for the locations where samples were collected, the areas where visually characterized as sandy substrate with no significant relief or ledges and no significant fish assemblages (Ron Sechler, Personal Communication, 04 April 2007). Discussion The depressional features identified in the phase two multibeam survey are consistent with previously identified “rippled scour depressions (RSD)” (Cacchione et. al., 1984; Thieler et. al., 1999; Thieler et. al., 2001), “ripple channel depressions (RCD)” (McQuarrie, 1998), or “sorted bedform”(Murray and Thieler, 2004) features. Though termed differently throughout the literature, for the purposes of this assessment, RSD, RCD, and sorted bedforms will be considered interchangeable terms to identify the same geologic feature. On the Pacific Coast, Cacchione et. al. (1984) identified surficial sedimentary features of the shoreface and inner shelf environments with slight topographic expressions (~1 m total relief) about 100-200 m wide and extending hundreds to thousands of meters in the cross-shore direction. These features were composed of course sand (in some cases shell hash and gravel) and arranged into large wave generated ripples. Termed, “Rippled Scour Depressions (RSD)” these features were attributed to areas of intensified cross-shore flow that preferentially winnow fine material, leaving a course lag parallel to flow. Similar geologic features were later
-- R - 3 -- West Onslow Beach and New River Inlet (Topsail Beach), NC
Final General Reevaluation Report and Final Environmental Impact Statement
identified throughout the Atlantic coast, including off the coast of North Carolina and South Carolina (McQuarrie, 1998; Thieler et. al., 1999; Thieler et. al., 2001). According to McQuarrie (1998), an approximately 102 km2 area was surveyed using sidescan sonar, high resolution seismic, and vibracores on the shoreface and inner shelf of Onslow Bay. This study characterized the inner shelf off Topsail Beach as Tertiary and Pleistocene outcrops with a thin, discontinuous, loose surficial sheet of sediment. In addition to continuous quaternary fluvial channels traced shore perpendicular across the shore face, wave and current action on the shoreface generates “ripple channel depressions (RCD’s)” on the shoreface. Vibracore and surface sediment samples within and outside of these features are consistent with RSD sediment data identified in other studies (Cacchionne et. al., 1984; Thieler et. al., 1999; Thieler et. al., 2001). A significant amount of historic side scan data has been collected offshore of Topsail Beach (1992, 1994, and 1996) (Rob Thieler, Personal Communication; McQuarrie, 1998). This historic data matches well with the July 2006 side scan data providing some additional insight to the offshore extent and stability of these features. Considering that the data are spread over a 15 year timeframe and imagery still matches well, it appears that these features are fairly stable, at least over a decadal time frame (Rob Thieler; Personal Communication), suggesting that these features are maintained by the localized interaction of oceanographic processes and poorly sorted bed material. Side scan imagery from Theiler et. al. (1999) identified subtle shore oblique bathymetric expressions of high acoustic reflectivity dominating the shoreface and inner shelf of Wrightsville Beach, NC and Folly Beach, SC. The depressional features had 1 m vertical relief across widths of 100’s of meters and were associated with RSD’s as defined by Cacchione et. al.(1984). –According to Thieler (1999), individual RSD’s were approximately 40-100 m wide on Wrightsville Beach, NC and Folly Beach, SC and are up to 1 m deep on the upper shoreface, but have a much more subdued (~50 cm) bathymetric expression further offshore. Most depressions develop just outside the surf zone at 3-4 meters water depth and extend into the inner shelf at 15 m. Vibracore data from Thieler et. al. (2001) indicate that these RSD features are floored by course sand, shell hash, and quartz gravel and are surrounded by areas of fine sand. These study sites appear to be relatively stable or represent a recurring, preferential morphologic state to which the seafloor returns after storm induced perturbations. This apparent stability is interpreted to be the result of interactions at several scales that contribute to a repeating, self-reinforcing pattern of forcing and sedimentary response which ultimately causes the RSD’s to be maintained as bedforms responding to both along-and across shore flows. According to Dr. Bill Cleary (Personal communication), the presence of RSD’s/Sorted bedforms as identified through side scan imagery off Topsail Beach are ubiquitous from Topsail beach through Wrightsville Beach. Side Scan sonar imagery identifying the same features exists for Figure eight Island and also Lee/Hutaff island. Murray and Thieler (2003) reviewed data within Wrightsville Beach, NC RSD’s and did not indicate any significant offshore-directed currents as identified by Cacchione et. al. (1984), suggesting the dominance of along-shelf transport rather than cross shelf flow.

-- R - 4 -- West Onslow Beach and New River Inlet (Topsail Beach), NC
Final General Reevaluation Report and Final Environmental Impact Statement
These depressional features are independent of geologic factors and are a result of oceanographic process such as the interaction of waves, mean currents, and poorly sorted bed material in a moderately high-energy environment. Considering that their observations suggested the dominance of along-shelf transport rather than cross-shelf flow and transport, Murray and Thieler (2004) adopted the term “sorted bedforms” to describe the features off Wrightsville Beach and elsewhere. The North Carolina Coastal Habitat Protection Plan (CHPP) was adopted by the North Carolina Marine Fisheries, Environmental Management, and Coastal Resources Commissions in December 2004. The CHPP identifies six types of habitats that produce North Carolina’s coastal fisheries resources including shell bottom, sea grasses, wetlands, hard bottoms, soft bottoms, and the water column. Rippled scour depressions are identified as soft bottom habitat in Chapter 6 of the CHPP under the subsection titled “Ocean Intertidal Beaches and Subtidal bottom:” “The surf zone is the shallow subtidal area of breaking waves seaward of the intertidal beach. Within the surf zone, longshore sandbars frequently develop and shift seasonally in response to wave energy. Seaward of the surf zone, the subtidal bottom consists of a series of minor ridges and swales. Ripple scour depressions, ranging from 130–330 ft (40–100 m) in width and up to 3 ft (1 m) in depth, occur along the southern portion of the coast and are perpendicularly oriented to the beach, extending to the base of the shoreface (Thieler et al. 1995; Reed and Wells 2000). These features are located adjacent to areas experiencing chronic severe beach erosion, and may be indicative of rapid offshore transport of sand during storms (Thieler et al. 1995).” According to the CHPP, RSD’s are not considered Essential Fish Habitat (EFH), Habitat Areas of Particular Concern (HAPC), Primary Nursery Area (PNA) or Strategic Habitat Area (SHA). Though soft bottom habitat is probably the most resilient to physical alterations because of its lack of structure and dynamic nature, it plays a vital role as nursery and foraging grounds for fish and invertebrate species. Benthic soft bottom habitat within the project, area (Sections 2.01.8 and 2.01.9) and the potential biological impacts of beach nourishment (Sections 8.01.6 and 8.01.7) are identified in the Draft GRR and EIS for the West Onslow Beach and New River Inlet (Topsail Beach) Shore Protection Project.
-- R - 5 -- West Onslow Beach and New River Inlet (Topsail Beach), NC
Final General Reevaluation Report and Final Environmental Impact Statement
Conclusion Based on the data collected through sidescan and multibeam survey techniques, the Corps concludes that no hard bottom features are located within the -23 depth of closure limits of the West Onslow Beach and New River Inlet (Topsail Beach) Shore Protection Project. After review of the available literature, the high backscatter depressional features identified through side scan and multi beam sonar as well as the surface sediment samples collected within and outside of theses features are consistent with previous descriptions RSD, RCD, and sorted bedform features. Furthermore, these features are identified in the North Carolina CHPP as soft bottom habitat and are not considered EFH, HAPC, PNA, or SHA. Impacts to soft bottom habitat are discussed in detail in Sections Sections 2.01.8 and 2.01.9 and 8.01.6 and 8.01.7 of the Draft GRR and EIS. Within the -23’ depth of closure limit of the project area, nourished sediment will move offshore as the constructed beach profile equilibrates to a more natural beach profile. The total area of the RSD, RCD, sorted bedform features that occurs within the -23 ft. depth of closure limits is 0.3834 acres. Though nourished sediment could gradually move within the depressional features, it is likely that the features will be maintained as a preferential morphologic state through the repeating, self-reinforcing pattern of forcing and sedimentary response which causes the RSD’s to be maintained as sediment starved bedforms responding to both along-and across shore flows (Thieler et. al., 2001). Literature Cited Cacchione D. A., D. E. Drake, W. D. Grant, and G. B. Tate. 1984. Rippled Scour Depressions on the Inner Continental Shelf Off Central California. Journal of Sedimentary Petrology. Vol. 54, No. 4, p. 1280-1291. McQuarrie M. E. 1998. Geologic Framework Short-Term, Storm-Induced Changes in Shoreface Morphology: Topsail Beach, NC. Thesis submitted in partial fulfillment of the requirements for the degree of Master of Science in the Department of Environment in the Graduate School of Duke University. Murray A. B. and E. R. Thieler. 2004. A New Hypothesis and Exploratory Model for the Formation of Large-Scale Inner-Shelf Sediment Sorting and “Rippled Scour Depressions.” Continental Shelf Research. 24: 295-315. Street, M. W., A.. S. Deaton, W. S. Chappell, and P. D. Mooreside. 2005. North Carolina Coastal Habitat Protection Plan. North Carolina Department of Environment and Natural Resources, Division of Marine Fisheries, Morehead City, NC. 656 pp.
-- R - 6 -- West Onslow Beach and New River Inlet (Topsail Beach), NC
Final General Reevaluation Report and Final Environmental Impact Statement
Theiler E.R., P. T. Gayes, W. C. Schwab, and M. S. Harris. 1999. Tracing Sediment Dispersal on Nourished Beaches: Two Case Studies. Coastal Sediments. New York, ASCE, p. 2118-2136. Thieler E. R., O. H. Pilkey, Jr., W. J. Cleary, and W. C. Schwab. 2001. Modern Sedimentation on the Shoreface and Inner Continental Shelf at Wrightsville Beach, North Carolina, USA. Journal of Sedimentary Research. Vol. 71, No. 6, p. 958-970. E. Robert Thieler. Personal Communication. 01 March 2007. W. J. Cleary. Personal Communication. March 2007. Ron Sechler. Personal Communication. 04 April 2007. http://pubs.usgs.gov/of/1998/of98-596/
General Reevaluation Report
and Environmental Impact Statement
on
Hurricane Protection and Beach Erosion Control
WEST ONSLOW BEACH AND NEW RIVER INLET (TOPSAIL BEACH), NORTH CAROLINA
Appendix R - Nearshore Hardbottom Survey
Figure 1 - Sidescan Sonar and Multibeam Survey Results
(Figure prepared by Coastal Planning and Engineering, Inc. (CPE))

#0
#0
#0 #0 #0#0 #0 #0 #0
SOUTHERN FILL LIMIT
TI8TI6
TI4
TI16TI14TI12TI10
£
1 inch equals 1,000 feet
0 500 1,000Feet
1. COORDINATES SHOWN HEREON ARE IN FEET BASED ON THE NORTH CAROLINA STATE PLANE COORDINATE SYSTEM, NORTH AMERICAN DATUM OF 1983 (NAD 83).2. AERIAL PHOTOGRAPHY PROVIDED BY PENDER COUNTY GIS DEPARTMENT, DATE FLOWN 2003.3. BATHYMETRIC CONTOURS AND MULTIBEAM SURVEY RESULTS PROVIDED BY USACE WILMINGTON DISTRICT ON FEBRUARY 5, 2007.4. APPROXIMATE LOCATION OF A - A' LINE INTERPRETED BY CPE FROM GRAPHIC PROVIDED BY USACE- WILMINGTON DISTRICT ON FEBRUARY 5, 2007.
NOTES TOPSAIL BEACHINTERIM (EMERGENCY) BEACH FILL PROJECT
POTENTIAL HARDBOTTOM INVESTIGATION
COASTAL PLANNING & ENGINEERING, INC2481 NW BOCA RATON BLVD.BOCA RATON, FL 33431PH. (561) 391-8102FAX.(561) 391-9116
BY: HMV COMM NO: 3700 FIGURE 2DATE: 02/28/07
TITLE:
G:\N
orth C
arolin
a\TOP
SAIL\
3700
08_T
OPSA
IL_BE
ACH_
DRAF
T_ST
ATE_
EIS\_
MXD\
TOPS
AIL_
POTE
NTIAL
_HAR
DBOT
TOM_
INVE
STIG
ATIO
N_CO
NTOU
RS_0
2070
7.mxd
ONSLOW BAY
NORTHERN FILL LIMIT
TI30TI28TI26TI24TI22TI20TI18
£
TOPSAIL BEACH
SURF CITY
MATC
HLIN
E TOP
LEFT
MATC
HLIN
E LOW
ER R
IGHT
TOPSAIL BEACH
CITY
LIMI
T
-25-23
-19
-25-23-21-19-17
ONSLOW BAY
LEGEND
CITY LIMIT
(NGVD) BATHYMETRIC CONTOURS
FILL PLACEMENT LIMIT
#0 USACE BASELINE STATIONS
A'A
General Reevaluation Report
and Environmental Impact Statement
on
Hurricane Protection and Beach Erosion Control
WEST ONSLOW BEACH AND NEW RIVER INLET (TOPSAIL BEACH), NORTH CAROLINA
Appendix R - Nearshore Hardbottom Survey
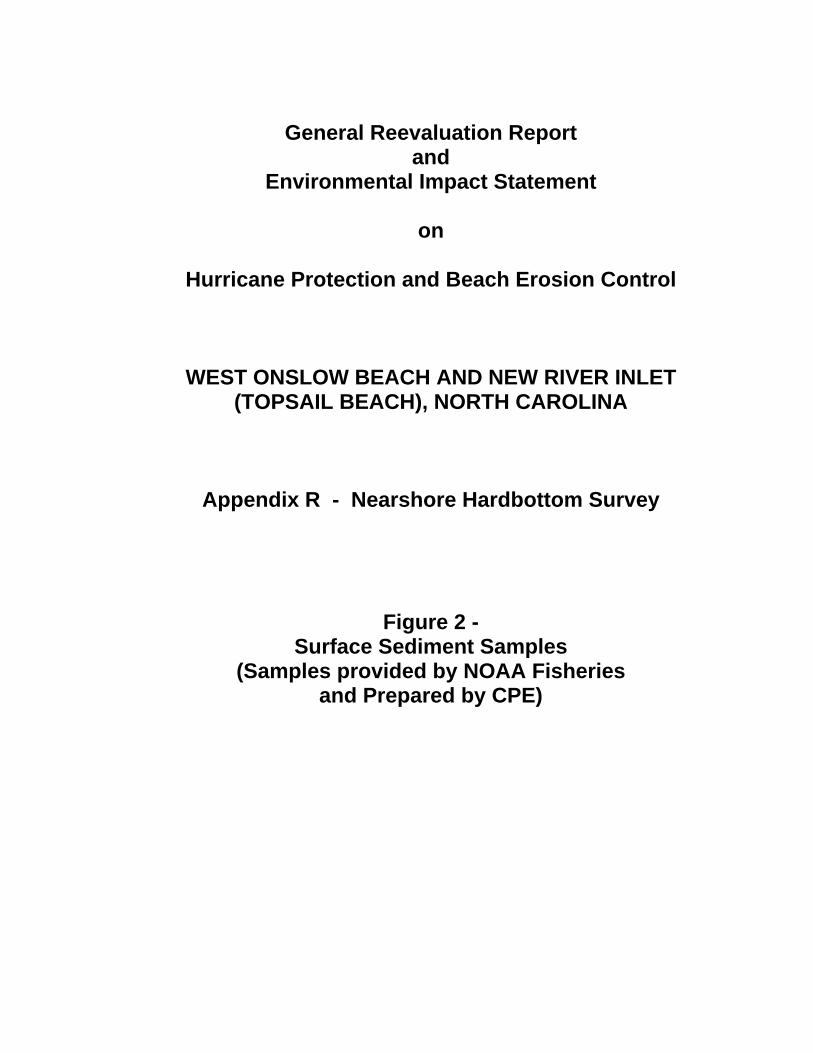
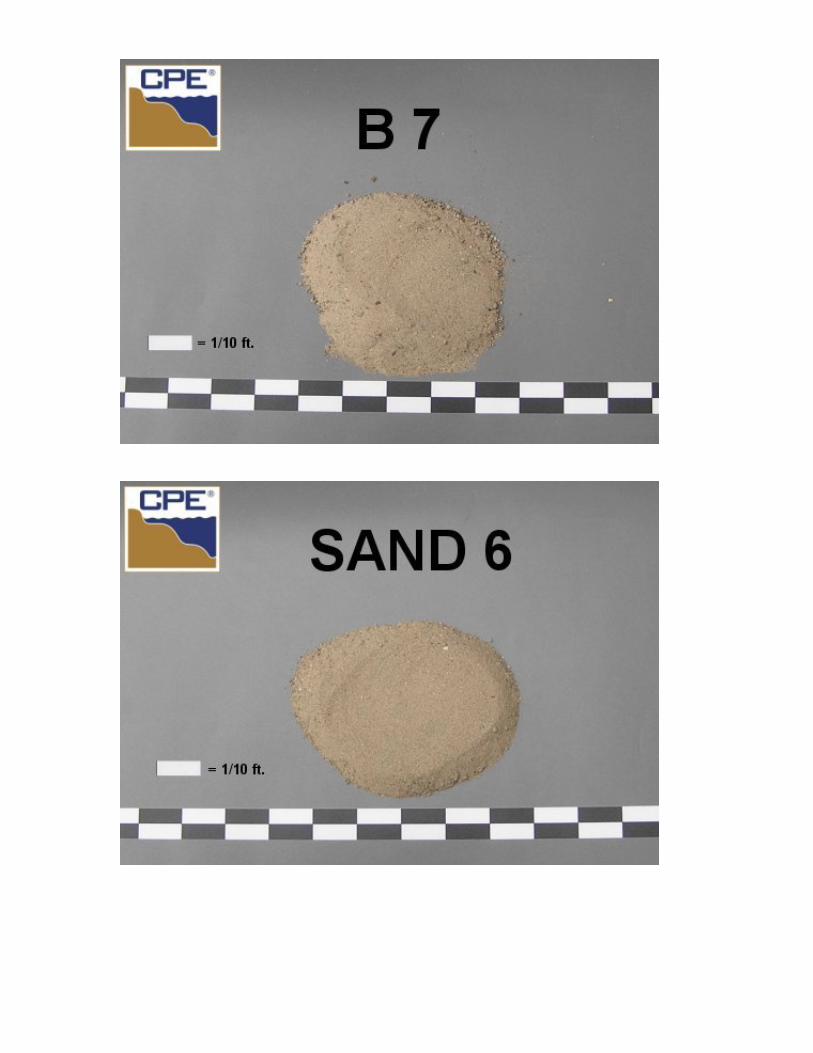
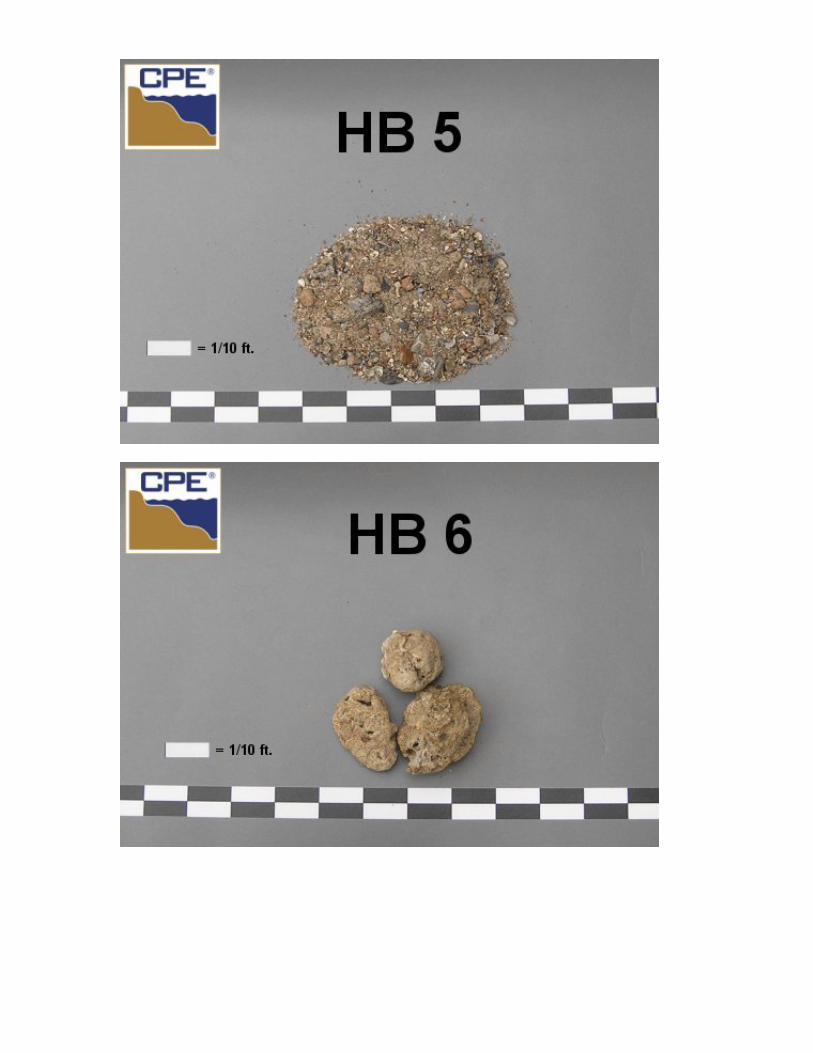
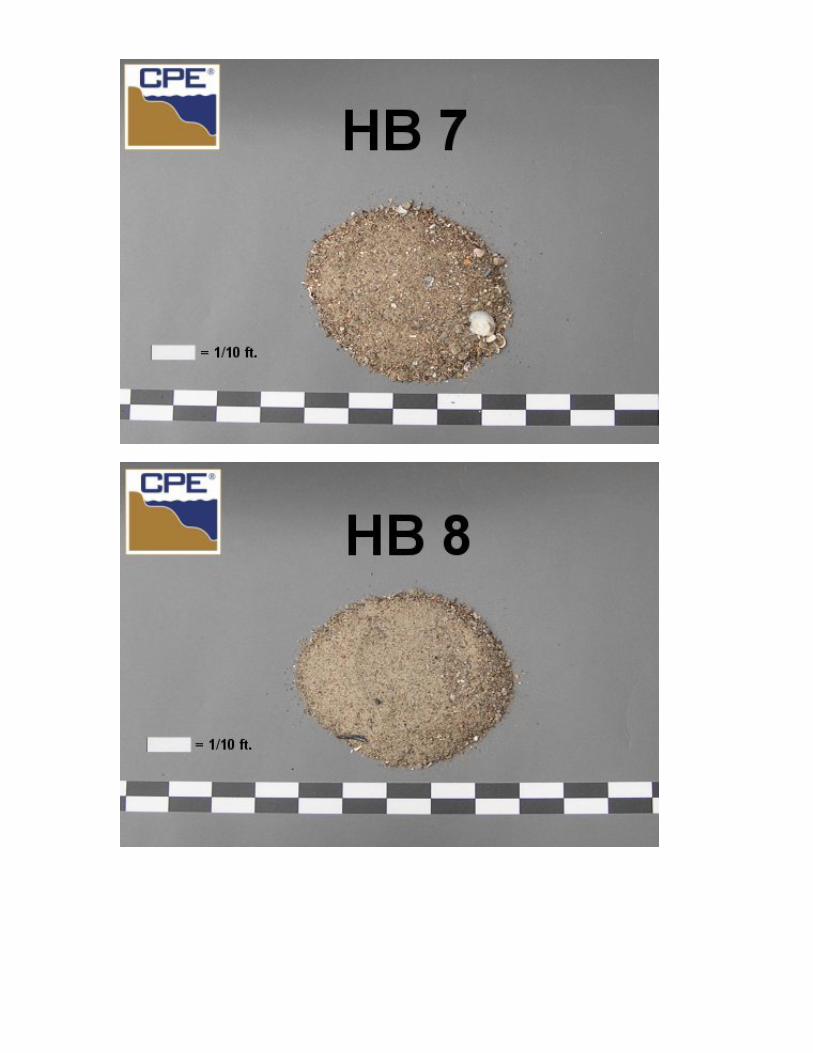
Figure 2 - Surface Sediment Samples
(Samples provided by NOAA Fisheries and Prepared by CPE)
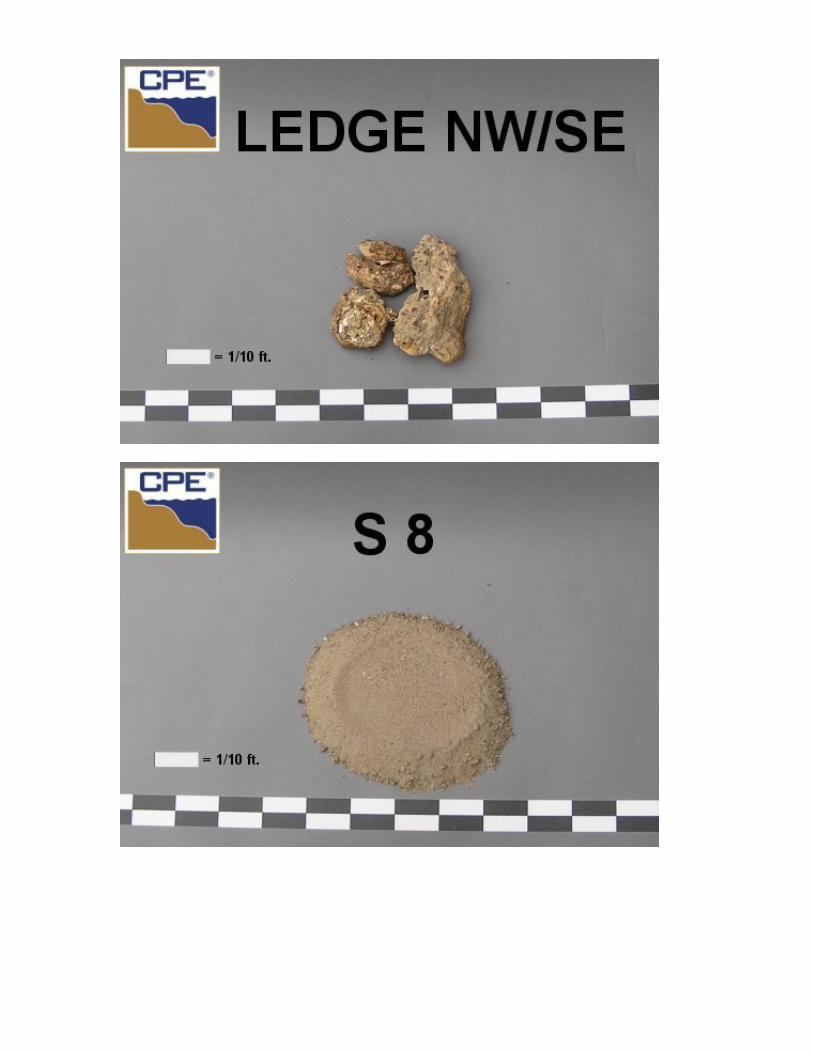
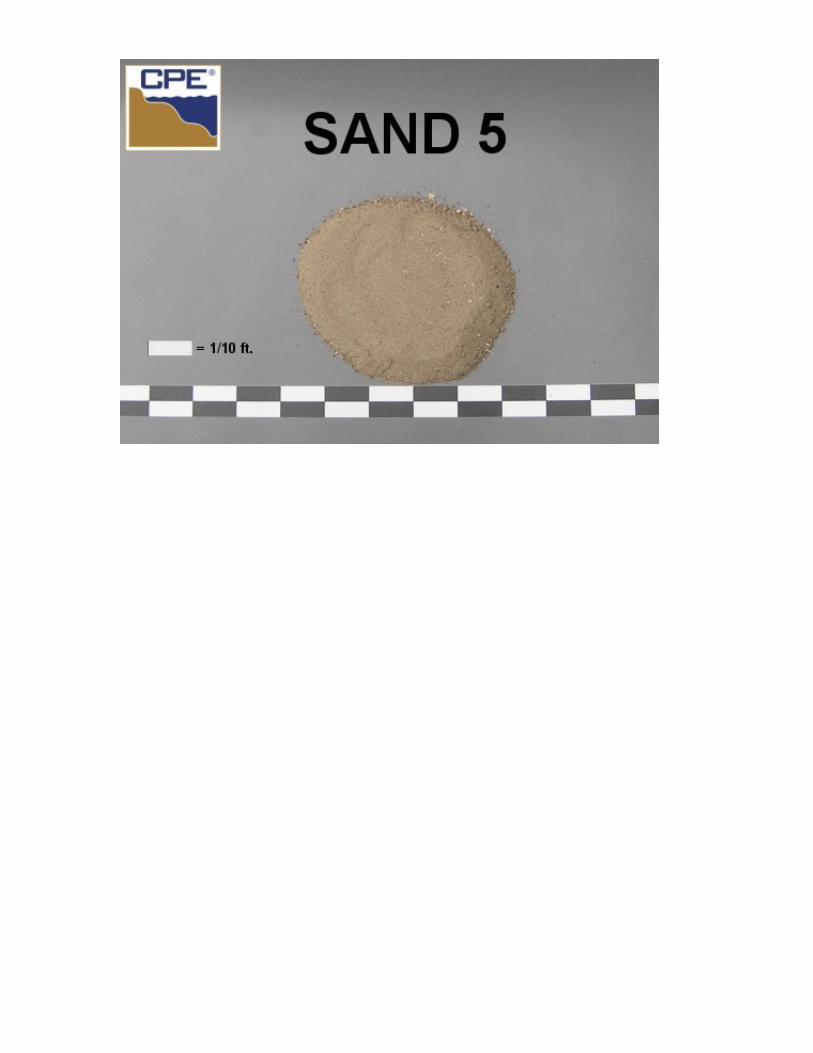
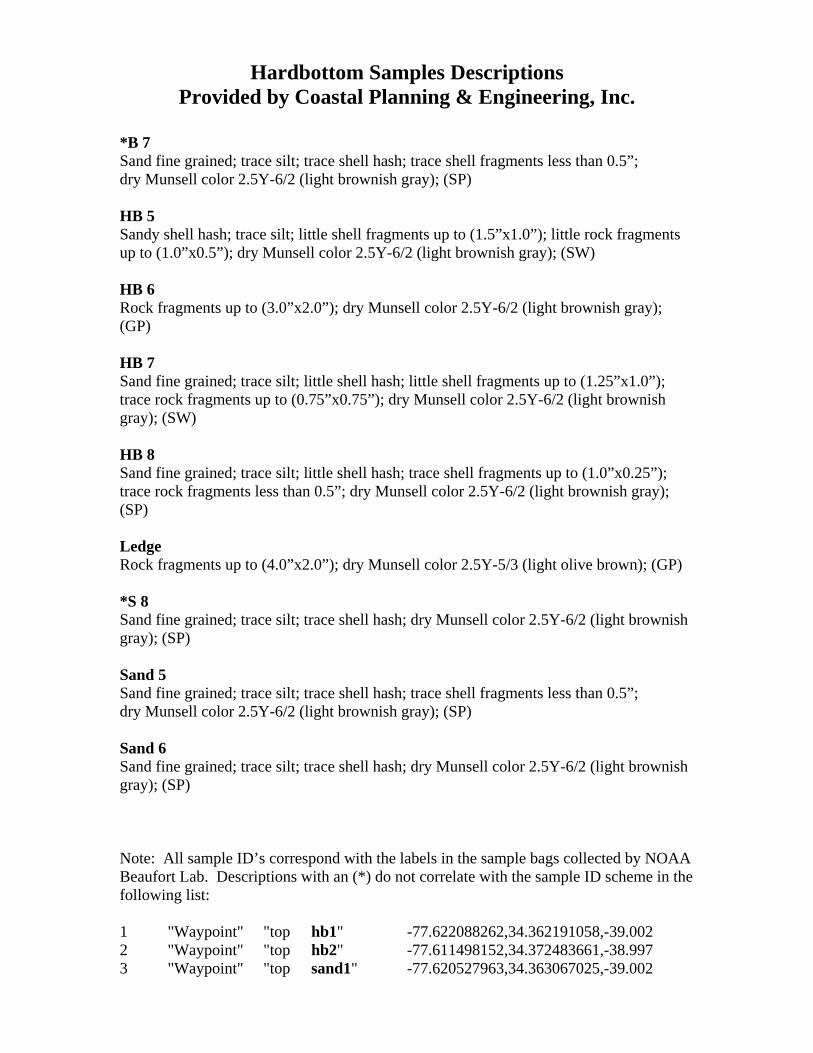
Hardbottom Samples Descriptions Provided by Coastal Planning & Engineering, Inc.
*B 7 Sand fine grained; trace silt; trace shell hash; trace shell fragments less than 0.5”; dry Munsell color 2.5Y-6/2 (light brownish gray); (SP) HB 5 Sandy shell hash; trace silt; little shell fragments up to (1.5”x1.0”); little rock fragments up to (1.0”x0.5”); dry Munsell color 2.5Y-6/2 (light brownish gray); (SW) HB 6 Rock fragments up to (3.0”x2.0”); dry Munsell color 2.5Y-6/2 (light brownish gray); (GP) HB 7 Sand fine grained; trace silt; little shell hash; little shell fragments up to (1.25”x1.0”); trace rock fragments up to (0.75”x0.75”); dry Munsell color 2.5Y-6/2 (light brownish gray); (SW) HB 8 Sand fine grained; trace silt; little shell hash; trace shell fragments up to (1.0”x0.25”); trace rock fragments less than 0.5”; dry Munsell color 2.5Y-6/2 (light brownish gray); (SP) Ledge Rock fragments up to (4.0”x2.0”); dry Munsell color 2.5Y-5/3 (light olive brown); (GP) *S 8 Sand fine grained; trace silt; trace shell hash; dry Munsell color 2.5Y-6/2 (light brownish gray); (SP) Sand 5 Sand fine grained; trace silt; trace shell hash; trace shell fragments less than 0.5”; dry Munsell color 2.5Y-6/2 (light brownish gray); (SP) Sand 6 Sand fine grained; trace silt; trace shell hash; dry Munsell color 2.5Y-6/2 (light brownish gray); (SP) Note: All sample ID’s correspond with the labels in the sample bags collected by NOAA Beaufort Lab. Descriptions with an (*) do not correlate with the sample ID scheme in the following list: 1 "Waypoint" "top hb1" -77.622088262,34.362191058,-39.002 2 "Waypoint" "top hb2" -77.611498152,34.372483661,-38.997 3 "Waypoint" "top sand1" -77.620527963,34.363067025,-39.002
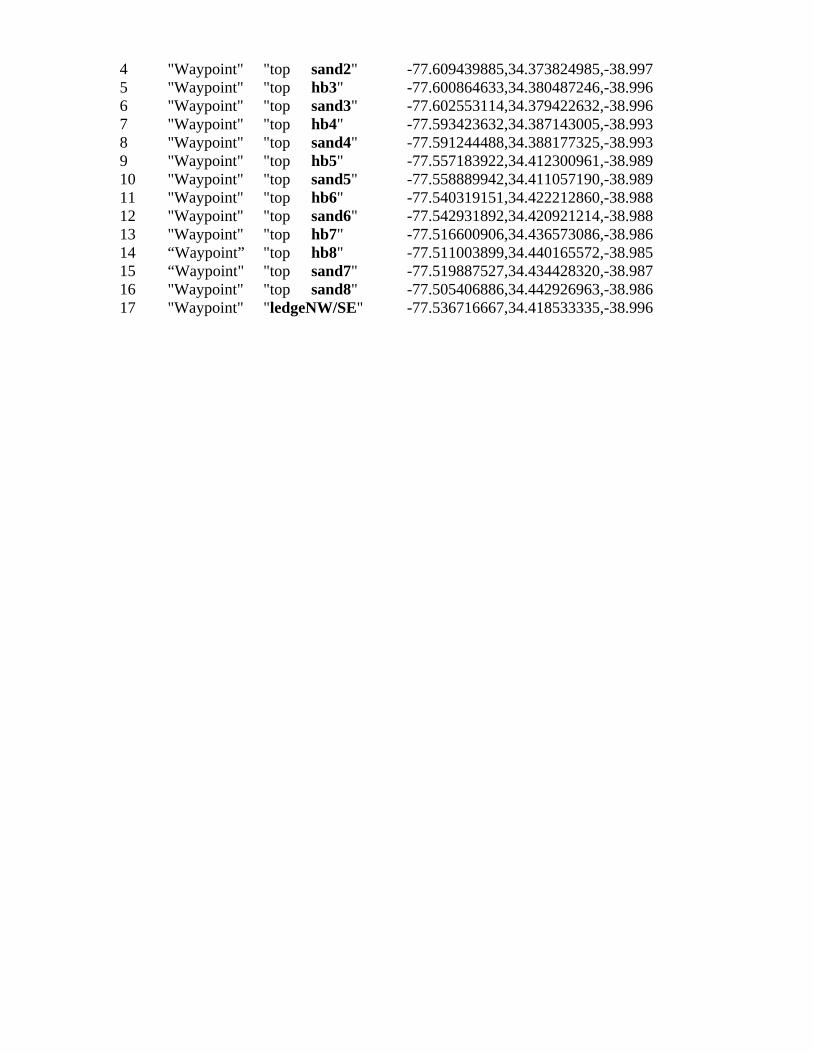
4 "Waypoint" "top sand2" -77.609439885,34.373824985,-38.997 5 "Waypoint" "top hb3" -77.600864633,34.380487246,-38.996 6 "Waypoint" "top sand3" -77.602553114,34.379422632,-38.996 7 "Waypoint" "top hb4" -77.593423632,34.387143005,-38.993 8 "Waypoint" "top sand4" -77.591244488,34.388177325,-38.993 9 "Waypoint" "top hb5" -77.557183922,34.412300961,-38.989 10 "Waypoint" "top sand5" -77.558889942,34.411057190,-38.989 11 "Waypoint" "top hb6" -77.540319151,34.422212860,-38.988 12 "Waypoint" "top sand6" -77.542931892,34.420921214,-38.988 13 "Waypoint" "top hb7" -77.516600906,34.436573086,-38.986 14 “Waypoint” "top hb8" -77.511003899,34.440165572,-38.985 15 “Waypoint" "top sand7" -77.519887527,34.434428320,-38.987 16 "Waypoint" "top sand8" -77.505406886,34.442926963,-38.986 17 "Waypoint" "ledgeNW/SE" -77.536716667,34.418533335,-38.996
General Reevaluation Report and
Environmental Impact Statement
on
Hurricane Protection and Beach Erosion Control
WEST ONSLOW BEACH AND NEW RIVER INLET (TOPSAIL BEACH), NORTH CAROLINA
Appendix R - Nearshore Hardbottom Survey
Attachment 1 - Sidescan Sonar and Multibeam Survey Scope of Work


SCOPE OF WORK
NEARSHORE HARD BOTTOM SIDESCAN SURVEY TOPSAIL ISLAND, NORTH CAROLINA
1. General. The Contractor shall acquire Sidescan Sonar Data along Topsail Island, North Carolina for the purposes of identifying and mapping potential Hard Bottom Areas. The longshore limits of the data collection extend form New Topsail Inlet to the Surf City/North Topsail town line as identified on the Government furnished map. The offshore limits shall extend from the mean low water contour to the -25 feet NGVD 1929 contour as identified on the Government furnished map. 2. Survey Control. All horizontal and vertical control used for this survey shall be from the North Carolina or a Federal Agency Network and be of third order accuracy or better. All control loops must be tied to at least two or more control points. The Contractor shall furnish a list of all points used to the Government. All work shall be relative to NAD 1983 North Carolina State Plane Feet in the horizontal plane and NGVD 1929 in the vertical plane. The Government will provide control information for previously established Control Points along the length of the project area. 3. Clearances. The Contractor shall acquire all Clearances necessary to obtain the required data. All discussions for access to private or public property or restricted waters or airspace must be included in the required weekly status report with name of person, address, and telephone number. 4. Required Deliverables. The Contractor is required to deliver Side Scan Mosaic Raster Data Sets, Shapefiles, Metadata Records, a Weekly Status Reports, and a Final Written Report.
4.1 Side Scan Mosaic Raster Data Sets. The Contractor shall deliver Georeferenced Mosaics of the Raster Data sets from the Side Scan Survey. The Raster Data sets shall depict the backscatter information used to map the potential hard bottom areas in the project area. The Raster Data Sets shall be in a format compatible with ESRI ArcView/ArcInfo Version 9.0. 4.2 Shapefiles. The Contractor shall deliver Polygon Shapefiles defining the potential hard bottom areas within the project area. The Shapefiles shall be in a format compatible with ESRI ArcView/ArcInfo Version 9.0. 4.3 Metadata Record. An FGDC compliant metadata record for each spatial data deliverable shall be created using ESRI ArcView/ArcInfo ArcCatalog version 9.0. Appropriate information shall be entered in all required fields. The Contractor shall attach the appropriate metadata record to each spatial data file using ArcCatalog so that no importing or formatting of the metadata record is required by the Government.

2
5. Weekly Status Report. The Contractor is required to submit a Weekly Status Report each week, beginning on the Task Order Award Date, until all deliverables are received and accepted by the Government. The Weekly Status Report shall be delivered via e-mail no later than 8:00 AM each Monday and shall document the Contractor’s progress from the previous Monday through the previous Sunday. The status report shall itemize each scope item with percent of work complete and an estimated date of completion. The report shall also include the number and type of field crews working, a description of any problems and/or delays encountered, and any photographs of the site and/or significant site features (such as outlet structures, retaining walls, escarpments, etc.) and/or specialized data collection activities.
6. Final Written Report. A written report summarizing all data collection activities shall be submitted as a Portable Document File (PDF) and in bound hardcopy. The following items shall be included in the survey report:
• Written description of workflow to complete task order (start to finish) including
flowchart diagram and detailed description of QA/QC process • Dates and times of each data collection activity • Atmospheric Conditions for each day of data collection activity • All Horizontal and Vertical Control used including monument name, establishing
agency, date established, description, and published horizontal and vertical values • TBM descriptions with vertical values • Copy of all field notes • Complete and detailed list of all survey equipment used including copy of last
factory calibration report • Metadata Record as described in 4.3 above • Photographs of the site and any significant features or data collection techniques
used 7. Quality Control. If work is found to be in error, incomplete, illegible or unsatisfactory after assignment is completed, the Contractor shall be liable for all cost in connection with correcting such errors. Corrective work may be performed by Government personnel or Contractor personnel at the discretion of the Contracting Officer. In any event, the Contractor shall be responsible for all costs incurred for correction of such errors, including salaries, automotive expenses, equipment rental, supervision, and any other costs in connection therewith. All data and deliverables shall be reviewed for the following:
• Required coverage of the project limits • Capture of all required features • Required accuracies • Required horizontal and vertical datum • Adherence to the delivery order requirements
8. Technical POC. All technical questions concerning work under this task order shall be directed to Jim Jacaruso at (910) 251-4064.
3
9. Completion Date. All work required under this task order shall be completed and delivered no later than 21 calendar days from the Task Order Award Date. This schedule is subject to adjustment by the Contracting Officer in writing. 10. Deliver To. All work shall be delivered to: U. S. Army Corps of Engineers Wilmington District Attn: Jim Jacaruso, TS-EE 69 Darlington Avenue PO Box 1890 Wilmington, NC 28402-1890
General Reevaluation Report
and Environmental Impact Statement
on
Hurricane Protection and Beach Erosion Control
WEST ONSLOW BEACH AND NEW RIVER INLET (TOPSAIL BEACH), NORTH CAROLINA
Appendix R - Nearshore Hardbottom Survey
Attachment 2 - High-Resolution Remote Sensing of Potential Hard
Bottom Habitats: Topsail Island, NC July 2006 Survey Report

High-Resolution Remote Sensing of Potential Hard
Bottom Habitats: Topsail Island, NC July 2006
Survey Report
Project No. DACW54-02-D-0006, Delivery Order 0035, Nearshore Hardbottom
Sidescan Survey, Topsail Island, NC G&O Project Number 146046.T35.6480.GEO
Submitted by:
With Subconsultant:
ii
TABLE OF CONTENTS
TABLE OF CONTENTS ................................................................................................... ii
Executive Summary........................................................................................................1
Survey Preparation .........................................................................................................1
Survey Area ..................................................................................................................1
RTK-GPS Survey Control & Multibeam Calibration ......................................................2
RTK-GPS Network Adjustment & Site Calibration ........................................................3
Multibeam Echosounder Calibration Report .................................................................8
Data Processing Routines & QA/QC Information ......................................................14
Introduction .................................................................................................................14
Bathymetry Processing ...............................................................................................14
Side-Scan Processing.................................................................................................15
Typical Side-Scan Artifacts .........................................................................................16
Potential Hardbottom Identification .............................................................................20
Topsail Island Remote Sensing Workflow Diagram ..................................................22
Topsail Island Remote Sensing QA/QC Workflow Diagram......................................22
Graphical Summary of Deliverables............................................................................23
Appendix A – Official USACE Scope of Work ............................................................30
Appendix B - Benchmark Descriptions.......................................................................34
Appendix C– Field Notes, Daily GPS Quality & Copy of Field Book ........................41
Appendix D - R/V 4-Points Setup & Instrument Accuracies .....................................47
Appendix E – QTC Report ............................................................................................53
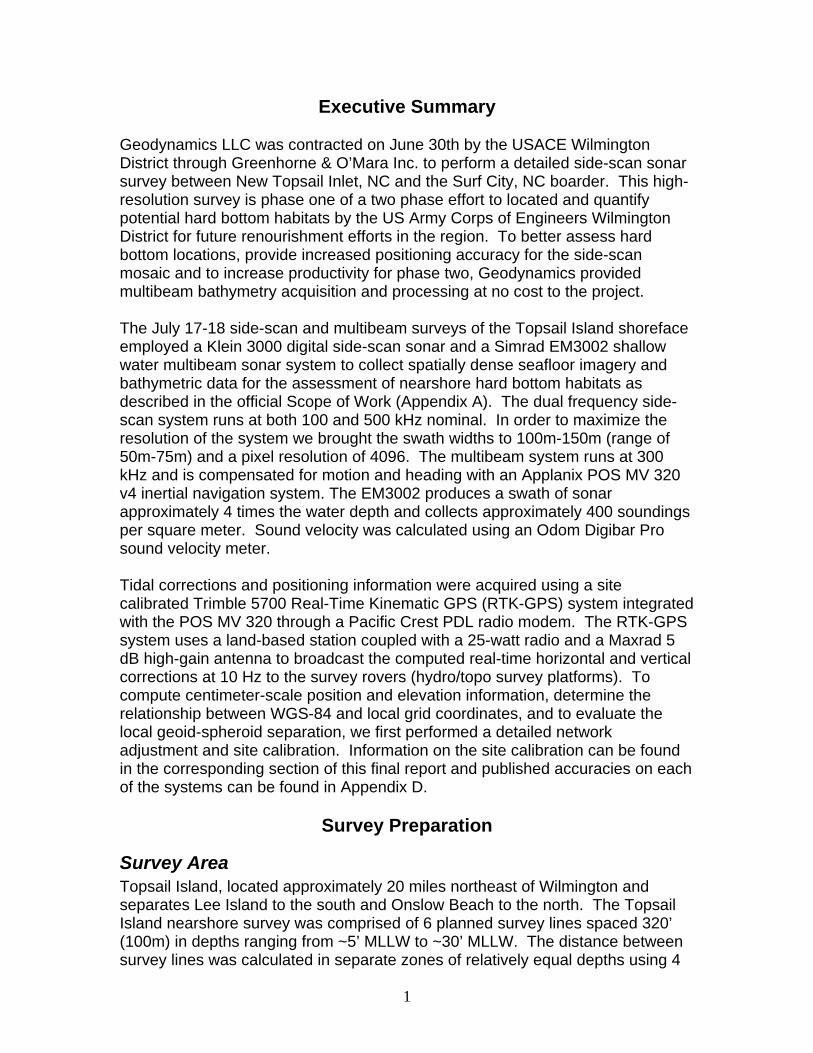
1
Executive Summary Geodynamics LLC was contracted on June 30th by the USACE Wilmington District through Greenhorne & O’Mara Inc. to perform a detailed side-scan sonar survey between New Topsail Inlet, NC and the Surf City, NC boarder. This high-resolution survey is phase one of a two phase effort to located and quantify potential hard bottom habitats by the US Army Corps of Engineers Wilmington District for future renourishment efforts in the region. To better assess hard bottom locations, provide increased positioning accuracy for the side-scan mosaic and to increase productivity for phase two, Geodynamics provided multibeam bathymetry acquisition and processing at no cost to the project. The July 17-18 side-scan and multibeam surveys of the Topsail Island shoreface employed a Klein 3000 digital side-scan sonar and a Simrad EM3002 shallow water multibeam sonar system to collect spatially dense seafloor imagery and bathymetric data for the assessment of nearshore hard bottom habitats as described in the official Scope of Work (Appendix A). The dual frequency side-scan system runs at both 100 and 500 kHz nominal. In order to maximize the resolution of the system we brought the swath widths to 100m-150m (range of 50m-75m) and a pixel resolution of 4096. The multibeam system runs at 300 kHz and is compensated for motion and heading with an Applanix POS MV 320 v4 inertial navigation system. The EM3002 produces a swath of sonar approximately 4 times the water depth and collects approximately 400 soundings per square meter. Sound velocity was calculated using an Odom Digibar Pro sound velocity meter. Tidal corrections and positioning information were acquired using a site calibrated Trimble 5700 Real-Time Kinematic GPS (RTK-GPS) system integrated with the POS MV 320 through a Pacific Crest PDL radio modem. The RTK-GPS system uses a land-based station coupled with a 25-watt radio and a Maxrad 5 dB high-gain antenna to broadcast the computed real-time horizontal and vertical corrections at 10 Hz to the survey rovers (hydro/topo survey platforms). To compute centimeter-scale position and elevation information, determine the relationship between WGS-84 and local grid coordinates, and to evaluate the local geoid-spheroid separation, we first performed a detailed network adjustment and site calibration. Information on the site calibration can be found in the corresponding section of this final report and published accuracies on each of the systems can be found in Appendix D.
Survey Preparation
Survey Area Topsail Island, located approximately 20 miles northeast of Wilmington and separates Lee Island to the south and Onslow Beach to the north. The Topsail Island nearshore survey was comprised of 6 planned survey lines spaced 320’ (100m) in depths ranging from ~5’ MLLW to ~30’ MLLW. The distance between survey lines was calculated in separate zones of relatively equal depths using 4
2
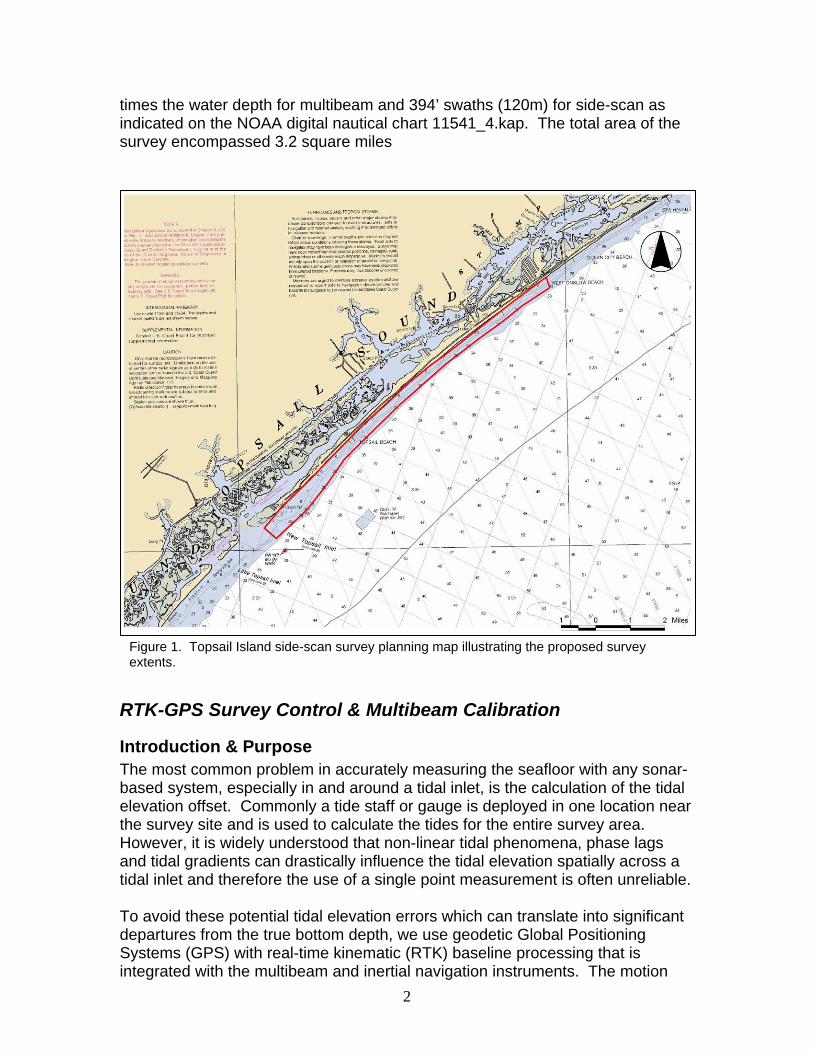
times the water depth for multibeam and 394’ swaths (120m) for side-scan as indicated on the NOAA digital nautical chart 11541_4.kap. The total area of the survey encompassed 3.2 square miles
RTK-GPS Survey Control & Multibeam Calibration
Introduction & Purpose The most common problem in accurately measuring the seafloor with any sonar-based system, especially in and around a tidal inlet, is the calculation of the tidal elevation offset. Commonly a tide staff or gauge is deployed in one location near the survey site and is used to calculate the tides for the entire survey area. However, it is widely understood that non-linear tidal phenomena, phase lags and tidal gradients can drastically influence the tidal elevation spatially across a tidal inlet and therefore the use of a single point measurement is often unreliable. To avoid these potential tidal elevation errors which can translate into significant departures from the true bottom depth, we use geodetic Global Positioning Systems (GPS) with real-time kinematic (RTK) baseline processing that is integrated with the multibeam and inertial navigation instruments. The motion
Figure 1. Topsail Island side-scan survey planning map illustrating the proposed survey extents.
3
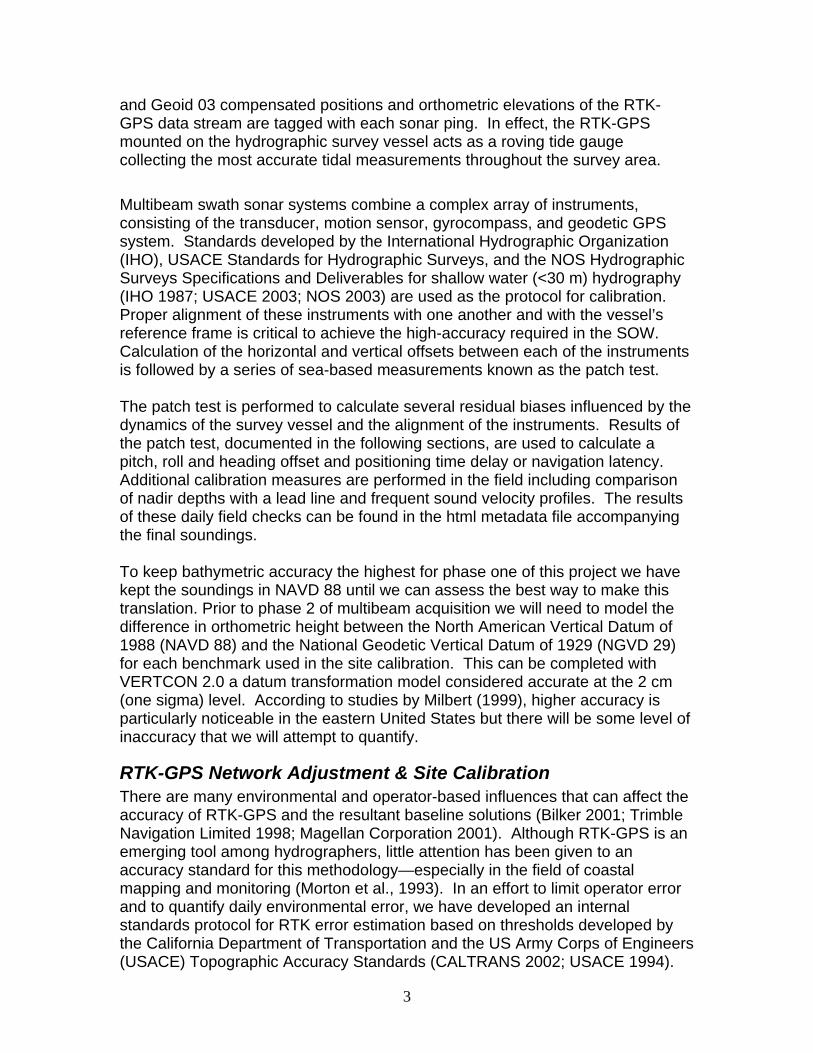
and Geoid 03 compensated positions and orthometric elevations of the RTK-GPS data stream are tagged with each sonar ping. In effect, the RTK-GPS mounted on the hydrographic survey vessel acts as a roving tide gauge collecting the most accurate tidal measurements throughout the survey area. Multibeam swath sonar systems combine a complex array of instruments, consisting of the transducer, motion sensor, gyrocompass, and geodetic GPS system. Standards developed by the International Hydrographic Organization (IHO), USACE Standards for Hydrographic Surveys, and the NOS Hydrographic Surveys Specifications and Deliverables for shallow water (<30 m) hydrography (IHO 1987; USACE 2003; NOS 2003) are used as the protocol for calibration. Proper alignment of these instruments with one another and with the vessel’s reference frame is critical to achieve the high-accuracy required in the SOW. Calculation of the horizontal and vertical offsets between each of the instruments is followed by a series of sea-based measurements known as the patch test. The patch test is performed to calculate several residual biases influenced by the dynamics of the survey vessel and the alignment of the instruments. Results of the patch test, documented in the following sections, are used to calculate a pitch, roll and heading offset and positioning time delay or navigation latency. Additional calibration measures are performed in the field including comparison of nadir depths with a lead line and frequent sound velocity profiles. The results of these daily field checks can be found in the html metadata file accompanying the final soundings. To keep bathymetric accuracy the highest for phase one of this project we have kept the soundings in NAVD 88 until we can assess the best way to make this translation. Prior to phase 2 of multibeam acquisition we will need to model the difference in orthometric height between the North American Vertical Datum of 1988 (NAVD 88) and the National Geodetic Vertical Datum of 1929 (NGVD 29) for each benchmark used in the site calibration. This can be completed with VERTCON 2.0 a datum transformation model considered accurate at the 2 cm (one sigma) level. According to studies by Milbert (1999), higher accuracy is particularly noticeable in the eastern United States but there will be some level of inaccuracy that we will attempt to quantify.
RTK-GPS Network Adjustment & Site Calibration There are many environmental and operator-based influences that can affect the accuracy of RTK-GPS and the resultant baseline solutions (Bilker 2001; Trimble Navigation Limited 1998; Magellan Corporation 2001). Although RTK-GPS is an emerging tool among hydrographers, little attention has been given to an accuracy standard for this methodology—especially in the field of coastal mapping and monitoring (Morton et al., 1993). In an effort to limit operator error and to quantify daily environmental error, we have developed an internal standards protocol for RTK error estimation based on thresholds developed by the California Department of Transportation and the US Army Corps of Engineers (USACE) Topographic Accuracy Standards (CALTRANS 2002; USACE 1994).
4
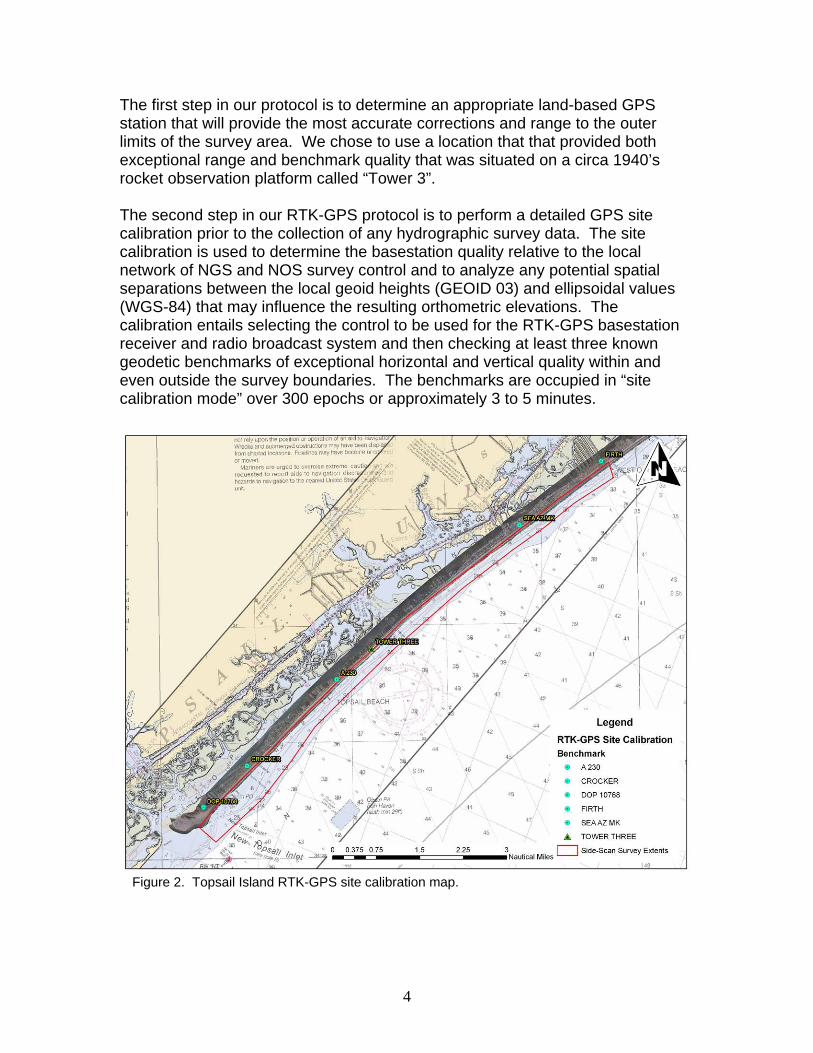
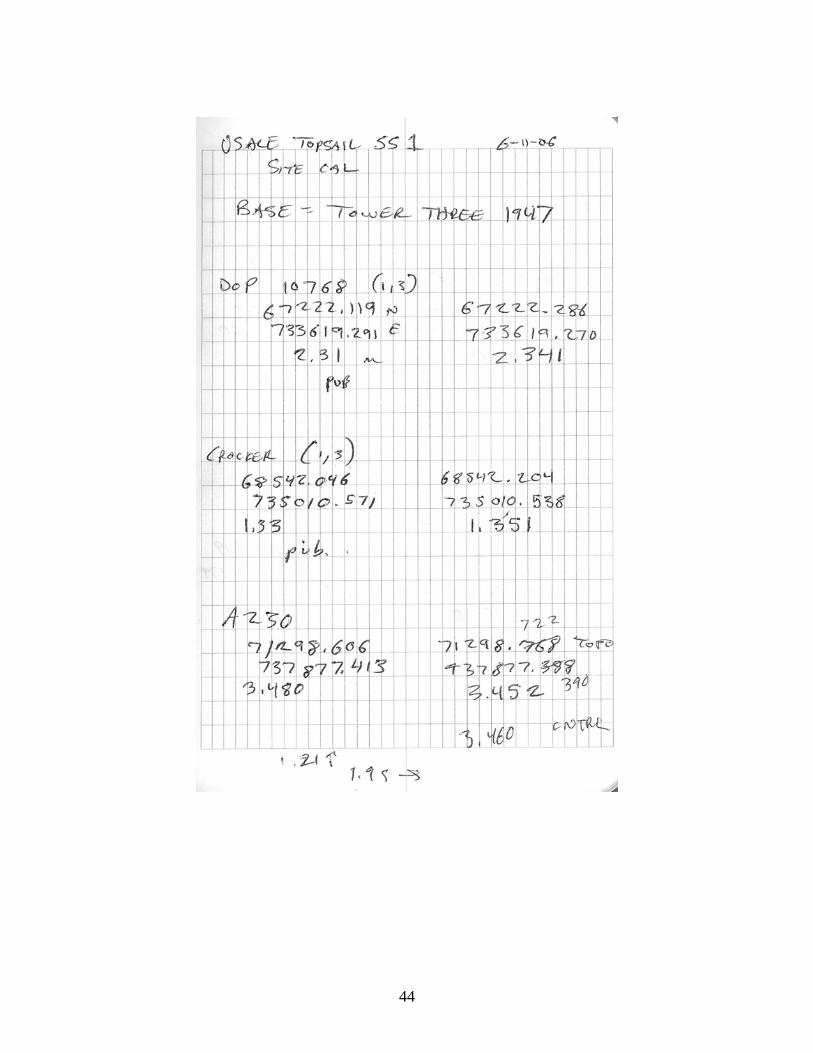
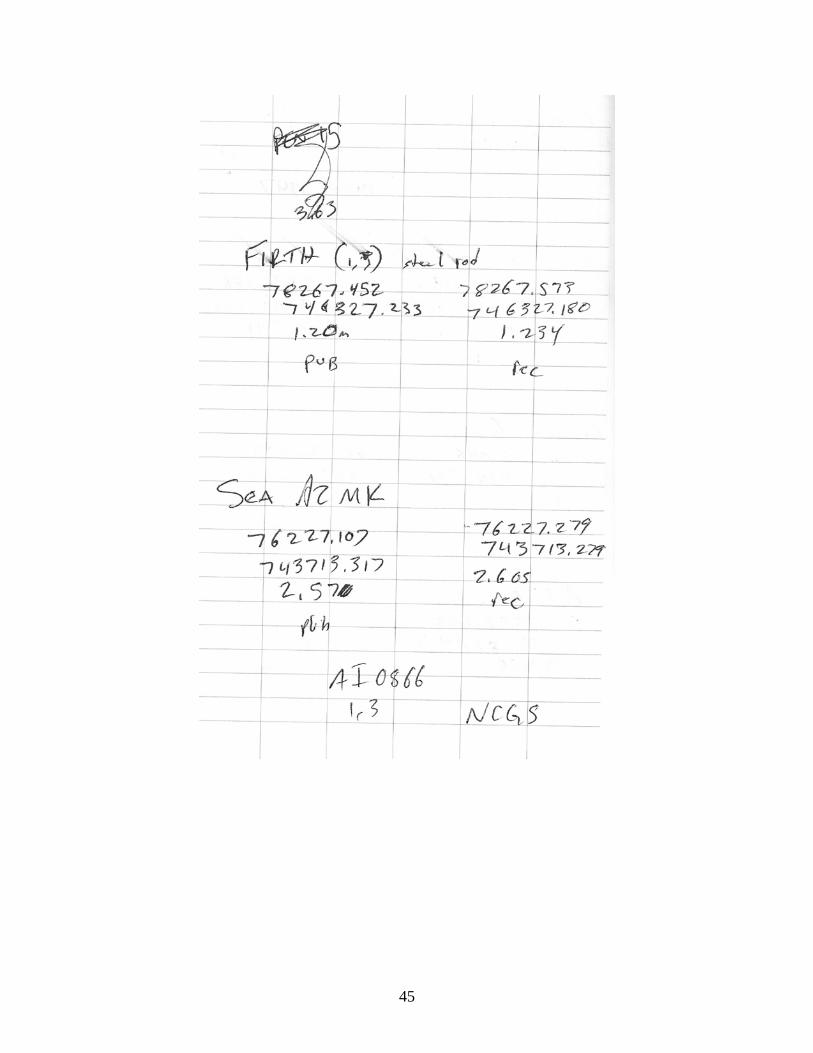
The first step in our protocol is to determine an appropriate land-based GPS station that will provide the most accurate corrections and range to the outer limits of the survey area. We chose to use a location that that provided both exceptional range and benchmark quality that was situated on a circa 1940’s rocket observation platform called “Tower 3”. The second step in our RTK-GPS protocol is to perform a detailed GPS site calibration prior to the collection of any hydrographic survey data. The site calibration is used to determine the basestation quality relative to the local network of NGS and NOS survey control and to analyze any potential spatial separations between the local geoid heights (GEOID 03) and ellipsoidal values (WGS-84) that may influence the resulting orthometric elevations. The calibration entails selecting the control to be used for the RTK-GPS basestation receiver and radio broadcast system and then checking at least three known geodetic benchmarks of exceptional horizontal and vertical quality within and even outside the survey boundaries. The benchmarks are occupied in “site calibration mode” over 300 epochs or approximately 3 to 5 minutes.
Figure 2. Topsail Island RTK-GPS site calibration map.
5
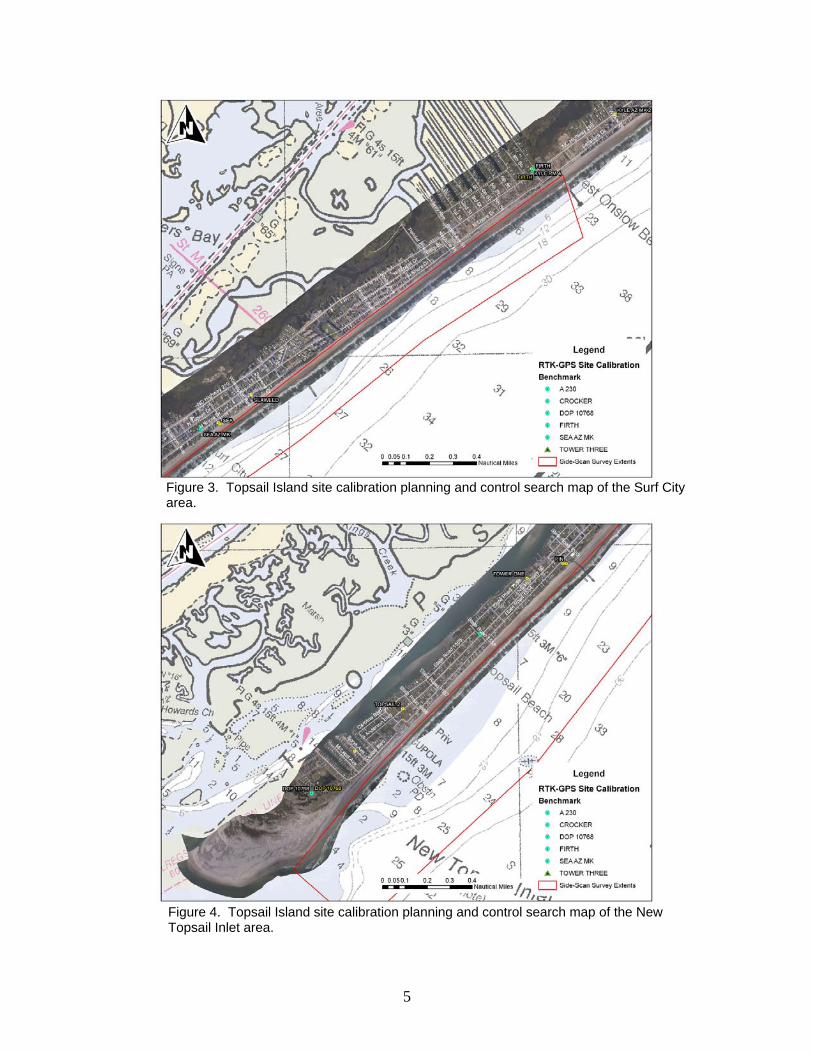
Figure 4. Topsail Island site calibration planning and control search map of the New Topsail Inlet area.
Figure 3. Topsail Island site calibration planning and control search map of the Surf City area.
6
7
8
Multibeam Echosounder Calibration Report
Calibration type: Multibeam Sonar The following calibration report documents procedures used to measure and adjust sensor biases and offsets for multibeam echosounder systems. This report has been adopted and modified from NOAA. Calibration must be conducted A) prior to CY survey data acquisition B) after installation of echosounder, position and vessel attitude equipment C) after changes to equipment installation or acquisition systems D) whenever the Hydrographer suspects incorrect calibration results. The Hydrographer shall periodically demonstrate that calibration correctors are valid for appropriate vessels and that data quality meets survey requirements. In the event the Hydrographer
Calibration Date: June 24, 2006 Ship Vessel RV 4-Points Echosounder System EM3002 Positioning System POS MV (tightly coupled)-RTK GPS Attitude System POS MV Sound Velocity Probe Odem Digibar Pro (profiler) / Valeport Mini SVS
(at head)
Annual Installation x System change x Periodic/QC Other
9
determines these correctors are no longer valid, or any part of the echosounder system configuration is changed or damaged, the Hydrographer must conduct new system calibrations. Multibeam echosounder calibrations must be designed carefully and individually in consideration of systems, vessel, location, environmental conditions and survey requirements. The calibration procedure should determine or verify system offsets and calibration correctors (residual system biases) for draft (static and dynamic), horizontal position control (DGPS), navigation timing error, heading, roll, and pitch. Standard calibration patch test procedures are described in Field Procedures for the Calibration of Multibeam Echo-sounding Systems, by André Godin (Documented in Chapter 17 of the Caris HIPS/SIPS 6.0 User Manual, 2006). Additional information is provided in POS/MV Model 320 Ver 4 System Manual (10/2003), Appendix F, Patch Test, and the NOAA Field Procedures Manual (FPM, 2003). The patch test method only corrects very basic alignment biases. These procedures are used to measure static navigation timing error, transducer pitch offset, transducer roll offset, and transducer azimuth offset (yaw). Dynamic and reference frame biases can be investigated using a reference surface.
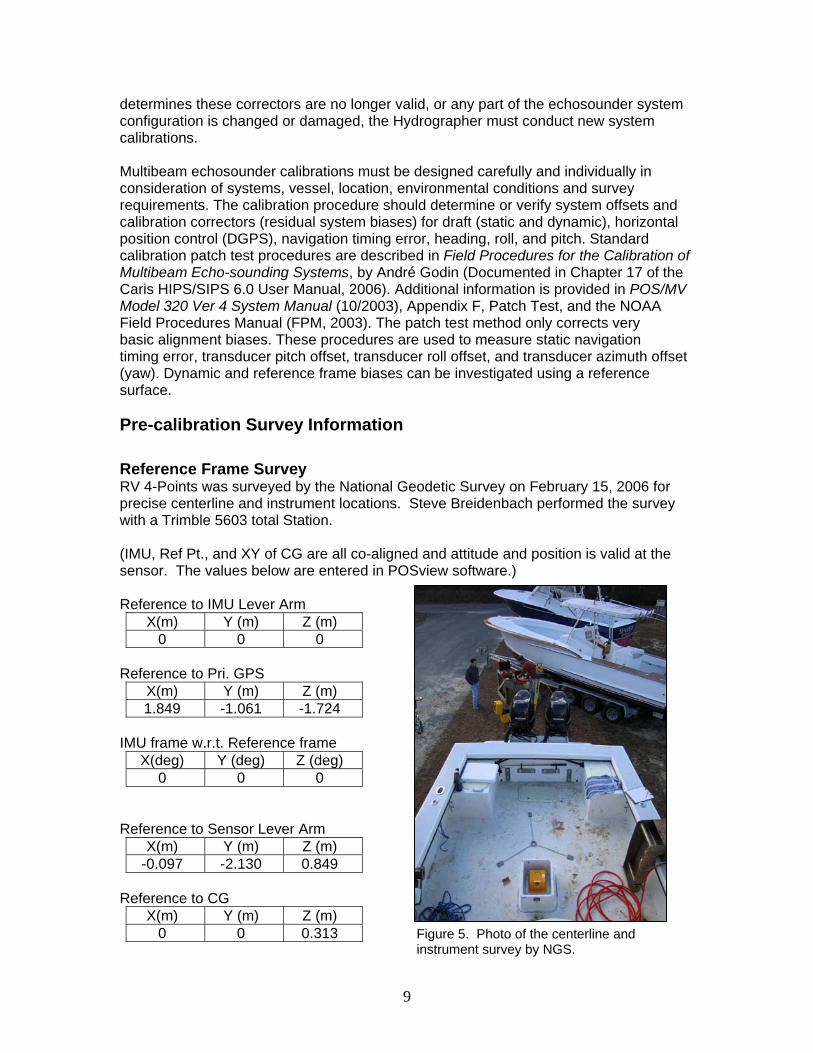
Pre-calibration Survey Information Reference Frame Survey RV 4-Points was surveyed by the National Geodetic Survey on February 15, 2006 for precise centerline and instrument locations. Steve Breidenbach performed the survey with a Trimble 5603 total Station. (IMU, Ref Pt., and XY of CG are all co-aligned and attitude and position is valid at the sensor. The values below are entered in POSview software.) Reference to IMU Lever Arm
X(m) Y (m) Z (m) 0 0 0
Reference to Pri. GPS
X(m) Y (m) Z (m) 1.849 -1.061 -1.724
IMU frame w.r.t. Reference frame
X(deg) Y (deg) Z (deg) 0 0 0
Reference to Sensor Lever Arm
X(m) Y (m) Z (m) -0.097 -2.130 0.849
Reference to CG
X(m) Y (m) Z (m) 0 0 0.313
Figure 5. Photo of the centerline and instrument survey by NGS.
10
Reference to Vessel (Pt of validation for attitude and nav) X(m) Y (m) Z (m)
-0.097 -2.130 0.849 __X__Measurements verified for this calibration. ___ __Drawing and table attached. _____Drawing and table included with project report
POS MV Configuration File: 4_points_022806._*________________ Notes: _NGS vessel survey results were put in POSview and GAMS calibration was done on February 28, 2006___.
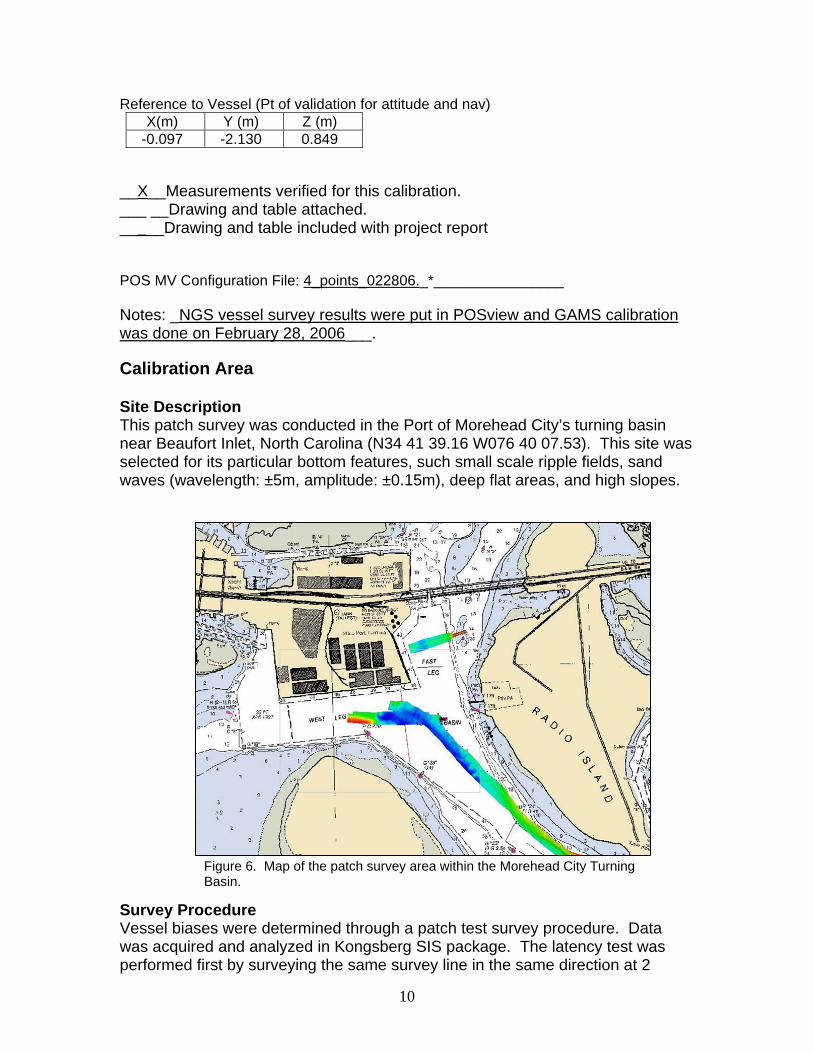
Calibration Area Site Description This patch survey was conducted in the Port of Morehead City’s turning basin near Beaufort Inlet, North Carolina (N34 41 39.16 W076 40 07.53). This site was selected for its particular bottom features, such small scale ripple fields, sand waves (wavelength: ±5m, amplitude: ±0.15m), deep flat areas, and high slopes. Survey Procedure Vessel biases were determined through a patch test survey procedure. Data was acquired and analyzed in Kongsberg SIS package. The latency test was performed first by surveying the same survey line in the same direction at 2
Figure 6. Map of the patch survey area within the Morehead City Turning Basin.
11
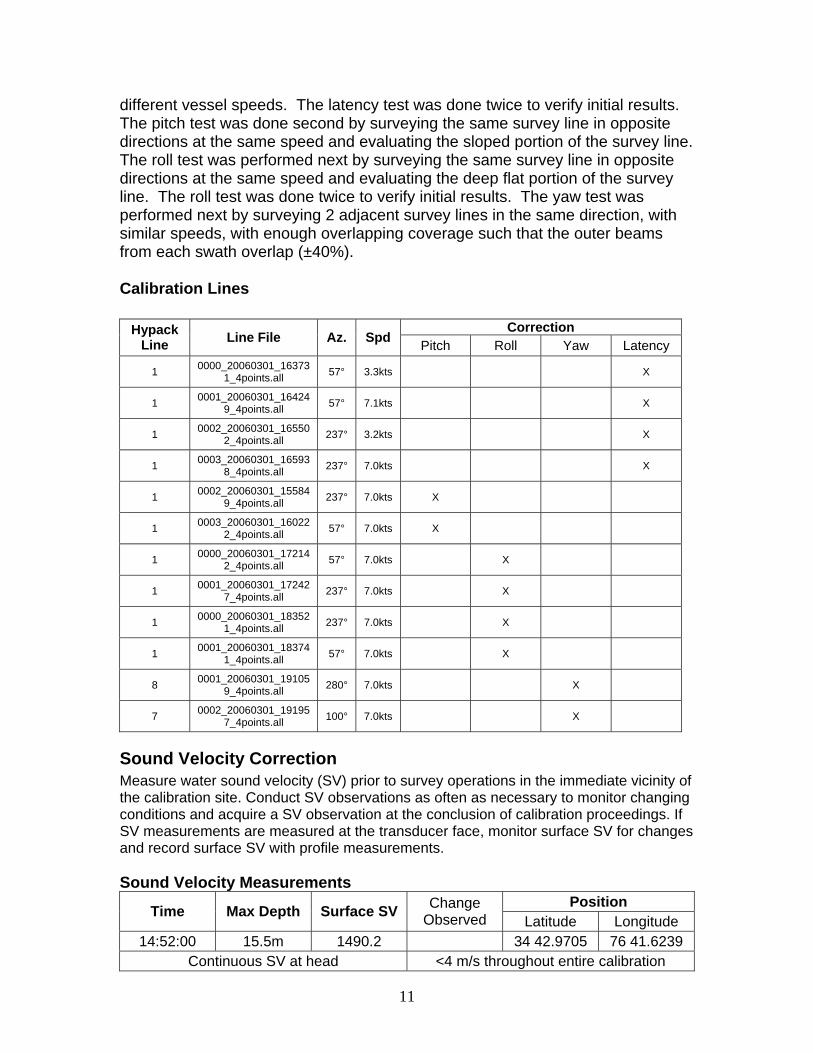
different vessel speeds. The latency test was done twice to verify initial results. The pitch test was done second by surveying the same survey line in opposite directions at the same speed and evaluating the sloped portion of the survey line. The roll test was performed next by surveying the same survey line in opposite directions at the same speed and evaluating the deep flat portion of the survey line. The roll test was done twice to verify initial results. The yaw test was performed next by surveying 2 adjacent survey lines in the same direction, with similar speeds, with enough overlapping coverage such that the outer beams from each swath overlap (±40%). Calibration Lines
Correction Hypack Line Line File Az. Spd Pitch Roll Yaw Latency
1 0000_20060301_163731_4points.all 57° 3.3kts X
1 0001_20060301_164249_4points.all 57° 7.1kts X
1 0002_20060301_165502_4points.all 237° 3.2kts X
1 0003_20060301_165938_4points.all 237° 7.0kts X
1 0002_20060301_155849_4points.all 237° 7.0kts X
1 0003_20060301_160222_4points.all 57° 7.0kts X
1 0000_20060301_172142_4points.all 57° 7.0kts X
1 0001_20060301_172427_4points.all 237° 7.0kts X
1 0000_20060301_183521_4points.all 237° 7.0kts X
1 0001_20060301_183741_4points.all 57° 7.0kts X
8 0001_20060301_191059_4points.all 280° 7.0kts X
7 0002_20060301_191957_4points.all 100° 7.0kts X
Sound Velocity Correction Measure water sound velocity (SV) prior to survey operations in the immediate vicinity of the calibration site. Conduct SV observations as often as necessary to monitor changing conditions and acquire a SV observation at the conclusion of calibration proceedings. If SV measurements are measured at the transducer face, monitor surface SV for changes and record surface SV with profile measurements. Sound Velocity Measurements
Position Time Max Depth Surface SV Change Observed Latitude Longitude
14:52:00 15.5m 1490.2 34 42.9705 76 41.6239 Continuous SV at head <4 m/s throughout entire calibration
12
Data Acquisition and Processing Guidelines Initially, calibration measurement offsets should be set to zero in vessel configuration files. Static and dynamic draft offsets, inertial measurement unit (IMU) lever arm offsets, and vessel reference frame offsets must be entered in appropriate software applications prior to bias analysis. Perform minimal cleaning to eliminate gross flyers from sounding data. Navigation Timing Error (NTE) Measure NTE correction through examination of a profile of the center beams from lines run in the same direction at maximum and minimum vessel speeds. NTE is best observed in shallow water. Transducer Pitch Offset (TPO) Apply NTE correction. Measure TPO correction through examination of a profile of the center beams from lines run up and down a bounded slope or across a conspicuous feature. Acquire data on lines oriented in opposite directions, at the same vessel speed. TPO is best observed in deep water. Transducer Roll Offset (TRO) Apply NTE and TPO corrections. Measure the TRO correction through examination of roll on the outer beams across parallel overlapping lines. TRO is best observed over flat terrain in deep water. An additional check for TRO adjustment can be performed by running two lines parallel to a sloped surface. Transducer Azimuth Offset (TAO or yaw) Apply NTE, TPO and TRO corrections. Measure TAO correction through examination of a conspicuous topographic feature observed on the outer beams of lines run in opposite directions.
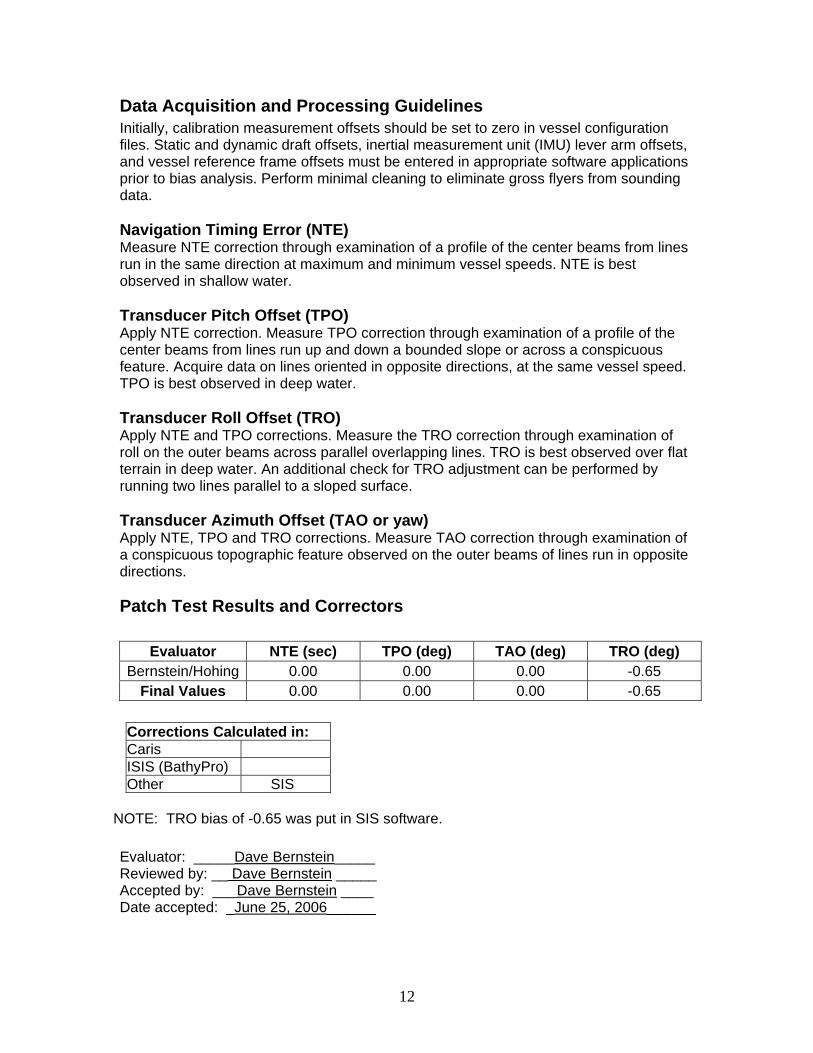
Patch Test Results and Correctors
Evaluator NTE (sec) TPO (deg) TAO (deg) TRO (deg) Bernstein/Hohing 0.00 0.00 0.00 -0.65
Final Values 0.00 0.00 0.00 -0.65 Corrections Calculated in: Caris ISIS (BathyPro) Other SIS
NOTE: TRO bias of -0.65 was put in SIS software. Evaluator: _____Dave Bernstein_____ Reviewed by: __ Dave Bernstein _____ Accepted by: ___Dave Bernstein ____ Date accepted: _June 25, 2006______
13
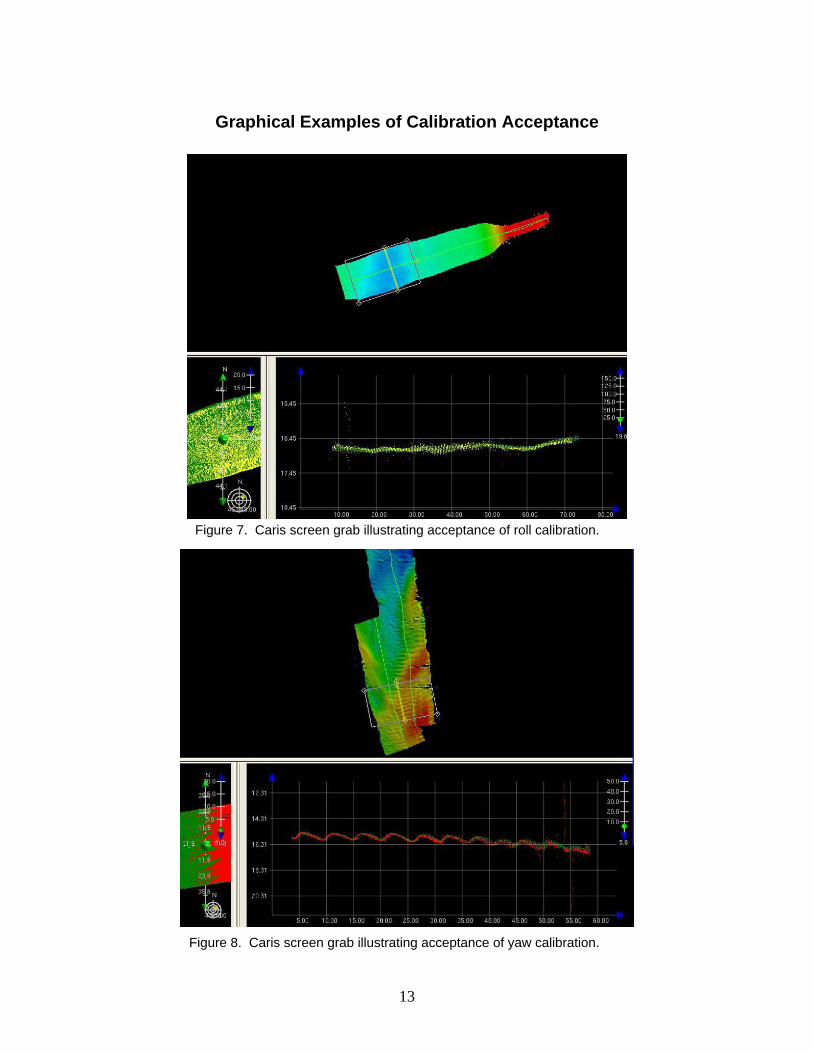
Graphical Examples of Calibration Acceptance
Figure 7. Caris screen grab illustrating acceptance of roll calibration.
Figure 8. Caris screen grab illustrating acceptance of yaw calibration.
14
Data Processing Routines & QA/QC Information
Introduction Processing high-density multibeam bathymetry and backscatter data requires a multitude of processing routines and data quality analyses. The following section will detail all aspects of data post-processing for the Beaufort Inlet multibeam surveys. Also presented in this section is detailed QA/QC information and analysis generated throughout the various processing procedures.
Bathymetry Processing The multibeam collects swath widths approximately 4 times the water depth. The portions of swath, mainly in the outer beams, that exhibit areas of inconsistent data are clipped and not included in the final digital file. Sounding track lines are generally parallel to each other and parallel to the seafloor contour. Sinuous lines and data acquired during turns are not included in the final processed data. To meet the accuracy and resolution standards for measured depths specified in the USACE Hydrographic Surveying Manual and the NOS Hydrographic Surveys, Specifications and Deliverables Manual, measured echosounder depths were corrected for all departures from true depths attributable to the method of sounding or to faults in the measuring apparatus. These corrections are subdivided into four categories, and are listed below in the sequence in which they were applied to the data.
1. Instrument error corrections: included to account for the sources of error related to the sounding equipment itself.
2. Vessel offsets: added to the observed soundings to account for the depth of the echosounder below the water surface, positioning of the motion reference unit, and GPS antenna.
3. Velocity of sound correctors: applied to the soundings to compensate for the fact that echosounders may only display depths based on an assumed sound velocity profile while the true velocity may vary in time and space.
4. Heave, pitch, roll, heading and navigation latency corrections: applied to the multibeam soundings to correct for the effect of vessel motion caused by waves and swells, the error in the vessel's heading, and the time delay from the moment the position is measured until the data is received by the GPS receiver.
Multibeam Data Processing Steps in CARIS HIPS software: The EM3002 sonar system has a unique arrangement of data flow. Most settings that influence the data are put in before and during a survey and therefore are not a factor in data processing (these include vessel offsets, lever arms, vessel biases, timing biases, and survey sound velocity). Vessel attitude is also processed real-time during a survey.
15
Post-processing of multibeam data consist of attitude and navigation editing, merging, swath editing, area-based editing, and exporting of final data.
1. Attitude & Navigation Editing: Errors or gaps in attitude and navigation information causing errors in soundings are edited.
2. Merging: Computing and integrating the GPS tide in the sounding data.
Additional sound velocity corrections are made if needed in this phase. Draft changes for datum conversions are made here as well.
3. Total Propagated Error (TPE) is calculated
4. Swath- and beam-based filters and TPE (IHO standards) filters are
applied.
5. Swath Editing: Swaths are edited for erroneous data if needed
6. Base or CUBE Surface is created for area- and CUBE-based editing.
7. Area-based editing using the subset editor to edit/check erroneous data only within the desired subset.
8. CUBE filtering (if needed)
9. Recompute TPE
10. Recompute CUBE and/or base surface 11. Final export of base surface to XYZ decimated soundings (1m).
NOTE: Bathy is delivered in NAVD 88 until we determine if phase 2 will require the NGVD 29 vertical datum. Also, bathy data maybe adjusted in phase 2 once we get some overlapping coverage to determine slight offsets that may need to be applied for roll due to the towing of the side-scan sonar.
Side-Scan Processing 1. Side scan is replayed (ISIS) and slant range corrected. Areas that have lost bottom track data are manually digitized to replace lost altitude data. 2. Appropriate image corrections are determine in ISIS and defined for the mosaic procedure. - A threshold of 4 was used for all files incorporated in the mosaic. This means the 8 bit or 16 bit data is shifted by 4 bits to correct the histogram when the data is played for mosaic.
16
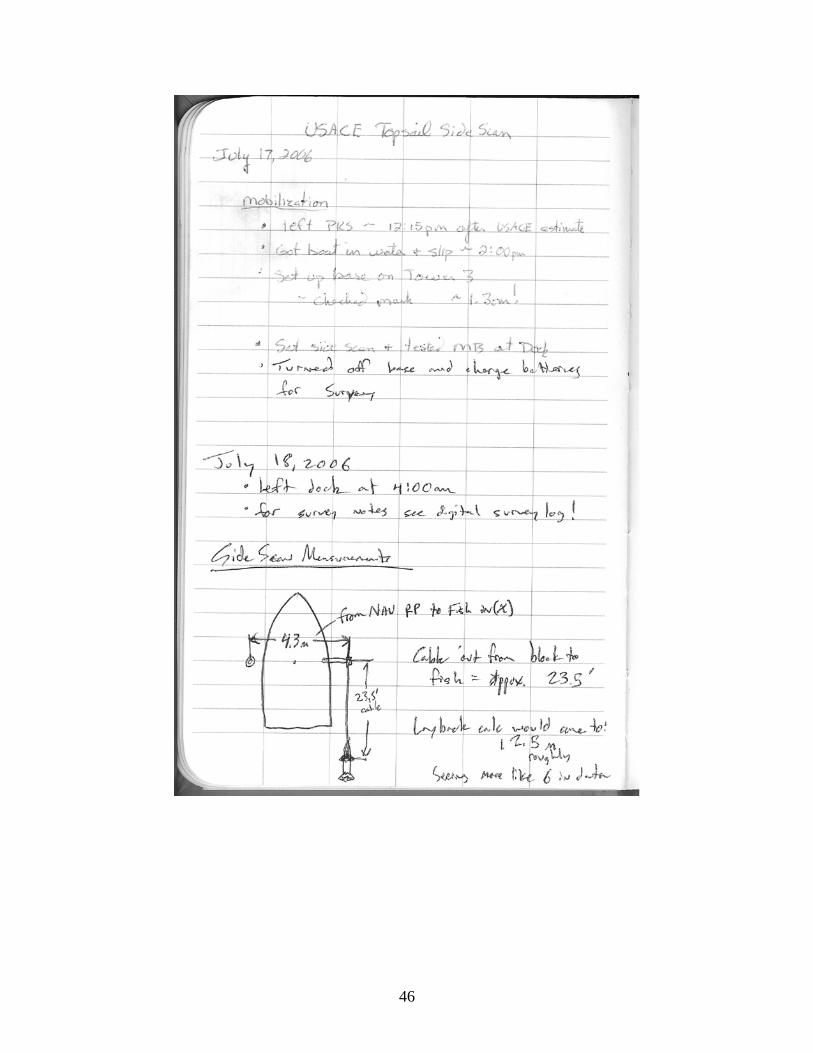
- A “STANDARD: TVG correction with a Pixel to Pixel Balance correction was applied to all files in the mosaic. This correction implemented a 4% darkness and a 10% decay rate. 3. The data is then mosaiced using ISIS to play back the data and Delphmap Mosaic to create the mosaic file. All of the mosaic setting and corrections are applied in Delph Mosaic. - layback = 4.5m - X shift = 4.3m - set data resolution 50 cm for channels 1-2 15cm for channels 3-4 - cover up for overlapping lines - fill gaps between pings - use course made good for heading (heading not as useful due to unknown declinations to the klein mag compass)
During this stage, the depth, delay, and duration settings are altered for each file played back in order to provide adjacent lines with specific coverage (overlap) in ISIS. 4. The mosaic in Triton DDS_VIF format is then exported to Geo-Tiff file format with associated .world file.
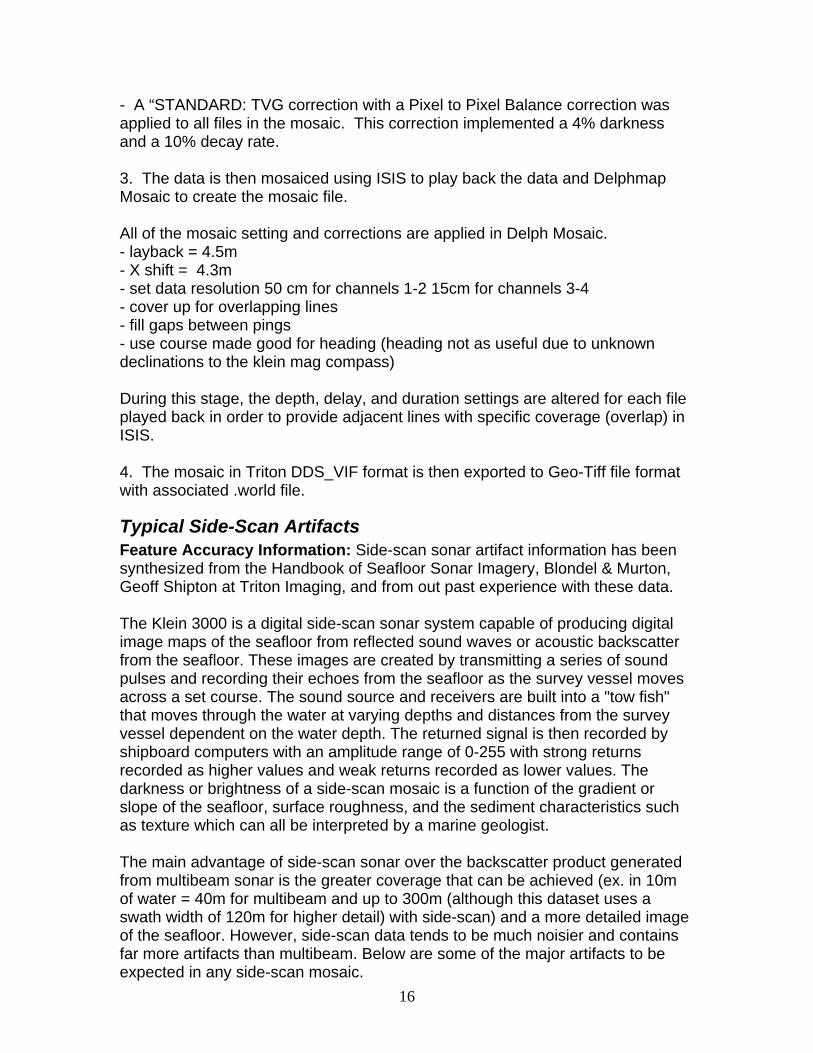
Typical Side-Scan Artifacts Feature Accuracy Information: Side-scan sonar artifact information has been synthesized from the Handbook of Seafloor Sonar Imagery, Blondel & Murton, Geoff Shipton at Triton Imaging, and from out past experience with these data. The Klein 3000 is a digital side-scan sonar system capable of producing digital image maps of the seafloor from reflected sound waves or acoustic backscatter from the seafloor. These images are created by transmitting a series of sound pulses and recording their echoes from the seafloor as the survey vessel moves across a set course. The sound source and receivers are built into a "tow fish" that moves through the water at varying depths and distances from the survey vessel dependent on the water depth. The returned signal is then recorded by shipboard computers with an amplitude range of 0-255 with strong returns recorded as higher values and weak returns recorded as lower values. The darkness or brightness of a side-scan mosaic is a function of the gradient or slope of the seafloor, surface roughness, and the sediment characteristics such as texture which can all be interpreted by a marine geologist. The main advantage of side-scan sonar over the backscatter product generated from multibeam sonar is the greater coverage that can be achieved (ex. in 10m of water = 40m for multibeam and up to 300m (although this dataset uses a swath width of 120m for higher detail) with side-scan) and a more detailed image of the seafloor. However, side-scan data tends to be much noisier and contains far more artifacts than multibeam. Below are some of the major artifacts to be expected in any side-scan mosaic.
17
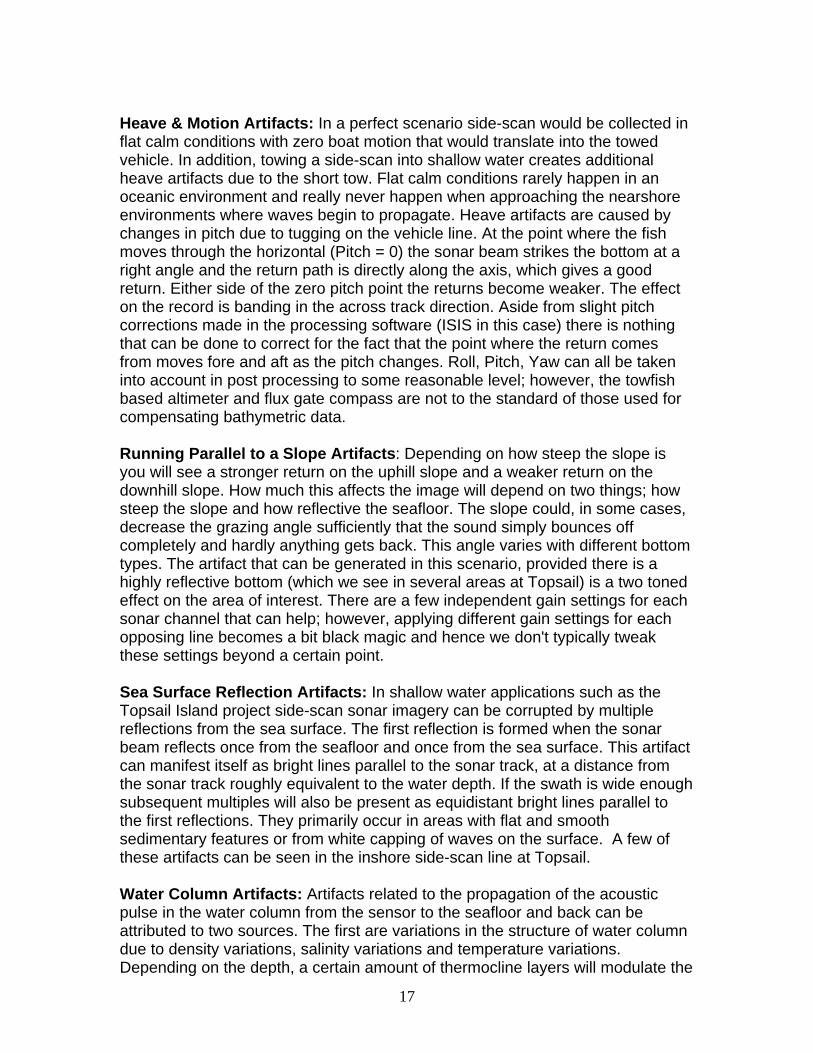
Heave & Motion Artifacts: In a perfect scenario side-scan would be collected in flat calm conditions with zero boat motion that would translate into the towed vehicle. In addition, towing a side-scan into shallow water creates additional heave artifacts due to the short tow. Flat calm conditions rarely happen in an oceanic environment and really never happen when approaching the nearshore environments where waves begin to propagate. Heave artifacts are caused by changes in pitch due to tugging on the vehicle line. At the point where the fish moves through the horizontal (Pitch = 0) the sonar beam strikes the bottom at a right angle and the return path is directly along the axis, which gives a good return. Either side of the zero pitch point the returns become weaker. The effect on the record is banding in the across track direction. Aside from slight pitch corrections made in the processing software (ISIS in this case) there is nothing that can be done to correct for the fact that the point where the return comes from moves fore and aft as the pitch changes. Roll, Pitch, Yaw can all be taken into account in post processing to some reasonable level; however, the towfish based altimeter and flux gate compass are not to the standard of those used for compensating bathymetric data. Running Parallel to a Slope Artifacts: Depending on how steep the slope is you will see a stronger return on the uphill slope and a weaker return on the downhill slope. How much this affects the image will depend on two things; how steep the slope and how reflective the seafloor. The slope could, in some cases, decrease the grazing angle sufficiently that the sound simply bounces off completely and hardly anything gets back. This angle varies with different bottom types. The artifact that can be generated in this scenario, provided there is a highly reflective bottom (which we see in several areas at Topsail) is a two toned effect on the area of interest. There are a few independent gain settings for each sonar channel that can help; however, applying different gain settings for each opposing line becomes a bit black magic and hence we don't typically tweak these settings beyond a certain point. Sea Surface Reflection Artifacts: In shallow water applications such as the Topsail Island project side-scan sonar imagery can be corrupted by multiple reflections from the sea surface. The first reflection is formed when the sonar beam reflects once from the seafloor and once from the sea surface. This artifact can manifest itself as bright lines parallel to the sonar track, at a distance from the sonar track roughly equivalent to the water depth. If the swath is wide enough subsequent multiples will also be present as equidistant bright lines parallel to the first reflections. They primarily occur in areas with flat and smooth sedimentary features or from white capping of waves on the surface. A few of these artifacts can be seen in the inshore side-scan line at Topsail. Water Column Artifacts: Artifacts related to the propagation of the acoustic pulse in the water column from the sensor to the seafloor and back can be attributed to two sources. The first are variations in the structure of water column due to density variations, salinity variations and temperature variations. Depending on the depth, a certain amount of thermocline layers will modulate the
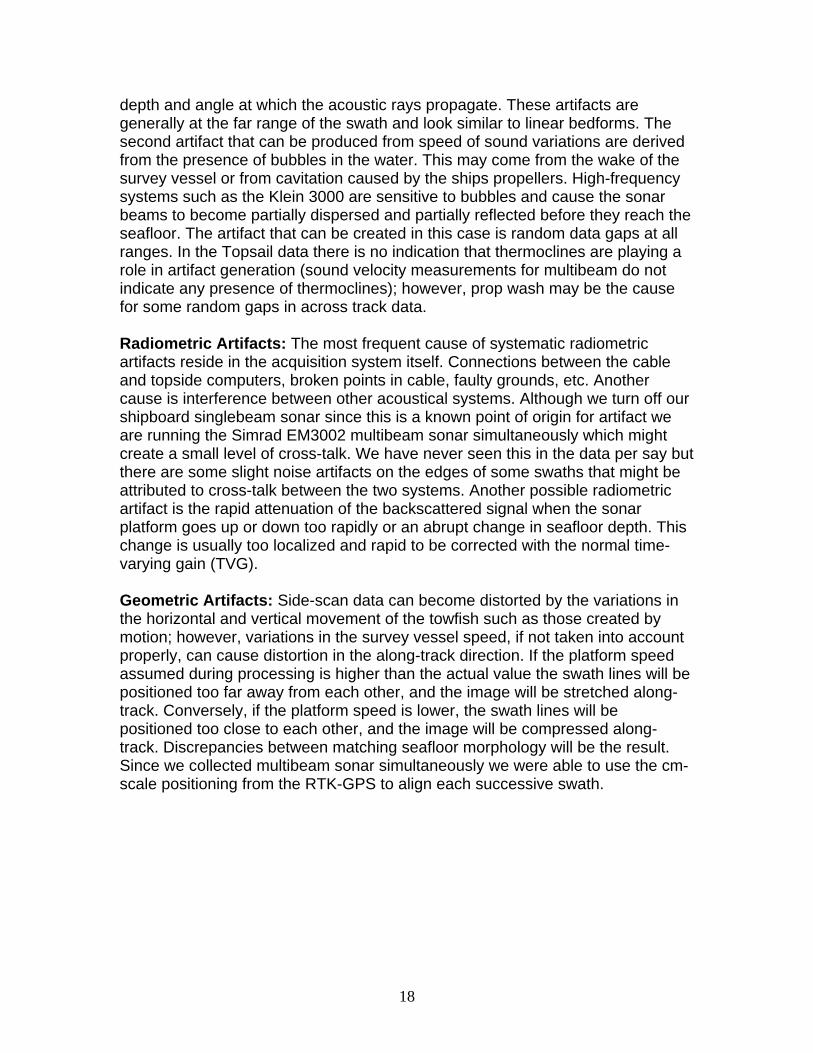
18
depth and angle at which the acoustic rays propagate. These artifacts are generally at the far range of the swath and look similar to linear bedforms. The second artifact that can be produced from speed of sound variations are derived from the presence of bubbles in the water. This may come from the wake of the survey vessel or from cavitation caused by the ships propellers. High-frequency systems such as the Klein 3000 are sensitive to bubbles and cause the sonar beams to become partially dispersed and partially reflected before they reach the seafloor. The artifact that can be created in this case is random data gaps at all ranges. In the Topsail data there is no indication that thermoclines are playing a role in artifact generation (sound velocity measurements for multibeam do not indicate any presence of thermoclines); however, prop wash may be the cause for some random gaps in across track data. Radiometric Artifacts: The most frequent cause of systematic radiometric artifacts reside in the acquisition system itself. Connections between the cable and topside computers, broken points in cable, faulty grounds, etc. Another cause is interference between other acoustical systems. Although we turn off our shipboard singlebeam sonar since this is a known point of origin for artifact we are running the Simrad EM3002 multibeam sonar simultaneously which might create a small level of cross-talk. We have never seen this in the data per say but there are some slight noise artifacts on the edges of some swaths that might be attributed to cross-talk between the two systems. Another possible radiometric artifact is the rapid attenuation of the backscattered signal when the sonar platform goes up or down too rapidly or an abrupt change in seafloor depth. This change is usually too localized and rapid to be corrected with the normal time-varying gain (TVG). Geometric Artifacts: Side-scan data can become distorted by the variations in the horizontal and vertical movement of the towfish such as those created by motion; however, variations in the survey vessel speed, if not taken into account properly, can cause distortion in the along-track direction. If the platform speed assumed during processing is higher than the actual value the swath lines will be positioned too far away from each other, and the image will be stretched along-track. Conversely, if the platform speed is lower, the swath lines will be positioned too close to each other, and the image will be compressed along-track. Discrepancies between matching seafloor morphology will be the result. Since we collected multibeam sonar simultaneously we were able to use the cm-scale positioning from the RTK-GPS to align each successive swath.
19
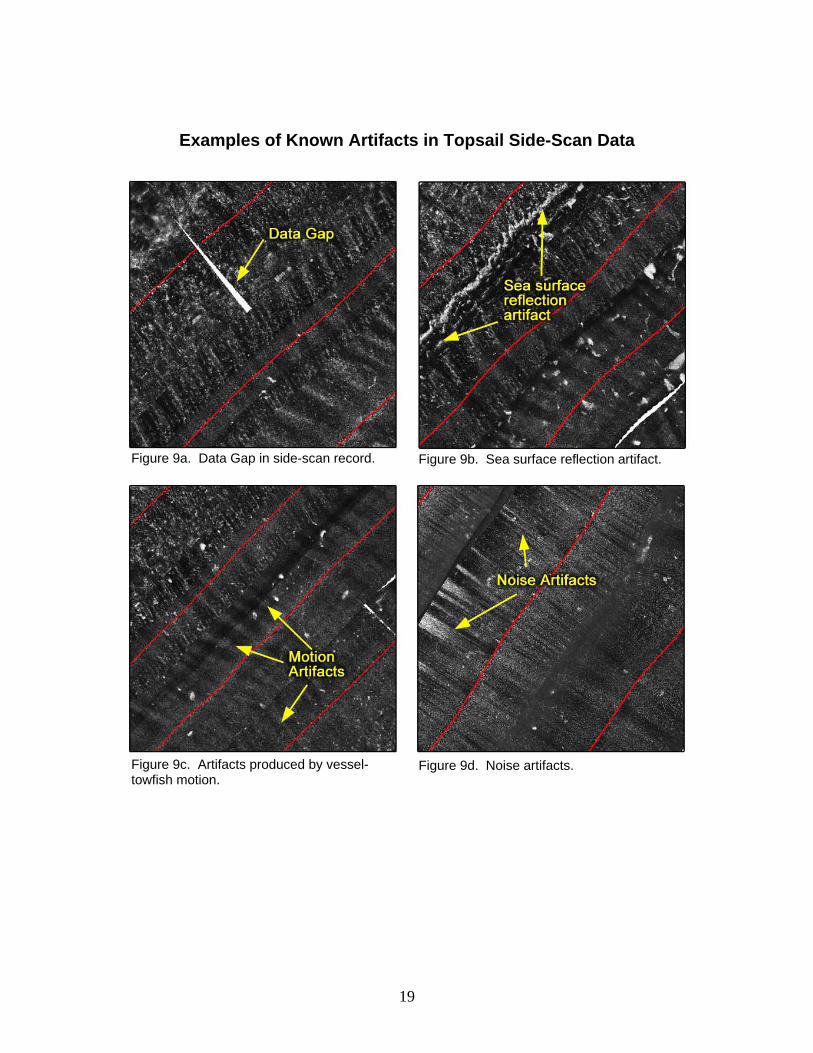
Examples of Known Artifacts in Topsail Side-Scan Data
Figure 9c. Artifacts produced by vessel- towfish motion.
Figure 9d. Noise artifacts.
Figure 9a. Data Gap in side-scan record. Figure 9b. Sea surface reflection artifact.
20
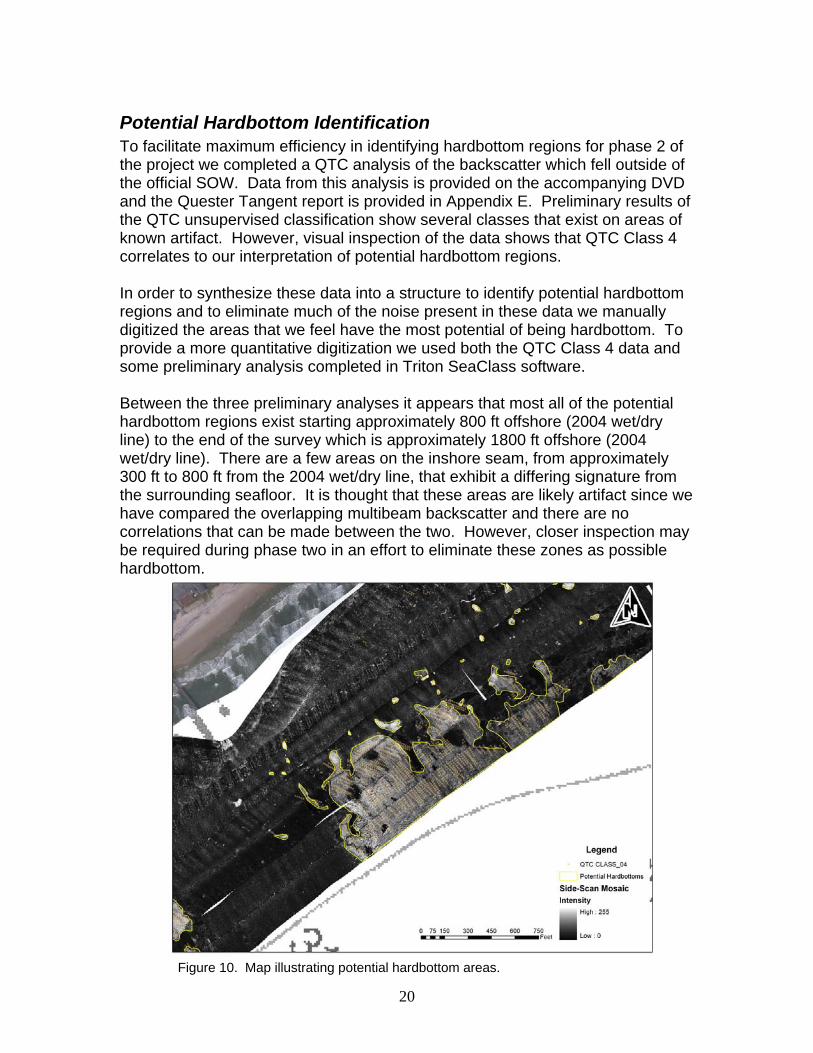
Potential Hardbottom Identification To facilitate maximum efficiency in identifying hardbottom regions for phase 2 of the project we completed a QTC analysis of the backscatter which fell outside of the official SOW. Data from this analysis is provided on the accompanying DVD and the Quester Tangent report is provided in Appendix E. Preliminary results of the QTC unsupervised classification show several classes that exist on areas of known artifact. However, visual inspection of the data shows that QTC Class 4 correlates to our interpretation of potential hardbottom regions. In order to synthesize these data into a structure to identify potential hardbottom regions and to eliminate much of the noise present in these data we manually digitized the areas that we feel have the most potential of being hardbottom. To provide a more quantitative digitization we used both the QTC Class 4 data and some preliminary analysis completed in Triton SeaClass software. Between the three preliminary analyses it appears that most all of the potential hardbottom regions exist starting approximately 800 ft offshore (2004 wet/dry line) to the end of the survey which is approximately 1800 ft offshore (2004 wet/dry line). There are a few areas on the inshore seam, from approximately 300 ft to 800 ft from the 2004 wet/dry line, that exhibit a differing signature from the surrounding seafloor. It is thought that these areas are likely artifact since we have compared the overlapping multibeam backscatter and there are no correlations that can be made between the two. However, closer inspection may be required during phase two in an effort to eliminate these zones as possible hardbottom.
Figure 10. Map illustrating potential hardbottom areas.
21
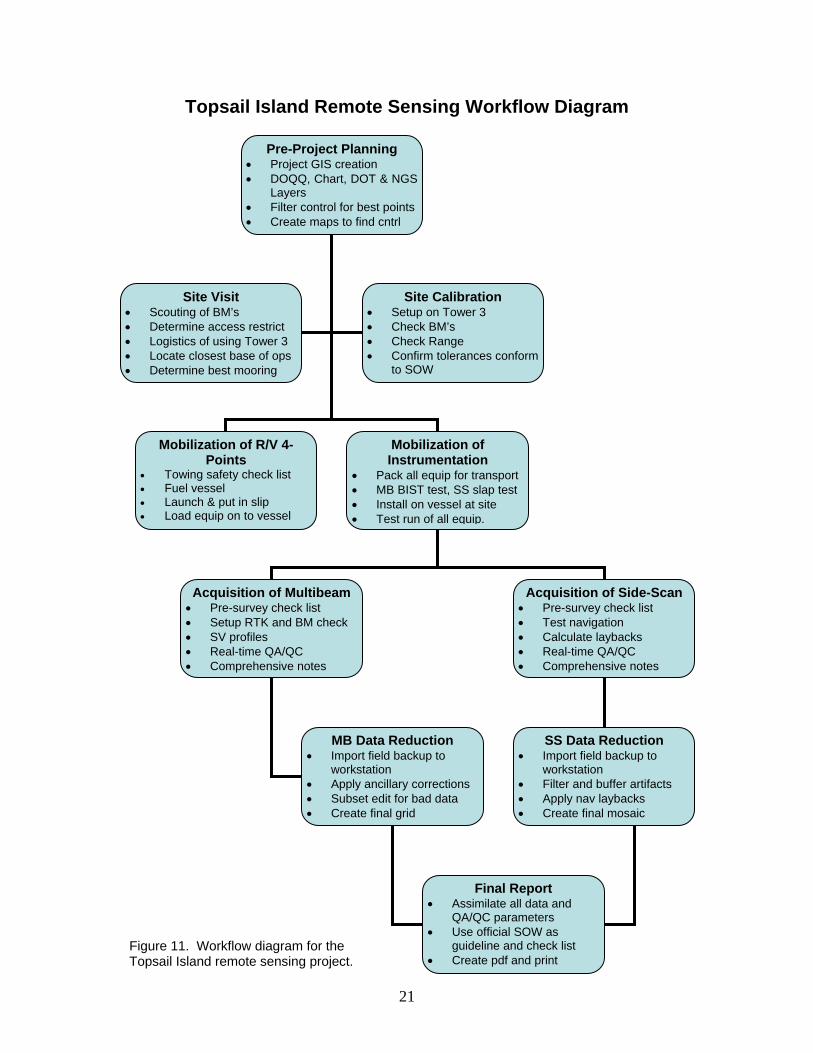
Topsail Island Remote Sensing Workflow Diagram
Pre-Project Planning • Project GIS creation • DOQQ, Chart, DOT & NGS
Layers • Filter control for best points• Create maps to find cntrl
Mobilization of R/V 4-Points
• Towing safety check list • Fuel vessel • Launch & put in slip • Load equip on to vessel
Mobilization of Instrumentation
• Pack all equip for transport• MB BIST test, SS slap test• Install on vessel at site • Test run of all equip.
Site Visit • Scouting of BM’s • Determine access restrict • Logistics of using Tower 3 • Locate closest base of ops • Determine best mooring
Site Calibration • Setup on Tower 3 • Check BM’s • Check Range • Confirm tolerances conform
to SOW
Acquisition of Multibeam• Pre-survey check list • Setup RTK and BM check • SV profiles • Real-time QA/QC • Comprehensive notes
Acquisition of Side-Scan• Pre-survey check list • Test navigation • Calculate laybacks • Real-time QA/QC • Comprehensive notes
MB Data Reduction • Import field backup to
workstation • Apply ancillary corrections • Subset edit for bad data • Create final grid
SS Data Reduction • Import field backup to
workstation • Filter and buffer artifacts • Apply nav laybacks • Create final mosaic
Final Report • Assimilate all data and
QA/QC parameters • Use official SOW as
guideline and check list • Create pdf and print
Figure 11. Workflow diagram for the Topsail Island remote sensing project.
22
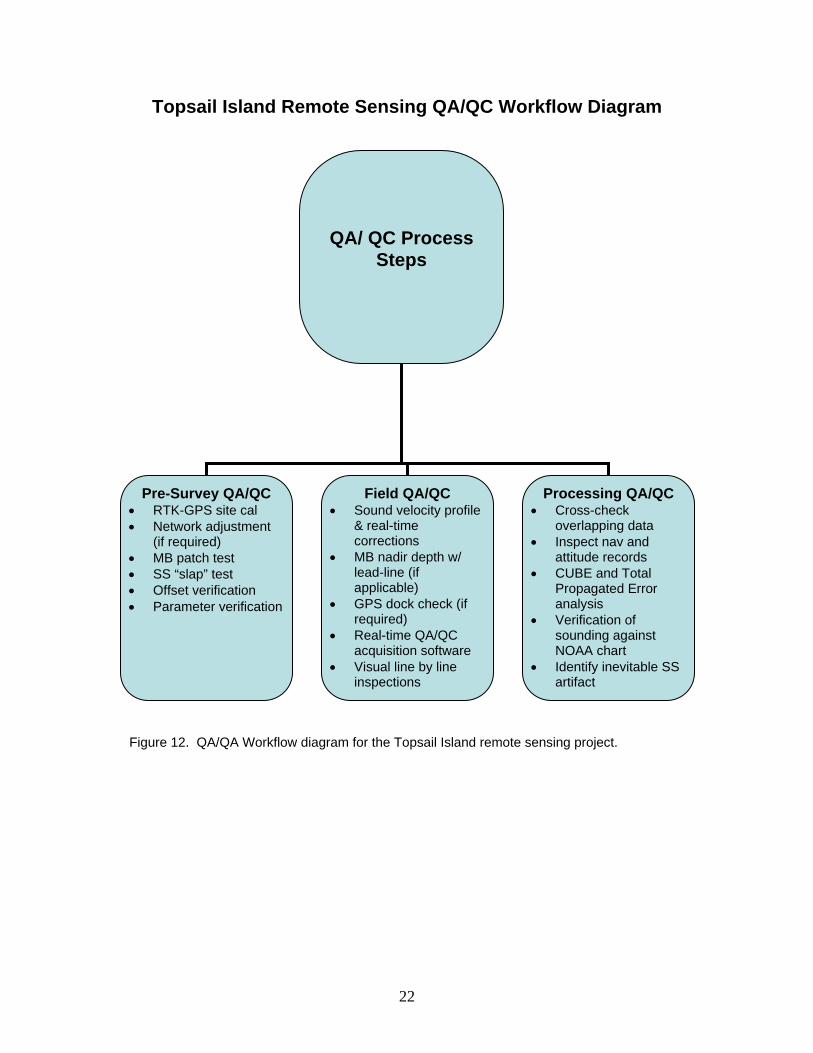
Topsail Island Remote Sensing QA/QC Workflow Diagram
QA/ QC Process Steps
Pre-Survey QA/QC • RTK-GPS site cal • Network adjustment
(if required) • MB patch test • SS “slap” test • Offset verification • Parameter verification
Field QA/QC • Sound velocity profile
& real-time corrections
• MB nadir depth w/ lead-line (if applicable)
• GPS dock check (if required)
• Real-time QA/QC acquisition software
• Visual line by line inspections
Processing QA/QC • Cross-check
overlapping data • Inspect nav and
attitude records • CUBE and Total
Propagated Error analysis
• Verification of sounding against NOAA chart
• Identify inevitable SS artifact
Figure 12. QA/QA Workflow diagram for the Topsail Island remote sensing project.
23
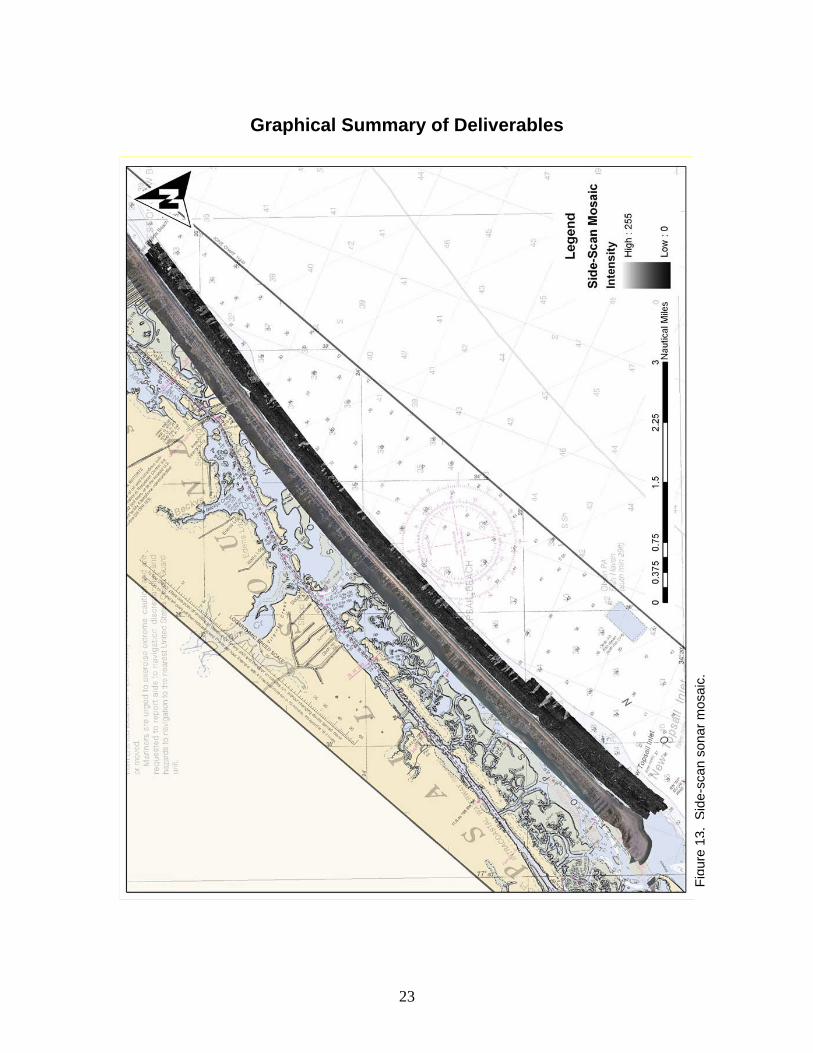
Graphical Summary of Deliverables
Figu
re 1
3. S
ide-
scan
son
ar m
osai
c.
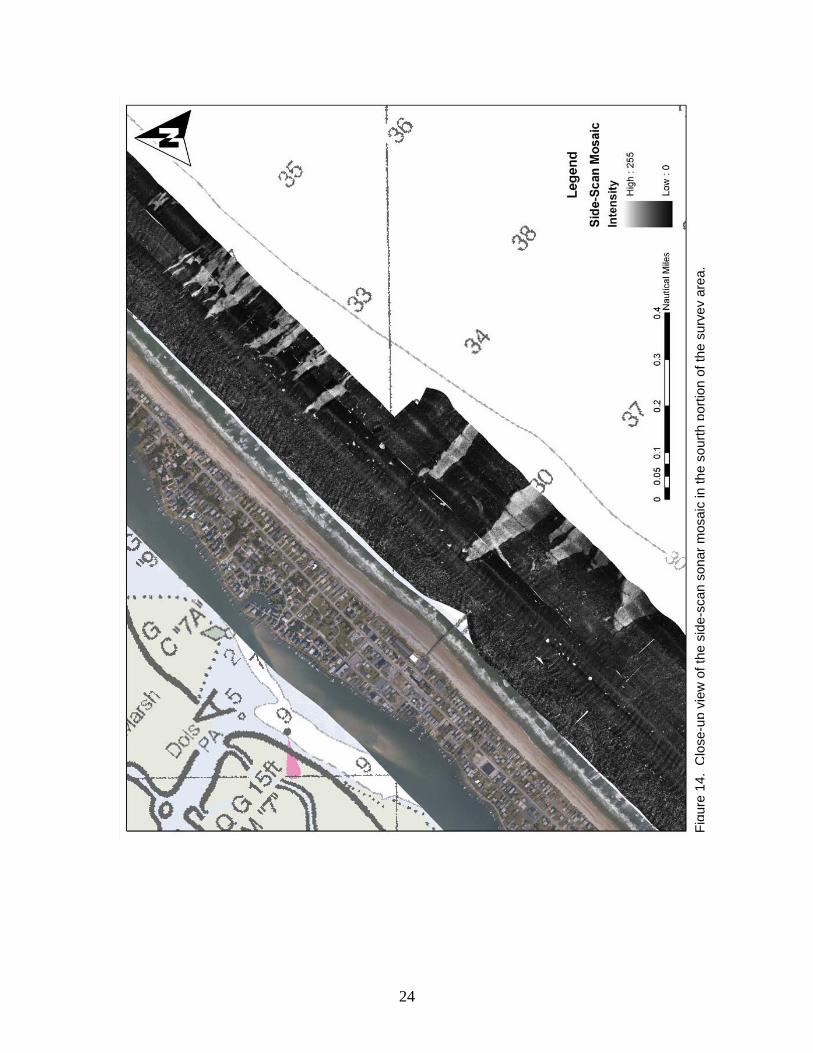
24
Figu
re 1
4. C
lose
-up
view
of t
he s
ide-
scan
son
ar m
osai
c in
the
sour
th p
ortio
n of
the
surv
ey a
rea.
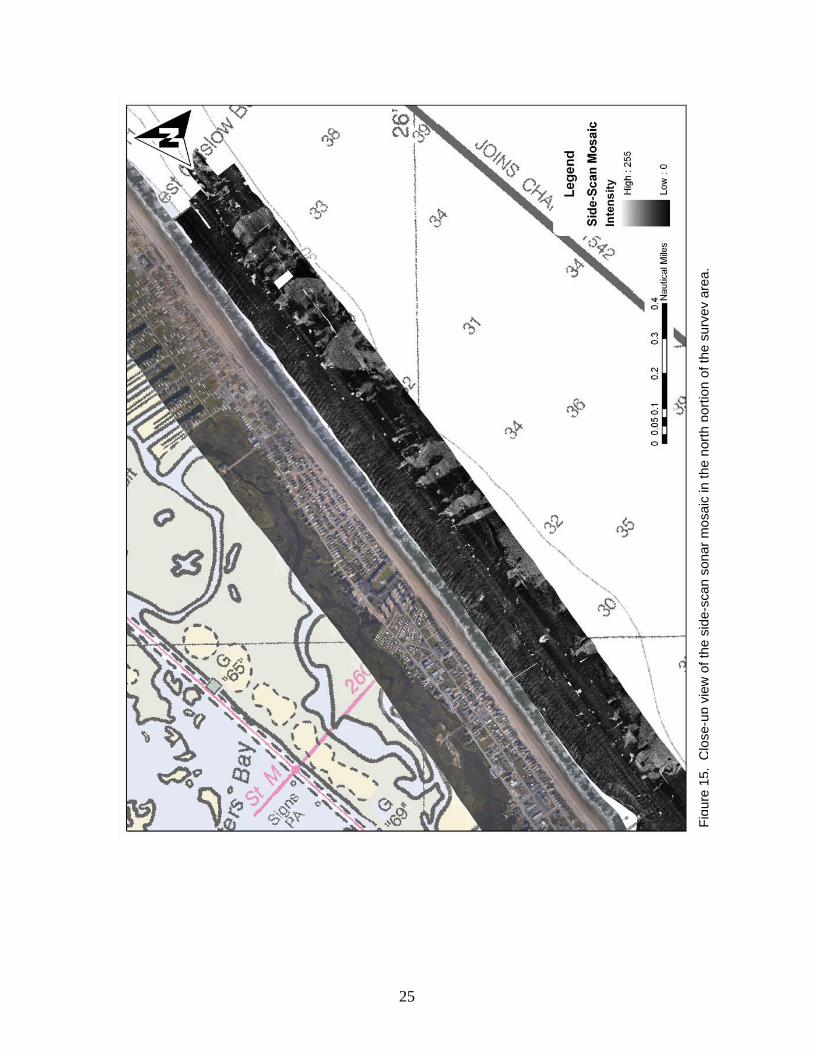
25
Figu
re 1
5. C
lose
-up
view
of t
he s
ide-
scan
son
ar m
osai
c in
the
north
por
tion
of th
e su
rvey
are
a.
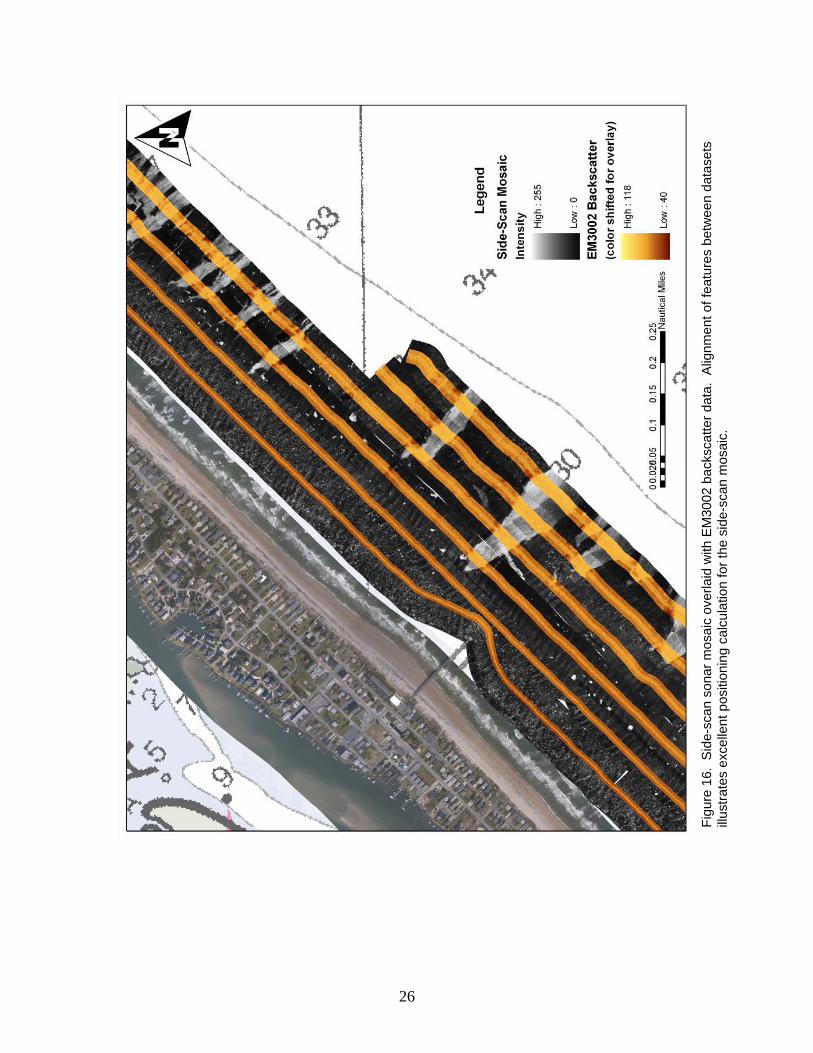
26
Figu
re 1
6. S
ide-
scan
son
ar m
osai
c ov
erla
id w
ith E
M30
02 b
acks
catte
r dat
a. A
lignm
ent o
f fea
ture
s be
twee
n da
tase
ts
illust
rate
s ex
celle
nt p
ositi
onin
g ca
lcul
atio
n fo
r the
sid
e-sc
an m
osai
c.
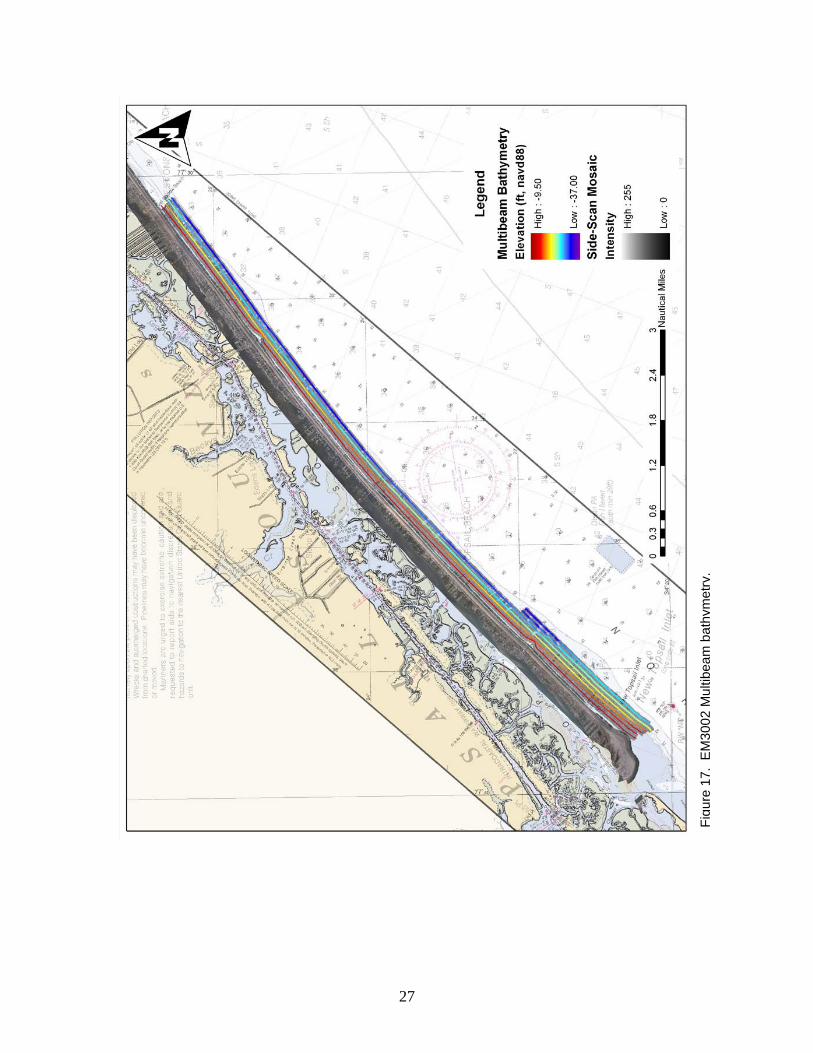
27
Figu
re 1
7. E
M30
02 M
ultib
eam
bat
hym
etry
.
28
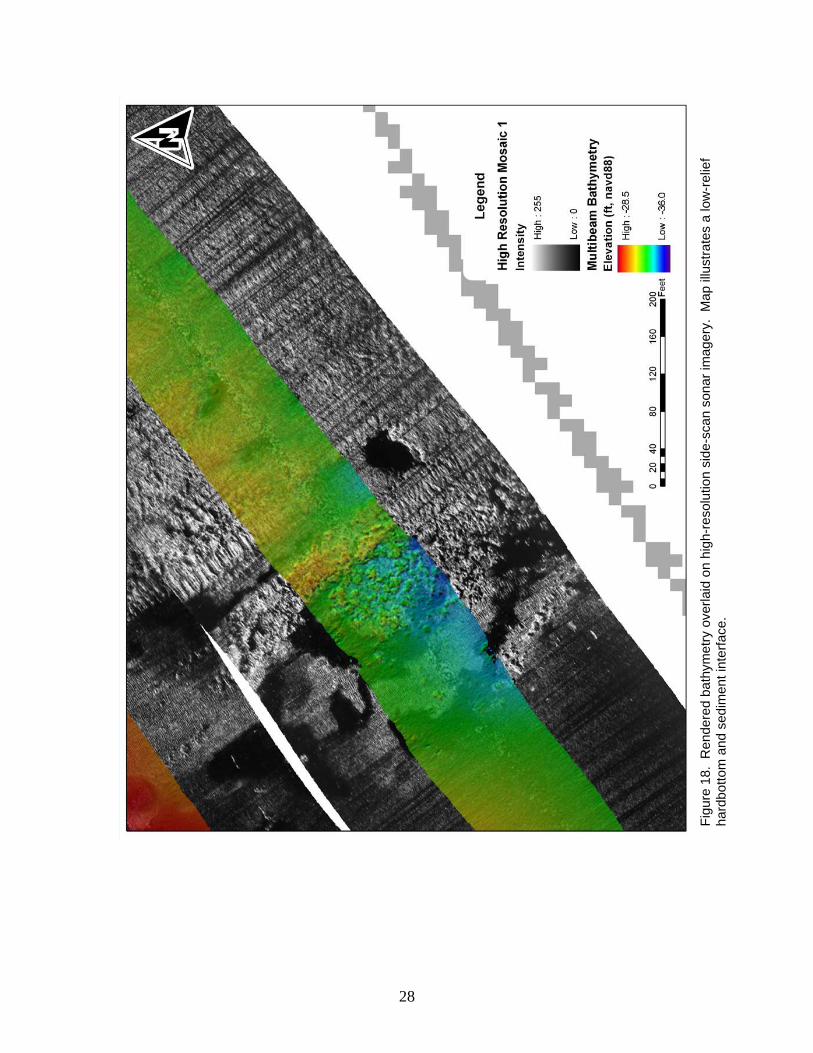
Figu
re 1
8. R
ende
red
bath
ymet
ry o
verla
id o
n hi
gh-re
solu
tion
side
-sca
n so
nar i
mag
ery.
Map
illu
stra
tes
a lo
w-r
elie
f ha
rdbo
ttom
and
sed
imen
t int
erfa
ce.
29
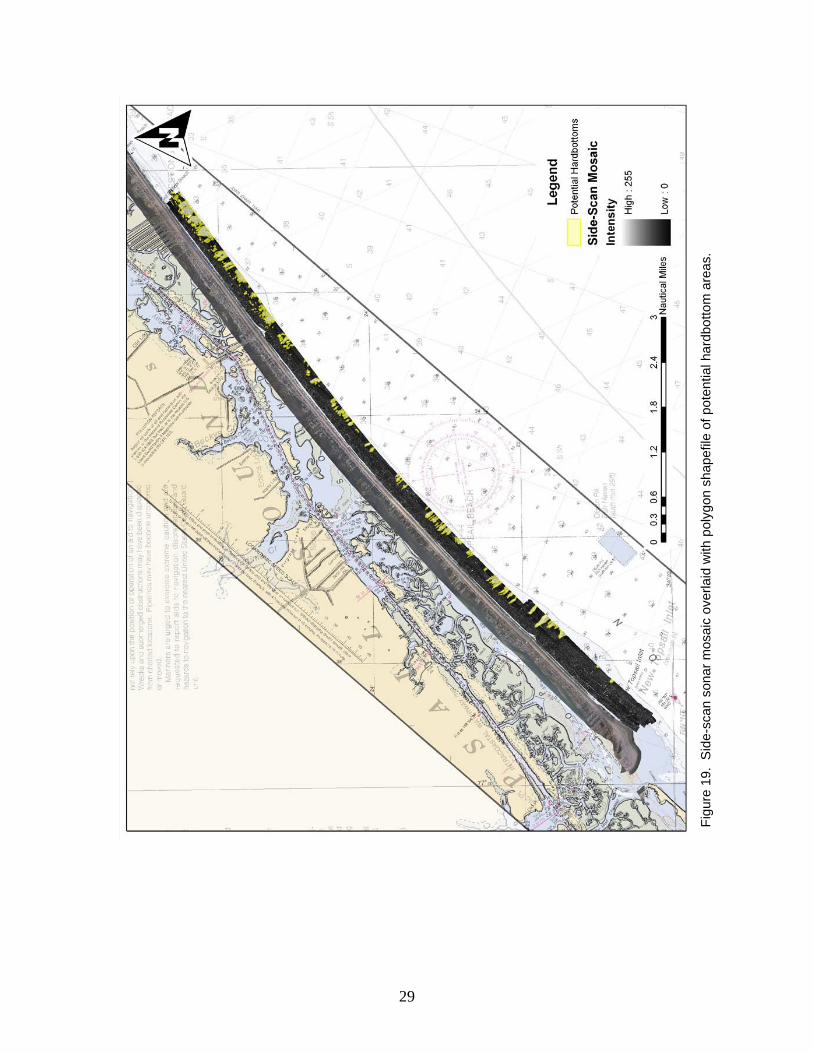
Figu
re 1
9. S
ide-
scan
son
ar m
osai
c ov
erla
id w
ith p
olyg
on s
hape
file
of p
oten
tial h
ardb
otto
m a
reas
.

30
Appendix A – Official USACE Scope of Work
31
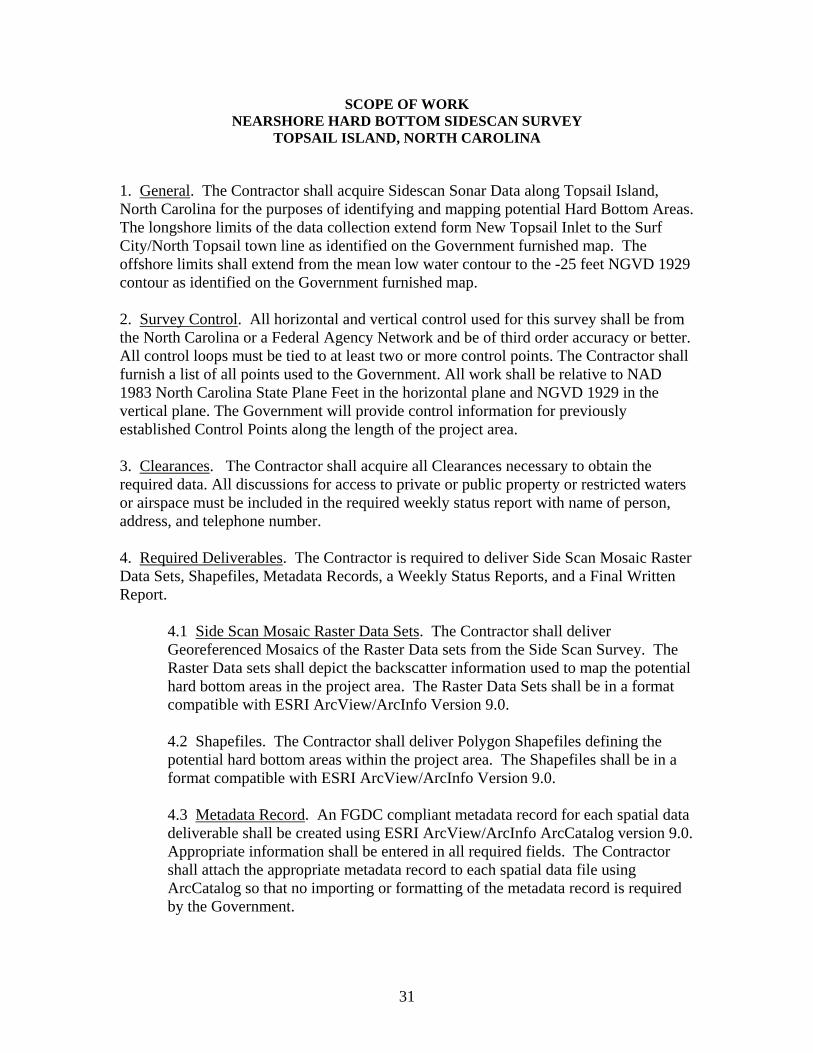
SCOPE OF WORK NEARSHORE HARD BOTTOM SIDESCAN SURVEY
TOPSAIL ISLAND, NORTH CAROLINA
1. General. The Contractor shall acquire Sidescan Sonar Data along Topsail Island, North Carolina for the purposes of identifying and mapping potential Hard Bottom Areas. The longshore limits of the data collection extend form New Topsail Inlet to the Surf City/North Topsail town line as identified on the Government furnished map. The offshore limits shall extend from the mean low water contour to the -25 feet NGVD 1929 contour as identified on the Government furnished map. 2. Survey Control. All horizontal and vertical control used for this survey shall be from the North Carolina or a Federal Agency Network and be of third order accuracy or better. All control loops must be tied to at least two or more control points. The Contractor shall furnish a list of all points used to the Government. All work shall be relative to NAD 1983 North Carolina State Plane Feet in the horizontal plane and NGVD 1929 in the vertical plane. The Government will provide control information for previously established Control Points along the length of the project area. 3. Clearances. The Contractor shall acquire all Clearances necessary to obtain the required data. All discussions for access to private or public property or restricted waters or airspace must be included in the required weekly status report with name of person, address, and telephone number. 4. Required Deliverables. The Contractor is required to deliver Side Scan Mosaic Raster Data Sets, Shapefiles, Metadata Records, a Weekly Status Reports, and a Final Written Report.
4.1 Side Scan Mosaic Raster Data Sets. The Contractor shall deliver Georeferenced Mosaics of the Raster Data sets from the Side Scan Survey. The Raster Data sets shall depict the backscatter information used to map the potential hard bottom areas in the project area. The Raster Data Sets shall be in a format compatible with ESRI ArcView/ArcInfo Version 9.0. 4.2 Shapefiles. The Contractor shall deliver Polygon Shapefiles defining the potential hard bottom areas within the project area. The Shapefiles shall be in a format compatible with ESRI ArcView/ArcInfo Version 9.0. 4.3 Metadata Record. An FGDC compliant metadata record for each spatial data deliverable shall be created using ESRI ArcView/ArcInfo ArcCatalog version 9.0. Appropriate information shall be entered in all required fields. The Contractor shall attach the appropriate metadata record to each spatial data file using ArcCatalog so that no importing or formatting of the metadata record is required by the Government.
32
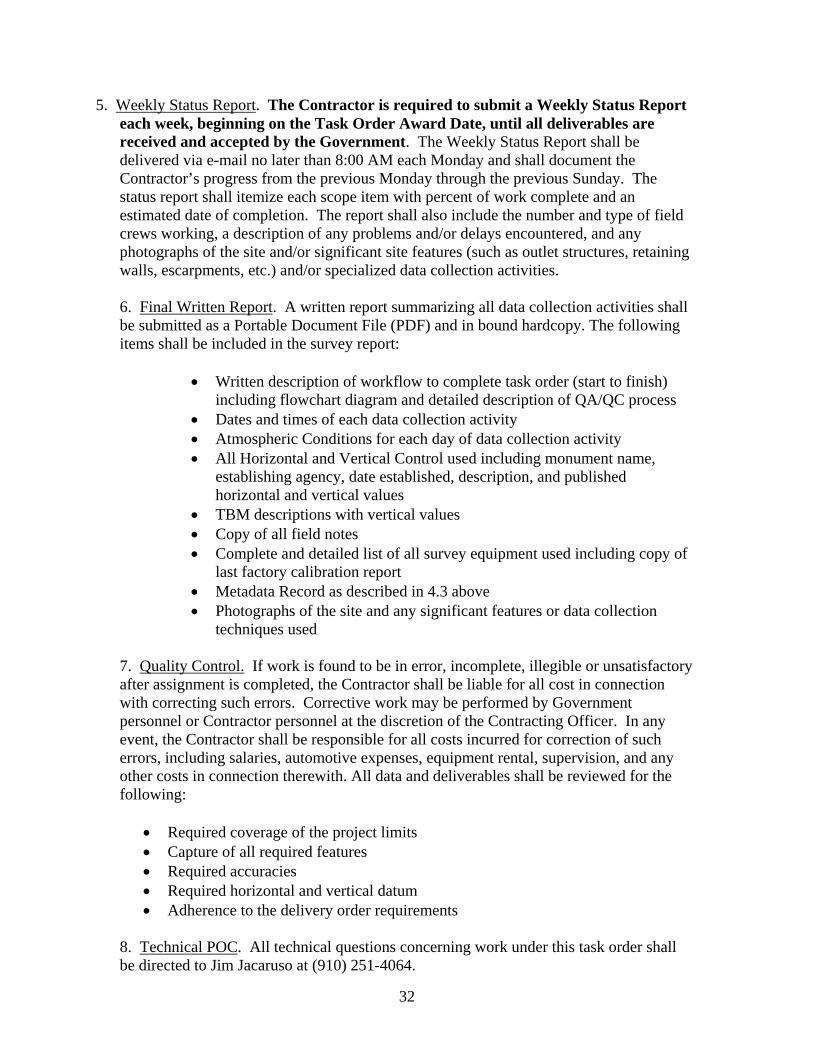
5. Weekly Status Report. The Contractor is required to submit a Weekly Status Report each week, beginning on the Task Order Award Date, until all deliverables are received and accepted by the Government. The Weekly Status Report shall be delivered via e-mail no later than 8:00 AM each Monday and shall document the Contractor’s progress from the previous Monday through the previous Sunday. The status report shall itemize each scope item with percent of work complete and an estimated date of completion. The report shall also include the number and type of field crews working, a description of any problems and/or delays encountered, and any photographs of the site and/or significant site features (such as outlet structures, retaining walls, escarpments, etc.) and/or specialized data collection activities.
6. Final Written Report. A written report summarizing all data collection activities shall be submitted as a Portable Document File (PDF) and in bound hardcopy. The following items shall be included in the survey report:
• Written description of workflow to complete task order (start to finish)
including flowchart diagram and detailed description of QA/QC process • Dates and times of each data collection activity • Atmospheric Conditions for each day of data collection activity • All Horizontal and Vertical Control used including monument name,
establishing agency, date established, description, and published horizontal and vertical values
• TBM descriptions with vertical values • Copy of all field notes • Complete and detailed list of all survey equipment used including copy of
last factory calibration report • Metadata Record as described in 4.3 above • Photographs of the site and any significant features or data collection
techniques used 7. Quality Control. If work is found to be in error, incomplete, illegible or unsatisfactory after assignment is completed, the Contractor shall be liable for all cost in connection with correcting such errors. Corrective work may be performed by Government personnel or Contractor personnel at the discretion of the Contracting Officer. In any event, the Contractor shall be responsible for all costs incurred for correction of such errors, including salaries, automotive expenses, equipment rental, supervision, and any other costs in connection therewith. All data and deliverables shall be reviewed for the following:
• Required coverage of the project limits • Capture of all required features • Required accuracies • Required horizontal and vertical datum • Adherence to the delivery order requirements
8. Technical POC. All technical questions concerning work under this task order shall be directed to Jim Jacaruso at (910) 251-4064.
33
9. Completion Date. All work required under this task order shall be completed and delivered no later than 14 calendar days from the Task Order Award Date. This schedule is subject to adjustment by the Contracting Officer in writing. 10. Deliver To. All work shall be delivered to: U. S. Army Corps of Engineers Wilmington District Attn: Jim Jacaruso, TS-EE 69 Darlington Avenue PO Box 1890 Wilmington, NC 28402-1890

34
Appendix B - Benchmark Descriptions
35
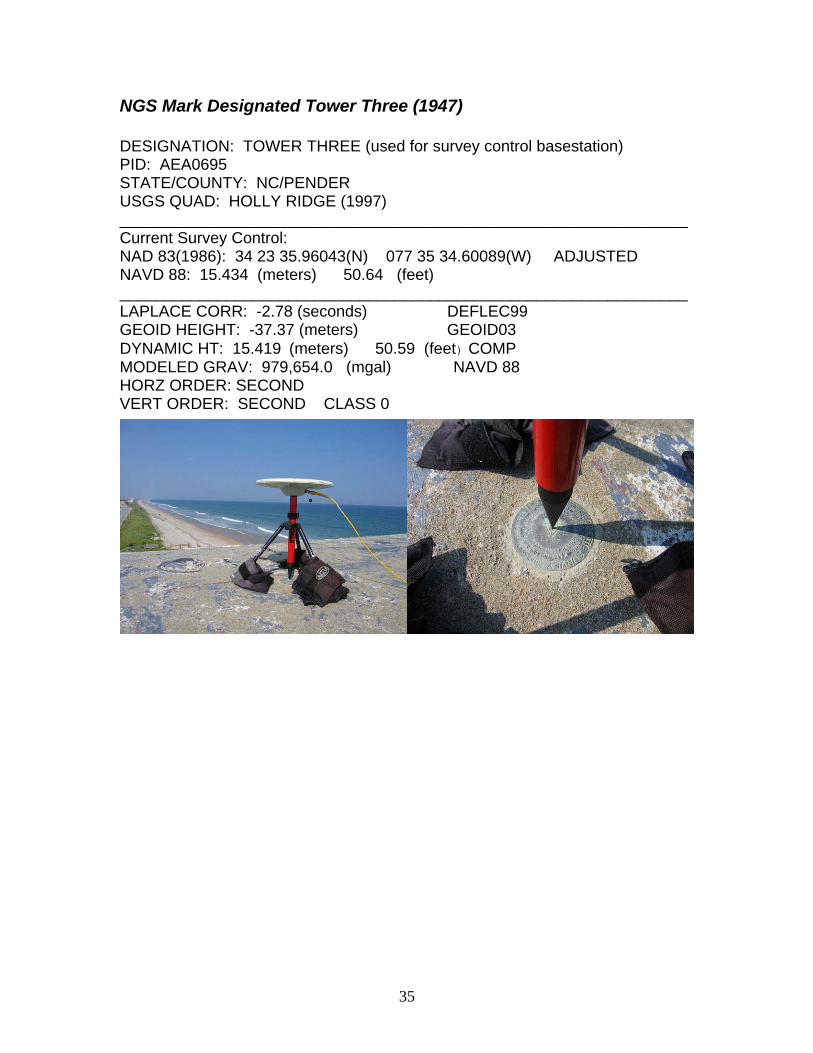
NGS Mark Designated Tower Three (1947)
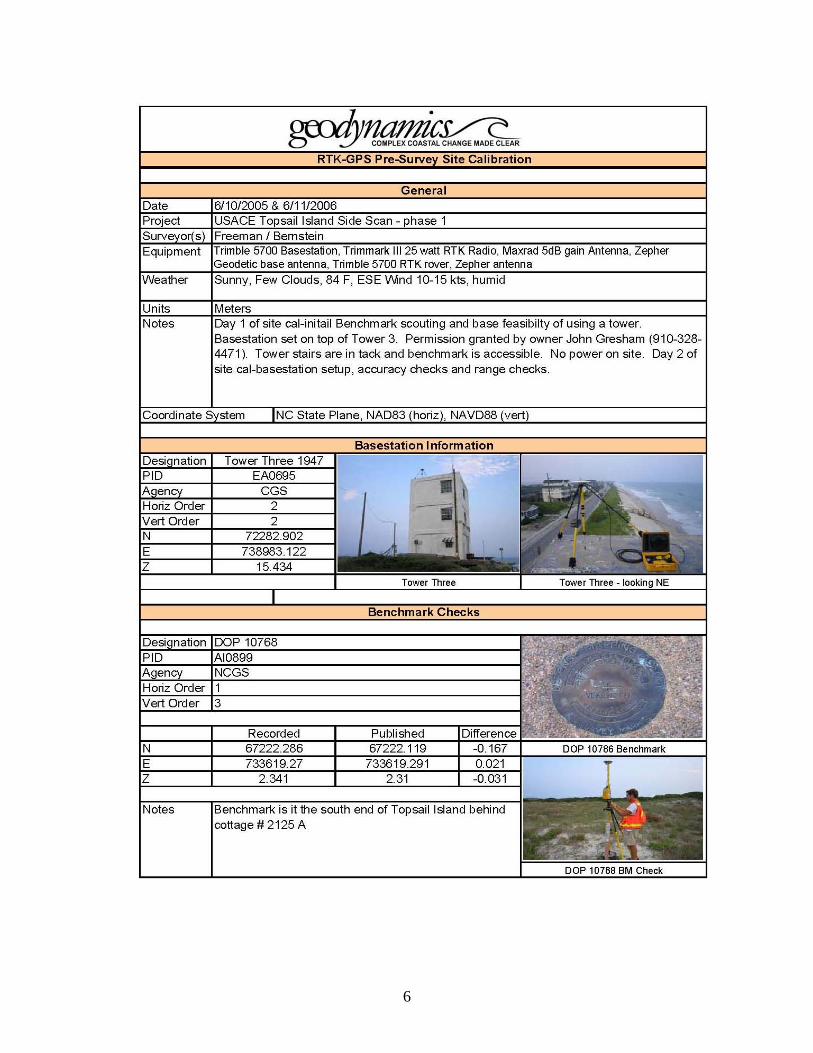
DESIGNATION: TOWER THREE (used for survey control basestation) PID: AEA0695 STATE/COUNTY: NC/PENDER USGS QUAD: HOLLY RIDGE (1997) ________________________________________________________________Current Survey Control: NAD 83(1986): 34 23 35.96043(N) 077 35 34.60089(W) ADJUSTED NAVD 88: 15.434 (meters) 50.64 (feet) ________________________________________________________________ LAPLACE CORR: -2.78 (seconds) DEFLEC99 GEOID HEIGHT: -37.37 (meters) GEOID03 DYNAMIC HT: 15.419 (meters) 50.59 (feet) COMP MODELED GRAV: 979,654.0 (mgal) NAVD 88 HORZ ORDER: SECOND VERT ORDER: SECOND CLASS 0
36
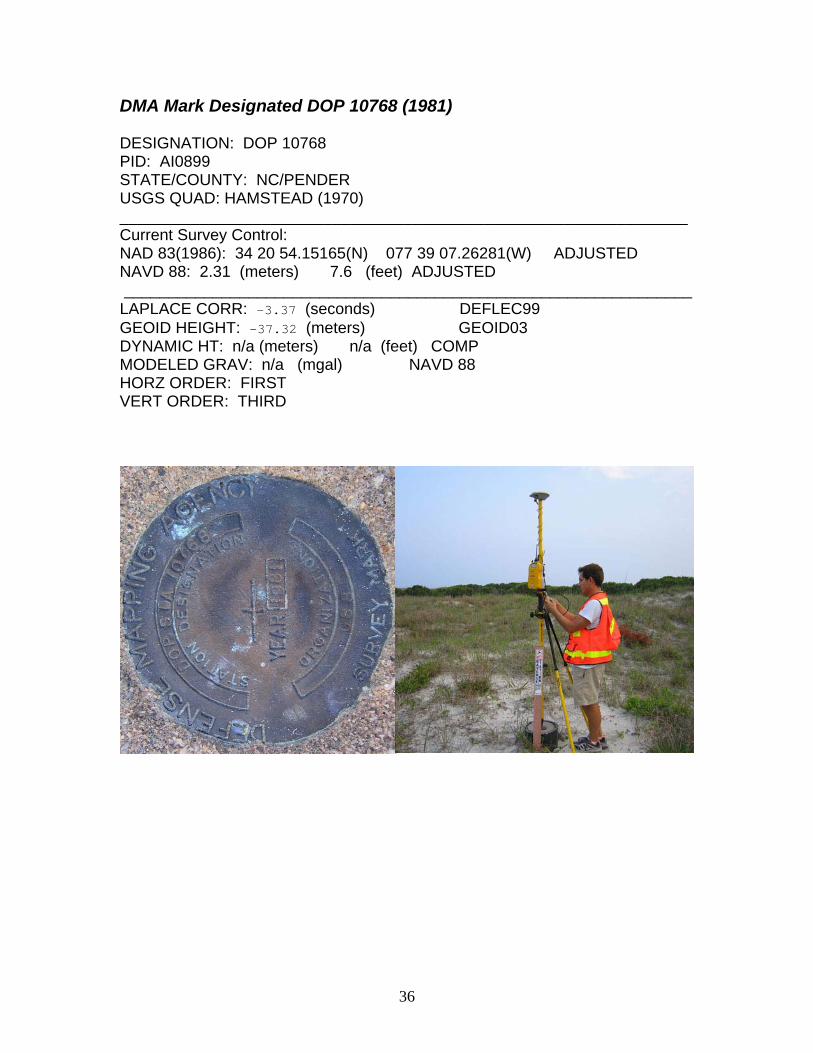
DMA Mark Designated DOP 10768 (1981) DESIGNATION: DOP 10768 PID: AI0899 STATE/COUNTY: NC/PENDER USGS QUAD: HAMSTEAD (1970) ________________________________________________________________ Current Survey Control: NAD 83(1986): 34 20 54.15165(N) 077 39 07.26281(W) ADJUSTED NAVD 88: 2.31 (meters) 7.6 (feet) ADJUSTED ________________________________________________________________ LAPLACE CORR: -3.37 (seconds) DEFLEC99 GEOID HEIGHT: -37.32 (meters) GEOID03 DYNAMIC HT: n/a (meters) n/a (feet) COMP MODELED GRAV: n/a (mgal) NAVD 88 HORZ ORDER: FIRST VERT ORDER: THIRD
37
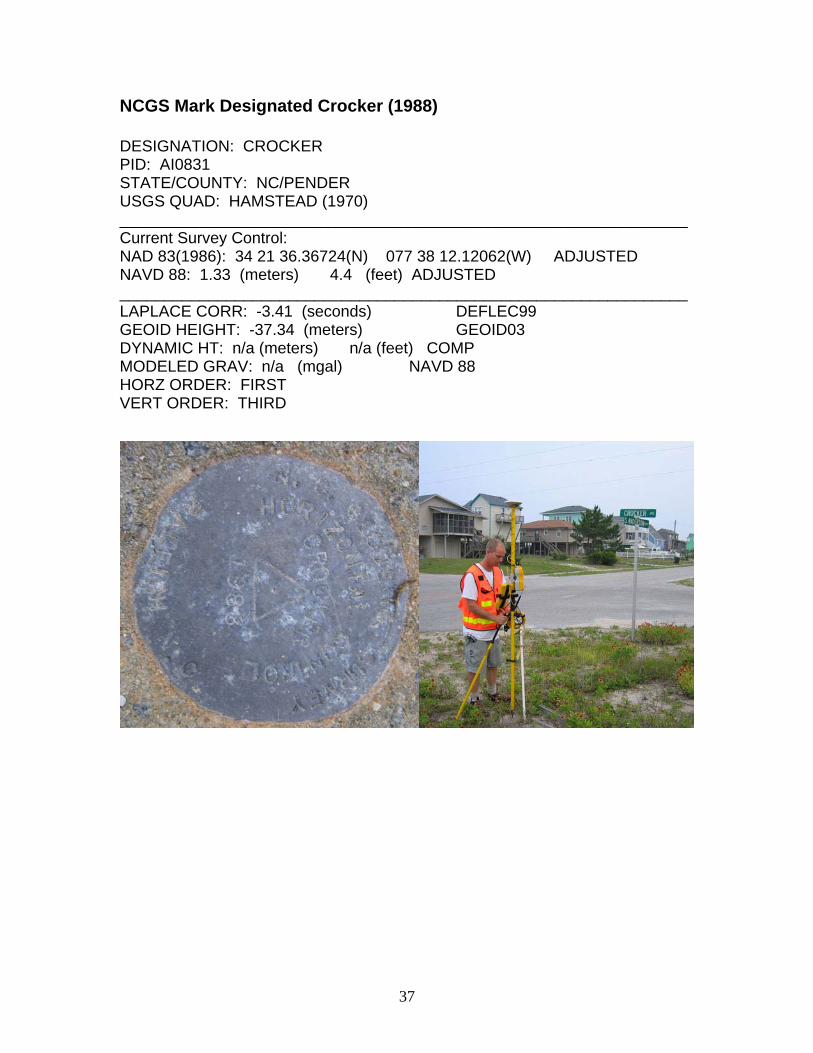
NCGS Mark Designated Crocker (1988)
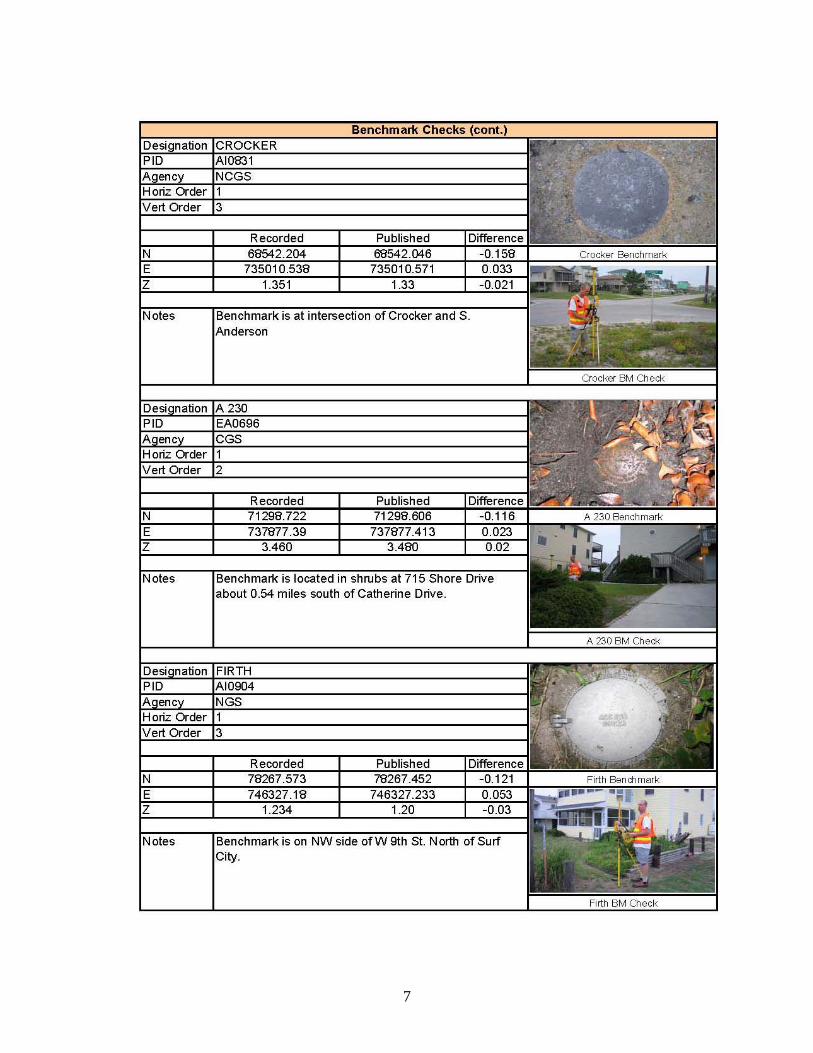
DESIGNATION: CROCKER PID: AI0831 STATE/COUNTY: NC/PENDER USGS QUAD: HAMSTEAD (1970) ________________________________________________________________ Current Survey Control: NAD 83(1986): 34 21 36.36724(N) 077 38 12.12062(W) ADJUSTED NAVD 88: 1.33 (meters) 4.4 (feet) ADJUSTED ________________________________________________________________ LAPLACE CORR: -3.41 (seconds) DEFLEC99 GEOID HEIGHT: -37.34 (meters) GEOID03 DYNAMIC HT: n/a (meters) n/a (feet) COMP MODELED GRAV: n/a (mgal) NAVD 88 HORZ ORDER: FIRST VERT ORDER: THIRD
38
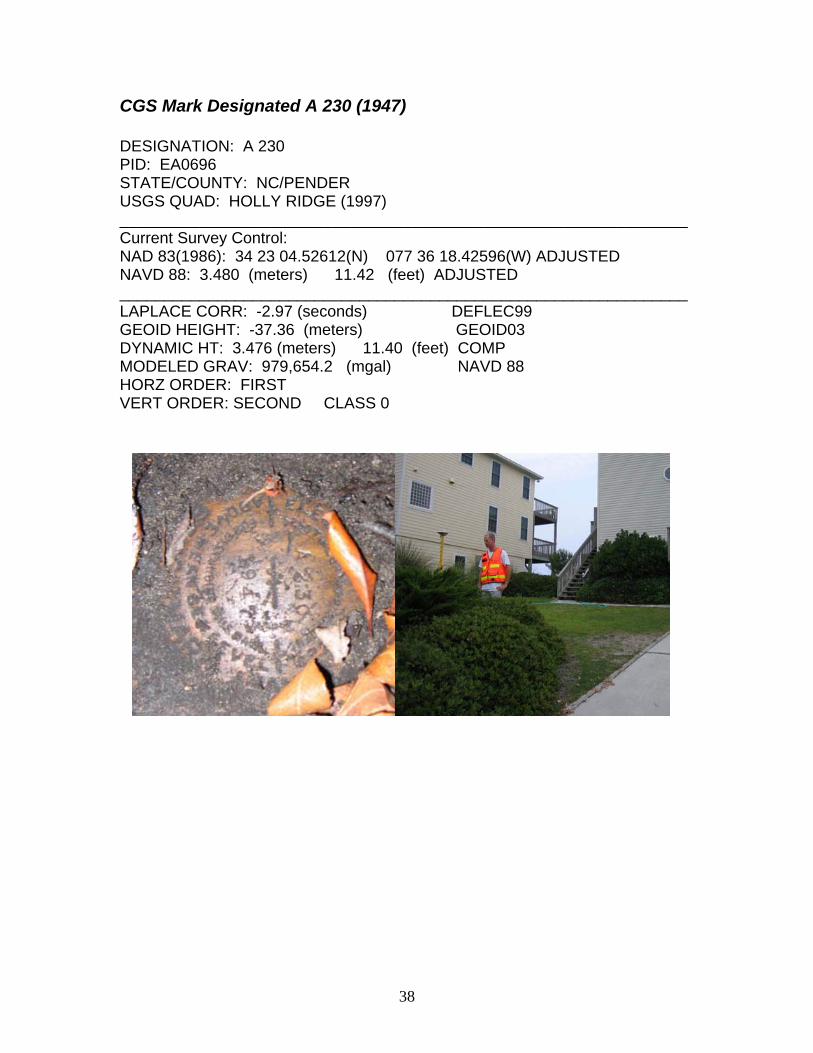
CGS Mark Designated A 230 (1947)
DESIGNATION: A 230 PID: EA0696 STATE/COUNTY: NC/PENDER USGS QUAD: HOLLY RIDGE (1997) ________________________________________________________________ Current Survey Control: NAD 83(1986): 34 23 04.52612(N) 077 36 18.42596(W) ADJUSTED NAVD 88: 3.480 (meters) 11.42 (feet) ADJUSTED ________________________________________________________________ LAPLACE CORR: -2.97 (seconds) DEFLEC99 GEOID HEIGHT: -37.36 (meters) GEOID03 DYNAMIC HT: 3.476 (meters) 11.40 (feet) COMP MODELED GRAV: 979,654.2 (mgal) NAVD 88 HORZ ORDER: FIRST VERT ORDER: SECOND CLASS 0
39
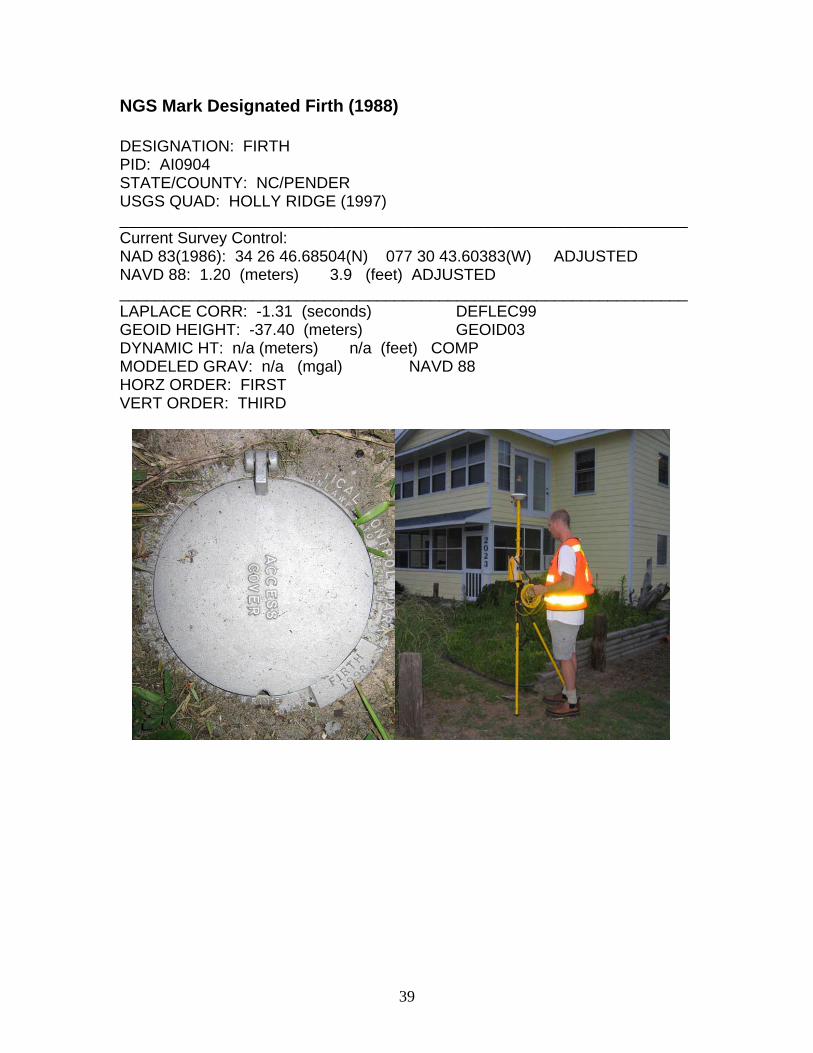
NGS Mark Designated Firth (1988)
DESIGNATION: FIRTH PID: AI0904 STATE/COUNTY: NC/PENDER USGS QUAD: HOLLY RIDGE (1997) ________________________________________________________________ Current Survey Control: NAD 83(1986): 34 26 46.68504(N) 077 30 43.60383(W) ADJUSTED NAVD 88: 1.20 (meters) 3.9 (feet) ADJUSTED ________________________________________________________________ LAPLACE CORR: -1.31 (seconds) DEFLEC99 GEOID HEIGHT: -37.40 (meters) GEOID03 DYNAMIC HT: n/a (meters) n/a (feet) COMP MODELED GRAV: n/a (mgal) NAVD 88 HORZ ORDER: FIRST VERT ORDER: THIRD
40
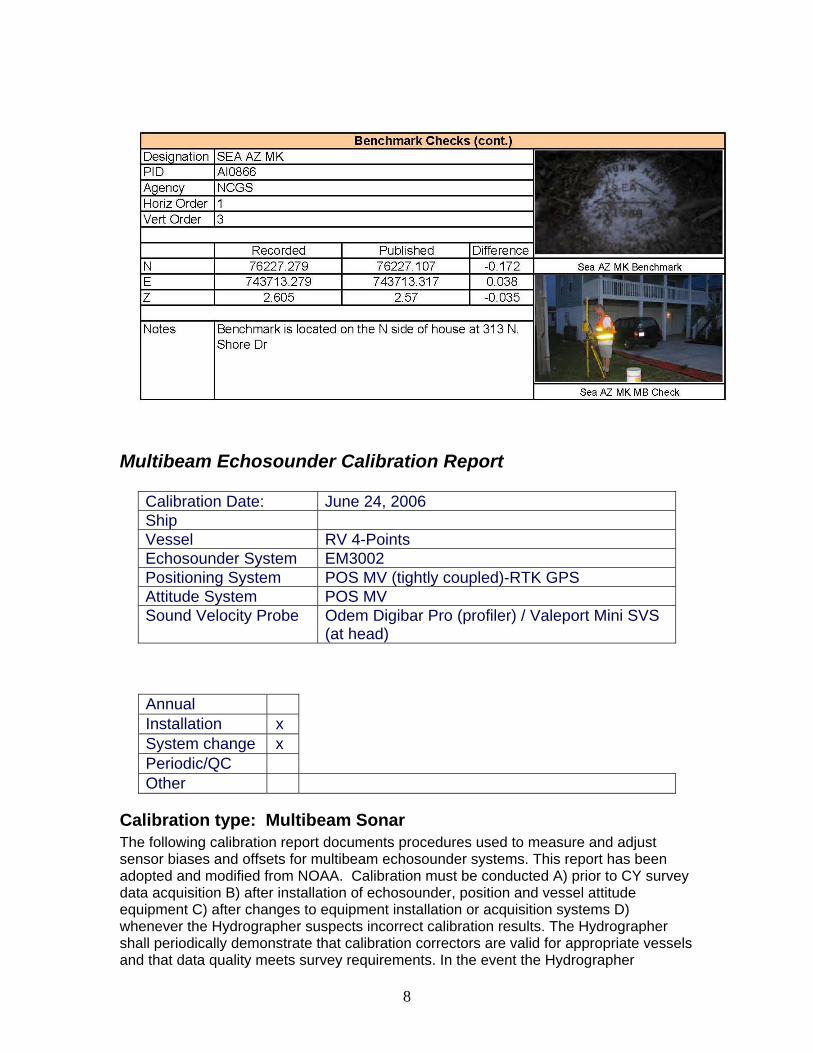
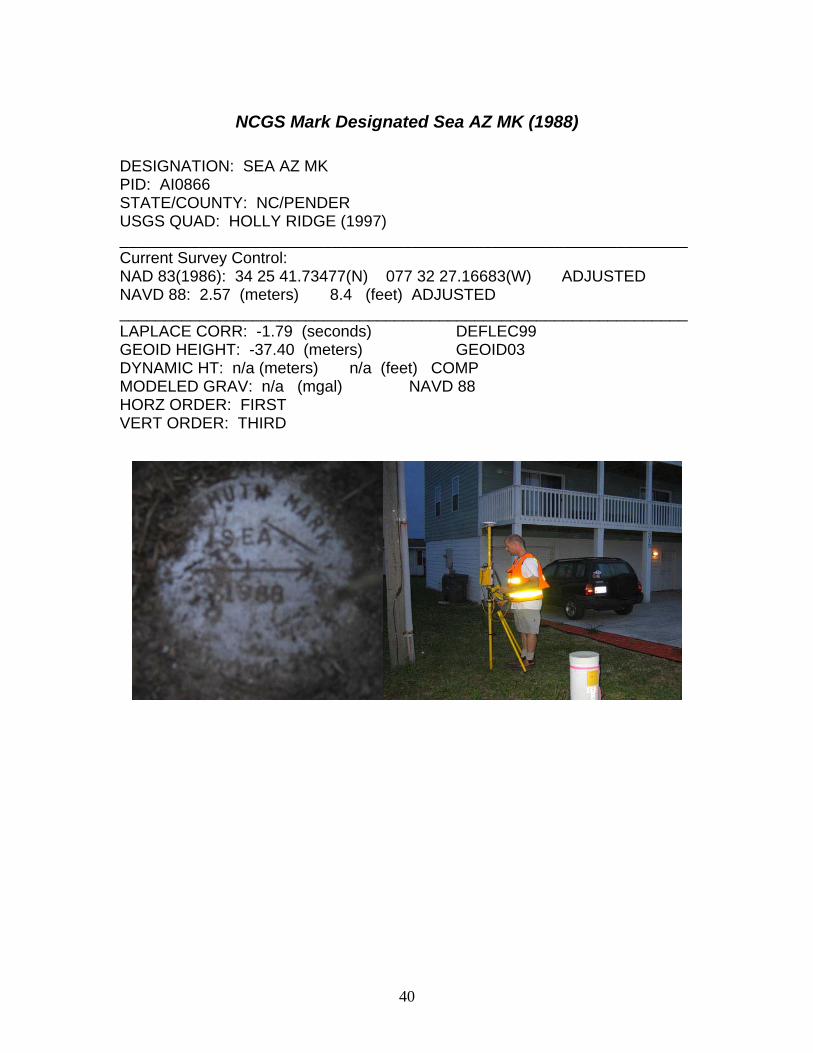
NCGS Mark Designated Sea AZ MK (1988)
DESIGNATION: SEA AZ MK PID: AI0866 STATE/COUNTY: NC/PENDER USGS QUAD: HOLLY RIDGE (1997) ________________________________________________________________ Current Survey Control: NAD 83(1986): 34 25 41.73477(N) 077 32 27.16683(W) ADJUSTED NAVD 88: 2.57 (meters) 8.4 (feet) ADJUSTED ________________________________________________________________ LAPLACE CORR: -1.79 (seconds) DEFLEC99 GEOID HEIGHT: -37.40 (meters) GEOID03 DYNAMIC HT: n/a (meters) n/a (feet) COMP MODELED GRAV: n/a (mgal) NAVD 88 HORZ ORDER: FIRST VERT ORDER: THIRD

41
Appendix C– Field Notes, Daily GPS Quality & Copy of Field Book
42

43
44
45
46

47
Appendix D - R/V 4-Points Setup & Instrument Accuracies
48
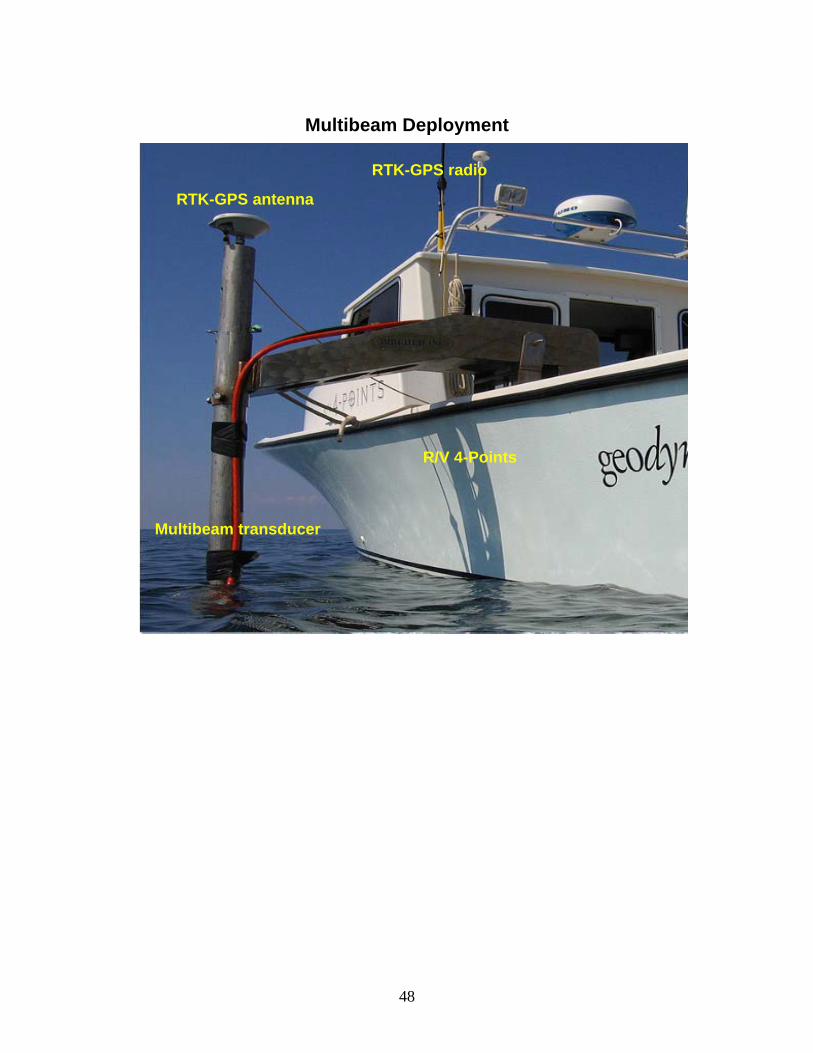
Multibeam Deployment
RTK-GPS antenna
RTK-GPS radio
Multibeam transducer
R/V 4-Points
49
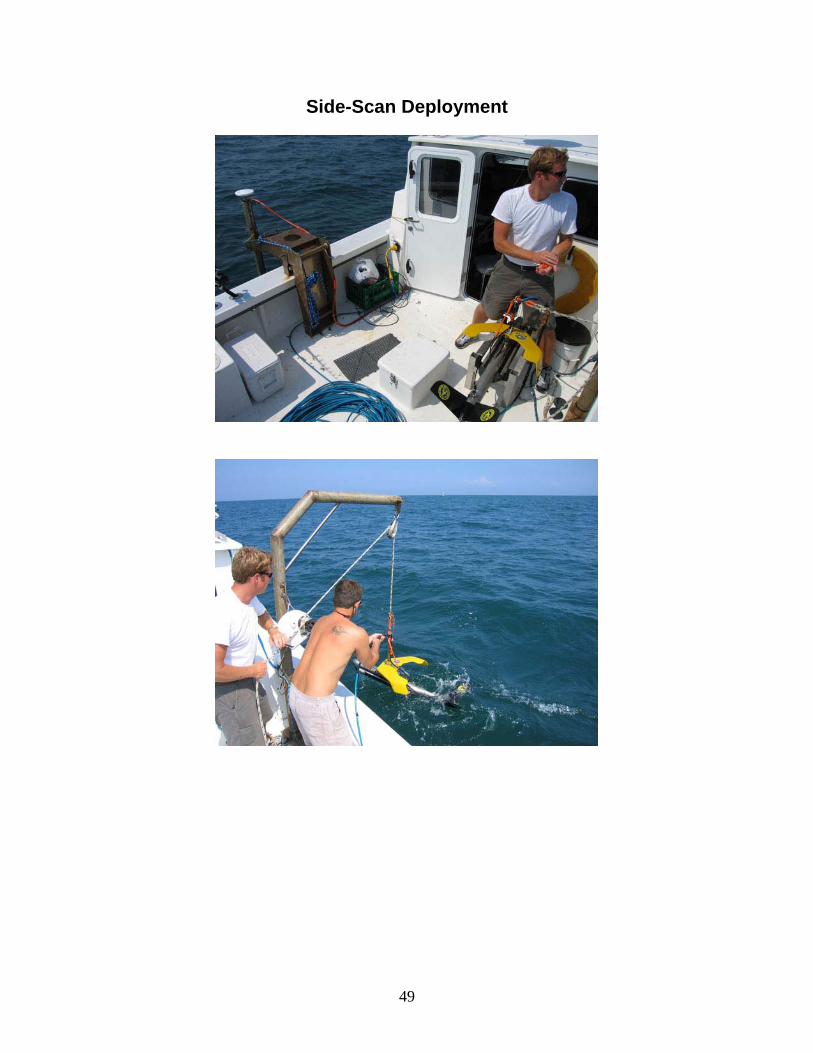
Side-Scan Deployment
50
Survey Instruments & Published Accuracies
Survey Vessel The research vessel 4-Points is a custom fiberglass survey boat designed specifically for shallow water sonar and acoustical operations. The vessel is 25’ long with a 10’ beam; the bottom tapers from a deep “Carolina” style Vee to a relatively flat-bottomed stern that provides a shallow draft of approximately 1.2’. Twin 140 four-stroke engines, hung on a stainless steel bracket, power the vessel. All electronics and generators are grounded to the sea via a bottom mounted bonding plate to eliminate all electrical noise. The transducer mount was engineered and designed at the University of North Carolina at Chapel Hill’s Institute of Marine Science specifically for multibeam and ADCP surveys (Hench, et. al, 2000 “A portable retractable ADCP boom-mount for small boats”. Estuaries, 23 (3): 392-399.). The mount was designed to keep the transducer below any potential bow wave and to also house the motion sensor directly over the transducer. Side-scan instrumentation is deployed, towed and retrieved from custom davit on starboard side. Side-Scan Sonar Equipment
• Klein 3000 side-scan sonar towfish o Frequency: 132 kHz and 445 kHz o Transmission pulse: tone burst selectable from 25-400 usec.
Independent pulse for each frequency o Beams: horz-100 kHz 7 degrees, horz-500 kHz 21 degrees,
vertical-40 degrees o Range: 100 kHz to 450m, 500 kHz to 150m o Multiplexer: T1, 1.5 MB/sec o Note: There are no calibration reports associated with side-scan
Multibeam Equipment • Simrad EM 3002 multibeam sonar transducer
o Multi-Frequency: in 300 kHz band o Max ping rate: 40 Hz o No. of beams/ping: 254 Roll and Pitch stabilized o Beam width: 1.5o x 1.5o o Beam spacing: 0.9o o Depth range from sonar head: 1 to 150 m o Depth resolution: 1 cm o Depth accuracy: 5 cm RMS o Range sampling rate: 15 kHz o Bottom detection by phase or amplitude. Seabed imaging &
classification with backscatter (sidescan-like) output. o Full swath width accuracy to the latest IHO standard
• POS MV 320 v4 Main Specifications (with RTK Corrections)
51
o Roll, Pitch accuracy: 0.02° (1 sigma with GPS or DGPS) 0.01° (1 sigma with RTK)
o Heave Accuracy: 5 cm or 5% (whichever is greater) for periods of 20 seconds or less
o Heading Accuracy: 0.02° (1 sigma) with 2 m antenna baseline, 0.01 (1sigma) with 4 m baseline
o Position Accuracy: 0.5 - 2 m (1 sigma) depending on quality of differential corrections 0.02 - 0.10 m (RTK) with input
o Velocity Accuracy: 0.03 m/s horizontal
• Trimble 5700 dual frequency GPS system & RTK-Basestation o Instrument used for positioning and tidal corrections o High precision L1 and L2 measurements o 24 channels L1 C/A code, L1/L2 full cycle carrier o Extremely low latency (20 milliseconds) o RTK-GPS accuracy depends on conditions such as multipath,
obstructions, satellite geometry, atmospheric parameters and basestation control quality.
- Published horizontal accuracy: 10 mm + 1ppm RMS - Published vertical accuracy: 20 mm + 1ppm RMS
• Odom Hydrographics Digibar Pro sound velocity probe
o Sampling rate: 10 Hz o Depth accuracy: > 31 cm o Velocity accuracy: +/- 0.3 m/sec
Computers & Software • Rack mounted multibeam acquisition PC
o 3.0 GHz Intel Pentium 4 processors with 800 MHz system bus o 1 GB of RAM o Triton Elics International (TEI) Isis version 6.2 acquisition software o CARIS HIPS/SIPS processing software
• Rack mounted Simrad multibeam power unit
o EM3002 controller and power modulator
• (3) Fujitsu pentop navigation PC o Hypack Max.
• (4) Dell high-end GIS processing workstations
o Arcview 3.3, ArcGIS 9.1, Surfer 8.0, Trimble Geomatics Office, Matlab 12, TEI Bathypro and DelphMap, CARIS
Backup field & processing computers and instrumentation • (2) Dell laptops

52
• (3) Fujitsu pentop • (5) Maxtor 250 – 300 gigabyte external backup drive

53
Appendix E – QTC Report
54
55

56

57
58
59
60

61

62

63
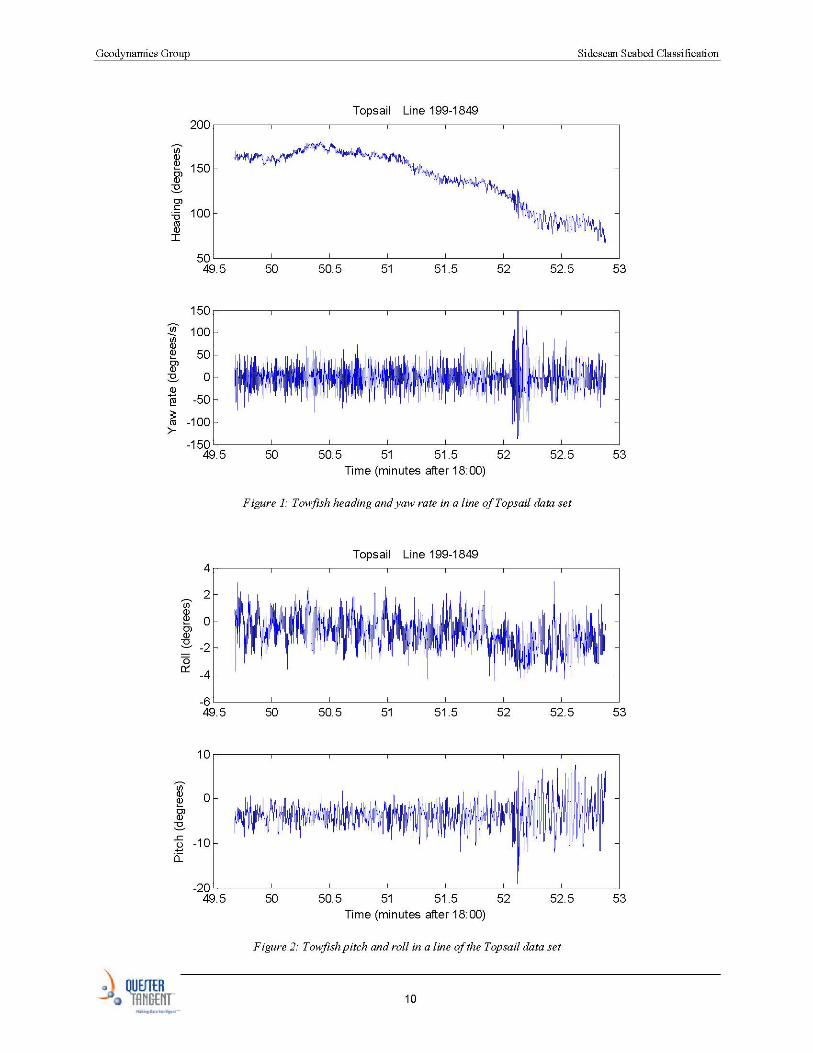
64
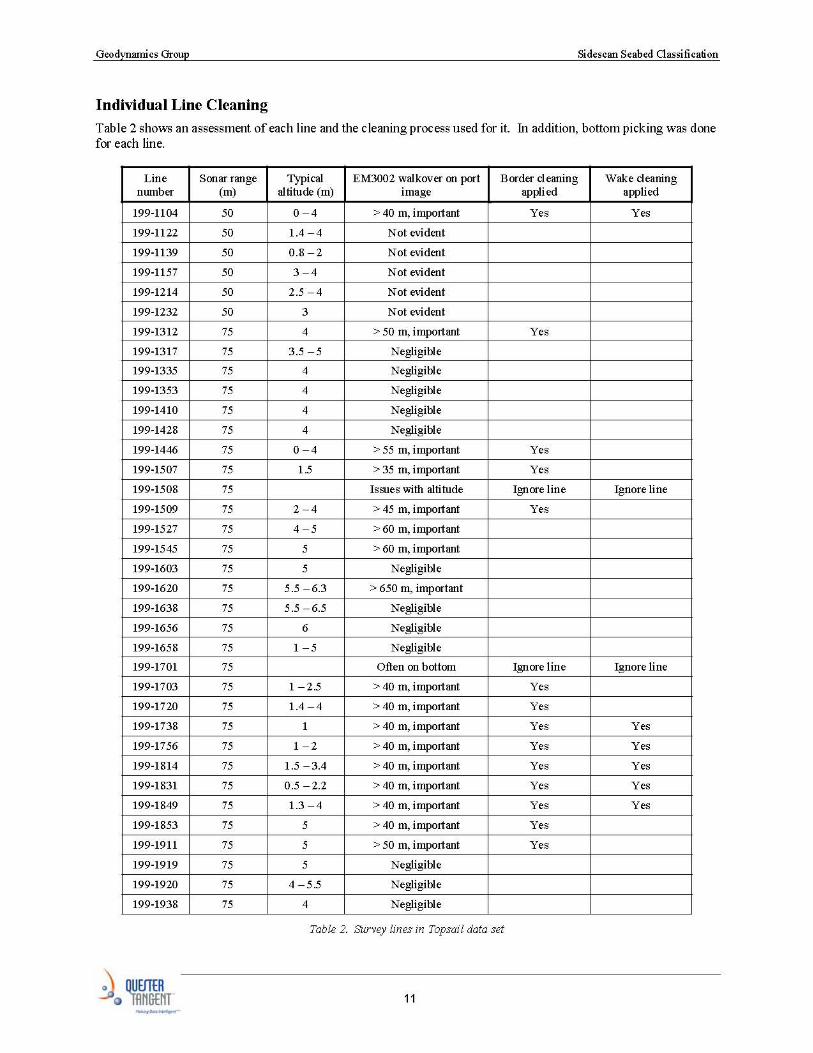
65
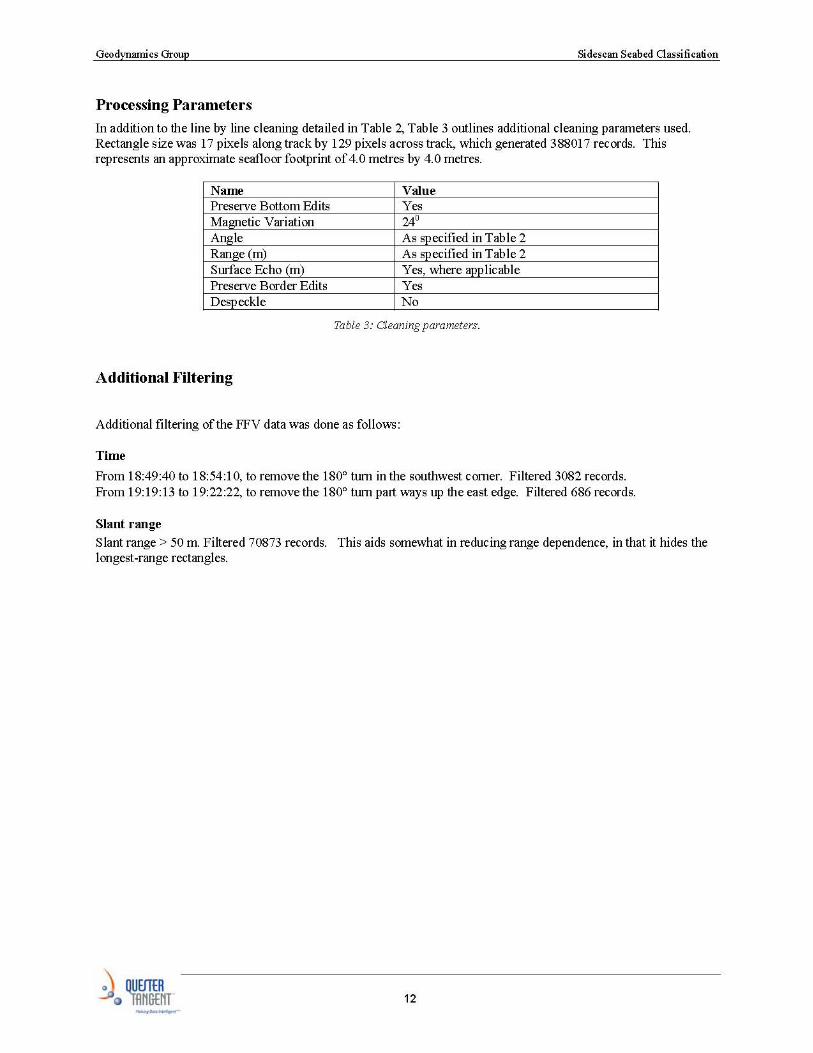
66
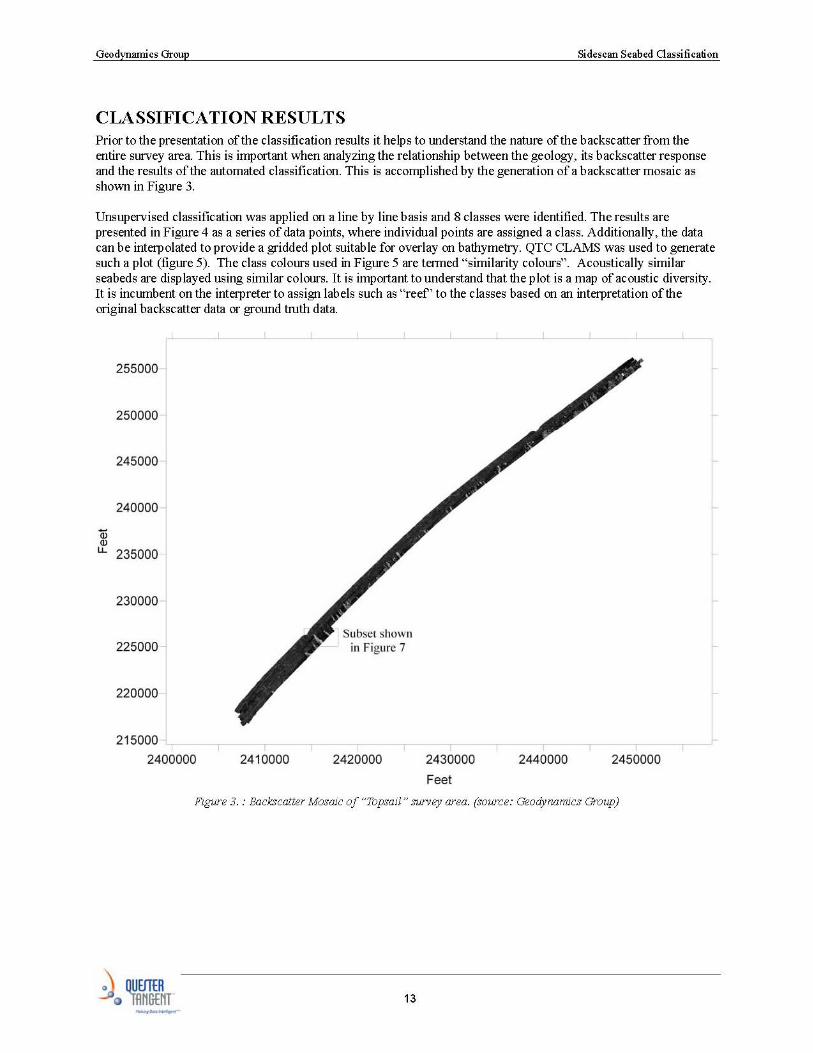
67
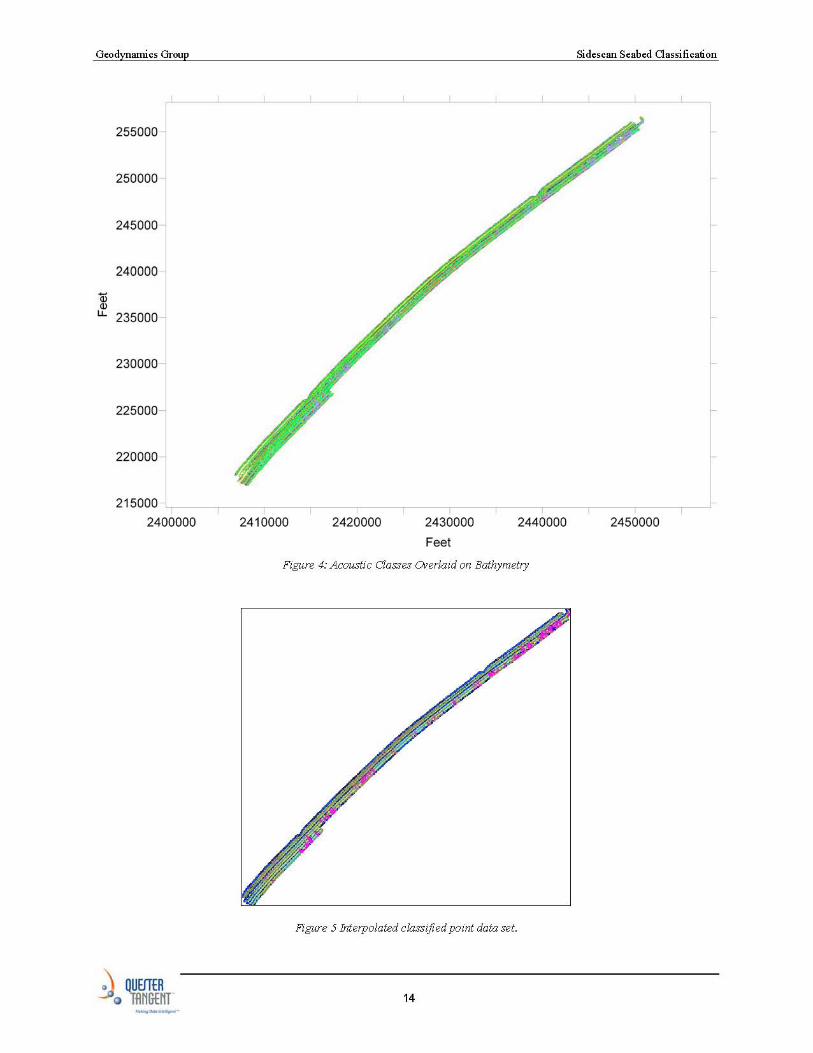
68
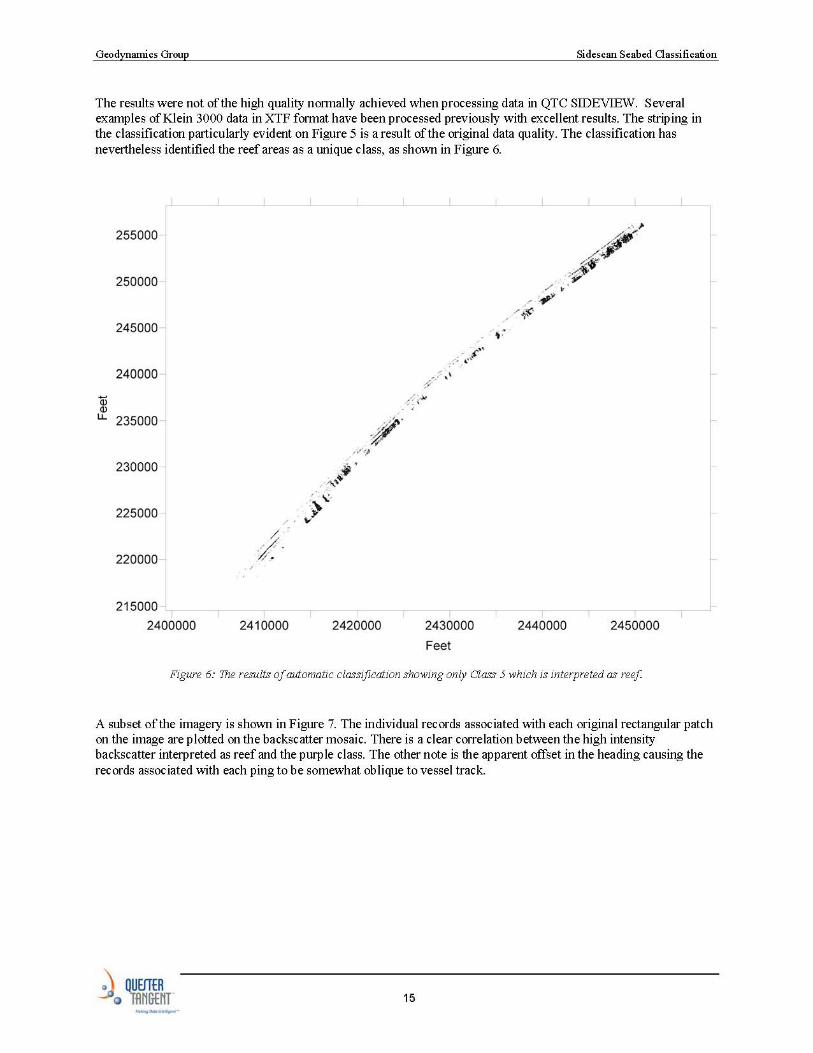
69
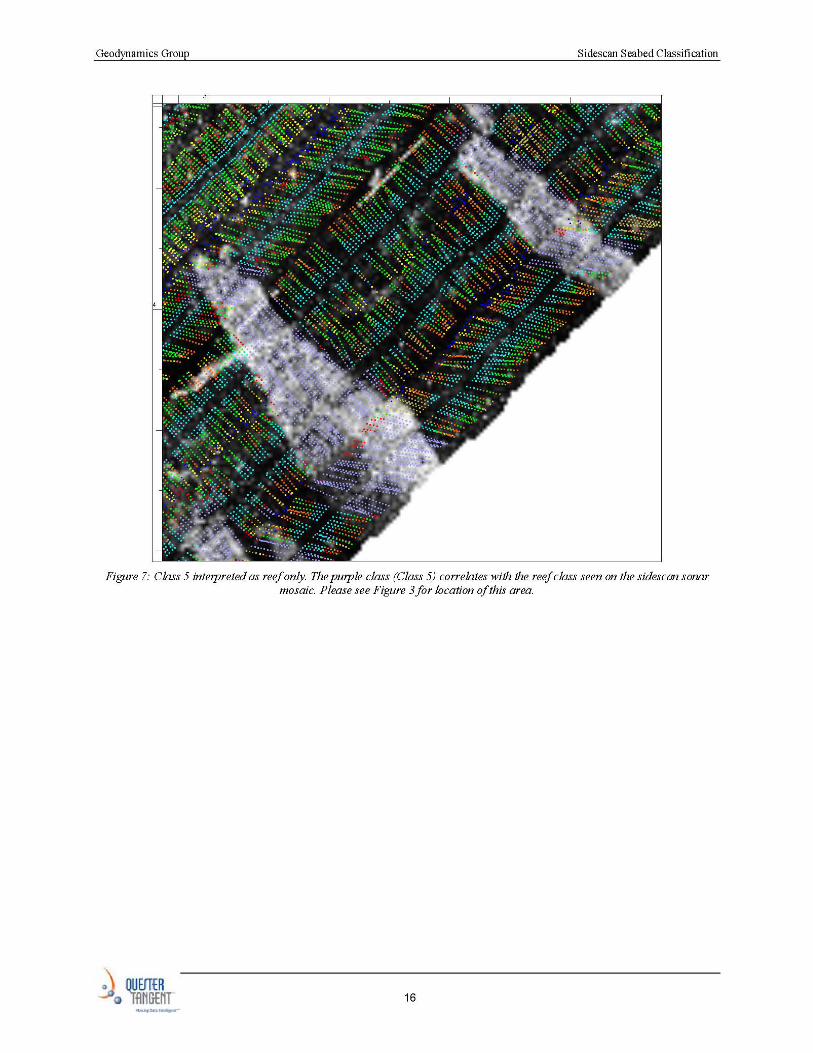
70
71

72
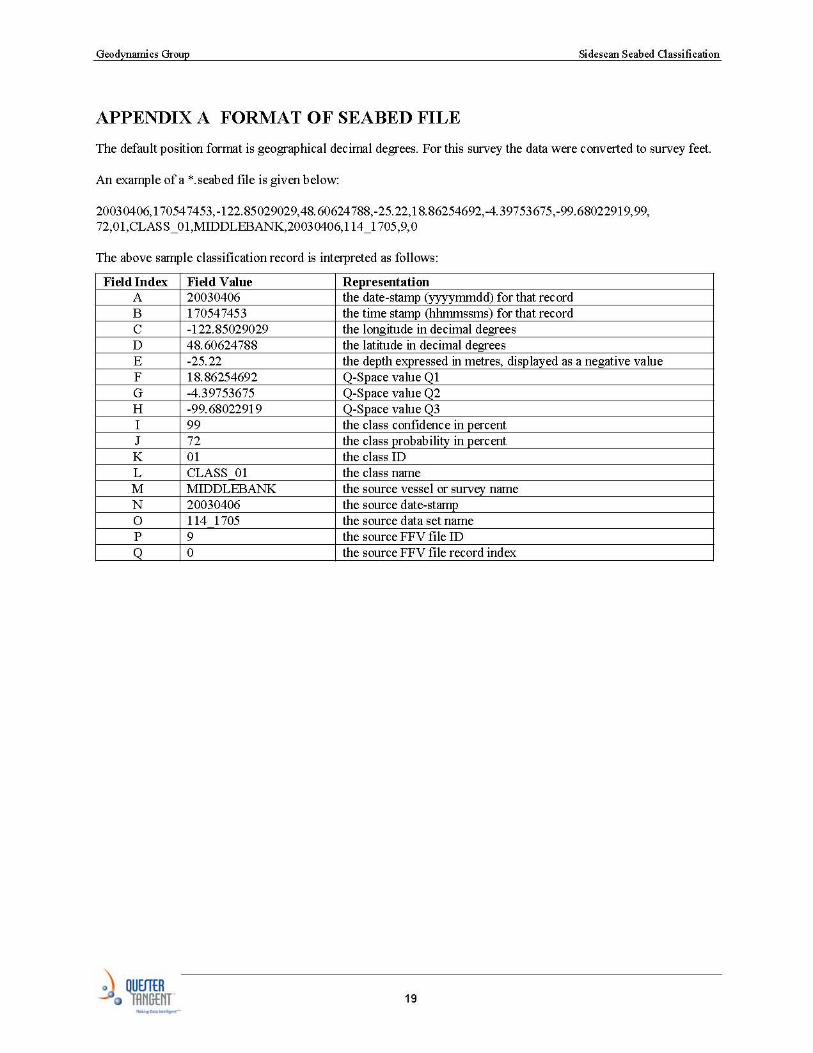
73
General Reevaluation Report
and Environmental Impact Statement
on
Hurricane Protection and Beach Erosion Control
WEST ONSLOW BEACH AND NEW RIVER INLET (TOPSAIL BEACH), NORTH CAROLINA
Appendix R - Nearshore Hardbottom Survey
Attachment 3 - High-Resolution 3D Bathymetric Assessment of
Potential Hard Bottom Habitats: Topsail Island, Surf City and North Topsail Island, NC January / February 2007

High-Resolution 3D Bathymetric Assessment of
Potential Hard Bottom Habitats: Topsail Island, Surf City and North Topsail Island, NC January / February 2007
Survey Report
Project No. DACW54-02-D-0006, Delivery Order 0035 Modification 01 Nearshore Hardbottom Sidescan Survey for Multibeam Data Collections Topsail Island, NC
G&O Project Number 146046.T35.6481.GEO
Submitted by:
With Subconsultant:
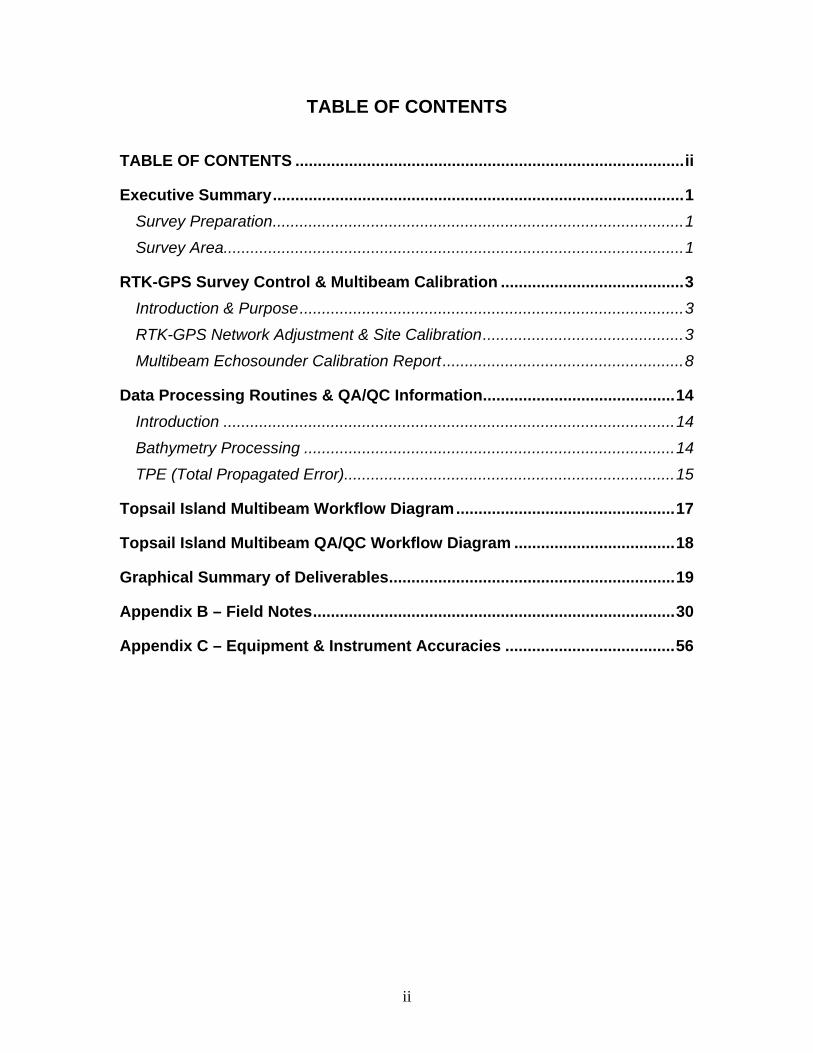
ii
TABLE OF CONTENTS
TABLE OF CONTENTS .......................................................................................ii
Executive Summary............................................................................................1 Survey Preparation............................................................................................1 Survey Area.......................................................................................................1
RTK-GPS Survey Control & Multibeam Calibration .........................................3 Introduction & Purpose......................................................................................3 RTK-GPS Network Adjustment & Site Calibration.............................................3 Multibeam Echosounder Calibration Report ......................................................8
Data Processing Routines & QA/QC Information...........................................14 Introduction .....................................................................................................14 Bathymetry Processing ...................................................................................14 TPE (Total Propagated Error)..........................................................................15
Topsail Island Multibeam Workflow Diagram.................................................17
Topsail Island Multibeam QA/QC Workflow Diagram ....................................18
Graphical Summary of Deliverables................................................................19
Appendix B – Field Notes.................................................................................30
Appendix C – Equipment & Instrument Accuracies ......................................56
1
Executive Summary Geodynamics LLC was contracted by the USACE Wilmington District through Greenhorne & O’Mara Inc. on January 16th 2007 to perform a detailed bathymetric survey (phase 2) of zones identified as potential hard bottoms from the July 2006 side-scan sonar study performed by Geodynamics in July 2006 (phase 1). The January 26 – February 6th multibeam surveys employed a Simrad EM3002 shallow water multibeam sonar system to collect spatially dense bathymetric data across 0.85 square miles of seafloor for the development of an accurate surface model as described in the official Scope of Work (Appendix A). The system runs at 300 kHz and is compensated for motion and heading with an Applanix POS MV 320 v4 inertial navigation system. Sensor offsets have been surveyed to close within 1 millimeter by the National Geodetic Survey. The EM3002 produces a swath of sonar approximately 4 times the water depth and collects approximately 400 soundings per square meter. Sound velocity was calculated in real-time at the transducer head with an Applied Microsystems miniSV and profile data was collected with an Odom Digibar Pro. Tidal corrections and positioning information were acquired using a site calibrated Trimble 5700 Real-Time Kinematic GPS (RTK-GPS) system integrated with the POS MV 320 through a Pacific Crest PDL radio modem. The RTK-GPS system uses a land-based station coupled with a 25-watt radio and a Maxrad 5 dB high-gain antenna to broadcast the computed real-time horizontal and vertical corrections at 10 Hz to the hydro survey platform. To compute centimeter-scale position and elevation information, determine the relationship between WGS-84 and local grid coordinates, and to evaluate the local geoid-spheroid separation, we first performed a detailed network adjustment and site calibration. Information on the site calibration can be found in the corresponding section of this final report and published accuracies on each of the systems can be found in Appendix C.
Survey Preparation
Survey Area Topsail Island is located approximately 20 miles northeast of Wilmington and separates Lee Island to the south and Onslow Beach to the north. The Topsail Island nearshore survey was comprised of 18 planned survey lines (6 line per survey area) spaced 70’ to 90’ apart to obtain 100% seafloor coverage (Figure 1). The total area of the survey encompassed 0.85 square miles with a total of 57 line miles.
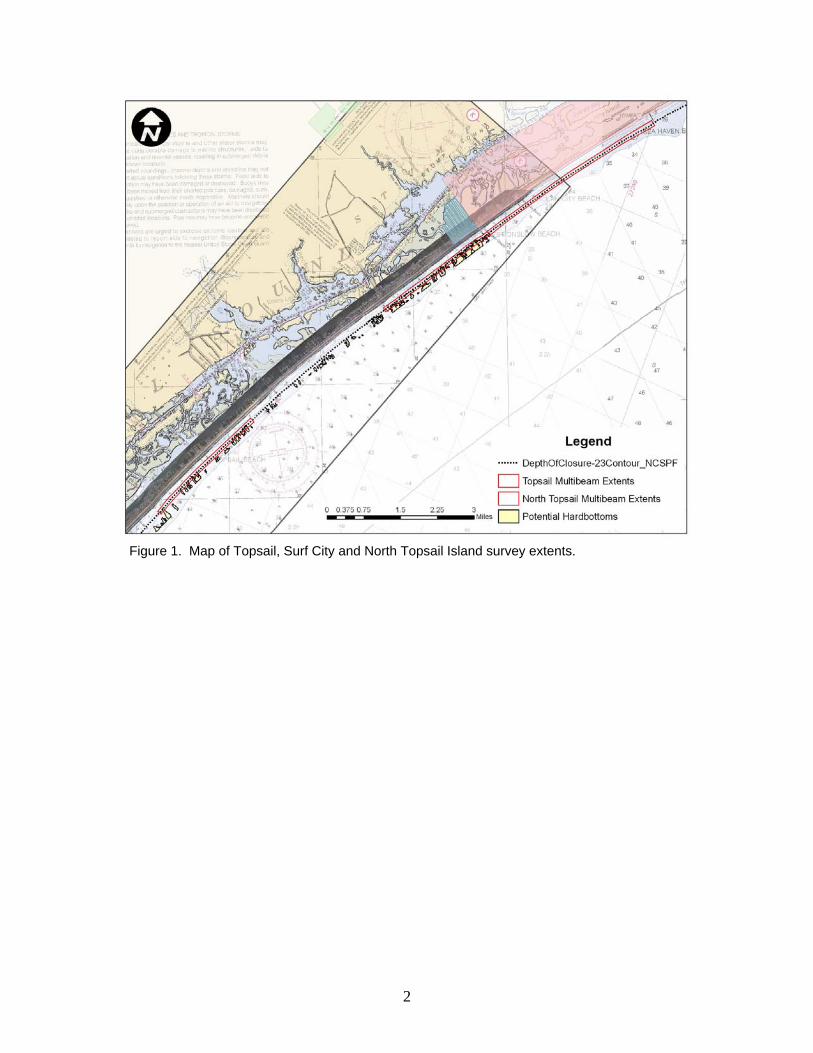
2
Figure 1. Map of Topsail, Surf City and North Topsail Island survey extents.
3
RTK-GPS Survey Control & Multibeam Calibration
Introduction & Purpose The most common problem in accurately measuring the seafloor with any sonar-based system, especially in and around a tidal inlet, is the calculation of the tidal elevation offset. Commonly a tide staff or gauge is deployed in one location near the survey site and is used to calculate the tides for the entire survey area. However, it is widely understood that non-linear tidal phenomena, phase lags and tidal gradients can drastically influence the tidal elevation spatially across a tidal inlet and therefore the use of a single point measurement is often unreliable. To avoid these potential tidal elevation errors which can translate into significant departures from the true bottom depth, we use geodetic Global Positioning Systems (GPS) with real-time kinematic (RTK) baseline processing that is integrated with the multibeam and inertial navigation instruments. The motion and Geoid 03 compensated positions and orthometric elevations of the RTK-GPS data stream are tagged with each sonar ping. In effect, the RTK-GPS mounted on the hydrographic survey vessel acts as a roving tide gauge collecting the most accurate tidal measurements throughout the survey area. Multibeam swath sonar systems combine a complex array of instruments, consisting of the transducer, motion sensor, inertial navigation, and geodetic GPS systems. Standards developed by the International Hydrographic Organization (IHO), USACE Standards for Hydrographic Surveys, and the NOS Hydrographic Surveys Specifications and Deliverables for shallow water (<30 m) hydrography (IHO 1987; USACE 2003; NOS 2006) are used as the protocol for calibration. Proper alignment of these instruments with one another and with the vessel’s reference frame is critical to achieve the high-accuracy required in the SOW. Calculation of the horizontal and vertical offsets between each of the instruments completed by the National Geodetic Survey is followed by a series of sea-based measurements known as the patch test. The patch test is performed to calculate several residual biases influenced by the dynamics of the survey vessel and the alignment of the instruments. Results of the patch test, documented in the following sections, are used to calculate a pitch, roll and heading offset and positioning time delay or navigation latency. Additional calibration measures are performed in the field including comparison of nadir depths with a lead line and frequent sound velocity profiles. The results of these daily field checks can be found in the html metadata file accompanying the final soundings.
RTK-GPS Network Adjustment & Site Calibration There are many environmental and operator-based influences that can affect the accuracy of RTK-GPS and the resultant baseline solutions (Bilker 2001; Trimble
4
Navigation Limited 1998; Magellan Corporation 2001). Although RTK-GPS is an emerging tool among hydrographers, little attention has been given to an accuracy standard for this methodology—especially in the field of coastal mapping and monitoring (Morton et al., 1993). In an effort to limit operator error and to quantify daily environmental error, we have developed an internal standards protocol for RTK error estimation based on thresholds developed by the California Department of Transportation and the US Army Corps of Engineers (USACE) Topographic Accuracy Standards (CALTRANS 2002; USACE 1994). The first step in our protocol is to determine an appropriate land-based GPS station that will provide the most accurate corrections and range to the outer limits of the survey area. Phase one of the project we used a benchmark atop a circa 1940’s rocket observation platform called “Tower 3”. Our initial plan was to use this mark for phase 2 of the project; however, after approximately 3 weeks of trying to contact the owner for access to the site we were unable to reach the current owners of the property. We then chose to use “A230”, which is approximately 0.5 miles south of “Tower 3”. The second step in our RTK-GPS protocol was to perform a detailed GPS site calibration on the new basestation prior to the collection of any hydrographic survey data. The site calibration is used to determine the basestation quality relative to the local network of NGS and NOS survey control and to analyze any potential spatial separations between the local geoid heights (GEOID 03) and ellipsoidal values (WGS-84) that may influence the resulting orthometric elevations. The calibration entails selecting the control to be used for the RTK-GPS basestation receiver and radio broadcast system and then checking at least three known geodetic benchmarks of exceptional horizontal and vertical quality within and even outside the survey boundaries. The benchmarks are occupied in “site calibration mode” over 300 epochs or approximately 3 to 5 minutes. A detailed RTK-GPS site calibration for phase 2 of this project was performed on January 26, 2007 prior to the start of the multibeam data acquisition phase. Three benchmarks from various government and state agencies were used in the calibration and results can be found in Table 1. Results showed an average deviation of 4.8cm (0.157’) in the Northing, 1.5cm (0.049’) in the Easting and 3.0cm (0.098’) in the Elevation.

5
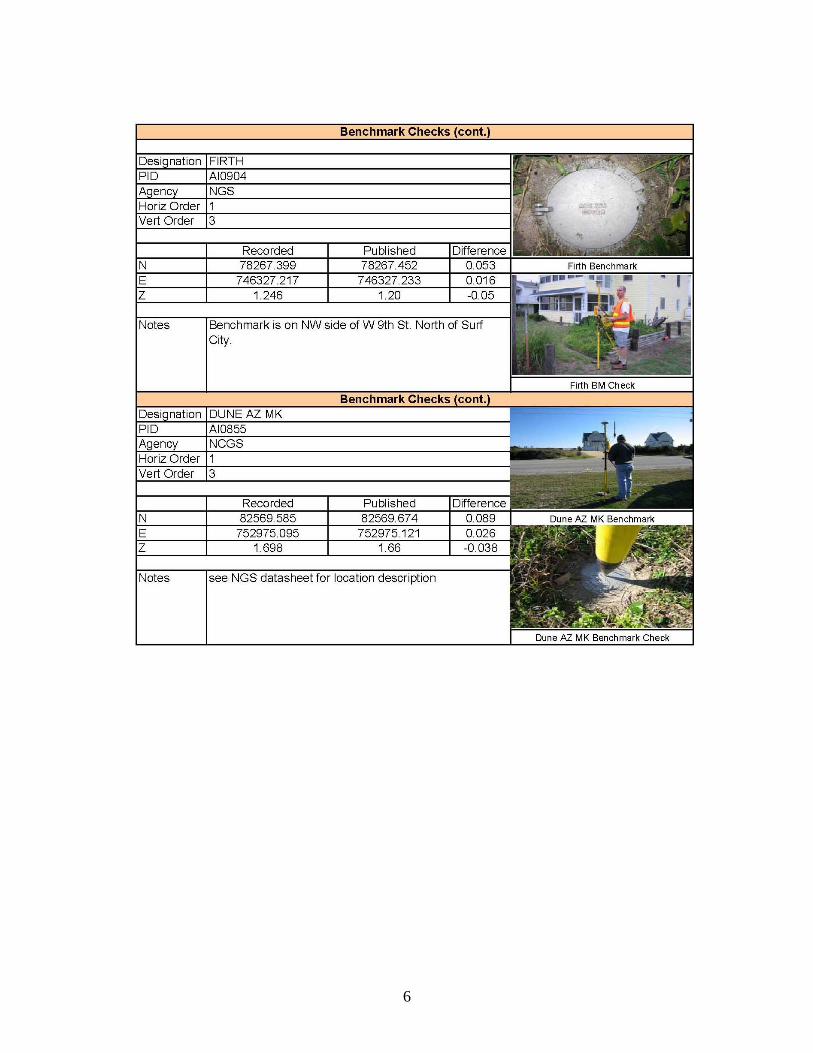
6
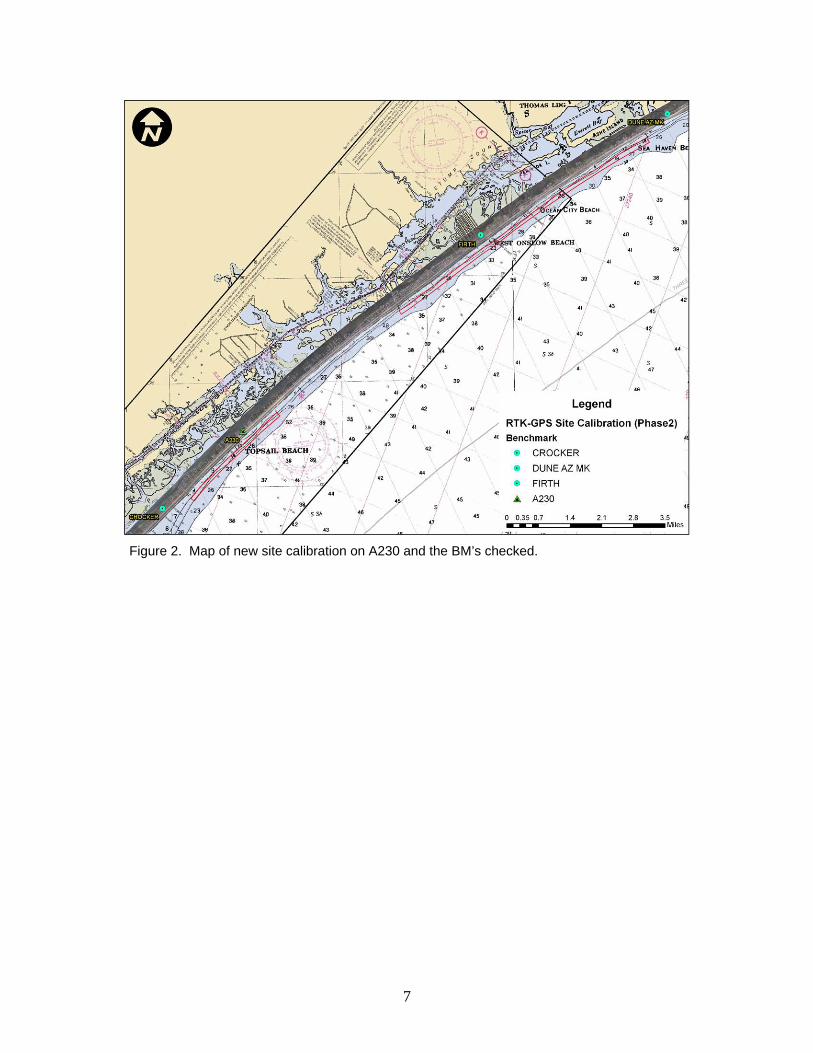
7
Figure 2. Map of new site calibration on A230 and the BM’s checked.
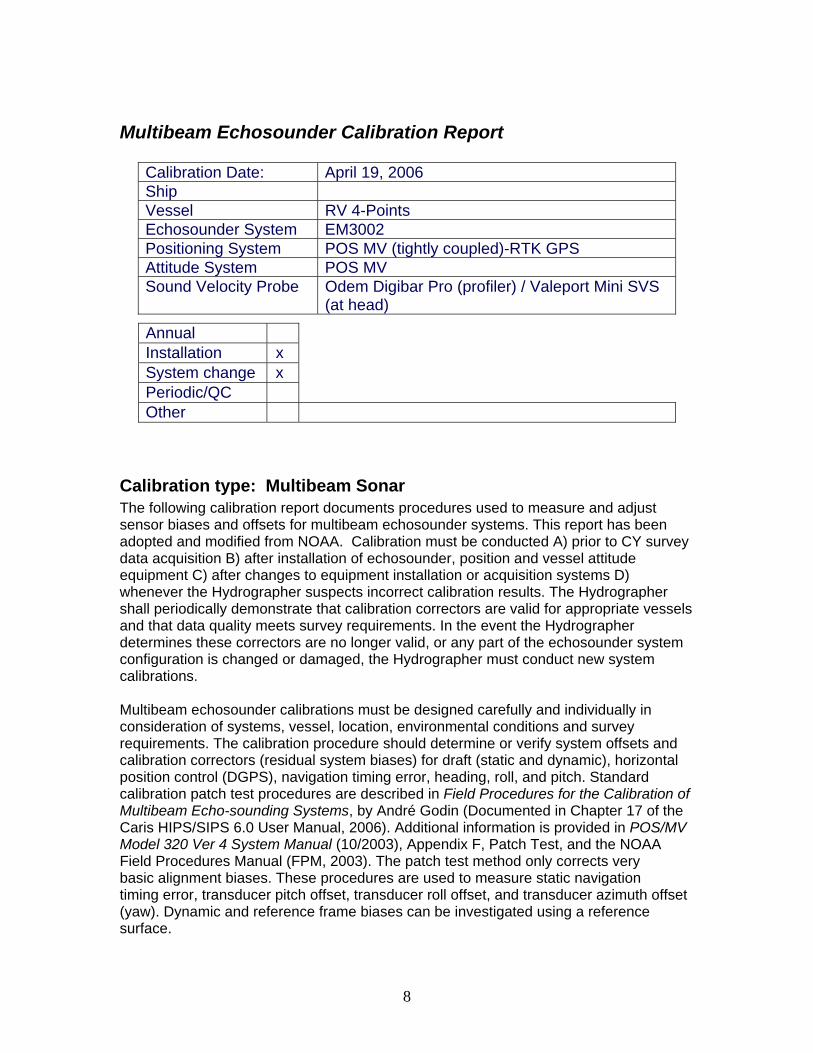
8
Multibeam Echosounder Calibration Report
Calibration type: Multibeam Sonar The following calibration report documents procedures used to measure and adjust sensor biases and offsets for multibeam echosounder systems. This report has been adopted and modified from NOAA. Calibration must be conducted A) prior to CY survey data acquisition B) after installation of echosounder, position and vessel attitude equipment C) after changes to equipment installation or acquisition systems D) whenever the Hydrographer suspects incorrect calibration results. The Hydrographer shall periodically demonstrate that calibration correctors are valid for appropriate vessels and that data quality meets survey requirements. In the event the Hydrographer determines these correctors are no longer valid, or any part of the echosounder system configuration is changed or damaged, the Hydrographer must conduct new system calibrations. Multibeam echosounder calibrations must be designed carefully and individually in consideration of systems, vessel, location, environmental conditions and survey requirements. The calibration procedure should determine or verify system offsets and calibration correctors (residual system biases) for draft (static and dynamic), horizontal position control (DGPS), navigation timing error, heading, roll, and pitch. Standard calibration patch test procedures are described in Field Procedures for the Calibration of Multibeam Echo-sounding Systems, by André Godin (Documented in Chapter 17 of the Caris HIPS/SIPS 6.0 User Manual, 2006). Additional information is provided in POS/MV Model 320 Ver 4 System Manual (10/2003), Appendix F, Patch Test, and the NOAA Field Procedures Manual (FPM, 2003). The patch test method only corrects very basic alignment biases. These procedures are used to measure static navigation timing error, transducer pitch offset, transducer roll offset, and transducer azimuth offset (yaw). Dynamic and reference frame biases can be investigated using a reference surface.
Calibration Date: April 19, 2006 Ship Vessel RV 4-Points Echosounder System EM3002 Positioning System POS MV (tightly coupled)-RTK GPS Attitude System POS MV Sound Velocity Probe Odem Digibar Pro (profiler) / Valeport Mini SVS
(at head)
Annual Installation x System change x Periodic/QC Other

9
Pre-calibration Survey Information Reference Frame Survey RV 4-Points was surveyed by the National Geodetic Survey on February 15, 2006 for precise centerline and instrument locations. Steve Breidenbach performed the survey with a Trimble 5603 total Station. (IMU, Ref Pt., and XY of CG are all co-aligned and attitude and position is valid at the sensor. The values below are entered in POSview software.) Reference to IMU Lever Arm
X(m) Y (m) Z (m) 0 0 0
Reference to Pri. GPS
X(m) Y (m) Z (m) 1.849 -1.061 -1.724
IMU frame w.r.t. Reference frame
X(deg) Y (deg) Z (deg) 0 0 0
Reference to Sensor Lever Arm
X(m) Y (m) Z (m) -0.097 -2.130 0.849
Reference to CG
X(m) Y (m) Z (m) 0 0 0.313
Reference to Vessel (Pt of validation for attitude and nav)
X(m) Y (m) Z (m) -0.097 -2.130 0.849
__X__Measurements verified for this calibration. ___ __Drawing and table attached. _____Drawing and table included with project report
POS MV Configuration File: 4_points_022806._*________________ Notes: _NGS vessel survey results were put in POSview and GAMS calibration was done on February 28, 2006___.
Figure 3. Photo of the centerline and instrument survey by NGS.
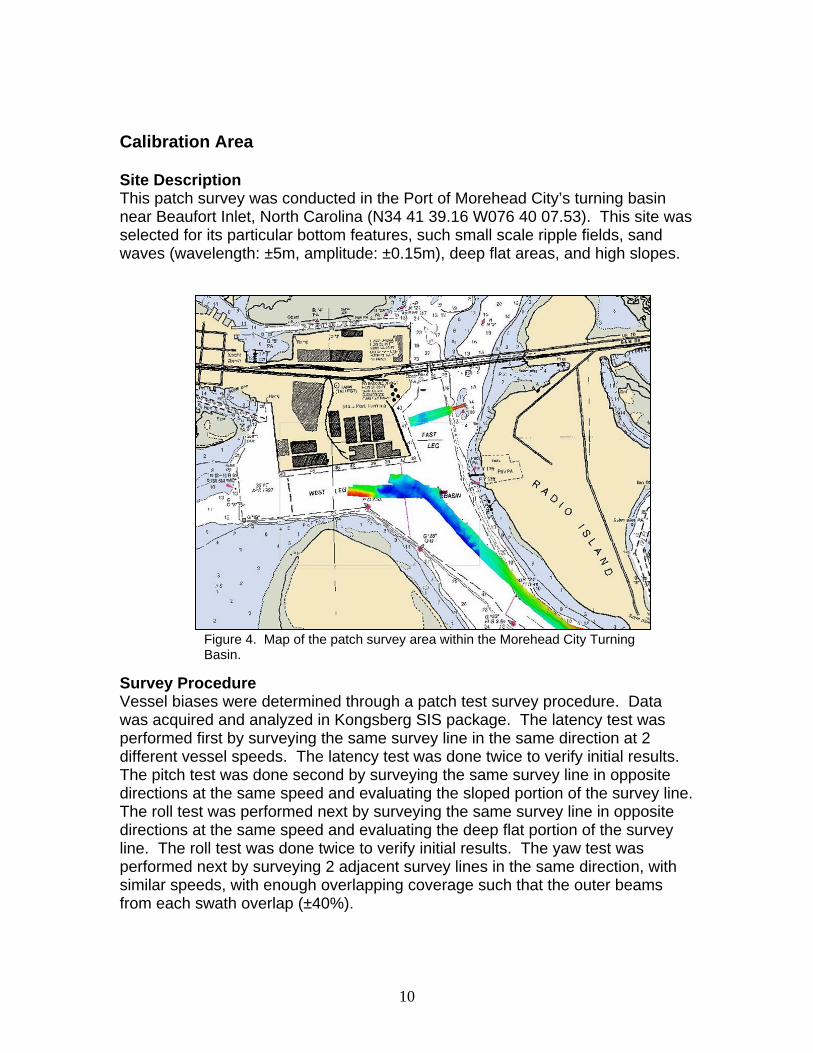
10
Calibration Area Site Description This patch survey was conducted in the Port of Morehead City’s turning basin near Beaufort Inlet, North Carolina (N34 41 39.16 W076 40 07.53). This site was selected for its particular bottom features, such small scale ripple fields, sand waves (wavelength: ±5m, amplitude: ±0.15m), deep flat areas, and high slopes. Survey Procedure Vessel biases were determined through a patch test survey procedure. Data was acquired and analyzed in Kongsberg SIS package. The latency test was performed first by surveying the same survey line in the same direction at 2 different vessel speeds. The latency test was done twice to verify initial results. The pitch test was done second by surveying the same survey line in opposite directions at the same speed and evaluating the sloped portion of the survey line. The roll test was performed next by surveying the same survey line in opposite directions at the same speed and evaluating the deep flat portion of the survey line. The roll test was done twice to verify initial results. The yaw test was performed next by surveying 2 adjacent survey lines in the same direction, with similar speeds, with enough overlapping coverage such that the outer beams from each swath overlap (±40%).
Figure 4. Map of the patch survey area within the Morehead City Turning Basin.
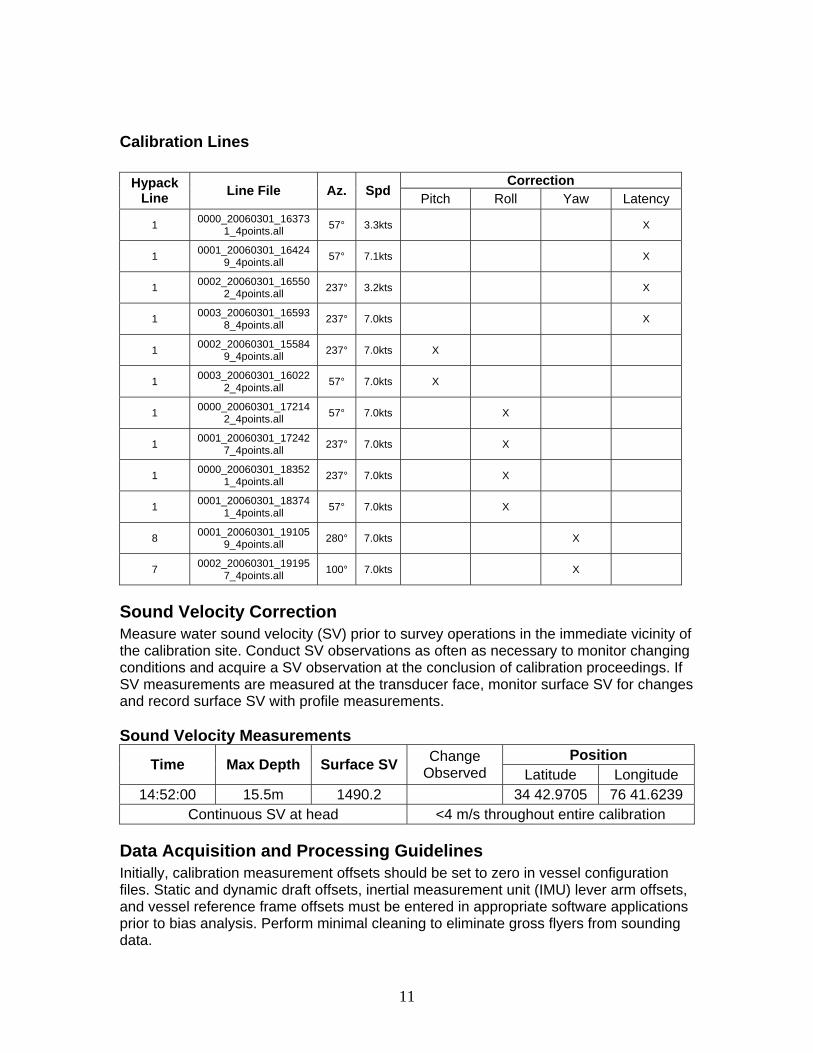
11
Calibration Lines
Correction Hypack Line Line File Az. Spd Pitch Roll Yaw Latency
1 0000_20060301_163731_4points.all 57° 3.3kts X
1 0001_20060301_164249_4points.all 57° 7.1kts X
1 0002_20060301_165502_4points.all 237° 3.2kts X
1 0003_20060301_165938_4points.all 237° 7.0kts X
1 0002_20060301_155849_4points.all 237° 7.0kts X
1 0003_20060301_160222_4points.all 57° 7.0kts X
1 0000_20060301_172142_4points.all 57° 7.0kts X
1 0001_20060301_172427_4points.all 237° 7.0kts X
1 0000_20060301_183521_4points.all 237° 7.0kts X
1 0001_20060301_183741_4points.all 57° 7.0kts X
8 0001_20060301_191059_4points.all 280° 7.0kts X
7 0002_20060301_191957_4points.all 100° 7.0kts X
Sound Velocity Correction Measure water sound velocity (SV) prior to survey operations in the immediate vicinity of the calibration site. Conduct SV observations as often as necessary to monitor changing conditions and acquire a SV observation at the conclusion of calibration proceedings. If SV measurements are measured at the transducer face, monitor surface SV for changes and record surface SV with profile measurements. Sound Velocity Measurements
Position Time Max Depth Surface SV Change Observed Latitude Longitude
14:52:00 15.5m 1490.2 34 42.9705 76 41.6239 Continuous SV at head <4 m/s throughout entire calibration
Data Acquisition and Processing Guidelines Initially, calibration measurement offsets should be set to zero in vessel configuration files. Static and dynamic draft offsets, inertial measurement unit (IMU) lever arm offsets, and vessel reference frame offsets must be entered in appropriate software applications prior to bias analysis. Perform minimal cleaning to eliminate gross flyers from sounding data.
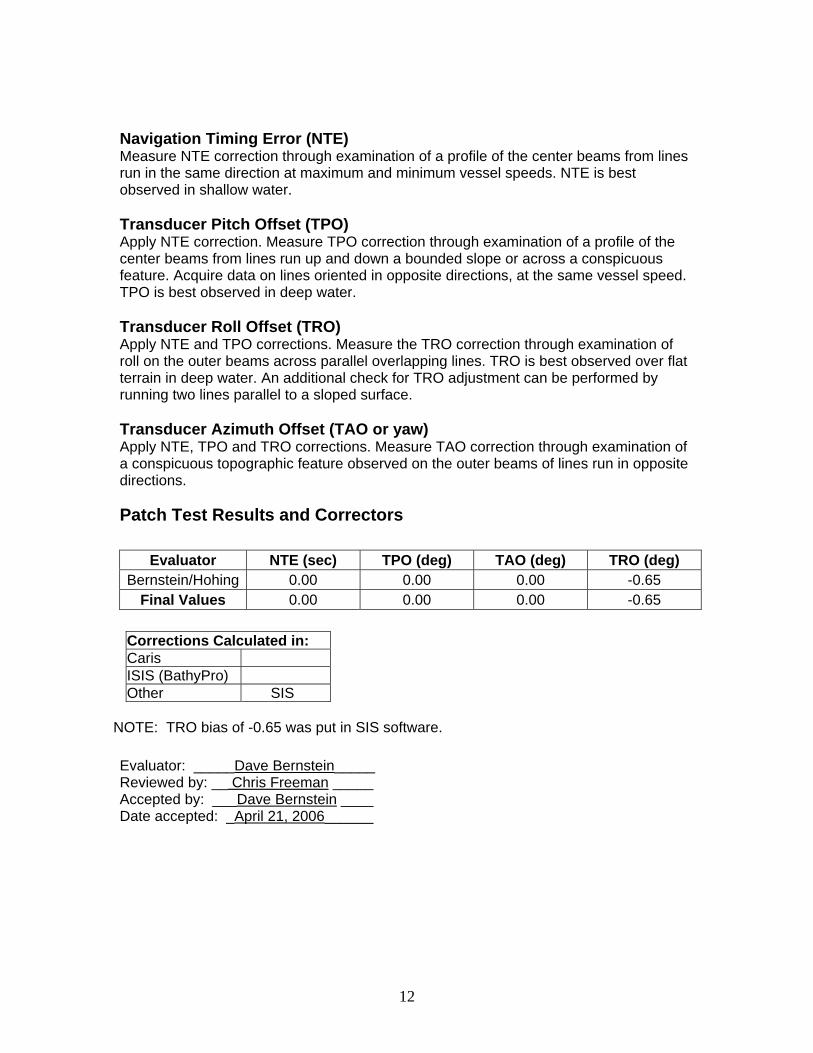
12
Navigation Timing Error (NTE) Measure NTE correction through examination of a profile of the center beams from lines run in the same direction at maximum and minimum vessel speeds. NTE is best observed in shallow water. Transducer Pitch Offset (TPO) Apply NTE correction. Measure TPO correction through examination of a profile of the center beams from lines run up and down a bounded slope or across a conspicuous feature. Acquire data on lines oriented in opposite directions, at the same vessel speed. TPO is best observed in deep water. Transducer Roll Offset (TRO) Apply NTE and TPO corrections. Measure the TRO correction through examination of roll on the outer beams across parallel overlapping lines. TRO is best observed over flat terrain in deep water. An additional check for TRO adjustment can be performed by running two lines parallel to a sloped surface. Transducer Azimuth Offset (TAO or yaw) Apply NTE, TPO and TRO corrections. Measure TAO correction through examination of a conspicuous topographic feature observed on the outer beams of lines run in opposite directions.
Patch Test Results and Correctors
Evaluator NTE (sec) TPO (deg) TAO (deg) TRO (deg) Bernstein/Hohing 0.00 0.00 0.00 -0.65
Final Values 0.00 0.00 0.00 -0.65 Corrections Calculated in: Caris ISIS (BathyPro) Other SIS
NOTE: TRO bias of -0.65 was put in SIS software. Evaluator: _____Dave Bernstein_____ Reviewed by: __ Chris Freeman _____ Accepted by: ___Dave Bernstein ____ Date accepted: _April 21, 2006______

13
Graphical Examples of Calibration Acceptance
Figure 5. Caris screen grab illustrating acceptance of roll calibration.
Figure 6. Caris screen grab illustrating acceptance of yaw calibration.
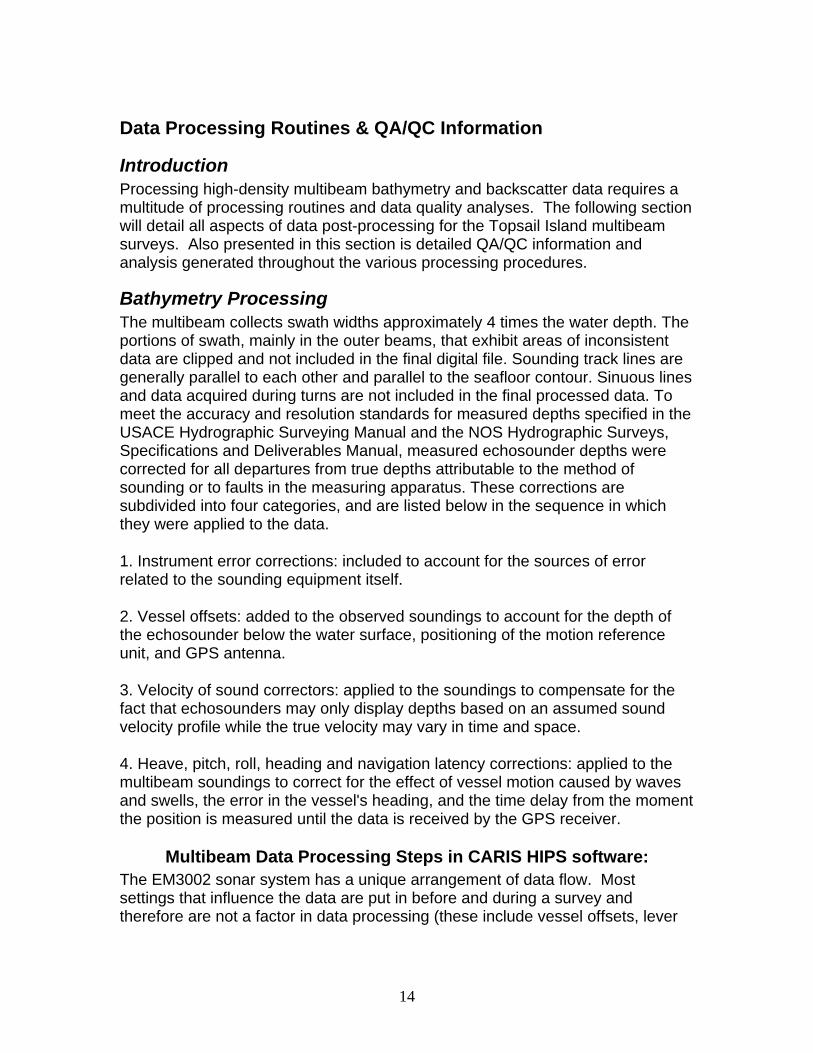
14
Data Processing Routines & QA/QC Information
Introduction Processing high-density multibeam bathymetry and backscatter data requires a multitude of processing routines and data quality analyses. The following section will detail all aspects of data post-processing for the Topsail Island multibeam surveys. Also presented in this section is detailed QA/QC information and analysis generated throughout the various processing procedures.
Bathymetry Processing The multibeam collects swath widths approximately 4 times the water depth. The portions of swath, mainly in the outer beams, that exhibit areas of inconsistent data are clipped and not included in the final digital file. Sounding track lines are generally parallel to each other and parallel to the seafloor contour. Sinuous lines and data acquired during turns are not included in the final processed data. To meet the accuracy and resolution standards for measured depths specified in the USACE Hydrographic Surveying Manual and the NOS Hydrographic Surveys, Specifications and Deliverables Manual, measured echosounder depths were corrected for all departures from true depths attributable to the method of sounding or to faults in the measuring apparatus. These corrections are subdivided into four categories, and are listed below in the sequence in which they were applied to the data.
1. Instrument error corrections: included to account for the sources of error related to the sounding equipment itself.
2. Vessel offsets: added to the observed soundings to account for the depth of the echosounder below the water surface, positioning of the motion reference unit, and GPS antenna.
3. Velocity of sound correctors: applied to the soundings to compensate for the fact that echosounders may only display depths based on an assumed sound velocity profile while the true velocity may vary in time and space.
4. Heave, pitch, roll, heading and navigation latency corrections: applied to the multibeam soundings to correct for the effect of vessel motion caused by waves and swells, the error in the vessel's heading, and the time delay from the moment the position is measured until the data is received by the GPS receiver.
Multibeam Data Processing Steps in CARIS HIPS software: The EM3002 sonar system has a unique arrangement of data flow. Most settings that influence the data are put in before and during a survey and therefore are not a factor in data processing (these include vessel offsets, lever
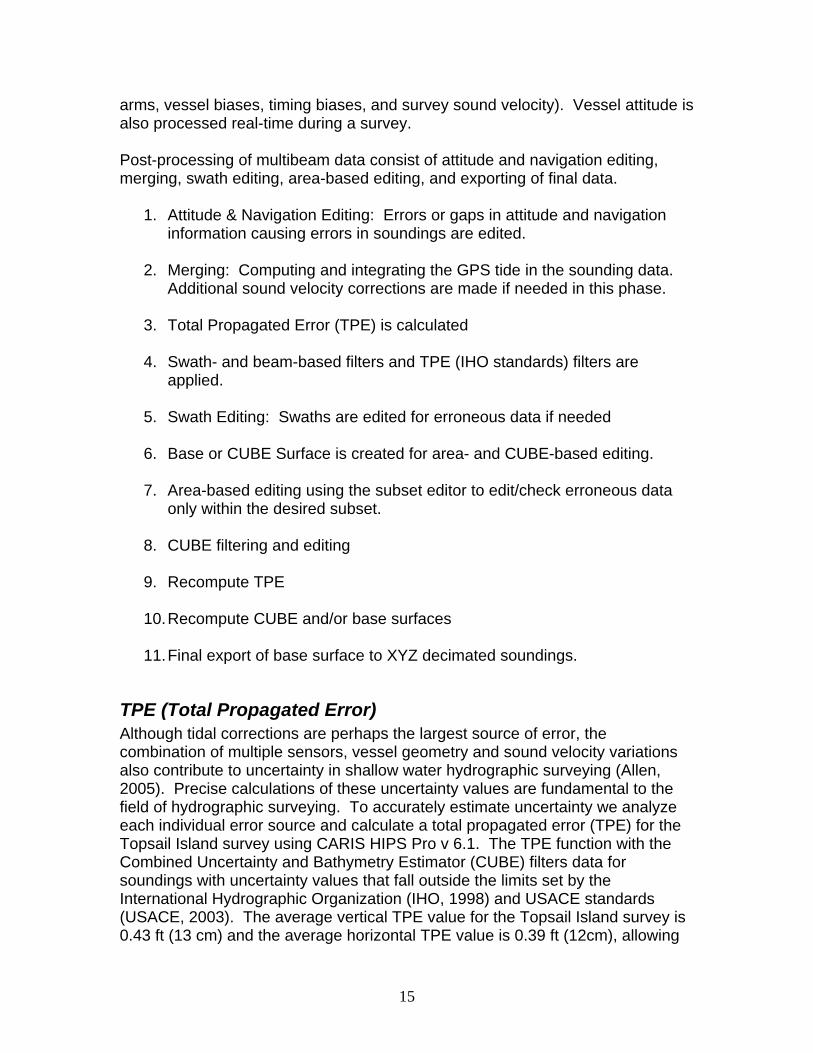
15
arms, vessel biases, timing biases, and survey sound velocity). Vessel attitude is also processed real-time during a survey. Post-processing of multibeam data consist of attitude and navigation editing, merging, swath editing, area-based editing, and exporting of final data.
1. Attitude & Navigation Editing: Errors or gaps in attitude and navigation information causing errors in soundings are edited.
2. Merging: Computing and integrating the GPS tide in the sounding data.
Additional sound velocity corrections are made if needed in this phase. 3. Total Propagated Error (TPE) is calculated
4. Swath- and beam-based filters and TPE (IHO standards) filters are
applied.
5. Swath Editing: Swaths are edited for erroneous data if needed
6. Base or CUBE Surface is created for area- and CUBE-based editing.
7. Area-based editing using the subset editor to edit/check erroneous data only within the desired subset.
8. CUBE filtering and editing
9. Recompute TPE
10. Recompute CUBE and/or base surfaces 11. Final export of base surface to XYZ decimated soundings.
TPE (Total Propagated Error) Although tidal corrections are perhaps the largest source of error, the combination of multiple sensors, vessel geometry and sound velocity variations also contribute to uncertainty in shallow water hydrographic surveying (Allen, 2005). Precise calculations of these uncertainty values are fundamental to the field of hydrographic surveying. To accurately estimate uncertainty we analyze each individual error source and calculate a total propagated error (TPE) for the Topsail Island survey using CARIS HIPS Pro v 6.1. The TPE function with the Combined Uncertainty and Bathymetry Estimator (CUBE) filters data for soundings with uncertainty values that fall outside the limits set by the International Hydrographic Organization (IHO, 1998) and USACE standards (USACE, 2003). The average vertical TPE value for the Topsail Island survey is 0.43 ft (13 cm) and the average horizontal TPE value is 0.39 ft (12cm), allowing
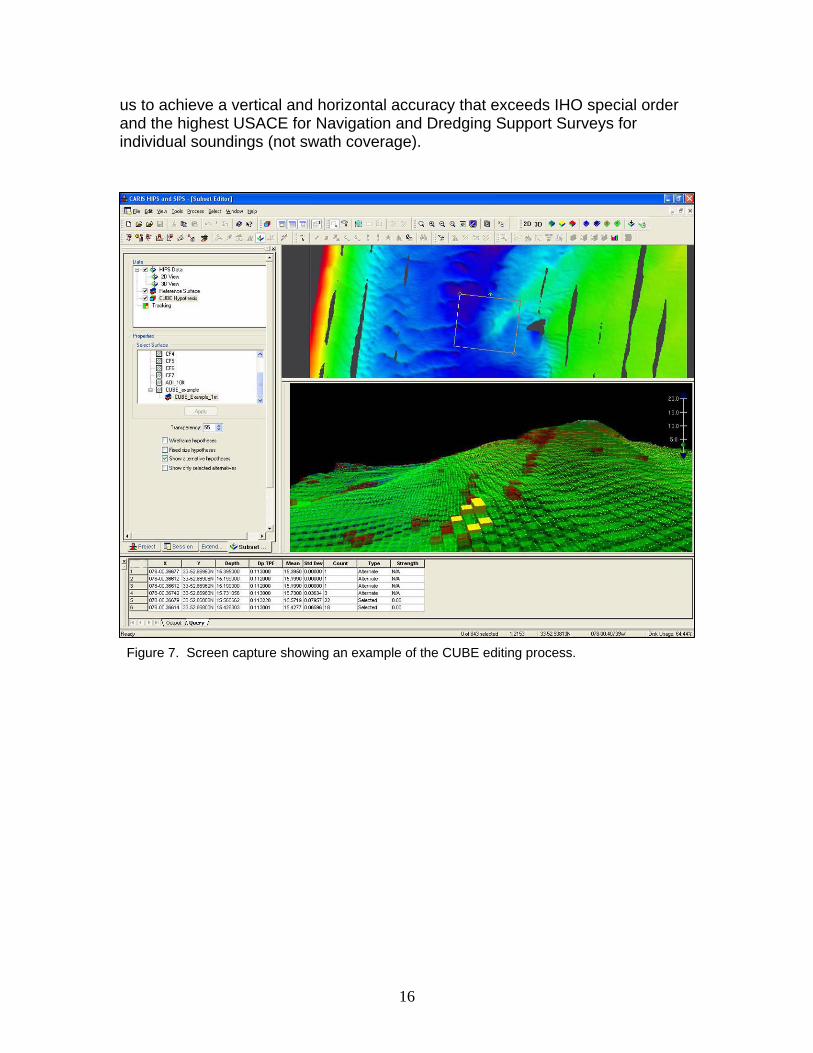
16
us to achieve a vertical and horizontal accuracy that exceeds IHO special order and the highest USACE for Navigation and Dredging Support Surveys for individual soundings (not swath coverage).
Figure 7. Screen capture showing an example of the CUBE editing process.
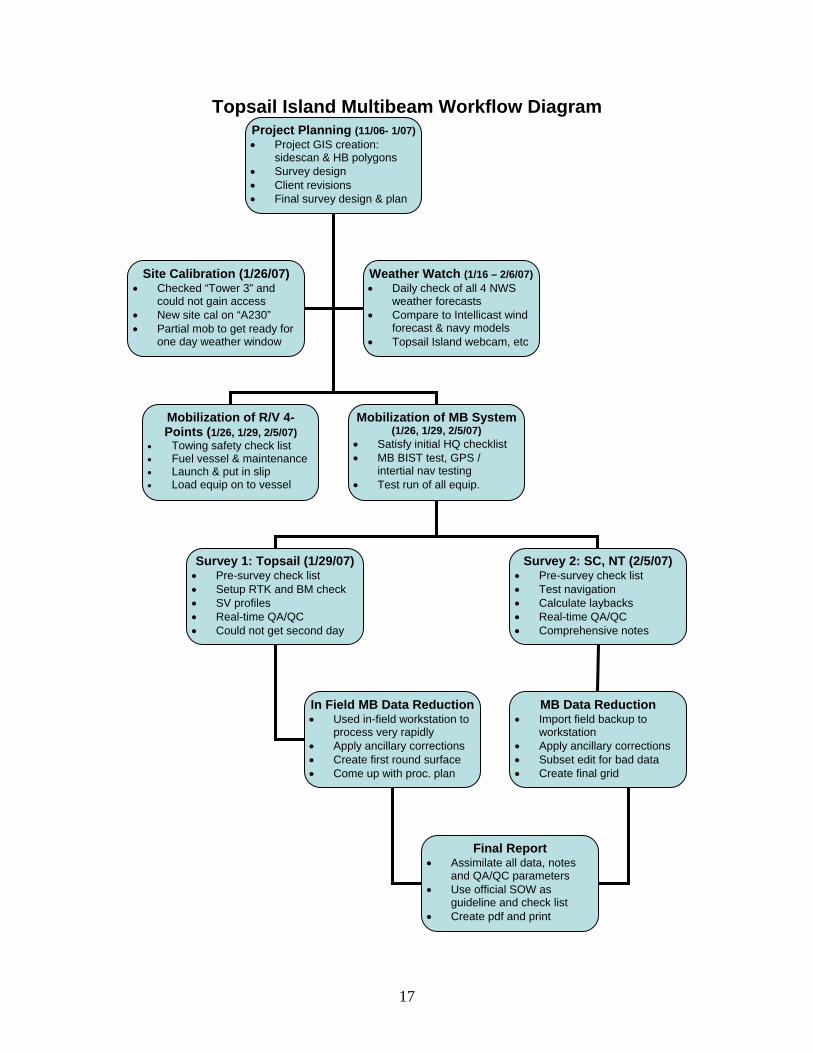
17
Topsail Island Multibeam Workflow Diagram
Project Planning (11/06- 1/07)• Project GIS creation:
sidescan & HB polygons • Survey design • Client revisions • Final survey design & plan
Mobilization of R/V 4-Points (1/26, 1/29, 2/5/07)
• Towing safety check list • Fuel vessel & maintenance • Launch & put in slip • Load equip on to vessel
Mobilization of MB System (1/26, 1/29, 2/5/07)
• Satisfy initial HQ checklist • MB BIST test, GPS /
intertial nav testing • Test run of all equip.
Site Calibration (1/26/07) • Checked “Tower 3” and
could not gain access • New site cal on “A230” • Partial mob to get ready for
one day weather window
Survey 1: Topsail (1/29/07)• Pre-survey check list • Setup RTK and BM check • SV profiles • Real-time QA/QC • Could not get second day
Survey 2: SC, NT (2/5/07) • Pre-survey check list • Test navigation • Calculate laybacks • Real-time QA/QC • Comprehensive notes
In Field MB Data Reduction• Used in-field workstation to
process very rapidly • Apply ancillary corrections • Create first round surface • Come up with proc. plan
MB Data Reduction • Import field backup to
workstation • Apply ancillary corrections • Subset edit for bad data • Create final grid
Final Report • Assimilate all data, notes
and QA/QC parameters • Use official SOW as
guideline and check list • Create pdf and print
Weather Watch (1/16 – 2/6/07)• Daily check of all 4 NWS
weather forecasts • Compare to Intellicast wind
forecast & navy models • Topsail Island webcam, etc
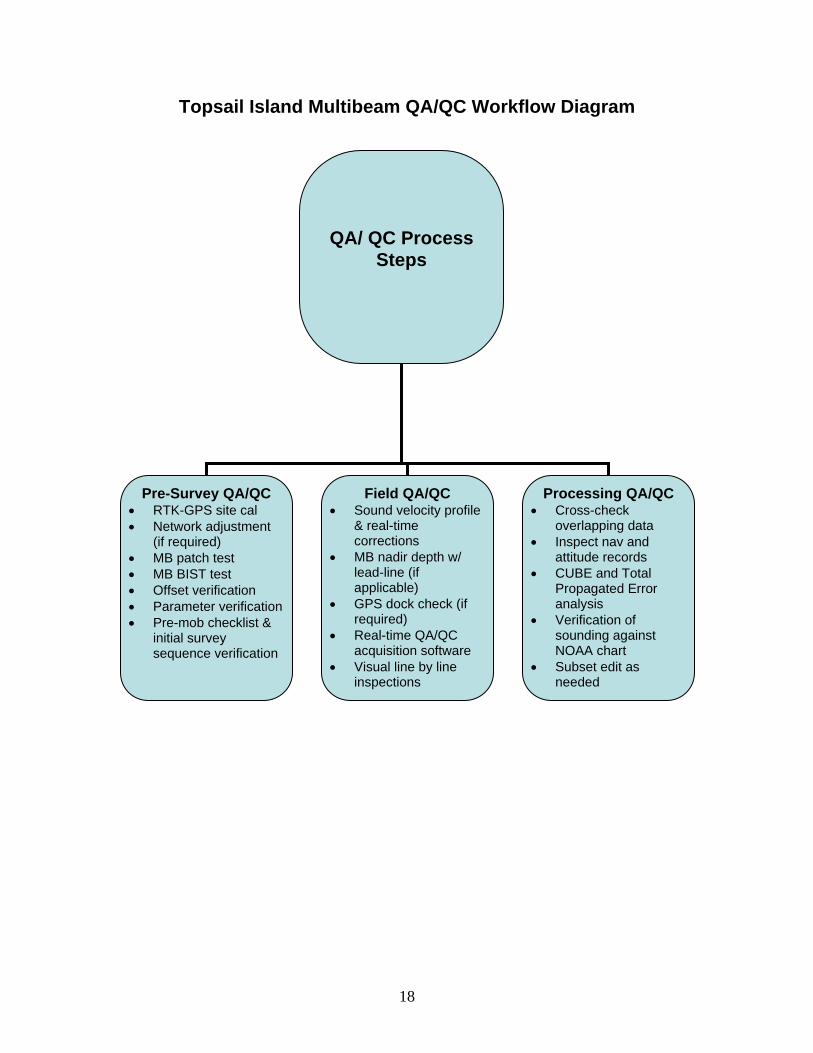
18
Topsail Island Multibeam QA/QC Workflow Diagram
QA/ QC Process Steps
Pre-Survey QA/QC • RTK-GPS site cal • Network adjustment
(if required) • MB patch test • MB BIST test • Offset verification • Parameter verification • Pre-mob checklist &
initial survey sequence verification
Field QA/QC • Sound velocity profile
& real-time corrections
• MB nadir depth w/ lead-line (if applicable)
• GPS dock check (if required)
• Real-time QA/QC acquisition software
• Visual line by line inspections
Processing QA/QC • Cross-check
overlapping data • Inspect nav and
attitude records • CUBE and Total
Propagated Error analysis
• Verification of sounding against NOAA chart
• Subset edit as needed
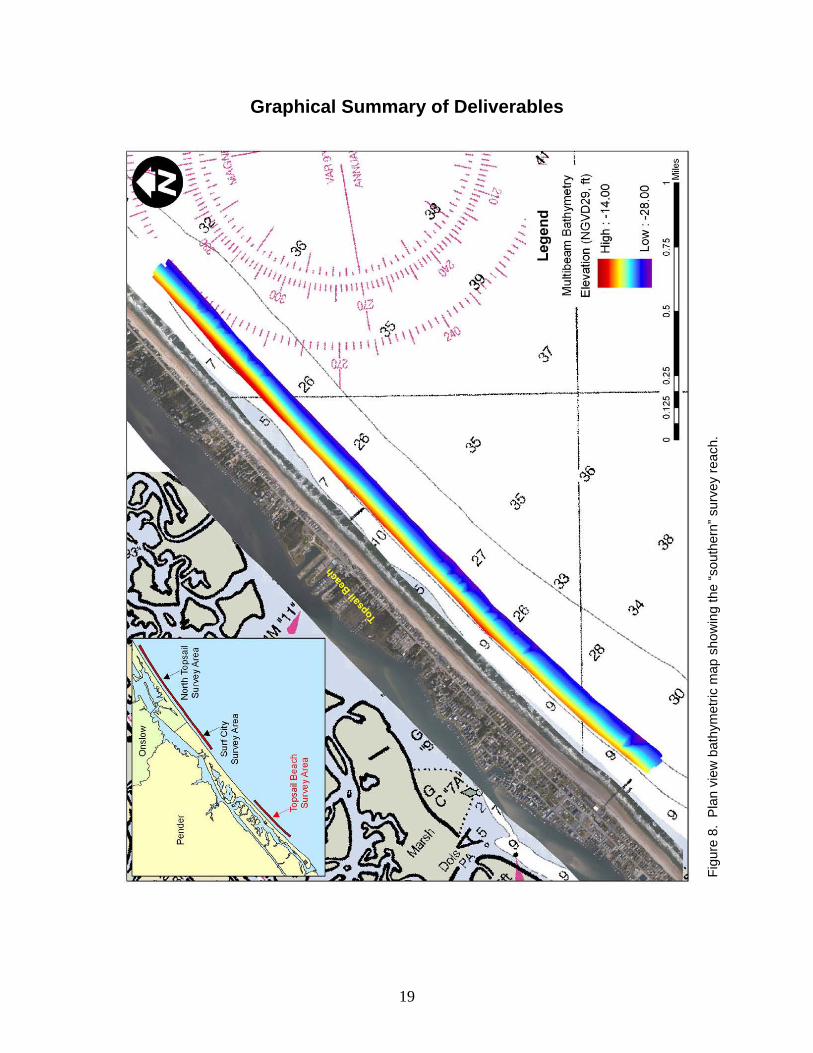
19
Graphical Summary of Deliverables
Figu
re 8
. P
lan
view
bat
hym
etric
map
sho
win
g th
e “s
outh
ern”
sur
vey
reac
h.
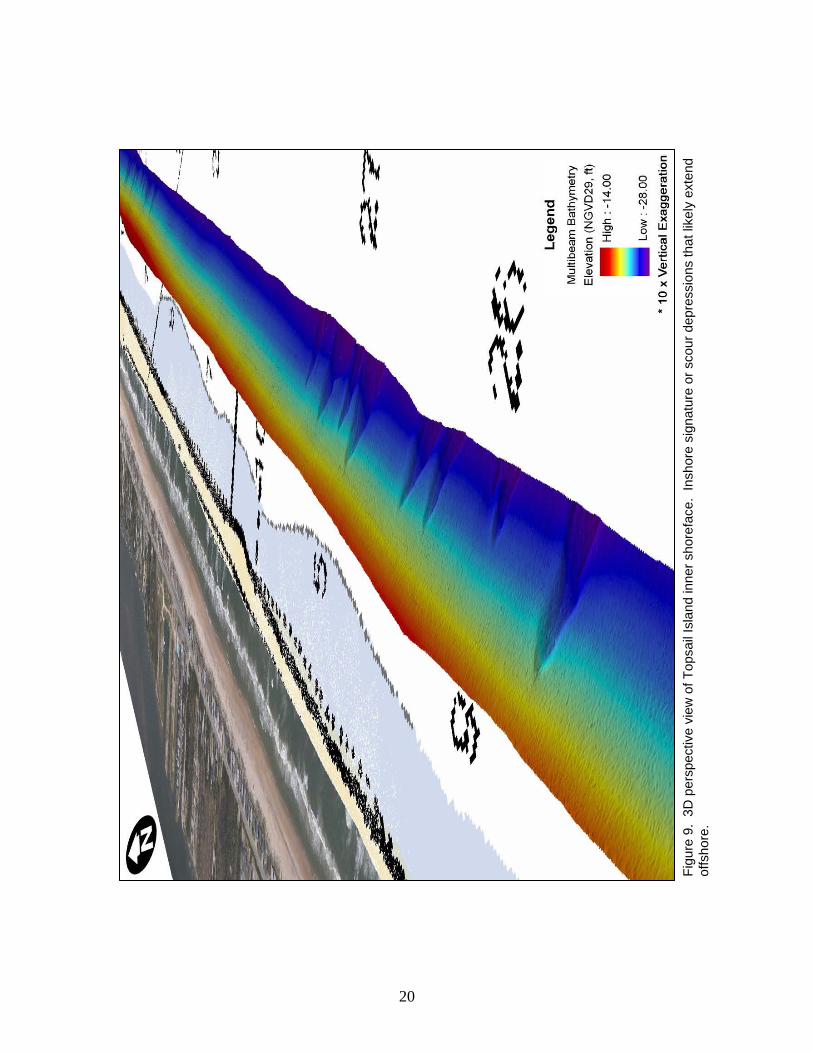
20
Figu
re 9
. 3D
per
spec
tive
view
of T
opsa
il Is
land
inne
r sho
refa
ce.
Insh
ore
sign
atur
e or
sco
ur d
epre
ssio
ns th
at li
kely
ext
end
offs
hore
.
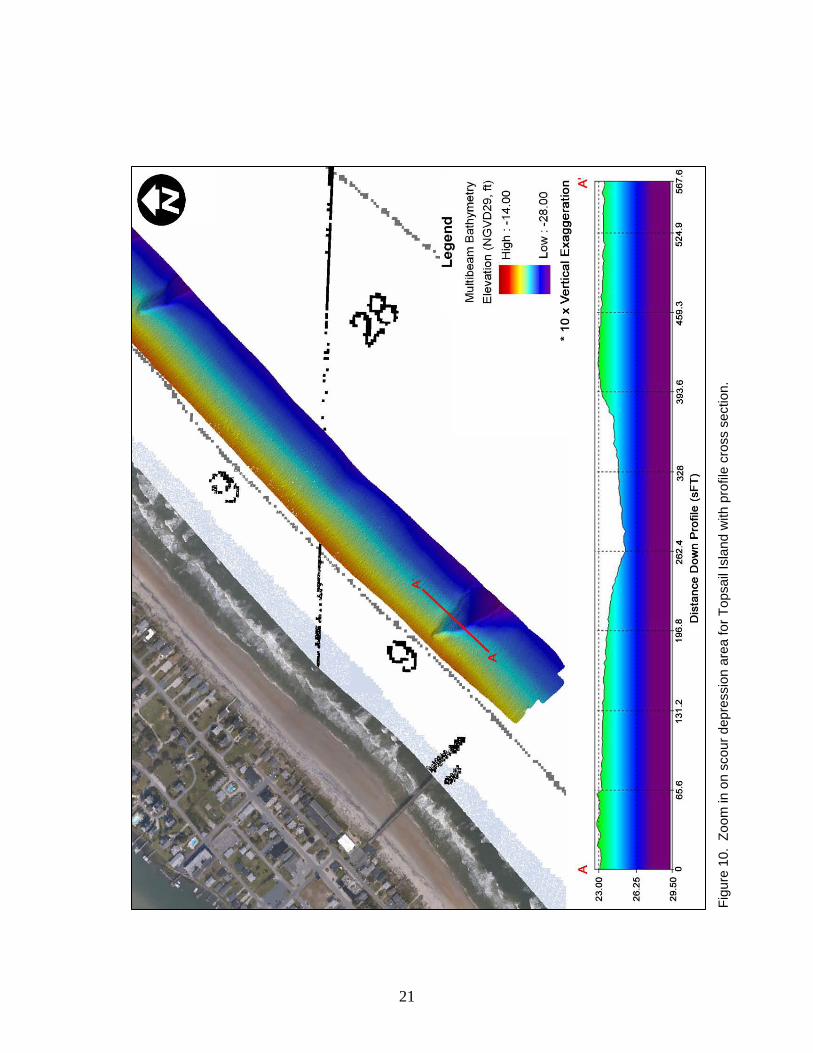
21
Figu
re 1
0. Z
oom
in o
n sc
our d
epre
ssio
n ar
ea fo
r Top
sail
Isla
nd w
ith p
rofil
e cr
oss
sect
ion.
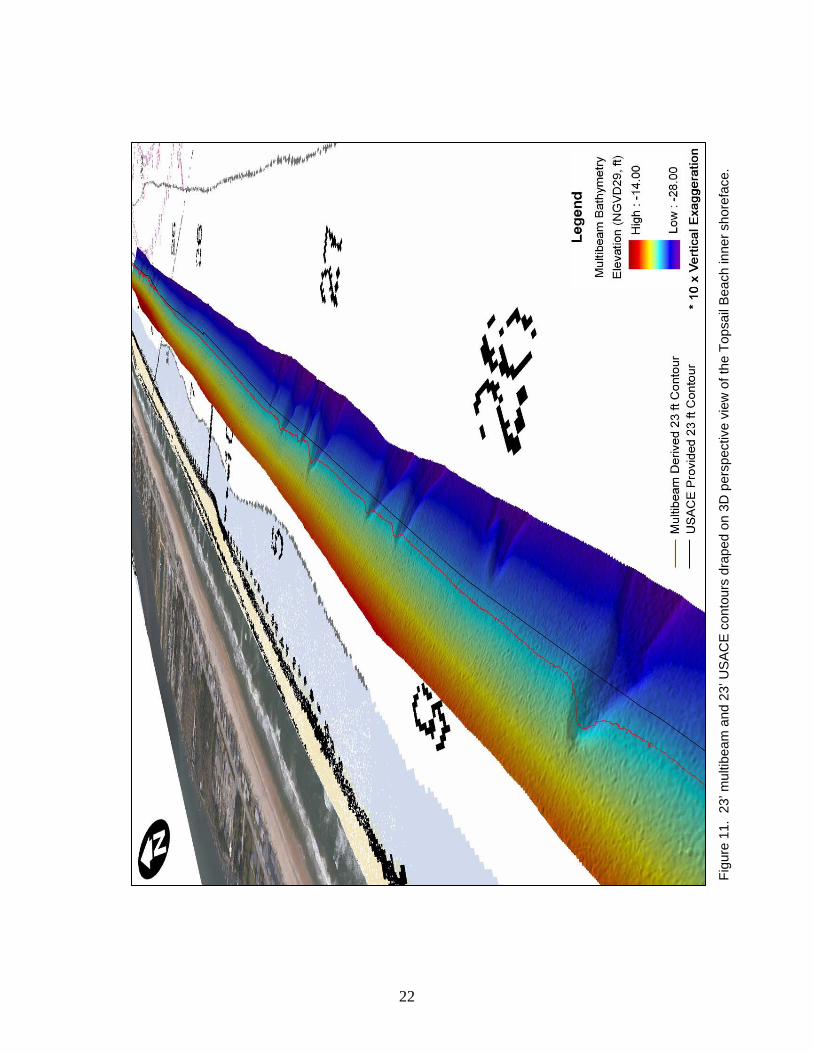
22
Figu
re 1
1. 2
3’ m
ultib
eam
and
23’
US
AC
E c
onto
urs
drap
ed o
n 3D
per
spec
tive
view
of t
he T
opsa
il B
each
inne
r sho
refa
ce.
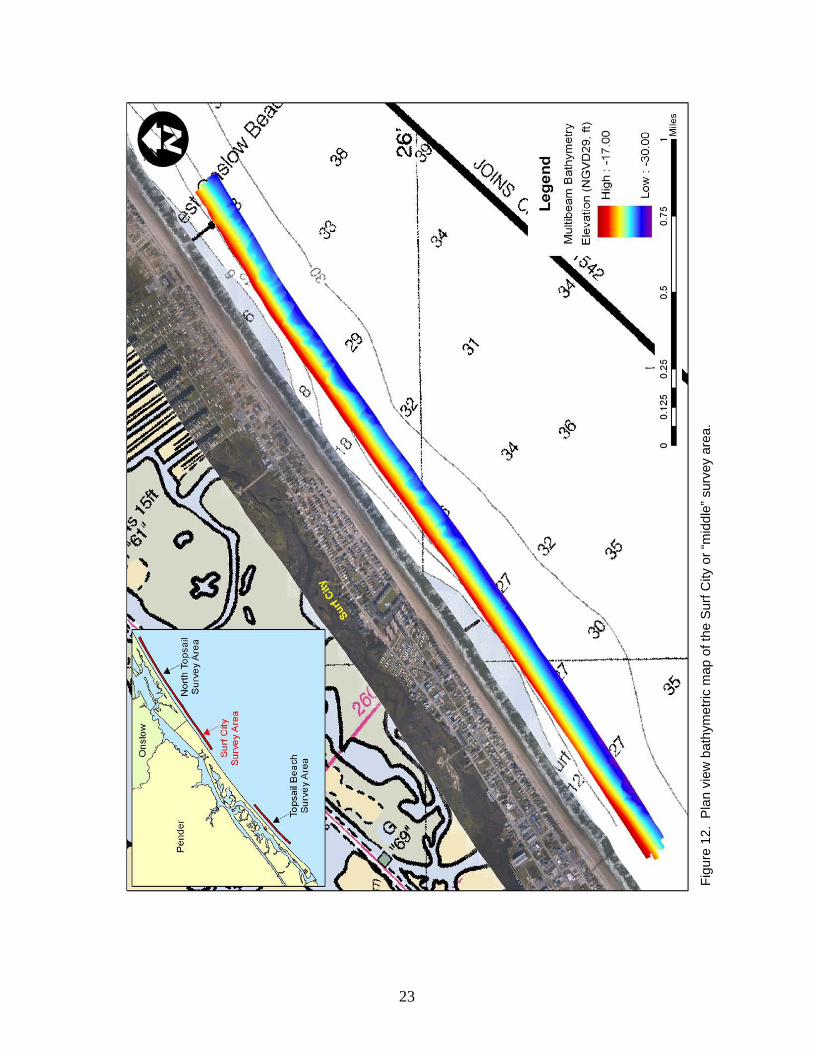
23
Figu
re 1
2. P
lan
view
bat
hym
etric
map
of t
he S
urf C
ity o
r “m
iddl
e” s
urve
y ar
ea.
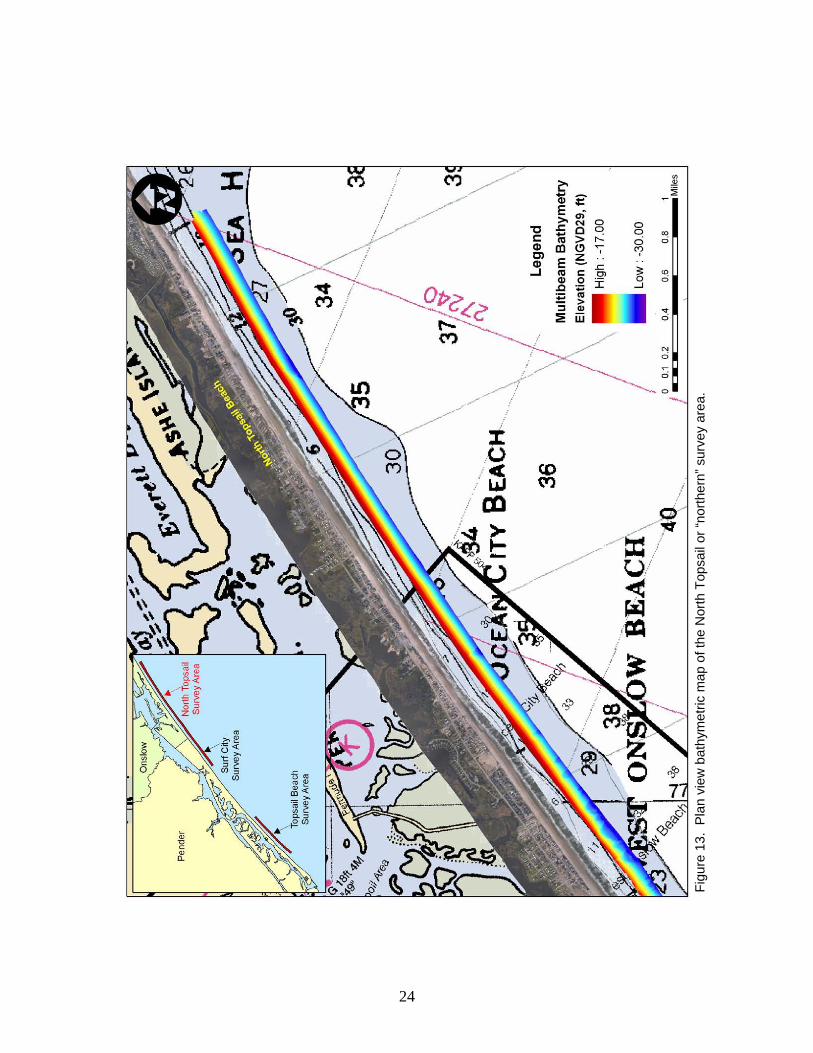
24
Figu
re 1
3. P
lan
view
bat
hym
etric
map
of t
he N
orth
Top
sail
or “n
orth
ern”
sur
vey
area
.

25
Appendix A – Official USACE Scope of Work (Scanned G&O Copy)
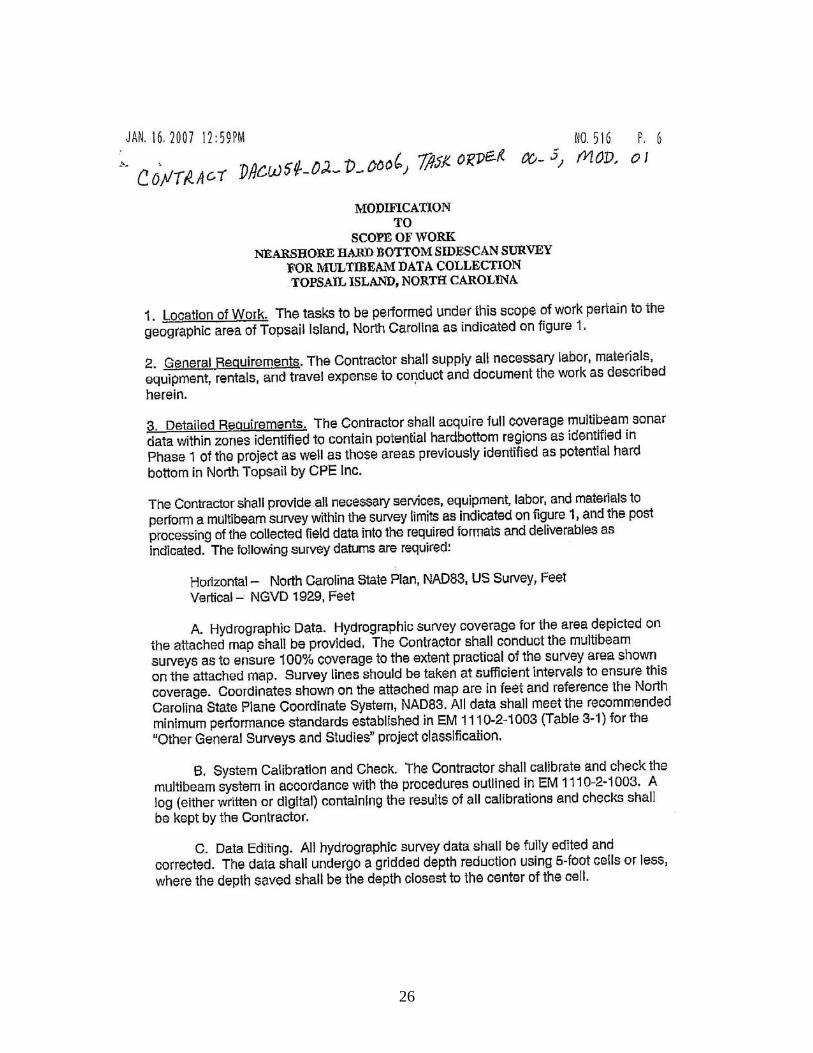
26
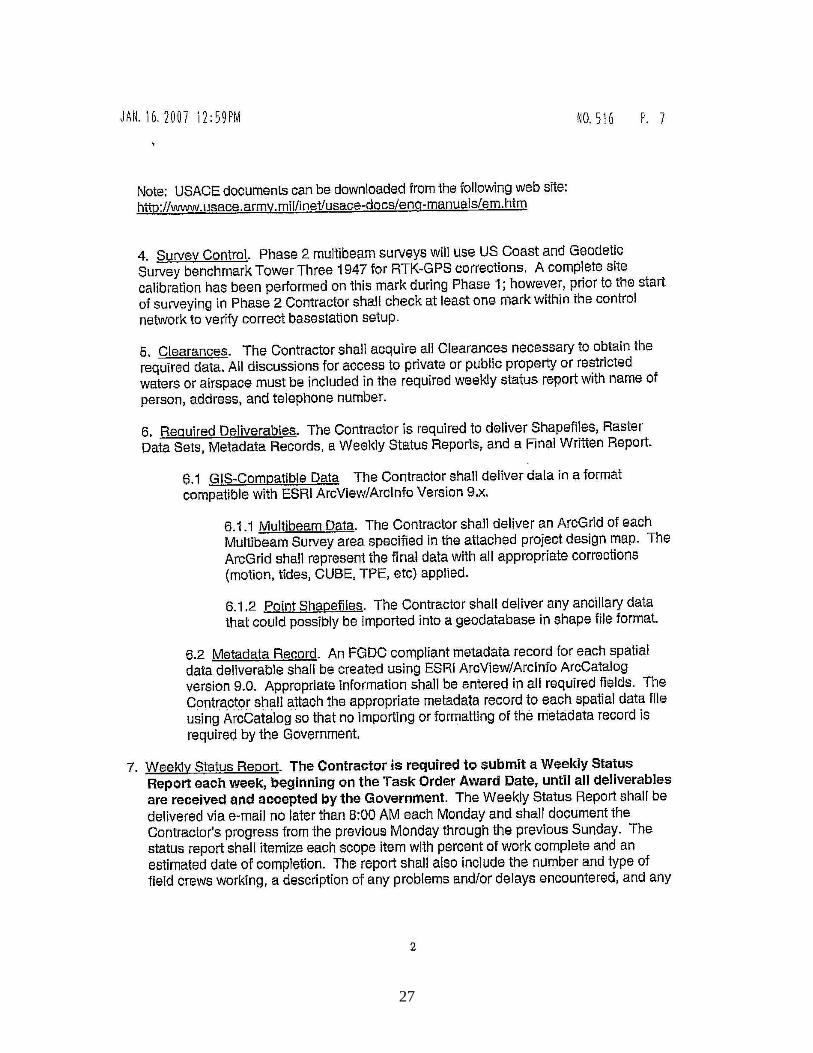
27
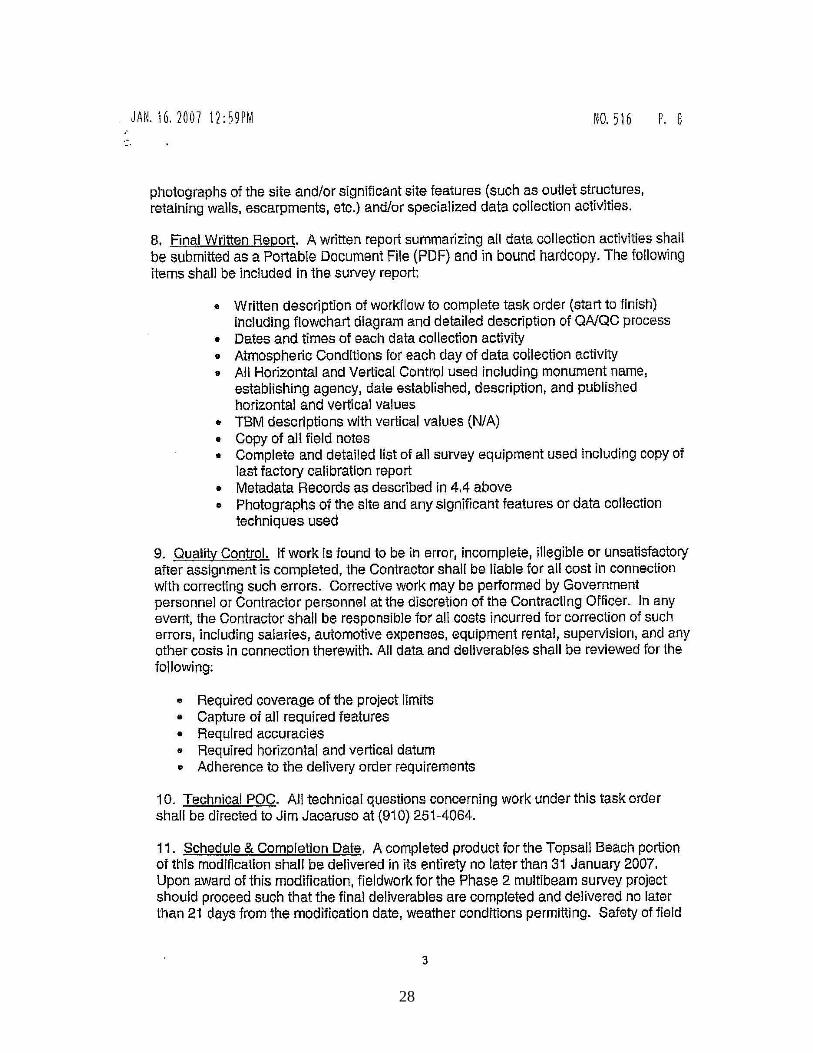
28
29

30
Appendix B – Field Notes
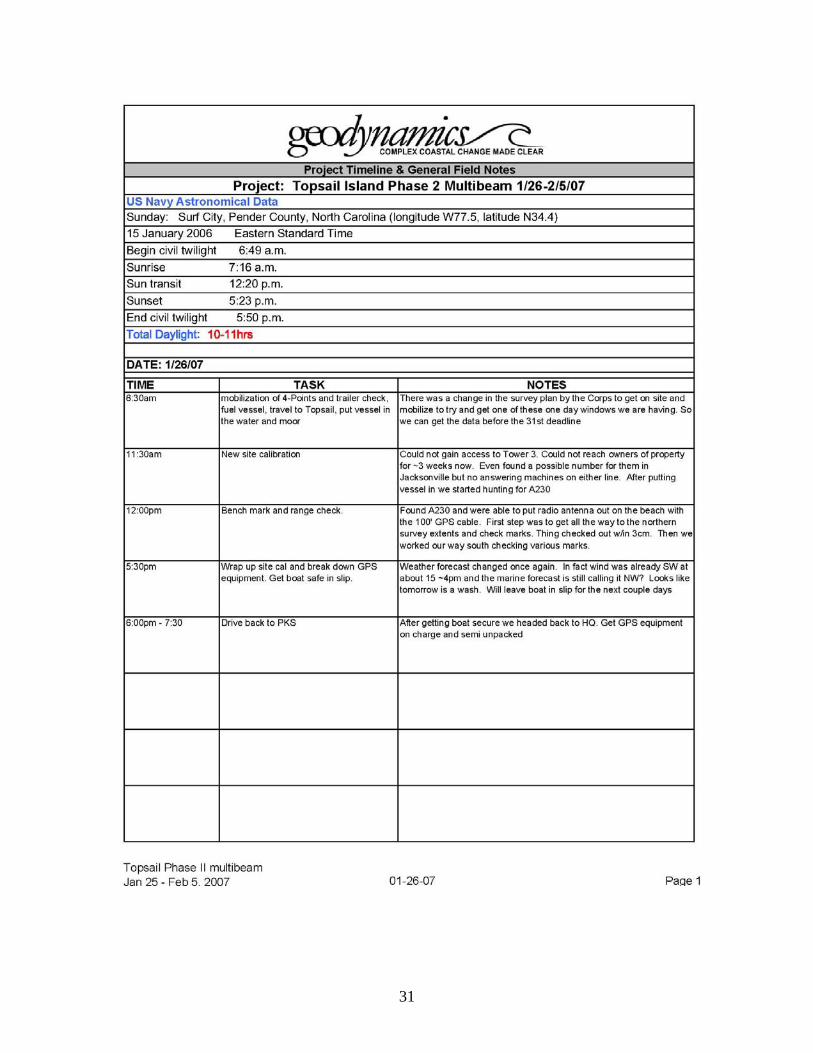
31
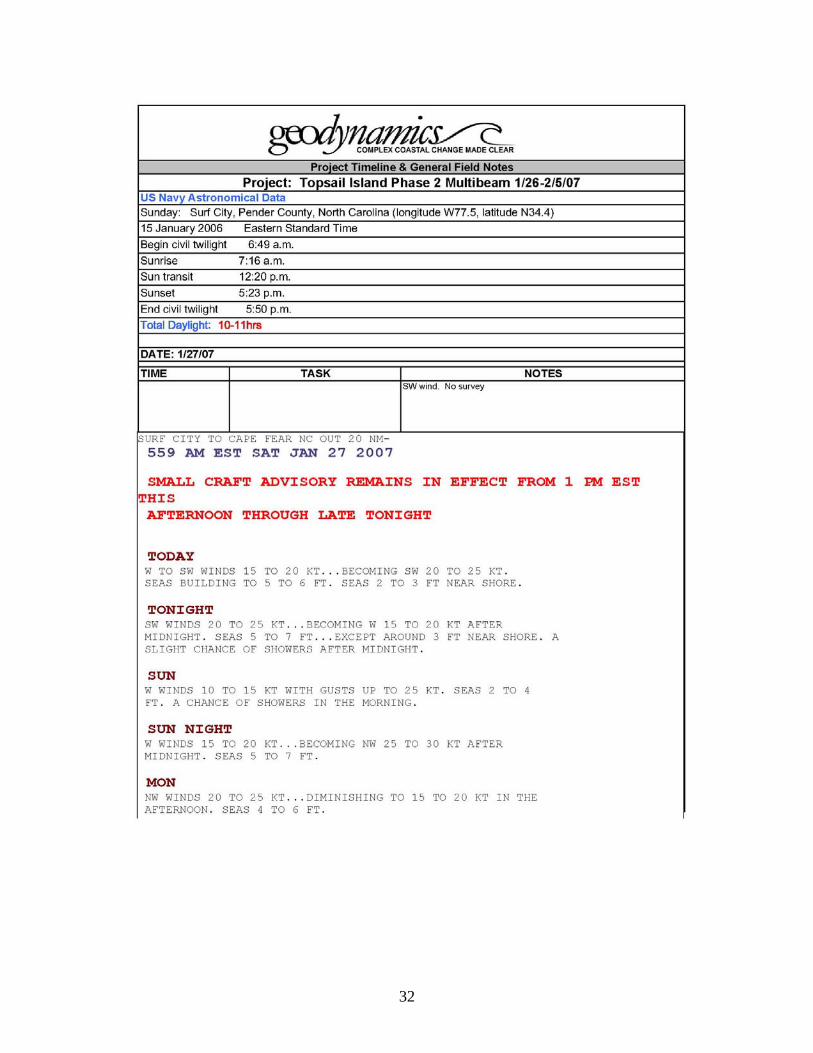
32
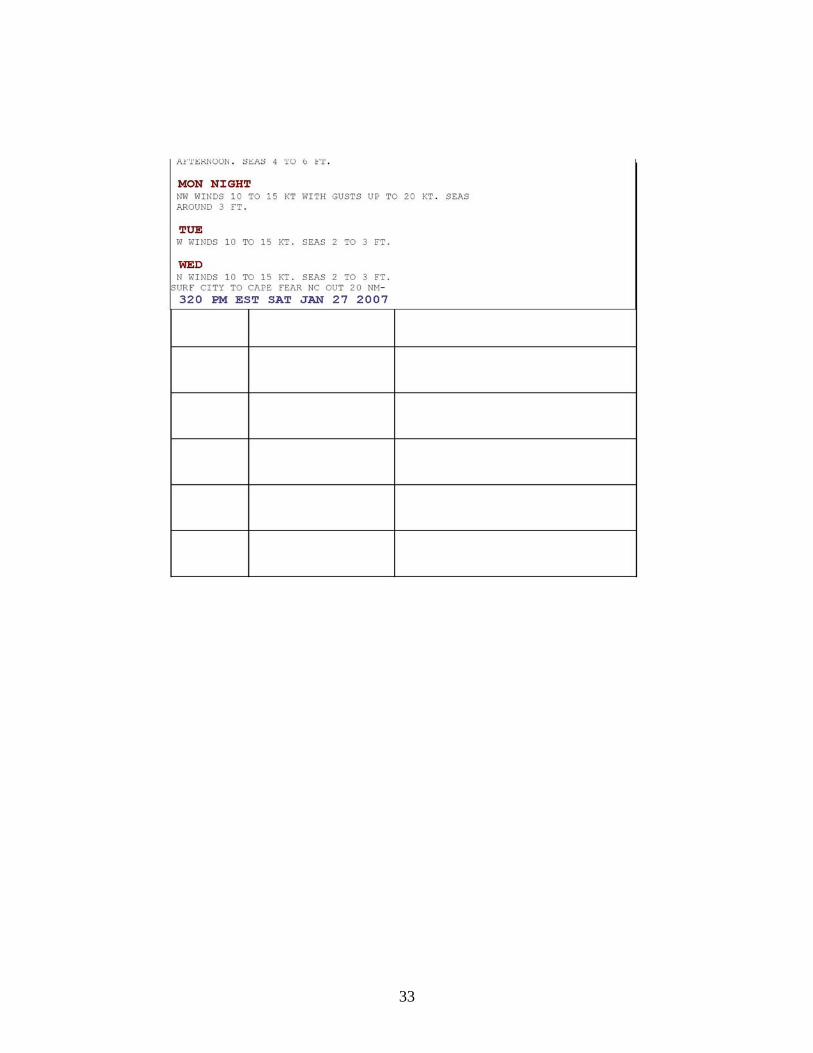
33
34

35
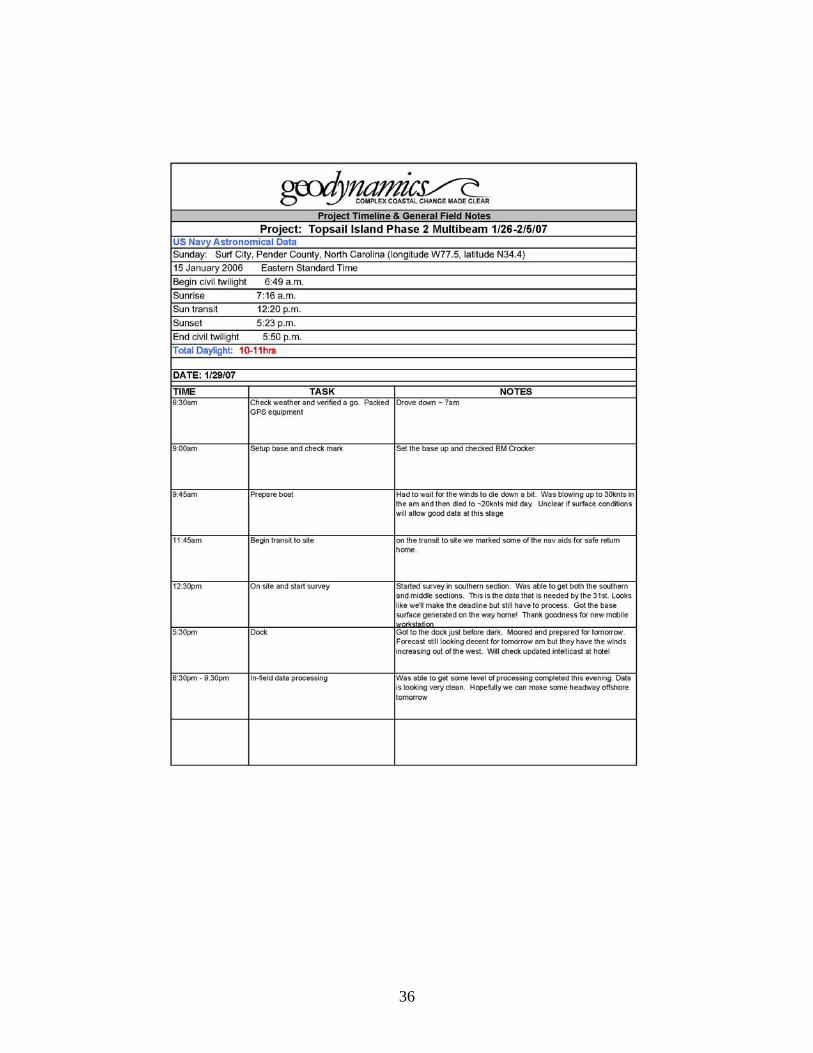
36
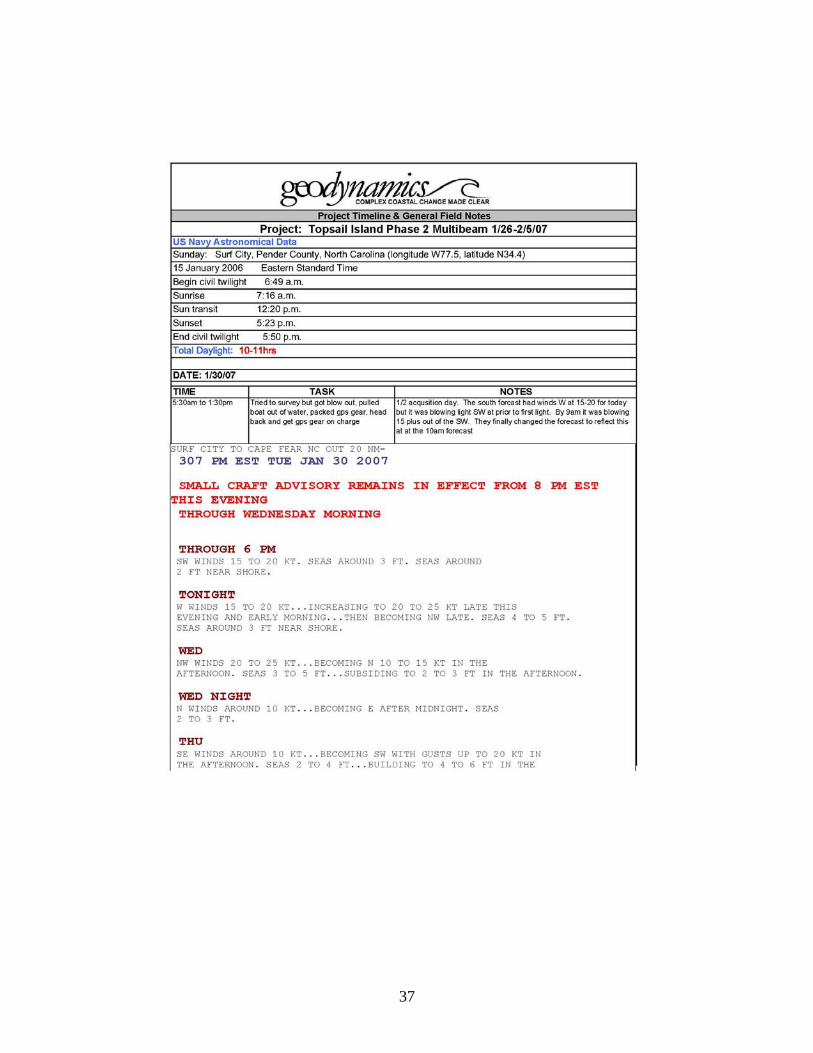
37
38
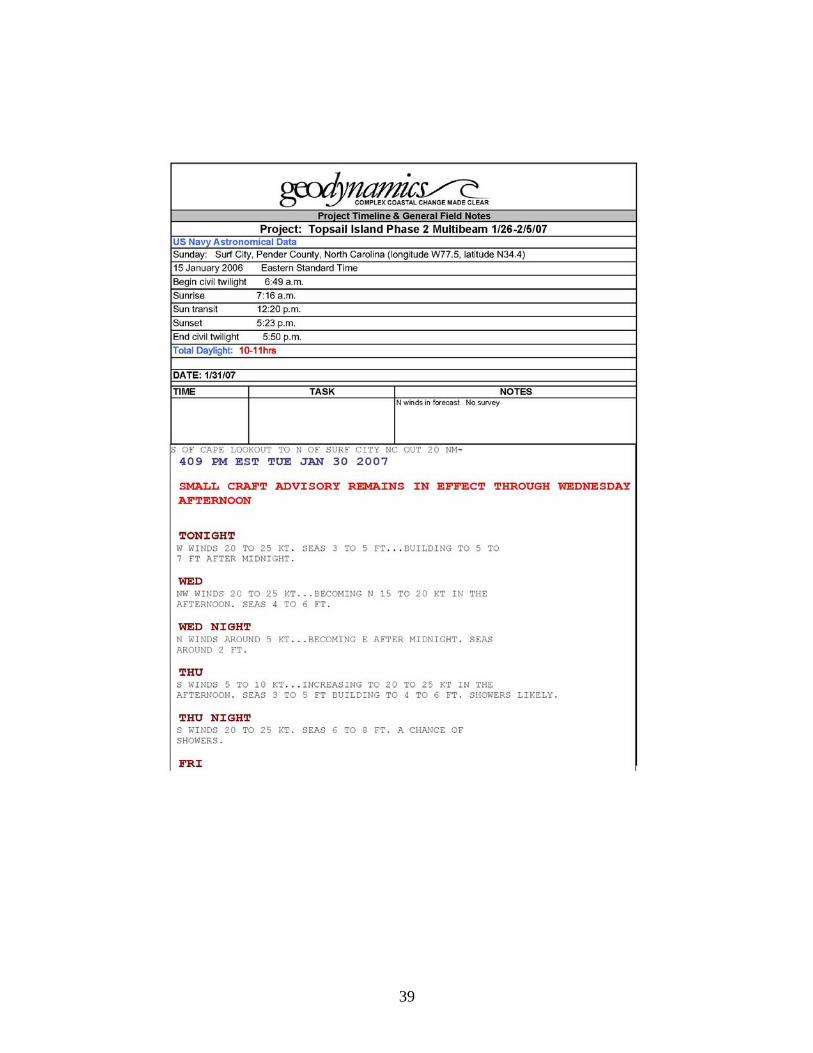
39

40
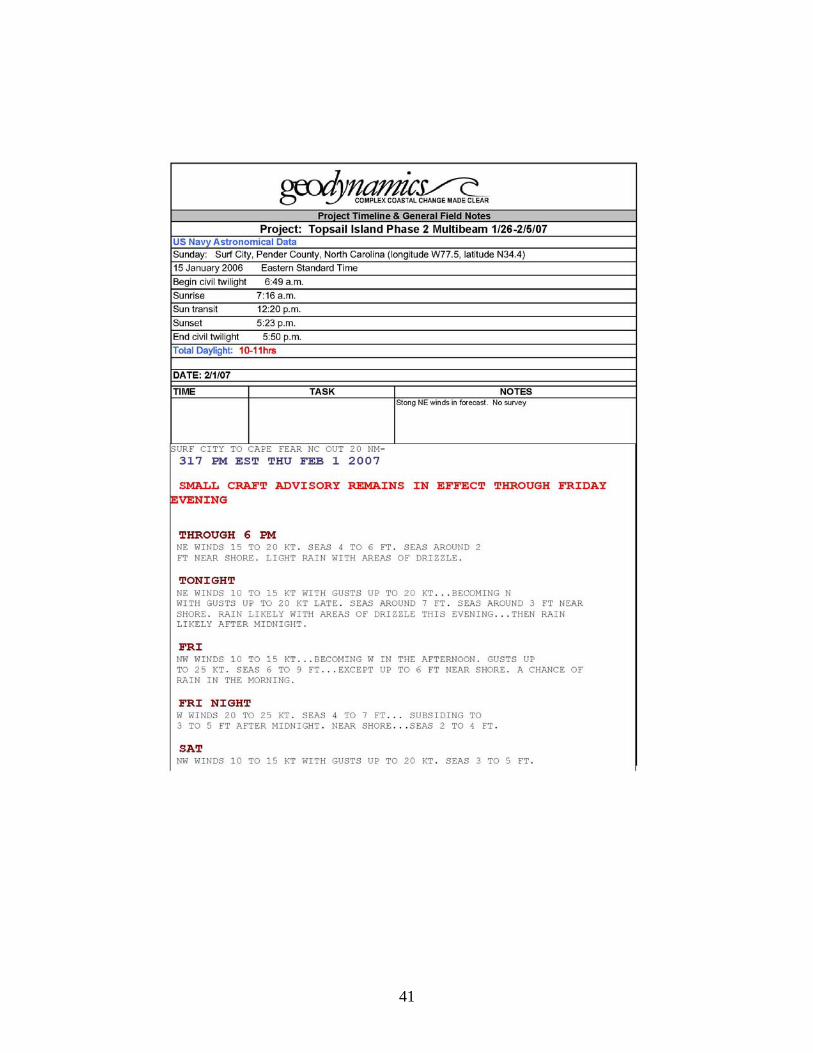
41
42
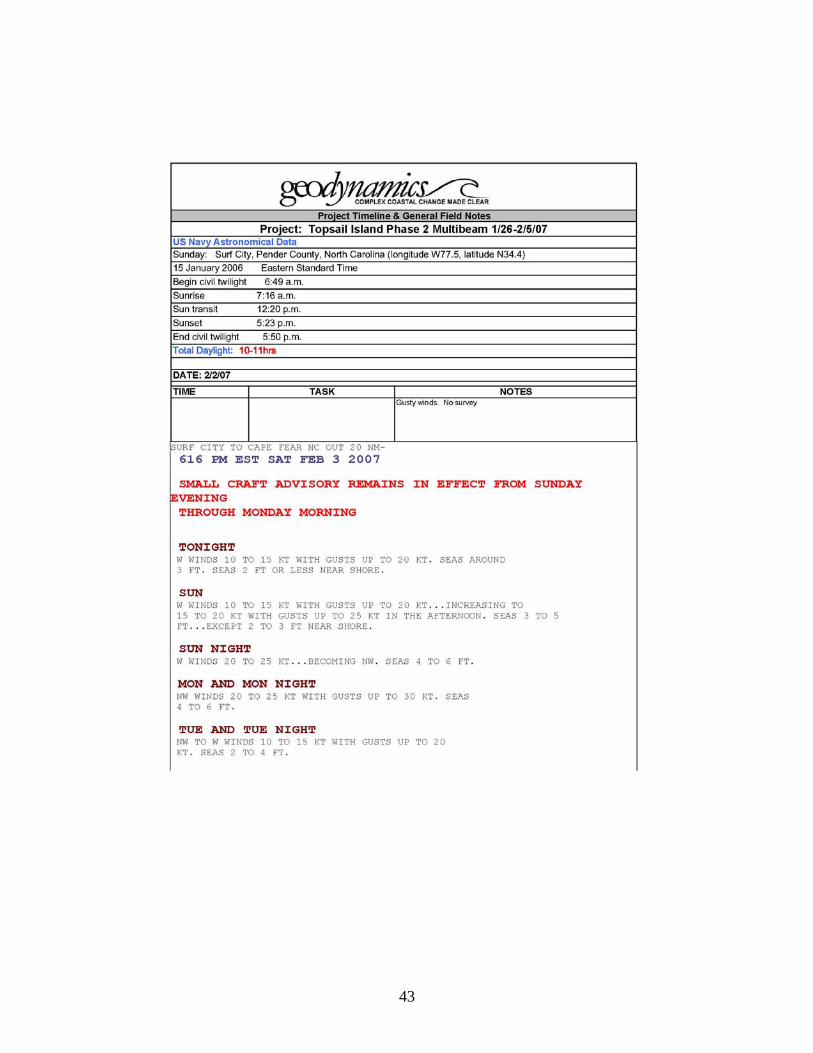
43

44
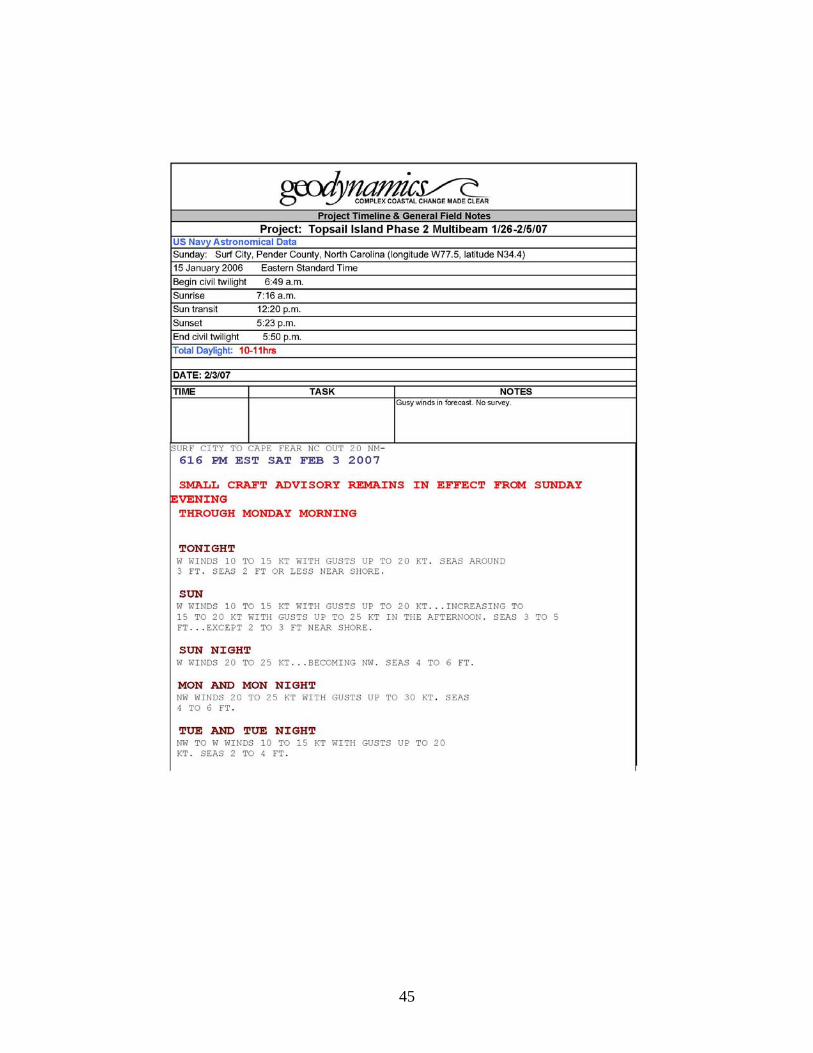
45

46
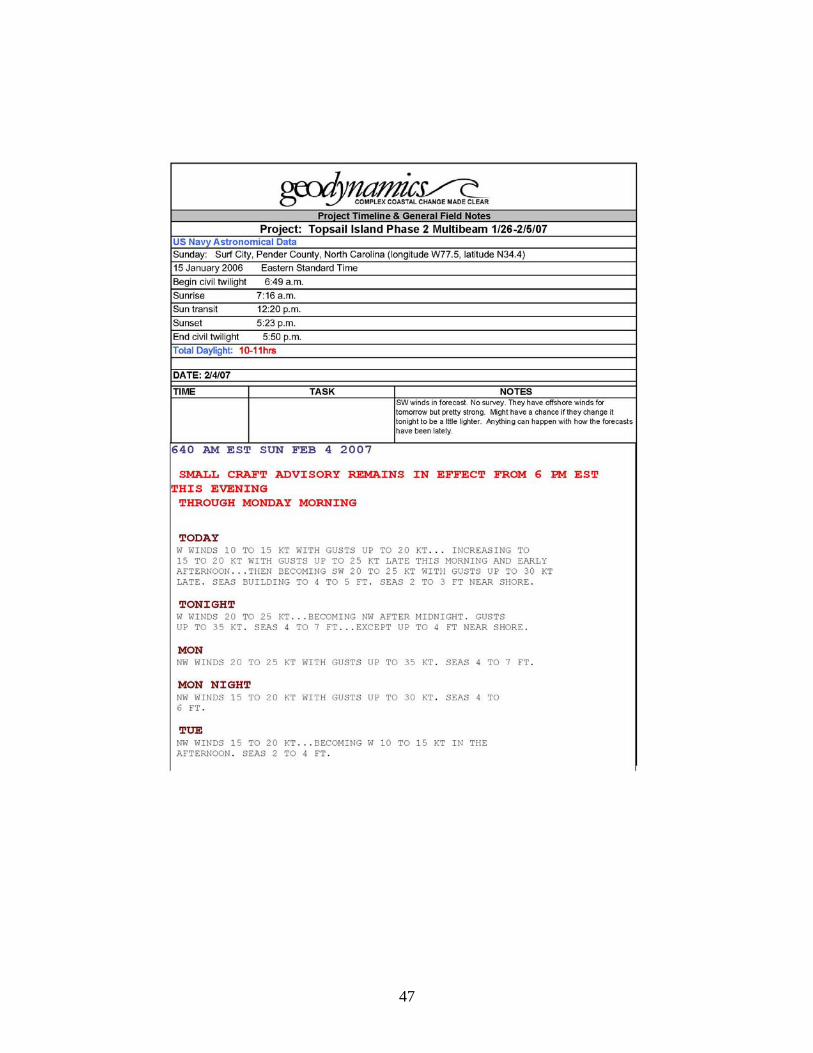
47

48
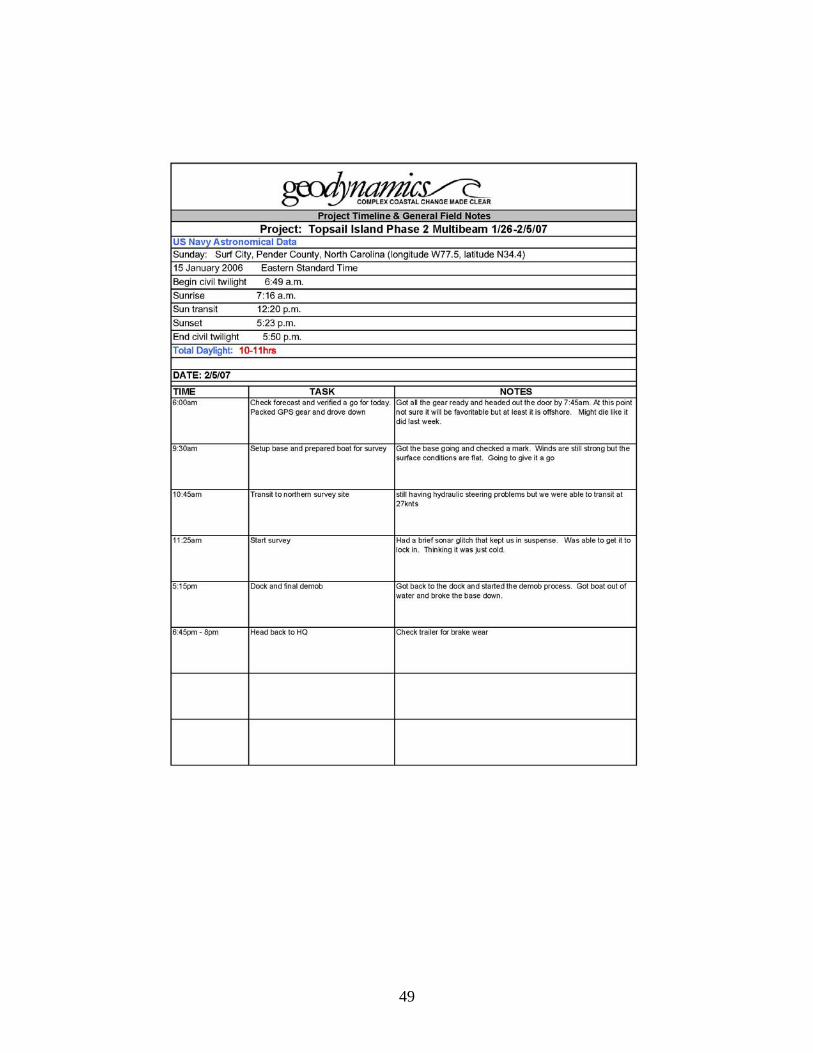
49

50
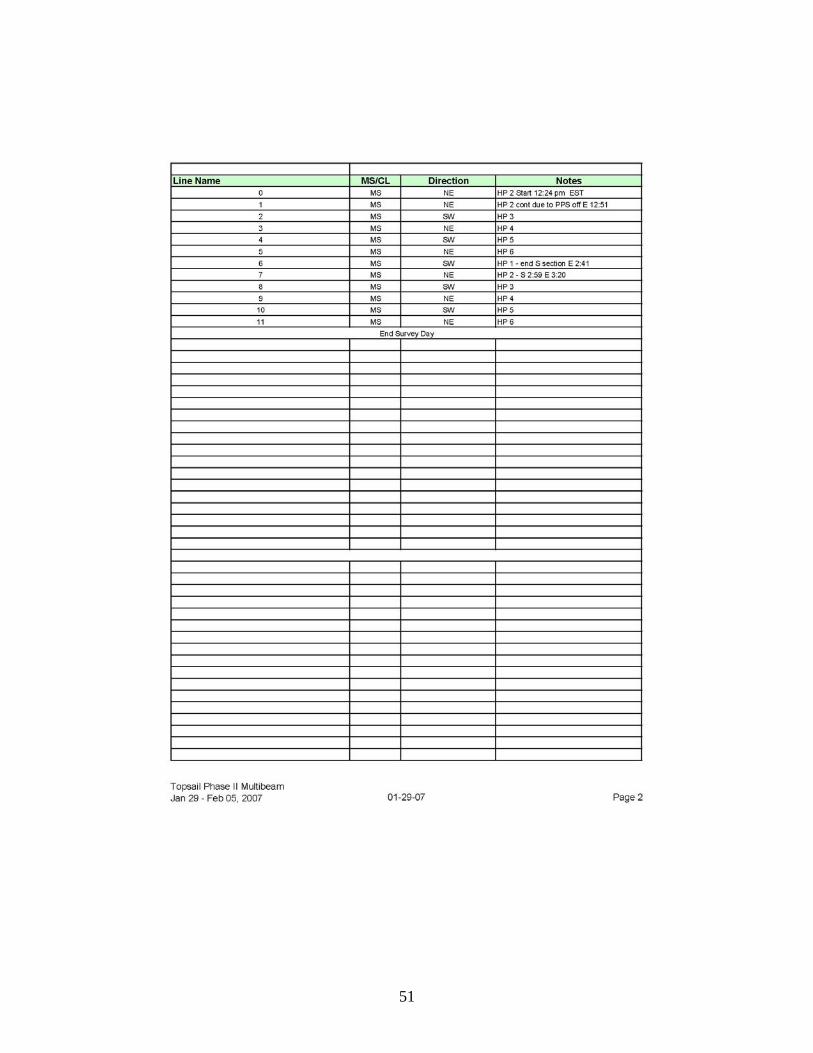
51
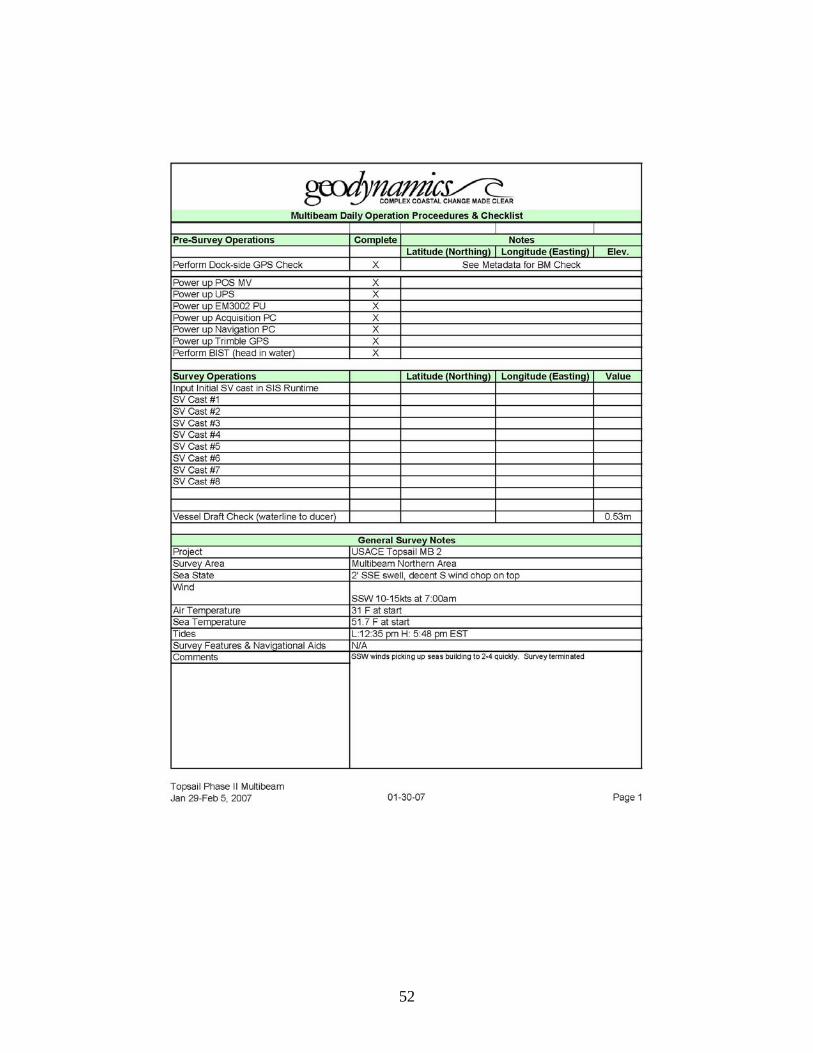
52

53
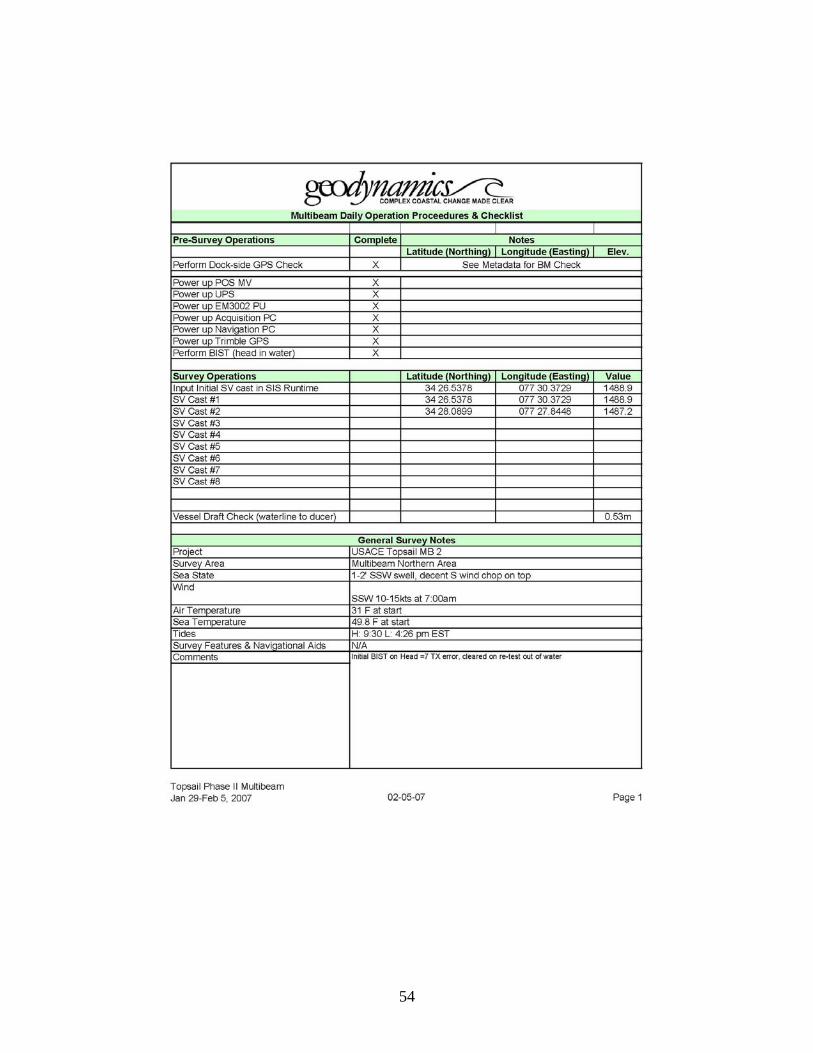
54
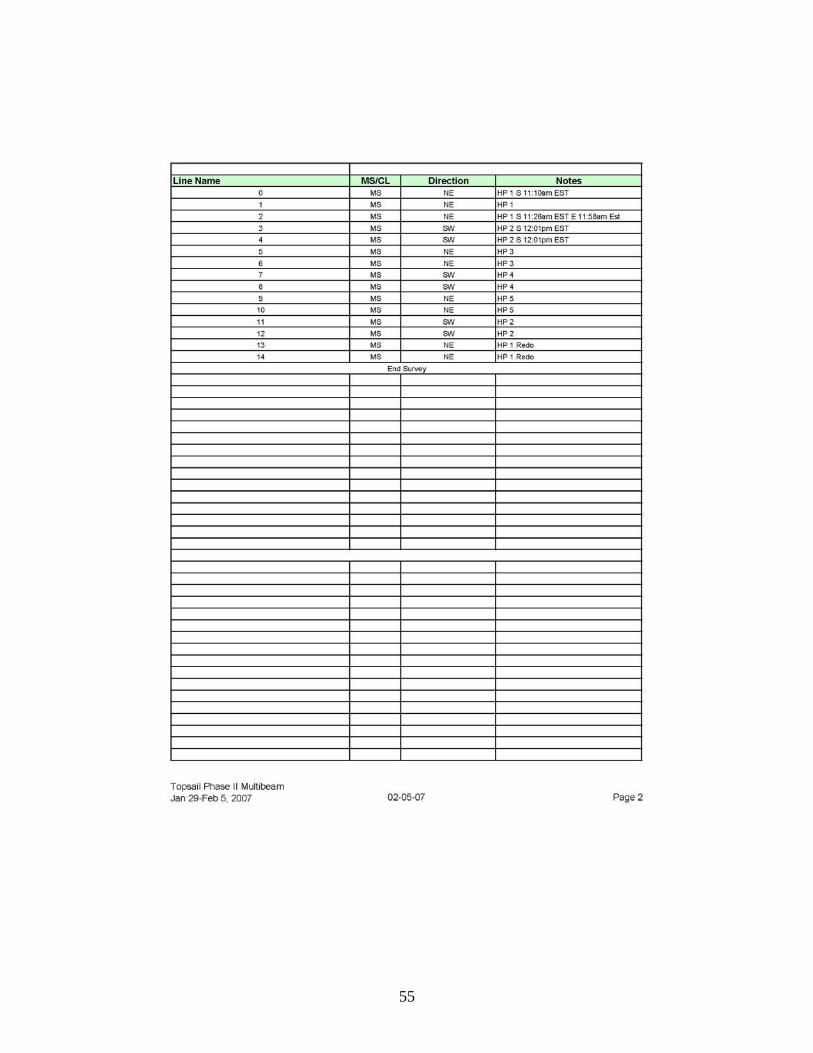
55

56
Appendix C – Equipment & Instrument Accuracies
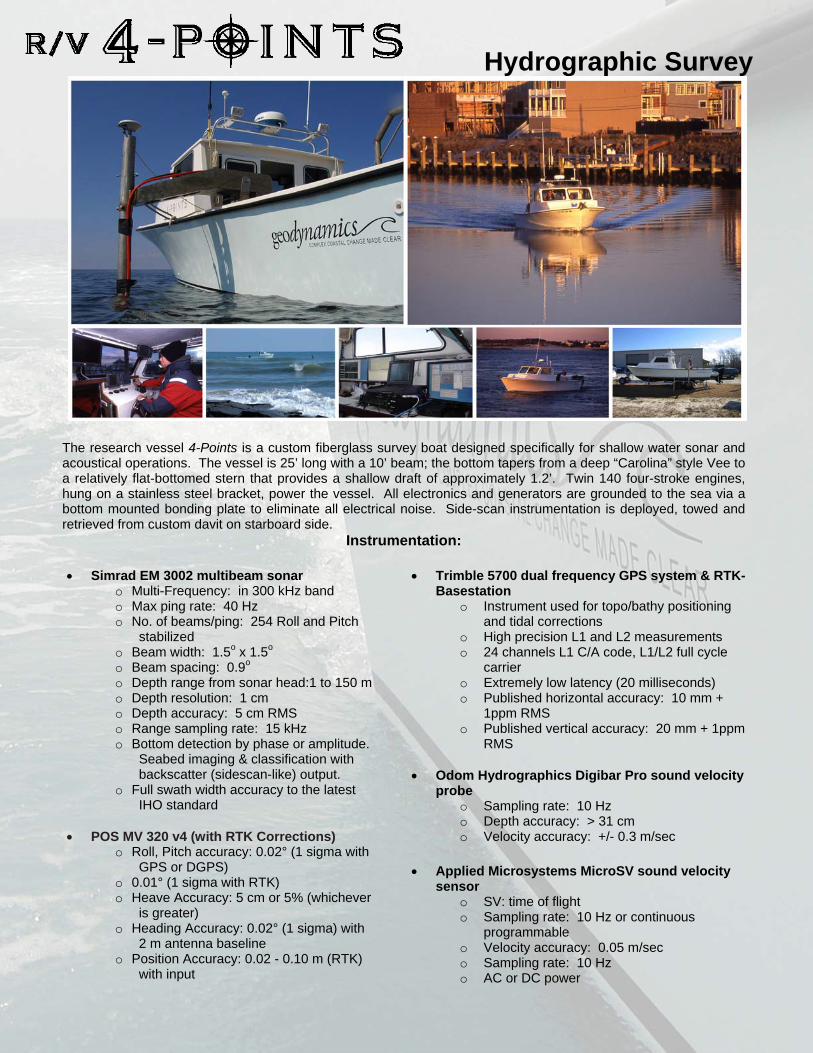
57
Hydrographic Survey
The research vessel 4-Points is a custom fiberglass survey boat designed specifically for shallow water sonar and acoustical operations. The vessel is 25’ long with a 10’ beam; the bottom tapers from a deep “Carolina” style Vee to a relatively flat-bottomed stern that provides a shallow draft of approximately 1.2’. Twin 140 four-stroke engines, hung on a stainless steel bracket, power the vessel. All electronics and generators are grounded to the sea via a bottom mounted bonding plate to eliminate all electrical noise. Side-scan instrumentation is deployed, towed and retrieved from custom davit on starboard side.
Instrumentation:
• Simrad EM 3002 multibeam sonar o Multi-Frequency: in 300 kHz band o Max ping rate: 40 Hz o No. of beams/ping: 254 Roll and Pitch
stabilized o Beam width: 1.5o x 1.5o o Beam spacing: 0.9o o Depth range from sonar head:1 to 150 m o Depth resolution: 1 cm o Depth accuracy: 5 cm RMS o Range sampling rate: 15 kHz o Bottom detection by phase or amplitude.
Seabed imaging & classification with backscatter (sidescan-like) output.
o Full swath width accuracy to the latest IHO standard
• POS MV 320 v4 (with RTK Corrections)
o Roll, Pitch accuracy: 0.02° (1 sigma with GPS or DGPS)
o 0.01° (1 sigma with RTK) o Heave Accuracy: 5 cm or 5% (whichever
is greater) o Heading Accuracy: 0.02° (1 sigma) with
2 m antenna baseline o Position Accuracy: 0.02 - 0.10 m (RTK)
with input
• Trimble 5700 dual frequency GPS system & RTK-Basestation
o Instrument used for topo/bathy positioning and tidal corrections
o High precision L1 and L2 measurements o 24 channels L1 C/A code, L1/L2 full cycle
carrier o Extremely low latency (20 milliseconds) o Published horizontal accuracy: 10 mm +
1ppm RMS o Published vertical accuracy: 20 mm + 1ppm
RMS
• Odom Hydrographics Digibar Pro sound velocity probe
o Sampling rate: 10 Hz o Depth accuracy: > 31 cm o Velocity accuracy: +/- 0.3 m/sec
• Applied Microsystems MicroSV sound velocity sensor
o SV: time of flight o Sampling rate: 10 Hz or continuous
programmable o Velocity accuracy: 0.05 m/sec o Sampling rate: 10 Hz o AC or DC power
58
Processing
Geodynamics maintains a cluster of high-end computer workstations and file/backup servers for the most demanding geospatial data acquisition, processing and analysis. At geodynamics we specialize in high-end spatial data processing and analysis through geographic information science and 3D visualization. .
Instrumentation:
Hardware • Field
o Custom rack mounted multibeam acquisition PC
o 3.6 GHz Intel Pentium 4 processors with 800 MHz system bus
o 2 GB of RAM o 512 Dual DVI graphics card o (2) 500 GB SATA hard drives o Simrad SIS & Applanix POS View
acquisition software o CARIS HIPS/SIPS o (3) Fujitsu pentop navigation PC o (3) Maxtor external backup hard drives
~ 850 GB of storage • Office
o (4) high-end Dell GIS processing workstations
o (2) Dell workstation laptops o (2) 1 TB RAID network attached
storage devices o (4) Maxtor / Seagate external backup
drives ~ 1.2 TB of storage
Software • Multibeam / Side Scan
o Caris HIPS / SIPS 6 sp2 o Triton Imaging ISIS o Triton Imaging BathyPro & DelphMap
• Singlebeam
o Hypack Max v. 6.2 sp1 o Caris HIPS / SIPS 6 sp2
• Topographic
o Trimble Geomatics Office o Caris HIPS / SIPS 6 sp2 (Lidar)
• GIS
o ArcView 3.3a (Spatial, 3D & Image Analyst)
o ArcGIS 9.1 (Spatial, ArcScene, 3D, Survey & Geostatistical Analyst)
o Surfer 8.0 o ArcIMS