Embed Size (px)
Citation preview
NEARSHORE SONAR SURVEYS AT HUNTINGTON BEACH, CALIFORNIA
FIELD OPERATIONS REPORT
13 May 2014 – 15 May 2014
Submitted to:
California State Lands Commission
100 Howe Avenue, Suite 100 South
Sacramento, CA 95825-8202
Submitted by:
ECOSYSTEMS MANAGEMENT ASSOCIATES, INC.
2166 Avenida de la Playa, Suite E
La Jolla, CA 92037
ECO-M Reference No. 14-05
12 June 2014
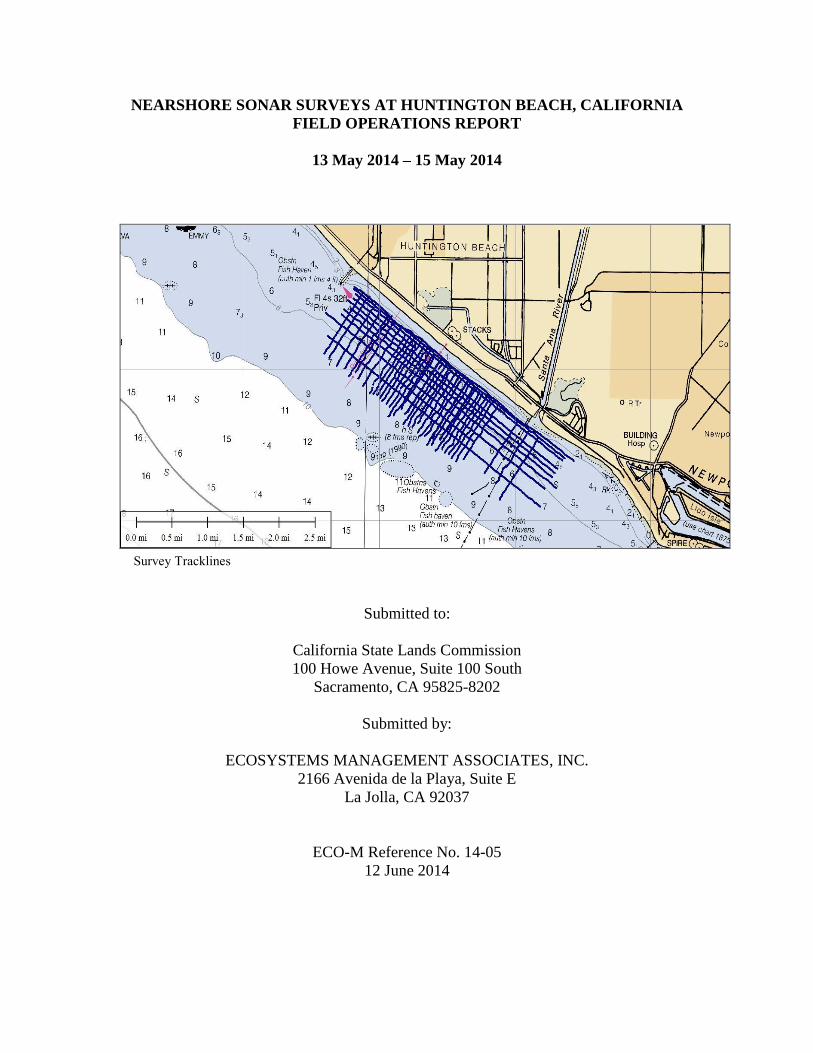
Survey Tracklines
Nearshore Sonar Surveys at Huntington Beach, California
Field Operations Report
EcoSystems Management Associates, Inc. i Technical Report
ECO-M Reference No. 14-05
TABLE OF CONTENTS
1.0 INTRODUCTION ............................................................................................................... 1
1.1 PERMITTING: CALIFORNIA STATE LANDS COMMISSION ................................ 1
1.2 PROJECT BACKGROUND AND NEED ...................................................................... 5
2.0 OFFSHORE GEOPHYSICAL SURVEY ........................................................................... 5
2.1 GEOPHYSICAL SURVEY DESIGN ............................................................................. 5
2.2 GEOPHYSICAL SURVEY EQUIPMENT ..................................................................... 6
2.2.1 Echosounder ................................................................................................................. 6
2.2.2 Sub-bottom Profiler ...................................................................................................... 6
2.2.3 Survey Vessel ............................................................................................................... 6
2.2.4 Navigation System ........................................................................................................ 6
2.3 GEOPHYSICAL SURVEY EQUIPMENT ................................................................... 12
2.3.1 Echosounder ............................................................................................................... 12
2.3.2 Sub-bottom Profiling .................................................................................................. 14
2.4 DATA PROCESSING AND INTERPRETATION ....................................................... 14
2.4.1 Data Processing .......................................................................................................... 14
2.4.2 Data Interpretation ...................................................................................................... 14
2.5 MARINE MAMMAL OBSERVATION ....................................................................... 14
3.0 RESULTS .......................................................................................................................... 15
LIST OF APPENDICES
Appendix A. Marine Mammal Observation Report ................................................................. A-1
LIST OF FIGURES
Figure 1-1. Survey area and desalination project site in Huntington Beach. .............................2
Figure 1-2. Bathymetry survey lines for the geophysical survey conducted at
Huntington Beach on 13–15 May 2014. ..................................................................3
Figure 1-3. Sub-bottom survey lines for the geophysical survey conducted at
Huntington Beach on 13–15 May 2014. ..................................................................4
Figure 3-1. Bathymetry map of surveyed area .........................................................................16
Figure 3-2. Sub-bottom profile for transect SB58 parallel to the shoreline. Location of
profile SB58 is shown in Figure 1-3 ......................................................................17
Figure 3-3. Sub-bottom profile for transect SB6 from 25 to 45 ft water depth. Location
of profile SB6 is shown in Figure 1-3 ....................................................................18
LIST OF TABLES
Table 2-1. Coordinates for the bathymetry tracklines ...............................................................7
Table 2-2. Coordinates for sub-bottom survey tracklines .........................................................9
Table 2-3. Equipment specifications for echosounder and sub-bottom profiler used on
13–15 May 2014 for Huntington Beach survey .....................................................10
Nearshore Sonar Surveys at Huntington Beach, California
Field Operations Report
EcoSystems Management Associates, Inc. ii Technical Report
ECO-M Reference No. 14-05
LIST OF PHOTOS
Photo 2-1. ECO-M’s survey vessel “Farallon,” which was used for data collection for
the 13–15 May 2014 survey off Huntington Beach ...............................................11
Photo 2-2. The helmsman steering display, seen in the photograph, shows pre-plotted
survey lines ............................................................................................................13
Nearshore Sonar Surveys at Huntington Beach, California
Field Operations Report
EcoSystems Management Associates, Inc. 1 Technical Report
ECO-M Reference No. 14-05
NEARSHORE SONAR SURVEYS AT HUNTINGTON BEACH, CALIFORNIA
FIELD OPERATIONS REPORT
13 May 2014 – 15 May 2014
1.0 INTRODUCTION
EcoSystems Management Associates, Inc. (ECO-M), a subsidiary of Coastal
Environments (CE), conducted a nearshore geophysical survey offshore of Huntington Beach
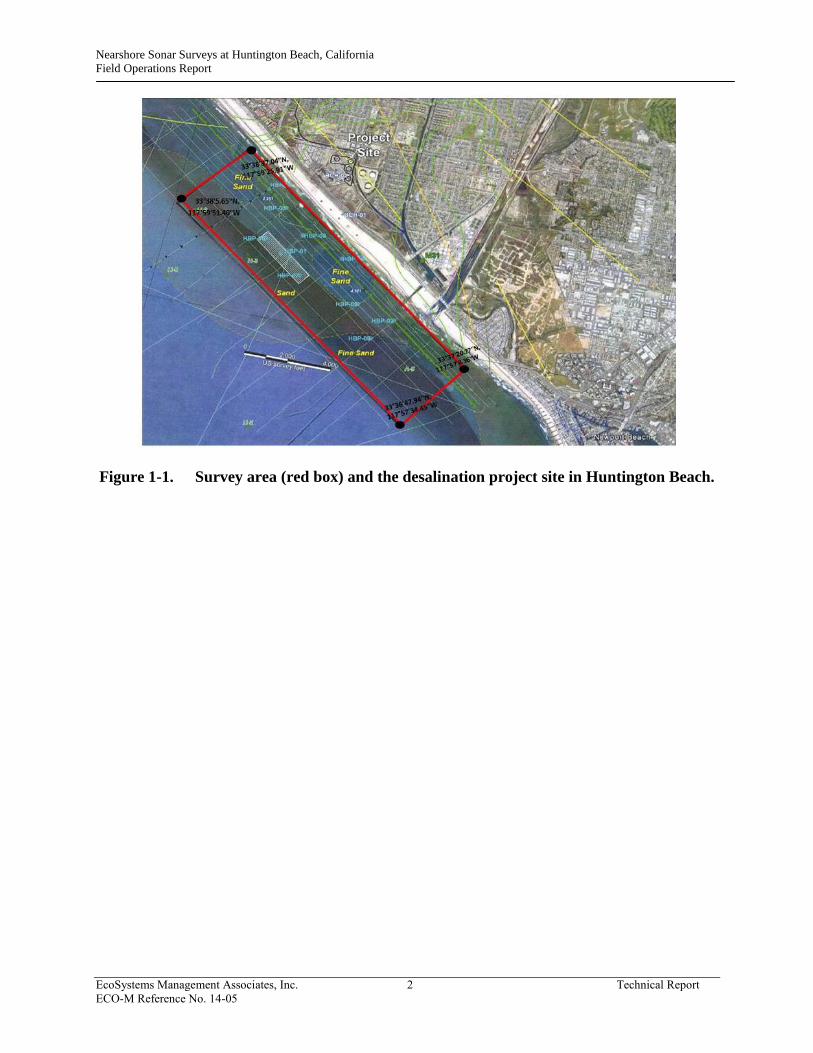
from 13 May through 15 May 2014 for the Huntington Beach Desalination Project. The
proposed desalination project site is located in Huntington Beach in Orange County, California
(Figure 1-1). The project’s purpose is to produce 50 million gallons per day (mgd) of desalinated
water for human consumption. This would require a sustained-feed water supply of
approximately 127 mgd.
For this project, bathymetric and sub-bottom profiling surveys were carried out. These
surveys covered the area from the surf zone to about 6,000 feet offshore and imaged the sub-
bottom geology to depths of at least 100–200 feet. The survey lines are shown in Figures 1-2 and
1-3. Figure 1-2 shows the bathymetry lines, while Figure 1-3 shows the sub-bottom lines. These
surveys offshore of Huntington Beach were needed to identify the nearshore sub-bottom geology
in order to characterize the offshore alluvial basin and its suitability for installing a subsurface
intake system (infiltration gallery) for the proposed Huntington Beach Desalination Project.
.
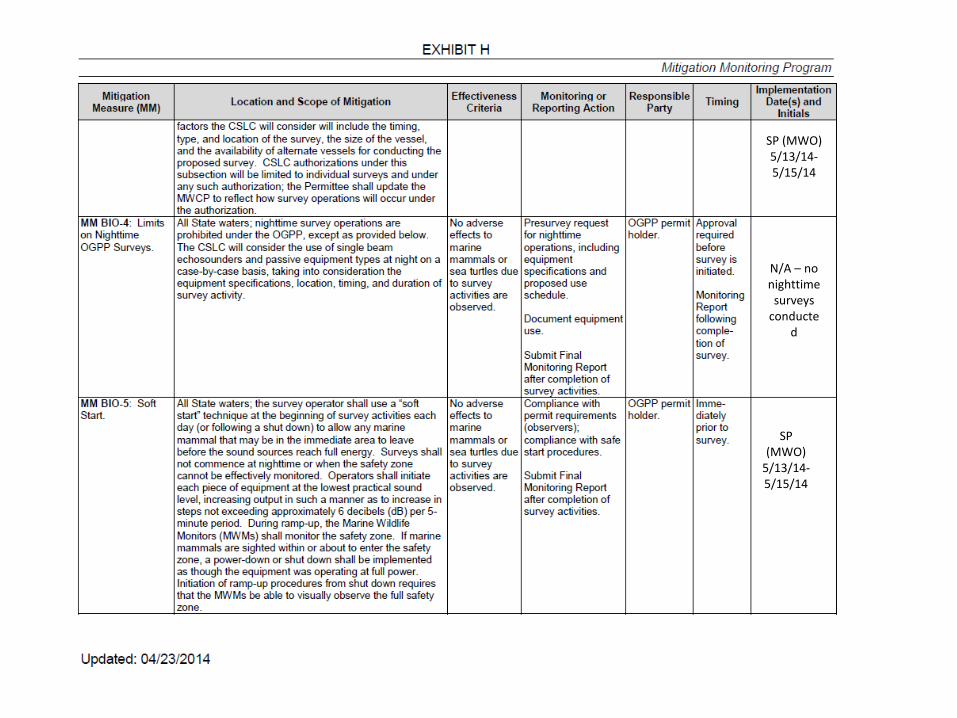
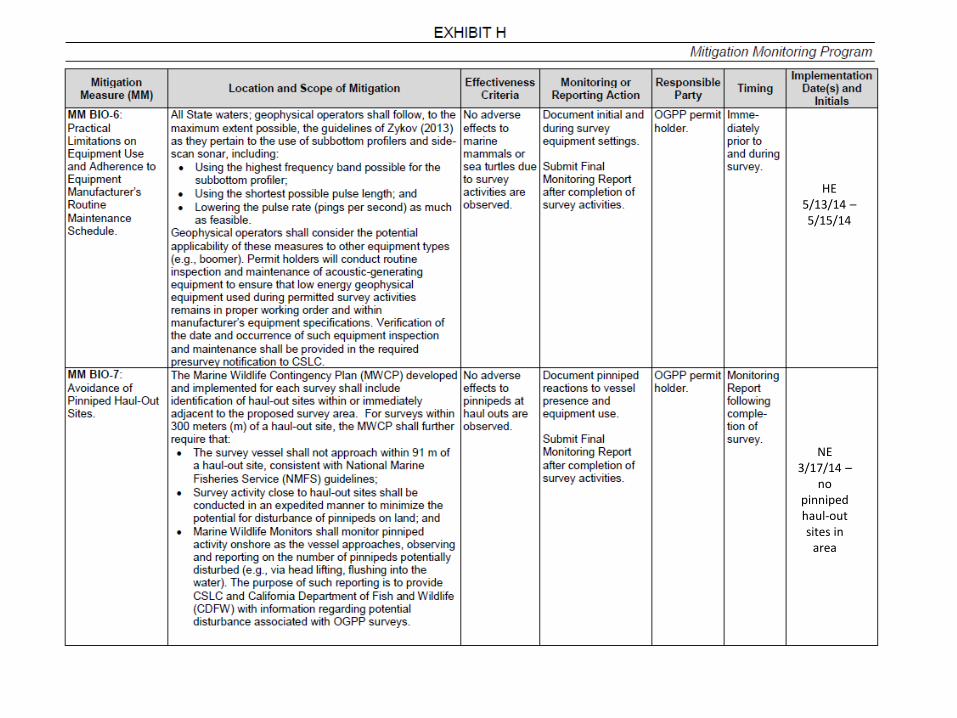
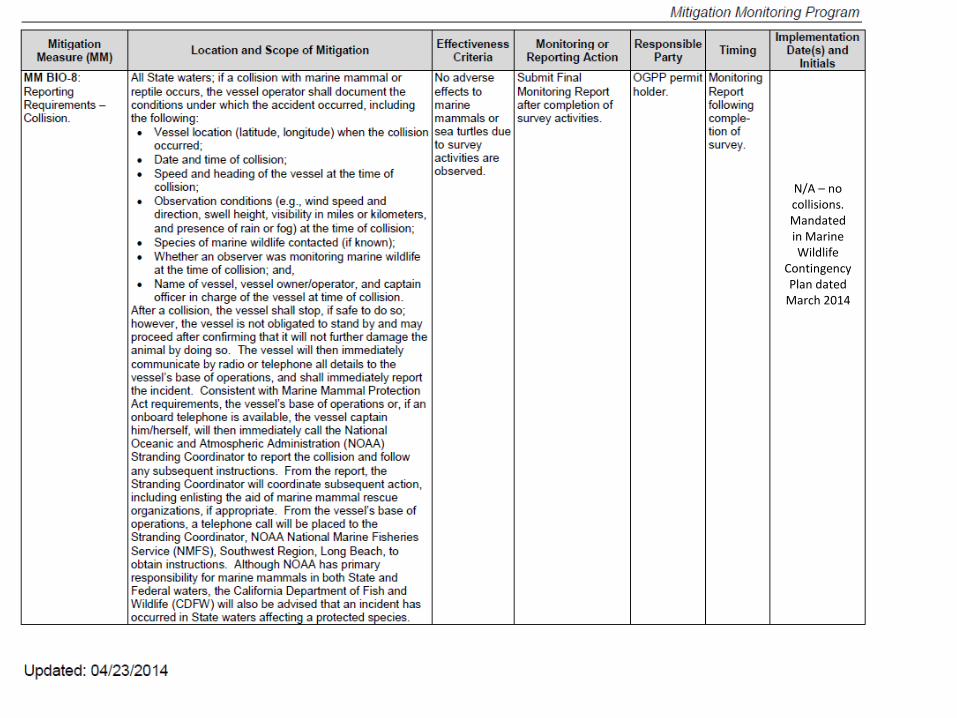
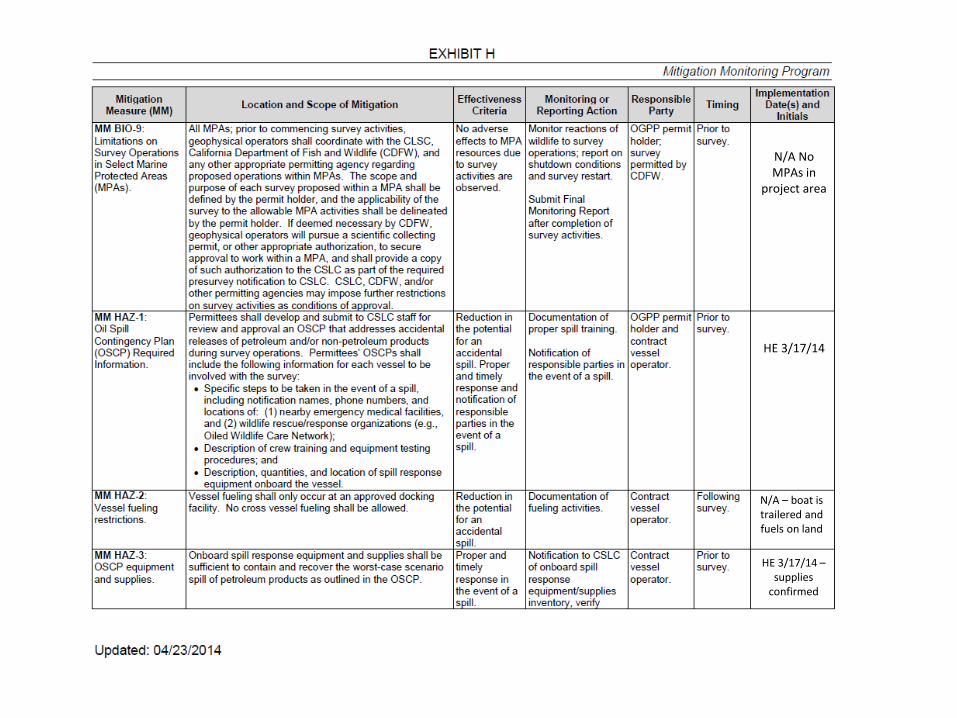
1.1 PERMITTING: CALIFORNIA STATE LANDS COMMISSION
Prior to the geophysical survey work, ECO-M acquired the necessary permit from the
California State Lands Commission (Permit #PRC 8536.9). As per the permit requirements, a
Marine Wildlife Contingency Plan and an Oil Spill Response Plan were prepared. A marine
wildlife observer was present during the surveys to ensure that the required safety zones were
implemented and operations were stopped if marine wildlife entered the zone, as well as to
monitor the safety of marine wildlife during activities that did not require safety zone monitoring
(activities with frequencies > 200 kHz). A copy of the Marine Mammal Observer Report can be
found in Appendix A. Additionally, all parties identified in Exhibit E of the permit were sent
notifications of the geophysical survey activity, and NOAA’s Long Beach office and whale-
watching operations were called to determine recent whale sightings in the area. This
information was then relayed to the captain and crew. Current whale sightings in the area were
located approximately 5–10 miles offshore, well out of the range of these activities.
Nearshore Sonar Surveys at Huntington Beach, California
Field Operations Report
EcoSystems Management Associates, Inc. 2 Technical Report
ECO-M Reference No. 14-05
Figure 1-1. Survey area (red box) and the desalination project site in Huntington Beach.
Nearshore Sonar Surveys at Huntington Beach, California
Field Operations Report
EcoSystems Management Associates, Inc. 3 Technical Report
ECO-M Reference No. 14-05
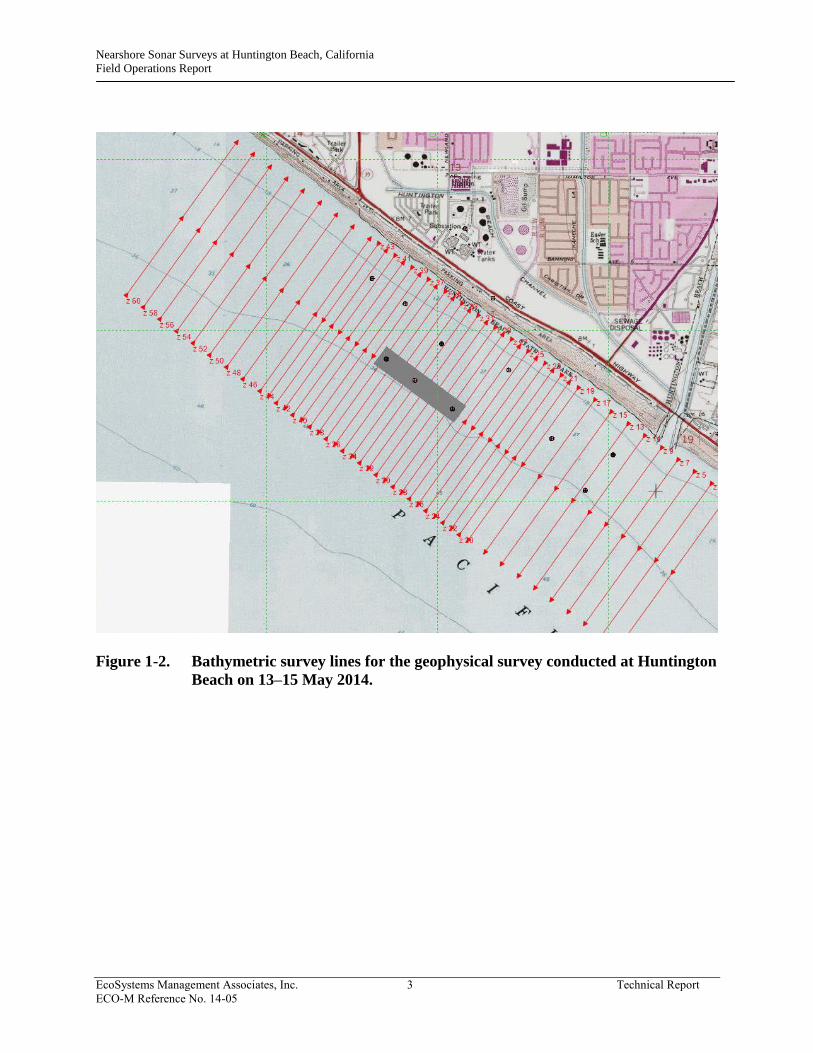
Figure 1-2. Bathymetric survey lines for the geophysical survey conducted at Huntington
Beach on 13–15 May 2014.
Nearshore Sonar Surveys at Huntington Beach, California
Field Operations Report
EcoSystems Management Associates, Inc. 4 Technical Report
ECO-M Reference No. 14-05
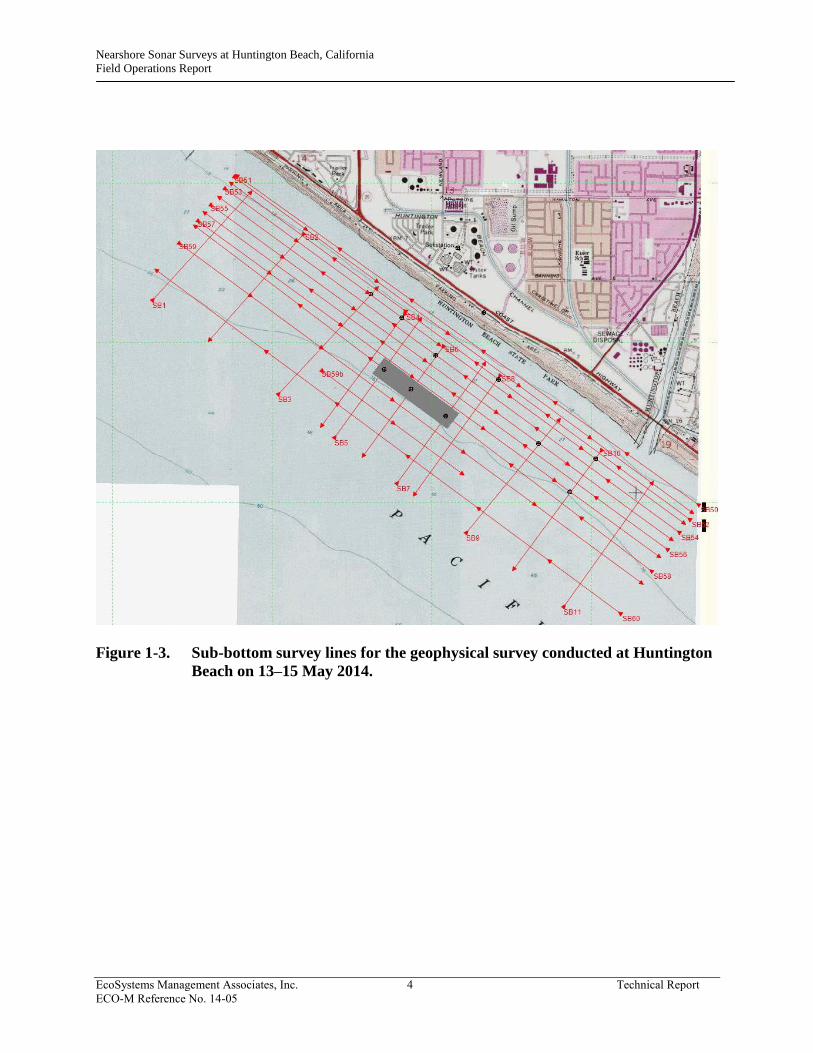
Figure 1-3. Sub-bottom survey lines for the geophysical survey conducted at Huntington
Beach on 13–15 May 2014.
Nearshore Sonar Surveys at Huntington Beach, California
Field Operations Report
EcoSystems Management Associates, Inc. 5 Technical Report
ECO-M Reference No. 14-05
1.2 PROJECT BACKGROUND AND NEED
These surveys were necessary to determine whether any geological hazards, faults,
shallow gas, or soft sediments existed in the project area. The surveys examined the nearshore
sub-bottom geology in order to characterize the offshore alluvial basin and its suitability for the
installation of a subsurface intake system (infiltration gallery) for the proposed Huntington
Beach Desalination Project. This intake system would draw saline water from the shallow
sediments along the offshore area of the coastline. This approach would ameliorate the problem
of saltwater wedge migration into local freshwater wells and eliminate future problems with
marine life entrainment during the saline water pumping needed to supply the plant. There are
questions regarding the types of alluvial deposits that exist in the offshore basin, their
configurations and the associated geological structures, and whether these deposits would permit
enough migration of water to the well head to properly supply water to the proposed desalination
facility.
The Santa Ana River enters the Pacific Ocean about 1.5 miles south of the project site.
The coastal fan/delta system of the Santa Ana River supplies most of the sediment that covers the
coastal and nearshore area, whereas ancient channels of the Santa Ana River cut during sea level
lowstands constrain the locations of the late Quaternary, coarse-grained fluvial deposits most
suitable for groundwater flow. These paleochannels may exist across the area, since the river
meandered across much of Orange County as the fan/delta system was building up along the
Pleistocene coast.
Geological structures related to deformation along the Newport-Inglewood fault zone
may exist in the survey area and create potential obstacles to horizontal fluid transport within the
alluvial basin. Identification and mapping of these structures is necessary for input to the
groundwater flow models used to evaluate subsurface intake designs. The Newport-Inglewood
fault zone is located mostly to the northeast of the project site, although a buried “South Branch
Fault” is projected to cross near the southern edge of the site. Judging by the complexity of
faulting in this section of the Newport-Inglewood fault zone, where the offshore fault to the
south steps northeast onshore in a releasing stepover (for a right-slip fault zone), it is possible
that other buried faults cross the survey area. A releasing stepover is an extensional system that
may enhance permeability and fluid flow. Many of the “gaps” along the fault zone to the north
are sites where seawater intrusion affects the shallow groundwater aquifers. Other hazards that
may exist in the offshore area include shallow gas pockets associated with natural seeps along
the hydrocarbon-enriched fault zone, as manifested in the adjacent oil fields. These hazards must
be avoided or mitigated during the construction of a subsurface intake system.
2.0 OFFSHORE GEOPHYSICAL SURVEY
2.1 GEOPHYSICAL SURVEY DESIGN
The survey included 22 sub-bottom survey lines and 44 bathymetric lines. Survey lines
ran both inshore/offshore and shore-parallel (upcoast/downcoast). Shore-parallel survey lines
were 18,000 feet long, and inshore/offshore survey lines were approximately 4,000 feet long.
Nearshore Sonar Surveys at Huntington Beach, California
Field Operations Report
EcoSystems Management Associates, Inc. 6 Technical Report
ECO-M Reference No. 14-05
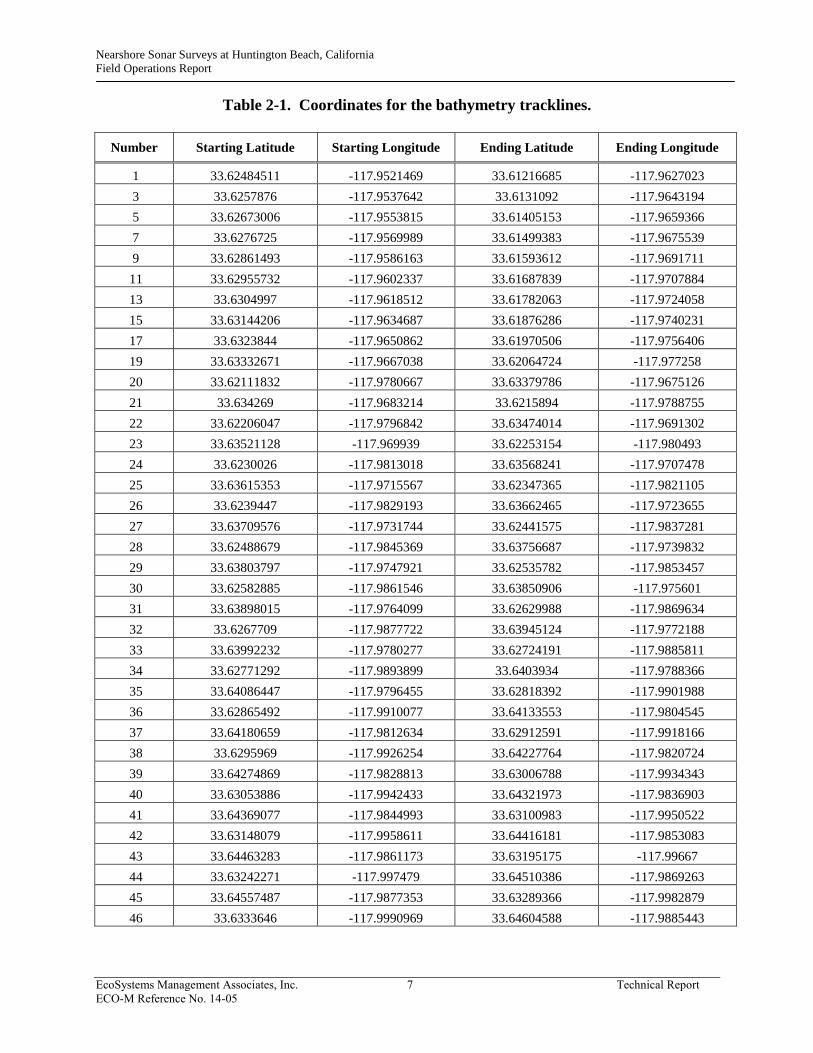
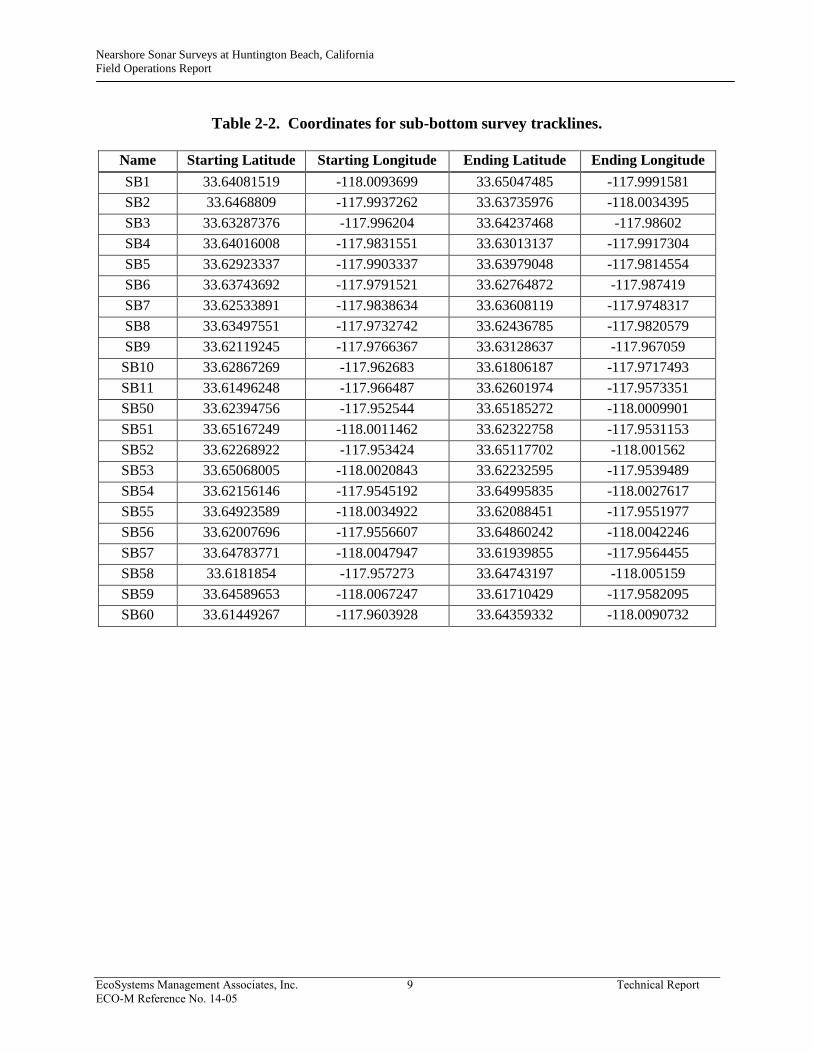
Distances between survey lines varied, as shown in Figures 1-2 and 1-3. The coordinates of the
start and end points for each trackline are presented in Table 2-1 for the bathymetric survey and
Table 2-2 for the sub-bottom profile survey.
2.2 GEOPHYSICAL SURVEY EQUIPMENT
The following equipment was used for this survey:
Echosounder (Syquest Bathy 500 MF),
Sub-bottom profiler (Ross Laboratories transceiver with four 4T61 [3.5 kHz] Massa
transducers), and
DGPS navigation system.
Equipment specifications are in Table 2-3.
2.2.1 Echosounder
An echosounder measures the depth of the seafloor (bathymetry). When continuous
measurements of seafloor depth are made along vessel tracks with accurate navigation positions,
these depth measurements can be turned into bathymetric maps by connecting points of equal
depth.
2.2.2 Sub-bottom Profiler
Sub-bottom profiling equipment allows for the detection and characterization of objects
buried below the seafloor. The 3.5 kHz sub-bottom profiler was used for this project and
provided excellent records.
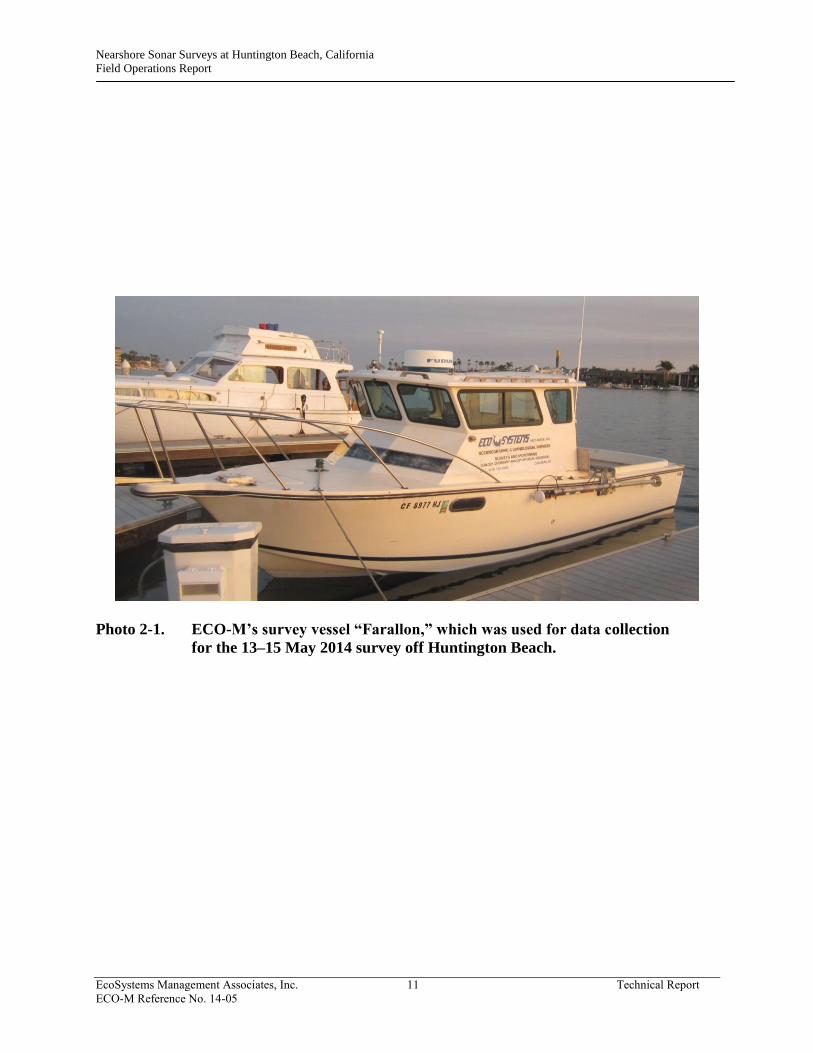
2.2.3 Survey Vessel
The survey was conducted using a 27-ft Farrallon trailerable survey boat (Photo 2-1).
This boat is powered by a Panther Marine 350 HP engine with dual counter-rotating props. The
boat is equipped with DGPS, RADAR, echosounder, and related electronics with a lifting hoist
for the deployment of sonar fish and other marine instrumentation.
2.2.4 Navigation System
Navigation and positioning were accomplished with a Differential Global Positioning
System (DGPS). The DGPS is an all-weather, radio-based, satellite navigation system that
enables users to accurately determine position, velocity, and precise time. The DGPS system
consists of a Leica Professional GPS Model MX600, Hydro-Pro Navigation Software, and a
differential correction signal receiver. The differential signals come from Coast Guard beacons
established for GPS correction. The system provides an accuracy of +/-1 meter (3 feet).
Nearshore Sonar Surveys at Huntington Beach, California
Field Operations Report
EcoSystems Management Associates, Inc. 7 Technical Report
ECO-M Reference No. 14-05
Table 2-1. Coordinates for the bathymetry tracklines.
Number Starting Latitude Starting Longitude Ending Latitude Ending Longitude
1 33.62484511 -117.9521469 33.61216685 -117.9627023
3 33.6257876 -117.9537642 33.6131092 -117.9643194
5 33.62673006 -117.9553815 33.61405153 -117.9659366
7 33.6276725 -117.9569989 33.61499383 -117.9675539
9 33.62861493 -117.9586163 33.61593612 -117.9691711
11 33.62955732 -117.9602337 33.61687839 -117.9707884
13 33.6304997 -117.9618512 33.61782063 -117.9724058
15 33.63144206 -117.9634687 33.61876286 -117.9740231
17 33.6323844 -117.9650862 33.61970506 -117.9756406
19 33.63332671 -117.9667038 33.62064724 -117.977258
20 33.62111832 -117.9780667 33.63379786 -117.9675126
21 33.634269 -117.9683214 33.6215894 -117.9788755
22 33.62206047 -117.9796842 33.63474014 -117.9691302
23 33.63521128 -117.969939 33.62253154 -117.980493
24 33.6230026 -117.9813018 33.63568241 -117.9707478
25 33.63615353 -117.9715567 33.62347365 -117.9821105
26 33.6239447 -117.9829193 33.63662465 -117.9723655
27 33.63709576 -117.9731744 33.62441575 -117.9837281
28 33.62488679 -117.9845369 33.63756687 -117.9739832
29 33.63803797 -117.9747921 33.62535782 -117.9853457
30 33.62582885 -117.9861546 33.63850906 -117.975601
31 33.63898015 -117.9764099 33.62629988 -117.9869634
32 33.6267709 -117.9877722 33.63945124 -117.9772188
33 33.63992232 -117.9780277 33.62724191 -117.9885811
34 33.62771292 -117.9893899 33.6403934 -117.9788366
35 33.64086447 -117.9796455 33.62818392 -117.9901988
36 33.62865492 -117.9910077 33.64133553 -117.9804545
37 33.64180659 -117.9812634 33.62912591 -117.9918166
38 33.6295969 -117.9926254 33.64227764 -117.9820724
39 33.64274869 -117.9828813 33.63006788 -117.9934343
40 33.63053886 -117.9942433 33.64321973 -117.9836903
41 33.64369077 -117.9844993 33.63100983 -117.9950522
42 33.63148079 -117.9958611 33.64416181 -117.9853083
43 33.64463283 -117.9861173 33.63195175 -117.99667
44 33.63242271 -117.997479 33.64510386 -117.9869263
45 33.64557487 -117.9877353 33.63289366 -117.9982879
46 33.6333646 -117.9990969 33.64604588 -117.9885443
Nearshore Sonar Surveys at Huntington Beach, California
Field Operations Report
EcoSystems Management Associates, Inc. 8 Technical Report
ECO-M Reference No. 14-05
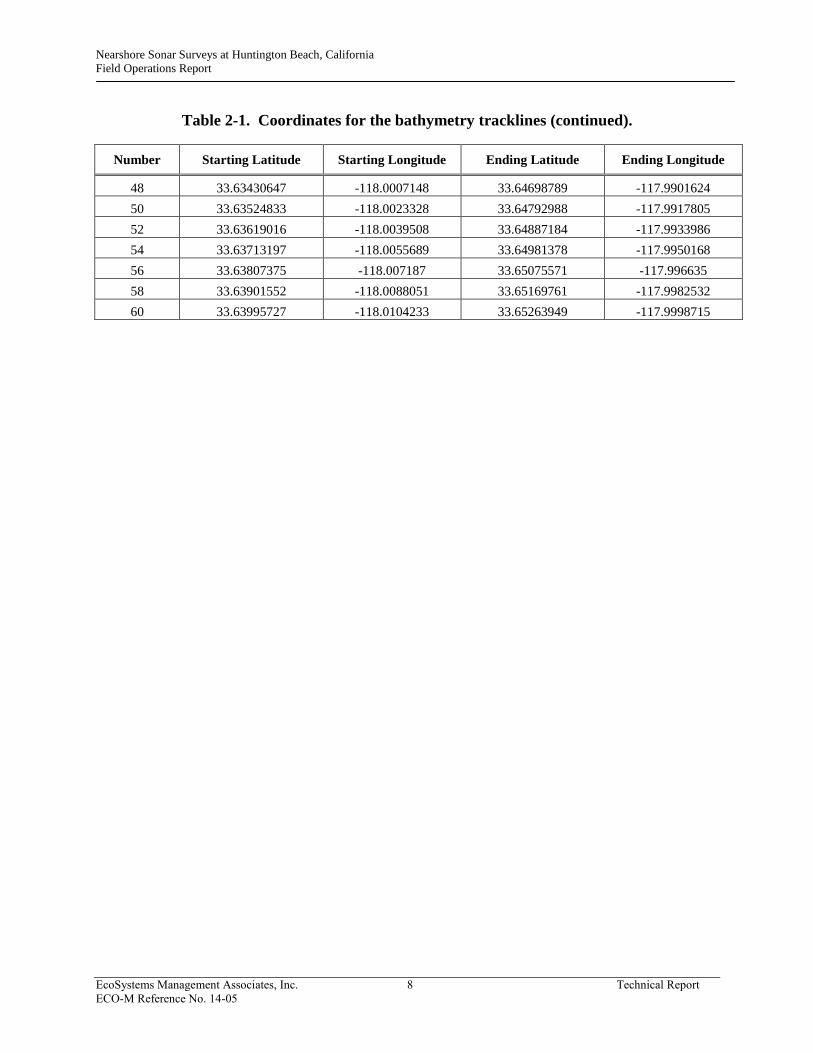
Table 2-1. Coordinates for the bathymetry tracklines (continued).
Number Starting Latitude Starting Longitude Ending Latitude Ending Longitude
48 33.63430647 -118.0007148 33.64698789 -117.9901624
50 33.63524833 -118.0023328 33.64792988 -117.9917805
52 33.63619016 -118.0039508 33.64887184 -117.9933986
54 33.63713197 -118.0055689 33.64981378 -117.9950168
56 33.63807375 -118.007187 33.65075571 -117.996635
58 33.63901552 -118.0088051 33.65169761 -117.9982532
60 33.63995727 -118.0104233 33.65263949 -117.9998715
Nearshore Sonar Surveys at Huntington Beach, California
Field Operations Report
EcoSystems Management Associates, Inc. 9 Technical Report
ECO-M Reference No. 14-05
Table 2-2. Coordinates for sub-bottom survey tracklines.
Name Starting Latitude Starting Longitude Ending Latitude Ending Longitude
SB1 33.64081519 -118.0093699 33.65047485 -117.9991581
SB2 33.6468809 -117.9937262 33.63735976 -118.0034395
SB3 33.63287376 -117.996204 33.64237468 -117.98602
SB4 33.64016008 -117.9831551 33.63013137 -117.9917304
SB5 33.62923337 -117.9903337 33.63979048 -117.9814554
SB6 33.63743692 -117.9791521 33.62764872 -117.987419
SB7 33.62533891 -117.9838634 33.63608119 -117.9748317
SB8 33.63497551 -117.9732742 33.62436785 -117.9820579
SB9 33.62119245 -117.9766367 33.63128637 -117.967059
SB10 33.62867269 -117.962683 33.61806187 -117.9717493
SB11 33.61496248 -117.966487 33.62601974 -117.9573351
SB50 33.62394756 -117.952544 33.65185272 -118.0009901
SB51 33.65167249 -118.0011462 33.62322758 -117.9531153
SB52 33.62268922 -117.953424 33.65117702 -118.001562
SB53 33.65068005 -118.0020843 33.62232595 -117.9539489
SB54 33.62156146 -117.9545192 33.64995835 -118.0027617
SB55 33.64923589 -118.0034922 33.62088451 -117.9551977
SB56 33.62007696 -117.9556607 33.64860242 -118.0042246
SB57 33.64783771 -118.0047947 33.61939855 -117.9564455
SB58 33.6181854 -117.957273 33.64743197 -118.005159
SB59 33.64589653 -118.0067247 33.61710429 -117.9582095
SB60 33.61449267 -117.9603928 33.64359332 -118.0090732
Nearshore Sonar Surveys at Huntington Beach, California
Field Operations Report
EcoSystems Management Associates, Inc. 10 Technical Report
ECO-M Reference No. 14-05
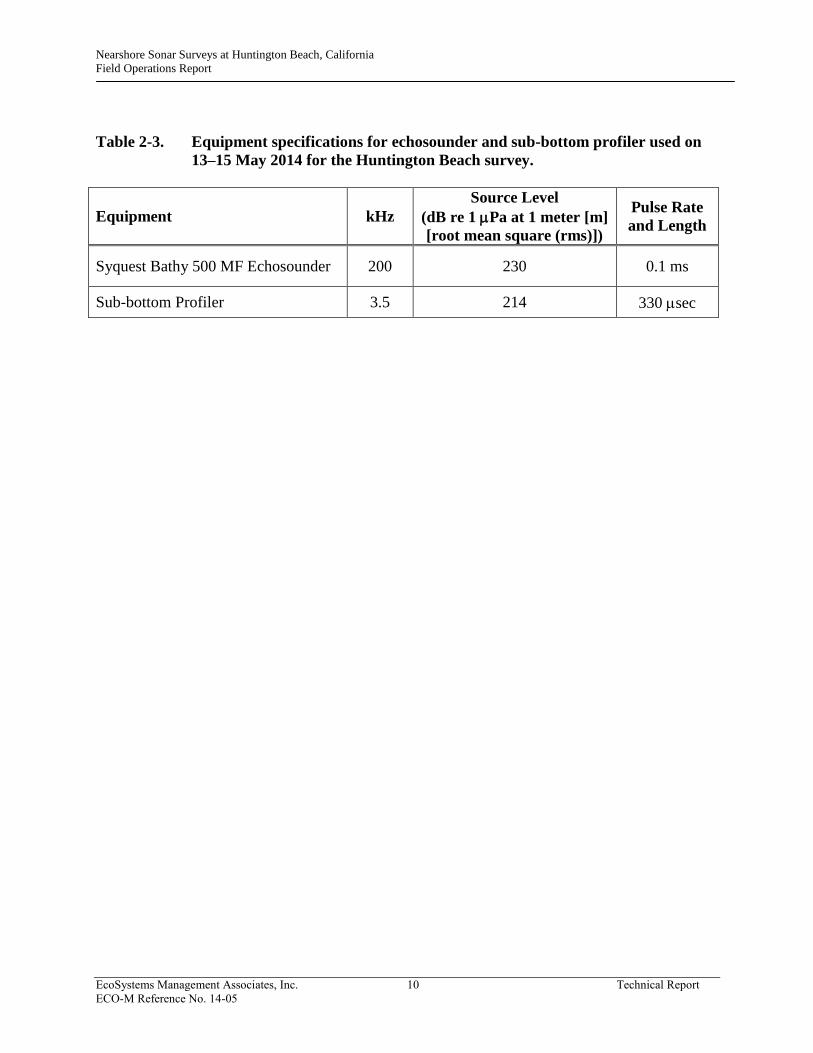
Table 2-3. Equipment specifications for echosounder and sub-bottom profiler used on
13–15 May 2014 for the Huntington Beach survey.
Equipment kHz
Source Level
(dB re 1 Pa at 1 meter [m]
[root mean square (rms)])
Pulse Rate
and Length
Syquest Bathy 500 MF Echosounder 200 230 0.1 ms
Sub-bottom Profiler 3.5 214 330 sec
Nearshore Sonar Surveys at Huntington Beach, California
Field Operations Report
EcoSystems Management Associates, Inc. 11 Technical Report
ECO-M Reference No. 14-05
Photo 2-1. ECO-M’s survey vessel “Farallon,” which was used for data collection
for the 13–15 May 2014 survey off Huntington Beach.
Nearshore Sonar Surveys at Huntington Beach, California
Field Operations Report
EcoSystems Management Associates, Inc. 12 Technical Report
ECO-M Reference No. 14-05
2.3 GEOPHYSICAL SURVEY EQUIPMENT
A total of 66 survey lines were acquired in a rectilinear grid measuring approximately
18,000 ft by 5,000 ft (2,066 acres). Twenty-two sub-bottom and 44 bathymetric survey lines
were acquired in a shore-parallel (upcoast/downcoast) and inshore/offshore orientation. The sub-
bottom profiler was towed off the starboard quarter of the vessel from the towing davit fairlead at
a depth of 6-10 ft.
A differential Global Positioning Satellite (GPS) navigation system was used to record
the shot points at precise one-second intervals during acquisition. A differential system uses ties
to the Coast Guard-maintained permanent GPS base station in the area. Nominal GPS position
accuracy is about 10 meters, and with differential technique, sub-meter position accuracy (< 3 ft)
was achieved. The shot-point navigation (geographic coordinates) during acquisition was based
on the World Geodetic System of 1984 (WGS84) and converted to the California State Plane
Coordinate System, zone 6, North American Datum of 1983 (NAD83), in U.S. Survey Feet for
mapping. Shot-point positions were determined by adding corrections for the layback or acoustic
source distance behind the GPS antenna on the boat.
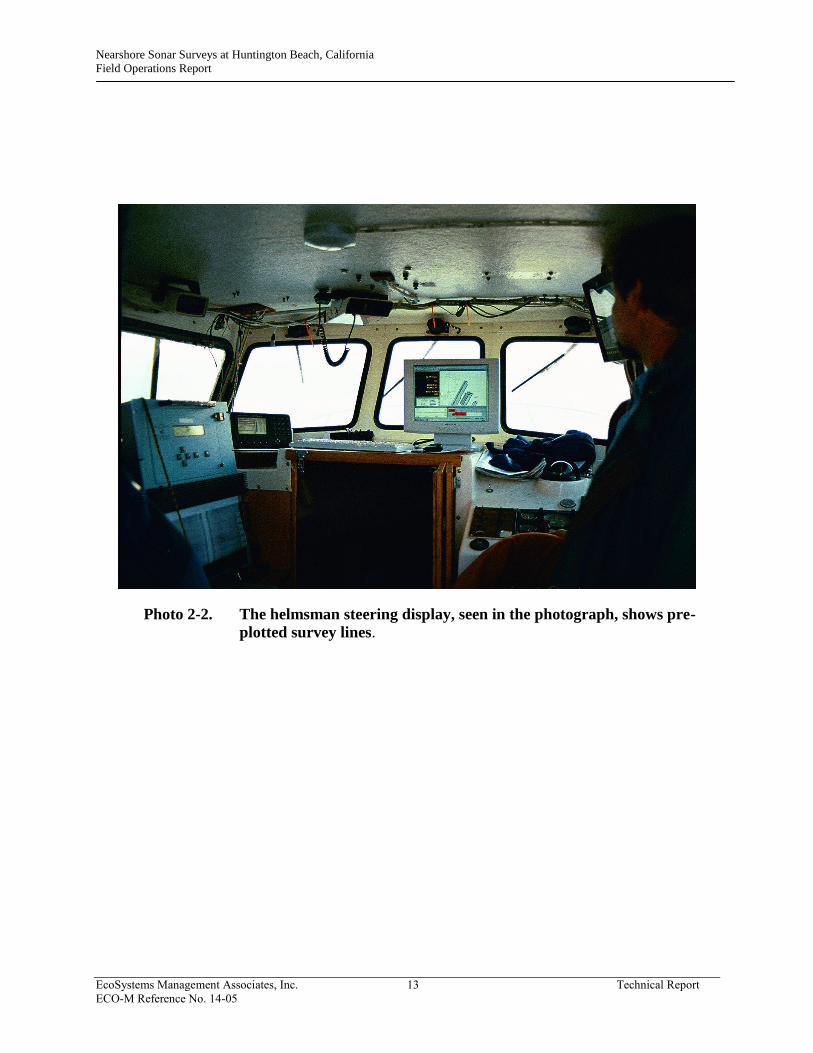
The survey parameters (i.e., area coordinates, line and cross-line spacings) were entered
into the Chesapeake SonarWiz5 Navigation Software creating a “pre-plot.” With this pre-plot, it
was possible to ensure that adequate survey line coverage had been obtained. The navigation
system records the shot-point number, x/y position, date, time, and position information at each
selected time interval. Position and time data are automatically stored on a computer hard drive,
and digital back-up storage is used. In addition, a real-time Helmsman Correct Course Steering
Display helped keep the vessel on the pre-plotted survey lines (Photo 2-2). Simultaneously with
the collection of positioning data, an event mark was sent to the recorders, which was annotated
with shot-point number, time, and date.
Data quality was established in the field during acquisition by monitoring the data being
recorded by the digital data-acquisition system and by preliminary data processing aboard the
boat. The software used for the digital recording of the data allows for the display of shot records
and some quantitative measures of signal and noise levels. Real-time records from the data-
acquisition system were also displayed to show data quality and to allow for preliminary
geological interpretation.
2.3.1 Echosounder
A total of 44 tracklines were acquired for the bathymetric survey. Tracklines were run in
an inshore/offshore orientation and a shore-parallel (upcoast/downcoast) orientation (Figure 1-2).
Inshore/offshore tracklines were approximately 4,000 feet in length. Shore-parallel
(upcoast/downcoast) tracklines were approximately 18,000 feet in length. Distances between
tracklines varied from 200 feet to more than 1,000 feet. The echosounder is located underneath
the vessel, at about 1 m or less below the surface. Data acquisition was with a Trimble Hydropro.
Nearshore Sonar Surveys at Huntington Beach, California
Field Operations Report
EcoSystems Management Associates, Inc. 13 Technical Report
ECO-M Reference No. 14-05
Photo 2-2. The helmsman steering display, seen in the photograph, shows pre-
plotted survey lines.
Nearshore Sonar Surveys at Huntington Beach, California
Field Operations Report
EcoSystems Management Associates, Inc. 14 Technical Report
ECO-M Reference No. 14-05
2.3.2 Sub-bottom Profiling
A total of 22 tracklines were acquired for the sub-bottom profiler survey (Table 2-2).
Sub-bottom tracklines were conducted in an inshore/offshore and shore-parallel
(upcoast/downcoast) orientation (Figure 1-3). Inshore/offshore tracklines were approximately
4,000 feet in length. Shore-parallel (upcoast/downcoast) tracklines were approximately 18,000
feet in length. Distances between tracklines varied, ranging between 200 to over 1,000 ft. The
sub-bottom profiler was towed off the starboard quarter on a cable length of 2 m (6.5 ft). Data
acquisition was with the Chesapeake SonarWiz 5.
2.4 DATA PROCESSING AND INTERPRETATION
2.4.1 Data Processing
Data processing for the sub-bottom profile data was performed using the Chesapeake TM
post-processing module of SonarWiz 5. Data processing for the bathymetric survey was done
with Hydro Pro. For the bathymetric data, the data were referenced to the local datum of Mean
Lower Low Water (MLLW) using data from the LA Harbor tide gauge (9410660).
2.4.2 Data Interpretation
Sub-bottom profile data were processed to identify the nearshore sub-bottom geology in
order to characterize the offshore alluvial basin and its suitability for the installation of a
subsurface intake system (infiltration gallery). Echosounder data were overlain onto sub-bottom
profile data to determine the bathymetric contours of the surveyed areas.
2.5 MARINE MAMMAL OBSERVATION
The marine mammal observer’s report is presented in Appendix A. In this report, we
provide daily summaries of observed mammals during the surveys and weather logs through 15
May 2014. The marine mammal surveys were carried out by Mr. Steven Putnam. Mr. Putnam is
a certified Marine Mammal Observer.
Nearshore Sonar Surveys at Huntington Beach, California
Field Operations Report
EcoSystems Management Associates, Inc. 15 Technical Report
ECO-M Reference No. 14-05
3.0 RESULTS
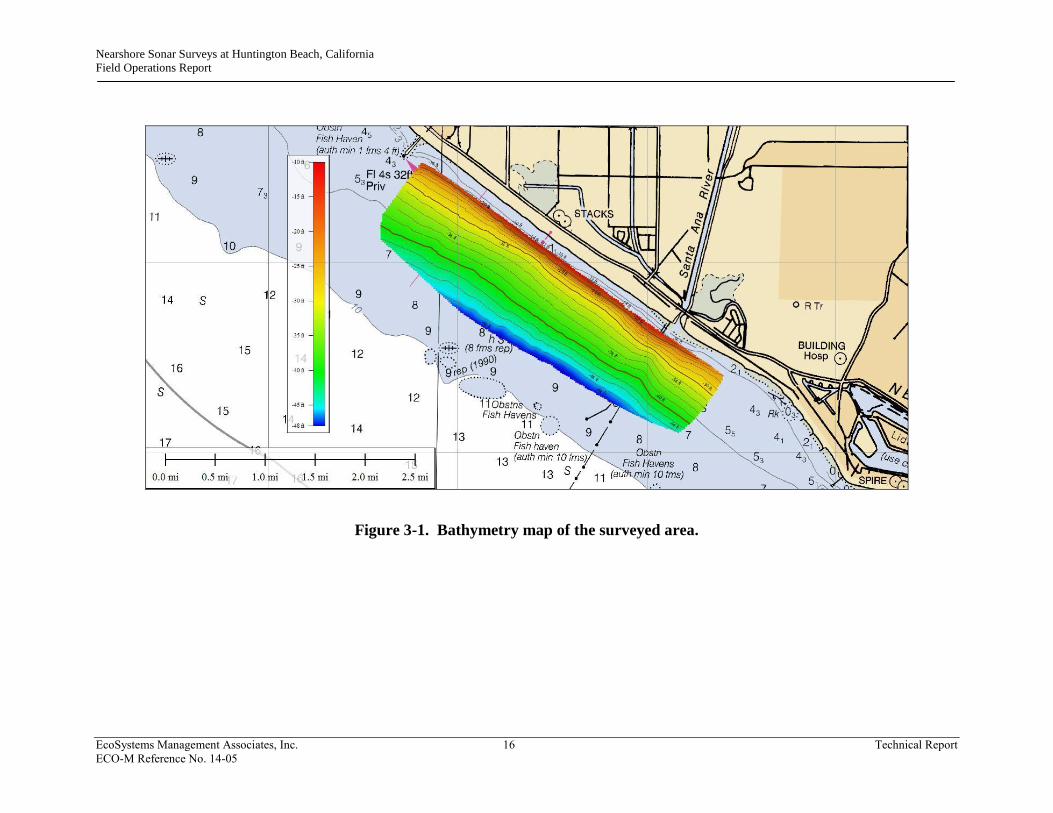
Figure 3-1 shows the bathymetry of the surveyed area off Huntington Beach. Figures 3-2
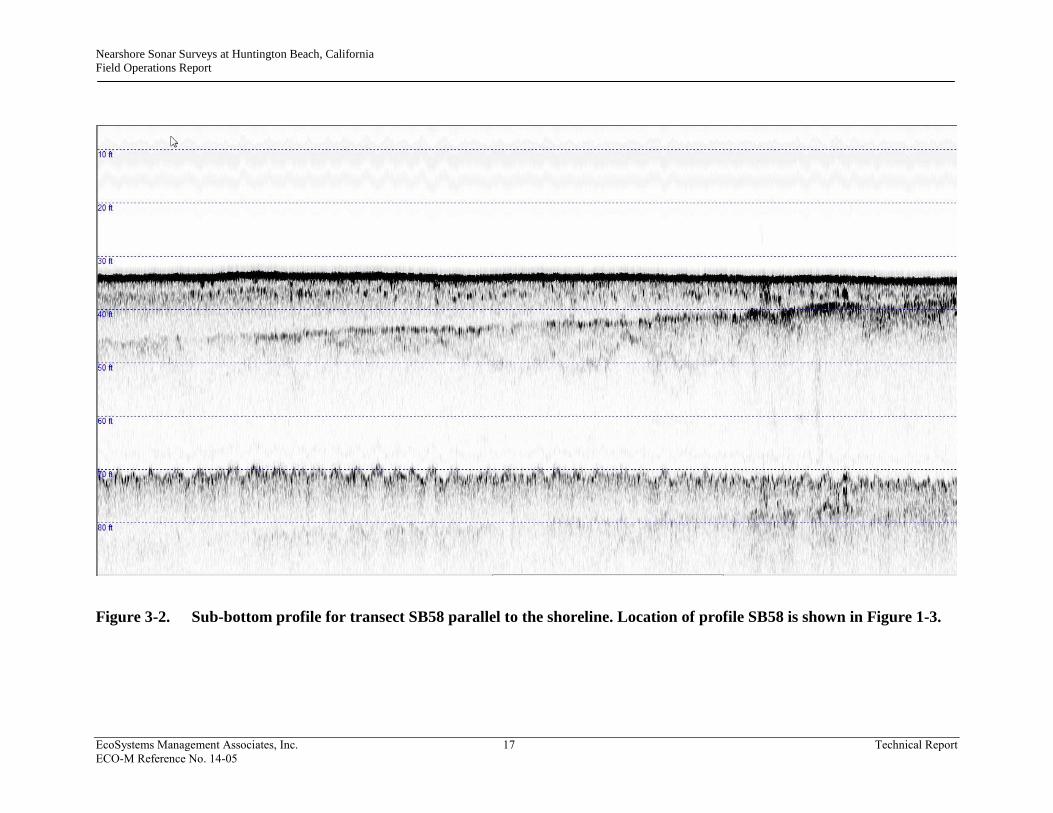
and 3-3 show the sub-bottom profiles for selected transects. The locations of these transects are
shown in Figure 1-3.
Nearshore Sonar Surveys at Huntington Beach, California
Field Operations Report
EcoSystems Management Associates, Inc. 16 Technical Report
ECO-M Reference No. 14-05
Figure 3-1. Bathymetry map of the surveyed area.
Nearshore Sonar Surveys at Huntington Beach, California
Field Operations Report
EcoSystems Management Associates, Inc. 17 Technical Report
ECO-M Reference No. 14-05
Figure 3-2. Sub-bottom profile for transect SB58 parallel to the shoreline. Location of profile SB58 is shown in Figure 1-3.
Nearshore Sonar Surveys at Huntington Beach, California
Field Operations Report
EcoSystems Management Associates, Inc. 18 Technical Report
ECO-M Reference No. 14-05
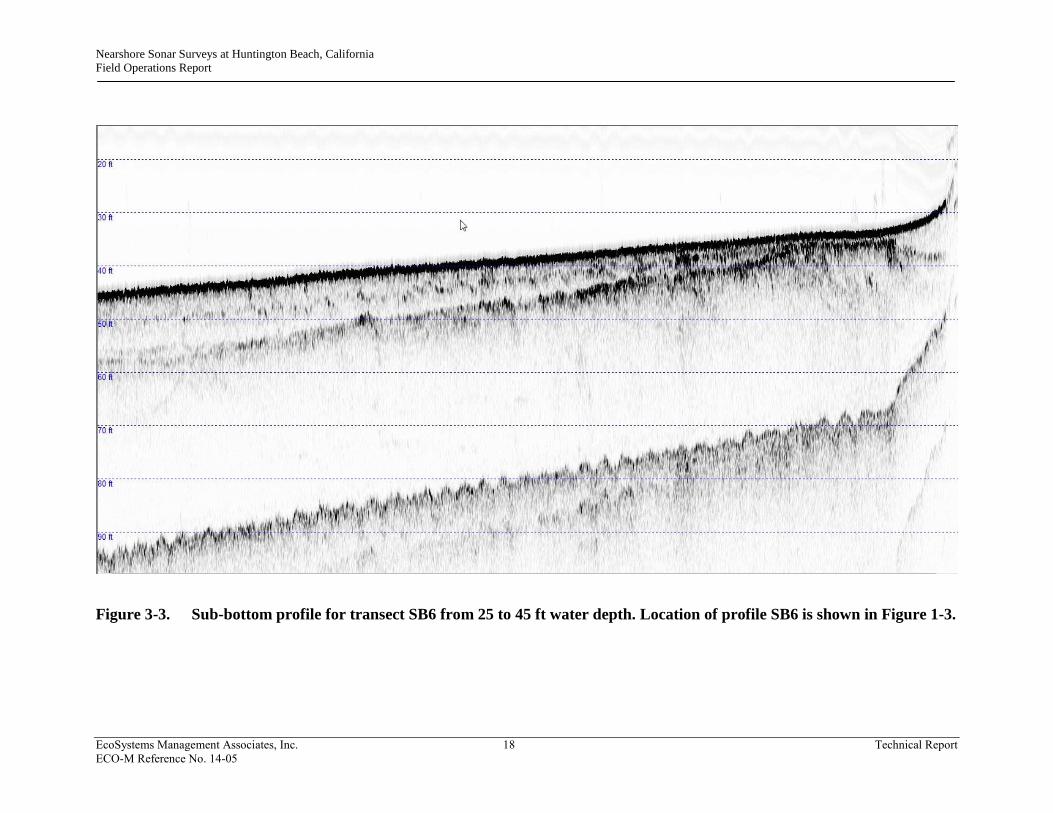
Figure 3-3. Sub-bottom profile for transect SB6 from 25 to 45 ft water depth. Location of profile SB6 is shown in Figure 1-3.
Nearshore Sonar Surveys at Huntington Beach, California
Field Operations Report
EcoSystems Management Associates, Inc. A-1 Technical Report
ECO-M Reference No. 14-05
APPENDIX A
MARINE MAMMAL OBSERVER REPORT
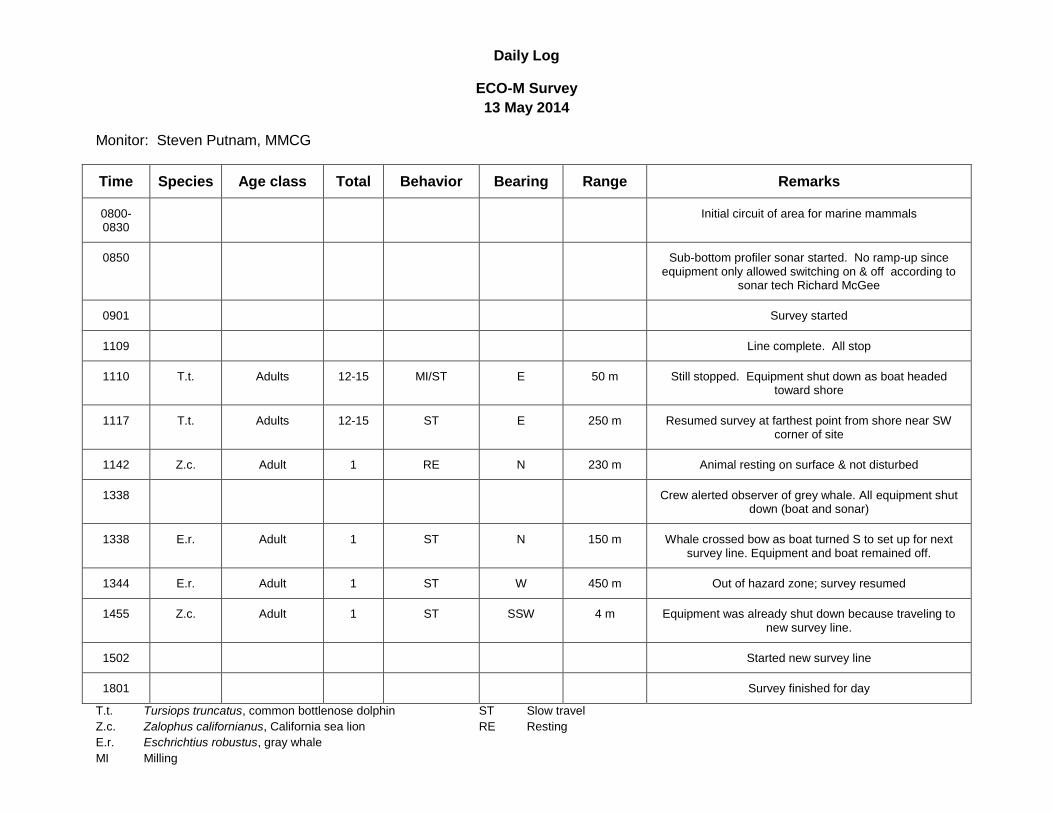
Daily Log
ECO-M Survey
13 May 2014
Monitor: Steven Putnam, MMCG
Time Species Age class Total Behavior Bearing Range Remarks
0800-0830
Initial circuit of area for marine mammals
0850 Sub-bottom profiler sonar started. No ramp-up since equipment only allowed switching on & off according to
sonar tech Richard McGee
0901 Survey started
1109 Line complete. All stop
1110 T.t. Adults 12-15 MI/ST E 50 m Still stopped. Equipment shut down as boat headed toward shore
1117 T.t. Adults 12-15 ST E 250 m Resumed survey at farthest point from shore near SW corner of site
1142 Z.c. Adult 1 RE N 230 m Animal resting on surface & not disturbed
1338 Crew alerted observer of grey whale. All equipment shut down (boat and sonar)
1338 E.r. Adult 1 ST N 150 m Whale crossed bow as boat turned S to set up for next survey line. Equipment and boat remained off.
1344 E.r. Adult 1 ST W 450 m Out of hazard zone; survey resumed
1455 Z.c. Adult 1 ST SSW 4 m Equipment was already shut down because traveling to new survey line.
1502 Started new survey line
1801 Survey finished for day
T.t. Tursiops truncatus, common bottlenose dolphin ST Slow travel
Z.c. Zalophus californianus, California sea lion RE Resting
E.r. Eschrichtius robustus, gray whale
MI Milling
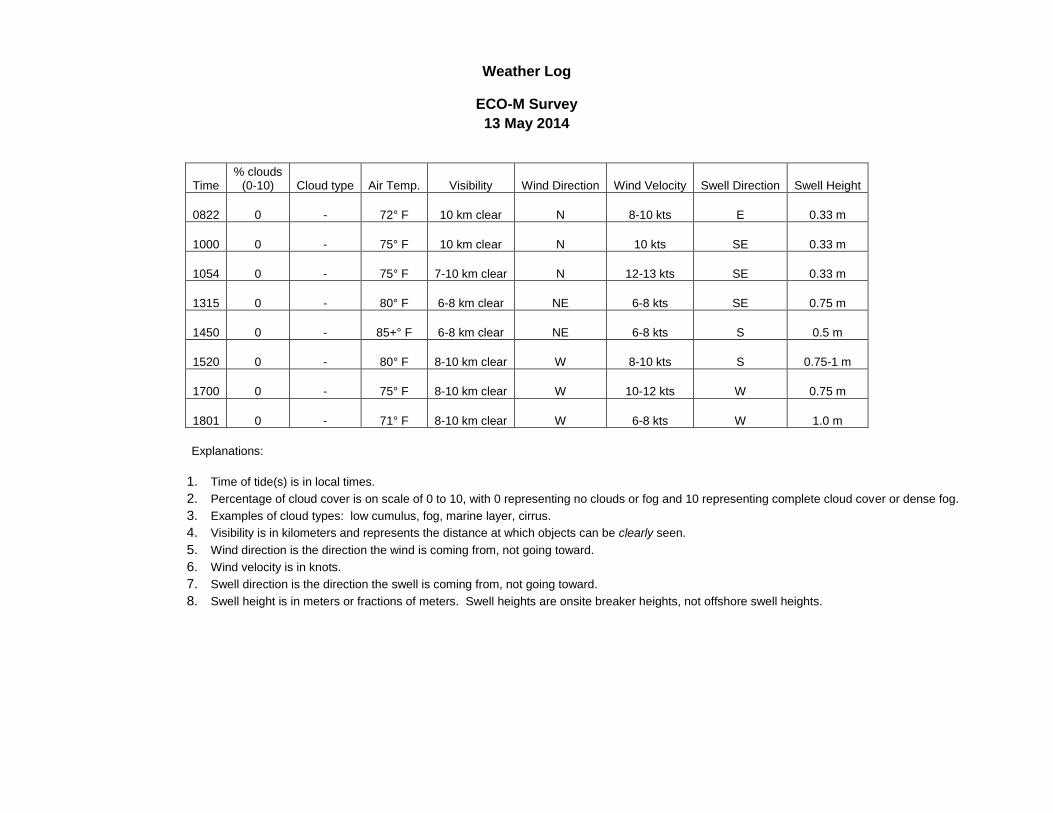
Weather Log
ECO-M Survey
13 May 2014
Time % clouds
(0-10) Cloud type Air Temp. Visibility Wind Direction Wind Velocity Swell Direction Swell Height
0822 0 - 72° F 10 km clear N 8-10 kts E 0.33 m
1000 0 - 75° F 10 km clear N 10 kts SE 0.33 m
1054 0 - 75° F 7-10 km clear N 12-13 kts SE 0.33 m
1315 0 - 80° F 6-8 km clear NE 6-8 kts SE 0.75 m
1450 0 - 85+° F 6-8 km clear NE 6-8 kts S 0.5 m
1520 0 - 80° F 8-10 km clear W 8-10 kts S 0.75-1 m
1700 0 - 75° F 8-10 km clear W 10-12 kts W 0.75 m
1801 0 - 71° F 8-10 km clear W 6-8 kts W 1.0 m
Explanations:
1. Time of tide(s) is in local times.
2. Percentage of cloud cover is on scale of 0 to 10, with 0 representing no clouds or fog and 10 representing complete cloud cover or dense fog.
3. Examples of cloud types: low cumulus, fog, marine layer, cirrus.
4. Visibility is in kilometers and represents the distance at which objects can be clearly seen.
5. Wind direction is the direction the wind is coming from, not going toward.
6. Wind velocity is in knots.
7. Swell direction is the direction the swell is coming from, not going toward.
8. Swell height is in meters or fractions of meters. Swell heights are onsite breaker heights, not offshore swell heights.
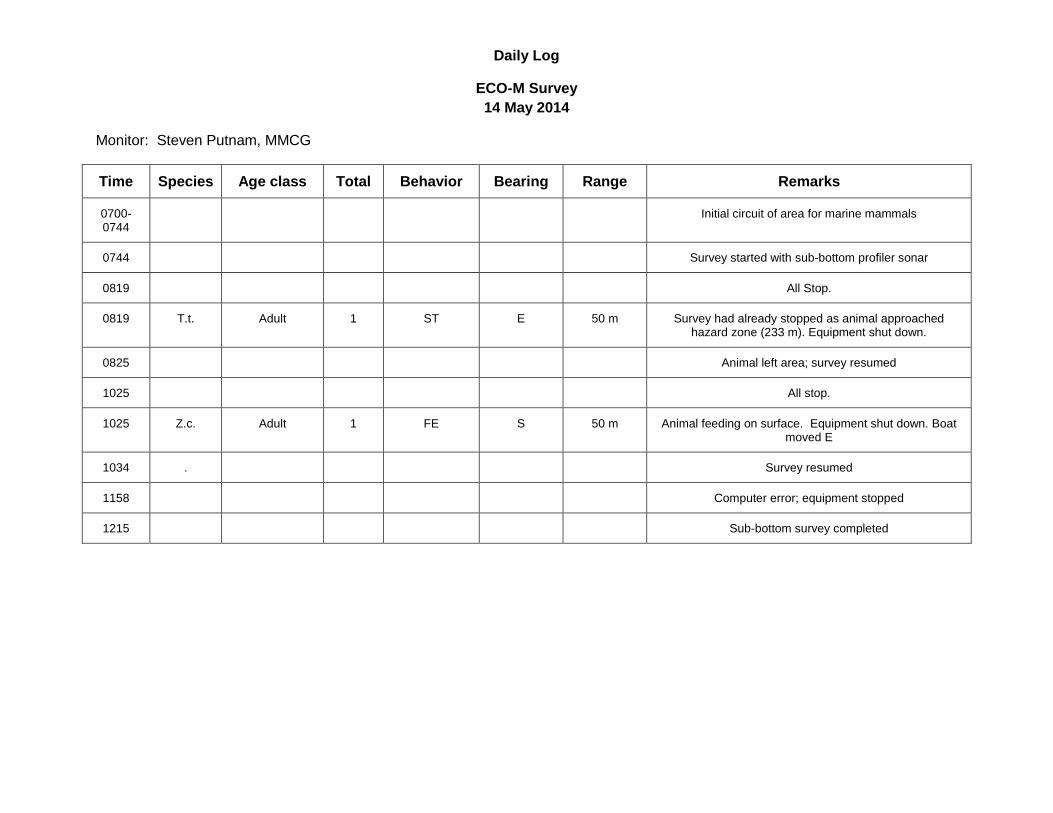
Daily Log
ECO-M Survey
14 May 2014
Monitor: Steven Putnam, MMCG
Time Species Age class Total Behavior Bearing Range Remarks
0700-0744
Initial circuit of area for marine mammals
0744 Survey started with sub-bottom profiler sonar
0819 All Stop.
0819 T.t. Adult 1 ST E 50 m Survey had already stopped as animal approached hazard zone (233 m). Equipment shut down.
0825 Animal left area; survey resumed
1025 All stop.
1025 Z.c. Adult 1 FE S 50 m Animal feeding on surface. Equipment shut down. Boat moved E
1034 . Survey resumed
1158 Computer error; equipment stopped
1215 Sub-bottom survey completed
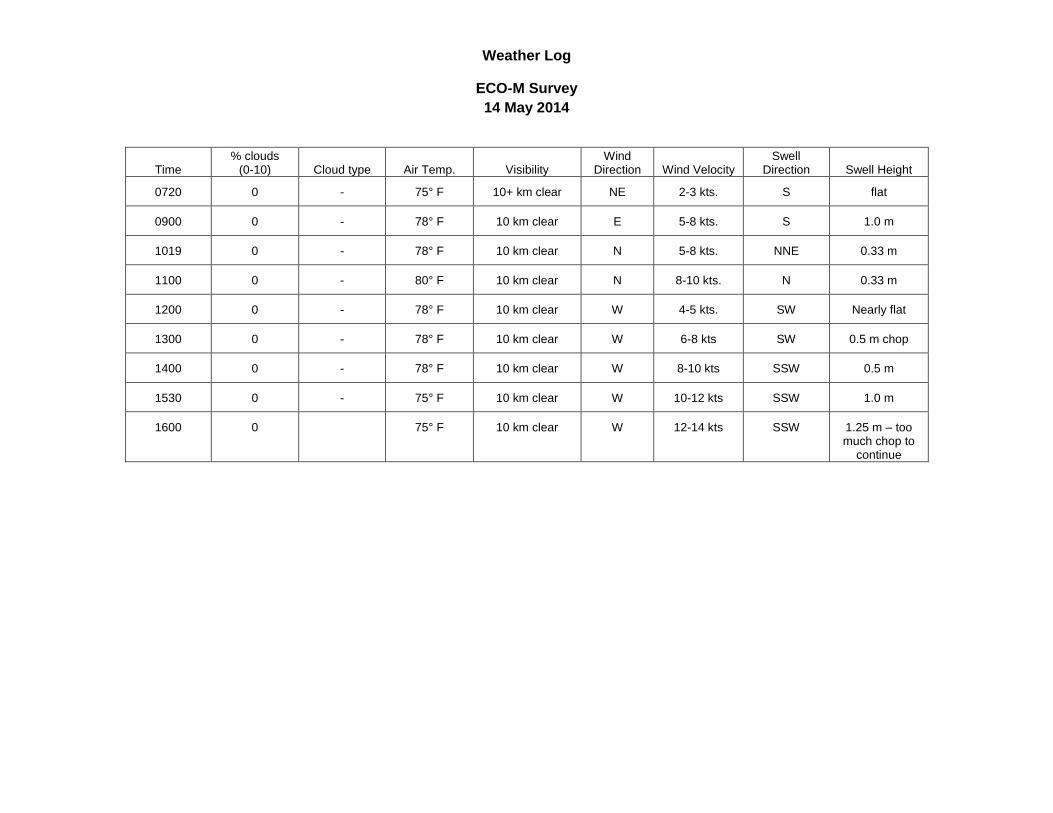
Weather Log
ECO-M Survey
14 May 2014
Time % clouds
(0-10) Cloud type Air Temp. Visibility Wind
Direction Wind Velocity Swell
Direction Swell Height
0720 0 - 75° F 10+ km clear NE 2-3 kts. S flat
0900 0 - 78° F 10 km clear E 5-8 kts. S 1.0 m
1019 0 - 78° F 10 km clear N 5-8 kts. NNE 0.33 m
1100 0 - 80° F 10 km clear N 8-10 kts. N 0.33 m
1200 0 - 78° F 10 km clear W 4-5 kts. SW Nearly flat
1300 0 - 78° F 10 km clear W 6-8 kts SW 0.5 m chop
1400 0 - 78° F 10 km clear W 8-10 kts SSW 0.5 m
1530 0 - 75° F 10 km clear W 10-12 kts SSW 1.0 m
1600 0 75° F 10 km clear W 12-14 kts SSW 1.25 m – too much chop to
continue
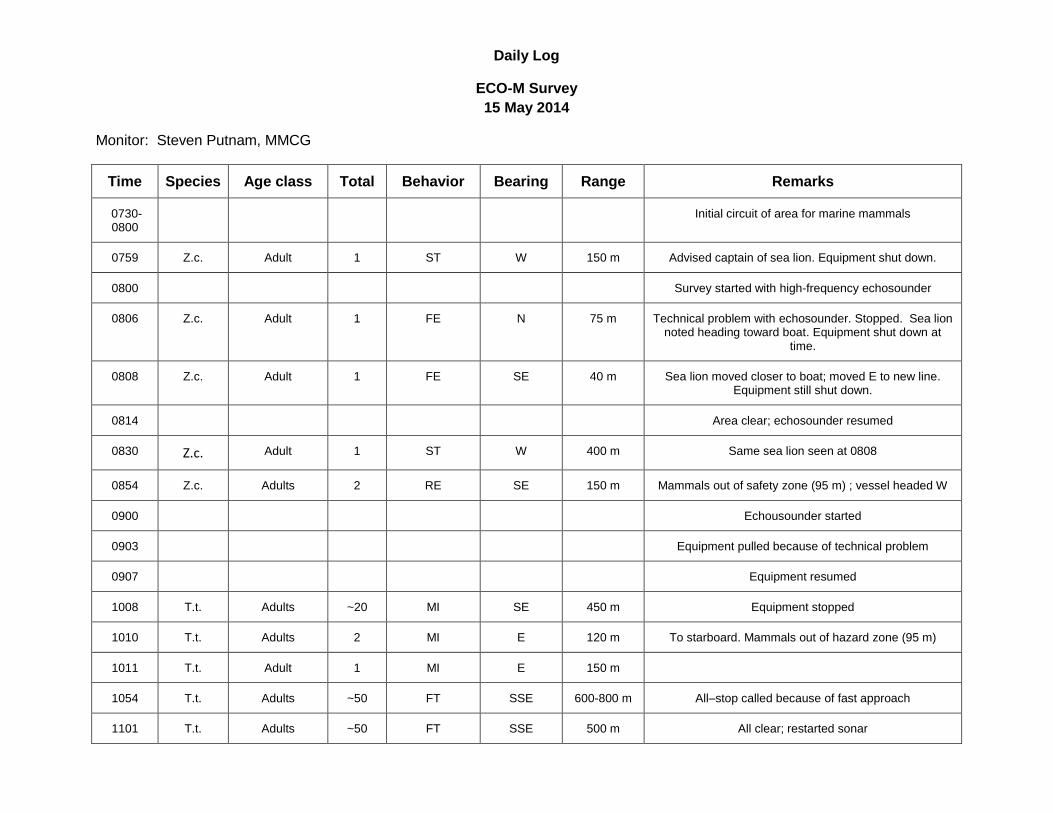
Daily Log
ECO-M Survey
15 May 2014
Monitor: Steven Putnam, MMCG
Time Species Age class Total Behavior Bearing Range Remarks
0730-0800
Initial circuit of area for marine mammals
0759 Z.c. Adult 1 ST W 150 m Advised captain of sea lion. Equipment shut down.
0800 Survey started with high-frequency echosounder
0806 Z.c. Adult 1 FE N 75 m Technical problem with echosounder. Stopped. Sea lion noted heading toward boat. Equipment shut down at
time.
0808 Z.c. Adult 1 FE SE 40 m Sea lion moved closer to boat; moved E to new line. Equipment still shut down.
0814 Area clear; echosounder resumed
0830 Z.c. Adult 1 ST W 400 m Same sea lion seen at 0808
0854 Z.c. Adults 2 RE SE 150 m Mammals out of safety zone (95 m) ; vessel headed W
0900 Echousounder started
0903 Equipment pulled because of technical problem
0907 Equipment resumed
1008 T.t. Adults ~20 MI SE 450 m Equipment stopped
1010 T.t. Adults 2 MI E 120 m To starboard. Mammals out of hazard zone (95 m)
1011 T.t. Adult 1 MI E 150 m
1054 T.t. Adults ~50 FT SSE 600-800 m All–stop called because of fast approach
1101 T.t. Adults ~50 FT SSE 500 m All clear; restarted sonar
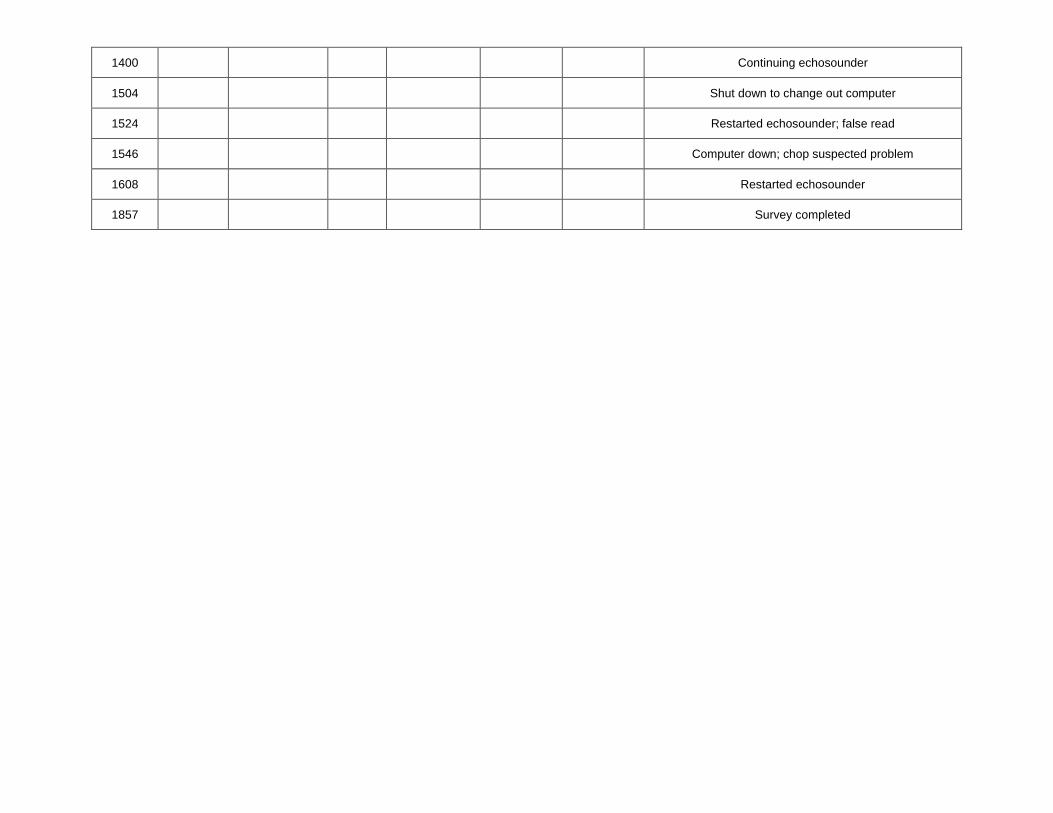
1400 Continuing echosounder
1504 Shut down to change out computer
1524 Restarted echosounder; false read
1546 Computer down; chop suspected problem
1608 Restarted echosounder
1857 Survey completed
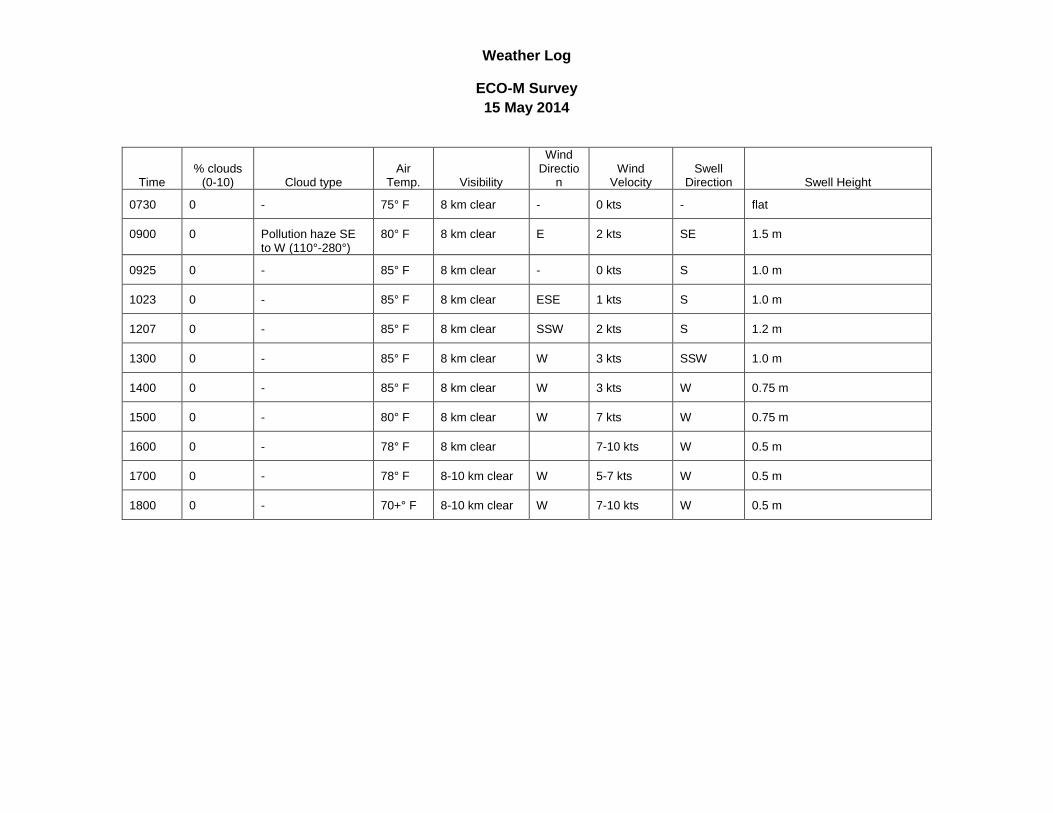
Weather Log
ECO-M Survey
15 May 2014
Time % clouds
(0-10) Cloud type Air
Temp. Visibility
Wind Directio
n Wind
Velocity Swell
Direction Swell Height
0730 0 - 75° F 8 km clear - 0 kts - flat
0900 0 Pollution haze SE to W (110°-280°)
80° F 8 km clear E 2 kts SE 1.5 m
0925 0 - 85° F 8 km clear - 0 kts S 1.0 m
1023 0 - 85° F 8 km clear ESE 1 kts S 1.0 m
1207 0 - 85° F 8 km clear SSW 2 kts S 1.2 m
1300 0 - 85° F 8 km clear W 3 kts SSW 1.0 m
1400 0 - 85° F 8 km clear W 3 kts W 0.75 m
1500 0 - 80° F 8 km clear W 7 kts W 0.75 m
1600 0 - 78° F 8 km clear 7-10 kts W 0.5 m
1700 0 - 78° F 8-10 km clear W 5-7 kts W 0.5 m
1800 0 - 70+° F 8-10 km clear W 7-10 kts W 0.5 m
N/A – exempt – gasoline
vessel
N/A – exempt – gasoline
vessel
N/A – exempt – gasoline
vessel
N/A – exempt – gasoline
vessel
N/A – exempt – gasoline vessel
NE 5/12/14
HE 5/13/14- 5/15/14 Approval by NOAA
on 5/12/14
SP (MWO) 5/13/14- 5/15/14
SP (MWO) 5/13/14- 5/15/14
N/A – no nighttime
surveys conducte
d
SP (MWO)
5/13/14- 5/15/14
SP (MWO) 5/13/14- 5/15/14
NE 3/17/14 –
no pinniped haul-out sites in
area
HE 5/13/14 – 5/15/14
N/A – no collisions. Mandated in Marine Wildlife
Contingency Plan dated
March 2014
N/A No MPAs in
project area
HE 3/17/14
N/A – boat is trailered and fuels on land
HE 3/17/14 – supplies
confirmed
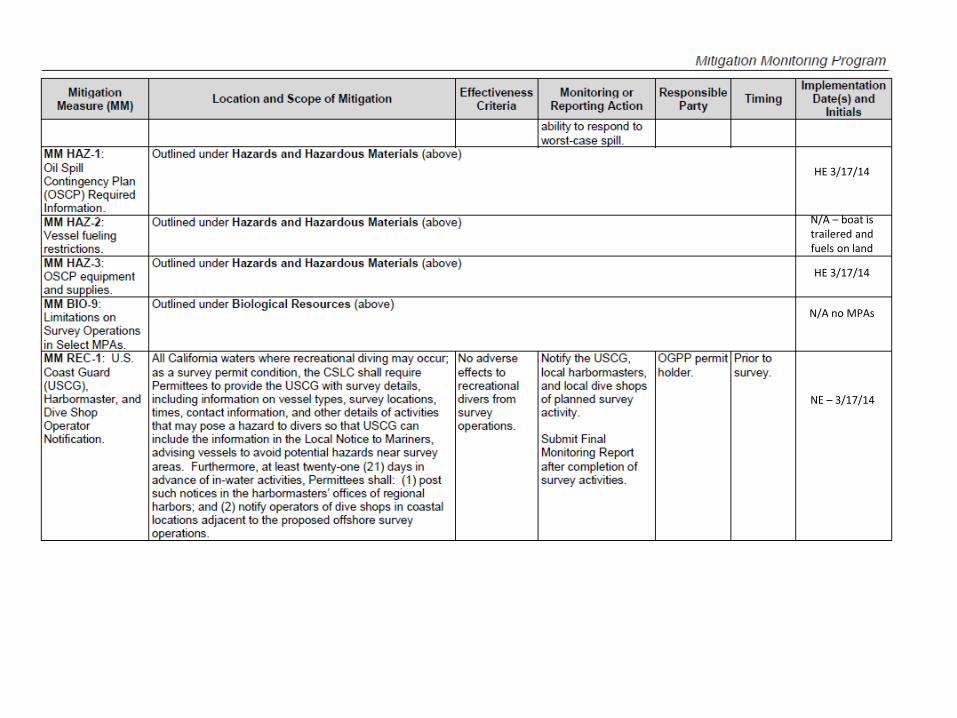
HE 3/17/14
N/A – boat is trailered and fuels on land
HE 3/17/14
N/A no MPAs
NE – 3/17/14
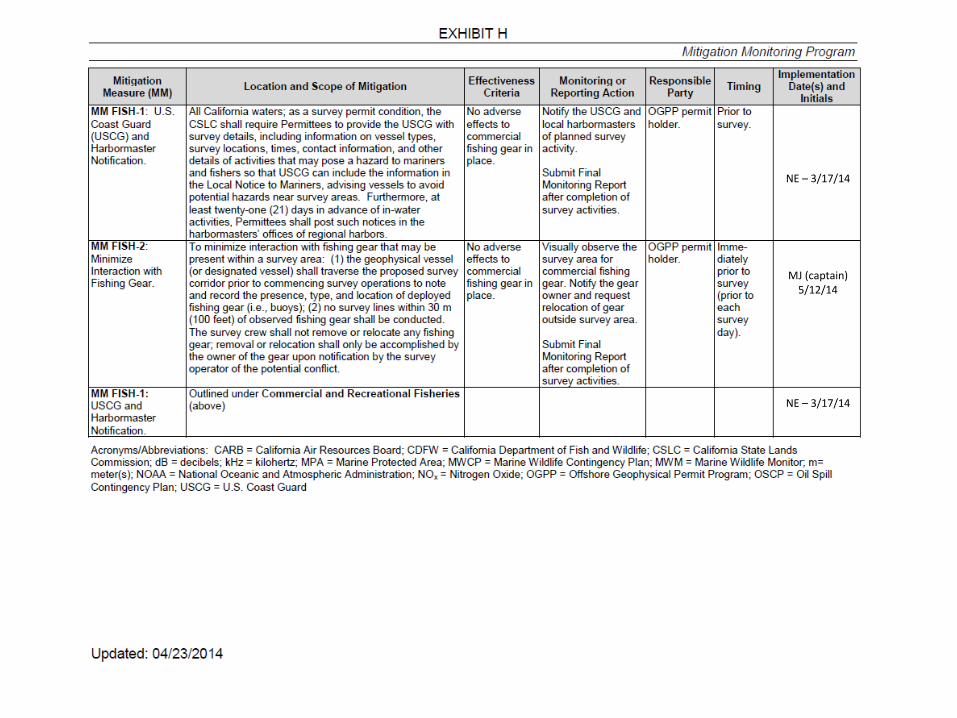
NE – 3/17/14
MJ (captain) 5/12/14
NE – 3/17/14