Embed Size (px)
Citation preview
DI
SC
US
SI
ON
P
AP
ER
S
ER
IE
S
Forschungsinstitut zur Zukunft der ArbeitInstitute for the Study of Labor
Necessity Entrepreneurship and Competitive Strategy
IZA DP No. 8219
May 2014
Joern H. BlockKarsten KohnDanny MillerKatrin Ullrich
Necessity Entrepreneurship and Competitive Strategy
Joern H. Block University of Trier and Erasmus University Rotterdam
Karsten Kohn
KfW Bankengruppe Frankfurt and IZA
Danny Miller HEC Montreal and University of Alberta
Katrin Ullrich
KfW Bankengruppe Frankfurt
Discussion Paper No. 8219 May 2014
IZA
P.O. Box 7240 53072 Bonn
Germany
Phone: +49-228-3894-0 Fax: +49-228-3894-180
E-mail: [email protected]
Any opinions expressed here are those of the author(s) and not those of IZA. Research published in this series may include views on policy, but the institute itself takes no institutional policy positions. The IZA research network is committed to the IZA Guiding Principles of Research Integrity. The Institute for the Study of Labor (IZA) in Bonn is a local and virtual international research center and a place of communication between science, politics and business. IZA is an independent nonprofit organization supported by Deutsche Post Foundation. The center is associated with the University of Bonn and offers a stimulating research environment through its international network, workshops and conferences, data service, project support, research visits and doctoral program. IZA engages in (i) original and internationally competitive research in all fields of labor economics, (ii) development of policy concepts, and (iii) dissemination of research results and concepts to the interested public. IZA Discussion Papers often represent preliminary work and are circulated to encourage discussion. Citation of such a paper should account for its provisional character. A revised version may be available directly from the author.
IZA Discussion Paper No. 8219 May 2014
ABSTRACT
Necessity Entrepreneurship and Competitive Strategy* Many start-ups chose to compete with incumbent firms using one of two generic strategies: cost leadership or differentiation. Our study demonstrates how this choice depends on whether the startup was founded out of necessity. Our results, based on a representative data set of 4,568 German start-ups, show that necessity entrepreneurs are more likely than other entrepreneurs to pursue a cost leadership strategy, and less likely to pursue a differentiation strategy. Decomposition analyses further show that up to half of the difference in choice of strategy can be attributed to distinct endowments of human capital, socio-economic attributes, and start-up project characteristics that correlate with necessity entrepreneurship. JEL Classification: L10, L26 Keywords: necessity entrepreneurship, new venture strategy, competitive strategy,
cost leadership, product differentiation, decomposition analysis Corresponding author: Karsten Kohn KfW Bankengruppe Palmengartenstr. 5-9 60325 Frankfurt am Main Germany E-mail: [email protected]
* This paper represents the authors’ personal opinions and does not necessarily reflect the views of KfW Bankengruppe.
1
INTRODUCTION
Our research seeks to better understand how start up conditions in a firm can influence its
competitive strategy. We shall argue that conditions such as the reasons an entrepreneur has to start
her business can have an important influence on competitive strategy. That decision is important for
a variety of reasons. First, it has been shown that circumstances characterizing the birth conditions
of a firm tend to be imprinted in firms for very long periods (Baron, Hannan, & Burton, 1999;
Stinchcombe, 1965). Thus early strategic decisions tend to be lasting ones. Moreover, the skills, cli-
ent contacts, personnel, and capital investments at start-up tend to lock the firm into its condition
(Hannan & Freeman, 1984; Miller, 1990). Finally, some types of strategies tend to be more salutary
for long term performance and economic growth than others.
Start-ups can choose different strategies for how to compete (Carter, Stearns, Reynolds, &
Miller, 1994). They can decide, for example, to compete on the basis of price or they can pursue a
strategy of differentiation via offering superior product value. We argue that the choice of competi-
tive strategy of a start-up will depend on the particular circumstances surrounding an entrepreneur
that precipitate the start-up decision. We focus on the primary motivations of founders for starting
their business. Specifically, we contrast founders who launch their businesses out of necessity – be-
cause they lack alternative employment opportunities – with those who begin their enterprises under
less restrictive or compelling conditions. This “necessity” condition is an important one as it may
correlate with the motivational, human capital, and resource endowments of the entrepreneur, and
therefore can have an important impact on the nature of a business.
Prior research shows that many entrepreneurs start their venture because they lack signifi-
cant opportunities for paid employment (Amit & Muller, 1995; Bergmann & Sternberg, 2007;
Gohmann & Fernandez, in press). Data from the Global Entrepreneurship Monitor show that the
proportion of necessity entrepreneurs amounts to 18.6 % in Germany, 25.9 % in Spain, and 21.2 %
in the US (Kelley, Singer, & Herrington, 2012). Studies also find that necessity entrepreneurs dis-
play different socio-economic characteristics than other entrepreneurs (Block & Wagner, 2010).
2
They also differ in human capital endowment, venture success, job satisfaction, and impact on eco-
nomic development (Acs & Varga, 2005; Bergmann & Sternberg, 2007; Block & Koellinger, 2009;
Block & Sandner, 2009; Kautonen & Palmroos, 2010; Wong, Ho, & Autio, 2005). Yet to date little
is known about the strategic behavior of necessity entrepreneurs. Our research addresses this gap by
assessing the competitive strategies they pursue. We distinguish cost leadership and differentiation
strategies,, each considered by Porter (1980) and his many followers to be individually and in com-
bination generic foundations of viable strategic behavior. We also seek to understand the reasons
why necessity entrepreneurs choose a particular competitive strategy.
Our empirical analysis uses an original data set from the KfW/ZEW Start-up Panel (Fryges,
Gottschalk, & Kohn, 2010). Our sample includes 4,568 ventures started in Germany between 2005
and 2007. Given the richness of the data we are able to determine the effect of necessity entrepre-
neurship on new venture competitive strategy, while controlling for a large number of start-up and
founder characteristics. As hypothesized, we find that necessity-based start-ups are more likely to
pursue a cost leadership strategy, and less likely to pursue a differentiation strategy. Moreover, ob-
servable characteristics such as human capital endowment and specifics of the chosen projects dif-
fer significantly between necessity-based and other start-ups, and these differences are often larger
than the corresponding variation between cost leaders and differentiators within the group of neces-
sity-based start-ups. Using Blinder-Oaxaca-type decomposition techniques we also find that up to
one half of the difference in choice of strategy between necessity-based and other start-ups is attrib-
utable to differences in observable characteristics.
Our study contributes to our understanding of the strategic consequences of necessity en-
trepreneurship (Block & Koellinger, 2009; Block & Sandner, 2009; Block & Wagner, 2010;
Dencker, Gruber, & Shah, 2009; Hechavaria & Reynolds, 2009; Kautonen & Palmroos, 2010;
Maritz, 2004; Williams, 2008). So far, little has been written about the strategies necessity entrepre-
neurs use to start their ventures; and we show how these individuals represent a distinctive group in
that respect. Second, we contribute to the literature on new venture strategy (Carter et al., 1994;
3
Covin & Slevin, 1990; Fern, Cardinal, & O’Neill, 2012; McDougall & Robinson, 1990; Ostgaard &
Birley, 1994). We demonstrate that the strategies of new ventures are shaped vitally by the motiva-
tions of their founders and the specific economic situations leading to their decision to launch a ven-
ture. Third, we contribute to the work on the effects of an entrepreneur’s pre-launch history on ven-
ture design (Baron et al., 1999; Dahl & Sorenson, 2012; Helfat & Lieberman, 2002; Sørensen, 2007;
Sørensen & Fassiotto, 2011; Thornton, 1999). We find that entrepreneurs with a history of eco-
nomic necessity start their venture with a different strategic orientation than other entrepreneurs.
Importantly, we are also able to estimate to what degree differences in strategy choice are attribut-
able to particularities in human capital endowment, socio-economic factors, and characteristics of
the start-up project correlating with necessity entrepreneurship.
The study is organized as follows: Section 2 reviews the literature on competitive strategy
in new ventures and develops hypotheses regarding the effect of necessity entrepreneurship on the
choice of new venture competitive strategy. Section 3 introduces the data and methods for the em-
pirical analysis, and presents our results. Section 4 concludes.
THEORY AND HYPOTHESES
Competitive strategy: typologies and determinants
Over the years, Porter’s (1980) distinction between cost leadership and differentiation
strategies and his related typology have been perhaps the best researched in the strategy literature. It
has been shown that these strategies yield competitive benefits for survival and profitability (Miller,
1988) 1. Carter et al. (1994) have shown that cost leadership and various differentiation strategies
are extremely common among start-ups. However, positive competitive outcomes can only be ob-
tained by matching competitive strategy to available resources (Barney, 1991): for example, excep-
1 Miles & Snow (1978) distinguished among prospector firms that competed on the basis of their innovative abilities and
charged higher prices for their superior offerings, defender firms that competed on the basis of efficiency and price, and analyzers who combined these strategies towards different ends. The work of Porter (1980) is related to that of Miles & Snow (1978) in that it contrasted firms that were differentiators and cost leaders. Prospectors engaged in innovative differentiation and defenders tended to be cost leaders. Porter’s (1980) third focus category of firms tailored a blend of differentiation and cost leadership to a narrowly tar-geted niche of the market; they related in orientation to Miles & Snow’s (1978) analyzers. Miller (1988) showed that there were many types of differentiation – for example, according to quality, marketing expertise and innovative talent.
4
tional creative or scientific talent is useful for innovative differentiation, and economical production
cost structures are needed to support sustained cost leadership. This resource-matching constraint
can have a major impact on the strategic choices of necessity entrepreneurs in new ventures, espe-
cially given what may be, in some aspects, a restrictive resource profile.
Many kinds of resources can sustain a strategy. These include obvious ones such as special
knowledge, patents and valuable properties, as well as energized corporate cultures (Barney, 1991).
But they can also include the motivations of those owning and working in the business – their will-
ingness to work hard to make the business successful and to do so for meager pay.
The importance of linking strategy to founder resources has been confirmed by studies of
new ventures. Research by Ostgaard & Birley (1994), for example, shows that new venture com-
petitive strategy is shaped by the personal social networks of the founders. Other researchers have
examined how the social context of founders shapes venture design (Baron et al., 1999; Burton &
Beckman, 2007; Dahl & Sorenson, 2012; Sørensen, 2007; Sørensen & Fassiotto, 2011). However,
these studies have not addressed the distinctive situations or choices of necessity entrepreneurs.
Necessity entrepreneurship and choice of competitive strategy
Cost leadership and differentiation strategies have been found to be common among new
ventures (Carter et al., 1994; Ostgaard & Birley, 1994). As noted, each of these strategies relies on a
different set of resources. We shall argue that the resources that are typically available to—or diffi-
cult to access for—a necessity entrepreneur will make it especially likely that she will adopt a cost
leadership versus a differentiation strategy2.
Certainly, the motivations to embark upon entrepreneurship can influence the strategy of a
new venture. Because necessity entrepreneurs are pushed into entrepreneurship, they often are in a
2 Prior studies have distinguished between entrepreneurs who started their business “to take advantage of a unique market opportunity” – so-called opportunity entrepreneurs, and those that became entrepreneurs because no other employment opportunities were available to them – necessity entrepreneurs (Reynolds et. al., 2005). These notions of necessity and opportunity entrepreneur-ship relate to the earlier work on “push versus pull” motivations for starting a venture (Amit & Mueller, 1995; Cooper & Dunkelberg, 1986; Solymossy, 1997).
5
less favorable position than other entrepreneurs to carefully plan their new initiatives. Compared to
other entrepreneurs, they have less time and fewer capital- or knowledge-based resources available
to them to develop a differentiated product or service offering (Dencker et al., 2009; Solymossy,
1997). Cost leadership strategies may require less planning and resources than those of differentia-
tion, as in some sectors of the economy and among very small businesses, simply the condition of
low labor costs can bestow firm viability: and those costs can be shaved simply by a founder and
her relatives being willing to work for low wages (Williams, 2008). These conditions may be sig-
nificant drivers of necessity entrepreneurs’ preference for cost leadership over differentiation strate-
gies, each of which requires different skills and capabilities (Miller, 1988; 1990).
Those with special talents, education or significant human capital are often able to sell it on
the labor market and reap significant returns. They are less likely to be forced to start a venture for
lack of a better alternative. By contrast, necessity entrepreneurs with sparse human capital (many of
whom cannot therefore find employment) are unlikely to have the special knowledge, education or
skills needed to design and produce differentiated offerings, for example, via innovative technolo-
gies or designs, or superior quality (Miles & Snow, 1978). They are more likely to be limited to
producing more standard fare, such as that consistent with a low cost strategy. In many industries,
cost leadership requires not special knowledge or advanced equipment, but, especially at the start-
up phase, a willingness for managers and their employees to work for low wages. Simply producing
an item at lower costs than those of a competitor may be the “resource” required to succeed as cost
leadership. By contrast, differentiation strategies, to succeed, require not just ordinary skills – but
those that issue out of high value abilities and resources (Miller, 1988). These may be hard to attain
for individuals whose employment status may attest to a lower level of human capital. Indeed, skill
gaps are confirmed by the comparative backgrounds in education, experience, and skills between
the necessity entrepreneurs and other entrepreneurs in our sample.
However, sometimes there also may be positive resource advantages that accrue to neces-
sity entrepreneurs, and which again lead them to pursue cost leadership. First, necessity entrepre-
6
neurs have demonstrated the courage to start a new venture. They are clearly motivated and deter-
mined. They also must succeed, in many cases, simply to feed themselves and their families. These
are powerful incentives. Moreover, a critical requirement of a cost leadership strategy is an espe-
cially economical cost structure. In the case of small start-up ventures where economies of scale
often are not yet relevant, such a cost structure can be facilitated by a highly motivated founder who
is willing to work for very little and to recruit others in his situation to share the risks and benefits
of the venture. After all, opportunity cost is not much of a constraint for necessity entrepreneurs,
and that same condition might hold for immediate or dependent members of their family.
In short, necessity entrepreneurs may be less able to embrace a differentiation strategy, but
more able and willing to undertake a cost leadership strategy. These arguments lead us to our prin-
cipal hypotheses:
Hypothesis 1: Necessity start-ups are more likely than other start-ups to implement a cost leader-
ship strategy.
Hypothesis 2: Necessity start-ups are less likely than other start-ups to implement a differentiation
strategy.
The rationales for our hypotheses can be linked to differences in observable characteristics
between necessity and other entrepreneurs. For example, we argue that necessity entrepreneurship is
correlated with inferior human capital endowment as measured by education, experience, and entre-
preneurial skills. Our study seeks to understand how much of the differences in strategy choice be-
tween necessity-based start-ups and other start-ups can be attributed to differences in observable
characteristics, i.e. differences in human capital endowment, socio-economic characteristics, and
particularities of the start-up projects.
7
EMPIRICAL ANALYSIS
Sample and variables
We use data from the KfW/ZEW Start-up Panel (KfW/ZEW-Gründungspanel), a unique
data set generated by a large-scale yearly survey of young firms in Germany. The data are collected
by computer-aided telephone interviews (CATI) with the founders. The target group contains newly
founded, legally independent firms that are run by at least one full-time entrepreneur. De-mergers
and subsidiaries are not included.3 We use the first survey wave collected in the year 2008 for our
empirical investigation. The survey provides data on 5,508 firms founded in the period from 2005
to 2007.
The design of the survey offers three advantages for our study. First, survivor bias is kept
at a minimum because the young firms included in the sample are included from their first year of
existence onwards. Second, the panel includes almost all industry sectors4 and is representative of
firms of meaningful size that are able to form an explicit strategy for their market entry. Third, the
respondents have not only answered questions regarding firm specifics, but have also provided per-
sonal information about their start-up motives and the human capital endowment of the founders.
This information is crucial to the analysis of strategy choice.
The competitive strategy of the start-ups is determined by information collected in the
questionnaire about the positioning of firms’ products or services relative to those of the firms’
main competitors. The response options to the question “Which of the following descriptions repre-
sents the ‘customer-value to price ratio’ of your products and services in comparison to your main
competitors” are (1) higher benefit at higher prices, (2) higher benefit at comparable or lower prices,
(3) comparable benefit at comparable prices, (4) lower prices at comparable benefit, and (5) lower
prices for lower benefit. We group the answers into three categories and distinguish cost leadership
and differentiation strategies as follows: Start-ups providing higher benefit offerings regardless of
prices are classified as differentiators. Start-ups offering lower prices regardless of benefits are clas-
3 See Fryges et al. (2010) for a detailed description of the design of the KfW/ZEW Start-up Panel. 4 The only sectors excluded are agriculture, mining and quarrying, electricity, gas and water supply, health care, and the public sector.
8
sified as cost-leaders. Start-ups which do not distinguish themselves from their competitors by
prices or benefit are classified as pursuing a neutral strategy.
We designate low price strategies as cost leadership because unless a firm’s costs are at
least as low as those of the competition, the firm would not be able to survive by offering lower
prices in the competitive markets within which most of the young firms operate.
Using information on founders’ start-up motives, we distinguish necessity-based and other
(non-necessity-based) start-ups as follows: Survey participants answered the question “What was
the main reason for the (members of team of) founders to become self-employed?” The response
options (1) no appropriate alternative in dependent employment and (2) escape from unemployment,
define a necessity-based start-up. All other response options, shown in Table 6 in the appendix, cap-
ture non-necessity motives. 23 % of all start-ups in our sample are classified as necessity-based
start-ups. The definitions of our remaining explanatory variables are reported in Table 6 in the ap-
pendix. Our final sample consists of 4,568 firms that completed the strategy question and responded
to all other items selected for our empirical analysis.
Descriptive statistics: differences between necessity-based and other start-ups
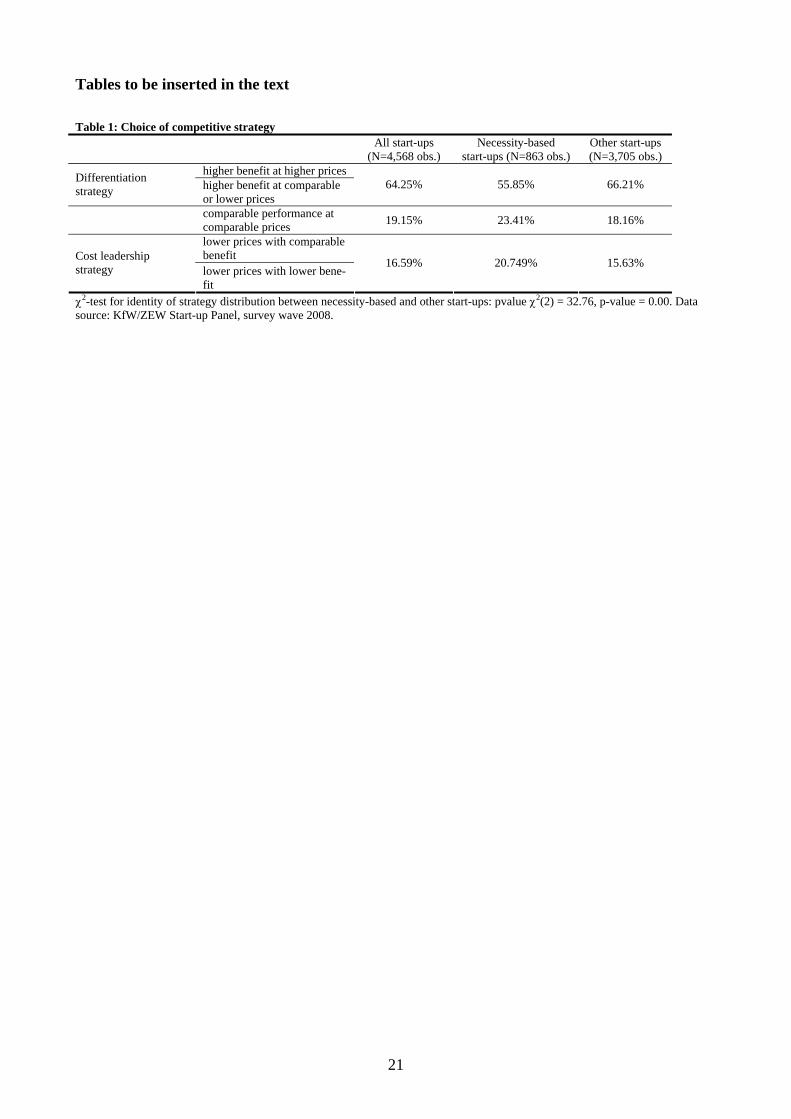
As reported in Table 1, nearly two thirds (64%) of all start-ups are classified as differenti-
ators, 17% are cost leaders, and 19% employ a neutral strategy. What is more, there are marked and
statistically significant differences between necessity-based and other start-ups: necessity-based
start-ups less often pursue a differentiation strategy, and more often pursue a cost leadership strat-
egy. Whereas the share of differentiators is 10 percentage points lower among necessity-based start-
ups than among other start-ups, the share of cost leaders is 5 percentage points higher.
Insert Table 1 here
9
Necessity entrepreneurs also differ from entrepreneurs with other motives with respect to
their socio-demographic attributes and to the characteristics of their start-up projects (see Table 2).
Regarding their endowment with general and specific human capital (Becker, 1964), the evidence is
mixed. For example, necessity entrepreneurs are older and have more industry experience, but they
start from unemployment more often and have less formal education. Moreover, they lack entrepre-
neurial experience, both positive and negative one. On the one hand, their age may accord them
some opportunity to gather resources during their professional life. On the other hand, long industry
experience and the paucity of self-employment experience suggests that their knowledge and skills
are specialized for dependent employment and is perhaps less useful for starting a venture.
In addition, necessity-based start-ups are less labor intensive compared to other start-ups.
They are also less likely than other start-ups to employ staff and form a team of founders. Their
products are less apt to involve market novelty and R&D activity. Necessity-based start-ups also
face more competitors and are mostly active in low-tech sectors, especially construction. These ob-
servations point to market segments with relatively low entry barriers and intense competition.
Insert Table 2 here
Model estimation
Attributes of the entrepreneurs and their start-up projects correlate with the necessity mo-
tive, and all of these factors may influence the choice of strategy. We attempt to disentangle the ef-
fects of the necessity motive and of other characteristics of the entrepreneurs as well as the specifics
of their start-up projects on different strategies. Using probit models, we contrast (I) the differentia-
tion strategy versus any other strategy, and (II) the cost leadership strategy versus any other strategy.
The basic estimation equations are specified as
(1) iiii XNecS εβα ++=* ,
10
where the (latent) strategy choice *iS of start-up Ni ,...,1= is a function of the necessity motive iNec
and observable characteristics iX . To establish the robustness of the estimated effects, we estimate
equation (1) both with and without the necessity motive as an explanatory variable, as well as sepa-
rately for necessity-based and other start-ups. Estimation results are displayed in Tables 3 and 4. 5
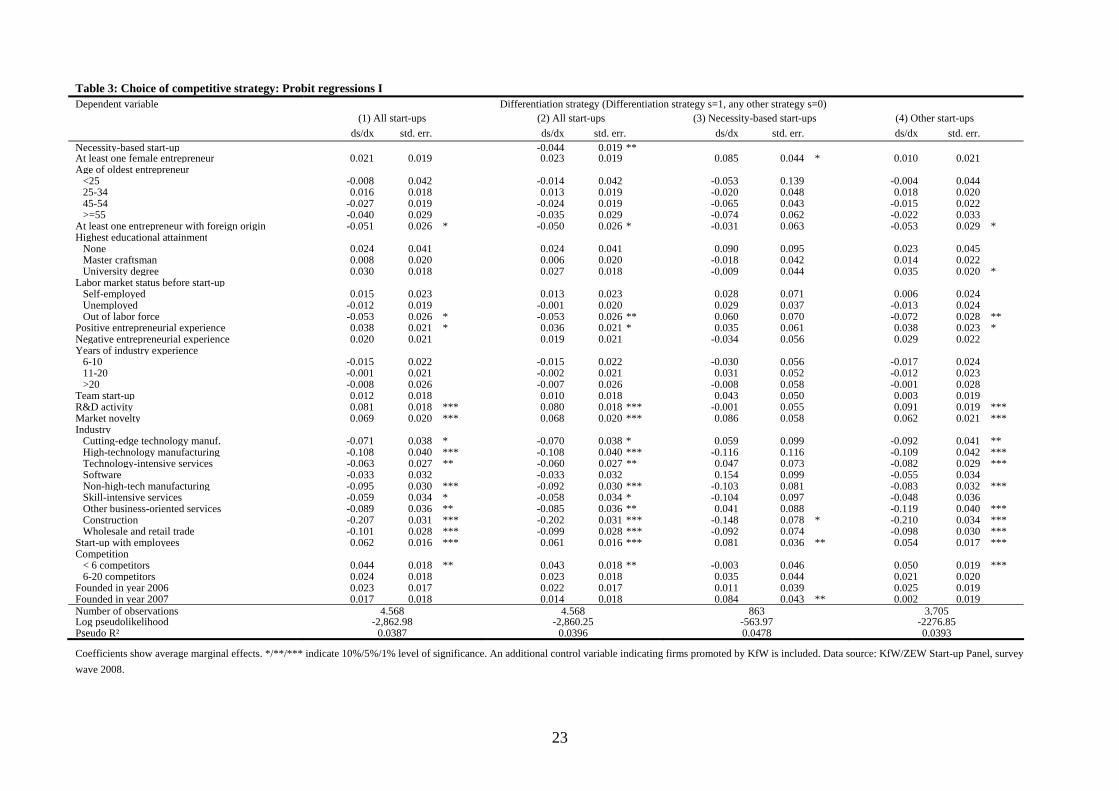
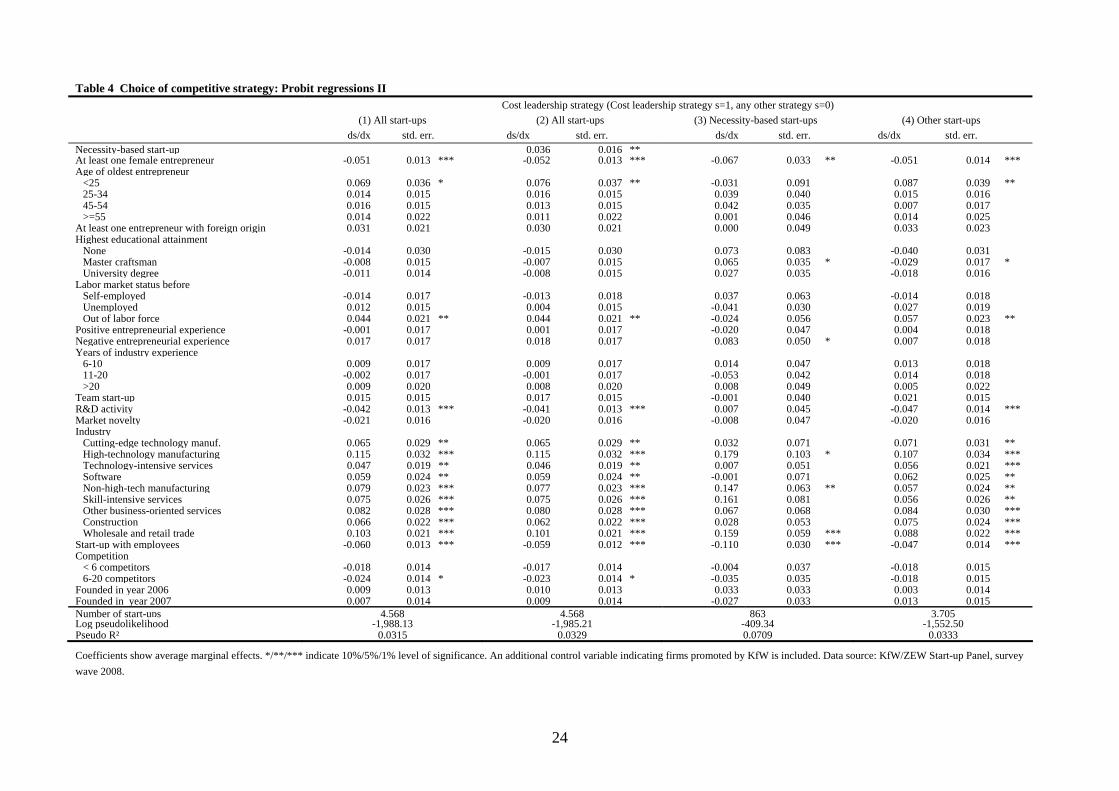
As hypothesized, the necessity motive significantly decreases the probability that an entre-
preneur will choose a differentiation strategy versus a cost leadership or a neutral strategy by four
percentage points, after controlling for start-up properties and socio-demographic characteristics
of the entrepreneurs (columns (1) and (2) of Table 3). Moreover, necessity boosts the likelihood of
cost leadership also by four percentage points compared to other start-up motives, again ceteris
paribus (columns (1) and (2) of Table 4). Signs and magnitudes of the marginal effects of the con-
trol variables iX remain basically unchanged irrespective of whether the necessity motive is in-
cluded in the estimations (columns (2)) or not (columns (1)). This results substantiates the notion
that the necessity motive has an own, direct effect on strategy choice. Hypotheses 1 and 2 are thus
supported.6
The control variables of Tables 3 and 4 suggest that human capital has limited influence on
the strategies chosen by necessity entrepreneurs. We find that human capital as measured by formal
educational attainment, labor market status before start-up, and industry and entrepreneurial experi-
ence has only limited influence on a start-up’s competitive strategy. Only positive entrepreneurial
experience increases the chances of pursuing a differentiation strategy, but the effect is weak. En-
trepreneurs who were out of the labor force before starting their venture have a lower (higher) like-
lihood of a differentiation strategy (cost leadership strategy).
Some properties of the start-up project are correlated with strategy choice. Start-ups intro-
ducing market novelties or engaging in R&D activity show a higher likelihood of a differentiation
5 Using correlation analysis and variance inflation factors (VIFs) we did not find evidence for multicollinearity. 6 Multinomial probit estimations show similar results. The marginal effect of the necessity motive is significantly negative with re-
spect to the differentiation strategy and significantly positive with respect to the cost leadership strategy, with magnitudes of four percentage points. Detailed estimation results are available from the authors upon request.
11
strategy. Tables 3 and 4 further indicate a relationship between start-up strategy and the level of
competition. It appears, for example, that the relationship between the number of competitors and
the likelihood of pursuing a cost leadership strategy is U-shaped. Finally, we find that start-ups with
employees prefer differentiation to cost leadership.
Insert Tables 3 and 4 here
Columns (3) and (4) in Tables 3 and 4 report the results of separate estimations for the
groups of necessity-based and other start-ups. The estimates for the (larger) group of other start-ups
are somewhat more precise (i.e., they have lower standard errors). Yet, overall, the estimated effects
do not differ markedly between the groups of necessity-based and other start-ups.
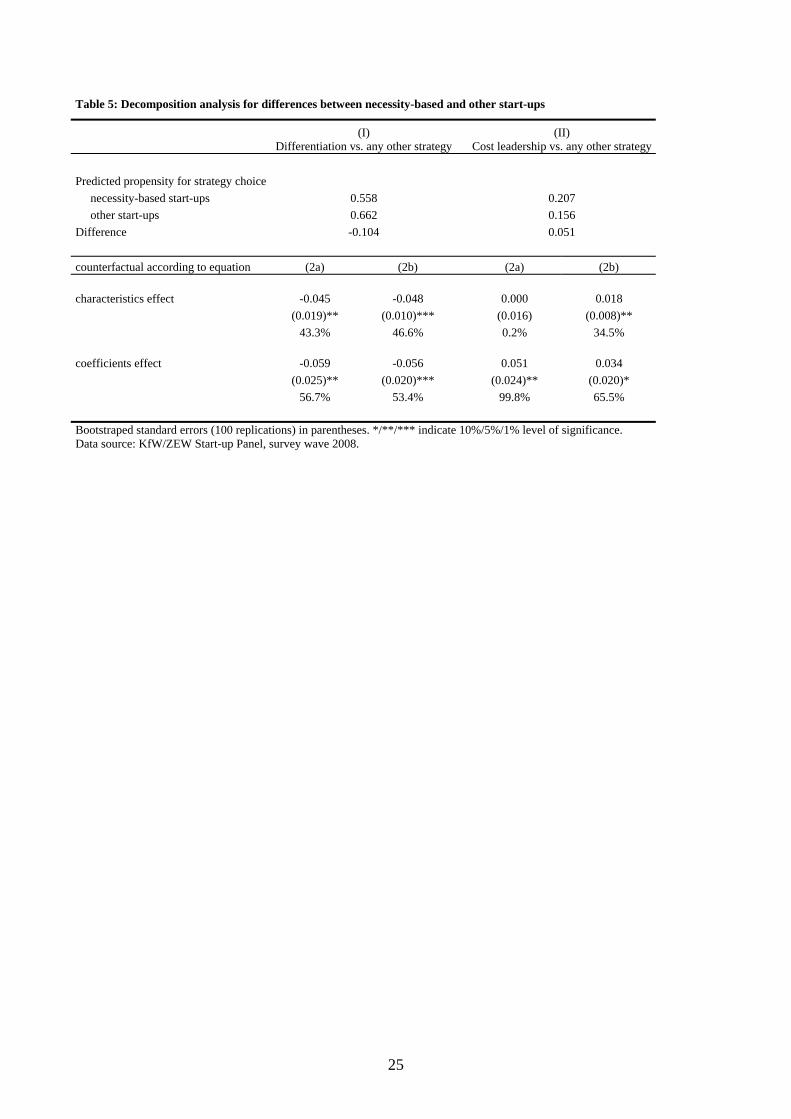
Decomposition analysis
How much of the difference in choice of strategy between necessity-based and other start-
ups is explained by differences in observable characteristics such as entrepreneurs’ human capital
endowment and the specifics of their start-up projects? To answer this question, we employ
Blinder-Oaxaca-type decompositions adapted to the non-linear case.7 Differences in competitive
strategy are decomposed into a ‘characteristics effect’ (also referred to as endowment effect) and a
‘coefficients effect’ (also referred to as behavioral or residual effect):
(2a) 4342143421
effecttscoefficien
nno
effectsticscharacteri
no
ono SSSSSS ˆˆˆˆˆˆ −+−=−
(2b) 4342143421
effecttscoefficien
on
o
effectsticscharacteri
non SSSS ˆˆˆˆ −+−= ,
where mS for necessity-based ( nm = ) and other ( om = ) start-ups are calculated as
7 See Blinder (1973) and Oaxaca (1973). See also Fairlie (1999, 2005) and Bauer and Sinning (2008).
12
(3) ( )∑=
− Φ=mN
i
mmim
m XNS1
1 ˆˆ β
based on the separate probit estimations above.8 The counterfactuals onS and n
oS are easily com-
puted in analogy to equation (3) using the characteristics of one group and the coefficients esti-
mated for the other.
The characteristics effect involves the part of the overall difference in predicted strategy
propensities between necessity-based and other start-ups which can be attributed to differences in
the observable characteristics iX (in our dataset). The coefficients effect captures the residual part
of the overall difference—which is due to differences in estimated coefficients β at given charac-
teristics. The latter also includes differences in the regression constants, i.e. the different baselines
for necessity-based and other start-ups. We run decomposition analyses separately for (I) the likeli-
hood of a differentiation strategy versus any other strategy, and (II) the likelihood of a cost leader-
ship strategy versus any other strategy.
The decompositions (2a) and (2b) differ with respect to the chosen counterfactual strate-
gies mmS~ˆ . In equation (2b), n
oS denotes the prediction for necessity-based start-ups, assuming that
they have the same coefficients as the other start-ups. Equation (2a) uses predictions onS for the
other start-ups based on the coefficients for necessity-based start-ups. We compute both versions to
investigate the sensitivity of the decomposition results.9 Results are displayed in Table 5.
Insert Table 5 here
8 In contrast to the approach pursued by Fairlie (1999, 2005), we do not focus on differences in observed average probabilities
)( no SS − , but rather on projected differences )ˆˆ( no SS − . The advantage of this approach is that the coefficients effect includes
less residual noise. Even though mS and mS resulting from probit estimation are not necessarily identical, their deviation is negli-gible for appropriate model specifications.
9 It is well-known that the decompositions resulting from the different counterfactuals do not necessarily yield identical results. Dif-ferent approaches to the issue of non-uniqueness have been proposed in the literature; see Oaxaca and Ransom (1994) and Silber
13
In decomposition (I), the characteristics effect explains almost one half (43 to 47%) of the
predicted 10 percentage points difference in the propensity to pursue a differentiation strategy. This
result is strikingly stable with respect to the choice of the counterfactuals in (2a) or (2b). In decom-
position (II), the characteristics effect explains up to one third (35 %) of the 5 percentage points dif-
ference in the propensity to pursue a cost leadership strategy, with some more sensitivity with re-
spect to the counterfactuals. In sum, the different endowments of necessity entrepreneurs—e.g.,
their less favorable labor market and entrepreneurial experience—are responsible for a considerable
proportion of the differences in strategy choice.
This notion is corroborated by descriptive evidence in Tables 7 and 8 in the appendix,
which report observable characteristics by strategy status within the groups of necessity-based (Ta-
ble 7) and other start-ups (Table 8). In line with the regression results discussed above, differenti-
ators and cost leaders differ significantly with respect to observable characteristics. However, intra-
group variation among necessity-based start-ups is in many cases lower than the differences be-
tween necessity-based and other start-ups. For example, the share of university graduates ranges
between 25 and 30 % among necessity entrepreneurs (see Table 7), but even gets as high as 46 %
among other start-ups (the range is from 35 to 46 %, see Table 8).
The coefficients effect accounts for the remainder of the differences in predicted propensi-
ties, i.e. for about 5 percentage points—or about one half—in decomposition (I) and 3 to 5 percent-
age points—or at least one third—in decomposition (II). These parts of the differences in strategy
choice are attributed to dissimilar strategic behavior of necessity-based and other start-ups even if
the two groups were identical with respect to the large set of observable characteristics.
and Weber (1999) for surveys. Yet each of the approaches relies on ad-hoc assumptions of some type, so we choose to report the two most prominent cases.
14
Limitations
Both our necessity entrepreneurship and strategy choice variables are self-reported and col-
lected at the same point in time. This could introduce a sort of self-selection bias. It could be that
entrepreneurs who did not have a novel (i.e. differentiating) idea, group themselves as necessity en-
trepreneurs. While our current dataset does not allow us to exclude this potential bias (and threat of
reverse causality) future research could try to solve this problem by relying less on self-reported
information and collecting data at different points in time.
CONCLUDING REMARKS
As a result of the recent economic crisis, necessity entrepreneurship has increased in many
countries. In the US, for example, the share of start-ups founded by necessity entrepreneurs rose
from 16.7% in 2007 to 24.7 % in 2009 (2011: 21.2%) (Kelley, Singer, & Herrington, 2012). In
some European or Asian countries, the numbers are even more impressive (e.g., 29.5 % in Ireland
and 41.4% in the Republic of Korea). Several governments have accelerated this trend by promot-
ing entrepreneurship as a way to escape unemployment (Green, 2013), which is alarmingly high in
many European countries (in particular among the youth). Despite this increased economic and pol-
icy relevance, still too little is known about the competitive offerings and evolution of necessity-
based start-ups.
Our study has addressed this gap by investigating the market entry strategies of necessity-
driven start-ups. Based on an enduring focus of the strategy and start-up literatures, we distinguish
between cost leadership and differentiation strategies. Our empirical results show that necessity-
based start-ups are more likely to pursue a cost leadership strategy and less likely to pursue a differ-
entiation strategy. Even though the necessity motive is linked to a number of observable character-
istics of the entrepreneurs and to various particularities of the start-up projects, it is found to have a
considerable, direct effect on the choice of strategy. Prior research suggests that birth conditions and
early strategic decisions can have lasting effects on the nature of a venture (Baron et al., 1999;
15
Stinchcombe, 1965) and the competiveness of national economies (Porter, 2011). For example,
firms pursuing cost-leadership strategies are shown to have lower growth potential in the long run
compared to other firms, and they are more vulnerable to changes in customer tastes and competi-
tion from producers in developing countries (Bradley et al., 2012; Porter, 2011).
Certainly, necessity entrepreneurs have been less able than other entrepreneurs to carefully
plan and prepare their move into entrepreneurship. By definition, they launch their venture out of
necessity and are driven by external circumstances. They thus have less time or opportunity to
amass or develop the specific resources – the skills, capabilities and connections – needed to pursue
a complex differentiation strategy. Cost leadership strategies seem to be more accessible to those
with few resources. Entrepreneurs who are willing to work for little money, to hire friends and fam-
ily with sparse skills but low wages, and to work long hours, can run an economical operation and
attract clients with low prices. In effect, our necessity entrepreneurs, because of the resource short-
ages they face, may serve as useful subjects for scholars of entrepreneurial bricolage and effectua-
tion – the ability to configure ignored or unrelated qualities into useful strategic assets – to make
something out of nothing (Baker & Nelson, 2005). Indeed, it would be promising to examine how
and when necessity entrepreneurs make a virtue out of their penurious situations by becoming more
ingenious and finding unexplored opportunities (George, 2005). Another interesting avenue of fur-
ther research would be to use other strategy classifications instead of Porter’s classification of com-
petitive strategies. Even though Porter’s classification has been shown to be enormously popular in
the strategy literature, there exist more fine-grained alternatives. Carter et al. (1994), for example,
identify six generic new venture strategies distinguishing along the two dimensions scope of seg-
mentation and product versus marketing emphasis. The use of such a more fine-grained classifica-
tion might allow for more detailed management implications for necessity start-ups.
16
REFERENCES
Acs, Z.J., Varga, A. (2005). Entrepreneurship, Agglomeration and Technological Change. Small
Business Economics, 24(3), 323-334.
Amit, R., Muller, E. (1995). “Push” and “Pull” Entrepreneurship. Journal of Small Business and
Entrepreneurship, 12(4), 64-80.
Baker, T., Nelson, R. E. (2005). Creating Something from Nothing: Resource Construction through
Entrepreneurial Bricolage. Administrative Science Quarterly, 50(3), 329-366.
Barney, J. B. (1991). Firm Resources and Sustained Competitive Advantage. Journal of Manage-
ment, 17(1), 99-120.
Baron, J.N., Hannan, M.T., Burton, M.D. (1999). Building the Iron Cage: Determinants of Manage-
rial Intensity in the Early Years of Organizations. American Sociological Review, 5(2),
239-275.
Bauer, T.K., Sinning, M. (2008). An Extension of the Blinder-Oaxaca Decomposition to Nonlinear
Models. Advances in Statistical Analysis 92, 197-206.
Becker, G.S. (1964). Human Capital: A Theoretical and Empirical Analysis with Special Reference
to Education. University of Chicago Press, Chicago, London, 3rd edn., 1993.
Bergmann, H., Sternberg, R. (2007). The Changing Face of Entrepreneurship in Germany. Small
Business Economics, 28(2/3), 205-221.
Blinder, A. S. (1973). Wage Discrimination: Reduced Form and Structural Estimates. Journal of
Human Resources 8(4), 436–455.
Block, J., Koellinger, P. (2009). I Can’t Get No Satisfaction – Necessity Entrepreneurship and Pro-
cedural Utility. Kyklos, 62(1), 191-209.
Block, J., Sandner, P. (2009). Necessity and Opportunity Entrepreneurs and their Duration in Self-
Employment: Evidence from German Micro Data. Journal of Industry, Competition and
Trade, 9(2), 117-137.
17
Block, J., Wagner, M. (2010). Necessity and Opportunity Entrepreneurs in Germany: Characteris-
tics and Earnings Differentials. Schmalenbach Business Review, 62(2), 154-174.
Burton, M.D., Beckman, C.M. (2007). Leaving a Legacy: Position Imprints and Successor Turnover
in Young Firms. American Sociological Review, 72(2), 239-266.
Carter, N.M., Stearns, T.M., Reynolds, P.D., Miller, B.A. (1994). New Venture Strategies: Theory
Development with an Empirical Base. Strategic Management Journal, 15(1), 21-41.
Cooper, A., Dunkelberg, W. (1986). Entrepreneurship and Paths to Business Ownership. Strategic
Management Journal, 7(1), 53-68.
Covin, J.G., Slevin, D.P. (1990). New Venture Strategic Posture, Structure, and Performance: An
Industry Life Cycle Analysis. Journal of Business Venturing, 5(2), 123-135.
Dahl, M.S., Sorenson, O. (2012). Home Sweet Home: Entrepreneurs’ Location Choices and the Per-
formance of their Ventures. Management Science, 58(6), 1059-1071.
Dencker, J.C., Gruber, M., Shah, S.K. (2009). Individual and Opportunity Factors Influencing Job
Creation in New Firms. Academy of Management Journal, 52(6), 1125-147.
Fairlie, R.W. (1999). The Absence of the African-American Owned Business: An Analysis of the
Dynamics of Self-Employment. Journal of Labor Economics 17(1), 80–108.
Fairlie, R.W. (2005). An Extension of the Blinder-Oaxaca Decomposition Technique to Logit and
Probit Models. Journal of Economic and Social Measurement 30, 305–316.
Fern, M. J., Cardinal, L., O’Neill, H.M. (2012). The Genesis of Strategy in New Ventures: Escaping
the Constraints of Founder and Team Knowledge. Strategic Management Journal, 33(4),
427-447.
Fryges, H., Gottschalk, S., Kohn, K. (2010). The KfW/ZEW Start-up Panel: Design and Research
Potential. Schmollers Jahrbuch/Journal of Applied Social Sciences Studies, 130(1), 117-
131.
George, G. (2005). Slack resources and the Performance of Privately Held Firms. Academy of Man-
agement Journal, 48(4), 661-676.
18
Green, F. (2013). Youth entrepreneurship. A background paper for the OECD Centre for Entrepre-
neurship, SMEs and Local Development.
http://www.oecd.org/cfe/leed/youth_bp_finalt.pdf, accessed May 18, 2014.
Gohmann, S.F., Fernandez, J.M. (in press). Proprietorship and unemployment in the United States.
Journal of Business Venturing. http://dx.doi.org/10.1016/j.jbusvent.2013.02.003.
Hannan, M. T., Freeman, J. (1984). Structural Inertia and Organizational Change. American Socio-
logical Review, 49(2), 149-164.
Hechavarria, D., Reynolds, P. (2009). Cultural Norms & Business Start-ups: the Impact of National
Values on Opportunity and Necessity Entrepreneurs. International Entrepreneurship and
Management Journal, 5(4), 417-437.
Helfat, C.E., Lieberman, M.B. (2002). The Birth of Capabilities: Market Entry and the Importance
of Pre-history. Industrial & Corporate Change, 11(4), 725-760.
Kautonen, T., Palmroos, J. (2010). The Impact of a Necessity-based Start-up on Subsequent Entre-
preneurial Satisfaction. International Entrepreneurship and Management Journal, 6(3),
285-300.
Kelley, D.J., Singer, S., Herrington, M. (2012). The Global Entrepreneurship Monitor. 2011 Global
Report. The Global Entrepreneurship Research Association.
Maritz, A. (2004). New Zealand Necessity Entrepreneurs. International Journal of Entrepreneur-
ship and Small Business, 3(1), 255-264.
McDougall, P., Robinson, R.B. (1990). New Venture Strategies: an Empirical Identification of
Eight ‘Archetypes’ of Competitive Strategies for Entry. Strategic Management Journal,
11(6), 447-467.
Miller, D. (1988). The Relationship of Porter's Business Strategies to Environment and Structure.
Academy of Management Journal, 31(2), 280-308.
Miller, D. (1990). The Icarus Paradox. NY: Harper Business.
19
Miles, R.E., Snow, C.C. (1978). Organizational Strategy, Structure, and Process. McGraw-Hill,
new York.
Oaxaca, R. (1973). Male-Female Wage Differentials in Urban Labor Markets. International Eco-
nomic Review 14, 693–709.
Oaxaca, R., Ransom, M. (1994). On Discrimination and the Decomposition of Wage Differentials.
Journal of Econometrics 61, 5–21.
Ostgaard, T.A., Birley, S. (1994). Personal Networks and Firm Competitive Strategy—A Strategic
of Coincidental Match? Journal of Business Venturing, 9(4), 281-305.
Porter, M.E. (1980). Competitive Strategy—Techniques for Analyzing Industries and Competitors.
Free Press, New York.
Porter, M.E. (2011). The Competitive Advantage of Nations. Free Press, New York.
Reynolds, P.D., Bosma, N., Autio, E., Hunt, S, Bono, N. de, Servais, I., Lopez-Garcia, P., Chin, N.
(2005). Global Entrepreneurship Monitor: Data Collection Design and Implementation
1998-2003. Small Business Economics, 24(3), 205-231.
Silber, J., Weber, M. (1999). Labour Market Discrimination: Are There Significant Differences Be-
tween the Various Decomposition Procedures? Applied Economics, 31(3), 359-365.
Solymossy, E. (1997). Push/Pull Motivation: Does it Matter in Terms of Venture Performance?, in:
Reynolds, Paul, William D. Bygrave, Nancy C. Carter, S. Manigart, C. Mason, G. Meyer,
and K. Shaver (eds.), Frontiers of Entrepreneurship Research. Babson Park: Babson Col-
lege, 204-217.
Sørensen, J.B. (2007). Bureaucracy and Entrepreneurship: Workplace Effects on Entrepreneurial
Entry. Administrative Science Quarterly, 52(3), 387-412.
Sørensen, J.B., Fassioto, M.A. (2011). Organizations as Fonts of Entrepreneurship. Organization
Science, 22(5), 1322-1331.
Stinchcombe, A. L. (1965). Organizations and Social Structure. Handbook of Organizations, 44(2),
142-193.

20
Thornton, P. H. (1999). The Sociology of Entrepreneurship. Annual Review of Sociology, 25, 19-46.
Williams, C.C. (2008). Beyond Necessity-driven Versus Opportunity-driven Entrepreneurship. A
Study of Informal Entrepreneurs in England, Russia and Ukraine. The International Jour-
nal of Entrepreneurship and Innovation, 9(3), 157-165.
Wong, P.K., Ho, Y.P., Autio, E. (2005). Entrepreneurship, Innovation and Economic Growth: Evi-
dence from GEM data. Small Business Economics, 24(3), 335-350.
21
Tables to be inserted in the text
Table 1: Choice of competitive strategy All start-ups
(N=4,568 obs.) Necessity-based
start-ups (N=863 obs.) Other start-ups (N=3,705 obs.)
higher benefit at higher prices Differentiation strategy higher benefit at comparable
or lower prices 64.25% 55.85% 66.21%
comparable performance at comparable prices 19.15% 23.41% 18.16%
lower prices with comparable benefit Cost leadership
strategy lower prices with lower bene-fit
16.59% 20.749% 15.63%
χ2-test for identity of strategy distribution between necessity-based and other start-ups: pvalue χ2(2) = 32.76, p-value = 0.00. Data source: KfW/ZEW Start-up Panel, survey wave 2008.
22
Table 2: Descriptive statistics: Necessity-based versus other start-ups
All start-ups Necessity-
based start-ups Other
start-ups Significance a)
of (2)-(3)
(1) (2) (3) (4)
At least one female entrepreneur 18.32 19.70 18.00 Age of oldest entrepreneur
< 25 3.44 1.39 3.91 *** 25–34 27.17 20.63 28.69 *** 35–44 38.11 38.01 38.14 45–54 22.85 29.43 21.32 *** >= 55 8.43 10.54 7.94 **
At least one entrepreneur with foreign origin 8.54 8.46 8.56 Highest educational attainment
None 3.31 3.01 3.37 Vocational training 32.62 42.99 30.20 *** Master craftsman 24.17 26.19 23.70 University degree 39.91 27.81 42.73 ***
Labor market status before start-up Employees 52.98 45.19 54.79 *** Self-employed 19.09 7.18 21.86 *** Unemployed 17.73 40.56 12.42 *** Out of labor force 10.20 7.07 10.93 ***
Positive entrepreneurial experience 21.08 9.85 23.70 *** Negative entrepreneurial experience 14.05 11.01 14.76 *** Years of industry experience
<= 5 18.85 18.19 19.00 6–10 23.38 18.66 24.48 *** 11–20 37.30 35.23 37.79 > 20 20.47 27.93 18.73 ***
Team start-up 26.90 15.06 29.66 *** R&D activity 24.19 13.09 26.77 *** Market novelty 16.29 10.20 17.71 *** Industry
Cutting-edge technology manufacturing 5.49 4.75 5.67 High-technology manufacturing 4.88 3.36 5.24 *** Technology-intensive services 20.93 22.48 20.57 Software 9.02 3.94 10.20 *** Non-high-tech manufacturing 10.79 11.24 10.69 Skill-intensive services 6.96 5.45 7.31 ** Other business-oriented services 5.74 7.07 5.43 * Consumer-oriented services 10.44 7.76 11.07 *** Construction 11.87 18.19 10.39 *** Wholesale and retail trade 13.88 15.76 13.44 *
Start-up with employees 63.11 53.77 65.29 *** Number of competitors
< 6 23.95 17.61 25.43 *** 6–20 20.69 19.93 20.86 > 20 55.36 62.46 53.71 ***
Year of foundation 2005 32.18 38.24 30.77 *** 2006 36.06 35.57 36.17 2007 31.76 26.19 33.06 ***
Number of start-ups 4,568 863 3,705
Shares of start-ups in percent. a) χ2-tests for identity of shares between necessity-based and other start-ups. */**/*** indicate 10%/5%/1% level of significance. Data source: KfW/ZEW Start-up Panel, survey wave 2008.
23
Table 3: Choice of competitive strategy: Probit regressions I Dependent variable Differentiation strategy (Differentiation strategy s=1, any other strategy s=0)
(1) All start-ups (2) All start-ups (3) Necessity-based start-ups (4) Other start-ups ds/dx std. err. ds/dx std. err. ds/dx std. err. ds/dx std. err.
Necessity-based start-up -0.044 0.019 ** At least one female entrepreneur 0.021 0.019 0.023 0.019 0.085 0.044 * 0.010 0.021 Age of oldest entrepreneur
<25 -0.008 0.042 -0.014 0.042 -0.053 0.139 -0.004 0.044 25-34 0.016 0.018 0.013 0.019 -0.020 0.048 0.018 0.020 45-54 -0.027 0.019 -0.024 0.019 -0.065 0.043 -0.015 0.022 >=55 -0.040 0.029 -0.035 0.029 -0.074 0.062 -0.022 0.033
At least one entrepreneur with foreign origin -0.051 0.026 * -0.050 0.026 * -0.031 0.063 -0.053 0.029 * Highest educational attainment
None 0.024 0.041 0.024 0.041 0.090 0.095 0.023 0.045 Master craftsman 0.008 0.020 0.006 0.020 -0.018 0.042 0.014 0.022 University degree 0.030 0.018 0.027 0.018 -0.009 0.044 0.035 0.020 *
Labor market status before start-up Self-employed 0.015 0.023 0.013 0.023 0.028 0.071 0.006 0.024 Unemployed -0.012 0.019 -0.001 0.020 0.029 0.037 -0.013 0.024 Out of labor force -0.053 0.026 * -0.053 0.026 ** 0.060 0.070 -0.072 0.028 **
Positive entrepreneurial experience 0.038 0.021 * 0.036 0.021 * 0.035 0.061 0.038 0.023 * Negative entrepreneurial experience 0.020 0.021 0.019 0.021 -0.034 0.056 0.029 0.022 Years of industry experience
6-10 -0.015 0.022 -0.015 0.022 -0.030 0.056 -0.017 0.024 11-20 -0.001 0.021 -0.002 0.021 0.031 0.052 -0.012 0.023 >20 -0.008 0.026 -0.007 0.026 -0.008 0.058 -0.001 0.028
Team start-up 0.012 0.018 0.010 0.018 0.043 0.050 0.003 0.019 R&D activity 0.081 0.018 *** 0.080 0.018 *** -0.001 0.055 0.091 0.019 *** Market novelty 0.069 0.020 *** 0.068 0.020 *** 0.086 0.058 0.062 0.021 *** Industry
Cutting-edge technology manuf. -0.071 0.038 * -0.070 0.038 * 0.059 0.099 -0.092 0.041 ** High-technology manufacturing -0.108 0.040 *** -0.108 0.040 *** -0.116 0.116 -0.109 0.042 *** Technology-intensive services -0.063 0.027 ** -0.060 0.027 ** 0.047 0.073 -0.082 0.029 *** Software -0.033 0.032 -0.033 0.032 0.154 0.099 -0.055 0.034 Non-high-tech manufacturing -0.095 0.030 *** -0.092 0.030 *** -0.103 0.081 -0.083 0.032 *** Skill-intensive services -0.059 0.034 * -0.058 0.034 * -0.104 0.097 -0.048 0.036 Other business-oriented services -0.089 0.036 ** -0.085 0.036 ** 0.041 0.088 -0.119 0.040 *** Construction -0.207 0.031 *** -0.202 0.031 *** -0.148 0.078 * -0.210 0.034 *** Wholesale and retail trade -0.101 0.028 *** -0.099 0.028 *** -0.092 0.074 -0.098 0.030 ***
Start-up with employees 0.062 0.016 *** 0.061 0.016 *** 0.081 0.036 ** 0.054 0.017 *** Competition
< 6 competitors 0.044 0.018 ** 0.043 0.018 ** -0.003 0.046 0.050 0.019 *** 6-20 competitors 0.024 0.018 0.023 0.018 0.035 0.044 0.021 0.020
Founded in year 2006 0.023 0.017 0.022 0.017 0.011 0.039 0.025 0.019 Founded in year 2007 0.017 0.018 0.014 0.018 0.084 0.043 ** 0.002 0.019 Number of observations 4.568 4.568 863 3,705Log pseudolikelihood -2,862.98 -2,860.25 -563.97 -2276.85Pseudo R² 0.0387 0.0396 0.0478 0.0393
Coefficients show average marginal effects. */**/*** indicate 10%/5%/1% level of significance. An additional control variable indicating firms promoted by KfW is included. Data source: KfW/ZEW Start-up Panel, survey wave 2008.
24
Table 4 Choice of competitive strategy: Probit regressions II Cost leadership strategy (Cost leadership strategy s=1, any other strategy s=0) (1) All start-ups (2) All start-ups (3) Necessity-based start-ups (4) Other start-ups ds/dx std. err. ds/dx std. err. ds/dx std. err. ds/dx std. err.
Necessity-based start-up 0.036 0.016 ** At least one female entrepreneur -0.051 0.013 *** -0.052 0.013 *** -0.067 0.033 ** -0.051 0.014 *** Age of oldest entrepreneur
<25 0.069 0.036 * 0.076 0.037 ** -0.031 0.091 0.087 0.039 ** 25-34 0.014 0.015 0.016 0.015 0.039 0.040 0.015 0.016 45-54 0.016 0.015 0.013 0.015 0.042 0.035 0.007 0.017 >=55 0.014 0.022 0.011 0.022 0.001 0.046 0.014 0.025
At least one entrepreneur with foreign origin 0.031 0.021 0.030 0.021 0.000 0.049 0.033 0.023 Highest educational attainment
None -0.014 0.030 -0.015 0.030 0.073 0.083 -0.040 0.031 Master craftsman -0.008 0.015 -0.007 0.015 0.065 0.035 * -0.029 0.017 * University degree -0.011 0.014 -0.008 0.015 0.027 0.035 -0.018 0.016
Labor market status before Self-employed -0.014 0.017 -0.013 0.018 0.037 0.063 -0.014 0.018 Unemployed 0.012 0.015 0.004 0.015 -0.041 0.030 0.027 0.019 Out of labor force 0.044 0.021 ** 0.044 0.021 ** -0.024 0.056 0.057 0.023 **
Positive entrepreneurial experience -0.001 0.017 0.001 0.017 -0.020 0.047 0.004 0.018 Negative entrepreneurial experience 0.017 0.017 0.018 0.017 0.083 0.050 * 0.007 0.018 Years of industry experience
6-10 0.009 0.017 0.009 0.017 0.014 0.047 0.013 0.018 11-20 -0.002 0.017 -0.001 0.017 -0.053 0.042 0.014 0.018 >20 0.009 0.020 0.008 0.020 0.008 0.049 0.005 0.022
Team start-up 0.015 0.015 0.017 0.015 -0.001 0.040 0.021 0.015 R&D activity -0.042 0.013 *** -0.041 0.013 *** 0.007 0.045 -0.047 0.014 *** Market novelty -0.021 0.016 -0.020 0.016 -0.008 0.047 -0.020 0.016 Industry
Cutting-edge technology manuf. 0.065 0.029 ** 0.065 0.029 ** 0.032 0.071 0.071 0.031 ** High-technology manufacturing 0.115 0.032 *** 0.115 0.032 *** 0.179 0.103 * 0.107 0.034 *** Technology-intensive services 0.047 0.019 ** 0.046 0.019 ** 0.007 0.051 0.056 0.021 *** Software 0.059 0.024 ** 0.059 0.024 ** -0.001 0.071 0.062 0.025 ** Non-high-tech manufacturing 0.079 0.023 *** 0.077 0.023 *** 0.147 0.063 ** 0.057 0.024 ** Skill-intensive services 0.075 0.026 *** 0.075 0.026 *** 0.161 0.081 0.056 0.026 ** Other business-oriented services 0.082 0.028 *** 0.080 0.028 *** 0.067 0.068 0.084 0.030 *** Construction 0.066 0.022 *** 0.062 0.022 *** 0.028 0.053 0.075 0.024 *** Wholesale and retail trade 0.103 0.021 *** 0.101 0.021 *** 0.159 0.059 *** 0.088 0.022 ***
Start-up with employees -0.060 0.013 *** -0.059 0.012 *** -0.110 0.030 *** -0.047 0.014 *** Competition
< 6 competitors -0.018 0.014 -0.017 0.014 -0.004 0.037 -0.018 0.015 6-20 competitors -0.024 0.014 * -0.023 0.014 * -0.035 0.035 -0.018 0.015
Founded in year 2006 0.009 0.013 0.010 0.013 0.033 0.033 0.003 0.014 Founded in year 2007 0.007 0.014 0.009 0.014 -0.027 0.033 0.013 0.015 Number of start-ups 4,568 4,568 863 3,705Log pseudolikelihood -1,988.13 -1,985.21 -409.34 -1,552.50Pseudo R² 0.0315 0.0329 0.0709 0.0333
Coefficients show average marginal effects. */**/*** indicate 10%/5%/1% level of significance. An additional control variable indicating firms promoted by KfW is included. Data source: KfW/ZEW Start-up Panel, survey wave 2008.
25
Table 5: Decomposition analysis for differences between necessity-based and other start-ups
(I) Differentiation vs. any other strategy
(II) Cost leadership vs. any other strategy
Predicted propensity for strategy choice necessity-based start-ups 0.558 0.207 other start-ups 0.662 0.156 Difference -0.104 0.051 counterfactual according to equation (2a) (2b) (2a) (2b) characteristics effect -0.045 -0.048 0.000 0.018 (0.019)** (0.010)*** (0.016) (0.008)** 43.3% 46.6% 0.2% 34.5% coefficients effect -0.059 -0.056 0.051 0.034
(0.025)** (0.020)*** (0.024)** (0.020)* 56.7% 53.4% 99.8% 65.5%
Bootstraped standard errors (100 replications) in parentheses. */**/*** indicate 10%/5%/1% level of significance. Data source: KfW/ZEW Start-up Panel, survey wave 2008.
26
Appendix Table 6: Definition of variables
Variable Operationalization in the questionnaire
Strategy of market entry
Which of the following five brief descriptions represents the ‘customer-value to price ratio’ of your products and services in comparison to your main competitors? [Answers: (1) higher benefit at higher prices, (2) higher benefit at comparable or lower prices, (3) comparable benefit at compa-rable prices, (4) lower prices at comparable benefit, (5) lower prices for lower benefit]
Necessity-based start-up What was the main reason for the (members of the team of) founders to become self-employed? [Necessity motives include the following answers: (1) no appropriate alternative in dependent employment, (2) escape from unemployment. Answers classifying non-necessity start-ups: (3) working self-determinedly, (4) realization of a specific business idea, (5) discovery of a market niche, (6) enforcement by a former employer, (7) tax advantages.]
At least one female entrepre-neur
Is the founder male or female? / How many of the founders are female?
Age of the oldest entrepreneur (in years)
In which year was the founder born? / Please indicate the age of each of the founders.
At least on entrepreneur with foreign origin
Which national origin does (do) the founder(s) have?
Highest educational attain-ment
Which is the highest professional qualification that the founder(s) has (have) acquired? [Tertiary education institutions comprise technical colleges, full universities, and doctoral programs.]
Labor market status before start-up
What was the employment situation of the founder(s) at the time of or immediately before the business start-up? If more than one answer applies, please choose the most suitable. [Answers: self-employed, employed by a private enterprise, employed by a public enterprise/in public ser-vices, unemployed, neither employed nor unemployed]
Positive entrepreneurial ex-perience
Has (one of) the founder(s) already founded one or more firms before the recent start-up? What happened to those firms? [Answers: old firm continues to exist, was handed over to a family member or a successor, or was sold.]
Negative entrepreneurial ex-perience
Has (one of) the founder(s) already founded one or more firms before the recent start-up? What happened to these firms? [Answers: old firm closed due to insolvency, closed without insolvency proceedings. Positive and negative experience are non-exclusive.]
Years of industry experience How many years of work experience in the industry of the start-up has got the founder (with the longest industry experience) up until now?
Team start-up Was your firm set up by one single founder or by a team of several founders, owners, or share-holders?
Start-up with employees How many employees worked in your firm by 31/12/200X? [Information transformed into a dummy variable whether the start-up employs staff or not.]
R&D activity Does your enterprise do research and development—be it continuously or occasionally? [Answers: yes, continuously; yes, occasionally; no]
Market novelty Let us take a look at the whole range of products and services of your firm. Are there any products or services that you were the first to introduce to the—regional, national, or world-wide—market?
Industry Not asked during the interview. Categorization determined by sampling. Competition Please assess the number of your—domestic or foreign—competitors in your main market (for
your product or service with the highest turnover). [Answers: less than 6 main competitors, 6 to 20 competitors, more than 20 competitors.]
Year of foundation In which year was your firm established? [Specify the initial founding year, not a mere change of ownership, name, or legal form.]
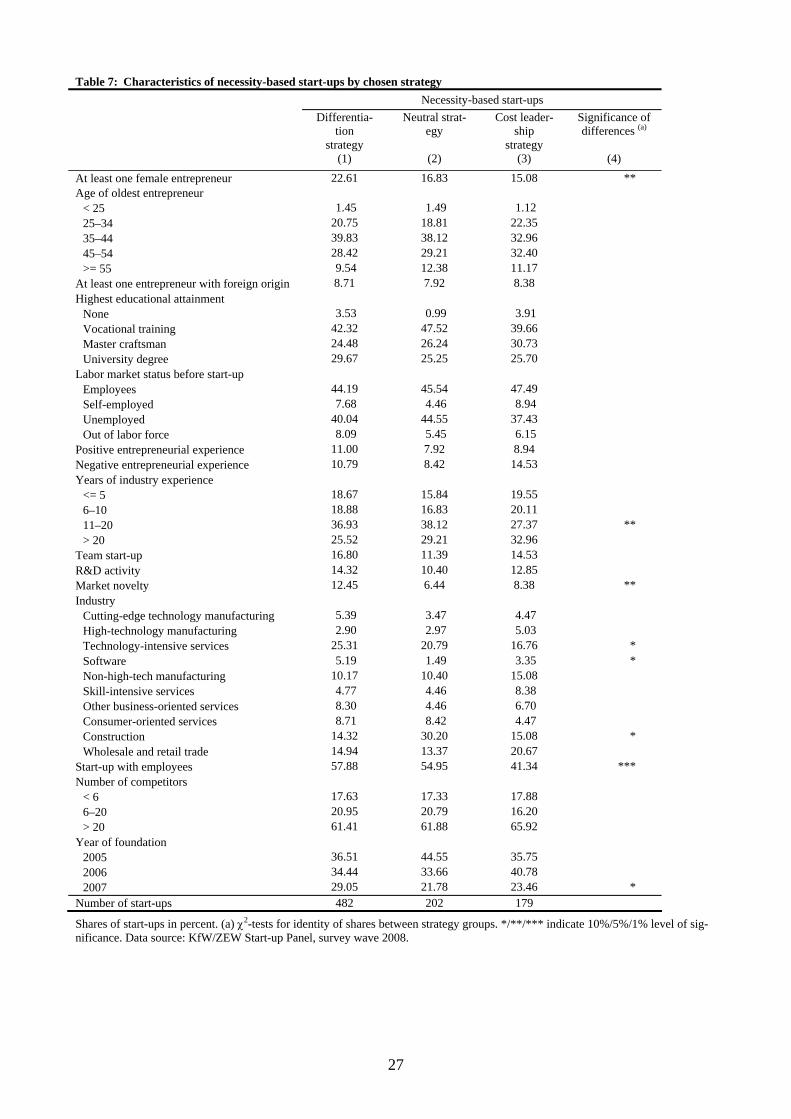
27
Table 7: Characteristics of necessity-based start-ups by chosen strategy Necessity-based start-ups
Differentia-
tion strategy
Neutral strat-egy
Cost leader-ship
strategy
Significance of differences (a)
(1) (2) (3) (4)
At least one female entrepreneur 22.61 16.83 15.08 ** Age of oldest entrepreneur
< 25 1.45 1.49 1.12 25–34 20.75 18.81 22.35 35–44 39.83 38.12 32.96 45–54 28.42 29.21 32.40 >= 55 9.54 12.38 11.17
At least one entrepreneur with foreign origin 8.71 7.92 8.38 Highest educational attainment
None 3.53 0.99 3.91 Vocational training 42.32 47.52 39.66 Master craftsman 24.48 26.24 30.73 University degree 29.67 25.25 25.70
Labor market status before start-up Employees 44.19 45.54 47.49 Self-employed 7.68 4.46 8.94 Unemployed 40.04 44.55 37.43 Out of labor force 8.09 5.45 6.15
Positive entrepreneurial experience 11.00 7.92 8.94 Negative entrepreneurial experience 10.79 8.42 14.53 Years of industry experience
<= 5 18.67 15.84 19.55 6–10 18.88 16.83 20.11 11–20 36.93 38.12 27.37 ** > 20 25.52 29.21 32.96
Team start-up 16.80 11.39 14.53 R&D activity 14.32 10.40 12.85 Market novelty 12.45 6.44 8.38 ** Industry
Cutting-edge technology manufacturing 5.39 3.47 4.47 High-technology manufacturing 2.90 2.97 5.03 Technology-intensive services 25.31 20.79 16.76 * Software 5.19 1.49 3.35 * Non-high-tech manufacturing 10.17 10.40 15.08 Skill-intensive services 4.77 4.46 8.38 Other business-oriented services 8.30 4.46 6.70 Consumer-oriented services 8.71 8.42 4.47 Construction 14.32 30.20 15.08 * Wholesale and retail trade 14.94 13.37 20.67
Start-up with employees 57.88 54.95 41.34 *** Number of competitors
< 6 17.63 17.33 17.88 6–20 20.95 20.79 16.20 > 20 61.41 61.88 65.92
Year of foundation 2005 36.51 44.55 35.75 2006 34.44 33.66 40.78 2007 29.05 21.78 23.46 *
Number of start-ups 482 202 179
Shares of start-ups in percent. (a) χ2-tests for identity of shares between strategy groups. */**/*** indicate 10%/5%/1% level of sig-nificance. Data source: KfW/ZEW Start-up Panel, survey wave 2008.

28
Table 8: Characteristics of other (non-necessity-based) start-ups by chosen strategy Non-necessity-based start-ups
Differentia-
tion strategy
Neutral strat-egy
Cost leader-ship
strategy
Significance of differences (a)
(1) (2) (3) (4)
At least one female entrepreneur 18.43 20.51 13.30 *** Age of oldest entrepreneur
< 25 3.51 2.97 6.74 *** 25–34 28.25 27.93 31.43 35–44 38.28 40.27 35.06 45–54 21.81 21.40 19.17 >= 55 8.15 7.43 7.60
At least one entrepreneur with foreign origin 8.28 8.62 9.67 Highest educational attainment
None 3.30 3.27 3.80 Vocational training 28.74 32.39 33.85 ** Master craftsman 22.46 29.12 22.63 *** University degree 45.50 35.22 39.72 ***
Labor market status before start-up Employed 54.38 58.25 52.50 * Self-employed 23.93 17.83 17.79 *** Unemployed 11.74 12.93 14.68 Out of labor force 9.95 11.00 15.03 ***
Positive entrepreneurial experience 26.05 17.68 20.73 *** Negative entrepreneurial experience 15.61 11.89 14.51 ** Years of industry experience
<= 5 19.04 17.68 20.38 6–10 24.50 23.18 25.91 11–20 37.63 39.23 36.79 > 20 18.83 19.91 16.93
Team start-up 31.47 24.22 28.32 *** R&D activity 30.98 17.38 19.86 *** Market novelty 20.38 11.29 13.82 *** Industry
Cutting-edge technology manufacturing 5.91 5.20 5.18 High-technology manufacturing 5.42 4.16 5.70 Technology-intensive services 20.46 19.91 21.76 Software 11.05 6.84 10.54 Non-high-tech manufacturing 10.97 10.70 9.50 *** Skill-intensive services 7.70 5.94 7.25 Other business-oriented services 5.06 6.09 6.22 Consumer-oriented services 12.60 9.81 6.04 Construction 7.91 18.13 11.92 *** Wholesale and retail trade 12.92 13.22 15.89 ***
Start-up with employees 68.20 63.15 55.44 *** Number of competitors
< 6 27.97 19.61 21.42 *** 6–20 20.99 21.84 19.17 > 20 51.04 58.54 59.41 ***
Year of foundation 2005 30.37 33.43 29.36 2006 37.06 33.28 35.75 2007 32.57 33.28 34.89
Number of start-ups 2,453 673 579
Shares of start-ups in percent. (a) χ2-tests for identity of shares between strategy groups. */**/*** indicate 10%/5%/1% level of sig-nificance. Data source: KfW/ZEW Start-up Panel, survey wave 2008.


![Review Article - Hindawi Publishing Corporationdownloads.hindawi.com/journals/apm/2011/984683.pdfstrategy to combat sarcopenia by stimulating hypertrophy and increasing strength [17]](https://img.pdfslide.net/doc/110x75/5f0558a97e708231d41282f3/review-article-hindawi-publishing-strategy-to-combat-sarcopenia-by-stimulating.jpg)