Embed Size (px)
Citation preview
Journal of Personality and Social Psychology Copyright 1998 by the American Psychological Association, Inc. 1998, Vol. 75, No. 4, 887-900 0022-3514/98/$3.00
Negative Information Weighs More Heavily on the Brain: The Negativity Bias in Evaluative Categorizations
T i f f a n y A. Ito, Je f f T. La r sen , N. K y l e Smi th , a nd John T. C a c i o p p o Ohio State University
Negative information tends to influence evaluations more strongly than comparably extreme positive information. To test whether this negativity bias operates at the evaluative categorization stage, the authors recorded event-related brain potentials (ERPs), which are more sensitive to the evaluative categorization than the response output stage, as participants viewed positive, negative, and neutral pictures. Results revealed larger amplitude late positive brain potentials during the evaluative categori- zation of (a) positive and negative stimuli as compared with neutral stimuli and (b) negative as compared with positive stimuli, even though both were equally probable, evaluatively extreme, and arousing. These results provide support for the hypothesis that the negativity bias in affective pro- cessing occurs as early as the initial categorization into valence classes.
A growing catalog of errors, biases, and asymmetries points to the conclusion that negative information more strongly influ- ences people's evaluations than comparably extreme positive information (Kanouse & Hansen, 1971; Peeters & Czapinski, 1990; Skowronski & Carlston, 1989). Impression formation is one area in which this is especially evident. In an illustrative study, Anderson (1965) found that evaluations of people de- scribed by multiple positive traits of differing extremity fol- lowed an averaging rule. The evaluation of such a person was similar to the average of the evaluations that had been given to people possessing each of the positive traits in isolation. By contrast, the evaluation of a person described by multiple nega- tive traits of differing extremity was less favorable than expected from an averaging model. This suggests that negative traits are given greater weight in overall evaluations than are positive traits (see also Birnbaum, 1972; Feldman, 1966; Fiske, 1980; Hodges, 1974). A greater weighting for negative information than positive information can also be seen in risk-taking re- search, where the axiom that losses loom larger than gains often holds. The distress that people report in association with the loss of a given quantity of money typically exceeds the amount of pleasure associated with gain of that same amount (e.g., Kahneman & Tversky, 1984). More generally, Taylor (1991) has noted a tendency for negative events to result in a greater
Tiffany A. Ito, Jeff T. Larsen, N. Kyle Smith, and John T Cacioppo, Department of Psychology, Ohio State University.
Preparation of this article was supported by National Science Founda- tion Grant SBR-9512459 and National Institute of Mental Health Grant P50MH52384-01A1. We thank Allyson Holbrook for assistance with statistical analyses.
Correspondence concerning this article should be addressed to Tiffany A. Ito, who is now at the Department of Psychology, CB 345, University of Colorado, Boulder, Colorado 80309, or to John T. Cacioppo, Depart- ment of Psychology, Ohio State University, 1885 Neil Avenue Mall, Columbus, Ohio 43210-1222. Electronic mail may be sent to tito @psych.colorado.edu or cacioppo. 1 @osu.edu.
mobilization of an organism's physiological, cognitive, emo- tional, and social responses.
These disparate instances of greater sensitivity to negative information represent the operation of what has been termed a negativity bias. Cacioppo and colleagues have incorporated the negativity bias into a more general model of evaluative space in which positive and negative evaluative processes are assumed to result from the operation of separable positive and negative motivational substrates, respectively (Cacioppo & Berntson, 1994; Cacioppo, Gardner, & Berntson, 1997; Ito & Cacioppo, in press). Positivity and negativity are further posited as having partially separable neurophysiological substrates that have func- tional outputs best viewed within a multidimensional bivariate space as opposed to a single bipolar continuum.
An important advantage of the model of evaluative space is that it incorporates instances in which positivity and negativity are activated in a reciprocal (i.e., bipolar) manner and instances in which positivity and negativity vary in other combinations. Research by Goldstein and Strube (1994) demonstrated that positive and negative evaluations do not always operate recipro- cally by revealing independence in the positive and negative reactions students reported at the beginning and end of three consecutive class periods. Specifically, the intensity of positivity and negativity within each class period was uncorrelated, and the two valent reactions were differentially affected by exam feedback. Cacioppo and colleagues referred to instances in which the positive and negative motivational systems operate independently as uncoupled activation (Cacioppo & Berntson, 1994; Cacioppo et al., 1997).
Multiple modes of evaluative activation were also observed by Ito, Cacioppo, and Lang (1998), who assessed the relation between positive and negative evaluations of nearly 500 color pictures from the International Affective Picture System (IAPS; Center for the Study of Emotion and Attention, 1995). For many of the pictures, positivity and negativity were negatively corre- lated, suggesting a reciprocal relation between the two motiva- tional systems. However, positivity and negativity were uncorre- lated for other pictures, revealing uncoupled activation. Uncou-
887
888 ITO, LARSEN, SMITH, AND CACIOPPO
pled activation can occur as singular activation of either the positive or the negative motivational system, both of which were observed by Ito et al. Finally, the model of evaluative space proposes a nonreciprocal mode of activation in which both va- lent systems are coactivated or coinhibited, resulting in a posi- tive correlation between positivity and negativity ratings. Racial prejudice is one area in which coactivation has been observed such that White participants sometimes report both strong posi- tive attitudes and strong negative attitudes toward African Americans (Hass, Katz, Rizzo, Bailey, & Eisenstadt, 1991).
Certainly, the model of evaluative space is not the first model to note the separability of positive and negative evaluative pro- cesses (for a review, see Cacioppo & Gardner, in press). This notion has a long tradition, for example, within the attitude and judgment literature. Although bipolar measures of attitudes are used widely and attitudes are often conceptualized as the net difference between the positive and negative valent processes aroused by a stimulus, many attitude theorists have nevertheless grappled with the separability of positive and negative evalua- tions (e.g., Edwards, 1946; Kaplan, 1972; Priester & Petty, 1996; Scott, 1968; Thompson, Zanna, & Griffin, 1995). The bivariate structure of evaluations was noted by Scott (1968) in his review of attitude measurement:
The conception of favorable and unfavorable as "opposites" im- plies that persons will not be found with attitudes simultaneously at both ends of the dimensions. Yet an alternative formulation might treat degree of favorableness and degree of unfavorableness as conceptually distinct (although no doubt empirically correlated) components, on which persons may make, simultaneously, a variety of position combinations. In other words, it is only by convention that direction of an attitude is conceptualized as a single bipolar continuum. (p. 206)
For our present purposes, the most important implication of conceptualizing positivity and negativity as separable is the abil- ity to stipulate different currency or activation functions for the two systems. Activation functions can be thought of as a means of expressing the value of separate and multifarious appetitive and aversive inputs on a common scale of positivity and negativ- ity, respectively. In the model of evaluative space (Cacioppo & Berntson, 1994; Cacioppo et al., 1997), the negative motivation system is characterized by a negativity bias. This refers to a tendency for the negative motivational system to respond more intensely than the positive motivational system to comparable amounts of activation. That is, the gradient for the currency function for negativity is steeper than the one for positivity (see also Lewin, 1935; Peeters & Czapinski, 1990).
The steeper gradient for the negative motivational system was evident in the evaluations of lAPS stimuli reported by Ito et al. (1998). To assess the negativity bias, Ito et al. performed a regression analysis, in which mean negativity scores were re- gressed onto mean arousal ratings used as a proxy for motiva- tional activation, for the 212 slides in the set that participants found more negative than positive. They similarly regressed mean positivity scores onto arousal ratings for the subset of 258 slides that participants found more positive than negative. As predicted, the slope of the regression line for negativity was steeper than the regression line for positivity. Similar results were obtained using bipolar valence scores as the measures of
evaluative activation, in which the dataset was dichotomized at the scale median.
To assess the generalizability of this effect across stimulus items, we have replicated this analysis on data for the English Affective Lexicon (Bradley, Lang, & Cuthbert, 1997). This stimulus set currently contains 620 verbs (e.g., act ivate) , nouns (e.g., l ion) , adverbs (e.g., le isurely) , and adjectives (e.g., quiet )
for which normative ratings of bipolar valence, arousal, and dominance are available. Prior to the analyses, the data were dichotomized at the median of the mean valence ratings. This median split yielded two subsets of words that elicited either predominantly positive or predominantly negative evaluations. Separate regression analyses in which valence ratings were pre- dicted from arousal ratings for the two subsets of words were then performed. As in Ito et al. (1998), arousal ratings were used as a proxy for motivational activation. Consistent with the regression analyses in Ito et al., a negativity bias was found such that the regression line relating arousal to valence among evaluatively negative words was steeper than the line relating arousal to valence among evaluatively positive words.
Although the extant research clearly reveals evidence of the negativity bias (e.g., see Skowronski & Carlston, 1989), much less is known about the stage at which this bias operates. Ob- servable expressions of an evaluation represent the output of at least two stages--evaluat ive categorization and response out- p u t - - a n d the negativity bias could operate at either stage. A negativity bias may be produced through processes occurring at the response-output stage by response priming, for example. This could occur i f negative stimuli are more likely to prime or activate a fight-or-flight response, thereby producing more extreme reactions to (including more extreme ratings of) nega- tive stimuli than positive stimuli (Cannon, 1929). Although not denying the possibility of response priming, the model of evalua- tive space views the negativity bias as an inherent characteristic of the underlying motivational substrate. This led to the predic- tion that the negativity bias will manifest at the initial evaluative categorization stage of information processing (Cacioppo &
In fact, Cacioppo and Berntson (1994) proposed that the activation functions for positivity and negativity were nonlinear with exponents less than 1. Therefore, nonlinear regression analyses were also performed on the IAPS ratings in Ito et al. (1998). These analyses used the equation E = A x + b, where E is either unipolar negativity ratings or positivity ratings, A is arousal ratings, X is the exponent that represents both the slope of the line and the rate of deceleration in the impact of increasing activation of the valent system of interest, and b represents the intercept value. To model activation of the negative motivational system, we com- puted the above equation using data from the 212 slides that participants found to be more negative than positive, with unipolar negativity ratings serving as E. To model activation of the positive motivational system, we computed the above equation using data from the 258 slides that participants found more positive than negative, with unipolar positivity ratings serving as E. As predicted by the negativity bias, the exponent was larger in the model estimating activation of the negative motivational system as compared with the model estimating activation of the positive motivational system. Similar results were obtained when bipolar valence ratings were used as E, dichotomizing the dataset at the scale median. Comparable analyses were also performed for stimuli in the English Affective Lexicon. Results again revealed a larger exponent in the model estimating activation of the negative motivational system.
NEGATIVITY BIAS IN EVALUATIVE CATEGORIZATIONS 889
Berntson, 1994; Cacioppo et al., 1997). In the present research, we report two experiments designed to test this hypothesis.
This research makes use of event-related brain potentials (ERPs) as measures of the evaluative categorization stage (Caci- oppo, Crites, Berntson, & Coles, 1993). ERPs are changes in electrocortical activity that occur in response to discrete stimuli. Time-locked topographical features of the ERP are referred to as components and are typically identified by the peaks in and the spatial distributions of the waveforms (for reviews, see Coles, Gratton, & Fabiani, 1990; Coles, Gratton, Kramer, & Miller, 1986). An ERP component is assumed to reflect one or more information-processing operations, and the amplitude of the component is thought to reflect the extent to which an infor- mation-processing operation is engaged (Donchin & Coles, 1988; Gehring, Gratton, Coles, & Donchin, 1992).
The paradigm we use is a modification of the oddball para- digm frequently used to study the P300 component of the ERE In the standard oddball paradigm, simple stimuli representing two distinct categories (e.g., low- and high-pitched tones) are presented with differing probabilities to participants. On aver- age, the low-probability stimulus (also called the oddball or target stimulus) evokes a larger positive-going potential, called the P300, as compared with the high-probability stimulus. The P300 has a maximal amplitude over central and parietal scalp areas, and manifests from approximately 300 to 900 ms follow- ing stimulus onset (Donchin, 1981).
To study evaluative processes, we have presented stimuli that are either positive, negative, or neutral in valence, with stimuli from one evaluative category occurring more frequently than the others (e.g., Cacioppo et al., 1993; Crites, Cacioppo, Gardner, & Berntson, 1995).2 We refer to the frequently presented stimuli in each sequence as the context and those from the less probable categories as targets. Evaluative inconsistency between the tar- get and context (e.g., a negative target stimulus embedded within a sequence of positive-context stimuli) results in an enhance- ment of a late positive potential (LPP) of the ERP, which shares many of the signature characteristics of the P300: (a) The LPP is typically largest over the parietal scalp area, intermediate over the central scalp area, and smallest over the frontal scalp area; (b) larger amplitude LPPs are elicited by the (evaluatively) inconsistent stimuli than by (evaluatively) consistent stimuli, particularly over central-parietal regions; (c) the average latency of the LPP falls within the 300 to 900 ms latency window typical of the P300; and (d) the amplitude of the LPP elicited over the central-parietal region varies as a function of the evalua- tive distance of the target from the context even when targets are equally probable (Cacioppo, Crites, Gardner, & Berntson, 1994; Crites & Cacioppo, 1996; Crites et al., 1995; Gardner, Cacioppo, Berntson, & Crites, in press). Furthermore, these LPP variations are found when individuals perform evaluative categorizations of the stimuli but not when they perform various nonevaluative categorizations (Cacioppo, Crites, & Gardner, 1996; Crites & Cacioppo, 1996).
As we have noted, we conceptualize evaluative categorization as separate from response selection and execution (or output; Cacioppo & Berntson, 1994; Cacioppo et al., 1993), which raises the issue of whether greater responsivity to negative cues is a function of processes operating at either the evaluative- categorization stage or response selection-execution stage.
ERPs provide a means of assessing the evaluative-categorization stage independent of response selection and execution pro- cesses. This was demonstrated by Crites et al. (1995), who recorded LPPs to positive, negative, and neutral stimuli embed- ded within sequences of positive-context stimuli. On some trials participants accurately reported their evaluations, whereas on others they were instructed to misreport their evaluations of either negative or neutral items as being positive. The misreport instructions had the intended effect on overt responses. However, the LPPs to evaluatively inconsistent stimuli, as compared with consistent stimuli, were enhanced, regardless of the accuracy of the overt evaluative report. These results were also replicated in a negative evaluative context in which participants either accurately reported their evaluations or misreported their neutral or positive evaluations (Crites et al., 1995; see also Gardner et al., in press). Therefore, ERPs provide an especially sensitive probe of the evaluative-categorization stage, allowing us to as- sess whether the underlying negative motivational system re- sponds more intensely than does the positive system to compara- ble amounts of activation.
To test the hypothesis that the negativity bias operates at the evaluative-categorization stage, we performed two experiments in which ERPs were recorded while participants evaluated posi- tive, negative, and neutral pictorial stimuli. Neutral pictures served as the most frequently presented contextual stimuli. The positive and negative pictures were equated for (a) probability of occurrence, (b) evaluative extremity relative to the neutral pictures, and (c) level of arousal, resulting in a design in which the positive and negative pictures differed primarily in terms of whether they activated the positive or negative motivational system. If the negativity bias operates at the evaluative-categori- zation stage, it should manifest itself as larger LPPs to evalua- tively negative pictures as compared with positive pictures.
Experiment 1
Method
Participants. Thirty-three Ohio State University (OSU) undergrad- uates (24 men) participated in the experiment for partial class credit. All were right-handed and had right-handed parents. Data from 8 partici- pants were removed because of equipment malfunction (n = 5 ), volun- tary withdrawal from the study (n = 2), or excessive artifact in the electroencephalograph (EEG) from vertical eye movement (n = 1 ). Analyses were conducted on the data obtained from the remaining 25 participants.
Materials. Thirty-six affectively neutral, two positive, and two nega- tive pictures were selected from Sets 1-8 of the IAPS (Center for the Study of Emotion and Attention--National Institute of Mental Health, 1995). Because neutral pictures were shown much more frequently than positive or negative pictures, the inclusion of a greater number of neutral pictures ensured that exemplars from all three categories were presented
2 In the traditional oddball paradigm, stimuli are presented in long sequences (e.g., 200 stimuli). Evaluative categorization of long se- quences of affectively valenced stimuli proved difficult for participants to perform (see Cacioppo et al., 1993, Note 1). As a result, we present stimuli in short sequences of 5 or 6 stimuli in our modified paradigm. The shorter sequences reduce variability in the ERP by presumably increasing participants' attention to and discrimination of the stimuli.
890 r i o , LARSEN, SMITH, AND CACIOPPO
an equal number of t imes) Using normative data collected from OSU undergraduates in a previous term (Ito et al., 1998), we selected neutral pictures that had (a) bipolar valence ratings near the midpoint (5.0) and median (5.19) of the scale (M = 5.10 on a 1 -9 scale; range = 4.21-6.15); (b) low levels of positive activation as measured by a unipolar positivity scale (M = 2.10 on a 5-point scale, where lower values indicate less positivity); (c) low levels of negative activation as measured by a unipolar negativity scale (M = 1.48 on a 5-point scale, where lower values indicate less negativity); and (d) low levels of arousal (M = 2.75, as measured on a 9-point bipolar scale where lower values indicate greater calmness). The 36 neutral pictures were divided into two equal-sized groups with comparable normative ratings: (a) bipolar valence M = 5.10, 5.10; (b) unipolar positivity M = 2.12, 2.08; (c) unipolar negativity M = 1.49, 1.47; and (d) arousal M = 2.74, 2.75. Examples of neutral pictures include a plate, hair dryer, and an electrical outlet.
The two positive and two negative pictures were selected to have high valence and arousal ratings that were equally extreme from the mean values for the neutral pictures. The positive pictures, which depicted a red Ferrari and people enjoying a roller coaster, had the following norma- tive ratings: (a) bipolar valence M = 8.31, (b) unipolar positivity M = 4.19, (c) unipolar negativity M = 1.23, and (d) arousal M = 7.43. The negative pictures, which depicted a mutilated face and a handgun aimed at the camera, had the following normative ratings: (a) bipolar valence M = 1,89, (b) unipolar positivity M = 1.16, (c) unipolar negativity M = 4.07, and (d) arousal M = 7.34. 4
Procedure. Potential participants were informed that the purpose of the study was to measure electrical activity occurring in the brain when people view pictures. Once they arrived for the experimental session, they received a brief overview of the procedures, then read and signed an informed consent form. Participants then had the electrodes attached and received more detailed task instructions.
Participants were seated in a comfortable reclining chair in a sound- attenuated, electrically shielded room. Following procedures used in prior research on evaluative categorization (Gardner et al., in press), pictures were shown to participants in sequences of five on a color computer monitor located approximately 76 cm in front of the chair.
LPPs are affected by surrounding contextual stimuli as well as by the stimuli currently being processed. As a result, LPPs observed in prior research (in which targets were embedded in positive or negative stimu- lus sequences) may have varied with the valence of the context stimuli as well as the target stimulus. To examine the negativity bias in the present experiment, we therefore established a neutral evaluative context and recorded ERP responses to pictures that were either evaluatively consistent (i.e., neutral) or inconsistent (i.e., positive or negative) with that context. To accomplish this, all participants were exposed to 120 sequences of five pictures. These sequences were divided into two 60- sequence blocks. Both blocks contained primarily neutral pictures but differed in whether positive or negative pictures were also embedded in some of the sequences (see Table 1). Specifically, in half of the se- quences in each block, a single positive or negative target (depending on the block) was embedded in the neutral context. In the remaining sequences in each block, all pictures within the sequences were neutral, and one of these neutral pictures was designated as the target picture. In all sequence types, targets randomly appeared in either the third, fourth, or fifth position in a sequence, thereby ensuring that targets were always preceded by at least two neutral pictures and that participants could not easily predict when a positive or negative picture might appear. This resulted in 12 trial types (see Table 1 ). Types 1 -6 were shown to each participant an equal number of times within one of the blocks, and Types 7 -12 were shown an equal number of times within the other block. Order of the trial types was randomized within each block for each participant. Participants were not informed of the distinction be- tween context and target pictures and evaluated all pictures in a similar
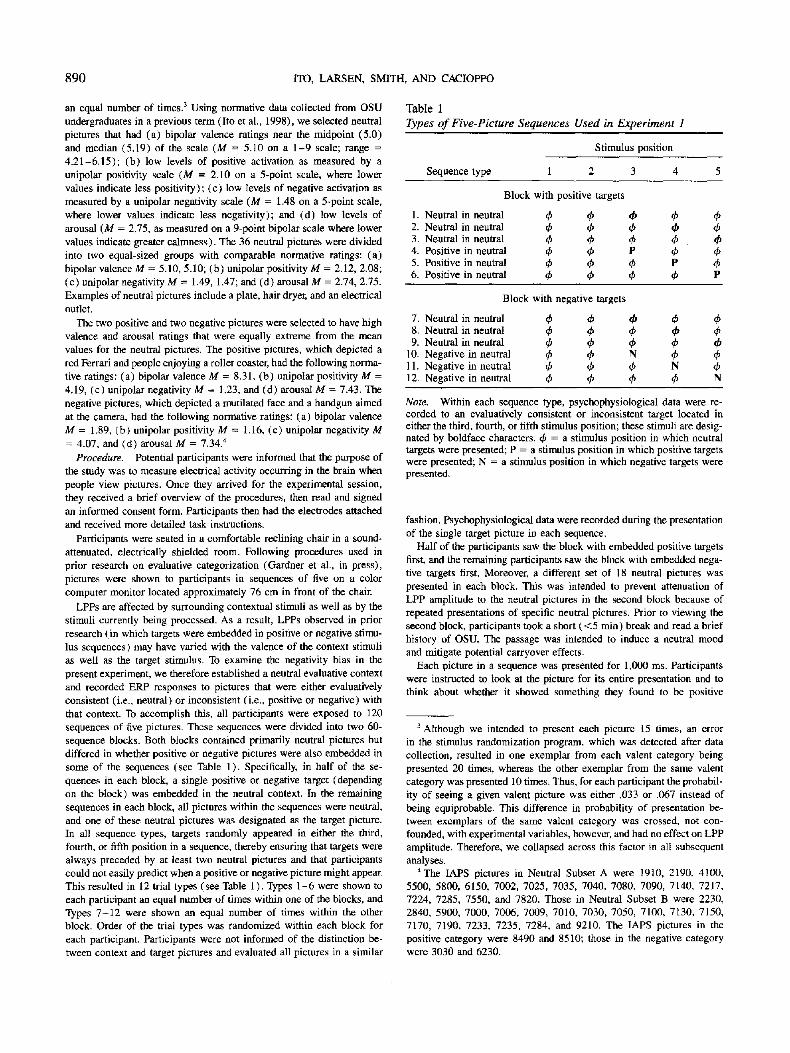
Table 1 Types of Five-Picture Sequences Used in Experiment 1
Stimulus position
Sequence type 1 2 3 4 5
Block with positive targets
1. Neutral in neutral th tb ~b q~ 2. Neutral in neutral ~b ~b ~ t~ tb 3. Neutral in neutral ~b t h ~b ~b ~b 4. Positive in neutral ~b th P ~b th 5. Positive in neutral tb ~b ~b P 'b 6. Positive in neutral ~b ~b tb ~b P
Block with negative targets
7. Neutral in neutral ~b ~b ~b 4~ ~b 8. Neutral in neutral ~b ~b ~b ~b 9. Neutral in neutral ~b th <h th
10. Negative in neutral ~b q5 N q~ 11. Negative in neutral ~b q~ ~b N 12. Negative in neutral ~ ~b th th N
Note. Within each sequence type, psychophysiological data were re- corded to an evaluatively consistent or inconsistent target located in either the third, fourth, or fifth stimulus position; these stimuli are desig- nated by boldface characters. ~b = a stimulus position in which neutral targets were presented; P = a stimulus position in which positive targets were presented; N = a stimulus position in which negative targets were presented.
fashion. Psychophysiological data were recorded during the presentation of the single target picture in each sequence.
Half of the participants saw the block with embedded positive targets first, and the remaining participants saw the block with embedded nega- tive targets first. Moreover, a different set of 18 neutral pictures was presented in each block. This was intended to prevent attenuation of LPP amplitude to the neutral pictures in the second block because of repeated presentations of specific neutral pictures. Prior to viewing the second block, participants took a short (<5 min) break and read a brief history of OSU. The passage was intended to induce a neutral mood and mitigate potential carryover effects.
Each picture in a sequence was presented for 1,000 ms. Participants were instructed to look at the picture for its entire presentation and to think about whether it showed something they found to be positive
3 Although we intended to present each picture 15 times, an error in the stimulus randomization program, which was detected after data collection, resulted in one exemplar from each valent category being presented 20 times, whereas the other exemplar from the same valent category was presented 10 times. Thus, for each participant the probabil- ity of seeing a given valent picture was either .033 or .067 instead of being equiprobable. This difference in probability of presentation be- tween exemplars of the same valent category was crossed, not con- founded, with experimental variables, however, and had no effect on LPP amplitude. Therefore, we collapsed across this factor in all subsequent analyses.
4 The IAPS pictures in Neutral Subset A were 1910, 2190, 4100, 5500, 5800, 6150, 7002, 7025, 7035, 7040, 7080, 7090, 7140, 7217, 7224, 7285, 7550, and 7820. Those in Neutral Subset B were 2230, 2840, 5900, 7000, 7006, 7009, 7010, 7030, 7050, 7100, 7130, 7150, 7170, 7190, 7233, 7235, 7284, and 9210. The IAPS pictures in the positive category were 8490 and 8510; those in the negative category were 3030 and 6230.
NEGATIVITY BIAS IN EVALUATIVE CATEGORIZATIONS 891
(or negative, depending on the block) or neutral. After stimulus offset, participants registered their evaluation by pressing one of two labeled keys on a computer keypad. Either the left (or right, counterbalanced) key indicated neutral. The other key indicated positive or negative, depending on which block was being presented. Participants used the left and right thumbs to press the left and right keys, respectively. After a 1,000 ms interstimulus interval, the next picture was shown. We stressed to participants that there were no right or wrong answers in evaluating the pictures and that we were interested in their first impres- sions. After the fifth picture in a sequence, the word pause was shown on the screen. Participants were instructed to use either thumb to press a third button on the keypad when they were ready to initiate the next sequence of five pictures.
To summarize, data were recorded from both target (positive and negative) and context (neutral) pictures. The design, therefore, featured two within-subject variables: picture category (valenced or context) and target valence (positive or negative). There were also three between- subject variables, representing the hand used to register a neutral evalua- tion (left or right), block order (positive or negative block first), and set of neutral pictures shown in the first block (Subset A or B). An additional within-subject factor, sagittal scalp site, is described below.
Psychophysiological data collection and reduction. EEG data were recorded at sites over midline frontal (Fz), central (Cz), and parietal (Pz) scalp areas using tin electrodes sewn into an elastic cap (Electro- Cap International, Eaton, OH). 5 An additional site at the top of the forehead served as an electrical ground. Miniature tin electrodes were also placed over the left and right mastoids. Active scalp sites were referenced on-line to the left mastoid. Additional miniature tin electrodes were placed above and below the left eye and on the outer canthus of each eye to monitor vertical and horizontal eye movements, respectively. Electrode impedances were below 5 K~ at all sites. EEG and electroocu- logram (EOG) recordings were amplified by NeuroScan Synamps am- plifiers with a bandpass of 0.1-30 Hz (12-dB roll-off) and digitized at 1,000 Hz. For all targets, EEG and EOG data recording began 128 ms before picture onset and continued throughout the 1,000 ms picture presentation.
Off-line, the data were rereferenced to a computed average of the left and right mastoids. 6 EEG data were next corrected to the mean voltage of the 128-ms prestimulus recording period before applying a regression procedure to remove the effects of vertical eye movements from the EEG, which can distort measurements from scalp sites (Semlitsch, Anderer, Schuster, & Presslich, 1986). The regression correction was applied to 14 of the participants' data. The remaining 11 participants did not blink enough during the EEG recording period for the regression procedure to reliably estimate eye activity from the vertical EOG channel. For these participants, we visually inspected the EEG data and deleted any trials on which ocular or other artifact occurred (e.g., because of move- ment). We similarly inspected the EEG data from those participants for whom the regression procedure was applied for remaining ocular or other artifact. For all participants, if artifact was detected at any of the three scalp sites, data from all sites for that trial were eliminated from further analysis. A 9-Hz low-pass digital filter was then applied to the remaining data.
We next constructed ensemble averages to extract the LPP component from the EEG signal (Coles et al., 1990). For each participant's data, we computed four averaged waveforms. These waveforms aggregated the electrical activity associated with the evaluation of positive targets, neutral targets in the positive block, negative targets, and neutral targets in the negative block. We calculated separate ensemble-averaged ERP waveforms for each scalp site for each participant. The amplitude of the LPP of the ERP was quantified by locating within each ERP wave- form the largest positive-going potential at Pz between 400-900 ms after stimulus onset. The amplitude of the LPP in the other two sites
was defined as the largest positive-going potential occurring within _ 100 ms of the LPP at Pz.
R e s u l ~
We first examined whether we replicated prior research on evaluative categorizations showing that the LPP ampli tude has a central-parietal scalp distribution and varies as a function of evaluative inconsistency. To do this, we subjected the LPP amplitudes to a 2 (picture category: context, valenced) x 2 ( target valence: positive, negative) x 3 (sagittal scalp site: fron- tal, central, parietal) x 2 (hand for neutral response) x 2 (block order: positive first, negative first) x 2 (set of neutral pictures paired with positive targets: Subset A, Subset B) multivariate analysis of variance (MANOVA). All F tests reported represent the Wilks ' s lambda approximation. Our results confirmed both prior effects. First, we obtained a main effect of sagittal scalp site, F (2 , 16) = 22.15, p < .0001. Two sets of p lanned contrasts were conducted to test specifically for the central-parietal scalp distribution. The first contrast compared the mean of the LPP amplitudes at Cz and Pz with the mean at Fz, revealing signifi- cantly larger LPPs at the combined C z - P z areas (combined C z - P z M = 7 .42/zV) than at Fz ( M = 3.28 #V), F (1 , 17) = 34.46, p < .0001. The second planned contrast compared LPP amplitudes at Pz and Cz, revealing larger LPPs at Pz ( M -- 8.49 /~V) than at Cz ( M = 6.35 #V) , F ( I , 17) = 9.84, p < .01. Second, the MANOVA revealed main effects of picture category, F ( I , 17) = 59.98, p < .0001, and target valence, F (1 , 17) = 8.79, p < .01, which were qualified by a significant Picture Category x Target valence interaction, F (1 , 17) = 19.45, p < .01. Both positive and negative targets (Mposi~ive = 7.43 #V, Mn~gat~e = 10.90 p,V) were associated with larger LPPs than their corresponding context pictures ( M = 2.95 #V and M = 2.89 #V, respectively), F (1 , 17) = 27.08, p < .001, and F (1 , 17) = 52.66, p < .001, respectively. Across both blocks, then, LPPs were larger for evaluatively inconsistent pictures than consistent pictures.
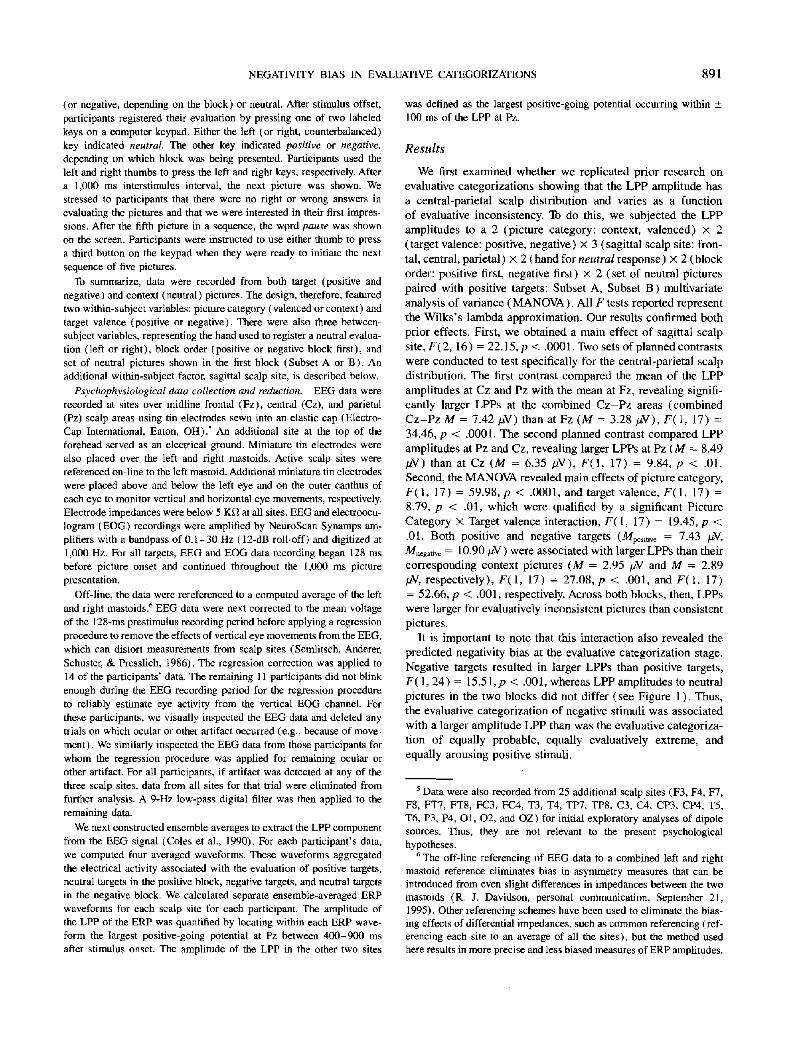
It is important to note that this interaction also revealed the predicted negativity bias at the evaluative categorization stage. Negative targets resulted in larger LPPs than positive targets, F ( 1, 24) = 15.51, p < .001, whereas LPP amplitudes to neutral pictures in the two blocks did not differ (see Figure 1 ). Thus, the evaluative categorization of negative stimuli was associated with a larger ampli tude LPP than was the evaluative categoriza- tion of equally probable, equally evaluatively extreme, and equally arousing positive stimuli.
5 Data were also recorded from 25 additional scalp sites (F3, F4, F7, F8, FT7, FT8, FC3, FC4, T3, T4, TP7, TP8, C3, C4, CP3, CP4, T5, T6, P3, P4, O1, 02, and OZ) for initial exploratory analyses of dipole sources. Thus, they are not relevant to the present psychological hypotheses.
6 The off-line referencing of EEG data to a combined left and right mastoid reference eliminates bias in asymmetry measures that can be introduced from even slight differences in impedances between the two mastoids (R. J. Davidson, personal communication, September 21, 1995). Other referencing schemes have been used to eliminate the bias- ing effects of differential impedances, such as common referencing (ref- erencing each site to an average of all the sites), but the method used here results in more precise and less biased measures of ERP amplitudes.
ITO, LARSEN, SMITH, AND CACIOPPO
-2:
2 -
v
6
' ~ l O -
141 18
"7
. " ' ' " , . _ . . . . - " " "" . - ' ° ' " ' " . . - . . . . . . . . . . - . . . .
892
- 6 -
I I I I I 1 ~ 1 1 1 1 1 1 1 1 1 1 1 1 1 1 1 1 1 1
o---- positive
i • negative
I I l I ! l I I I I
L a t e n c y (ms)
Figure 1. Averaged event-related brain potential waveforms at the midline parietal electrode (Pz) to neutral and positive targets in the block of trials containing neutral (frequent) and positive (rare) targets and to neutral and negative targets in the block of trials containing neutral (frequent) and negative (rare) targets. The amplitude of the late positive potential is not only larger to the rare (positive and negative) targets than the frequent (neutral) targets, but it is larger to the negative targets than the positive targets. These results were obtained even though the positive and negative targets were equally extreme, arousing, rare, and task relevant. These results, therefore, are consistent with the operation of a negativity bias at the evaluative categorization stage of information processing.
A Picture Category x Sagittal Scalp Site interaction was also obtained, F(2 , 1 6 ) = 16.38, p < .0001. For the target pictures, follow-up comparisons revealed larger amplitude LPPs at the central-parietal area (combined C z - P z M = 10.78 #V) as com- pared to Fz (M = 4.55 #V), F (1 , 24) = 74.30, p < .0001. LPPs at Pz (M = 12.54 #V) were also significantly larger than those at Cz (M = 9.01 #V) for the target pictures, F(1 , 24) = 23.92, p < .0001. For the neutral pictures, follow-up compari- sons revealed larger amplitude LPPs at the central-parietal area (combined C z - P z M = 3.55 #V) as compared to Fz (M = 1.48 #V), F (1 , 24) = 9.89, p < .005; LPP amplitudes at Pz and Cz did not differ for the context pictures.
More interesting from a theoretical perspective, we obtained a Picture Category x Target Valence x Sagittal Scalp Site inter- action, F(2 , 16) = 6.73, p < .01. The mean amplitudes as a function of picture category, target valence, and sagittal scalp site are shown in Table 2, and the stimulus-aligned averaged waveforms at Pz are shown in Figure 1. LPP amplitudes were larger to negative than positive targets at Pz, Cz, and Fz, all ps < .05. The interaction was attributable to a greater sensitivity to evaluative inconsistency at central and parietal areas. When participants were viewing negative target pictures, the target
pictures resulted in larger LPP amplitudes than the neutral pic- tures did at all sites, all ps < .01. When participants were viewing positive target pictures, the target pictures resulted in larger LPP amplitudes than neutral pictures did at Pz and Cz, p s < .005, a difference that was not significant at Fz, p < .06. 7
D i s c u s s i o n
The results of Experiment 1 reveal three important findings. First, the present results replicate prior research results, reveal- ing both the scalp distribution of the LPP and the LPP's sensitiv- ity to evaluative inconsistency (e.g., Cacioppo et al., 1993; Caci- oppo et al., 1994; Crites & Cacioppo, 1996; Crites et al., 1995). Specifically, the LPP was largest over central-parietal regions,
7 The MANOVA also revealed two higher order interactions that did not bear on theoretical issues: (a) Picture Category x Block Order x Set of Neutral Pictures Paired with Positive Targets, F( 1, 17) = 11.23, p < .01; (b) Picture Category × Hand for Neutral Response x Block Order x Set of Neutral Pictures Paired with Positive Targets, F( 1, 17) = 7.31, p < .01. None of these interactions were theoretically interesting, nor did they qualify the effects reported in the text.
NEGATIVITY BIAS IN EVALUATIVE CATEGORIZATIONS 893
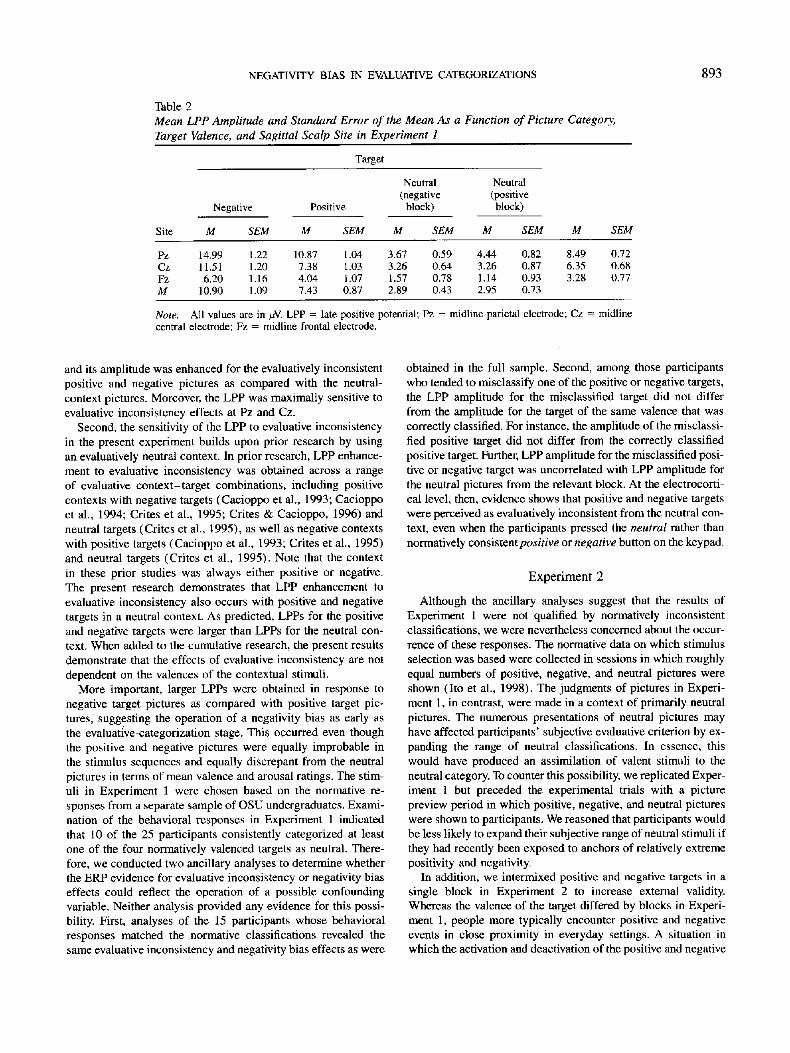
Table 2 Mean LPP Amplitude and Standard Error of the Mean As a Function of Picture Category, Target Valence, and Sagittal Scalp Site in Experiment 1
Target
Negative Positive
Neutral Neutral (negative (positive
block) block)
Site M SEM M SEM M SEM M SEM M SEM
Pz 14.99 1.22 10.87 1.04 3.67 0.59 4.44 0.82 8.49 0.72 Cz 11.51 1.20 7.38 1.03 3.26 0.64 3.26 0.87 6.35 0.68 Fz 6.20 1.16 4.04 1.07 1.57 0.78 1.14 0.93 3.28 0.77 M 10.90 1.09 7.43 0.87 2.89 0.43 2.95 0.73
Note. All values are in #V. LPP = late positive potential; Pz = midline parietal electrode; Cz = midline central electrode; Fz = midline frontal electrode.
and its amplitude was enhanced for the evaluatively inconsistent positive and negative pictures as compared with the neutral- context pictures. Moreover, the LPP was maximally sensitive to evaluative inconsistency effects at Pz and Cz.
Second, the sensitivity of the LPP to evaluative inconsistency in the present experiment builds upon prior research by using an evaluatively neutral context. In prior research, LPP enhance- ment to evaluative inconsistency was obtained across a range of evaluative context-target combinations, including positive contexts with negative targets (Cacioppo et al., 1993; Cacioppo et al., 1994; Crites et al., 1995; Crites & Cacioppo, 1996) and neutral targets (Crites et al., 1995), as well as negative contexts with positive targets (Cacioppo et al., 1993; Crites et al., 1995) and neutral targets (Crites et al., 1995). Note that the context in these prior studies was always either positive or negative. The present research demonstrates that LPP enhancement to evaluative inconsistency also occurs with positive and negative targets in a neutral context. As predicted, LPPs for the positive and negative targets were larger than LPPs for the neutral con- text. When added to the cumulative research, the present results demonstrate that the effects of evaluative inconsistency are not dependent on the valences of the contextual stimuli.
More important, larger LPPs were obtained in response to negative target pictures as compared with positive target pic- tures, suggesting the operation of a negativity bias as early as the evaluative-categorization stage. This occurred even though the positive and negative pictures were equally improbable in the stimulus sequences and equally discrepant from the neutral pictures in terms of mean valence and arousal ratings. The stim- uli in Experiment 1 were chosen based on the normative re- sponses from a separate sample of OSU undergraduates. Exami- nation of the behavioral responses in Experiment 1 indicated that 10 of the 25 participants consistently categorized at least one of the four normatively valenced targets as neutral. There- fore, we conducted two ancillary analyses to determine whether the ERP evidence for evaluative inconsistency or negativity bias effects could reflect the operation of a possible confounding variable. Neither analysis provided any evidence for this possi- bility. First, analyses of the 15 participants whose behavioral responses matched the normative classifications revealed the same evaluative inconsistency and negativity bias effects as were
obtained in the full sample. Second, among those participants who tended to misclassify one of the positive or negative targets, the LPP amplitude for the misclassified target did not differ from the amplitude for the target of the same valence that was correctly classified. For instance, the amplitude of the misclassi- fled positive target did not differ from the correctly classified positive target. Further, LPP amplitude for the misclassified posi- tive or negative target was uncorrelated with LPP amplitude for the neutral pictures from the relevant block. At the electrocorti- cal level, then, evidence shows that positive and negative targets were perceived as evaluatively inconsistent from the neutral con- text, even when the participants pressed the neutral rather than normatively consistent positive or negative button on the keypad.
Experiment 2
Although the ancillary analyses suggest that the results of Experiment 1 were not qualified by normatively inconsistent classifications, we were nevertheless concerned about the occur- rence of these responses. The normative data on which stimulus selection was based were collected in sessions in which roughly equal numbers of positive, negative, and neutral pictures were shown (Ito et al., 1998). The judgments of pictures in Experi- ment 1, in contrast, were made in a context of primarily neutral pictures. The numerous presentations of neutral pictures may have affected participants' subjective evaluative criterion by ex- panding the range of neutral classifications. In essence, this would have produced an assimilation of valent stimuli to the neutral category. To counter this possibility, we replicated Exper- iment 1 but preceded the experimental trials with a picture preview period in which positive, negative, and neutral pictures were shown to participants. We reasoned that participants would be less likely to expand their subjective range of neutral stimuli if they had recently been exposed to anchors of relatively extreme positivity and negativity.
In addition, we intermixed positive and negative targets in a single block in Experiment 2 to increase external validity. Whereas the valence of the target differed by blocks in Experi- ment 1, people more typically encounter positive and negative events in close proximity in everyday settings. A situation in which the activation and deactivation of the positive and negative
894 ITO, LARSEN, SMITH, AND CACIOPPO
mot iva t iona l sys tems occur in a r a n d o m sequence m ay therefore more c losely m i m i c the evaluat ive s i tuat ions typica l ly faced in eve ryday life. Moreover , whereas par t ic ipants in E x p e r i m e n t 1 were p resen ted wi th on ly two r e sponse opt ions (i .e. , posi t ive and neut ra l in the posi t ive target b lock and negat ive and neut ra l in the negat ive target b l o c k ) , par t i c ipan ts in E x p e r i m e n t 2 were p resen ted wi th all th ree opt ions for every picture. W h e n people natura l ly evaluate objec ts in thei r env i ronmen t , it is more l ikely tha t they choose f r o m the full r ange of evaluat ive responses , w h i c h inc ludes positivity, negativity, and neutrali ty. Thus , the p resence o f all th ree opt ions m ay also more closely co r r e spond to p e o p l e ' s everyday evaluat ive exper iences than did the s i tua- t ion in E x p e r i m e n t 1. Finally, to inc rease the genera l izabi l i ty of the effects ob ta ined in E x p e r i m e n t 1, we used di f ferent posi t ive and negat ive p ic tures in E x p e r i m e n t 2.
Method
Participants. Twenty-one OSU undergraduates (11 men) partici- pated in the experiment for partial class credit. Data from 7 participants were unusable because of equipment failure (n = 1 ) or excessive artifact (n = 6). Analyses were conducted on the data obtained from the re- maining 14 participants.
Materials. Twenty-six affectively neutral, two positive, and two neg- ative pictures were used in the experiment. Eighteen of the neutral pic- tures and all of the positive and negative pictures were selected from Sets 1 -8 of the lAPS using normative data from Ito et al. (1998). Some of the neutral pictures (but none of the positive or negative pictures) used in Experiment 1 were also used in Experiment 2. 8
The 18 neutral IAPS pictures had the following characteristics: (a) bipolar valence ratings near the midpoint of the scale (M = 5.00), (b) bipolar valence ratings not greater than 1 scale point away from the midpoint (range = 4 .60-5.40) , (c) low levels of positive activation as measured by unipolar positivity scale (M = 1.91 ), (d) low levels of negative activation as measured by unipolar negativity scale (M = 1.47), and (e) low levels of arousal (M = 2.64). The two positive and two negative pictures were selected to have high and equally extreme affect and arousal ratings. The positive pictures, which showed a pizza and a bowl of chocolate ice cream, had the following normative ratings: (a) bipolar valence = 7.81, (b) unipolar positivity = 3.65, (c) unipolar negativity = 1.42, and (d) arousal = 6.17. The negative pictures, which showed a dead cat and a dead and decomposing cow, had the following normative ratings: (a) bipolar valence = 2.10, (b) unipolar positivity = 1.09, (c) unipolar negativity = 4.08, and (d) arousal = 6,22. Eighteen pictures in the lAPS met our criteria for neutral pictures. To ensure equal rates of presentation of each individual picture, we included eight additional neutral pictures from the PC Paintbrush PhotoLibrary CD ( 1994 ).9
Procedure. Experiment 2 followed the same procedure as Experi- ment 1, with the following exceptions. First, participants were exposed to 90 sequences of five stimuli, and each of the 9 possible sequences in Table 3 was shown 10 times in a different random order for each partici- pant. Second, just prior to the presentation of experimental trials, partici- pants were preexposed to 30 positive, 30 negative, and 30 neutral pic- tures. To provide anchors of extreme positivity and negativity, all partici- pants viewed the neutral preview pictures last. Half of the participants were randomly assigned to view the positive pictures first, and the re- maining participants viewed the negative pictures first. Six pictures were shown at a time on the screen, and participants paced themselves through the preview screens. The 26 neutral, 2 positive, and 2 negative pictures selected for use in the experiment were among those shown during the preview period. These were augmented with 4 additional neutral pictures from the PC Paintbrush PhotoLibrary CD (1994), 28 positive pictures
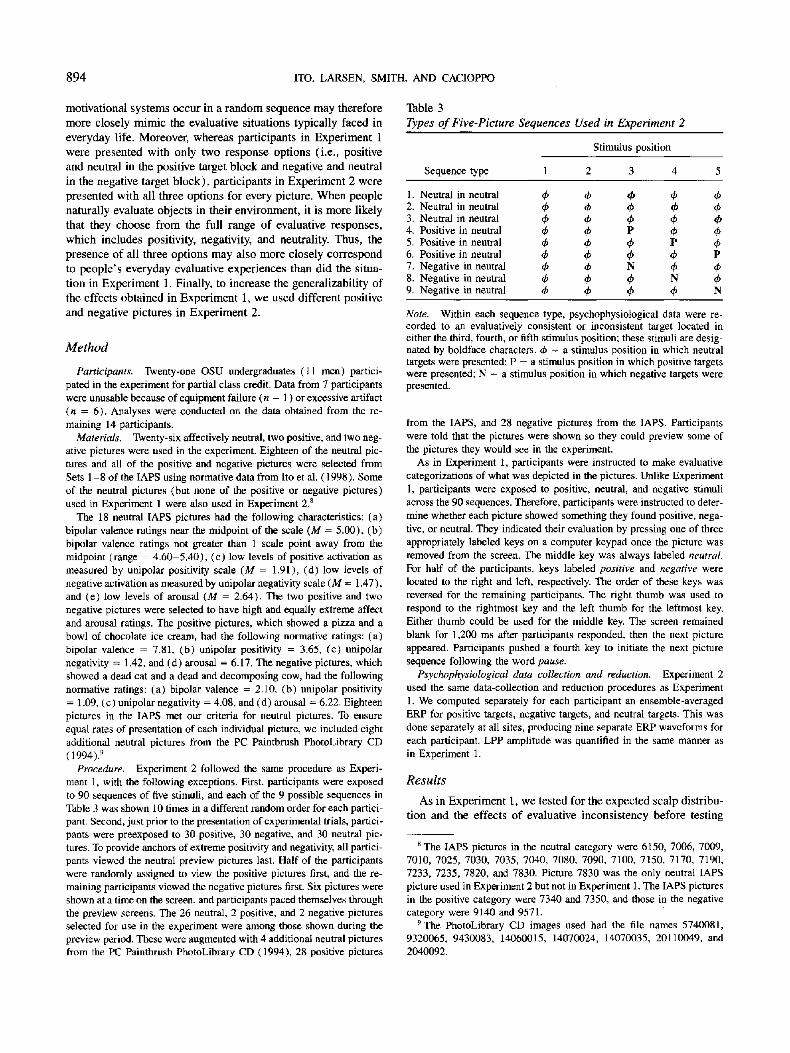
Table 3 Types of Five-Picture Sequences Used in Experiment 2
Stimulus position
Sequence type 1 2 3 4 5
1. Neutral in neutral 4' 4' ~b 4' 4' 2. Neutral in neutral 4' 4' 4' ~b 4' 3. Neutral in neutral 4' 4' 4' 4' ~b 4. Positive in neutral 4' 4' P 4' 4' 5. Positive in neutral 4' 4' 4' P 4' 6. Positive in neutral 4' 4' 4' 4' P 7. Negative in neutral 4' 4' N 4' 4' 8. Negative in neutral 4' 4' 4' N 4' 9. Negative in neutral 4' 4' 4' 4' N
Note. Within each sequence type, psychophysiological data were re- corded to an evaluatively consistent or inconsistent target located in either the third, fourth, or fifth stimulus position; these stimuli are desig- nated by boldface characters. 4' = a stimulus position in which neutral targets were presented; P = a stimulus position in which positive targets were presented; N = a stimulus position in which negative targets were presented.
from the lAPS, and 28 negative pictures from the IAPS. Participants were told that the pictures were shown so they could preview some of the pictures they would see in the experiment.
As in Experiment 1, participants were instructed to make evaluative categorizations of what was depicted in the pictures. Unlike Experiment 1, participants were exposed to positive, neutral, and negative stimuli across the 90 sequences. Therefore, participants were instructed to deter- mine whether each picture showed something they found positive, nega- tive, or neutral. They indicated their evaluation by pressing one of three appropriately labeled keys on a computer keypad once the picture was removed from the screen. The middle key was always labeled neutral. For half of the participants, keys labeled positive and negative were located to the right and left, respectively. The order of these keys was reversed for the remaining participants. The right thumb was used to respond to the rightmost key and the left thumb for the leftmost key. Either thumb could be used for the middle key. The screen remained blank for 1,200 ms after participants responded, then the next picture appeared. Participants pushed a fourth key to initiate the next picture sequence following the word pause.
Psychophysiological data collection and reduction. Experiment 2 used the same data-collection and reduction procedures as Experiment 1. We computed separately for each participant an ensemble-averaged ERP for positive targets, negative targets, and neutral targets. This was done separately at all sites, producing nine separate ERP waveforms for each participant. LPP amplitude was quantified in the same manner as in Experiment 1.
Results
As in E x p e r i m e n t 1, we tes ted for the expec ted scalp d is t r ibu- t ion and the effects o f evaluat ive incons i s t ency before tes t ing
8 The lAPS pictures in the neutral category were 6150, 7006, 7009, 7010, 7025, 7030, 7035, 7040, 7080, 7090, 7100, 7150, 7170, 7190, 7233, 7235, 7820, and 7830. Picture 7830 was the only neutral lAPS picture used in Experiment 2 but not in Experiment 1. The IAPS pictures in the positive category were 7340 and 7350, and those in the negative category were 9140 and 9571.
9The PhotoLibrary CD images used had the file names 5740081, 9320065, 9430083, 14060015, 14070024, 14070035, 20110049, and 2040092.
NEGATIVITY BIAS IN EVALUATIVE CATEGORIZATIONS 895
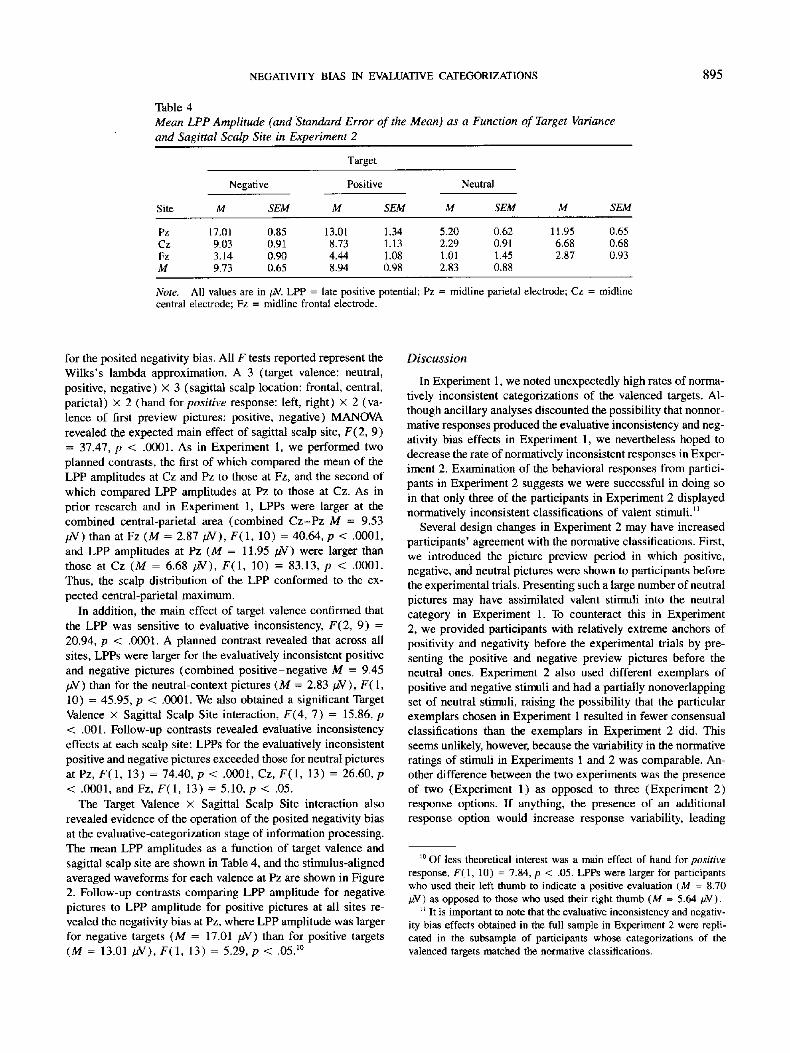
Table 4 Mean LPP Amplitude (and Standard Error of the Mean) as a Function of Target Variance and Sagittal Scalp Site in Experiment 2
Target
Negative Positive Neutral
Site M SEM M SEM M SEM M SEM
Pz 17.01 0.85 13.01 1.34 5.20 0.62 11.95 0.65 Cz 9.03 0.91 8.73 1.13 2.29 0.91 6.68 0.68 Fz 3.14 0.90 4.44 1.08 1.01 1.45 2.87 0.93 M 9.73 0.65 8.94 0.98 2.83 0.88
Note. All values are in #V. LPP = late positive potential; Pz = midline parietal electrode; Cz = midline central electrode; Fz = midline frontal electrode.
for the posited negativity bias. All F tests reported represent the Wilks's lambda approximation. A 3 (target valence: neutral, positive, negative) x 3 (sagittal scalp location: frontal, central, parietal) x 2 (hand for positive response: left, right) x 2 (va- lence of first preview pictures: positive, negative) MANOVA revealed the expected main effect of sagittal scalp site, F(2, 9) = 37.47, p < .0001. As in Experiment 1, we performed two planned contrasts, the first of which compared the mean of the LPP amplitudes at Cz and Pz to those at Fz, and the second of which compared LPP amplitudes at Pz to those at Cz. As in prior research and in Experiment 1, LPPs were larger at the combined central-parietal area (combined Cz-Pz M = 9.53 #V) than at Fz (M = 2.87 #V), F(1, 10) = 40.64, p < .0001, and LPP amplitudes at Pz (M = 11.95 #V) were larger than those at Cz (M = 6.68 /zV), F(1, 10) = 83.13, p < .0001. Thus, the scalp distribution of the LPP conformed to the ex- pected central-parietal maximum.
In addition, the main effect of target valence confirmed that the LPP was sensitive to evaluative inconsistency, F(2, 9) = 20.94, p < .0001. A planned contrast revealed that across all sites, LPPs were larger for the evaluatively inconsistent positive and negative pictures (combined positive-negative M = 9.45 #V) than for the neutral-context pictures (M = 2.83/~V), F( 1, 10) = 45.95, p < .0001. We also obtained a significant Target Valence x Sagittal Scalp Site interaction, F(4, 7) = 15.86, p < .001. Follow-up contrasts revealed evaluative inconsistency effects at each scalp site: LPPS for the evaluatively inconsistent positive and negative pictures exceeded those for neutral pictures at Pz, F(1, 13) = 74.40, p < .0001, Cz, F(1, 13) = 26.60, p < .0001, and Fz, F(1, 13) = 5.10, p < .05.
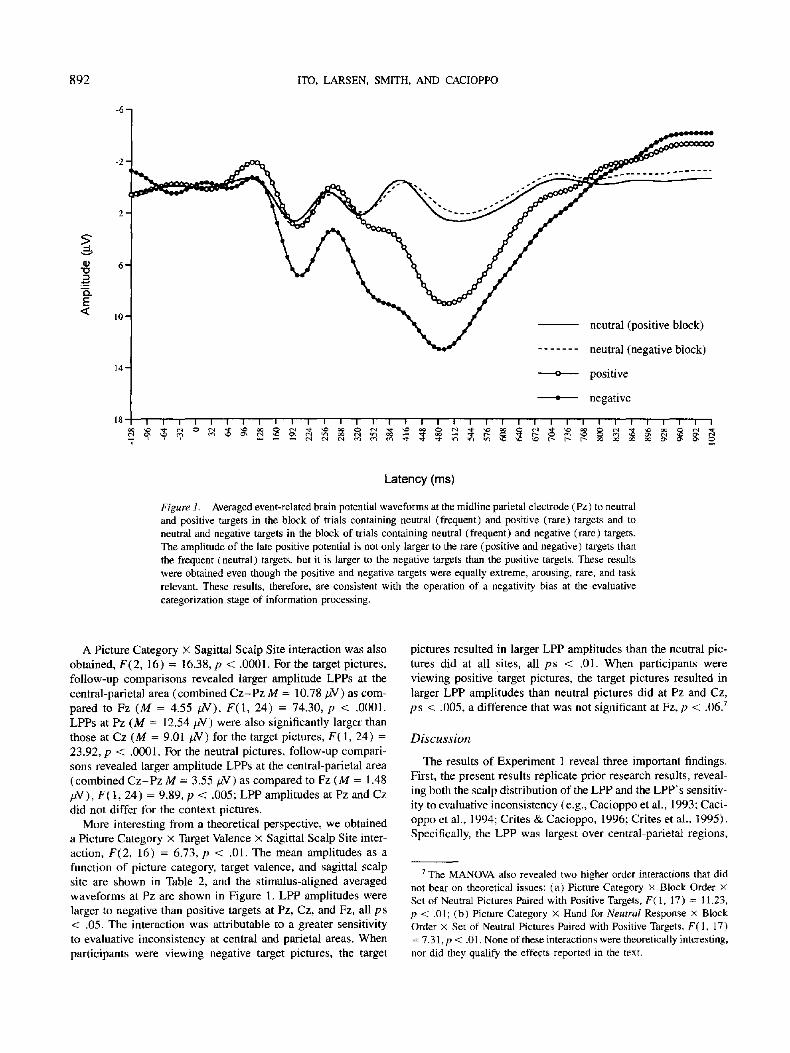
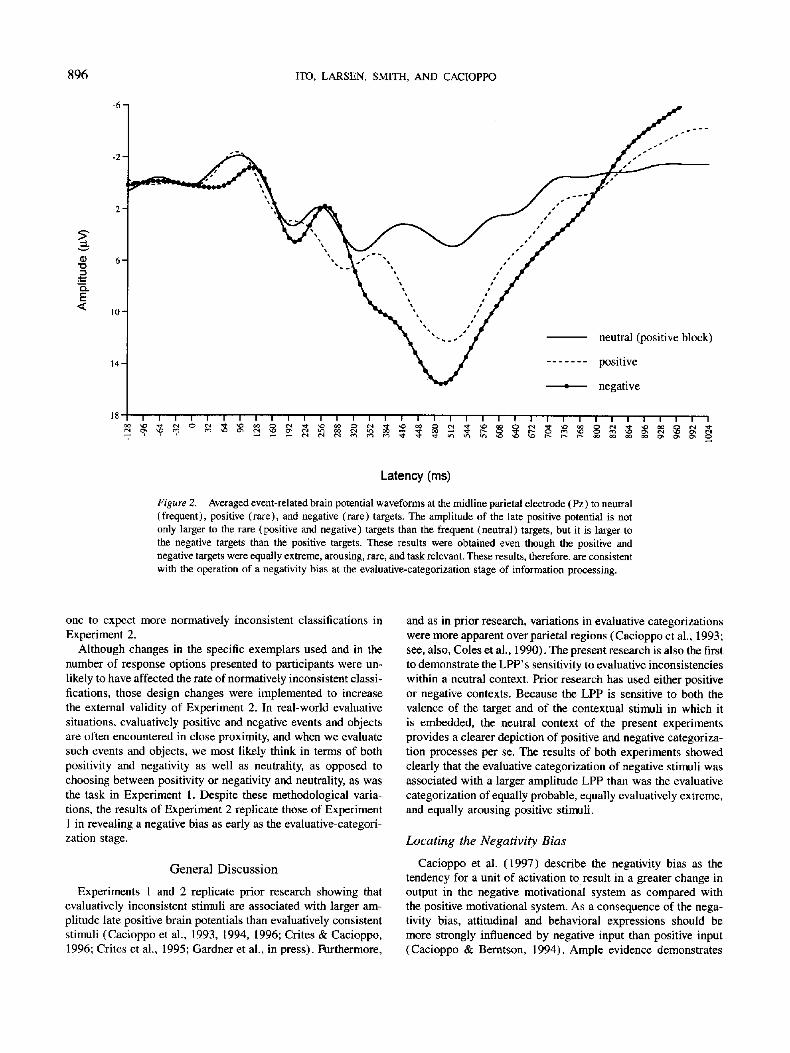
The Target Valence x Sagittal Scalp Site interaction also revealed evidence of the operation of the posited negativity bias at the evaluative-categorization stage of information processing. The mean LPP amplitudes as a function of target valence and sagittal scalp site are shown in Table 4, and the stimulus-aligned averaged waveforms for each valence at Pz are shown in Figure 2. Follow-up contrasts comparing LPP amplitude for negative pictures to LPP amplitude for positive pictures at all sites re- vealed the negativity bias at Pz, where LPP amplitude was larger for negative targets (M = 17.01 /zV) than for positive targets (M = 13.01 #V), F(1, 13) = 5.29, p < .05.1°
Discussion
In Experiment 1, we noted unexpectedly high rates of norma- tively inconsistent categorizations of the valenced targets. Al- though ancillary analyses discounted the possibility that nonnor- mative responses produced the evaluative inconsistency and neg- ativity bias effects in Experiment 1, we nevertheless hoped to decrease the rate of normatively inconsistent responses in Exper- iment 2. Examination of the behavioral responses from partici- pants in Experiment 2 suggests we were successful in doing so in that only three of the participants in Experiment 2 displayed normatively inconsistent classifications of valent stimuli. 1~
Several design changes in Experiment 2 may have increased participants' agreement with the normative classifications. First, we introduced the picture preview period in which positive, negative, and neutral pictures were shown to participants before the experimental trials. Presenting such a large number of neutral pictures may have assimilated valent stimuli into the neutral category in Experiment 1. To counteract this in Experiment 2, we provided participants with relatively extreme anchors of positivity and negativity before the experimental trials by pre- senting the positive and negative preview pictures before the neutral ones. Experiment 2 also used different exemplars of positive and negative stimuli and had a partially nonoverlapping set of neutral stimuli, raising the possibility that the particular exemplars chosen in Experiment 1 resulted in fewer consensual classifications than the exemplars in Experiment 2 did. This seems unlikely, however, because the variability in the normative ratings of stimuli in Experiments 1 and 2 was comparable. An- other difference between the two experiments was the presence of two (Experiment 1) as opposed to three (Experiment 2) response options. If anything, the presence of an additional response option would increase response variability, leading
10 Of less theoretical interest was a main effect of hand for positive response, F( 1, 10) = 7.84, p < .05. LPPs were larger for participants who used their left thumb to indicate a positive evaluation (M = 8.70 #V) as opposed to those who used their right thumb (M = 5.64/zV).
tl It is important to note that the evaluative inconsistency and negativ- ity bias effects obtained in the full sample in Experiment 2 were repli- cated in the subsample of participants whose categorizations of the valenced targets matched the normative classifications.
896 ITO, LARSEN, SMITH, AND CACIOPPO
:=k
- i
E <
61
' lock)
. . . . . . . positive
• negative
1 0 -
1 4 -
18 . .
Latency (ms)
Figure 2. Averaged event-related brain potential waveforms at the midline parietal electrode (Pz) to neutral (frequent), positive (rare), and negative (rare) targets. The amplitude of the late positive potential is not only larger to the rare (positive and negative) targets than the frequent (neutral) targets, but it is larger to the negative targets than the positive targets. These results were obtained even though the positive and negative targets were equally extreme, arousing, rare, and task relevant. These results, therefore, are consistent with the operation of a negativity bias at the evaluative-categorization stage of information processing.
one to expect more normatively inconsistent classifications in Experiment 2.
Although changes in the specific exemplars used and in the number of response options presented to participants were un- likely to have affected the rate of normatively inconsistent classi- fications, those design changes were implemented to increase the external validity of Experiment 2. In real-world evaluative situations, evaluatively positive and negative events and objects are often encountered in close proximity, and when we evaluate such events and objects, we most likely think in terms of both positivity and negativity as well as neutrality, as opposed to choosing between positivity or negativity and neutrality, as was the task in Experiment 1. Despite these methodological varia- tions, the results of Experiment 2 replicate those of Experiment 1 in revealing a negative bias as early as the evaluative-categori- zation stage.
General Discussion
Experiments 1 and 2 replicate prior research showing that evaluatively inconsistent stimuli are associated with larger am- plitude late positive brain potentials than evaluatively consistent stimuli (Cacioppo et al., 1993, 1994, 1996; Crites & Cacioppo, 1996; Crites et al., 1995; Gardner et al., in press). Furthermore,
and as in prior research, variations in evaluative categorizations were more apparent over parietal regions (Cacioppo et al., 1993; see, also, Coles et al., 1990). The present research is also the first to demonstrate the LPP's sensitivity to evaluative inconsistencies within a neutral context. Prior research has used either positive or negative contexts. Because the LPP is sensitive to both the valence of the target and of the contextual stimuli in which it i s embedded, the neutral context of the present experiments provides a clearer depiction of positive and negative categoriza- tion processes per se. The results of both experiments showed clearly that the evaluative categorization of negative stimuli was associated with a larger amplitude LPP than was the evaluative categorization of equally probable, equally evaluatively extreme, and equally arousing positive stimuli.
Locating the Negativity Bias
Cacioppo et al. (1997) describe the negativity bias as the tendency for a unit of activation to result in a greater change in output in the negative motivational system as compared with the positive motivational system. As a consequence of the nega- tivity bias, attitudinal and behavioral expressions should be more strongly influenced by negative input than positive input (Cacioppo & Berntson, 1994). Ample evidence demonstrates
NEGATIVITY BIAS IN EVALUATIVE CATEGORIZATIONS 897
greater responsivity to negative stimuli than positive stimuli, as reviewed in the introduction. What is not clear from prior re- search is the stage at which the negativity bias operates. As we noted, Cannon's (1929) notion that threatening stimuli are more likely to elicit general and diffuse sympathetic activation as part of an adaptive fight-or-flight response emphasizes the relative impact of negative information on action tendencies. Such an analysis may suggest that the negativity bias is introduced at the response output stage through some form of response prim- ing. The model of evaluative space, although not denying the possibility of response priming, treats the negativity bias as an inherent characteristic of the negative motivational system in the central nervous system (Cacioppo et al., 1997; Cacioppo & Berntson, 1994), leading to the prediction that the negativity bias operates automatically at the evaluative-categorization stage.
Assuming that the negativity bias operates at the evaluative- categorization stage, one question that can be asked is whether the negativity bias will always operate at this stage. Although greater responsivity to comparable activation is viewed in the model of evaluative space as an inherent characteristic of the negative motivation system, the negativity bias does not imply that the intensity of observed or reported negative evaluations will always exceed positive evaluations because of the associ- ated axiom of a positivity offset (Cacioppo & Berntson, 1994; Cacioppo et al., 1997). The positivity offset refers to a tendency toward greater output from the positive motivational system than negative motivational system when motivational activation is low.
Operation of the positivity offset was seen in the activation functions reported by Ito et al. (1998). As we noted in the introduction, regression analyses relating ratings of positivity and negativity to ratings of arousal (used as a proxy for motiva- tional activation) revealed a steeper slope for the activation func- tion of negativity. In addition to demonstrating the negativity bias, these analyses also revealed a positivity offset in the form of a higher intercept value for the regression line of positivity than for negativity (see Ito et al., 1998, Figure 9) /2 That is, when motivational activation is low, the motivation to approach exceeds the motivation to withdraw. The positivity offset is likely responsible for a wide range of effects, such as the ten- dency to rate new acquaintances more positively than negatively, even when little is known about them (e.g., Kaplan, 1972; Gard- ner, 1996).
The steeper slope for the activation function of negativity suggests that the negative motivational system is structured to respond more intensely than the positive motivational system to comparable levels of motivational activation, but whether these differences in responsivity manifest themselves as more extreme negative evaluations depends on how much motivational activa- tion is present. At the lowest levels, the higher intercept value for positivity results in more extreme positive evaluations than negative evaluations. As motivational activation increases, the steeper slope for the activation function of negativity leads the two activation functions to cross. After this intersection, output from the negative motivational system is greater than output from the positive motivational system (given equal motivational input to both systems), resulting in more extreme negative eval- uations than positive evaluations. In sum, the underlying motiva-
tional system for negativity is predicted to always respond more intensely per unit of activation than the positive motivational system, but whether these differences manifest themselves as more extreme negative evaluations than positive evaluations will depend on the activation levels of each and whether relatively weak or strong input is present. In the present experiments, relatively intense positive and negative stimuli were used, lead- ing us to predict LPP amplitude differences as a function of picture valence.
Another relevant question is why the negativity bias operates as early as the evaluative-categorization stage. If the negativity bias operated only at response stages, it would be difficult to redirect attention immediately, seamlessly, and effortlessly to potentially threatening events. Indeed, the adaptive advantage that the negativity bias confers to affective processing led us to suggest its operation at the earliest stages of evaluative pro- cessing (Cacioppo & Berntson, 1994; Cacioppo et al., 1997; see also Peeters & Czapinski, 1990). The notion that the negativ- ity bias reflects a rapid, automatic feature of evaluative (i.e., affective) processing is further suggested by the correspondence between the experimental conditions and the conditions required for what Bargh (1989) has referred to as an unintended, goal- dependent automaticity. As Bargh notes, all automaticities are to some extent conditional, in that they depend on the occurrence of some minimal set of circumstances. In the case of an unin- tended goal-dependent automaticity, the individual must be aware of the instigating stimulus and have a specific processing goal in mind, but intention for the effect to occur and conscious guidance of the process to completion are not required. The operationalizations in the present experiments appear to have met the conditions for unintended goal-dependent automaticity. The experimental stimuli were presented above sensory thresh- olds, and participants were given the processing goal of per- forming evaluative categorizations. At the same time, no men- tion of the negativity bias was made prior to the experimental trials, and there is no reason to expect that participants intended to display a negativity bias or that they consciously guided the negative and positive motivational systems to respond in ways that produced the observed differences in LPP amplitudes.
We do not assume that evaluative categorizations in general or the operation of the negativity bias in particular are necessar- ily goal-dependent, however. To the contrary, numerous studies have shown that the activation of evaluations stored in memory is a relatively unconditional phenomenon that can be triggered by the mere presence of an attitude object in the environment (Bargh, Chaiken, Govender, & Pratto, 1992; Fazio, Sanbon- matsu, Powell, & Kardes, 1986). Similarly, evidence consistent with the negativity bias has been obtained in paradigms in which an explicit evaluative task was not given (Pratto & John, 1991). This specific ability to operate automatically may increase the adaptive utility of the negativity bias by allowing organisms to
12 The positivity offset, in the form of a higher intercept value for the gradient relating positive evaluations and motivational activation, was also seen in the regression analyses on stimuli from the English Affective Lexicon (Bradley et al., 1997). In addition, all nonlinear regression analyses discussed in Footnote 1 also contained a higher intercept value for the positive gradient.
898 ITO, LARSEN, SMITH, AND CACIOPPO
avoid harm even when they are not explicitly sensitized to do so.
Implications of Other Models
As we have noted, the present results suggest that the negativ- ity bias operates as an automatic feature of the underlying nega- tive motivational system. Alternatively, the negativity bias has been explained in terms of differential diagnosticity for negative information as compared with positive information within the impression-formation domain (Reeder & Brewer, 1979; Skow- ronski & Carlston, 1989). According to this view, behaviors differ in how diagnostic they are of membership in a particular category, with negative behaviors often carrying more diagnos- tic information than positive ones.
Whereas impressions can covary as a function of diagnos- ticity, several lines of research suggest that the operation of a negativity bias in the underlying negative motivational system has more explanatory power than a diagnosticity-based explana- tion for negativity bias effects. The negativity bias has been observed in impression-formation tasks, even when negative be- haviors are not the most diagnostic (Ganzach, 1995; Gardner, 1996; Rowe, 1989), and in domains in which trait diagnosticity is not relevant (e.g., Ito et al., 1998; Miller, 1959). An explana- tion that makes reference to the underlying motivational system rather than diagnosticity also has the power to generalize to a greater number of situations. The diagnosticity explanation addresses information integration (i.e., how an impression of a person is formed from knowledge of that individual's different traits and behaviors) and has dealt with the attribution of traits to an individual (i.e., determining how moral a person is). In addition, diagnosticity effects may depend on learning, oc- curring only after the organism learns which behaviors are diag- nostic for a particular domain. In contrast, the negativity bias as we have conceptualized it functions as a property of the underlying negative motivational system alone. As such, it is expected to manifest itself in domains other than trait attribution and impression formation and to operate independent of learn- ing. At the same time, although we believe that differences in the activation functions of negativity and positivity are sufficient to result in greater responsivity to negative information, we do not doubt that differences in diagnosticity can affect evaluations. The latter effects, however, may be more limited in scope.
It is also possible that the effects observed in the present experiments were due not to the activation function of the nega- tive motivational system but to differences in the ease with which negative and positive stimuli could be classified; that is, negative stimuli may have contained greater informational value than positive stimuli, and this may have resulted in larger LPPs to negative stimuli. Although it seems clear that stimuli can differ in the extent to which they convey their evaluative mean- ing, there is no evidence that ease of classification varied sys- tematically with stimulus valence in the present experiments. If stimuli of one valence were more easily classified, then we might expect faster classifications for those items. When latencies of the LPPs were examined, however, no differences in stimulus valence were found. LPP latency is relevant to this issue because it is thought to reflect relative stimulus evaluation time (Don- chin, 1979) so that latencies increase as the categorization task
becomes more difficult (Kutas, McCarthy, & Donchin, 1977). If negative stimuli were more easily classified than positive stimuli, shorter LPP latencies should have been found for negative pic- tures as compared with positive pictures. Instead, LPP latencies were equivalent for negative, positive, and neutral stimuli (see Figures 1 and 2), suggesting equal ease of classification across stimulus valence.
A final alternative explanation for the larger LPPs for negative pictures is that they may have been more surprising or novel than positive pictures. This possibility stems from an assumed greater base rate of positive occurrences than negative occur- rences in everyday life. Although we did not obtain direct mea- sures of surprise or novelty in the present experiments, extant research indicates that there have been no systematic differences in the novelty of positive and negative stimuli within an experi- mental setting. Prior research involving similar stimuli reveals that positive and negative stimuli are (a) viewed for an equiva- lent duration in free-viewing periods (and for a longer duration than are neutral stimuli; Bradley, Cuthbert, & Lang, 1990, 1991; Lang, Greenwald, Bradley, & Hamm, 1993); (b) recalled with equal frequency and at a higher rate than neutral items (Bradley, Cuthbert, & Lang, 1996; Bradley, Greenwald, Petry, & Lang, 1992); and (c) rated as more interesting than neutral stimuli. In fact, positive pictures are rated as more interesting than the negative ones (Bradley et al., 1990, 1991; Lang, Greenwald, Bradley, & Hamm, 1993). If the negative pictures were more novel or surprising, then we might expect them to have been viewed longer than positive or neutral pictures, to have been more memorable, or to have received higher interest ratings (e.g., Fisk & Schneider, 1984; Pratto & John, 1991). As can be seen, this has not been the case.
Specific features of our experimental paradigm also argue against a novelty explanation. The preexposure period in Experi- ment 2, in which participants paced themselves through sets of positive, negative, and neutral pictures from which the experi- mental stimuli were drawn, would have helped to diminish any possible global novelty differences between the classes of stim- uli. The negativity bias effect was seen both when preexposure occurred (Experiment 2) and when it did not (Experiment 1 ). The stimuli were also specifically presented in a way that would minimize global novelty effects. This was accomplished by es- tablishing a local context in which positive and negative stimuli were equally unlikely. From the perspective of a participant in Experiment 1, for example, the structuring of the sequences resulted in 540 presentations of neutral pictures but in only 30 each of positive and negative pictures. The local context of the experiment was therefore very potent in establishing equally low local base-rate expectations for positive and negative pictures. Research on the conceptually similar P300-ERP component re- veals that its amplitude is more sensitive to the local (as opposed to global) context (Squires, Wickens, Squires, & Donchin, 1976). Extant research and specific features of the present ex- periments suggest that a confound between valence and novelty is unlikely to have produced the LPP results obtained.
Whereas novelty effects were unlikely to have produced the present results, Pratto and John (1991) argued that humans possess a mechanism effortlessly directing attention to negative stimuli. Participants in their study performed a modified Stroop task in which they named the ink color used to print various
NEGATIVITY BIAS IN EVALUATIVE CATEGORIZATIONS 899
desirable and undesirable traits. Color-naming latencies were longer for the undesirable traits, suggesting that the negatively valenced stimuli attracted more attention from the pr imary task ( ink-color naming) than the positively valenced stimuli. Al- though potential differences in arousal between the words in the two valence categories could also produce attentional differ- ences (Lang et al., 1993), greater attention to negative stimuli is a plausible adaptive behavior. It is important to note that in Pratto and John ' s research, participants were not explicitly instructed to attend to stimulus valence, whereas an explicit evaluative task was performed in the present experiments. Taken together, Pratto and John ' s results suggest that negative stimuli may attract attention through an automatic vigilance mecha- nism, and the present results suggest that once attended, negative information has a greater impact than equally extreme positive information.
R e f e r e n c e s
Anderson, N. H. (1965). Averaging versus adding as a stimulus-combi- nation rule in impression formation. Journal of Personality and Social Psychology, 2, 1-9.
Bargh, J. A. (1989). Conditional automaticity: Varieties of automatic influence in social perception and cognition. In J. S. Uleman & J. A. Bargh (Eds.), Unintended thought (pp. 3-51 ). New York: Guilford Press.
Bargh, J. A., Chaiken, S., Govender, T., & Pratto, E (1992). The general- ity of the automatic attitude activation effect. Journal of Personality and Social Psychology, 62, 893-912.
Birnbaum, M. (1972). Morality judgements: Tests of an averaging model. Journal of Experimental Psychology, 93, 35-42.
Bradley, M.M., Cuthbert, B. N., & Lang, P.J. (1990). Startle reflex modification: Emotion or attention? Psychophysiology, 27, 513-522.
Bradley, M. M., Cuthbert, B. N., & Lang, P. J. ( 1991 ). Startle and emo- tion: Lateral acoustic probes and the bilateral blink. Psychophysiology, 28, 285-295.
Bradley, M. M., Cuthbert, B. N., & Lang, P. J. (1996). Picture media and emotion: Effects of a sustained affective context. Psychophysiol- ogy, 33, 662-670.
Bradley, M.M., Greenwald, M. K., Petry, M., & Lang, P.J. (1992). Remembering pictures: Pleasure and arousal in memory. Journal of Experimental Psychology: Learning, Memory, and Cognition, 18, 379-390.
Bradley, M. M., Lang, P. J., & Cuthbert, B. N. (1997). Affective norms for English words. Gainesville: Center for the Study of Emotion and Attention--National Institute of Mental Health (CSEA-NIMH), University of Florida.
Cacioppo, J. T., & Berntson, G. G. (1994). Relationship between atti- tudes and evaluative space: A critical review, with emphasis on the separability of positive and negative substrates. Psychological Bulle- tin, 115, 401-423.
Cacioppo, J.T., Crites, S. L., Jr., Berutson, G. G., & Coles, M. G. H. (1993). If attitudes affect how stimuli are processed, should they not affect the event-related brain potential? Psychological Science, 4, 108-112.
Cacioppo, J. T., Crites, S. L., Jr., & Gardner, W. L. (1996). Attitudes to the right: Evaluative processing is associated with lateralized late positive event-related brain potentials. Personality and Social Psy- chology Bulletin, 22, 1205-1219.
Cacioppo, J.T., Crites, S.L., Jr., Gardner, W.L., & Berntson, G.G. (1994). Bioelectrical echoes from evaluative categorizations: I. A late positive brain potential that varies as a function of trait negativity and
extremity. Journal of Personality and Social Psychology, 67, 115- 125.
Cacioppo, J. T., & Gardner, W. L. (in press). Emotion. Annual Review of Psychology, 50.
Cacioppo, J.T., Gardner, W.L., & Bemtson, G.G. (1997). Beyond bipolar conceptualizations and measures: The case of attitudes and evaluative space. Personality and Social Psychology Review, 1, 3- 25.
Cannon, W. B. (1929). Bodily changes in pain, hunger, fear, and rage (2nd ed.). New York: Appleton-Century-Crofts.
Center for the Study of Emotion and Attention--National Institute of Mental Health (CSEA-NIMH). (1995). The international affective picture system: Digitized photographs. Gainesville: The Center for Research in Psychophysiology, University of Florida.
Coles, M. G. H., Gratton, G., & Fabiani, M. (1990). Event-related brain potentials. In J. T. Cacioppo & L. G. Tassinary (Eds.), Principles of psychophysiology: Physical, social, and inferential elements (pp. 413-455). Cambridge, England: Cambridge University Press.
Coles, M. G. H., Gratton, G., Kramer, A. E, & Miller, G.A. (1986). Principles of signal acquisition and analysis. In M. G. H. Coles, E. Donchin, & S.W. Porges (Eds.), Psychophysiology: Systems, pro- cesses, and applications (pp. 183-226). New York: Guilford Press.
Crites, S. L., Jr., & Cacioppo, J. T. (1996). Electrocortical differentiation of evaluative and nonevaluative categorizations. Psychological Sci- ence, 7, 318-321.
Crites, S.L., Jr., Cacioppo, J.T., Gardner, W. L., '& Berntson, G.G. (1995). Bioelectrical echoes from evaluative categorizations: II. A late positive brain potential that varies as a function of attitude regis- tration rather than attitude report. Journal of Personality and Social Psychology, 68, 997-1013.
Donchin, E. (1979). Event-related potentials: A tool in the study of human information processing. In H. Begleiter (Ed.), Evoked poten- tials and behavior (pp. 13-75). New York: Plenum.
Donchin, E. (1981). Surprise! . . . Surprise? Psychophysiology, 18, 493-513.
Donchin, E., & Coles, M. G. H. (1988). Is the P300 component a mani- festation of context updating? Behavioral and Brain Sciences, 11, 357-374.
Edwards, A. L. (1946). A critique of "neutral" items in attitude scales constructed by the method of equally appearing intervals. Psychologi- cal Review, 53, 159-169.
Fazio, R.H., Sanbonmatsu, D.M., Powell, M.C., & Kardes, E R. (1986). On the automatic activation of attitudes. Journal of Personal- ity and Social Psychology, 50, 229-238.
Feldman, S. (1966). Motivational aspects of attitudinal elements and their place in cognitive interaction. In S. Feldman (Ed.), Cognitive consistency (pp. 76-114). San Diego, CA: Academic Press.
Fisk, A. D., & Schneider, W. (1984). Memory as a function of attention, level of processing, and automatization. Journal of Experimental Psy- chology: Learning, Memory, and Cognition, 38, 889-906.
Fiske, S.T. (1980). Attention and weight in person perception: The impact of negative and extreme information. Journal of Personality and Social Psychology, 38, 889-906.
Ganzach, Y. (1995). Negativity (and positivity) in performance evalua- tion: Three field studies. Journal of Applied Psychology, 80, 491- 499.
Gardner, W. L. (1996). Biases in impression formation: A demonstration of a bivariate model of evaluation (positivity, negativity). Unpub- lished doctoral dissertation, Ohio State University, Columbus.
Gardner, W.L., Cacioppo, J.T., Berntson, G.G., & Crites, S.L., Jr. (in press). Distinguishing hostile from hospitable events: Individual differences in evaluative categorizations as indexed by a late positive brain potential. Social Cognition.
Gehring, W.J., Gratton, G., Coles, M. G. H., & Donchin, E. (1992).
900 ITO, LARSEN, SMITH, AND CACIOPPO
Probability effects on stimulus evaluation and response processes. Journal of Experimental Psychology: Human Perception and Perfor- mance, 18, 198-216.
Goldstein, M. D., & Strube, M. J. (1994). Independence revisited: The relation between positive and negative affect in a naturalistic setting. Personality and Social Psychology Bulletin, 20, 57-64.
Hass, R. G., Katz, I., Rizzo, N., Bailey, J., & Eisenstadt, D. (1991). Cross-racial appraisal as related to attitude ambivalence and cognitive complexity. Personality and Social Psychology Bulletin, 17, 83-92.
Hodges, B. H. (1974). Effect of valence on relative weighting in impres- sion formation. Journal of Personality and Social Psychology, 30, 378-381.
Ito, T. A., & Cacioppo, J. T. (in press). The psychophysiology of utility appraisals. In D. Kahneman, E. Diener, & N. Schwartz (Eds.), Under- standing quality of life: Scientific perspectives on enjoyment and suf- fering. New York: Russell Sage Foundation.
Ito, T. A., Cacioppo, J. T., & Lang, P. J. (1998). Eliciting affect using the International Affective Picture System: Bivariate evaluation and ambivalence. Personali~ and Social Psychology Bulletin 24, 855- 879.
Kahneman, D., & Tversky, A. (1984). Choices, values, and frames. American Psychologist, 39, 341-350.
Kanouse, D. E., & Hansen, L. R., Jr. ( 1971 ). Negativity in evaluations. In E. E. Jones, D. E. Kanouse, H. H. Kelley, R. E. Nisbett, S. Valin, & B. Weiner (Eds.), Attribution: Perceiving the causes of behavior (pp. 47-62) . Morristown, NJ: General Learning Press.
Kaplan, K. J. (1972). On the ambivalence-indifference problem in atti- tude theory and measurement: A suggested modification of the seman- tic differential technique. Psychological Bulletin, 77, 361-372.
Kutas, M., McCarthy, G., & Donchin, E. (1977). Augmenting mental chronometry: The P300 as a measure of stimulus evaluation time. Science, 197, 792-795.
Lang, P. J., Greenwald, M. K., Bradley, M. M., & Hamm, A. O. (1993). Looking at pictures: Affective, facial, visceral, and behavioral reac- tions. Psychophysiology, 30, 261-273.
Lewin, K. ( 1935 ). A dynamic theory of personality. New York: McGraw- Hill.
Miller, N. E. (1959). Liberalization of the basic S -R concepts: Exten- sions to conflict behavior, motivation, and social learning. In S. Kock (Ed.), Psychology: A study of a science (pp. 198-292). New York: McGraw-Hill.
PC Paintbrush PhotoLibrary [ Computer software ]. (1994). Cambridge, MA: Softkey International.
Peeters, G., & Czapinski, J. (1990). Positive-negative asymmetry in evaluations: The distinction between affective and informational nega- tivity effects. In W. Stroebe & M. Hewstone (Eds.), European review of social psychology (Vol. 1, pp. 33-60). Chichester, England: Wiley.
Pratto, E, & John, O.P. (1991). Automatic vigilance: The attention- grabbing power of negative social information. Journal of Personality and Social Psychology, 61, 380-391.
Priester, J. R., & Petty, R. E. (1996). The gradual threshold model of ambivalence: Relating the positive and negative bases of attitudes to subjective ambivalence. Journal of Personality and Social Psychol- ogy, 71, 442-447.
Reeder, G. D., & Brewer, M. B. (1979). A schematic model of disposi- tional attribution in interpersonal perception. Psychological Review, 86, 61-79.
Rowe, E M. (1989). Unfavorable information and interview decisions. In R.W. Eder & G.R. Ferris (Eds.), The employment interview: Theory, research, and practice (pp. 77-89). Newbury Park, CA: Sage.
Scott, W. A. (1968). Attitude measurement. In G. Lindzey & E. Aronson (Eds.), Handbook of social psychology (Vol. 2, pp. 204-273 ). Read- ing, MA: Addison-Wesley.
Semlitsch, H. V., Anderer, P., Schuster, P., & Presslich, O. (1986). A solution for reliable and valid reduction of ocular artifacts, applied to the P300 ERP. Psychophysiology, 23, 695-703.
Skowronski, J. J., & Carlston, D. E. (1989). Negativity and extremity biases in impression formation: A review of explanations. Psychologi- cal Bulletin, 105, 131-142.
Squires, K. C., Wickens, C., Squires, N. K., & Donchin, E. (1976). The effect of stimulus sequence on the waveform of the cortical event- related potential. Science, 193, 1142-1146.
Taylor, S.E. (1991). Asymmetrical effects of positive and negative events: The mobilization-minimization hypothesis. Psychological Bulletin, 110, 67-85.
Thompson, M. M., Zanna, M. P., & Griffin, D. W. (1995). Let's not be indifferent about (attitudinal) ambivalence. In R.E. Petty & J.A. Krosnick (Eds.), Attitude strength: Antecedents and consequences (pp. 361-386). Mahwah, NJ: Erlbaum.
Received December 3, 1997 Revision received April 21, 1998
Accepted April 21, 1998 •