Embed Size (px)
Citation preview
The Burden of Neonatal Abstinence Syndrome
(NAS) in Michigan Michigan FIMR Quarterly Meeting
December 1, 2016
Outline • Background • Methods • Results
• State • Length of stay & cost • Region • Maternal characteristics • New method for calculating NAS rates
• Conclusion • Public Health Implications
Background • Neonatal Abstinence Syndrome (NAS), sometimes referred to as
Neonatal Withdrawal Syndrome (NWS), occurs in a newborn who was exposed to addictive illegal or prescription drugs in utero.
• Two major types are recognized • Due to prenatal or maternal use during pregnancy • Postnatal NAS secondary to discontinuation of medications such as fentanyl
or morphine used for pain therapy in the infant
• The risk is greatest when the mother uses prescription opioid pain relievers or heroin during pregnancy 1-2
Background-1
• Maternal substance use is a leading preventable cause of mental, physical and psychological problems in infants and children.
• Infants with NAS are more likely to be born with low birthweight, have breathing and feeding problems, and seizures.
• Signs can include tremors, twitching, fussiness, excessive crying, fever, trouble sleeping, diarrhea, vomiting, and/or stuffiness/sneezing.
Drugs Associated with NAS
• Opioids: • Heroin • Methadone • Fentanyl • Morphine • Demerol • OxyContin
• Non-opioid CNS Depressants: (May mimic NAS)
• Benzodiazepines • SSRI’s • Barbiturates • Anticonvulsants • Antipsychotics • Alcohol
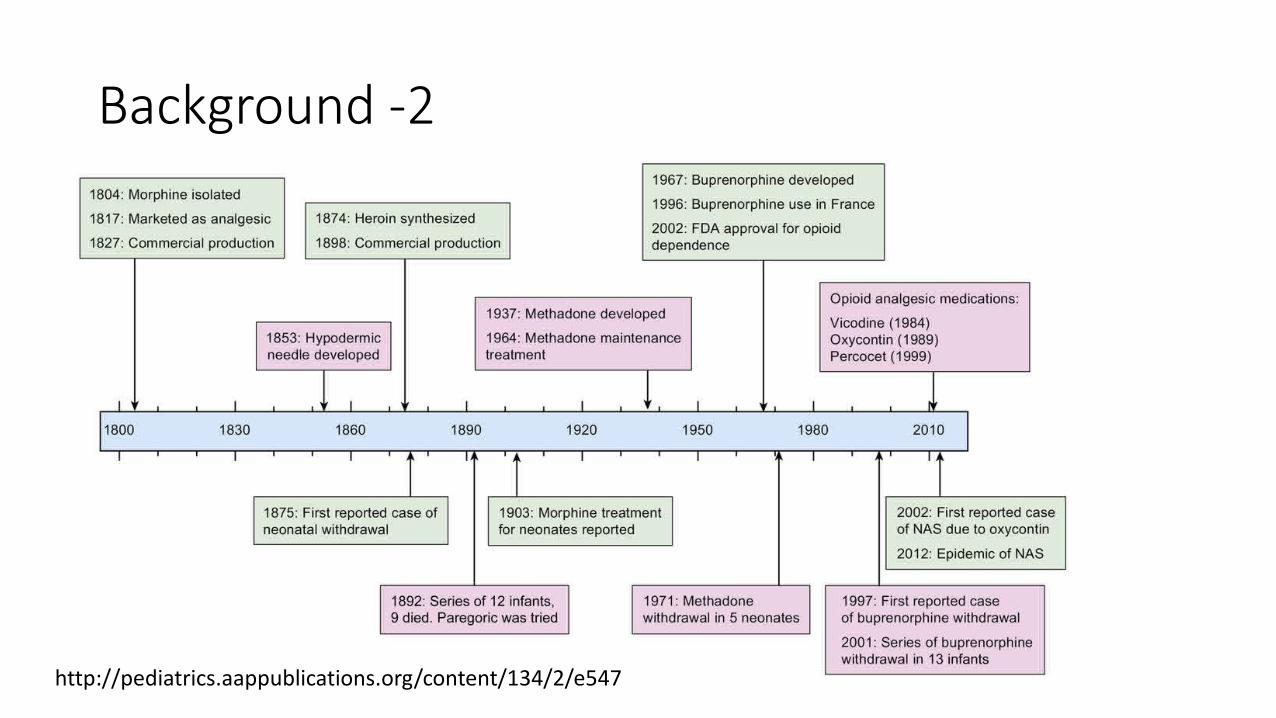
Background -2
http://pediatrics.aappublications.org/content/134/2/e547
Background-3
• Prescription drug use is growing • Increase in overdoses and deaths associated with non-medical prescription
drug use over the past decade
600
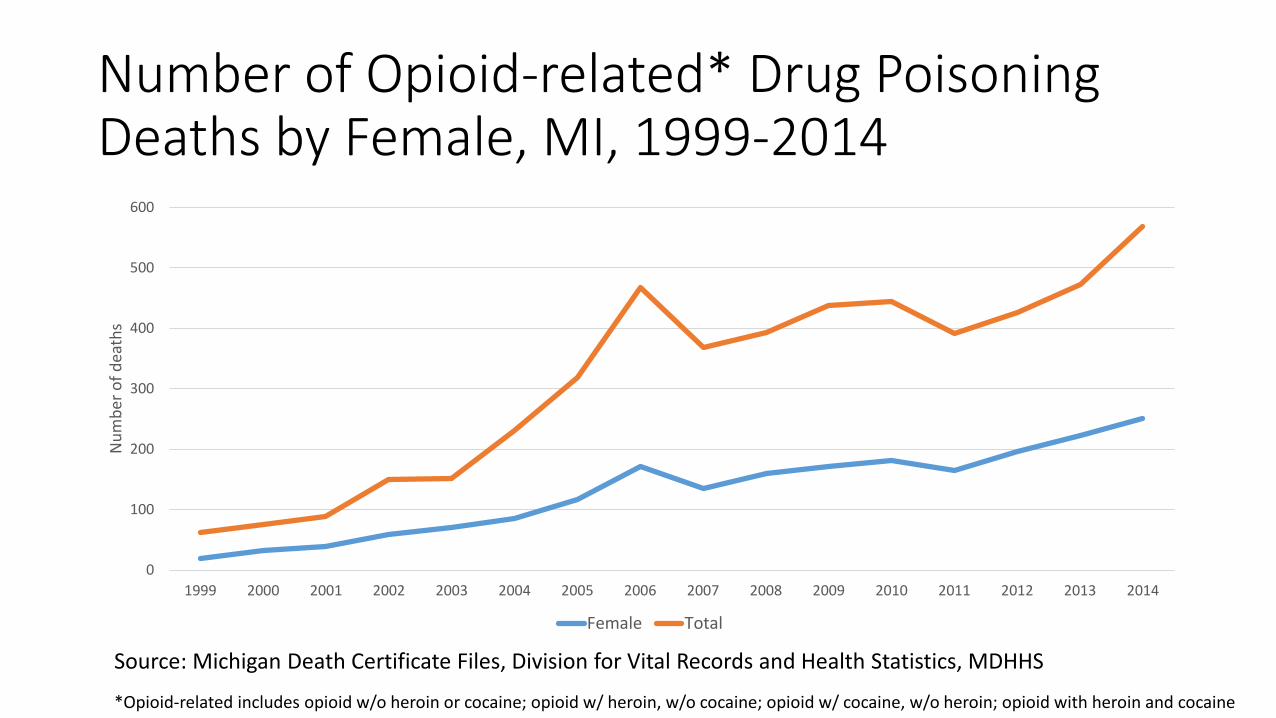
Number of Opioid-related* Drug Poisoning Deaths by Female, MI, 1999-2014
Num
ber o
f dea
ths
500
400
300
200
100
1999 2000 2001 2002 2003 2004 2005 2006 2007 2008 2009 2010 2011 2012 2013 2014
Female Total
Source: Michigan Death Certificate Files, Division for Vital Records and Health Statistics, MDHHS
*Opioid-related includes opioid w/o heroin or cocaine; opioid w/ heroin, w/o cocaine; opioid w/ cocaine, w/o heroin; opioid with heroin and cocaine
0
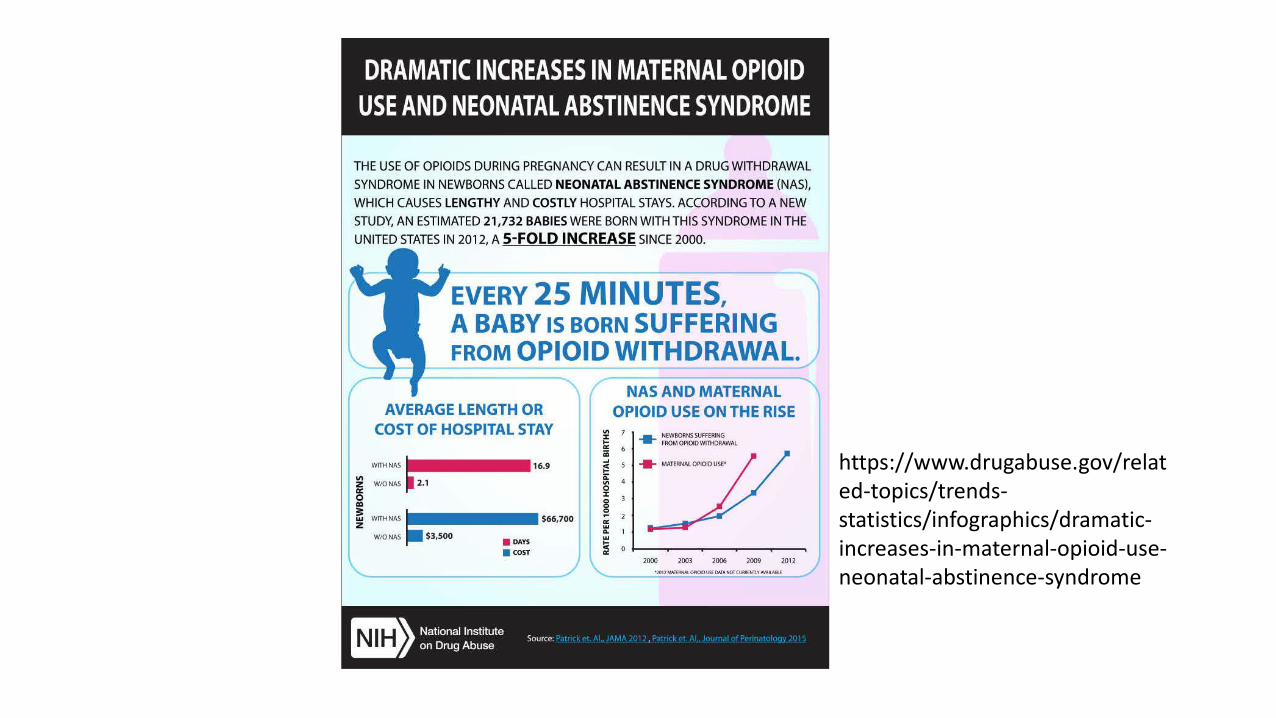
DRAMATIC INCREASES IN MATERNAL OPIOID USE AND NEONATAL ABSTINENCE SYNDROME
THE USE OF OPIOIDS DURING PREGNANCY CAN RESULT IN A DRUG WITHDRAWAL
SYNDROME IN NEWBORNS CALLED NEONATAL ABSTINENCE SYNDROME (NAS),
WHICH CAUSES LENGTHY AND COSTLY HOSPITAL STAYS. ACCORDING TO A NEW
STUDY, AN ESTIMATED 21,732 BABIES WERE BORN WITH THIS SYNDROME IN THE
UNITED STATES IN 2012, A 5-FOLD INCREASE SINCE 2000.
EVERY 25 MINUTES, A BABY IS BORN SUFFERING FROM OPIOID WITHDRAWAL.
AVERAGE LENGTH OR COST OF HOSPITAL STAY
WITH NAS •r••••••16.9
i W/ONAS ~ 2.1
i ! WITHNAS =------ $66,700 z W/ONAS $3,500
• DAYS
• COST
~ SAND MATERNAL OPIOID USE ON THE RISE
- 2 a:: w c.. 1
2000 2003 2006 2009 2012
m~ National Institute on Drug Abuse
Source ,
https://www.drugabuse.gov/relat ed-topics/trends-statistics/infographics/dramatic-increases-in-maternal-opioid-use-neonatal-abstinence-syndrome
Background-5
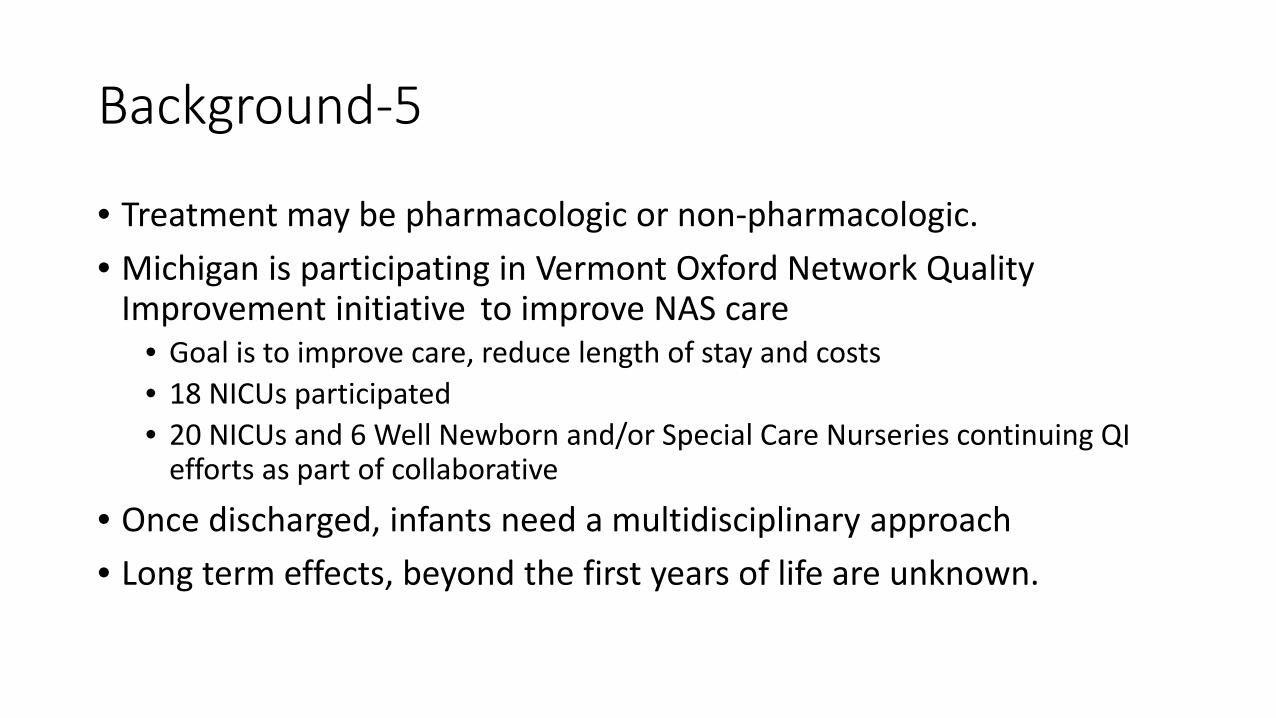
• Treatment may be pharmacologic or non-pharmacologic. • Michigan is participating in Vermont Oxford Network Quality
Improvement initiative to improve NAS care • Goal is to improve care, reduce length of stay and costs • 18 NICUs participated • 20 NICUs and 6 Well Newborn and/or Special Care Nurseries continuing QI
efforts as part of collaborative
• Once discharged, infants need a multidisciplinary approach • Long term effects, beyond the first years of life are unknown.
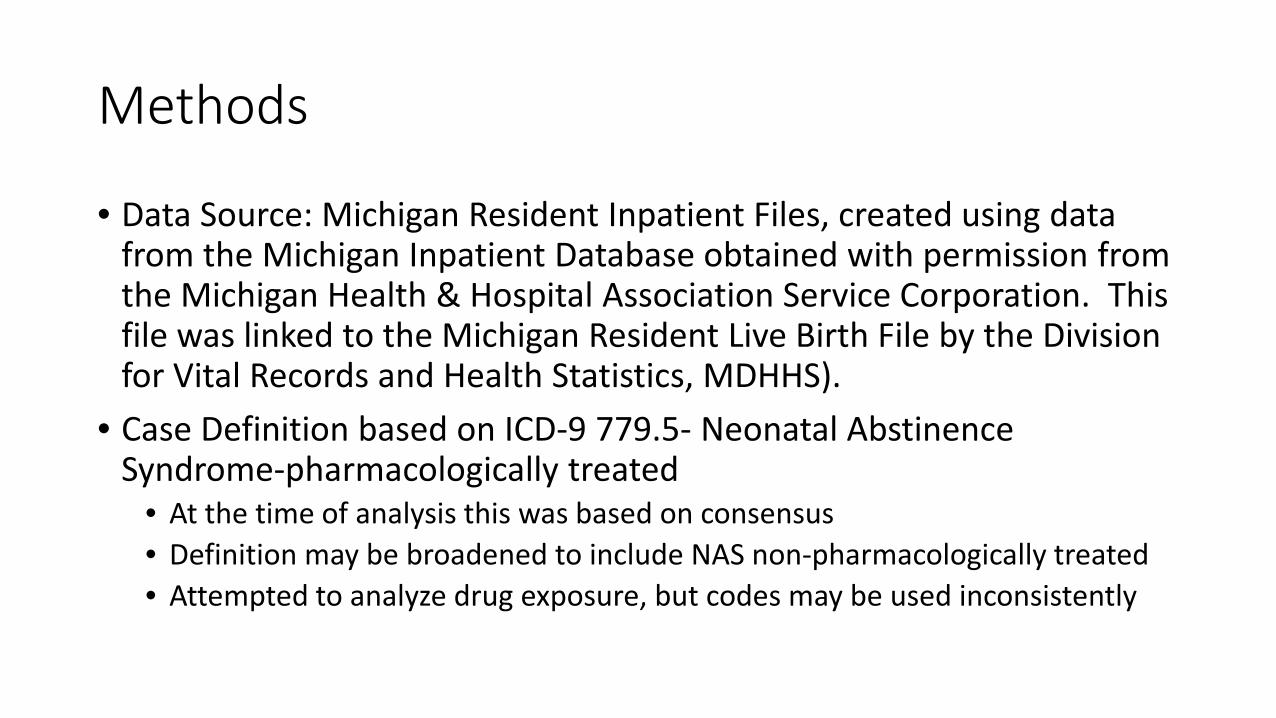
Methods
• Data Source: Michigan Resident Inpatient Files, created using data from the Michigan Inpatient Database obtained with permission from the Michigan Health & Hospital Association Service Corporation. This file was linked to the Michigan Resident Live Birth File by the Division for Vital Records and Health Statistics, MDHHS).
• Case Definition based on ICD-9 779.5- Neonatal Abstinence Syndrome-pharmacologically treated
• At the time of analysis this was based on consensus • Definition may be broadened to include NAS non-pharmacologically treated • Attempted to analyze drug exposure, but codes may be used inconsistently
Results - Michigan
800
700
600
500
per 100,000 400 live births
300
200
100
0
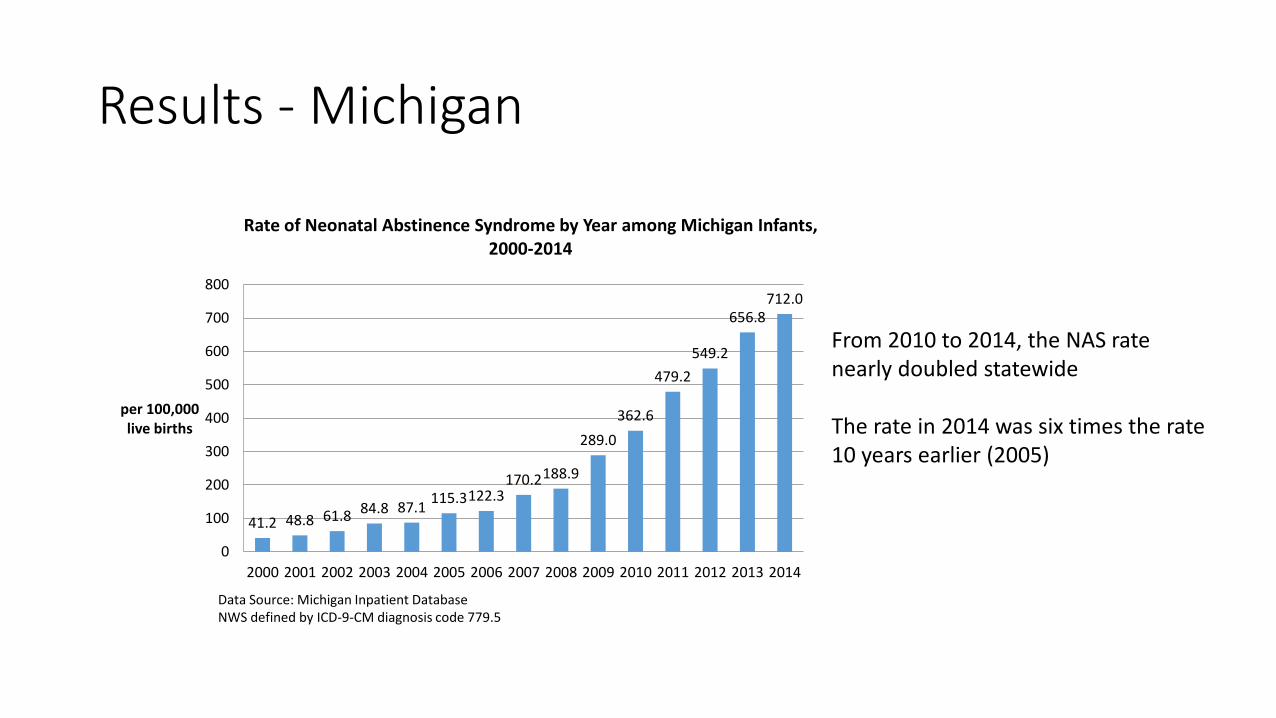
Rate of Neonatal Abstinence Syndrome by Year among Michigan Infants, 2000-2014
712.0 656.8
From 2010 to 2014, the NAS rate 549.2
nearly doubled statewide 479.2
362.6 The rate in 2014 was six times the rate 289.0
10 years earlier (2005) 170.2188.9
115.3122.3
41.2 48.8 61.8 84.8 87.1
2000 2001 2002 2003 2004 2005 2006 2007 2008 2009 2010 2011 2012 2013 2014
Data Source: Michigan Inpatient Database NWS defined by ICD-9-CM diagnosis code 779.5
20.0
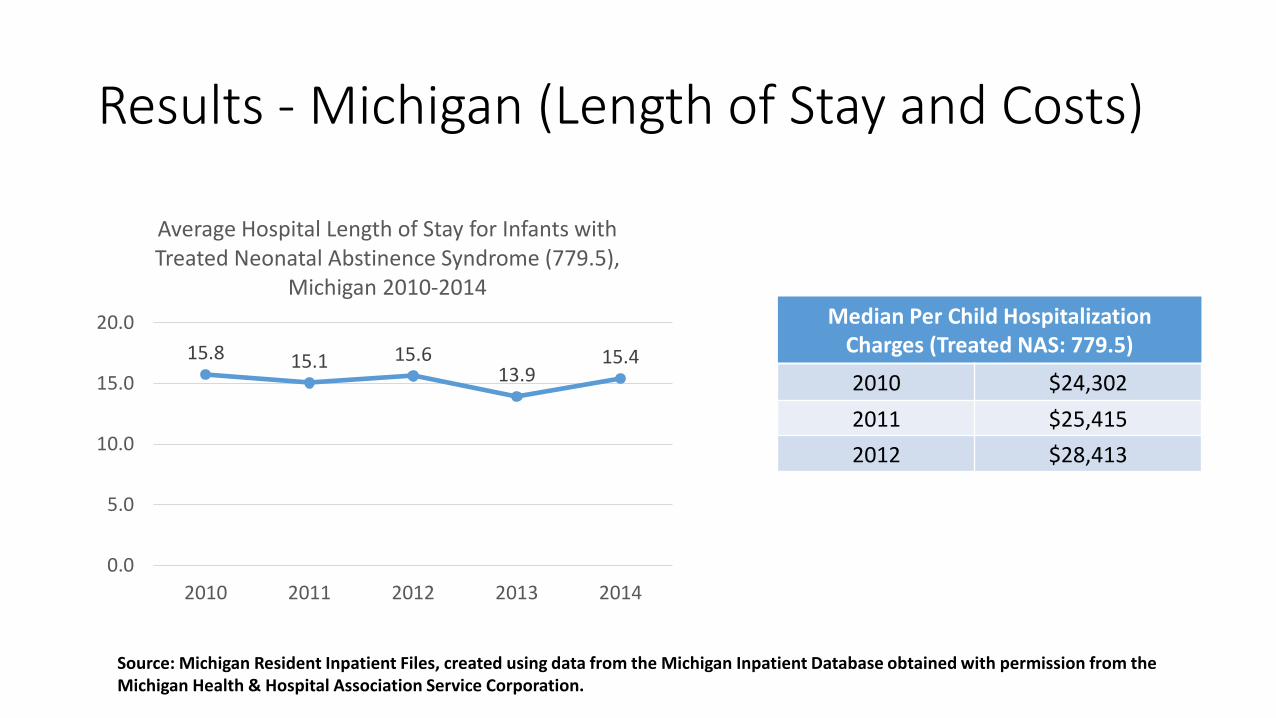
Results - Michigan (Length of Stay and Costs)
Average Hospital Length of Stay for Infants with Treated Neonatal Abstinence Syndrome (779.5),
Michigan 2010-2014
15.8 15.1 15.6 13.9
15.4 15.0
Median Per Child Hospitalization Charges (Treated NAS: 779.5)
2010 $24,302 2011 $25,415
10.0 2012 $28,413
5.0
0.0 2010 2011 2012 2013 2014
Source: Michigan Resident Inpatient Files, created using data from the Michigan Inpatient Database obtained with permission from the Michigan Health & Hospital Association Service Corporation.
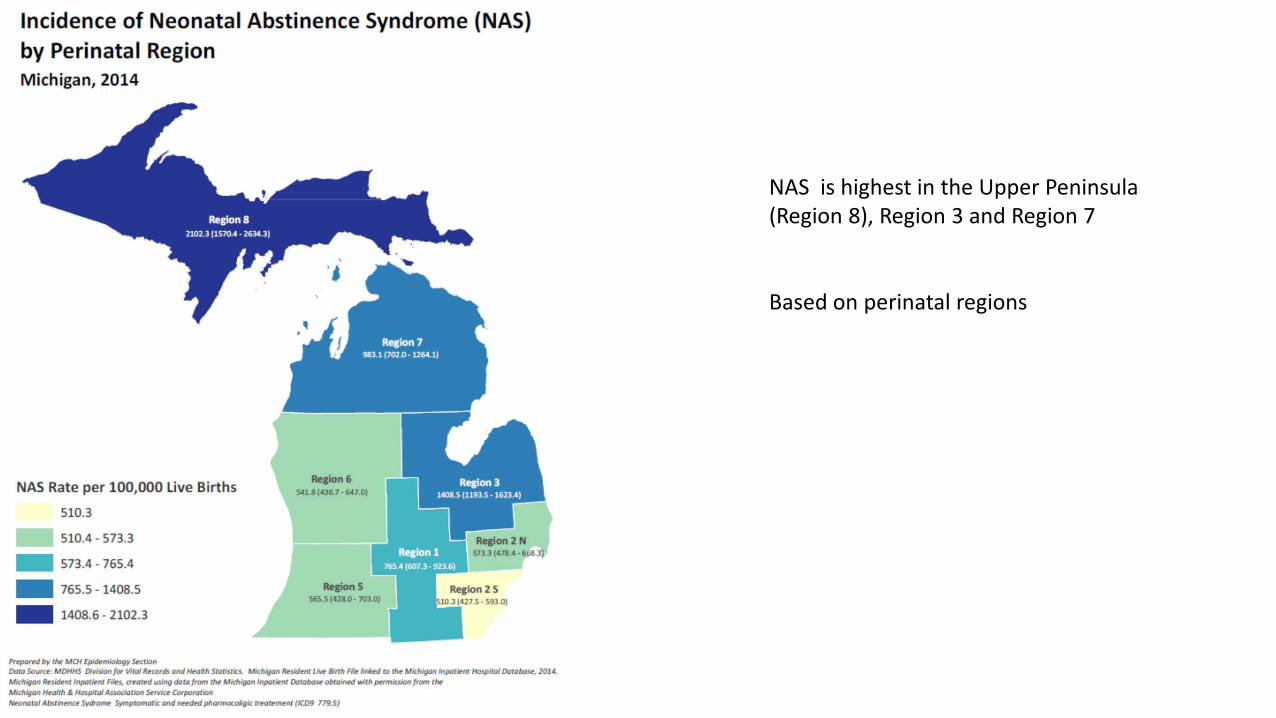
Results NAS is highest in the Upper Peninsula (Region 8), Region 3 and Region 7
Based on perinatal regions
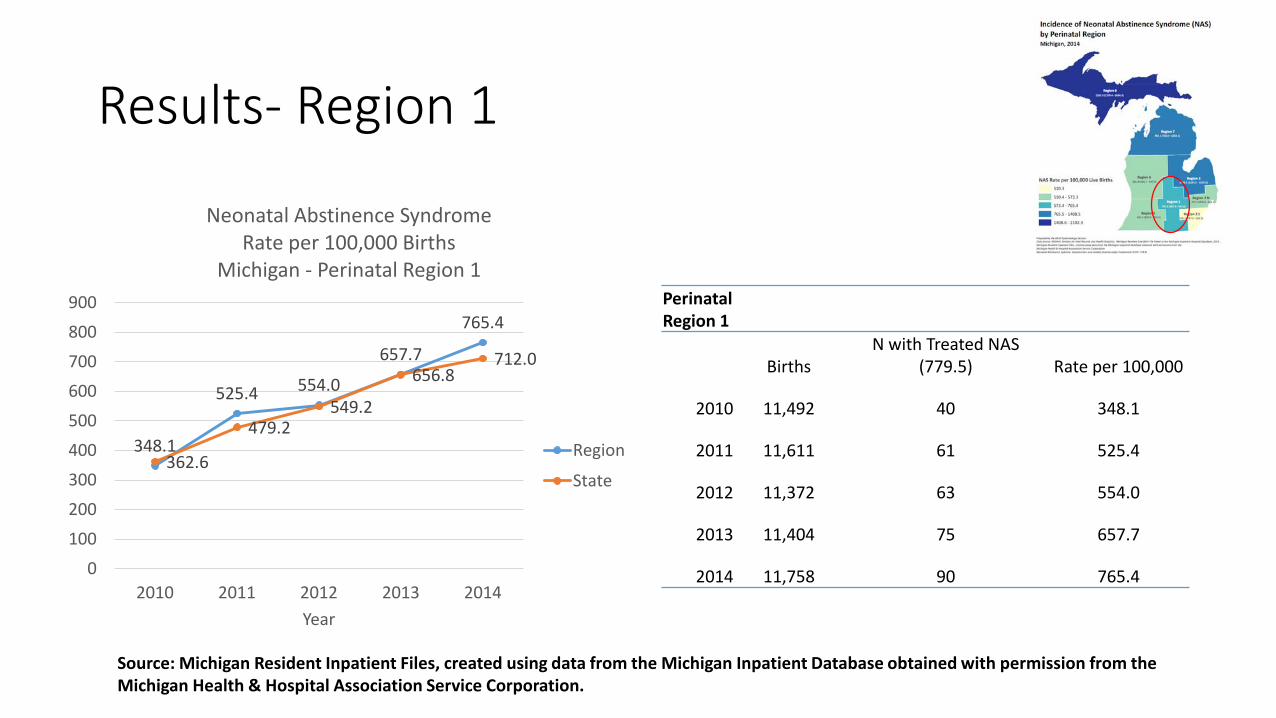
Results- Region 1
Neonatal Abstinence Syndrome Rate per 100,000 Births
Michigan - Perinatal Region 1 Perinatal 900
765.4 Region 1 800 N with Treated NAS
Births (779.5) Rate per 100,000
2010 11,492 40 348.1
Region 2011 11,611 61 525.4
State 2012 11,372 63 554.0
200
100 2013 11,404 75 657.7
0 2014 11,758 90 765.4 2010 2011 2012 2013 2014
Year
348.1
525.4 554.0
657.7
362.6
479.2 549.2
656.8 712.0
300
400
500
600
700
Source: Michigan Resident Inpatient Files, created using data from the Michigan Inpatient Database obtained with permission from the Michigan Health & Hospital Association Service Corporation.
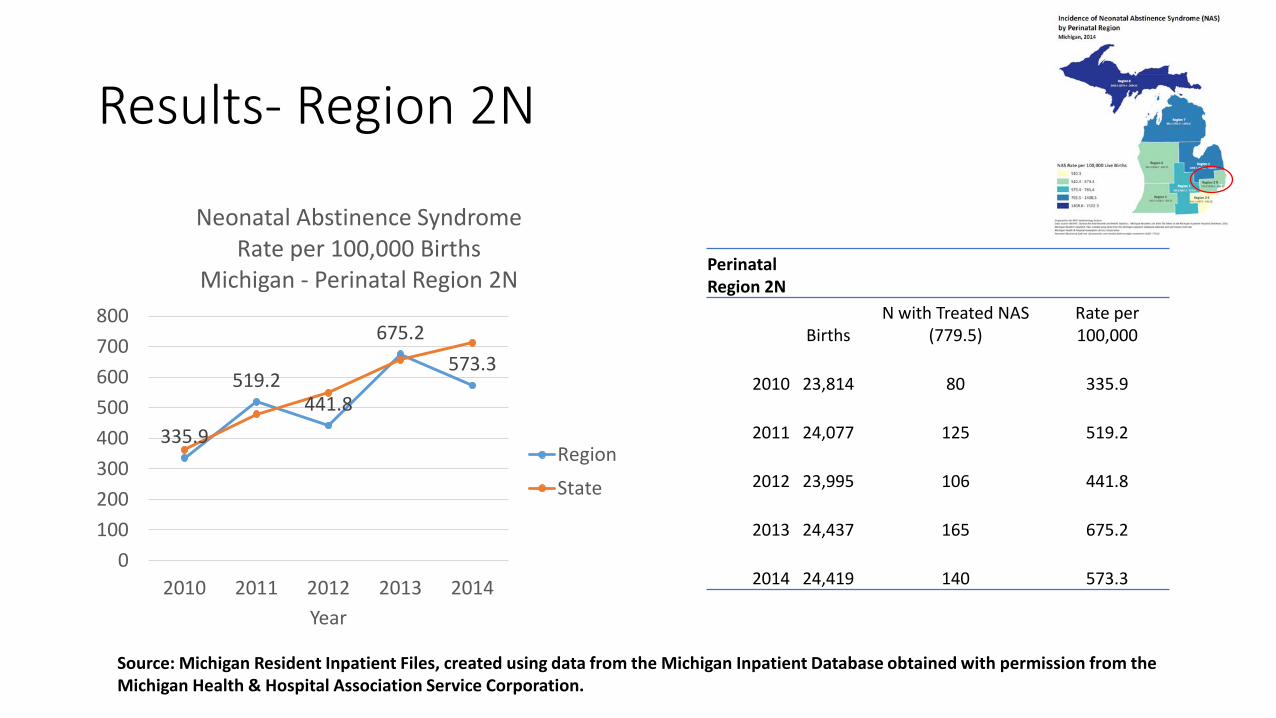
Results- Region 2N
Neonatal Abstinence Syndrome Rate per 100,000 Births
Perinatal Michigan - Perinatal Region 2N Region 2N
N with Treated NAS Rate per Births (779.5) 100,000
2010 23,814 80 335.9
2011 24,077 125 519.2 Region
2012 23,995 106 441.8 State 200 100 2013 24,437 165 675.2
0 2014 24,419 140 573.3 2010 2011 2012 2013 2014
Year
335.9
519.2 441.8
675.2 573.3
300 400 500 600 700 800
Source: Michigan Resident Inpatient Files, created using data from the Michigan Inpatient Database obtained with permission from the Michigan Health & Hospital Association Service Corporation.
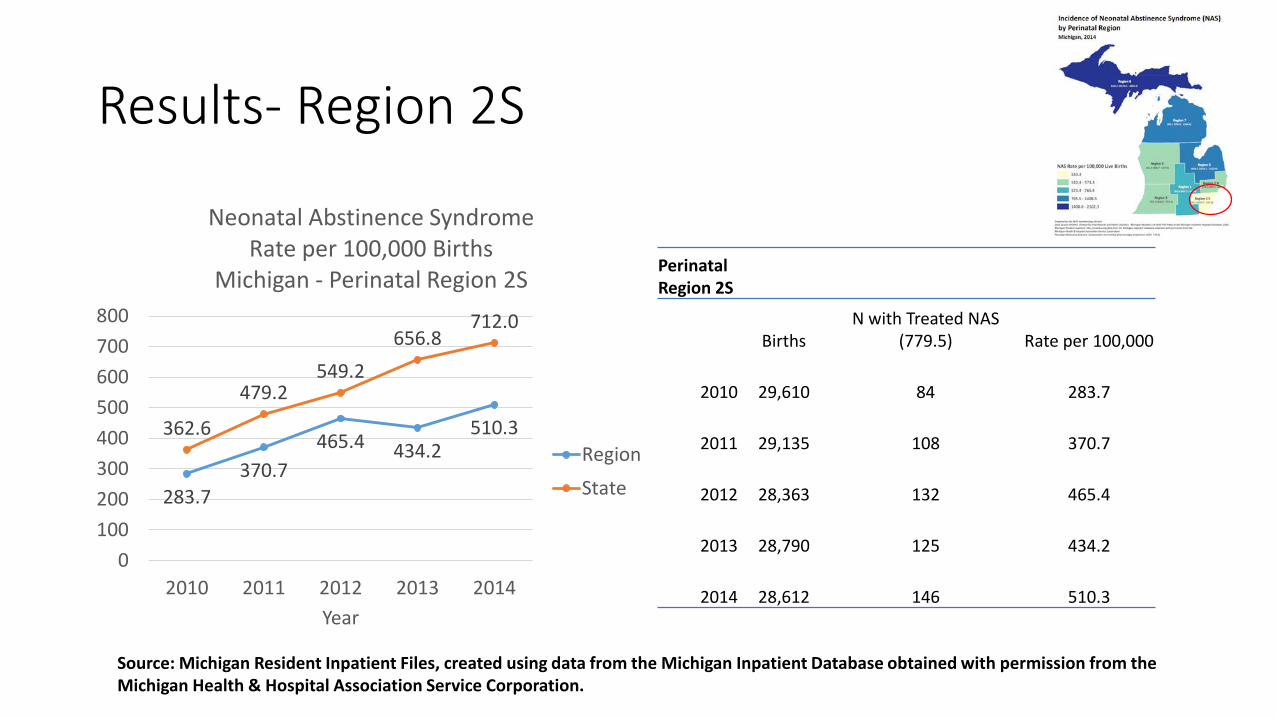
Results- Region 2S
Neonatal Abstinence Syndrome Rate per 100,000 Births
Michigan - Perinatal Region 2S 800 712.0 700 600 500 400 300 200 100
0
283.7 370.7
465.4 434.2 510.3 362.6
479.2 549.2
656.8
2010 2011 2012 2013 2014 Year
Perinatal Region 2S
Births N with Treated NAS
(779.5) Rate per 100,000
2010 29,610 84 283.7
Region
State
2011
2012
29,135
28,363
108
132
370.7
465.4
2013 28,790 125 434.2
2014 28,612 146 510.3
Source: Michigan Resident Inpatient Files, created using data from the Michigan Inpatient Database obtained with permission from the Michigan Health & Hospital Association Service Corporation.
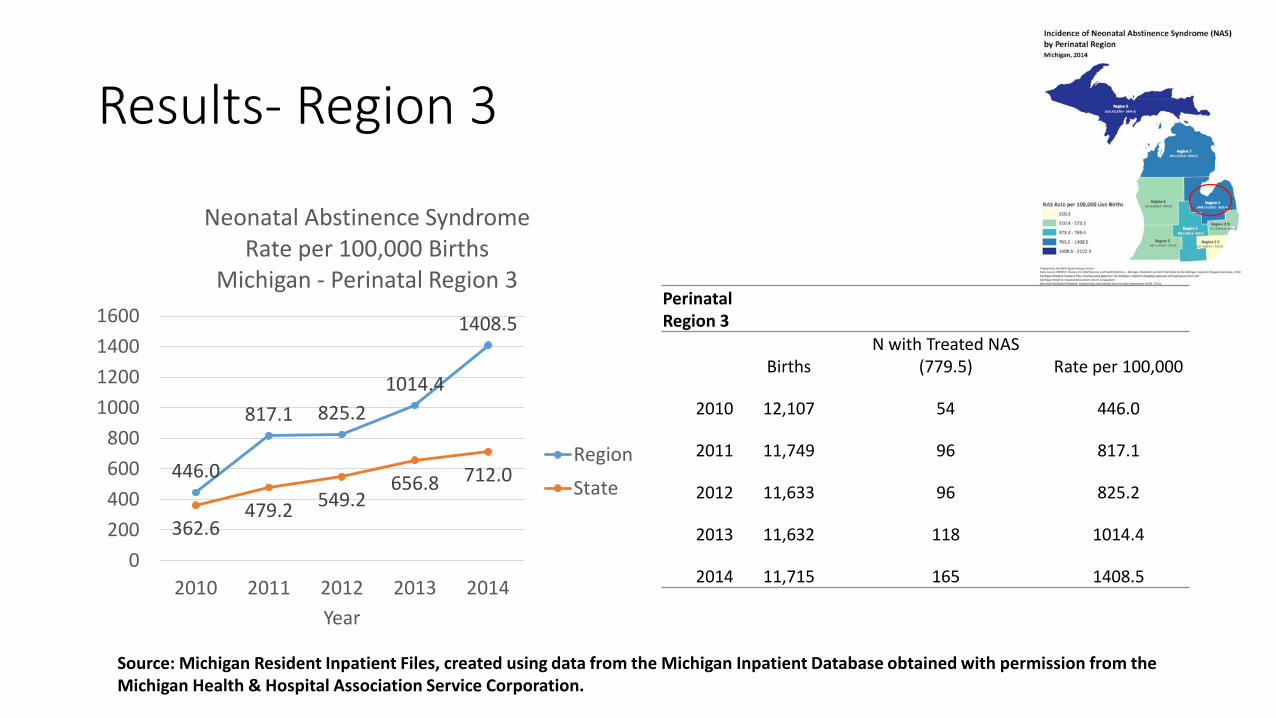
Results- Region 3
Neonatal Abstinence Syndrome Rate per 100,000 Births
Michigan - Perinatal Region 3 1600 1408.5 1400
1200
1000 2010 12,107 54 446.0
800 Region 2011 11,749 96 817.1
600 State 2012 11,633 96 825.2 400
200 2013 11,632 118 1014.4 0
2014 11,715 165 1408.5 2010 2011 2012 2013 2014
Year
Perinatal Region 3
N with Treated NAS (779.5) Rate per 100,000 Births
446.0
817.1 825.2 1014.4
362.6 479.2 549.2
656.8 712.0
Source: Michigan Resident Inpatient Files, created using data from the Michigan Inpatient Database obtained with permission from the Michigan Health & Hospital Association Service Corporation.
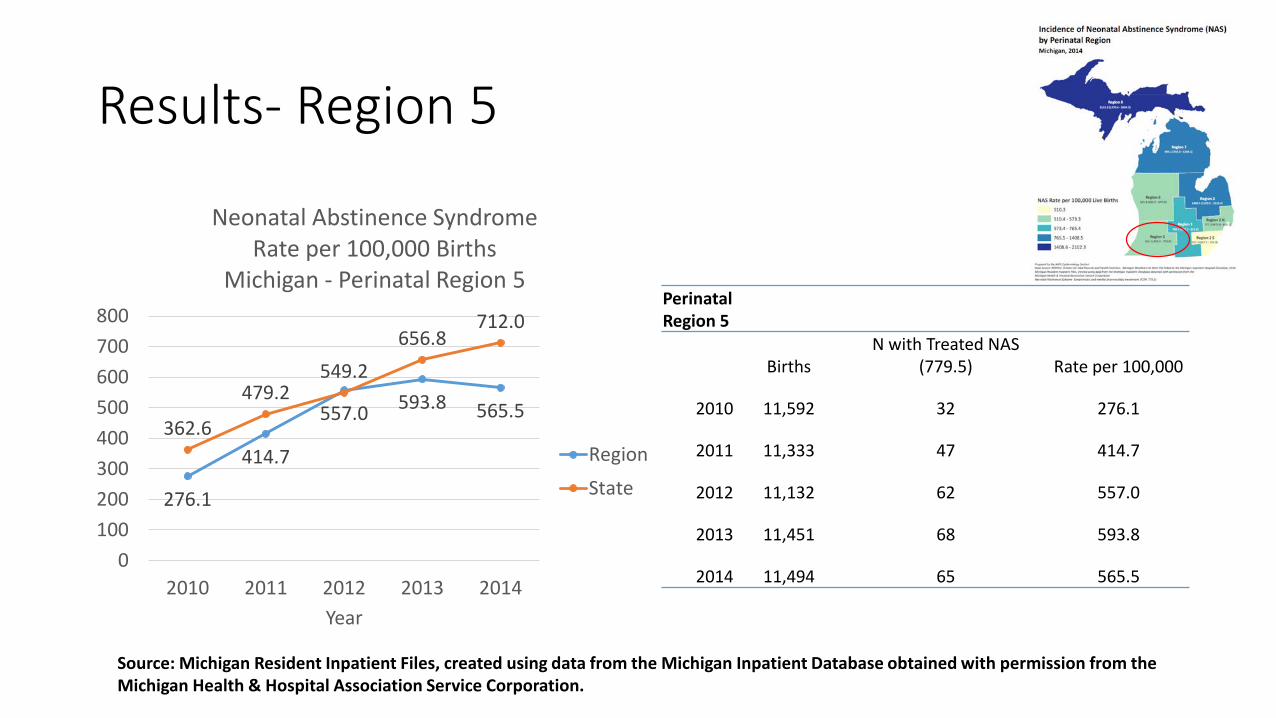
276.1
414.7
557.0 593.8 565.5 362.6
479.2 549.2
656.8
Region 2011 11,333 47 414.7 300
State 2012 11,132 62 557.0 200 100 2013 11,451 68 593.8
0 2014 11,494 65 565.5 2010 2011 2012 2013 2014
Year
Results- Region 5
Neonatal Abstinence Syndrome Rate per 100,000 Births
Michigan - Perinatal Region 5 800 712.0 700 600 500 400
Perinatal Region 5
N with Treated NAS Births (779.5) Rate per 100,000
2010 11,592 32 276.1
Source: Michigan Resident Inpatient Files, created using data from the Michigan Inpatient Database obtained with permission from the Michigan Health & Hospital Association Service Corporation.
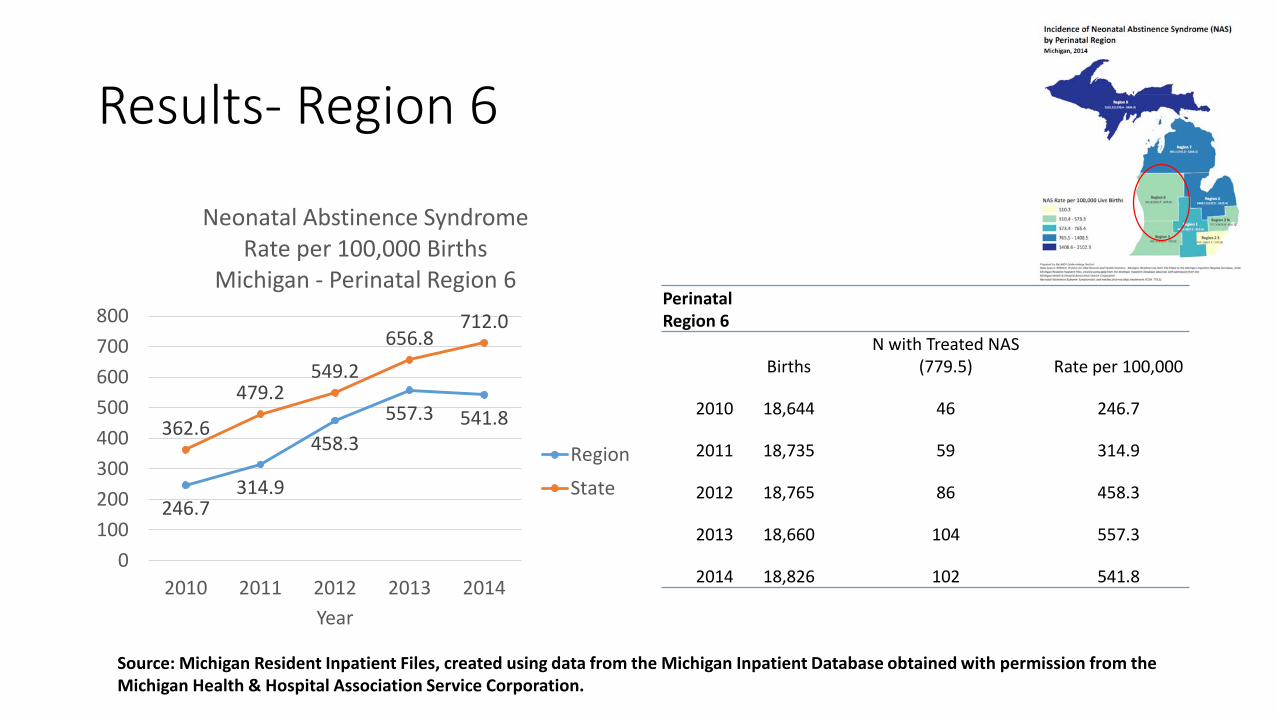
246.7 314.9
458.3 557.3 541.8 362.6
479.2 549.2
656.8
Region 2011 18,735 59 314.9 300
State 2012 18,765 86 458.3 200 100 2013 18,660 104 557.3
0 2014 18,826 102 541.8 2010 2011 2012 2013 2014
Year
Results- Region 6
Neonatal Abstinence Syndrome Rate per 100,000 Births
Michigan - Perinatal Region 6 800 712.0 700 600 500 400
Perinatal Region 6
N with Treated NAS Births (779.5) Rate per 100,000
2010 18,644 46 246.7
Source: Michigan Resident Inpatient Files, created using data from the Michigan Inpatient Database obtained with permission from the Michigan Health & Hospital Association Service Corporation.
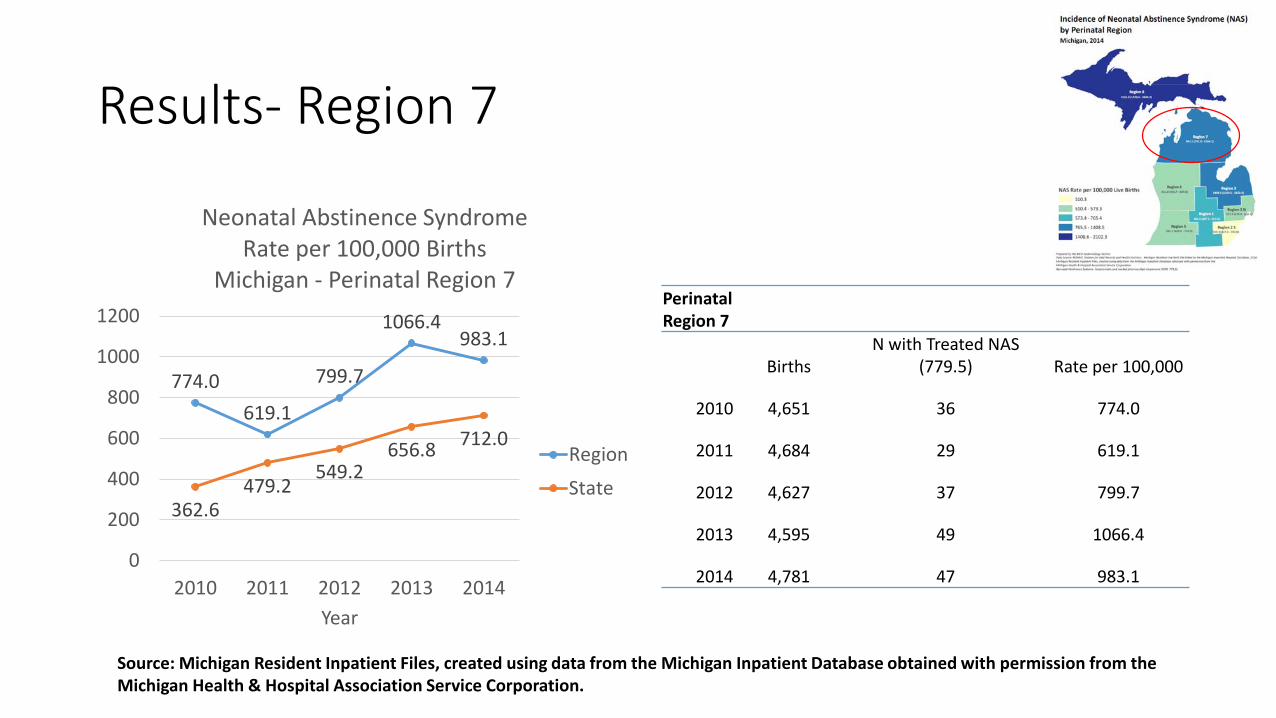
Results- Region 7
Neonatal Abstinence Syndrome Rate per 100,000 Births
Michigan - Perinatal Region 7 Perinatal
1200
774.0 619.1
799.7
983.1
362.6 479.2
549.2 656.8 712.0
1066.4 Region 7 N with Treated NAS 1000 Births (779.5) Rate per 100,000
800 2010 4,651 36 774.0
600 Region 2011 4,684 29 619.1
400 State 2012 4,627 37 799.7
200 2013 4,595 49 1066.4
0 2014 4,781 47 983.1 2010 2011 2012 2013 2014
Year
Source: Michigan Resident Inpatient Files, created using data from the Michigan Inpatient Database obtained with permission from the Michigan Health & Hospital Association Service Corporation.
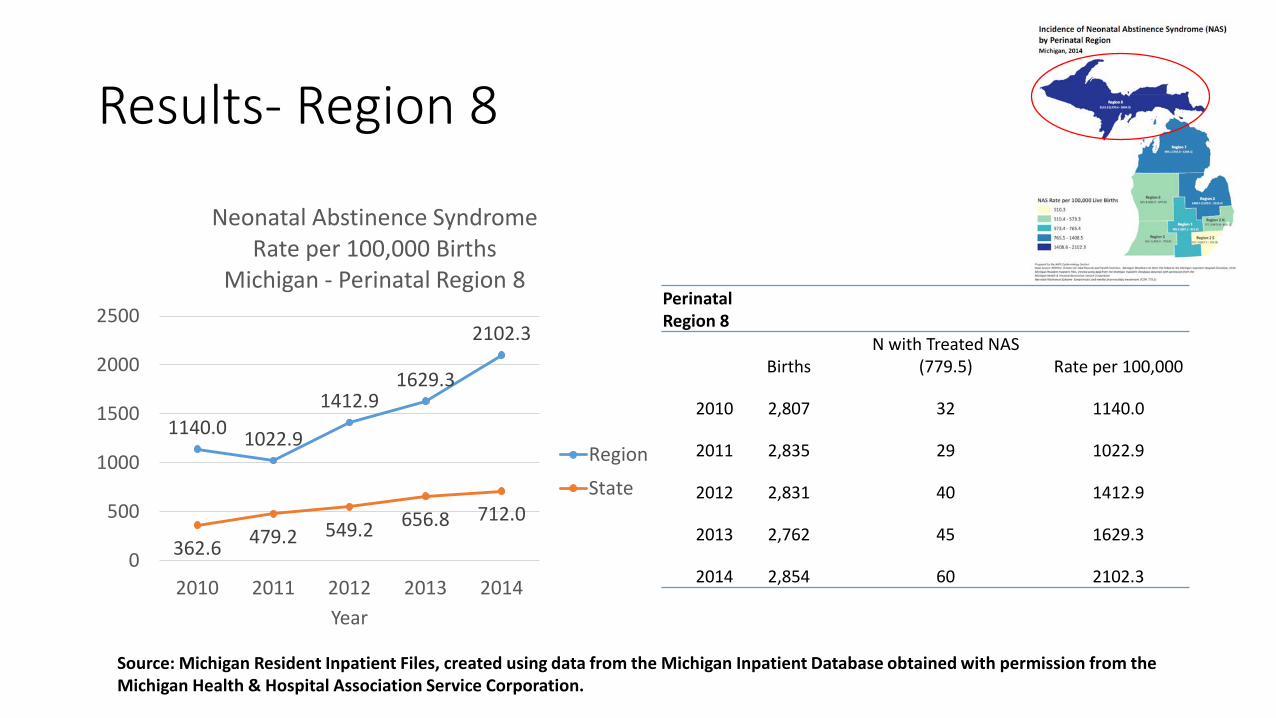
Results- Region 8
Neonatal Abstinence Syndrome Rate per 100,000 Births
Michigan - Perinatal Region 8 Perinatal
2500 Region 8 2102.3 N with Treated NAS Births (779.5) Rate per 100,000
2010 2,807 32 1140.0
Region 2011 2,835 29 1022.9
State 2012 2,831 40 1412.9
2013 2,762 45 1629.3 362.6 0
2014 2,854 60 2102.3 2010 2011 2012 2013 2014
Year
1140.0 1022.9
1412.9 1629.3
479.2 549.2 656.8 712.0 500
1000
1500
2000
Source: Michigan Resident Inpatient Files, created using data from the Michigan Inpatient Database obtained with permission from the Michigan Health & Hospital Association Service Corporation.
900.0
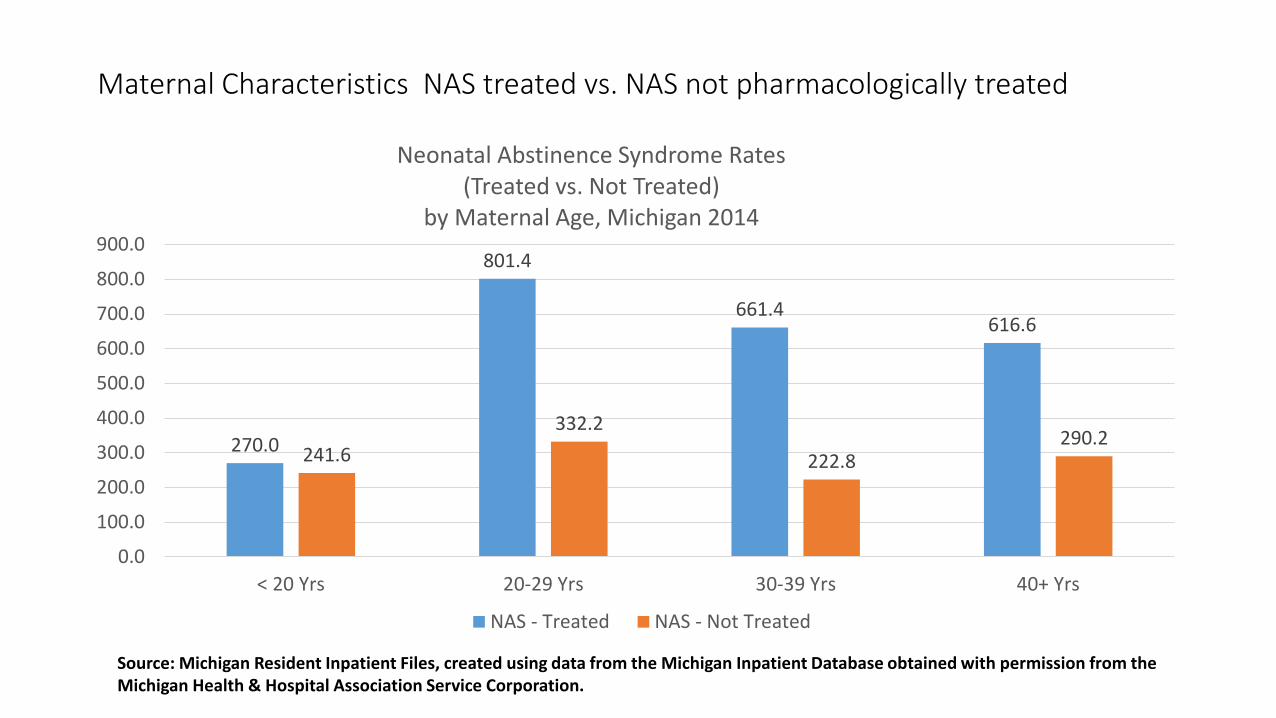
Maternal Characteristics NAS treated vs. NAS not pharmacologically treated
Neonatal Abstinence Syndrome Rates (Treated vs. Not Treated)
by Maternal Age, Michigan 2014
801.4
270.0
661.4 616.6
241.6 332.2
222.8 290.2
0.0
100.0
200.0
300.0
400.0
500.0
600.0
700.0
800.0
< 20 Yrs 20-29 Yrs 30-39 Yrs 40+ Yrs
NAS - Treated NAS - Not Treated
Source: Michigan Resident Inpatient Files, created using data from the Michigan Inpatient Database obtained with permission from the Michigan Health & Hospital Association Service Corporation.
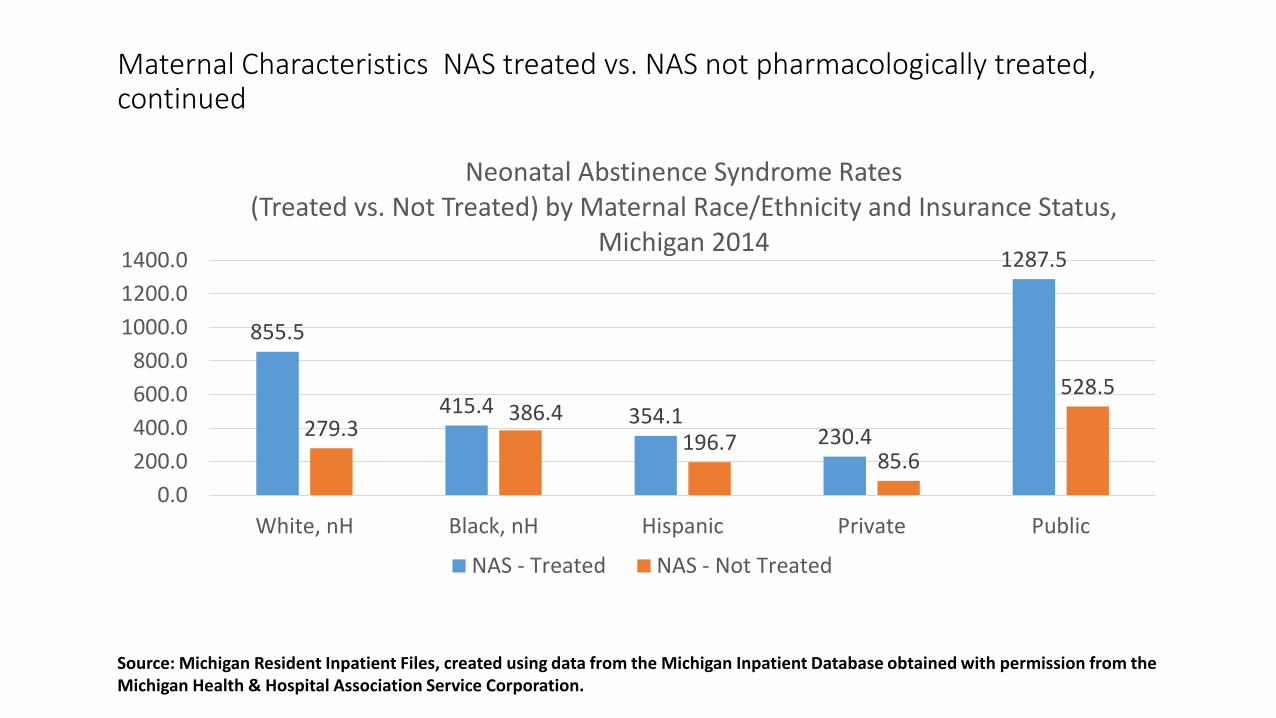
Maternal Characteristics NAS treated vs. NAS not pharmacologically treated, continued
Neonatal Abstinence Syndrome Rates (Treated vs. Not Treated) by Maternal Race/Ethnicity and Insurance Status,
Michigan 2014 1400.0 1287.5
855.5
415.4 354.1 230.4 279.3
386.4 196.7
85.6
528.5
0.0 200.0 400.0 600.0 800.0
1000.0 1200.0
White, nH Black, nH Hispanic Private Public
NAS - Treated NAS - Not Treated
Source: Michigan Resident Inpatient Files, created using data from the Michigan Inpatient Database obtained with permission from the Michigan Health & Hospital Association Service Corporation.
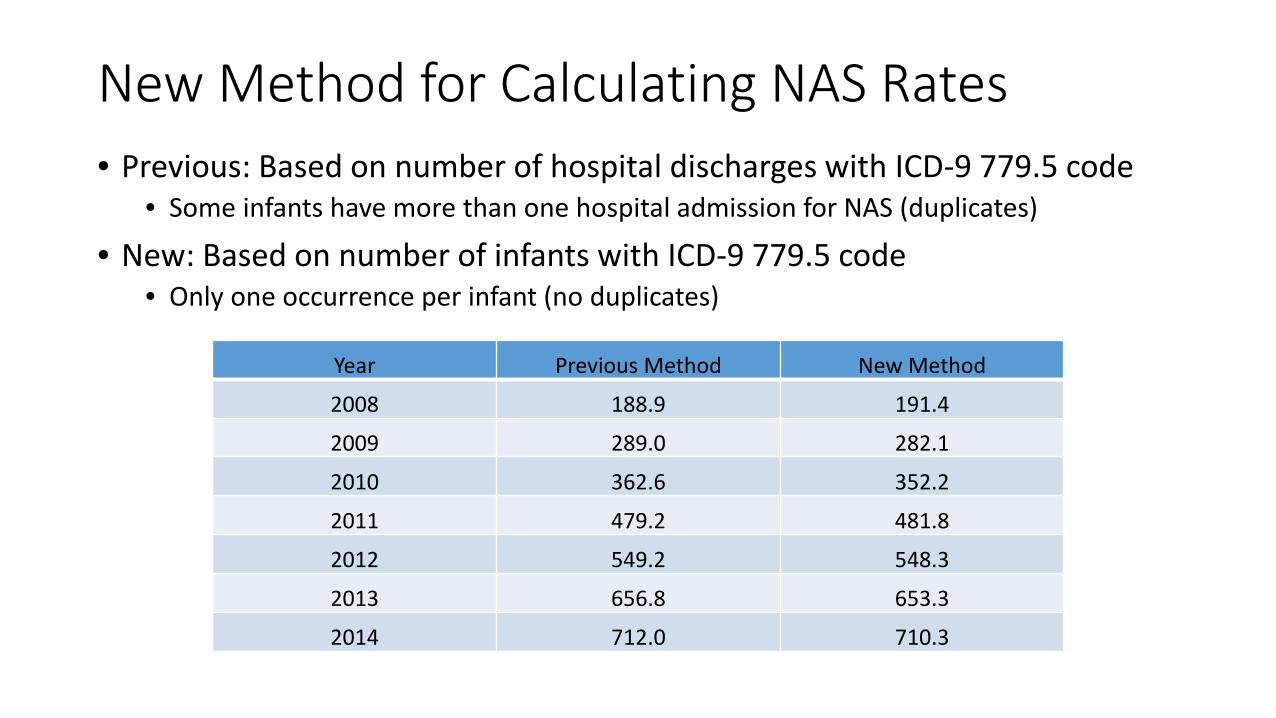
New Method for Calculating NAS Rates • Previous: Based on number of hospital discharges with ICD-9 779.5 code
• Some infants have more than one hospital admission for NAS (duplicates)
• New: Based on number of infants with ICD-9 779.5 code • Only one occurrence per infant (no duplicates)
Year Previous Method New Method
2008 188.9 191.4
2009 289.0 282.1
2010 362.6 352.2
2011 479.2 481.8
2012 549.2 548.3
2013 656.8 653.3
2014 712.0 710.3
Conclusions
• NAS is increasing in Michigan • Little change in average length of stay, but costs are increasing • Rates are highest in the Upper Peninsula and Northern Lower
Michigan • Rates are highest among women 20 years of age and older, especially
women 20-29 years • Rates are highest for White, non-Hispanic and women who intended
to pay for delivery using Medicaid Insurance. • New calculation method doesn’t significantly impact NAS rates.
Public Health Implications
• Access to illicit substances and community response are factors that impact the trend
• Punitive measures are ineffective in reducing drug-use in women. 3-4
• “Programs tailored for drug-using pregnant women need to address factors contributing to their drug abuse and adverse perinatal outcomes such as women’s reticence to access substance abuse treatment and prenatal care, their lack of medical insurance and social support, and poverty, especially in rural areas.”5
References
1. O'Donnell M, Nassar N, Leonard H, et al. Increasing prevalence of neonatalwithdrawal syndrome: population study of maternal factors and child protection involvement. Pediatrics. Apr 2009;123(4):e614-621.
2. Wagner CL, Katikaneni LD, Cox TH, Ryan RM. The impact of prenatal drugexposure on the neonate. Obstet Gynecol Clin North Am. Mar 1998;25(1):169-194. 3.Hekman K et.al. Neonatal withdrawal syndrome, Michigan, 2000-2009. Am J Prev Med. 2013; 45(1): 113-117.
3. Armstrong EM. Drug and alcohol use during pregnancy: weneed to protect, not punish, women. Womens Health Issues 2005;15:45–7.
4. Substance abuse reporting in pregnancy: the role of the obstetrician-gynecologist. ACOG Committee Opinion No. 473. American College ofObstetricians and Gynecologists. Obstet Gynecol 2011;117:200–1.
5. Creanga, et al Maternal Drug Use and its effect on neonates, a population-based study in Washington State. Obstet Gynecol 2012;119:924-933.