Embed Size (px)
Citation preview
Neonatal Abstinence Syndrome Surveillance Annual Report 2017
Miller AM1, McDonald M1 and Warren MD2 Tennessee Department of Health
1Division of Family Health and Wellness 2Population Health
A Note to the Reader:
In some cases (particularly in looking at data at the regional level), the counts included in this report are small and therefore may be statistically unreliable. Therefore, readers
should interpret all findings with caution. We especially encourage caution in interpreting findings and comparing differences across regions.
If you have questions about particular data points or need assistance in interpreting the
data, please contact Angela M. Miller, PhD, MSPH.
Phone: (615) 253-2655 Email: [email protected]
Table of Contents
List of Tables ......................................................................................................................................... i
List of Figures ....................................................................................................................................... ii
Executive Summary ............................................................................................................................. 1
Introduction ......................................................................................................................................... 2
Statewide Data ..................................................................................................................................... 3
Case Reports .................................................................................................................................... 3
Number and Rate of Cases ............................................................................................................ 3
Source of Exposure for NAS Infants ................................................................................................. 6
Source of Exposure ......................................................................................................................... 6
Regional Data .................................................................................................................................... 11
NAS Incidence by Region ............................................................................................................. 11
Exposure Source by Region ........................................................................................................ 11
Non-Residential NAS Cases............................................................................................................. 18
Conclusion ......................................................................................................................................... 20
Acknowledgements .......................................................................................................................... 20
References ......................................................................................................................................... 21
Technical Notes ................................................................................................................................ 22
Suggested Citation ........................................................................................................................... 22
List of Tables
Table 1: Reported Non-mutually Exclusive Sources of Exposure for Neonatal Abstinence Syndrome Cases, Tennessee 2016-2017 ......................................................................................... 7
Table 2: Derivation of Mutually Exclusive Categories of Exposure from Individual Exposures................................................................................................................................................................ 8
Table 3: State of Residence for Non-Resident Cases of Neonatal Abstinence Syndrome Reported in Tennessee, 2017 ......................................................................................................... 19
i
List of Figures
Figure 1: Number of Cases of Neonatal Abstinence Syndrome as a Percentage of Live Births, Tennessee 2013-2017. ........................................................................................................... 5
Figure 2: Mutually Exclusive Sources of Exposure for Neonatal Abstinence Syndrome Cases, Tennessee 2013-2017 ......................................................................................................................... 9
Figure 3: Class of Prescription Drug Use Among Those with Prescription Medication Exposure Only, 2016-2017. ............................................................................................................. 10
Figure 4: Annual Neonatal Abstinence Syndrome Case Rate by Tennessee Health Region, 2013-2017 .......................................................................................................................................... 13
Figure 5: Rate of NAS Cases by County, 2014 .............................................................................. 14
Figure 6: Rate of NAS Cases by County, 2015 .............................................................................. 14
Figure 7: Rate of NAS Cases by County, 2016 .............................................................................. 15
Figure 8: Rate of NAS Cases by County, 2017…………………………………………………………………….15
Figure 9: Distribution of Mutually Exclusive Sources of Exposure by Health Region for Neonatal Abstinence Syndrome Cases, Tennessee 2017…………………………………………………..16
Figure 10: Prevalence of Exposure to Medication Assisted Treatment among NAS Cases by Region, 2017……………………………………………………………………………………………………………………..17
Figure 11: Prevalence of Exposure to Legally Obtained Prescription Medications among NAS Cases by Region, 2017………………………………………………………………………………………………….…..17
ii
Figure 12: Prevalence of Exposure to Diverted Prescription Medications among NAS Cases by Region, 2017………………………………………………………………………………………………………………..17
Figure 13: Prevalence of Exposure to Illicit Drugs among NAS Cases by Region, 2017..……17
iii
Executive Summary Since the early 2000s, the use of opioid pain relievers in the US and Tennessee has increased rapidly. Accompanying this increase in drug use has been a ten-fold increase in the incidence of Neonatal Abstinence Syndrome (NAS), a condition in which an infant experiences withdrawal from opioid substances the mother took during pregnancy. In an effort to monitor the extent of the rise in NAS cases, the Tennessee Department of Health established NAS as a reportable condition, effective January 1, 2013. Since NAS reporting began, there have been over 5,100 reports of NAS cases to the surveillance system. While more infants were diagnosed with NAS in 2017 than in previous surveillance years, the case rate, relative to the number of births, has risen only modestly. Over 75% of mothers who delivered babies with NAS in 2017 were taking at least one medication prescribed to them by a health care provider, either alone or in conjunction with an illegally obtained substance. The percentage of women reporting only prescription medication use has steadily increased and remains high. In 2017, half of women with NAS births reported taking only prescription medications during pregnancy, with 92% of those being on medication-assisted treatment (MAT). The percentage of NAS infants with exposure to prescribed opioid pain relievers decreased in 2017. The patterns of exposure highlight continued opportunity for primary prevention of NAS—preventing substance misuse/abuse among women of childbearing age, and preventing an unintended pregnancy among women at risk of misusing/abusing substances. Additionally, the findings underscore the continued need for substance abuse treatment resources in Tennessee.
1
Introduction
Neonatal Abstinence Syndrome (NAS) is a condition in which an infant undergoes withdrawal from a substance to which he or she was exposed in-utero. The most common substances causing NAS are the opioid class of drugs, which includes morphine and heroin, as well as opioid pain medications and medication-assisted treatment such as buprenorphine and methadone. NAS can occur when a pregnant woman takes prescription medications prescribed to her, an illicit drug, or a prescription medication written for someone else but diverted to her.
Since the early 2000s, the incidence of NAS in Tennessee has increased by 10-fold, far exceeding the national increase (3-fold over the same time period). A sub-cabinet working group focused on NAS was convened in 2012, consisting of Commissioner-level representation from the Departments of Health, Children’s Services, Mental Health and Substance Abuse Services, Medicaid (TennCare), Safety and the Children’s Cabinet. This group has focused on aligning efforts across state agencies, with a focus on upstream (primary) prevention strategies.
In 2013, Tennessee became the first state in the nation to require reporting of NAS for public health surveillance purposes. Providers are required to report all diagnoses of NAS within 30 days of diagnosis. The data in this report reflect reporting to this surveillance system for CY2017.
2
Statewide Data
Highlights: Statewide Reporting • While the rate of NAS continues to increase, the rate of
increase has slowed.
• As is previous years, more males were diagnosed with NAS than females.
• In CY 2017, most NAS cases were reported by the infant’s birth hospital.
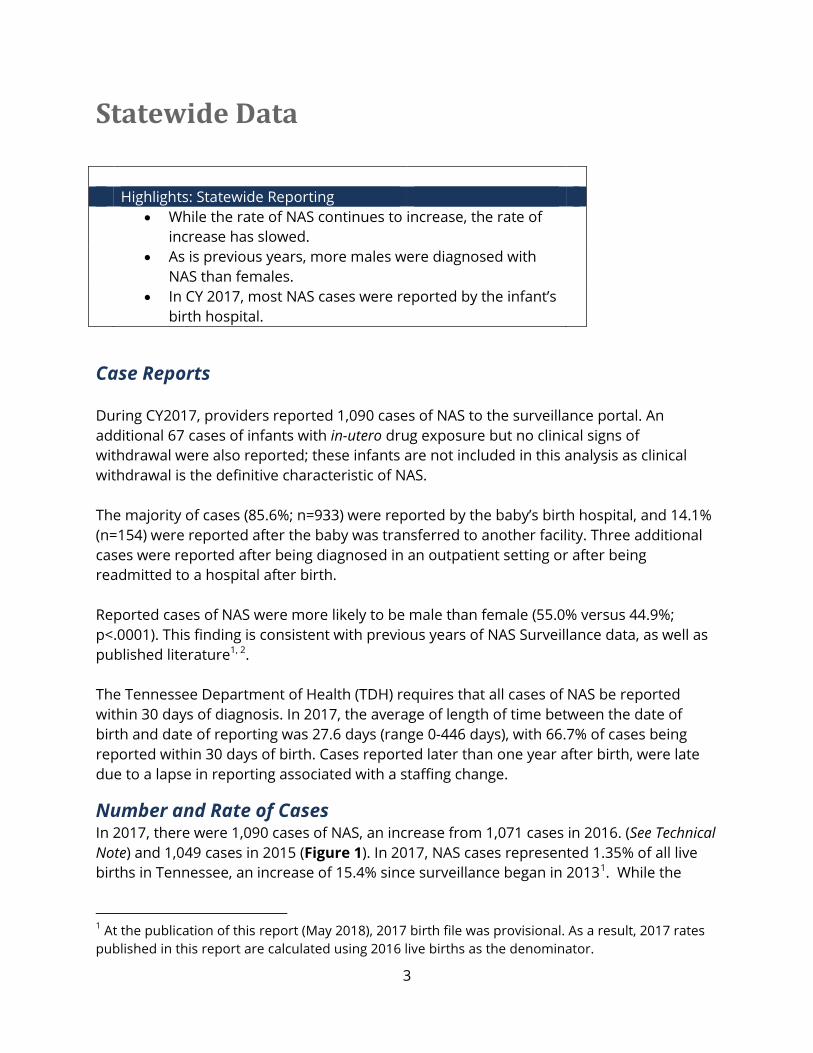
Case Reports During CY2017, providers reported 1,090 cases of NAS to the surveillance portal. An additional 67 cases of infants with in-utero drug exposure but no clinical signs of withdrawal were also reported; these infants are not included in this analysis as clinical withdrawal is the definitive characteristic of NAS. The majority of cases (85.6%; n=933) were reported by the baby’s birth hospital, and 14.1% (n=154) were reported after the baby was transferred to another facility. Three additional cases were reported after being diagnosed in an outpatient setting or after being readmitted to a hospital after birth. Reported cases of NAS were more likely to be male than female (55.0% versus 44.9%; p<.0001). This finding is consistent with previous years of NAS Surveillance data, as well as published literature1, 2. The Tennessee Department of Health (TDH) requires that all cases of NAS be reported within 30 days of diagnosis. In 2017, the average of length of time between the date of birth and date of reporting was 27.6 days (range 0-446 days), with 66.7% of cases being reported within 30 days of birth. Cases reported later than one year after birth, were late due to a lapse in reporting associated with a staffing change.
Number and Rate of Cases In 2017, there were 1,090 cases of NAS, an increase from 1,071 cases in 2016. (See Technical Note) and 1,049 cases in 2015 (Figure 1). In 2017, NAS cases represented 1.35% of all live births in Tennessee, an increase of 15.4% since surveillance began in 20131. While the
1 At the publication of this report (May 2018), 2017 birth file was provisional. As a result, 2017 rates published in this report are calculated using 2016 live births as the denominator.
3
increase in the percentage of infants with NAS since 2013 is statistically significant (p<.01), a distinction must be made between statistical significance and public health significance, as the magnitude of change remains quite small (1.17% of live births in 2013 vs. 1.35% of live births in 2017). In addition, while the NAS rate does continue to increase, the rate of increase is dramatically slower than that observed from 2000-2012.
4
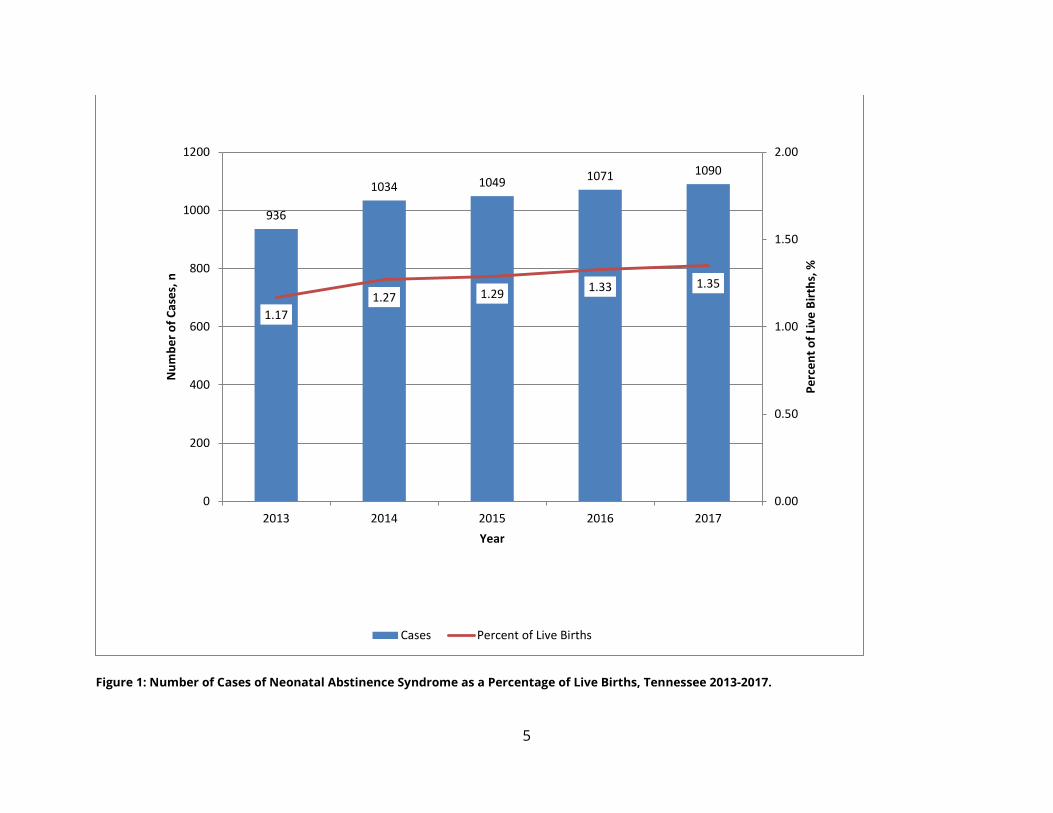
Figure 1: Number of Cases of Neonatal Abstinence Syndrome as a Percentage of Live Births, Tennessee 2013-2017.
936
1034 1049 1071 1090
1.17 1.27 1.29 1.33 1.35
0.00
0.50
1.00
1.50
2.00
0
200
400
600
800
1000
1200
2013 2014 2015 2016 2017
Perc
ent o
f Liv
e Bi
rths
, %
Num
ber o
f Cas
es, n
Year
Cases Percent of Live Births
5
Source of Exposure for NAS Infants
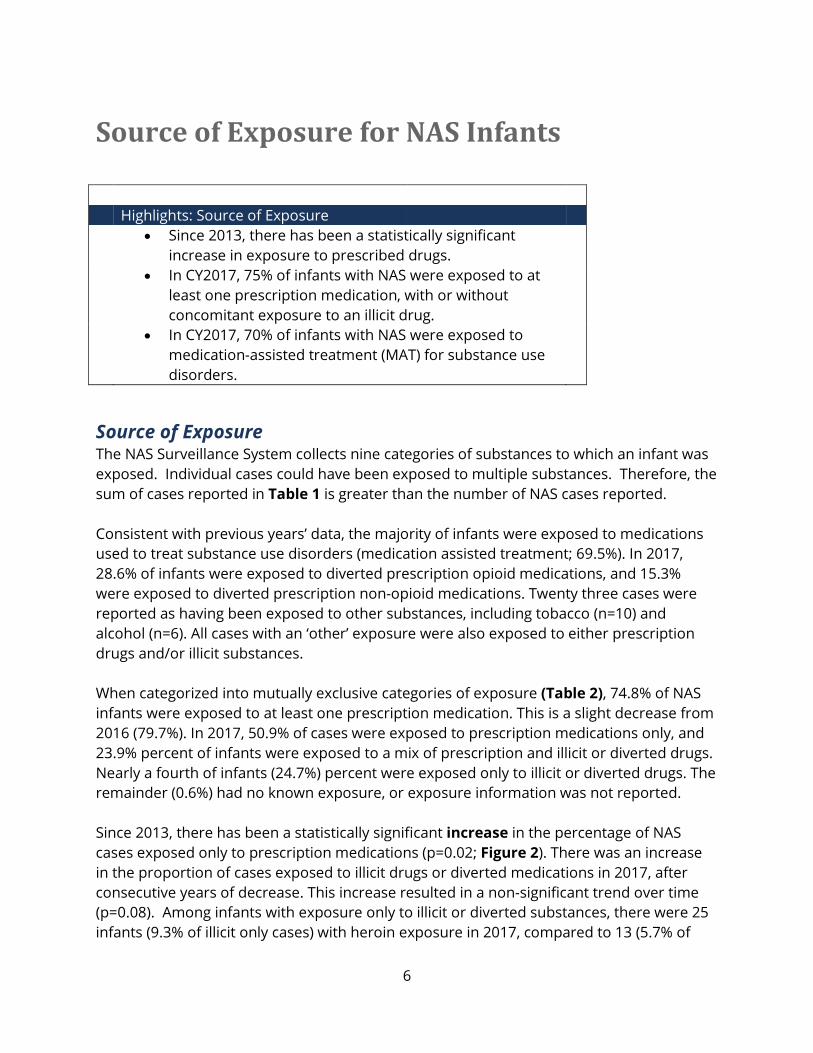
Highlights: Source of Exposure • Since 2013, there has been a statistically significant
increase in exposure to prescribed drugs.
• In CY2017, 75% of infants with NAS were exposed to at least one prescription medication, with or without concomitant exposure to an illicit drug.
• In CY2017, 70% of infants with NAS were exposed to medication-assisted treatment (MAT) for substance use disorders.
Source of Exposure The NAS Surveillance System collects nine categories of substances to which an infant was exposed. Individual cases could have been exposed to multiple substances. Therefore, the sum of cases reported in Table 1 is greater than the number of NAS cases reported. Consistent with previous years’ data, the majority of infants were exposed to medications used to treat substance use disorders (medication assisted treatment; 69.5%). In 2017, 28.6% of infants were exposed to diverted prescription opioid medications, and 15.3% were exposed to diverted prescription non-opioid medications. Twenty three cases were reported as having been exposed to other substances, including tobacco (n=10) and alcohol (n=6). All cases with an ‘other’ exposure were also exposed to either prescription drugs and/or illicit substances. When categorized into mutually exclusive categories of exposure (Table 2), 74.8% of NAS infants were exposed to at least one prescription medication. This is a slight decrease from 2016 (79.7%). In 2017, 50.9% of cases were exposed to prescription medications only, and 23.9% percent of infants were exposed to a mix of prescription and illicit or diverted drugs. Nearly a fourth of infants (24.7%) percent were exposed only to illicit or diverted drugs. The remainder (0.6%) had no known exposure, or exposure information was not reported. Since 2013, there has been a statistically significant increase in the percentage of NAS cases exposed only to prescription medications (p=0.02; Figure 2). There was an increase in the proportion of cases exposed to illicit drugs or diverted medications in 2017, after consecutive years of decrease. This increase resulted in a non-significant trend over time (p=0.08). Among infants with exposure only to illicit or diverted substances, there were 25 infants (9.3% of illicit only cases) with heroin exposure in 2017, compared to 13 (5.7% of
6
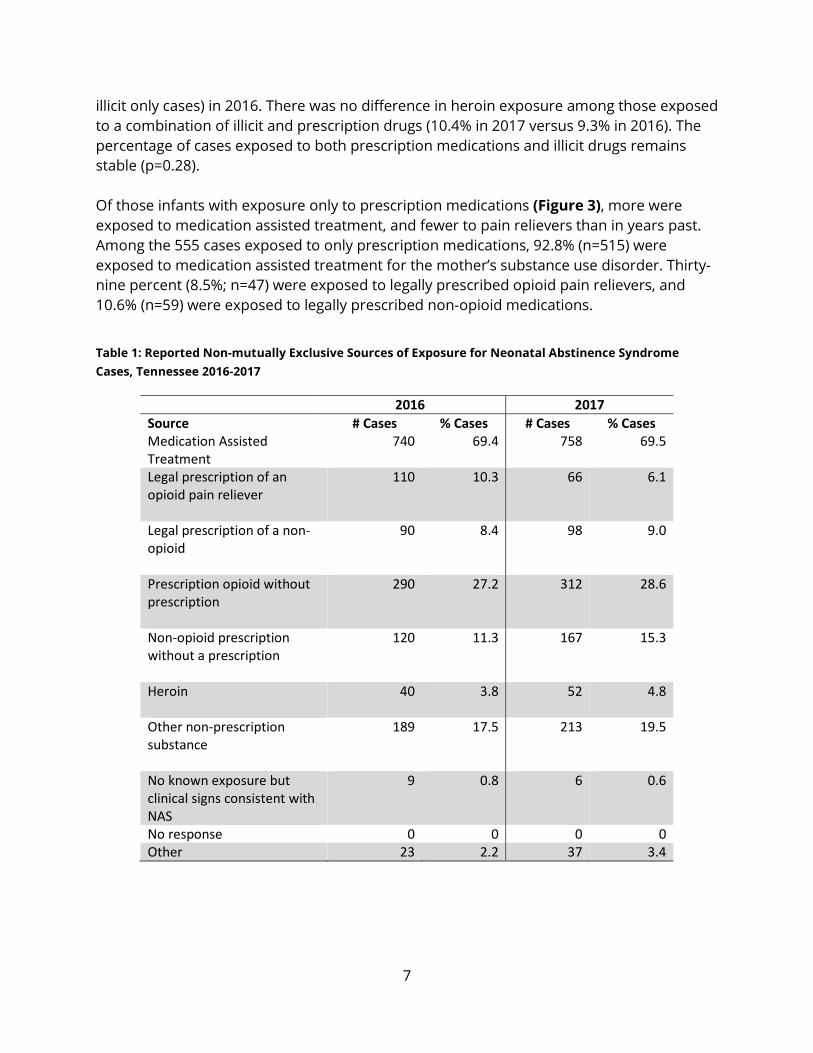
illicit only cases) in 2016. There was no difference in heroin exposure among those exposed to a combination of illicit and prescription drugs (10.4% in 2017 versus 9.3% in 2016). The percentage of cases exposed to both prescription medications and illicit drugs remains stable (p=0.28). Of those infants with exposure only to prescription medications (Figure 3), more were exposed to medication assisted treatment, and fewer to pain relievers than in years past. Among the 555 cases exposed to only prescription medications, 92.8% (n=515) were exposed to medication assisted treatment for the mother’s substance use disorder. Thirty-nine percent (8.5%; n=47) were exposed to legally prescribed opioid pain relievers, and 10.6% (n=59) were exposed to legally prescribed non-opioid medications.
Table 1: Reported Non-mutually Exclusive Sources of Exposure for Neonatal Abstinence Syndrome Cases, Tennessee 2016-2017
2016 2017 Source # Cases % Cases # Cases % Cases Medication Assisted Treatment
740 69.4 758 69.5
Legal prescription of an opioid pain reliever
110 10.3 66 6.1
Legal prescription of a non-opioid
90 8.4 98 9.0
Prescription opioid without prescription
290 27.2 312 28.6
Non-opioid prescription without a prescription
120 11.3 167 15.3
Heroin
40 3.8 52 4.8
Other non-prescription substance
189 17.5 213 19.5
No known exposure but clinical signs consistent with NAS
9 0.8 6 0.6
No response 0 0 0 0 Other 23 2.2 37 3.4
7
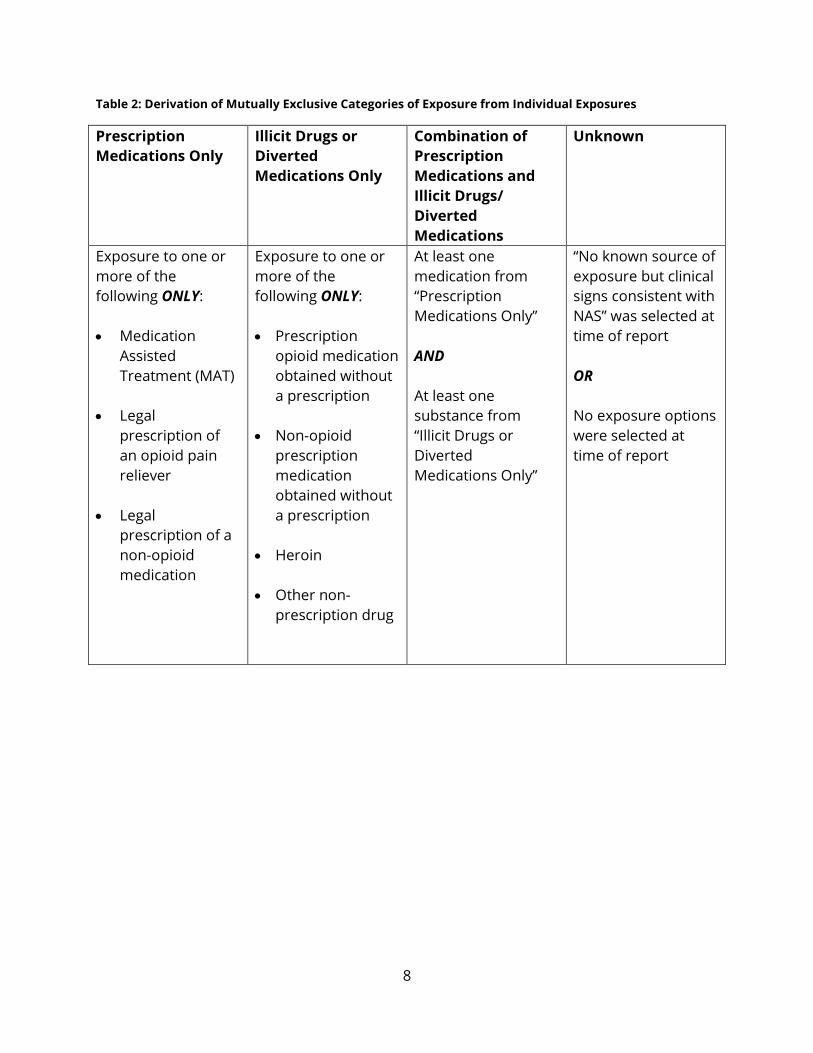
Table 2: Derivation of Mutually Exclusive Categories of Exposure from Individual Exposures
Prescription Medications Only
Illicit Drugs or Diverted Medications Only
Combination of Prescription Medications and Illicit Drugs/ Diverted Medications
Unknown
Exposure to one or more of the following ONLY: • Medication
Assisted Treatment (MAT)
• Legal
prescription of an opioid pain reliever
• Legal
prescription of a non-opioid medication
Exposure to one or more of the following ONLY: • Prescription
opioid medication obtained without a prescription
• Non-opioid
prescription medication obtained without a prescription
• Heroin • Other non-
prescription drug
At least one medication from “Prescription Medications Only” AND At least one substance from “Illicit Drugs or Diverted Medications Only”
“No known source of exposure but clinical signs consistent with NAS” was selected at time of report OR No exposure options were selected at time of report
8
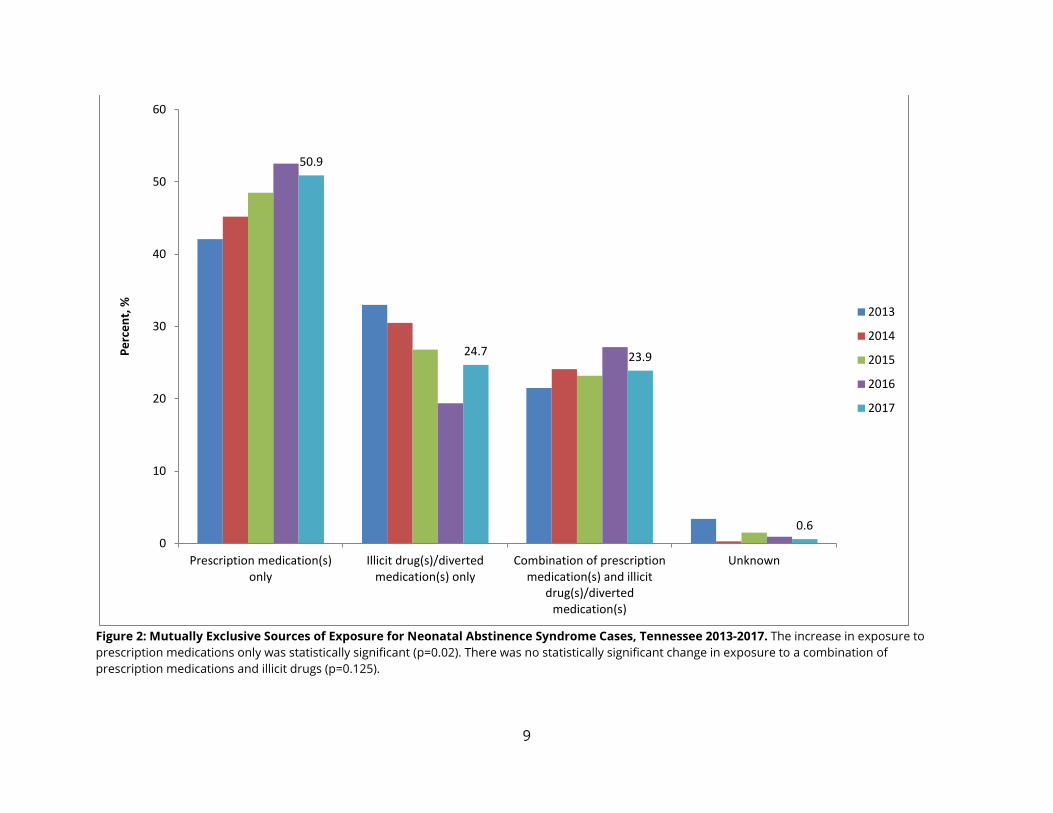
Figure 2: Mutually Exclusive Sources of Exposure for Neonatal Abstinence Syndrome Cases, Tennessee 2013-2017. The increase in exposure to prescription medications only was statistically significant (p=0.02). There was no statistically significant change in exposure to a combination of prescription medications and illicit drugs (p=0.125).
50.9
24.7 23.9
0.6 0
10
20
30
40
50
60
Prescription medication(s)only
Illicit drug(s)/divertedmedication(s) only
Combination of prescriptionmedication(s) and illicit
drug(s)/divertedmedication(s)
Unknown
Perc
ent,
%
2013
2014
2015
2016
2017
9
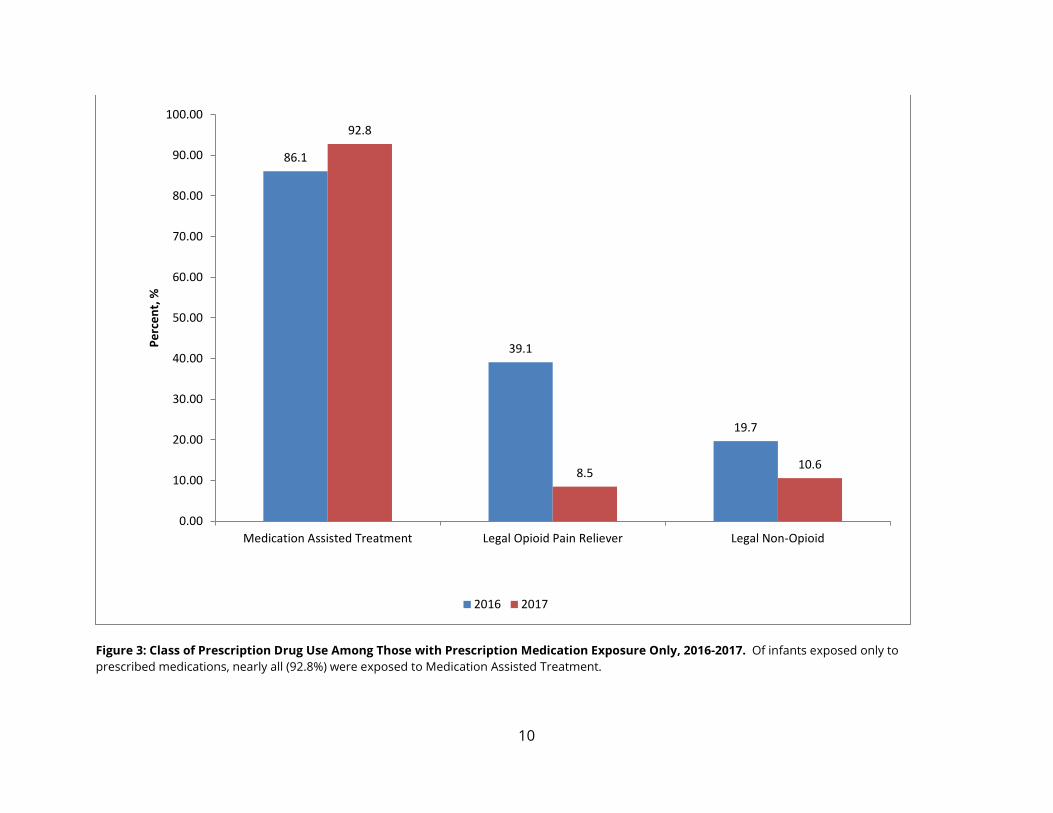
Figure 3: Class of Prescription Drug Use Among Those with Prescription Medication Exposure Only, 2016-2017. Of infants exposed only to prescribed medications, nearly all (92.8%) were exposed to Medication Assisted Treatment.
86.1
39.1
19.7
92.8
8.5 10.6
0.00
10.00
20.00
30.00
40.00
50.00
60.00
70.00
80.00
90.00
100.00
Medication Assisted Treatment Legal Opioid Pain Reliever Legal Non-Opioid
Perc
ent,
%
2016 2017
10
Regional Data
Highlights: Regional Trends for NAS • Rates of NAS increase when moving from west to east
across Tennessee.
• Patterns of exposure source vary by urban versus rural region status.
NAS Incidence by Region In 2017, rates of NAS varied by health department region. Rates of NAS are lowest in West Tennessee and increase in an easterly fashion. There has been some annual variation in the case rate by region, but time trends showed statistically significant increases only for Davidson County and the South Central Health Regions (Figure 4). Previous reports of NAS showed the East and Northeast Health Regions and Sullivan County as bearing the greatest burden of NAS. NAS rates in the East Health Region have decreased each of the last several years, while rates in Knox County and surrounding regions have either increased or remained relatively unchanged (Figure 5-8).
Exposure Source by Region There also appears to be geographic variation in the substance causing NAS (Figure 9). Compared to previous surveillance years, exposure to prescription medications has become more prevalent, being the primary source of exposure in all of the rural health department regions. Of the metro regions, prescription medications were also the primary source of exposure, except in Shelby, Knox and Davidson Counties, where a mix of prescription medications and illicit drugs were most prevalent.
Exposure to medication assisted treatment (MAT) is distributed somewhat evenly across the state, though prevalence tends to be higher in East Tennessee (Figure 10). Use of legally obtained opioid medications is more common in Middle and West Tennessee, with legally obtained non-opioid medications more common in East Tennessee (Figure 11). Exposure to diverted substances is distributed evenly across the state, with exposure to diverted opioid medications more common than diverted non-opioid medications. There was a higher proportion of NAS cases exposed to diverted opioids in Knox County and the East Health Region (Figure 12). Though a small number of cases (n=40) were exposed to
11

heroin, use of heroin is most common in urban areas (Shelby, Knox, Hamilton and Davidson Counties), and the surrounding counties (e.g., Davidson County and neighboring Mid-Cumberland Health Region (Figure 13).
12
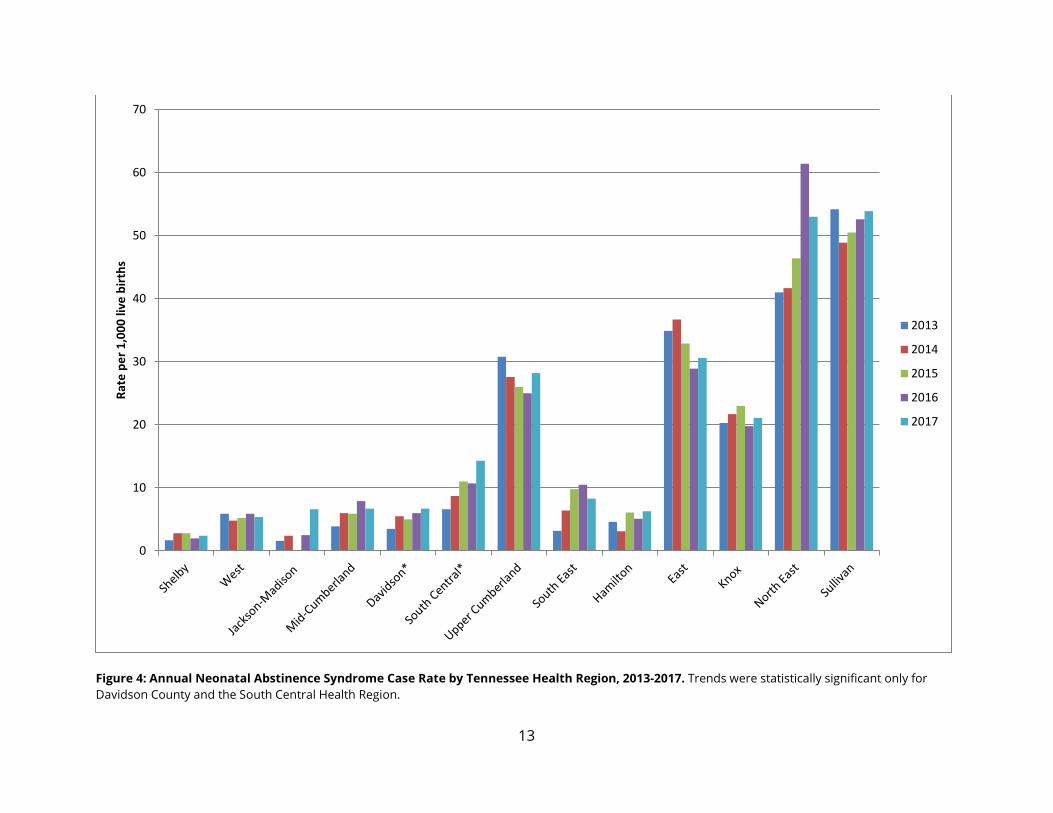
Figure 4: Annual Neonatal Abstinence Syndrome Case Rate by Tennessee Health Region, 2013-2017. Trends were statistically significant only for Davidson County and the South Central Health Region.
0
10
20
30
40
50
60
70Ra
te p
er 1
,000
live
birt
hs
2013
2014
2015
2016
2017
13
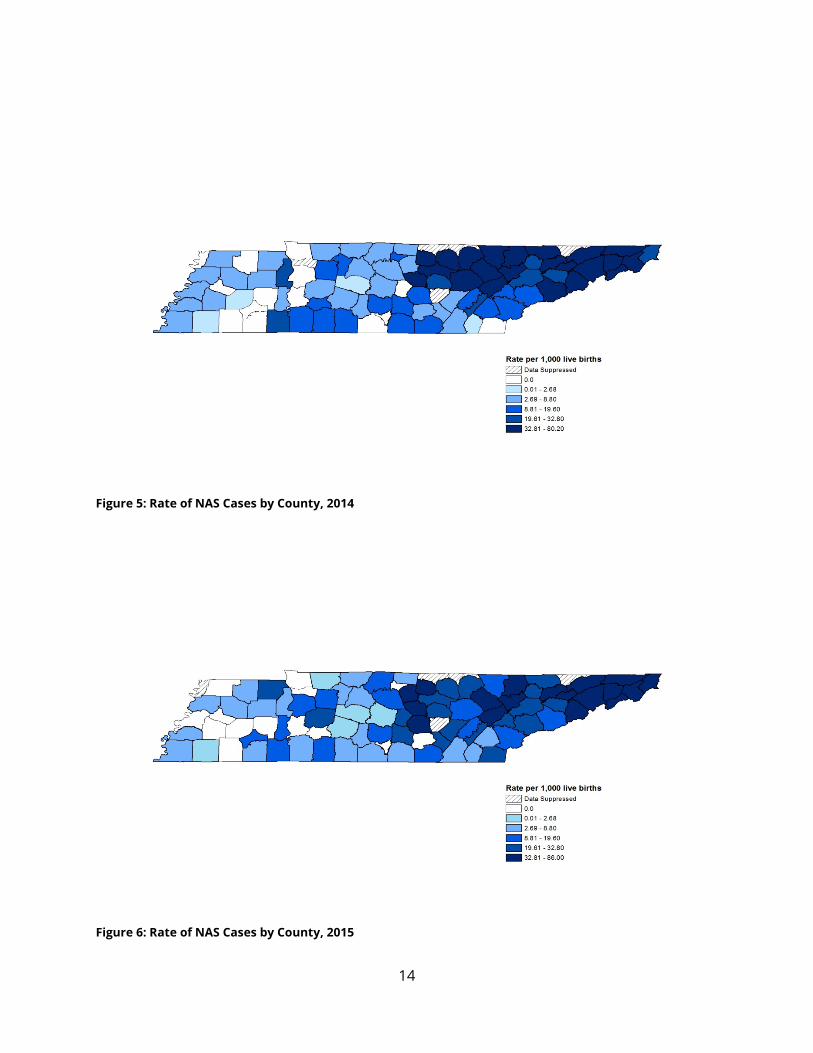
Figure 5: Rate of NAS Cases by County, 2014
Figure 6: Rate of NAS Cases by County, 2015
14
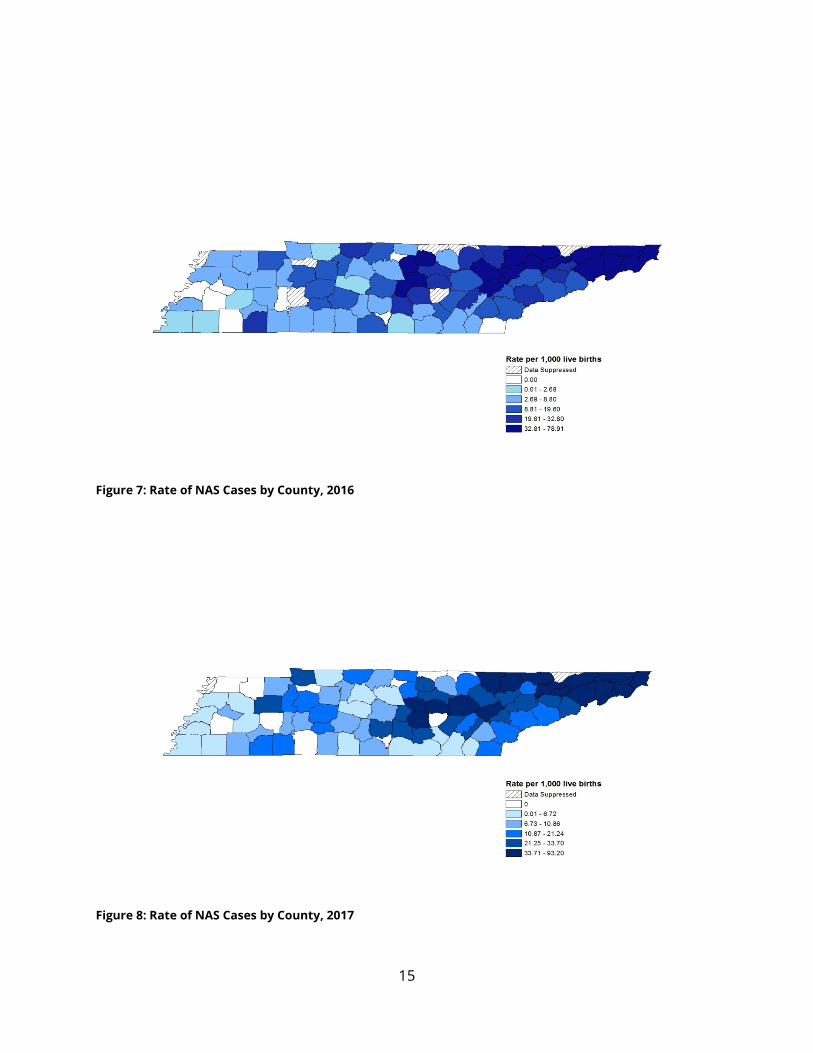
Figure 7: Rate of NAS Cases by County, 2016
Figure 8: Rate of NAS Cases by County, 2017
15
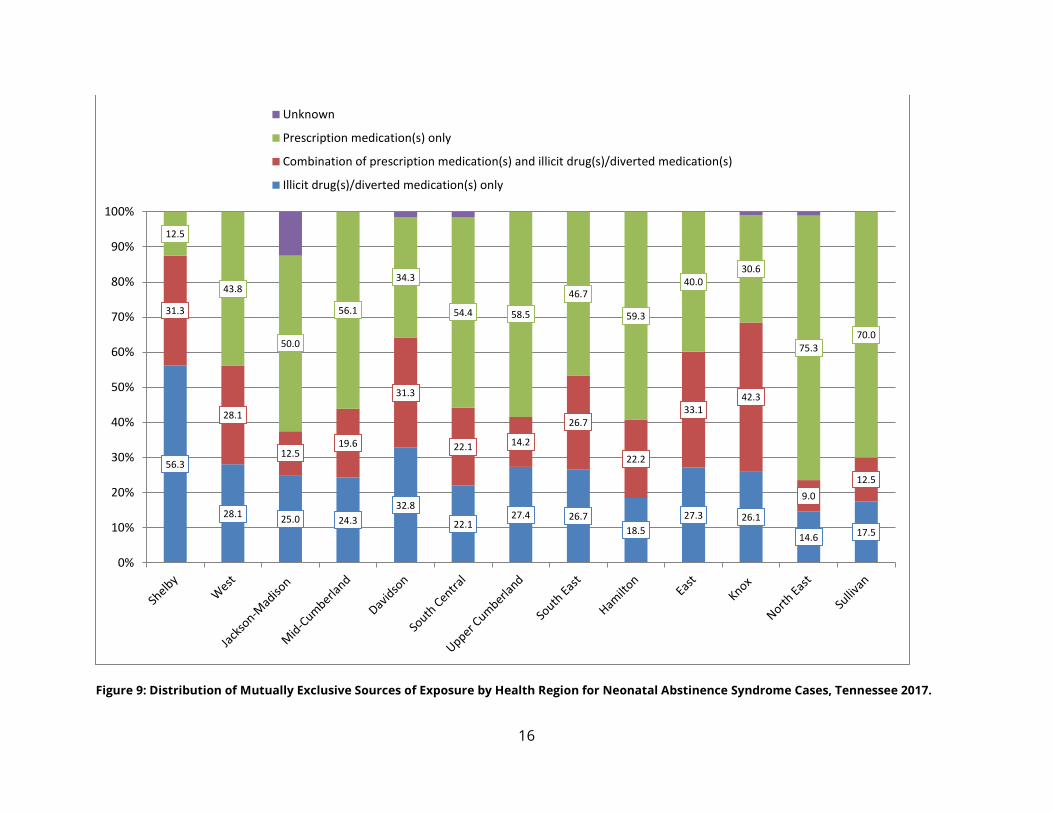
Figure 9: Distribution of Mutually Exclusive Sources of Exposure by Health Region for Neonatal Abstinence Syndrome Cases, Tennessee 2017.
56.3
28.1 25.0 24.3 32.8
22.1 27.4 26.7
18.5 27.3 26.1
14.6 17.5
31.3
28.1
12.5 19.6
31.3
22.1 14.2
26.7
22.2
33.1 42.3
9.0 12.5
12.5
43.8
50.0
56.1
34.3
54.4 58.5
46.7
59.3
40.0 30.6
75.3 70.0
0%
10%
20%
30%
40%
50%
60%
70%
80%
90%
100%
Unknown
Prescription medication(s) only
Combination of prescription medication(s) and illicit drug(s)/diverted medication(s)
Illicit drug(s)/diverted medication(s) only
16
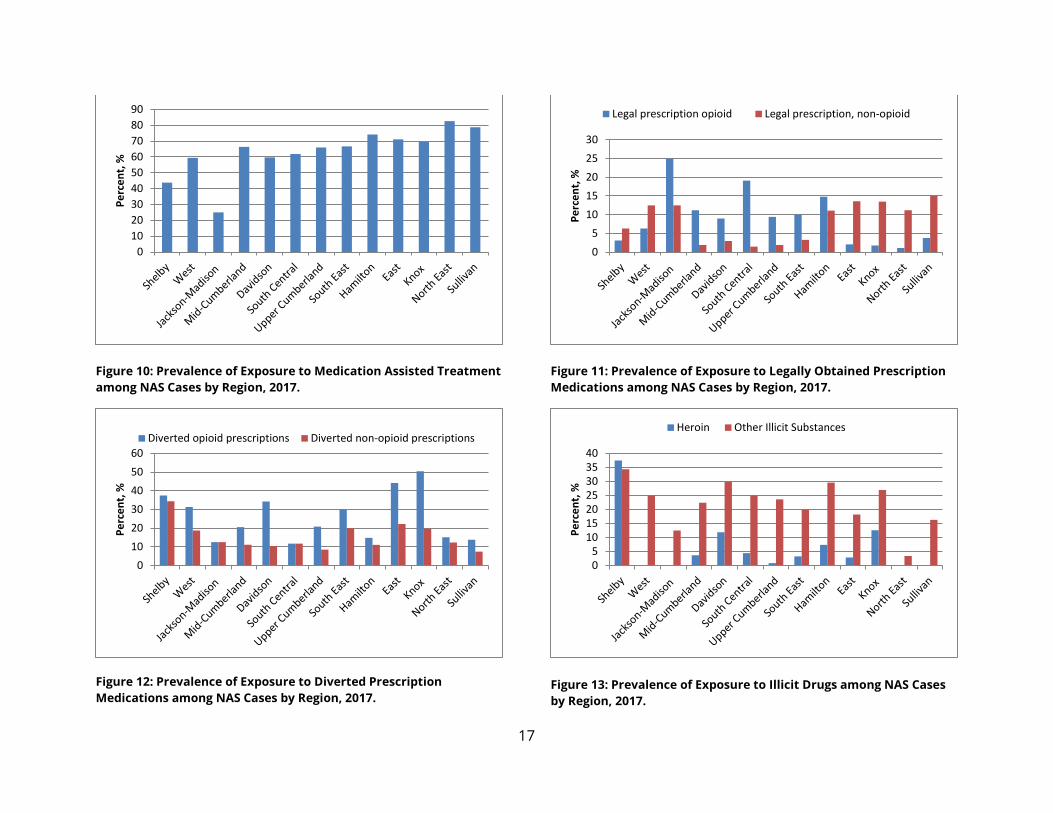
Figure 10: Prevalence of Exposure to Medication Assisted Treatment among NAS Cases by Region, 2017.
Figure 12: Prevalence of Exposure to Diverted Prescription Medications among NAS Cases by Region, 2017.
Figure 11: Prevalence of Exposure to Legally Obtained Prescription Medications among NAS Cases by Region, 2017.
Figure 13: Prevalence of Exposure to Illicit Drugs among NAS Cases by Region, 2017.
0102030405060708090
Perc
ent,
%
0102030405060
Perc
ent,
%
Diverted opioid prescriptions Diverted non-opioid prescriptions
05
1015202530
Perc
ent,
%
Legal prescription opioid Legal prescription, non-opioid
05
10152025303540
Perc
ent,
%
Heroin Other Illicit Substances
17
Non-Residential NAS Cases
Highlights: Non-Residential NAS Cases • In CY2017, Tennessee hospitals reported 94 NAS cases in
which the infant was from another state.
• The majority (55.3%) of non-residential NAS cases were from Virginia.
Effective July 1, 2014, reporting hospitals were asked to report cases of NAS treated at Tennessee hospitals that were residents of states that border Tennessee. These states include Alabama, Arkansas, Georgia, Kentucky, Mississippi, Missouri, North Carolina and Virginia. In 2017, 94 cases of NAS from other states were treated in Tennessee, down from 118 in 2016. The distribution of out of state cases, by maternal state of residence, is shown in Table 3. While the majority of non-resident cases continue to come from Virginia (55.3%), the percentage of cases from Kentucky has approximately doubled, increasing from 8.5% in 2016 to 20.2% in 2017. More than half (62.8%, n=59) of out of state NAS cases were born in Tennessee (for example, the baby’s mother was from North Carolina but delivered in Tennessee). The remainder (36.2%) were born in out of state hospitals and transferred to a Tennessee hospital for care (for example, the baby was born in Virginia but transferred to Tennessee for care) and one case reported as a home birth (1.1%). This is in contrast to previous years, where non-resident infants were more likely to be transferred to Tennessee for care than born in-state.
18
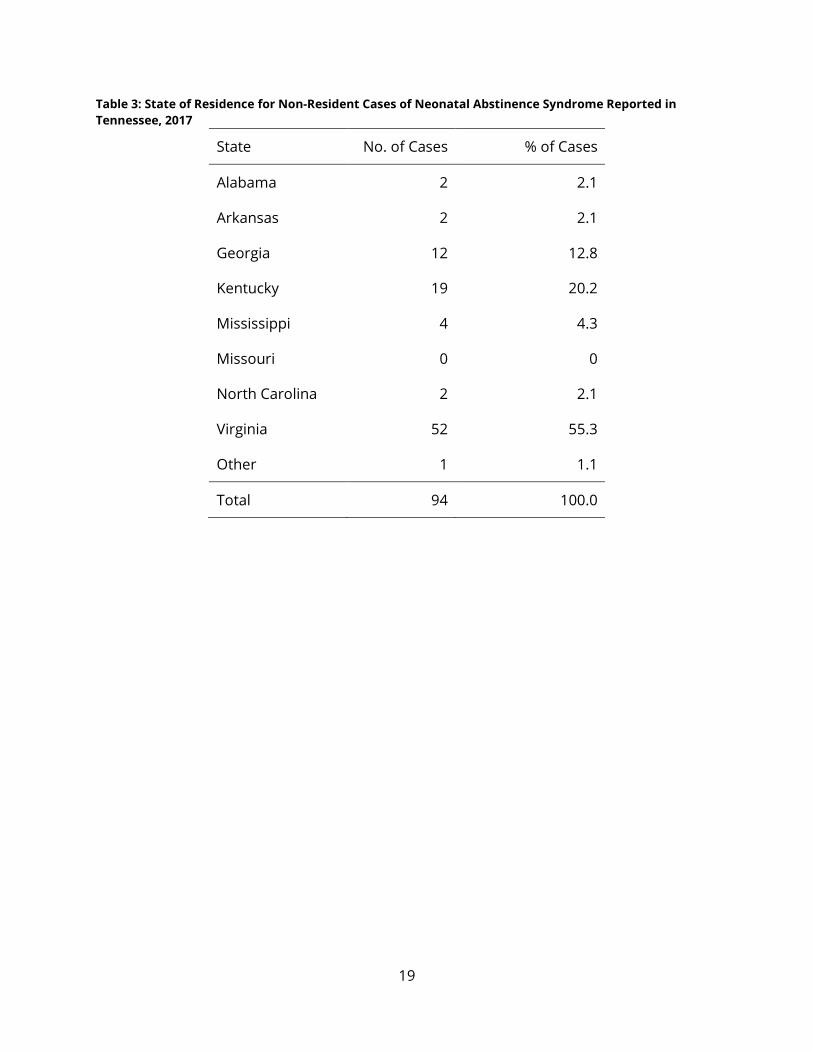
Table 3: State of Residence for Non-Resident Cases of Neonatal Abstinence Syndrome Reported in Tennessee, 2017
State No. of Cases % of Cases
Alabama 2 2.1
Arkansas 2 2.1
Georgia 12 12.8
Kentucky 19 20.2
Mississippi 4 4.3
Missouri 0 0
North Carolina 2 2.1
Virginia 52 55.3
Other 1 1.1
Total 94 100.0
19
Conclusion Since becoming a reportable condition in 2013, the proportion of births affected by Neonatal Abstinence Syndrome each year has risen slightly. Though 2017 was the first year in which we saw a statistically significant increase in the rate of NAS, one must draw a distinction between statistical significance and public health significance. In the case of NAS, a statistically significant increase represents a change from 1.17 to 1.35% of live births in Tennessee. This increase over a 5 year period is quite small relative to the steep 10-fold increases seen in between 2000-2012. This may indicate that the NAS epidemic is reaching a plateau; additional time will be needed to determine this with certainty. Since 2013, there has been a shift in the exposure sources associated with NAS, with more mothers of NAS infants taking medications prescribed by a provider. That nearly 70% of mothers of all NAS infants were receiving medication assisted treatment is suggestive that women with a history of substance use disorder are becoming more engaged with medical providers before and during pregnancy. The patterns of exposure (with nearly 75% of cases being exposed to at least one substance prescribed by a healthcare provider) highlight opportunities for primary prevention. Healthcare providers should explore non-opioid treatment modalities in women of childbearing age, and should promote effective contraceptive methods to prevent unintended pregnancies among women who use opioids.
Acknowledgements The Tennessee Department of Health would like to acknowledge the reporting hospitals and providers across the State of Tennessee, the NAS Sub-Cabinet Working Group and TDH Staff.
20
References 1. Charles MK, Cooper WO, Jansson LM, et al. Male Sex Associated with Increased Risk
of Neonatal Abstinence Syndrome. Hosp Pediatr 2017 Jun: 7(6):328-334. DOI:10.1542/hpeds.2016-0218.
2. O’Connor AB, O’Brien L, Alto WA. Are there gender related differences in neonatal abstinence syndrome following buprenorphine during pregnancy?. J Perinat Med 2013 Sep1;41(5):621-3. DOI: 10.1515/jpm-2012-0288.
21
Technical Notes 1. At publication of the 2016 Neonatal Abstinence Syndrome Surveillance Annual Report, 1,068 cases with a birth year of 2016 had been reported. After publication of the 2016 report, an additional 3 cases were reported and are included here. 2. All rates for 2017 were calculated using the 2016 Birth Statistical File.
Suggested Citation This report was prepared by Angela M. Miller, PhD, MSPH, Morgan McDonald, MD and Michael Warren, MD, MPH. Suggested citation: Miller AM, McDonald M and Warren MD (2018). Neonatal Abstinence Syndrome Surveillance Annual Report 2017. Tennessee Department of Health, Nashville, TN.
22