Embed Size (px)
Citation preview
Network Traffic Anomaly Detection and Characterization
Aaron Beach and Matthew Modaff under Yan Chen
Northwestern University
ABSTRACT Network systems need to be able to detect malicious activity and characterize it so that proper actions may be taken. This need is clearly demonstrated through the observed growth rate of informational and economic damage caused by intentionally or unintentionally induced attacks, faults, defects, etc. Network traffic characterization needs to take place accurately and quickly in real time to facilitate prompt appropriate action. Computational and storage resource limits require ingenuity to effectively characterize constantly varying network traffic trends. This paper aims to study network traffic characterization through applying forecasting algorithms to network traffic data and attempting to characterize the aberrations. A series of network traffic anomalies are studied and explained, these explanations are then linked with the specific anomaly’s unique characteristics to expose a set of conditions that distinguish the particular event. This characterization would provide a basis for appropriate responses to network activity. Categories and Subject Descriptors c.2.0 [Computer Communication Networks]: Security; c.2.3 [Computer Communication Networks]: Network Monitoring General Terms Security, Measurement Keywords Network Security, Traffic Measurement, Anomaly Detection, Anomaly Characterization, Intrusion Detection 1 INTRODUCTION This paper takes an anomaly-based approach to intrusion detection. This form of detection is scalable to the ever increasing variety of malicious activity on the internet. The variable amount of possible signatures outweighs the number of possible behaviors. Concordantly, this paper will focus on understanding network activity through its behavior.
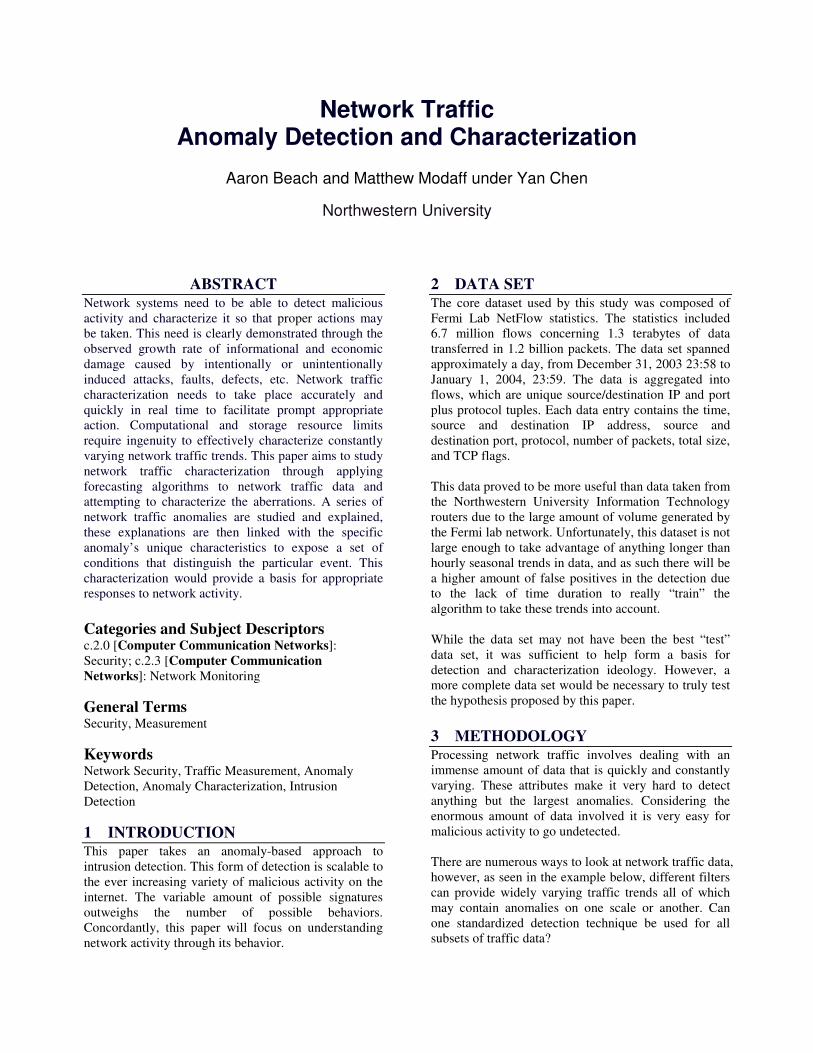
2 DATA SET The core dataset used by this study was composed of Fermi Lab NetFlow statistics. The statistics included 6.7 million flows concerning 1.3 terabytes of data transferred in 1.2 billion packets. The data set spanned approximately a day, from December 31, 2003 23:58 to January 1, 2004, 23:59. The data is aggregated into flows, which are unique source/destination IP and port plus protocol tuples. Each data entry contains the time, source and destination IP address, source and destination port, protocol, number of packets, total size, and TCP flags. This data proved to be more useful than data taken from the Northwestern University Information Technology routers due to the large amount of volume generated by the Fermi lab network. Unfortunately, this dataset is not large enough to take advantage of anything longer than hourly seasonal trends in data, and as such there will be a higher amount of false positives in the detection due to the lack of time duration to really “train” the algorithm to take these trends into account. While the data set may not have been the best “test” data set, it was sufficient to help form a basis for detection and characterization ideology. However, a more complete data set would be necessary to truly test the hypothesis proposed by this paper. 3 METHODOLOGY Processing network traffic involves dealing with an immense amount of data that is quickly and constantly varying. These attributes make it very hard to detect anything but the largest anomalies. Considering the enormous amount of data involved it is very easy for malicious activity to go undetected. There are numerous ways to look at network traffic data, however, as seen in the example below, different filters can provide widely varying traffic trends all of which may contain anomalies on one scale or another. Can one standardized detection technique be used for all subsets of traffic data?
[Figure 1 - Network traffic separated by destination port]
To distinguish patterns from aberrations we used the Holt-Winters forecasting method. Holt-Winters Algorithm (forecasting method) The Holt-Winters algorithm is an exponential smoothing prediction algorithm. [5] The predicted next value is the sum of three components: Baseline (intercept): at = �( yt – ct-m ) + (1 – �) ( at-1 + bt-1 ) Linear trend (slope): bt = �( at – at-1 ) + (1 – �) ( bt-1 ) Seasonal trend; ct = �( yt – at ) + (1 – �) ( ct-m ) The three constants, �, �, and � are arbitrary values chosen between 0 and 1. The higher the values, the more new data is weighted in its prediction. In this study, we arbitrarily choose 0.1 for many predictions because the aberrations were so defined that the values were insignificant. For sensitive applications requiring more precise values, the values should be chosen based on the time-step and the targeted event time duration. The constant m is the season size, usually a day or a week. Holt-Winters requires one seasonal period to jump-start its prediction algorithm, and another to initiate its deviation algorithm. As such, data within the first two seasons will not be able to take advantage of the seasonal trends in detection, as Holt-Winters uses that data to initialize the seasonal values. Because of the limited duration of the data set, only small periods (hours or minutes) are used based on the specific event being studied. Once a predicted value is known, then the actual value needs to be compared to the predicted value to flag traffic not within the tolerance band of the algorithm. The equation for the confidence band is: Deviation tolerance: dt = � | yt – �t | + (1 – �) dt-m
Tolerance range: )ˆ , ˆ( mttmtt dydy −− ⋅+⋅− δδ
To actually determine an anomaly from this, generally a “sliding window” [13] of data is used, and any time there are more than an pre-selected number of violations of the threshold within that window, it is flagged as an anomaly. Depending on application, this study uses violation threshold values between 1 and 15 along with window sizes between 1 and 30. The Holt-
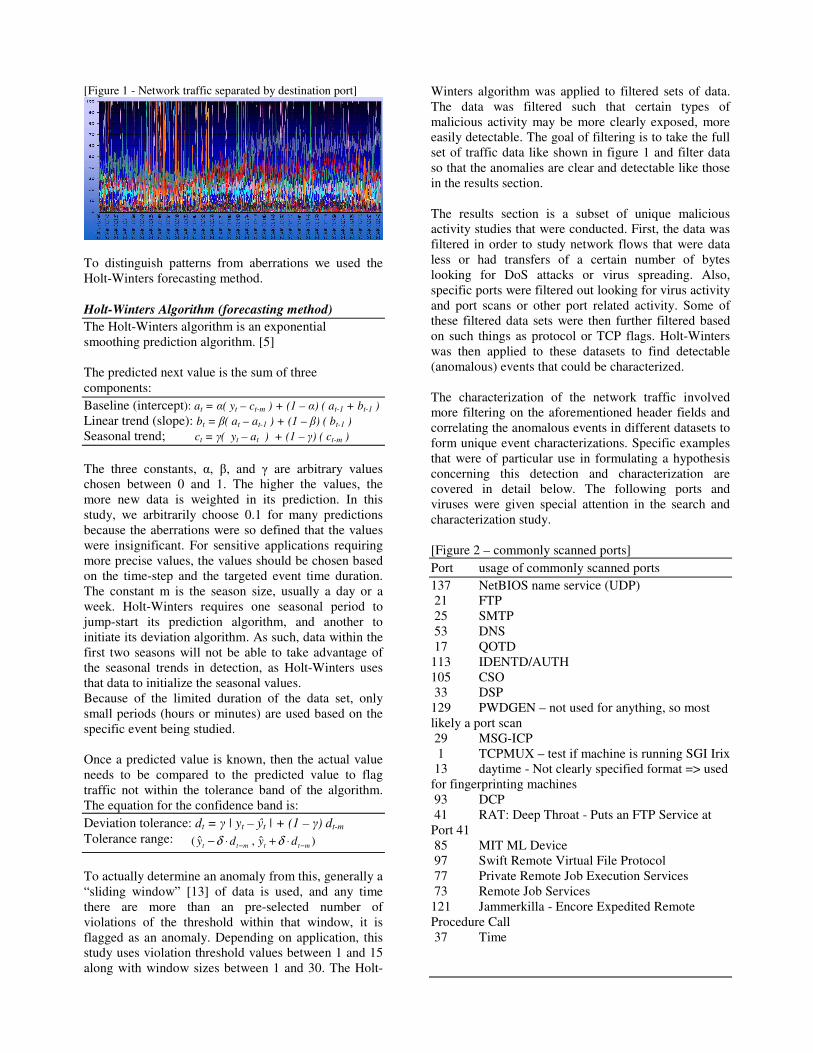
Winters algorithm was applied to filtered sets of data. The data was filtered such that certain types of malicious activity may be more clearly exposed, more easily detectable. The goal of filtering is to take the full set of traffic data like shown in figure 1 and filter data so that the anomalies are clear and detectable like those in the results section. The results section is a subset of unique malicious activity studies that were conducted. First, the data was filtered in order to study network flows that were data less or had transfers of a certain number of bytes looking for DoS attacks or virus spreading. Also, specific ports were filtered out looking for virus activity and port scans or other port related activity. Some of these filtered data sets were then further filtered based on such things as protocol or TCP flags. Holt-Winters was then applied to these datasets to find detectable (anomalous) events that could be characterized. The characterization of the network traffic involved more filtering on the aforementioned header fields and correlating the anomalous events in different datasets to form unique event characterizations. Specific examples that were of particular use in formulating a hypothesis concerning this detection and characterization are covered in detail below. The following ports and viruses were given special attention in the search and characterization study. [Figure 2 – commonly scanned ports] Port usage of commonly scanned ports 137 NetBIOS name service (UDP) 21 FTP 25 SMTP 53 DNS 17 QOTD 113 IDENTD/AUTH 105 CSO 33 DSP 129 PWDGEN – not used for anything, so most likely a port scan 29 MSG-ICP 1 TCPMUX – test if machine is running SGI Irix 13 daytime - Not clearly specified format => used for fingerprinting machines 93 DCP 41 RAT: Deep Throat - Puts an FTP Service at Port 41 85 MIT ML Device 97 Swift Remote Virtual File Protocol 77 Private Remote Job Execution Services 73 Remote Job Services 121 Jammerkilla - Encore Expedited Remote Procedure Call 37 Time
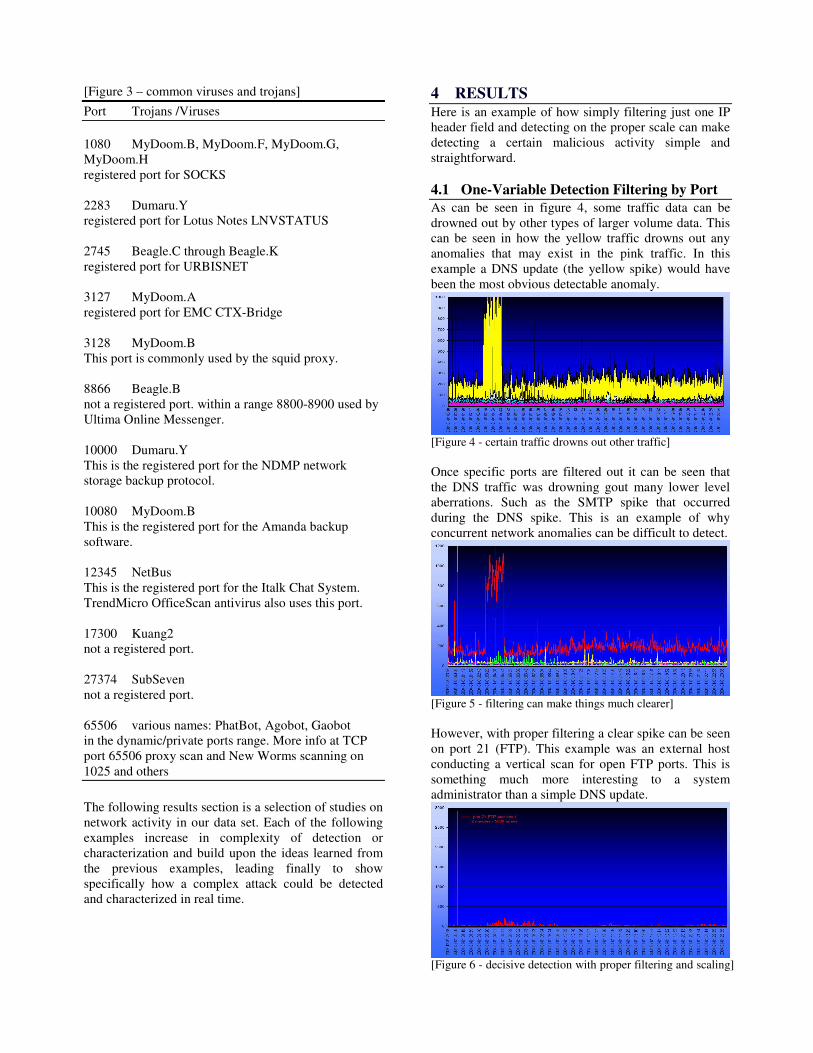
[Figure 3 – common viruses and trojans] Port Trojans /Viruses 1080 MyDoom.B, MyDoom.F, MyDoom.G, MyDoom.H registered port for SOCKS 2283 Dumaru.Y registered port for Lotus Notes LNVSTATUS 2745 Beagle.C through Beagle.K registered port for URBISNET 3127 MyDoom.A registered port for EMC CTX-Bridge 3128 MyDoom.B This port is commonly used by the squid proxy. 8866 Beagle.B not a registered port. within a range 8800-8900 used by Ultima Online Messenger. 10000 Dumaru.Y This is the registered port for the NDMP network storage backup protocol. 10080 MyDoom.B This is the registered port for the Amanda backup software. 12345 NetBus This is the registered port for the Italk Chat System. TrendMicro OfficeScan antivirus also uses this port. 17300 Kuang2 not a registered port. 27374 SubSeven not a registered port. 65506 various names: PhatBot, Agobot, Gaobot in the dynamic/private ports range. More info at TCP port 65506 proxy scan and New Worms scanning on 1025 and others
The following results section is a selection of studies on network activity in our data set. Each of the following examples increase in complexity of detection or characterization and build upon the ideas learned from the previous examples, leading finally to show specifically how a complex attack could be detected and characterized in real time.
4 RESULTS Here is an example of how simply filtering just one IP header field and detecting on the proper scale can make detecting a certain malicious activity simple and straightforward. 4.1 One-Variable Detection Filtering by Port As can be seen in figure 4, some traffic data can be drowned out by other types of larger volume data. This can be seen in how the yellow traffic drowns out any anomalies that may exist in the pink traffic. In this example a DNS update (the yellow spike) would have been the most obvious detectable anomaly.
[Figure 4 - certain traffic drowns out other traffic] Once specific ports are filtered out it can be seen that the DNS traffic was drowning gout many lower level aberrations. Such as the SMTP spike that occurred during the DNS spike. This is an example of why concurrent network anomalies can be difficult to detect.
[Figure 5 - filtering can make things much clearer] However, with proper filtering a clear spike can be seen on port 21 (FTP). This example was an external host conducting a vertical scan for open FTP ports. This is something much more interesting to a system administrator than a simple DNS update.
[Figure 6 - decisive detection with proper filtering and scaling]
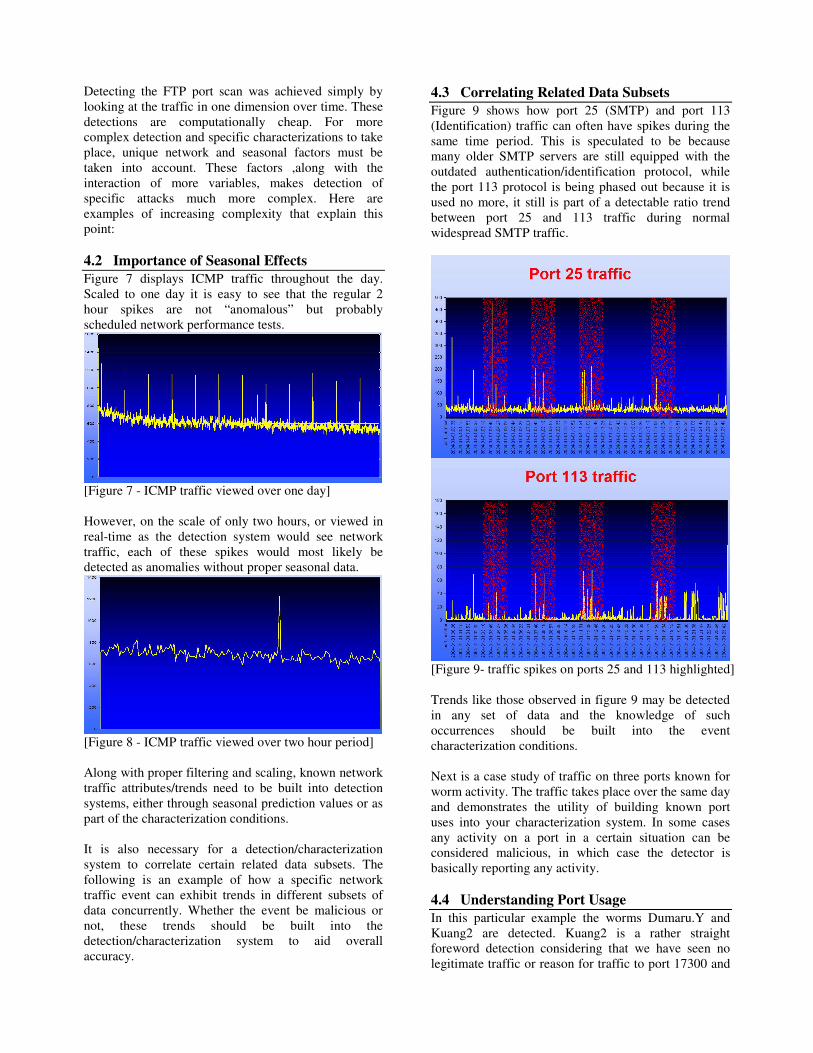
Detecting the FTP port scan was achieved simply by looking at the traffic in one dimension over time. These detections are computationally cheap. For more complex detection and specific characterizations to take place, unique network and seasonal factors must be taken into account. These factors ,along with the interaction of more variables, makes detection of specific attacks much more complex. Here are examples of increasing complexity that explain this point: 4.2 Importance of Seasonal Effects Figure 7 displays ICMP traffic throughout the day. Scaled to one day it is easy to see that the regular 2 hour spikes are not “anomalous” but probably scheduled network performance tests.
[Figure 7 - ICMP traffic viewed over one day] However, on the scale of only two hours, or viewed in real-time as the detection system would see network traffic, each of these spikes would most likely be detected as anomalies without proper seasonal data.
[Figure 8 - ICMP traffic viewed over two hour period] Along with proper filtering and scaling, known network traffic attributes/trends need to be built into detection systems, either through seasonal prediction values or as part of the characterization conditions. It is also necessary for a detection/characterization system to correlate certain related data subsets. The following is an example of how a specific network traffic event can exhibit trends in different subsets of data concurrently. Whether the event be malicious or not, these trends should be built into the detection/characterization system to aid overall accuracy.
4.3 Correlating Related Data Subsets Figure 9 shows how port 25 (SMTP) and port 113 (Identification) traffic can often have spikes during the same time period. This is speculated to be because many older SMTP servers are still equipped with the outdated authentication/identification protocol, while the port 113 protocol is being phased out because it is used no more, it still is part of a detectable ratio trend between port 25 and 113 traffic during normal widespread SMTP traffic.
[Figure 9- traffic spikes on ports 25 and 113 highlighted] Trends like those observed in figure 9 may be detected in any set of data and the knowledge of such occurrences should be built into the event characterization conditions. Next is a case study of traffic on three ports known for worm activity. The traffic takes place over the same day and demonstrates the utility of building known port uses into your characterization system. In some cases any activity on a port in a certain situation can be considered malicious, in which case the detector is basically reporting any activity. 4.4 Understanding Port Usage In this particular example the worms Dumaru.Y and Kuang2 are detected. Kuang2 is a rather straight foreword detection considering that we have seen no legitimate traffic or reason for traffic to port 17300 and
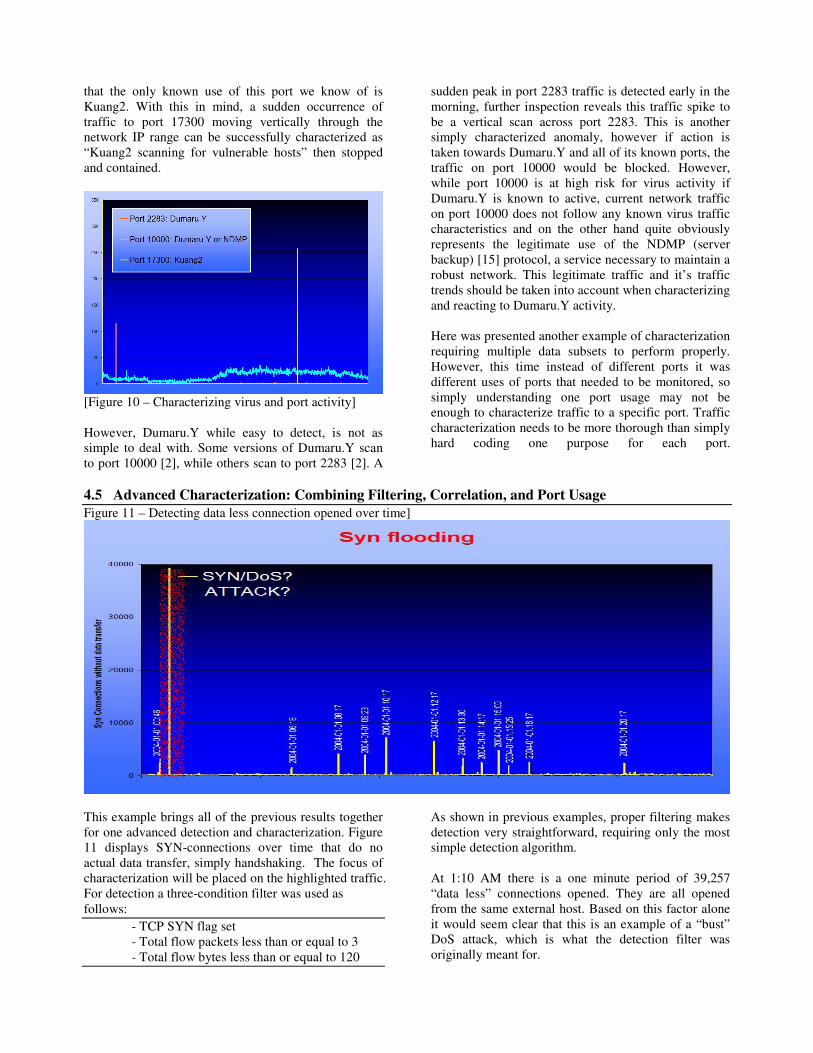
that the only known use of this port we know of is Kuang2. With this in mind, a sudden occurrence of traffic to port 17300 moving vertically through the network IP range can be successfully characterized as “Kuang2 scanning for vulnerable hosts” then stopped and contained.
[Figure 10 – Characterizing virus and port activity] However, Dumaru.Y while easy to detect, is not as simple to deal with. Some versions of Dumaru.Y scan to port 10000 [2], while others scan to port 2283 [2]. A
sudden peak in port 2283 traffic is detected early in the morning, further inspection reveals this traffic spike to be a vertical scan across port 2283. This is another simply characterized anomaly, however if action is taken towards Dumaru.Y and all of its known ports, the traffic on port 10000 would be blocked. However, while port 10000 is at high risk for virus activity if Dumaru.Y is known to active, current network traffic on port 10000 does not follow any known virus traffic characteristics and on the other hand quite obviously represents the legitimate use of the NDMP (server backup) [15] protocol, a service necessary to maintain a robust network. This legitimate traffic and it’s traffic trends should be taken into account when characterizing and reacting to Dumaru.Y activity. Here was presented another example of characterization requiring multiple data subsets to perform properly. However, this time instead of different ports it was different uses of ports that needed to be monitored, so simply understanding one port usage may not be enough to characterize traffic to a specific port. Traffic characterization needs to be more thorough than simply hard coding one purpose for each port.
4.5 Advanced Characterization: Combining Filtering, Correlation, and Port Usage Figure 11 – Detecting data less connection opened over time]
This example brings all of the previous results together for one advanced detection and characterization. Figure 11 displays SYN-connections over time that do no actual data transfer, simply handshaking. The focus of characterization will be placed on the highlighted traffic. For detection a three-condition filter was used as follows: - TCP SYN flag set - Total flow packets less than or equal to 3 - Total flow bytes less than or equal to 120
As shown in previous examples, proper filtering makes detection very straightforward, requiring only the most simple detection algorithm. At 1:10 AM there is a one minute period of 39,257 “data less” connections opened. They are all opened from the same external host. Based on this factor alone it would seem clear that this is an example of a “bust” DoS attack, which is what the detection filter was originally meant for.
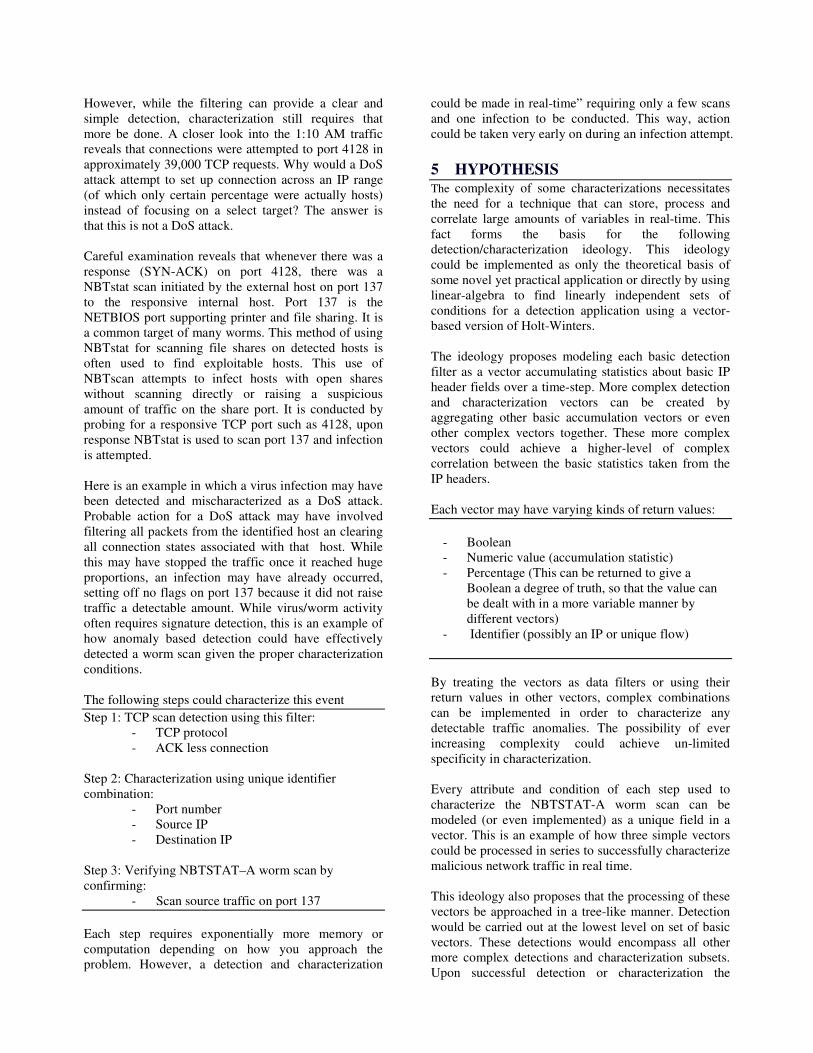
However, while the filtering can provide a clear and simple detection, characterization still requires that more be done. A closer look into the 1:10 AM traffic reveals that connections were attempted to port 4128 in approximately 39,000 TCP requests. Why would a DoS attack attempt to set up connection across an IP range (of which only certain percentage were actually hosts) instead of focusing on a select target? The answer is that this is not a DoS attack. Careful examination reveals that whenever there was a response (SYN-ACK) on port 4128, there was a NBTstat scan initiated by the external host on port 137 to the responsive internal host. Port 137 is the NETBIOS port supporting printer and file sharing. It is a common target of many worms. This method of using NBTstat for scanning file shares on detected hosts is often used to find exploitable hosts. This use of NBTscan attempts to infect hosts with open shares without scanning directly or raising a suspicious amount of traffic on the share port. It is conducted by probing for a responsive TCP port such as 4128, upon response NBTstat is used to scan port 137 and infection is attempted. Here is an example in which a virus infection may have been detected and mischaracterized as a DoS attack. Probable action for a DoS attack may have involved filtering all packets from the identified host an clearing all connection states associated with that host. While this may have stopped the traffic once it reached huge proportions, an infection may have already occurred, setting off no flags on port 137 because it did not raise traffic a detectable amount. While virus/worm activity often requires signature detection, this is an example of how anomaly based detection could have effectively detected a worm scan given the proper characterization conditions. The following steps could characterize this event Step 1: TCP scan detection using this filter:
- TCP protocol - ACK less connection
Step 2: Characterization using unique identifier combination:
- Port number - Source IP - Destination IP
Step 3: Verifying NBTSTAT–A worm scan by confirming: - Scan source traffic on port 137 Each step requires exponentially more memory or computation depending on how you approach the problem. However, a detection and characterization
could be made in real-time” requiring only a few scans and one infection to be conducted. This way, action could be taken very early on during an infection attempt. 5 HYPOTHESIS The complexity of some characterizations necessitates the need for a technique that can store, process and correlate large amounts of variables in real-time. This fact forms the basis for the following detection/characterization ideology. This ideology could be implemented as only the theoretical basis of some novel yet practical application or directly by using linear-algebra to find linearly independent sets of conditions for a detection application using a vector-based version of Holt-Winters. The ideology proposes modeling each basic detection filter as a vector accumulating statistics about basic IP header fields over a time-step. More complex detection and characterization vectors can be created by aggregating other basic accumulation vectors or even other complex vectors together. These more complex vectors could achieve a higher-level of complex correlation between the basic statistics taken from the IP headers. Each vector may have varying kinds of return values:
- Boolean - Numeric value (accumulation statistic) - Percentage (This can be returned to give a
Boolean a degree of truth, so that the value can be dealt with in a more variable manner by different vectors)
- Identifier (possibly an IP or unique flow) By treating the vectors as data filters or using their return values in other vectors, complex combinations can be implemented in order to characterize any detectable traffic anomalies. The possibility of ever increasing complexity could achieve un-limited specificity in characterization. Every attribute and condition of each step used to characterize the NBTSTAT-A worm scan can be modeled (or even implemented) as a unique field in a vector. This is an example of how three simple vectors could be processed in series to successfully characterize malicious network traffic in real time. This ideology also proposes that the processing of these vectors be approached in a tree-like manner. Detection would be carried out at the lowest level on set of basic vectors. These detections would encompass all other more complex detections and characterization subsets. Upon successful detection or characterization the
process tree would fork into higher and higher level vectors until finally all possible characterizations return negative or any return positive, in which case proper action may be taken. 6 FUTURE WORK The ultimate final goal of this project would be creating a real working application of the hypothesis and testing it on real network traffic. However, before this can be done a detailed analysis on the plausibility and necessary computational and storage requirements must be done. There must be a practical way to structure the ever increasing complexity of detection and characterization so that it can be scaled as needed for future applications. A way to store and organize detection and characterization vector sets must be clearly defined before such an application can be created. 7 SUMMARY AND CONCLUSIONS Detecting and characterizing a wide variety of network traffic is possible through tracking packet header fields. However, the vast number of varying types of malicious activity requires that, in some cases, a complex combination of these header values be filtered together and correlated to properly understand the network traffic. This paper introduces a novel concept of modeling types of network activity as a vector of conditions based on packet header fields that are being tracked, accumulated, and filtered. This concept allows for ever increasing levels of complexity to be built on top of each other, enabling us, through the application of linear algebra, to be monitoring the minimum, linearly independent set of variables necessary for detection and characterization. This model is scalable due to the separation of the levels of complexity. The increasing complexity could have its load distributed in a tree-like manner across a properly scaled number of resource entities. This hypothesis was drawn from considering the increasing necessity for complexity in detecting and characterizing today’s network traffic. This necessity for complex detection was demonstrated using the dataset of network flows provided by the Fermi Lab. While the dataset and our study does not exhaustively cover the plausibility of detecting all known attacks, it does study examples of how the levels of complexity in detection can be built on top of each other, proving the ability for the detection schema to be extended to malicious activity of unknown complexity.
8 REFERENCES [1] Kuang2, http://xforce.iss.net/xforce/xfdb/4074. [2] Dumaru.Y, http://www.nod32.com/scriptless/msgs/dumaruy.htm. [3] http:// us.mcafee.com [4] http://www.symantec.com [5] Jake Brutlag. Notes on RRDTOOL Implementation of Aberrant Behavior Detection. http://cricket.sourceforge.net/aberrant/rrd_hw.htm [6] N. Weaver, V. Paxson, S. Staniford, and R. Cunningham. A Taxonomy of Computer Worms, the First Workshop on Rapid Malcode (WORM), 2003. [7] J. Jung, V. Paxson, A. W. Berger, and H. Balakrishnan, Fast Portscan Detection Using Sequential Hypothesis Testing, , Proc. IEEE Symposium on Security and Privacy, 2004. [8] J. Jung, B. Krishnamurthy and M. Rabinovich, Flash Crowds and Denial of Service Attacks: Characterization and Implications for CDNs and Web Sites (PS version), in Proc. of WWW, 2002. [9] Haining Wang, Danlu Zhang, and Kang G. Shin,Detecting SYN Flooding Attacks in Proc. of IEEE INFOCOM, 2002 [10] T. H. Ptacek and T. N. Newsham. Insertion, Evasion, and Denial of Service: Eluding Network Intrusion Detection. Technical Report. 1998. [11] Barford, J. Kline, D. Plonka and Amos Ron, A Signal Analysis of Network Traffic Anomalies, P in Proc. of ACM SIGCOMM Internet Measurement Workshop (IMW), 2003. [12] B. Krishnamurthy, S. Sen, Y. Zhang, and Y. Chen, Sketch-based Change Detection: Methods, Evaluation, and Applications, in Proc. of ACM SIGCOMM Internet Measurement Conference (IMC), 2003. [ ] Jake D. Brutlag. Aberrant Behavior Detection in Time Series for Network Monitoring. http://www.usenix.org/events/lisa2000/full_papers/brutlag/brutlag_html/ [14] Dave’s port list http://lists.gpick.com/portlist/portlist.htm [15] Whitehats port database http://www.whitehats.ca/main/tools/portdatabase/portdatabase.html


![Anomaly Detection: Principles, Benchmarking, Explanation ...web.engr.oregonstate.edu/~tgd/...anomaly-detection... · Towards a Theory of Anomaly Detection [Siddiqui, et al.; UAI 2016]](https://img.pdfslide.net/doc/110x75/5fd8992320a65f059c333c6d/anomaly-detection-principles-benchmarking-explanation-webengr-tgdanomaly-detection.jpg)


![Increasing Reliability in Network Traffic Anomaly Detection · the proposed anomaly detection methods still have important drawbacks [60, 32] that discredit their practical usage](https://img.pdfslide.net/doc/110x75/604672a1848c7e6ca35d3e3e/increasing-reliability-in-network-traffic-anomaly-detection-the-proposed-anomaly.jpg)