Embed Size (px)
Citation preview
Klinik und Poliklinik für Neurologie
Frauke Zipp
Neurodegeneration und
Neuroprotektion bei Multipler Sklerose

Chard, D.T. et al. (2002) Brain atrophy in
clinically early relapsing-remitting multiple
sclerosis. Brain 125, 327-337
Kuhlmann,T. et al. (2002) Acute axonal damage
in multiple sclerosis is most extensive in early
disease stages and decreases over time. Brain
125, 2202-2212
Early neuronal/axonal injury

Atrophy, NAA ↓ in multiple sclerosis
correlate with disability (De Stefano et al., Brain1998; Bjartmar et al., Ann Neurol 2000)
8 years, from Fisher et al.

Human postmortem spinal cord Lower motor neuron pathology
Vogt et al, Ann Neurol 2009
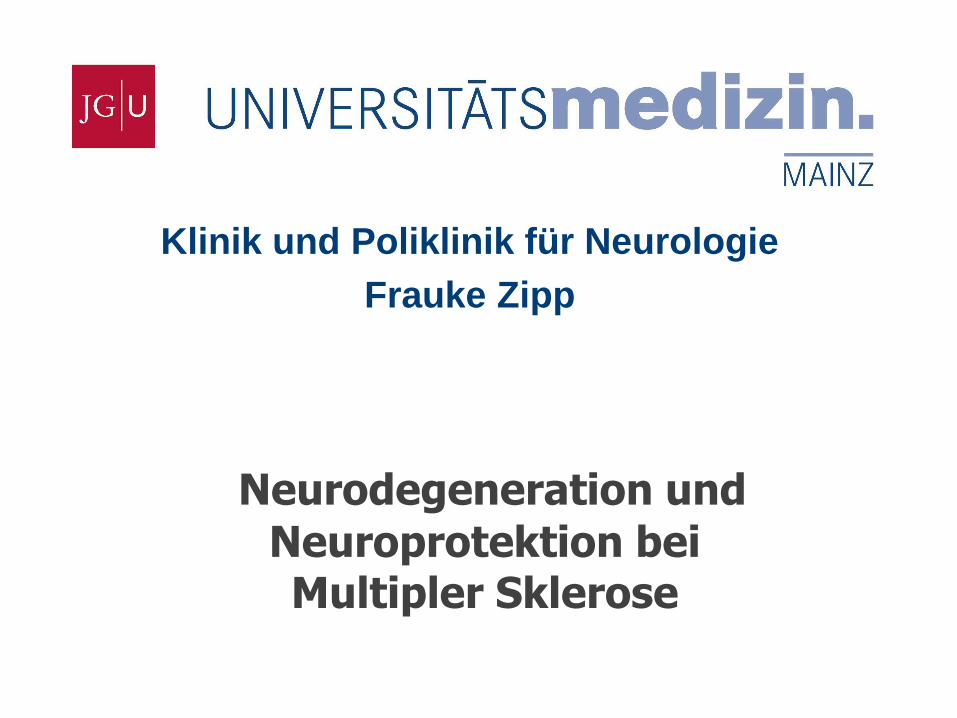
Pathogenesis
Blood Brain
Barrier
CNS-specific
T cell
CNS
vessel
activation/expansion
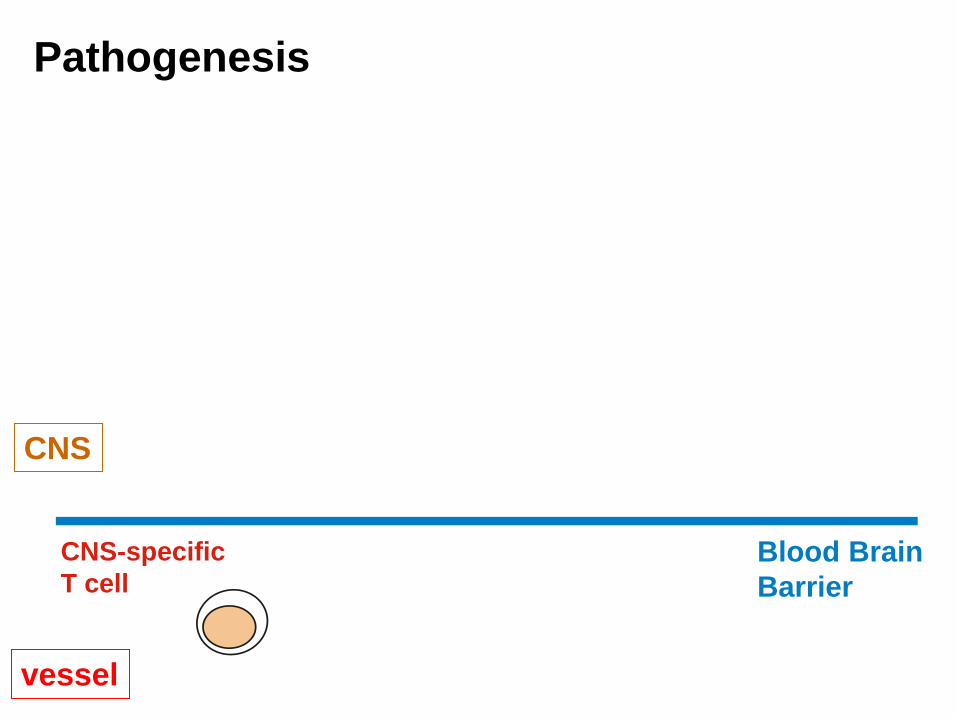
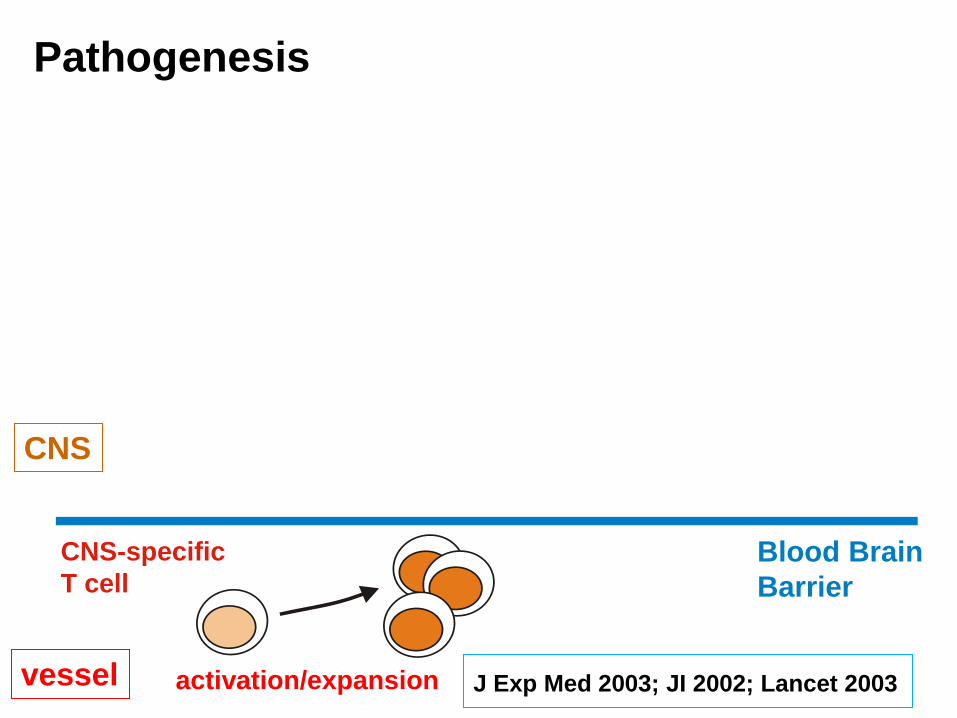
Pathogenesis
Blood Brain
Barrier
CNS
vessel
CNS-specific
T cell
J Exp Med 2003; JI 2002; Lancet 2003

APC
chemokine
adhesion molecules
Blood Brain
Barrier
transmigration
activation and expansion
Pathogenesis
CNS
vessel
CNS-specific
T cell
Nat Med 2009
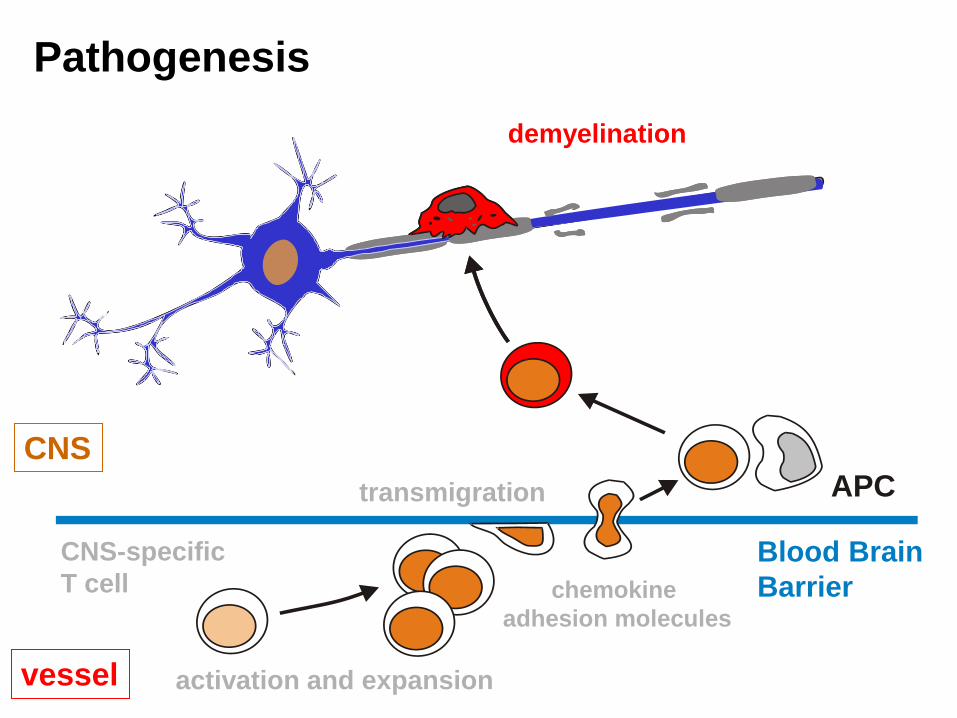
transmigration APC
demyelination
Blood Brain
Barrier chemokine
adhesion molecules
activation and expansion
Pathogenesis
CNS
vessel
CNS-specific
T cell

APC
axonal damage
neuronal injury
CNS-specific
T cell
transmigration
chemokine
adhesion molecules
activation and expansion
Pathogenesis
CNS
vessel
J Exp Med 2003; Neuron 2005;
J Clin Invest 2007; TINS 2006; Ann Neurol
2009; Immunity 2010; TINS 2010;
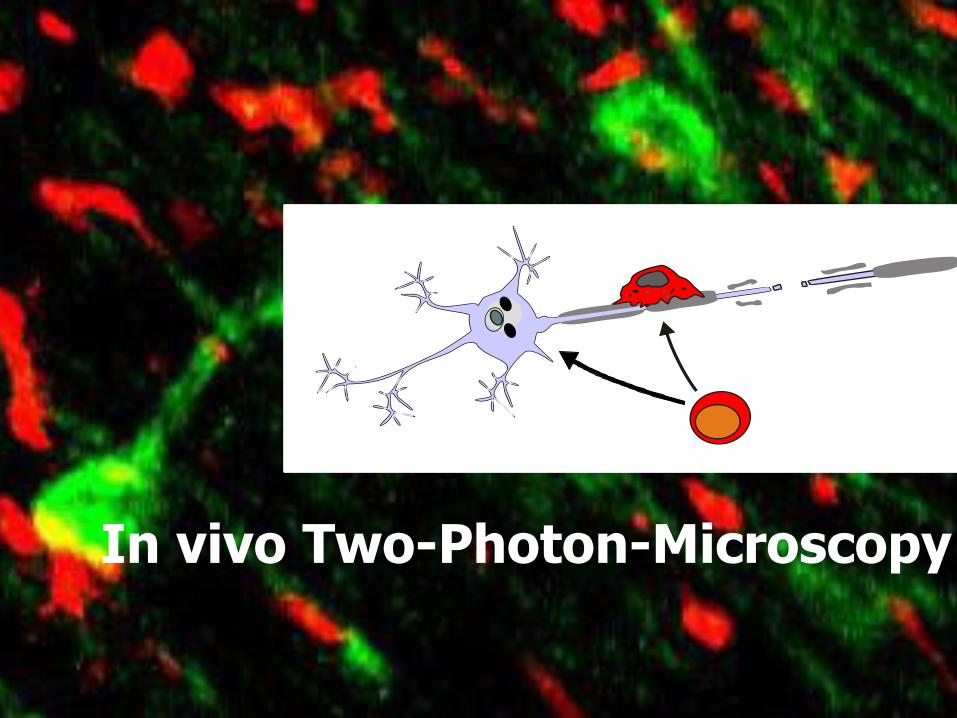
In vivo Two-Photon-Microscopy

2d2.tdRFP TH17 cells
B6.RAG-/-.Thy1.EGFP
Siffrin et al, Immunity 2010
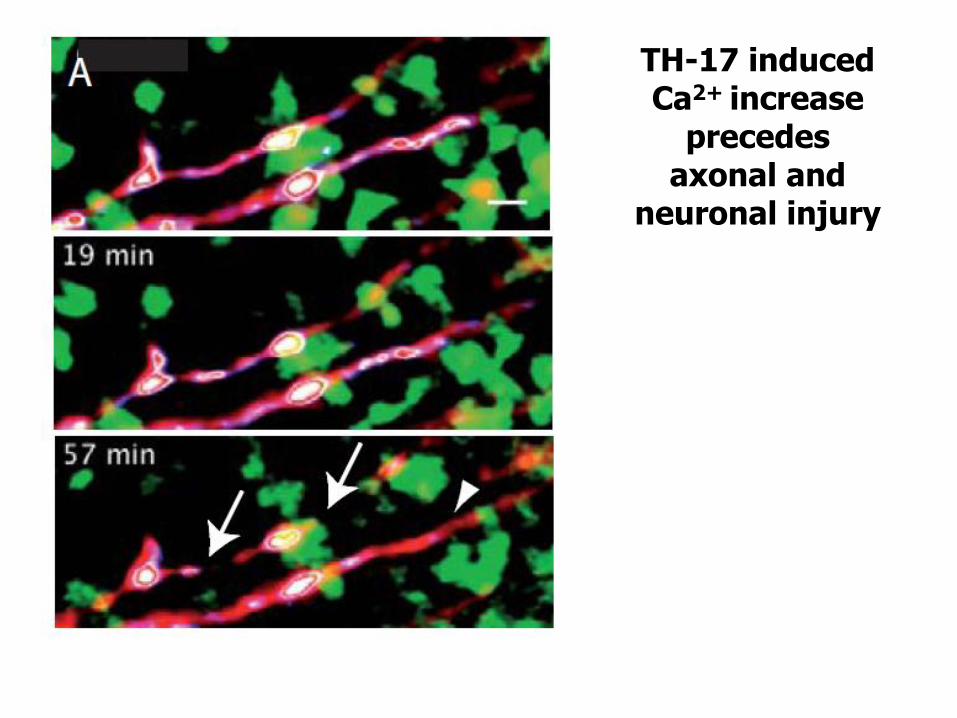
TH-17 induced Ca2+ increase
precedes axonal and
neuronal injury
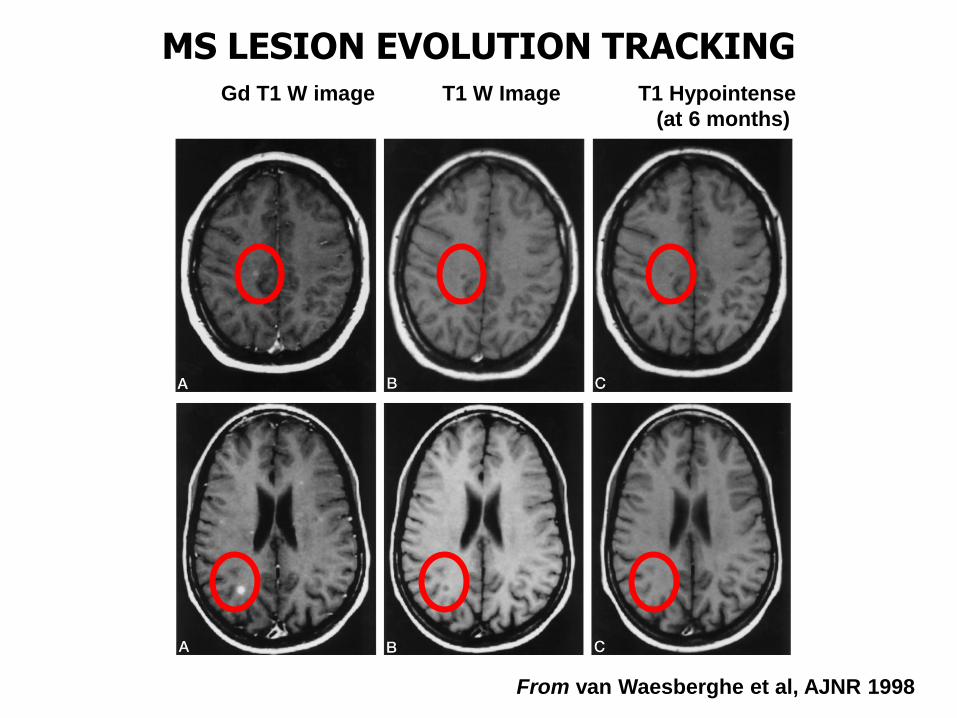
MS LESION EVOLUTION TRACKING
Gd T1 W image T1 W Image T1 Hypointense
(at 6 months)
From van Waesberghe et al, AJNR 1998
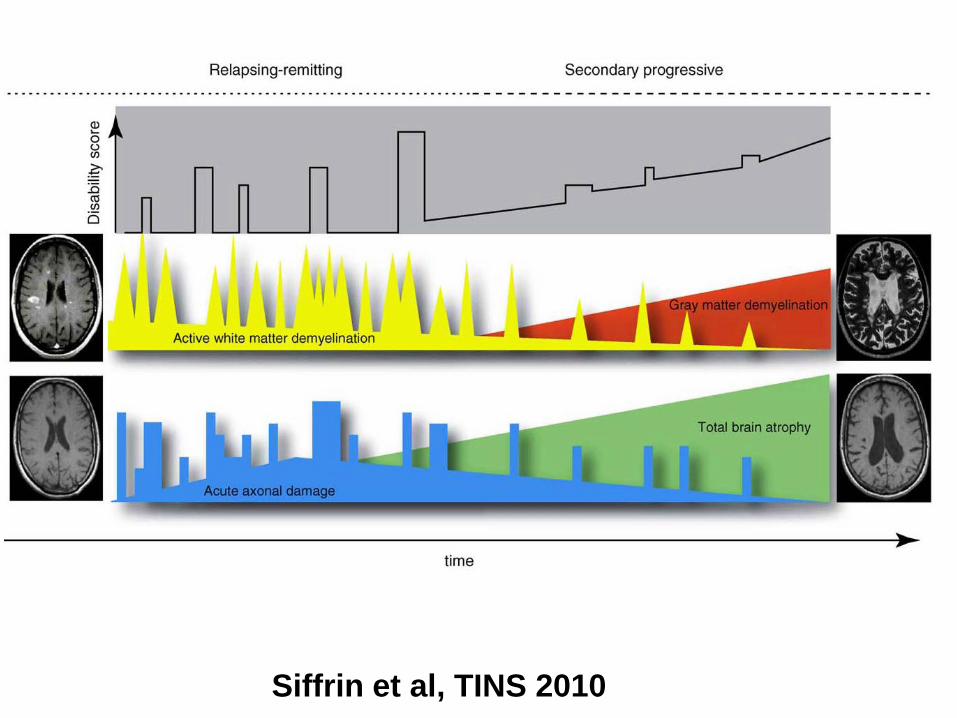
Siffrin et al, TINS 2010

control
Copaxone (50µg/ml)
Axonal outgrowth
control ga0
10
20
30
40
50
60
70
inte
nsit
y
p= 0.0278

Flavonoid in EAE
Epigallocatechin-3-gallate (EGCG)
Aktas et al., J Immunol 2004
EGCG EGCG
Luteolin: Hendriks et al., J Exp Med 2004
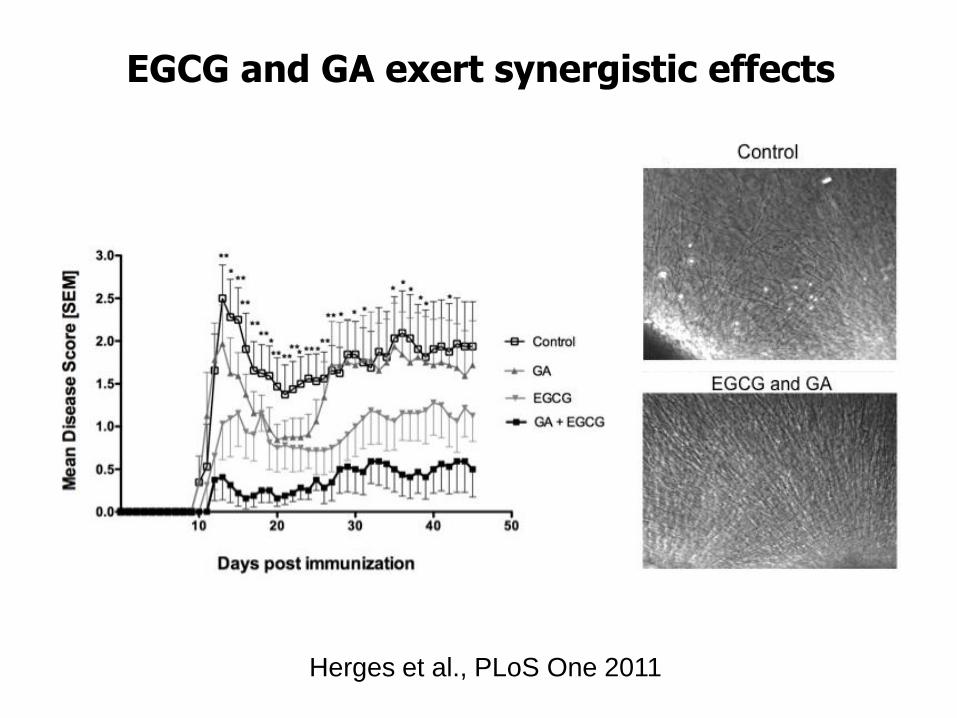
EGCG and GA exert synergistic effects
Herges et al., PLoS One 2011
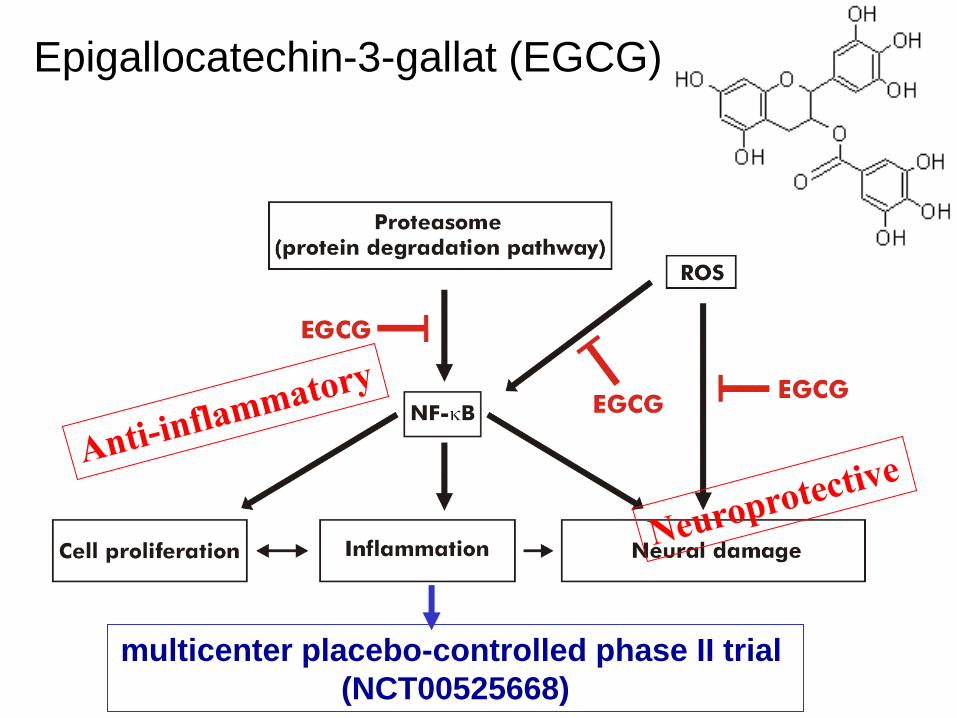
Epigallocatechin-3-gallat (EGCG)
multicenter placebo-controlled phase II trial
(NCT00525668)

Wirksamkeit bei „hochaktiven“ Patienten unter Natalizumab Therapie
Effekt auf die klinische
Behinderungsprogression
Natalizumab 10%
0.0
0.1
0.2
0.4
0.5
Woche
24 0 120
0.3
72 108 96 48 12 60 84 36
64%
Placebo 26%
ku
mu
liert
e W
ah
rsch
ein
lich
keit
ein
er
an
halt
en
den
Beh
ind
eru
ng
sp
rog
ressio
n
Post hoc Analyse von AFFIRM: Havrdova et al. Lancet Neurol 2009
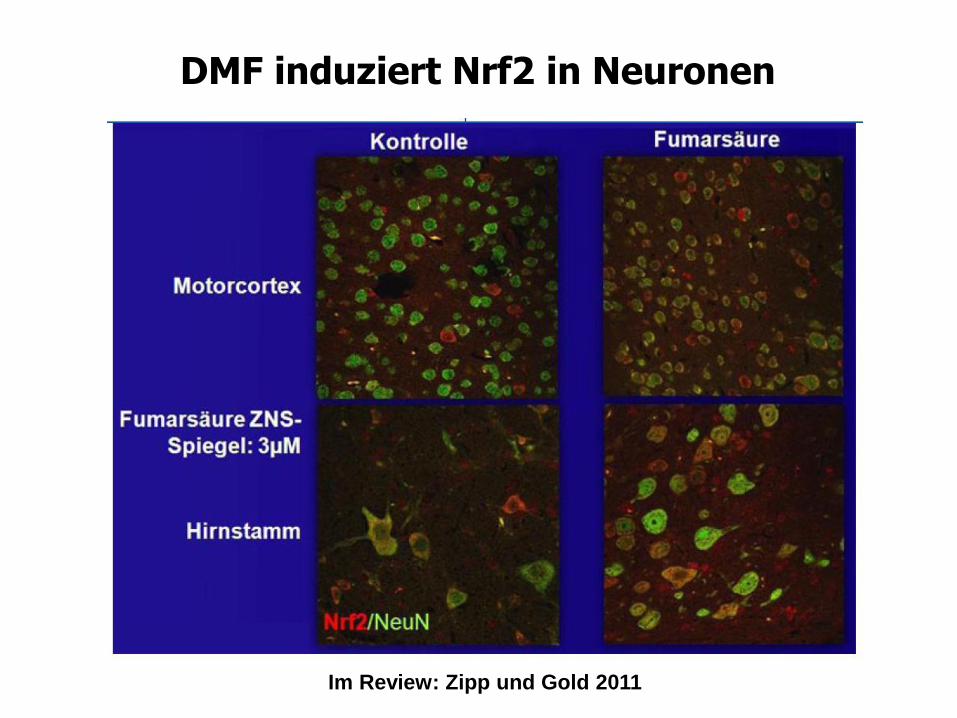
DMF induziert Nrf2 in Neuronen
Im Review: Zipp und Gold 2011

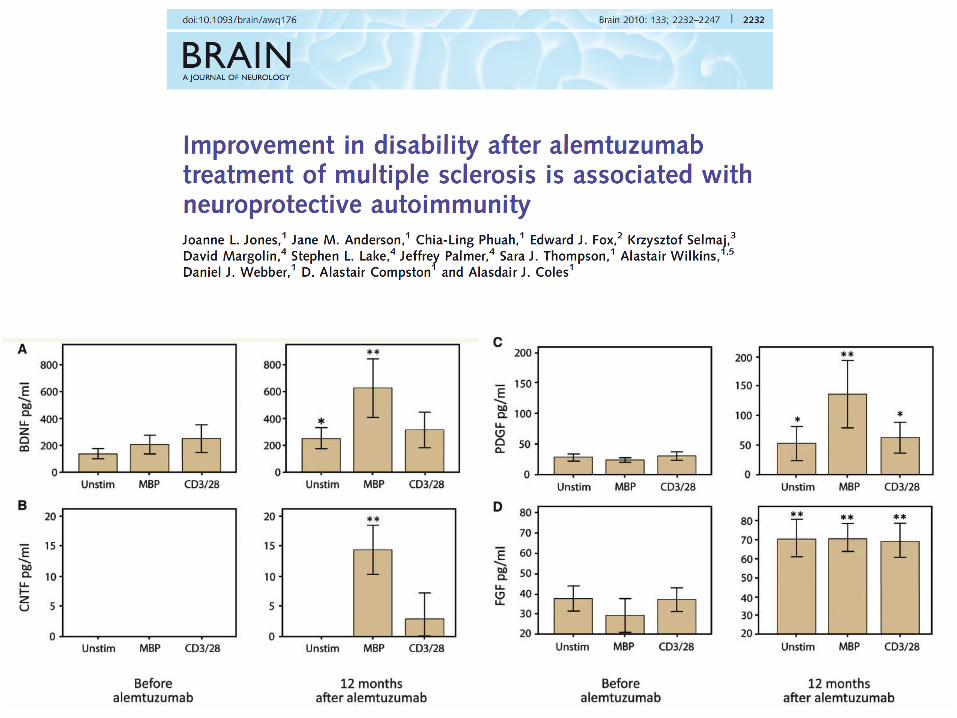
From Jones et al, Brain 2010
Alemtuzumab
Alemtuzumab 12 mg/d
24 mg/d

Fingolimod kann nach oraler Gabe im ZNS nachgewiesen werden
Lichtmikroskopische Autoradiographie bei Ratten nach mehrfacher oraler Gabe von [14C]-Fingolimod (7,5 mg / kg p.o. einmal täglich über 7 Tage)
Rückenmark Gehirn
Foster, CA et al. JPET 2007

From Aktas et al., Nat Rev Neurol 2010

FREEDOMS – Progression der Behinderung
FTY720 verzögert die Behinderungsprogression signifikant
0
5
10
15
20
25
30
0 90 180 270 360 450 540 630 720
FTY720 0,5 mg
FTY720 1,25 mg
Pa
tie
nte
n m
it 3
Mo
na
te a
nh
alt
en
de
r
ED
SS
-Zu
na
hm
e (
%)
Zeit bis zur Behinderungszunahme (Tage)
Plazebo
FTY720 1,25 mg vs. Plazebo: HR=0,68; p=0,02
FTY720 0,5 mg vs. Plazebo: HR=0,70; p=0,02
17,7%
16,6%
24,1%
Kappos L et al. N Engl J Med. 2010

-1.4
-1.2
-1.0
-0.8
-0.6
-0.4
-0.2
0 0 6 12 24
Grün schattierte Fläche:
Geschätzter Gehirnvolumenverlust bei Gesunden (0.2–
0.4% pro Jahr)
FREEDOMS: Reduktion des Gehirnvolumen-Verlustes im Zeitverlauf
Zeit (Monate)
Mit
tler
e V
erä
nd
eru
ng
geg
enü
ber
Ba
seli
ne
(%)
Fingolimod 1.25 mg
Fingolimod 0.5 mg
Placebo
*
** **
***
***
***
Daten nach: Kappos L et al. N Engl J Med. 2010
p < 0.001