Embed Size (px)
Citation preview
Neuroinformatics1: review of statistics
Kenneth D. HarrisUCL, 28/1/15
Types of data analysis
• Exploratory analysis• Graphical• Interactive• Aimed at formulating hypotheses• No rules – whatever helps you find a hypothesis
• Confirmatory analysis• For testing hypotheses once they have been formulated• Several frameworks for testing hypotheses• Rules need to be followed• In principle, you should collect a new data set for confirmatory analysis
• (For drug trials, this really matters. For basic research, people usually don’t bother).
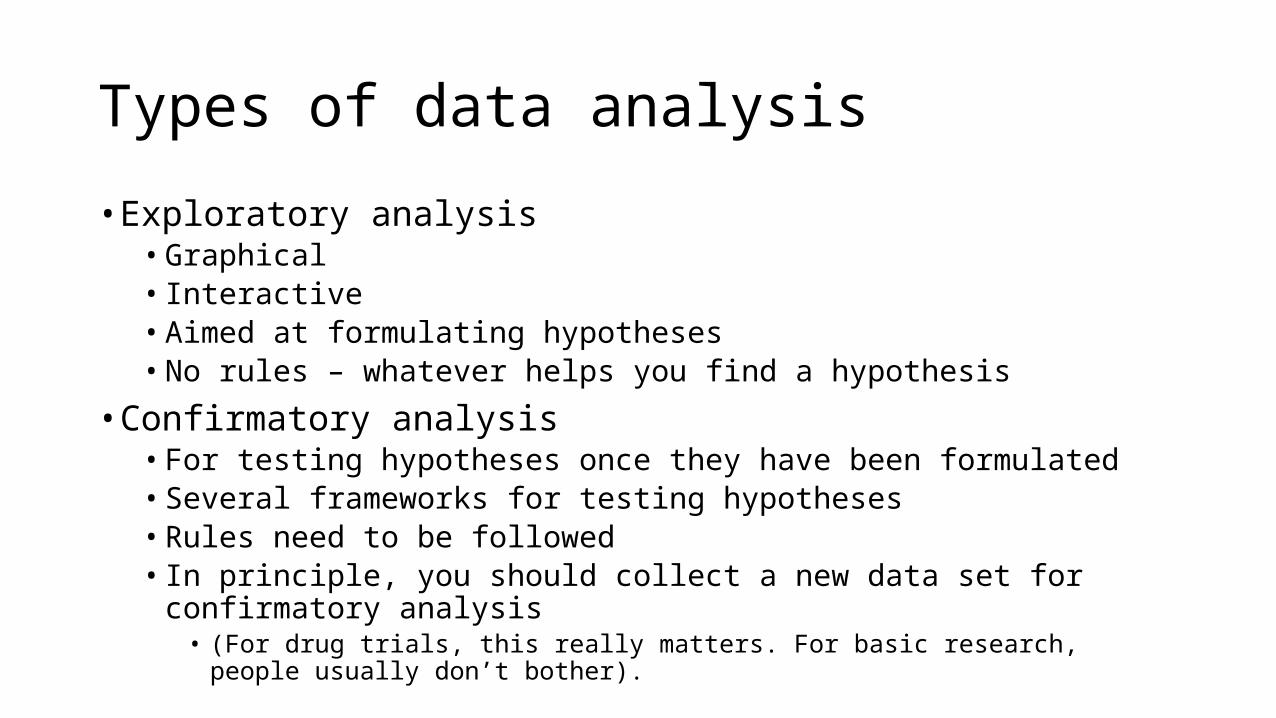
Exploratory analysis
• In low dimensions:• Histograms• Scatterplots• Bar charts
• In high dimensions:• Scatterplot matrix• Dimensionality reduction (PCA etc)• Cluster analysis
• Does NOT confirm a hypothesis• CAN go into a paper – and should, provided you also do confirmatory analysis
Interactive data exploration with gGobi
Confirmatory analysis
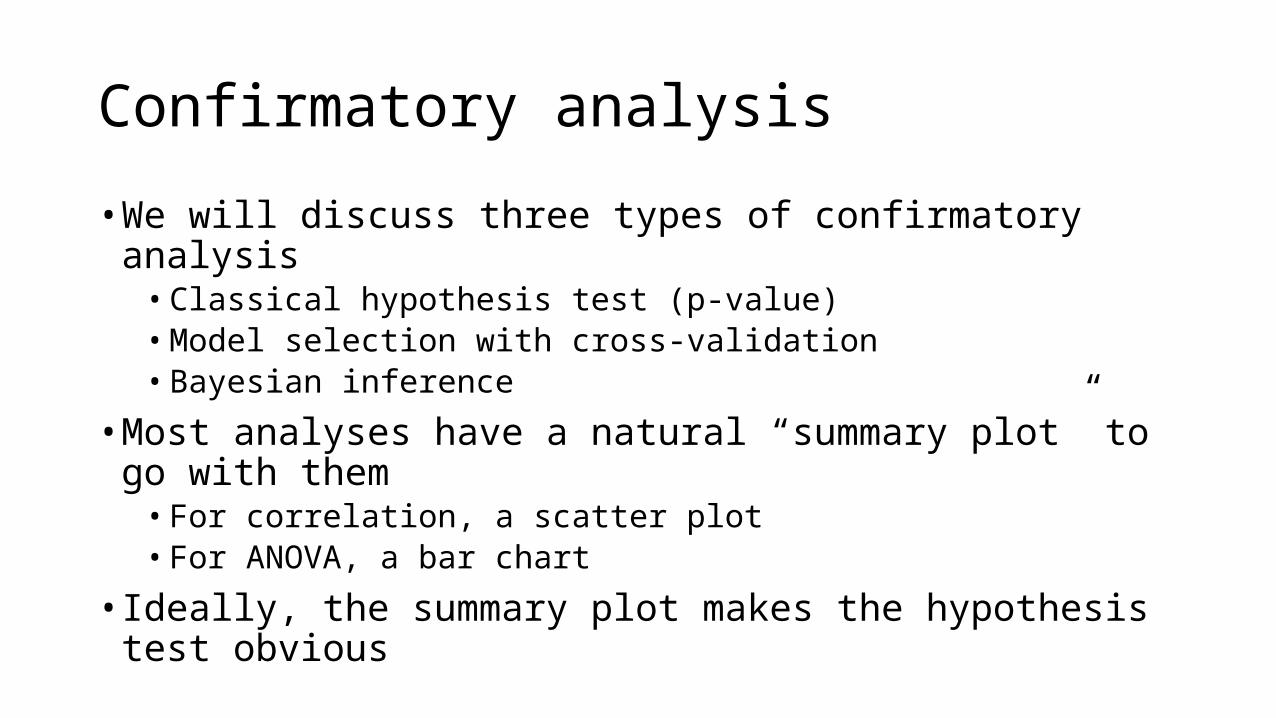
• We will discuss three types of confirmatory analysis• Classical hypothesis test (p-value)• Model selection with cross-validation• Bayesian inference
• Most analyses have a natural “summary plot” to go with them• For correlation, a scatter plot• For ANOVA, a bar chart
• Ideally, the summary plot makes the hypothesis test obvious
The “illustrative example”
• Show a single example of the phenomenon you are measuring• Pick carefully, because readers will take it far too literally
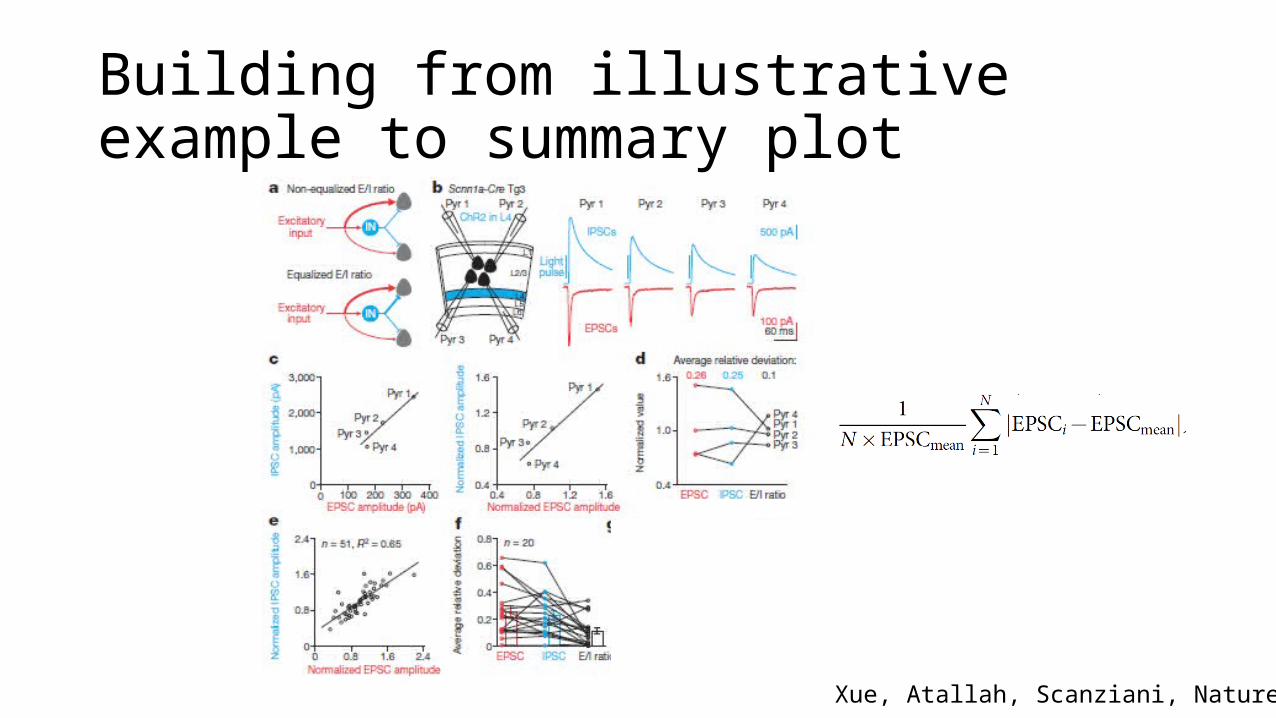
Building from illustrative example to summary plot
Xue, Atallah, Scanziani, Nature 2014
Classical hypothesis testing
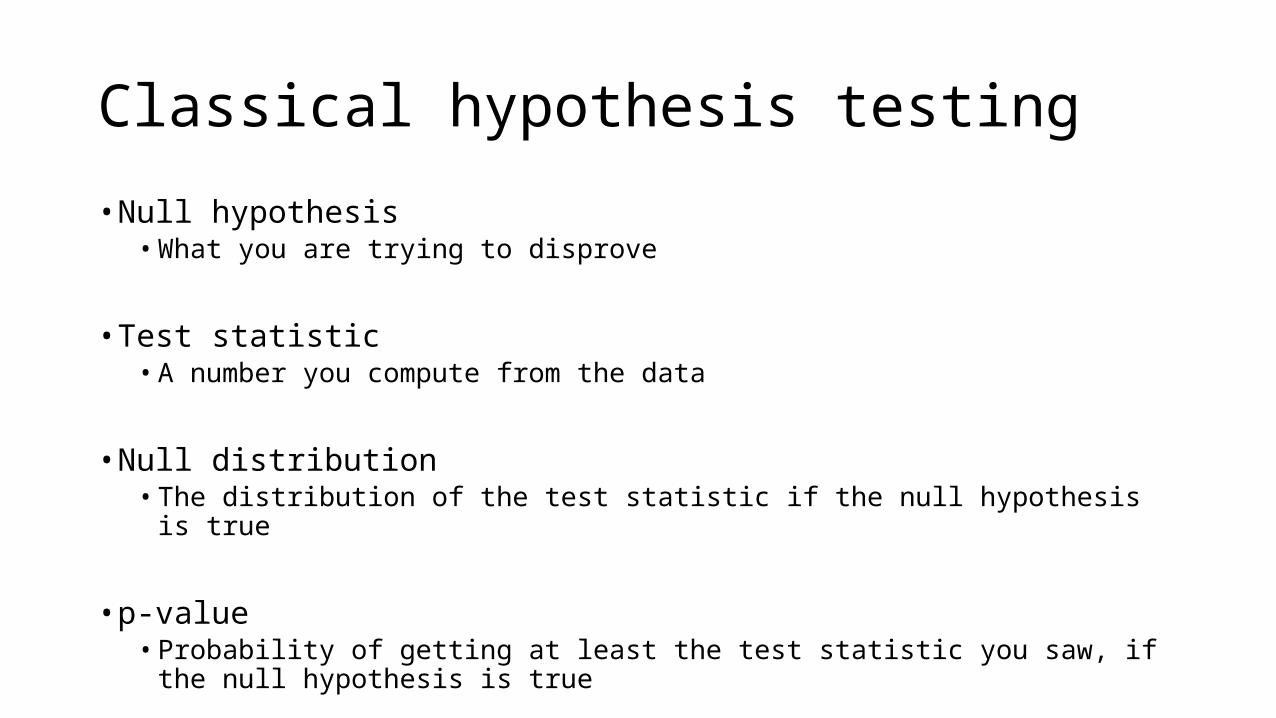
• Null hypothesis• What you are trying to disprove
• Test statistic• A number you compute from the data
• Null distribution• The distribution of the test statistic if the null hypothesis is true
• p-value • Probability of getting at least the test statistic you saw, if the null hypothesis is
true
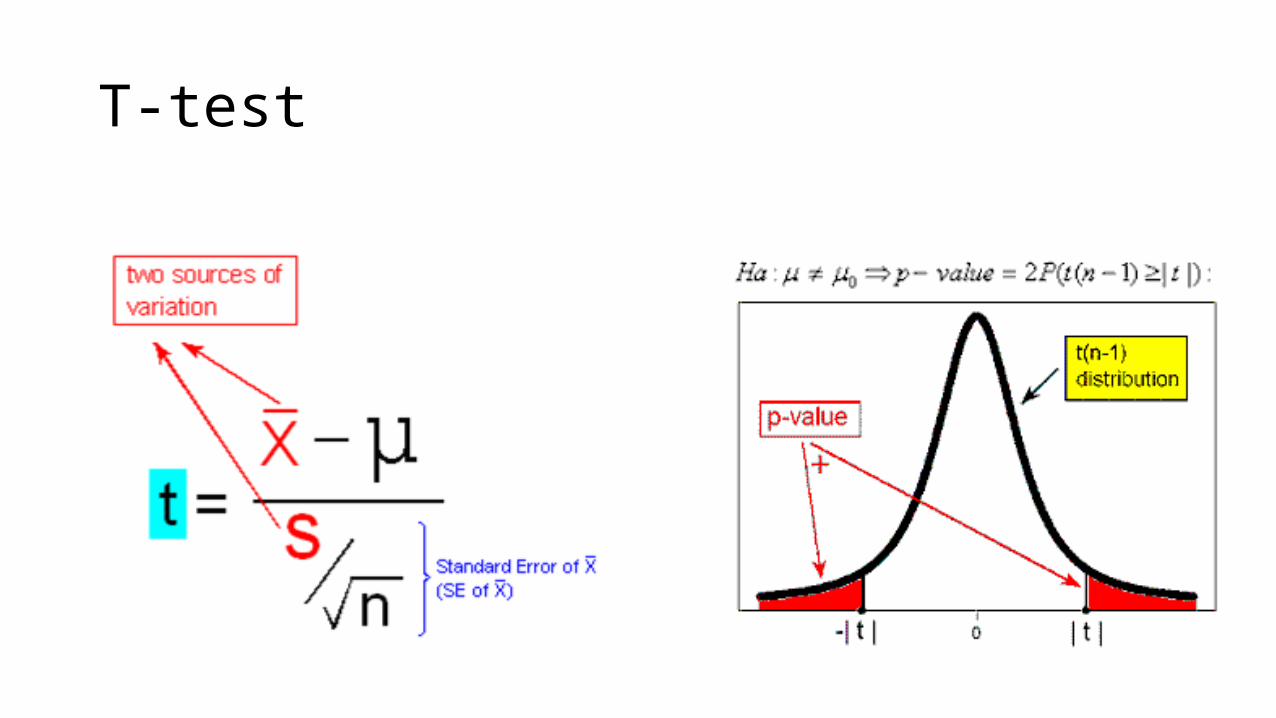
T-test
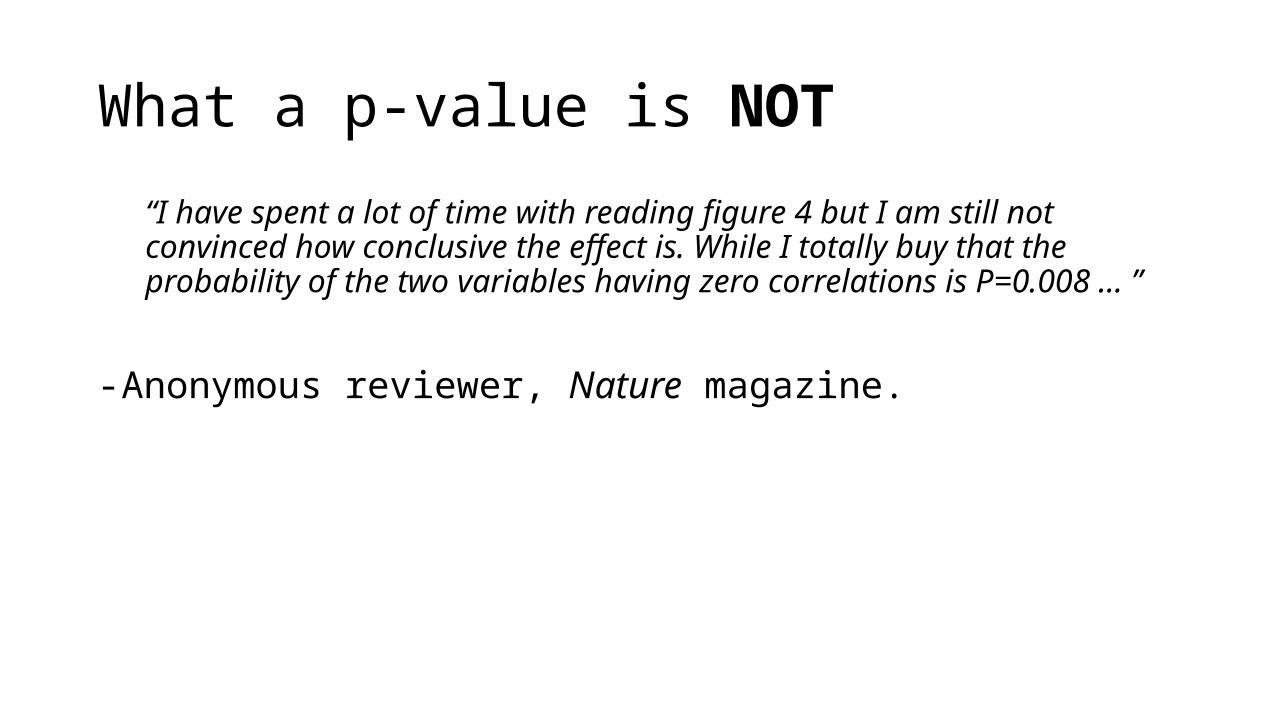
What a p-value is NOT
“I have spent a lot of time with reading figure 4 but I am still not convinced how conclusive the effect is. While I totally buy that the probability of the two variables having zero correlations is P=0.008 … ”
- Anonymous reviewer, Nature magazine.
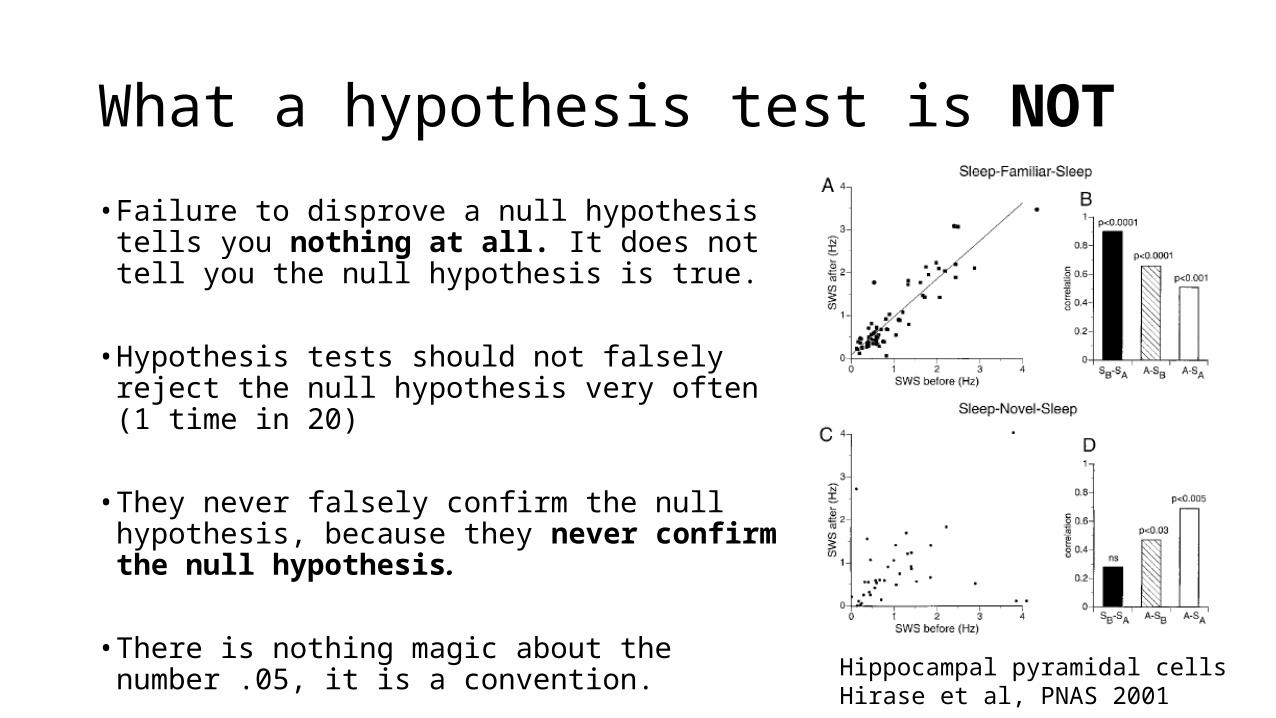
What a hypothesis test is NOT
• Failure to disprove a null hypothesis tells you nothing at all. It does not tell you the null hypothesis is true.
• Hypothesis tests should not falsely reject the null hypothesis very often (1 time in 20)
• They never falsely confirm the null hypothesis, because they never confirm the null hypothesis.
• There is nothing magic about the number .05, it is a convention. Hippocampal pyramidal cells
Hirase et al, PNAS 2001
Assumptions made by hypothesis tests• Many tests have specific assumptions e.g.• Large sample• Gaussian distribution• Check these on a case-by-case basis• This matters most when your p-value is marginal
• Nearly all tests make one additional, major assumption• Independent, Identically Distributed samples (IID)• Think carefully whether this holds
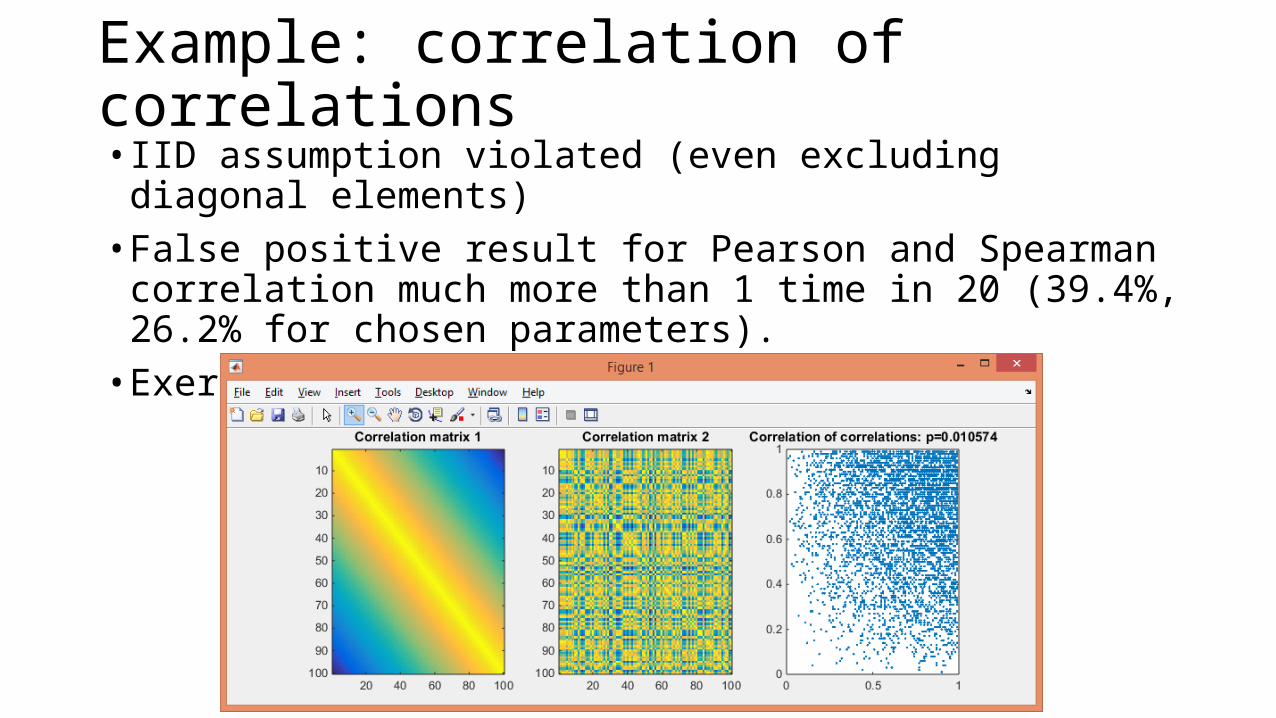
Example: correlation of correlations• IID assumption violated (even excluding diagonal elements)• False positive result for Pearson and Spearman correlation much
more than 1 time in 20 (39.4%, 26.2% for chosen parameters). • Exercise: simulate this.
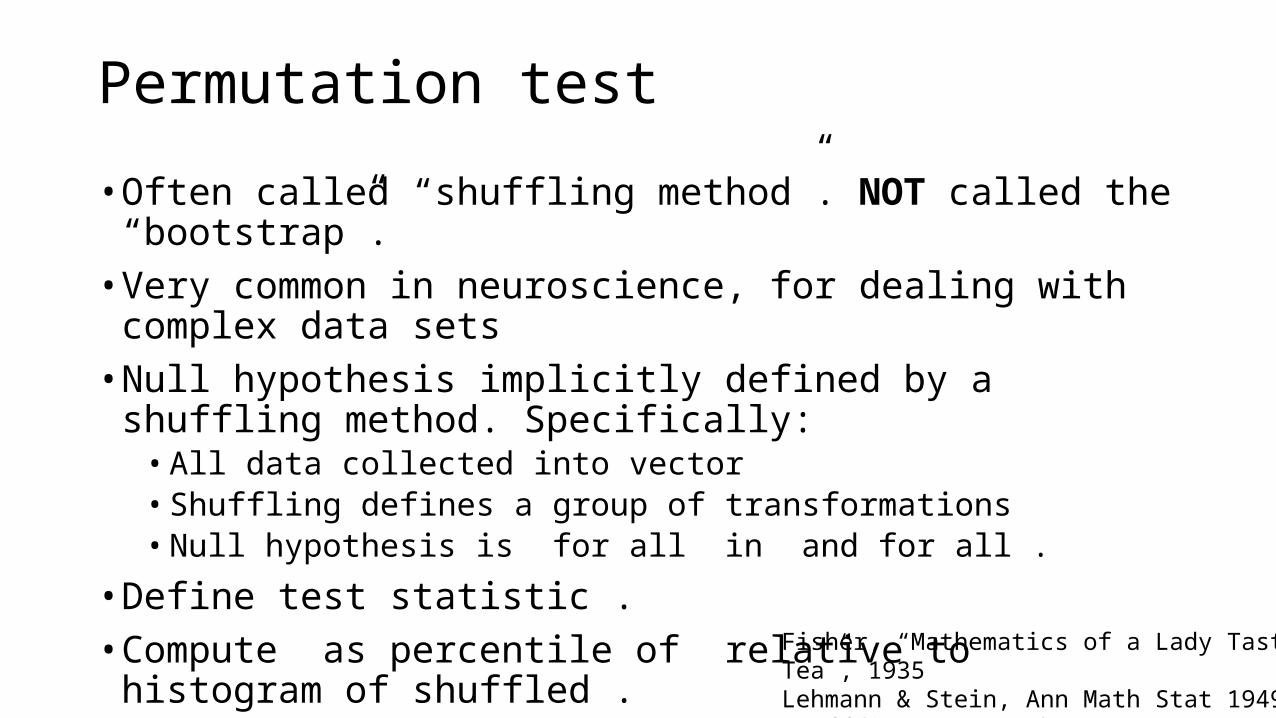
Permutation test
• Often called “shuffling method”. NOT called the “bootstrap”.• Very common in neuroscience, for dealing with complex data sets• Null hypothesis implicitly defined by a shuffling method. Specifically:• All data collected into vector • Shuffling defines a group of transformations • Null hypothesis is for all in and for all .
• Define test statistic .• Compute as percentile of relative to histogram of shuffled .• If null is correct, . • Reject null hypothesis if . Fisher, “Mathematics of a Lady Tasting Tea”, 1935
Lehmann & Stein, Ann Math Stat 1949Hoeffding, Ann Math Stat 1952
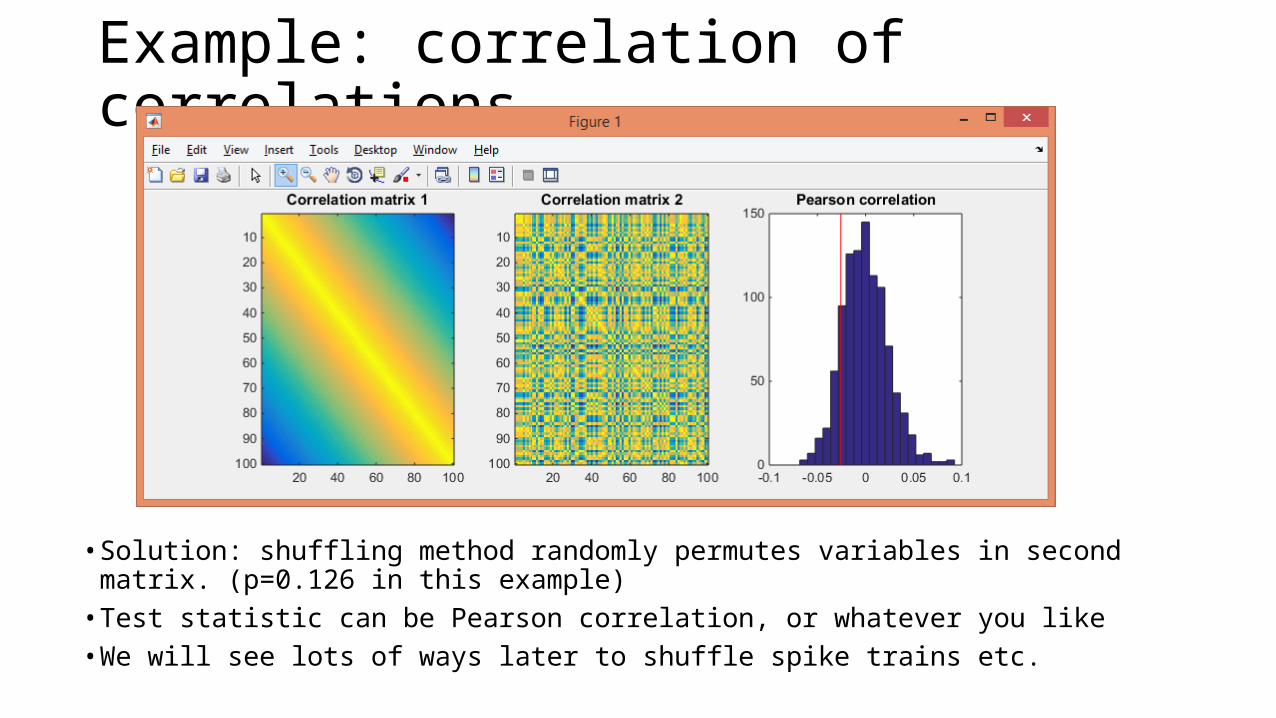
Example: correlation of correlations
• Solution: shuffling method randomly permutes variables in second matrix. (p=0.126 in this example)• Test statistic can be Pearson correlation, or whatever you like• We will see lots of ways later to shuffle spike trains etc.
Model selection with cross-validation
• Another type of inference, borrowed from machine learning. Not as philosophically well developed as classical or Bayesian inference, but becoming very popular due to ease of use with complex data.
• Two models of the data. Which one fits better?
• Data . Model assigns score , where is a set of parameters.
• One idea: choose to maximize . Select model with highest maximum score.
• Problem: more complex models will always win.
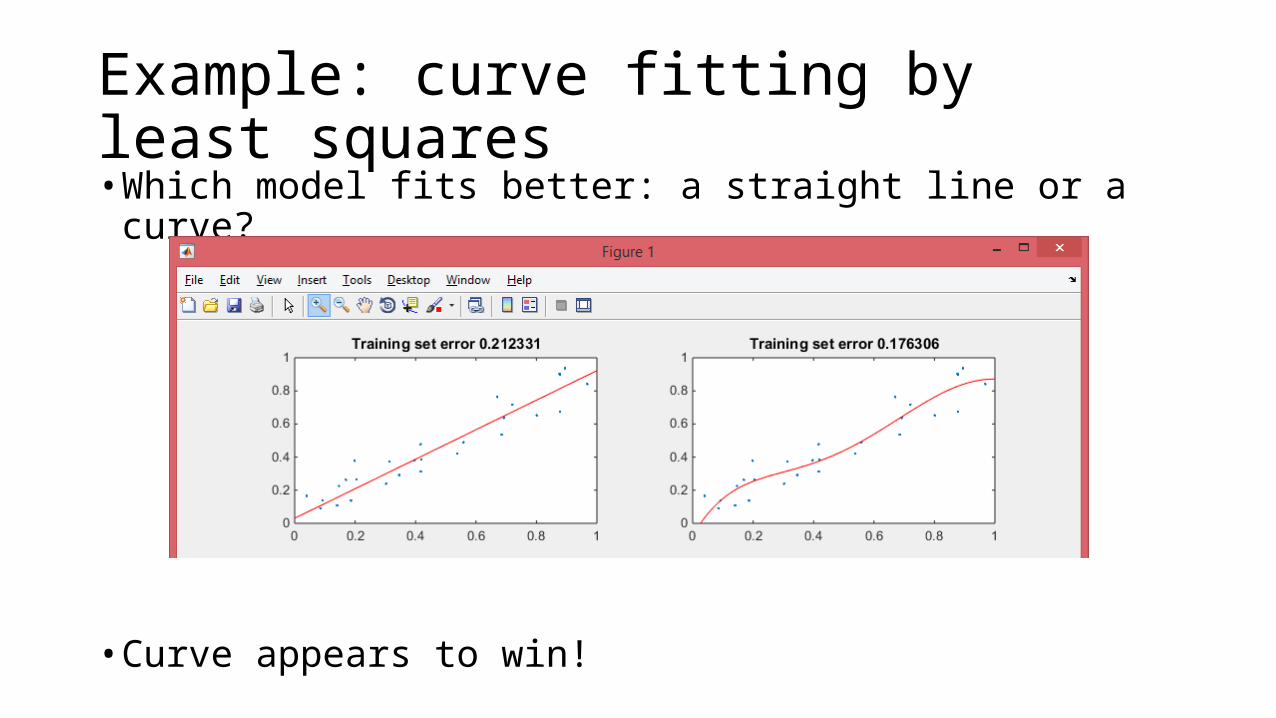
Example: curve fitting by least squares• Which model fits better: a straight line or a curve?
• Curve appears to win!
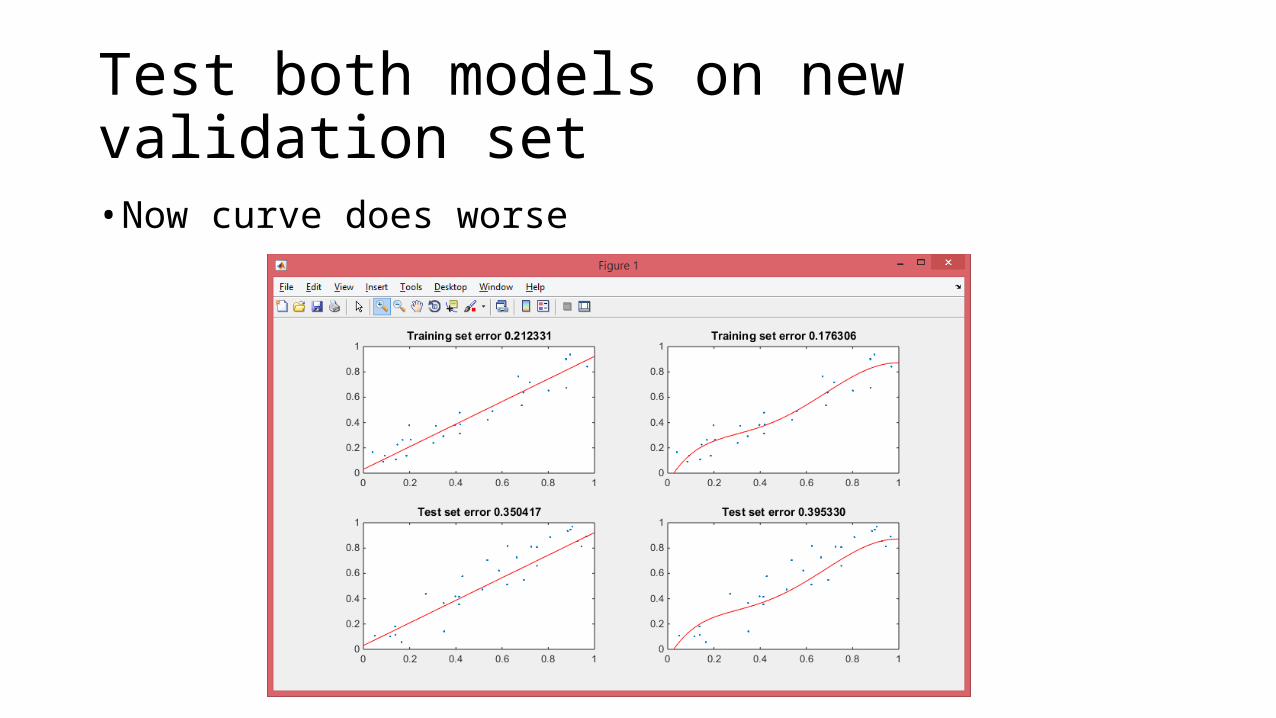
Test both models on new validation set• Now curve does worse
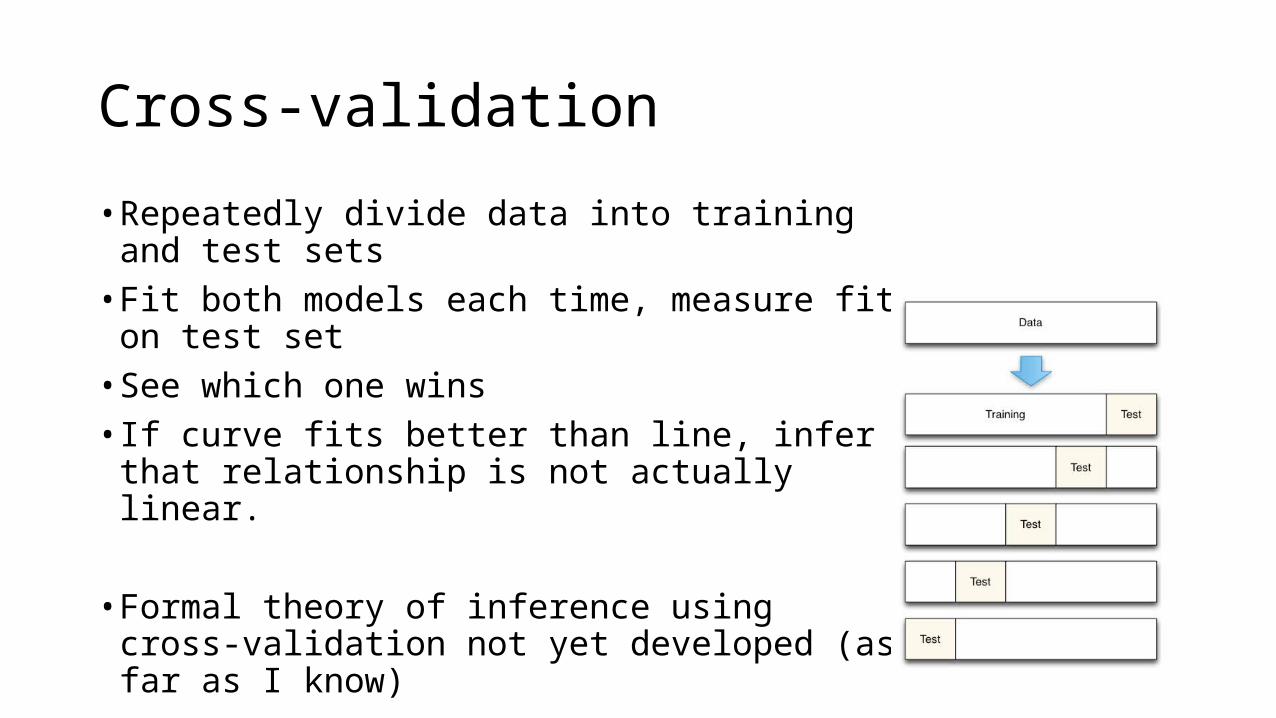
Cross-validation
• Repeatedly divide data into training and test sets• Fit both models each time, measure fit on test set• See which one wins• If curve fits better than line, infer that relationship
is not actually linear.
• Formal theory of inference using cross-validation not yet developed (as far as I know)
Bayesian Inference
• In principle, a more principled way to decide which model fits best
• No problem of free parameters because they are integrated out
Bayesian Inference
• Advantages• Well-developed philosophical and theoretical framework• Optimal inference when models are correct• Some statisticians really, really like it• Allows one to accept as well as reject hypotheses
• Disadvantages• Math can be intractable, requiring long computational approximations• Requires defining prior probabilities – sometimes you have no idea• Incorrect inferences if models are wrong• Unfamiliar to many experimental scientists/reviewers