Embed Size (px)
Citation preview
Neurons derived from P19 embryonic carcinoma cells as a platform for
biosensor applications – optimisation and characterisation
Dissertation
Zur Erlangung des Grades
Doktor der Naturwissenschaften
Am Fachbereich Biologie
Der Johannes Gutenberg-Universität Mainz
Hwei Ling Khor
geboren am 04.08.1977 in Singapore
Mainz, 2007

Eingereicht: 26.11.2007 Tag der mündlichen Prüfung: 19.12.2007

Stuff is made out of dreams.

And life is made of many
chanced encounters.
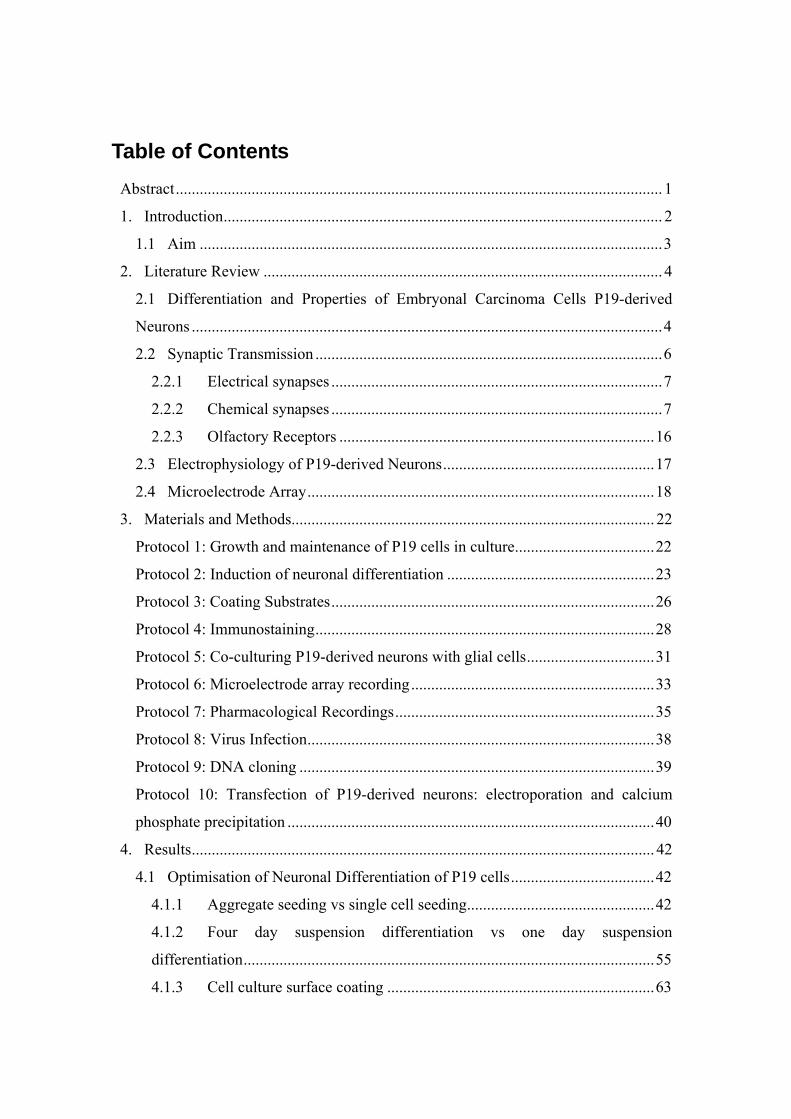
Table of Contents Abstract.......................................................................................................................... 1
1. Introduction.............................................................................................................. 2
1.1 Aim ....................................................................................................................3
2. Literature Review .................................................................................................... 4
2.1 Differentiation and Properties of Embryonal Carcinoma Cells P19-derived
Neurons ......................................................................................................................4
2.2 Synaptic Transmission .......................................................................................6
2.2.1 Electrical synapses ...................................................................................7
2.2.2 Chemical synapses ...................................................................................7
2.2.3 Olfactory Receptors ...............................................................................16
2.3 Electrophysiology of P19-derived Neurons.....................................................17
2.4 Microelectrode Array.......................................................................................18
3. Materials and Methods........................................................................................... 22
Protocol 1: Growth and maintenance of P19 cells in culture...................................22
Protocol 2: Induction of neuronal differentiation ....................................................23
Protocol 3: Coating Substrates.................................................................................26
Protocol 4: Immunostaining.....................................................................................28
Protocol 5: Co-culturing P19-derived neurons with glial cells................................31
Protocol 6: Microelectrode array recording.............................................................33
Protocol 7: Pharmacological Recordings.................................................................35
Protocol 8: Virus Infection.......................................................................................38
Protocol 9: DNA cloning .........................................................................................39
Protocol 10: Transfection of P19-derived neurons: electroporation and calcium
phosphate precipitation ............................................................................................40
4. Results.................................................................................................................... 42
4.1 Optimisation of Neuronal Differentiation of P19 cells....................................42
4.1.1 Aggregate seeding vs single cell seeding...............................................42
4.1.2 Four day suspension differentiation vs one day suspension
differentiation.......................................................................................................55
4.1.3 Cell culture surface coating ...................................................................63
4.2 Response of P19-derived Neuronal Network to Neurotransmitters ................75
4.2.1 Effects of neurotransmitters, their agonists and antagonists..................75
4.2.2 Application of inhibitory neurotransmitter, γ-aminobutyric acid (GABA)
and antagonists.....................................................................................................81
4.2.3 Application of excitatory neurotransmitter, glutamate and antagonists 90
4.3 OR5 Transfection.............................................................................................95
4.3.1 Viral infection ........................................................................................95
4.3.2 DNA cloning..........................................................................................97
4.3.3 Electroporation and calcium phosphate precipitation............................98
5. Discussion............................................................................................................ 102
5.1 Optimisation of Neuronal Differentiation of P19 EC Cells...........................102
5.1.1 Culture conditions................................................................................102
5.1.2 Cell culture surface coating .................................................................105
5.1.3 Extracellular Recording with Microelectrode Array ...........................106
5.2 Responses to Neurotransmitters.....................................................................110
5.2.1 Response to inhibitory neurotransmitter, GABA and its agonist and
antagonist ...........................................................................................................110
5.2.2 Response to excitatory neurotransmitter, glutamate and antagonists ..112
5.3 OR5 transfection ............................................................................................114
6. Conclusions and Outlook..................................................................................... 116
Acknowledgements.................................................................................................... 118
References.................................................................................................................. 119
List of Figures............................................................................................................ 126
List of Tables ............................................................................................................. 134
Appendix…………………………………………………………………………….135
Curriculum Vitae…………………………………………………………………….137
Abstract
Abstract
P19 is a mouse-derived embryonal carcinoma cell line capable of differentiation
toward ectodermal, mesodermal and endodermal lineages and could thus be
differentiated into neurons. Different culture conditions were tested to optimise and
increase the efficiency of neuronal differentiation since the population of P19-derived
neurons was reported to be heterogeneous with respect to the morphology and
neurotransmitters they synthesise. P19-derived neurons were cultured on
microelectrode arrays as cell aggregates and as dissociated cells. Improved neuronal
maturation was shown by the presence of microtubule associated protein 2,
neurofilament and synaptophysin formation when initiation of neuronal differentiation
was prolonged. High initial cell density cultures and coating of surfaces with
polyethylenimine-laminin further improved neuronal maturation of differentiated P19
cells. Increased spontaneous activities of the P19-derived neurons were
correspondingly recorded. Two to three hours recordings were performed between 17
and 25 days when extracellular signals were stabilised. It was found that P19-derived
neurons developed network properties as partially synchronised network activities.
P19-derived neurons appeared to give inhomogenous response to the 2 major
neurotransmitters, γ-aminobutyric acid (GABA) and glutamate. The P19-derived
neuronal networks obtained from optimised protocol in this thesis were predominantly
GABAergic. The reproducible long term extracellular recordings performed showed
that neurons derived from P19 embryonal carcinoma cells could be applied as a model
for cell based biosensor in corporation with microelectrode arrays.
1
Introduction
1. Introduction
Beyond the investigation of single neurons, the analysis of their activity within small
neuronal assemblies is a promising step forward to understand the function of
networks within the central nervous system. Although the analysis of network
behaviour may be achieved by multitude simultaneous patch-clamp recordings, it is
very tedious and time consuming. Microelectrode arrays (MEAs) with dissociated
neuronal cells or brain slices allow the convenient monitoring of spontaneous or
stimulated electrical activities of excitable cells and enable the detection of
neuroactive substance effects.
However, researchers face some difficulties when they start to utilise neuronal cells
on MEAs: the serial preparation and cultivation of primary cells is labour intensive
and requires highly skilled technicians beside high costs, long term scheduling and
extensive animal care. Neuronal cell lines offer some clear advantages over freshly
dissociated cells: they provide flexibility to the culturing process and represent a cell
reserve that eliminates the need for timed pregnancy animals each time culture is
initiated.
Cultured P19 embryonal carcinoma cells, a pluripotent cell type, can act as a
renewable cell source which could be exploited for cell-based assay development.
One of the major challenges faced for in vitro neuronal model cell types is the
requirement for a source of cells that is both renewable and genetically stable in
culture. Previous work has suggested that few neuronal cell lines express functional
receptors1, 2 such as GABAA receptors despite the expression of GABAA receptor
subunits3. Reynolds et al.4 had showed that GABAA receptor subunit mRNAs and
GABA-induced currents were observed in P19-derived neurons.
2
Introduction
1.1 Aim
1. To optimise the differentiation of P19 embryonic carcinoma cells into the
neuronal lineage.
a. To optimise the conditions for the extracellular recording of P19-
derived neurons.
2. To characterise the extracellular recording of P19-derived neurons in response to
2 major neurotransmitters L-Glutamate and GABA.
3. To perform extracellular recording of olfactory receptor 5 transfected P19-derived
neurons.
3
Literature Review
4
2. Literature Review
Biosensors incorporate a biological sensing element that converts a change in an
immediate environment to signals conducive for processing. They have been
implemented in environmental, medical, toxicological and defense applications.1, 2, 5
Biosensors have 2 characteristics: they have a naturally evolved selectivity to
biological or biologically active analytes and they have the capacity to respond to
analytes in a physiologically relevant manner. There are at least three classes of
biosensors, molecular, cellular and tissue. Molecular biosensors are based on
antibodies, enzymes, ion channels or nucleic acids for detection of analytes. Cell
based biosensors on the other hand have the added advantage of responding only to
functional biologically active analytes. Cells express and sustain an array of potential
molecular sensors. The receptors, channels and enzymes that are sensitive to an
analyte are maintained in a physiologically relevant manner by native cellular
machinery. Thus, cell based biosensors incorporating mammalian cells will have the
advantage to offer insight into the physiological effect of an analyte.
In spite of the many advances in cell based biosensors, there are still many problems
associated with them, such as analytical methods, reproducibility and reliance on
primary, animal-derived cells.
2.1 Differentiation and Properties of Embryonal Carcinoma Cells
P19-derived Neurons
Embryonic carcinoma cells resemble those comprising the inner cell mass of
preimplantation blastocysts and a number of differentiated cell types, with
characteristics of cells of the three germ layers, namely, ectodermal, mesodermal and
endodermal that can be obtained reproducibly by different treatments.6, 7
Much is unknown about the determination events that commit unspecialized cells to
differentiate into more specialised cell types that appear later during embryonic
development. Lines of embryonal carcinomic cells can be isolated from
Literature Review
5
teratocarcinomas and maintained in an undifferentiated state when kept in exponential
growth phase in tissue culture. If left undisturbed at high density, they differentiate in
vitro into a variety of cell types including epithelium, neurons, muscle and cartilage.
The value of the embryonic carcinoma cells in studying determination has been
limited by the complexity of their differentiation patterns; any one determination
event is obscured from study by others that occur simultaneously.
The P19 cell line was isolated by implanting a 7-day-old mouse embryo under the
testis capsule of an adult which resulted in the formation of a tumour. The tumour
cells were grown in culture and one clone, P19, was established as a line.
Treatment of P19 cells with retinoic acid (RA) in the range of 10-8 – 10-6 M induced
their differentiation into a limited variety of cell types which appear to be similar to
those derived from neuroectoderm.8, 9 RA-treated P19 cell cultures have been shown
to contain neurons, astroglia, microglia and cells resembling vascular smooth muscle9,
10. P19 derived neurons express a variety of neuronal markers such as the 68 000 and
160 000 molecular weight neurofilament proteins, tetanus toxin binding sites,
synaptophysin and HNK-1 surface binding sites which marks for gycoproteins present
on embryonic neurons11. Differentiation of cells was initiated after only one hour of
RA treatment. The upregulation of retinoic acid receptor genes was more pronounced
in the G1 phase of the cell cycle than in the S phase and continuous presence of RA
was necessary to sustain this induction (up to 17 hours). Aggregation of the cells also
enhanced the rate of RA mediated induction12.
Although, it is a clonal cell line, P19 cells differentiate into populations of diverse
neuronal cell types10, 11, 13, 14. Neurons initially comprised 30 – 70 % of the cells in the
population.
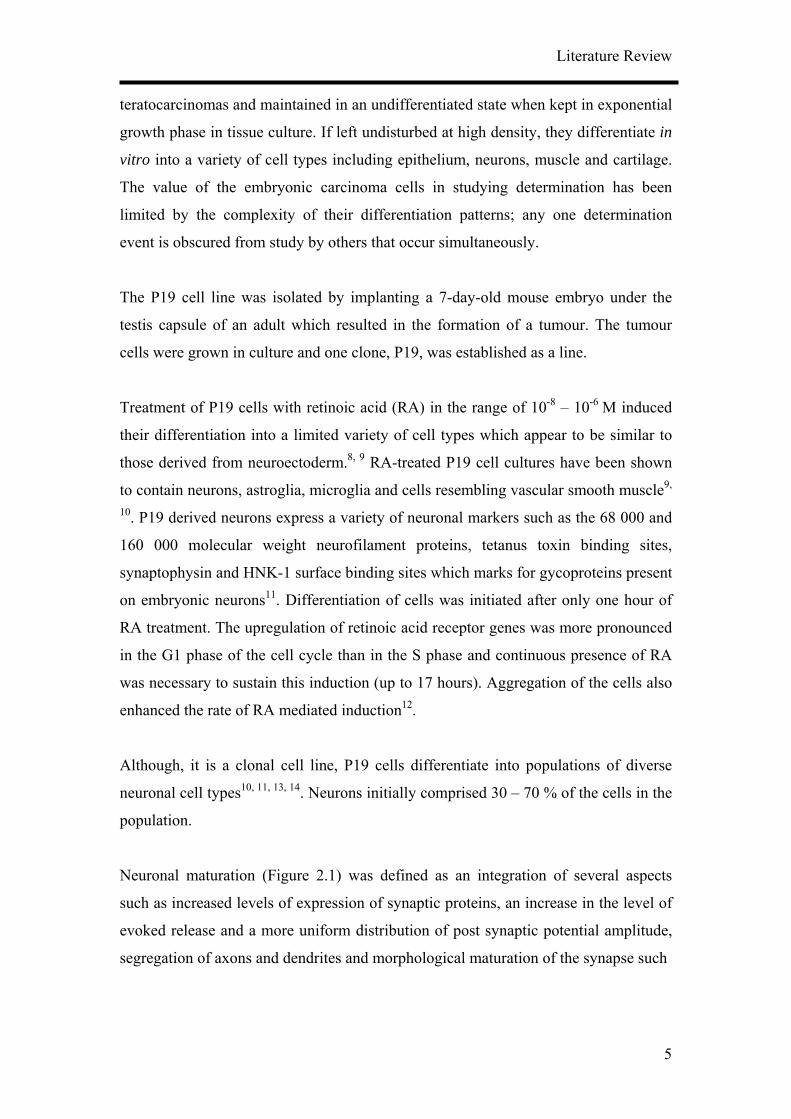
Neuronal maturation (Figure 2.1) was defined as an integration of several aspects
such as increased levels of expression of synaptic proteins, an increase in the level of
evoked release and a more uniform distribution of post synaptic potential amplitude,
segregation of axons and dendrites and morphological maturation of the synapse such
Literature Review
6
Figure 2.1 A schematic view of cellular morphology during an interval beginning with the start of
induction and ending 12 days later.15
as clustering of synaptic vesicles near release sites. A variety of neurotransmitters,
and associated gene transcripts and enzymes are expressed in P19-derived neurons.11,
13, 14, 16 Work to characterise the neurotransmitters present in RA-treated P19 cell
cultures indicated that the enzyme choline acetyltransferase (ChAT) could be detected
biochemically, and that acetycholine was synthesized also16. The neurons from the
RA treated cultures developed functional GABA receptors that are blocked by
bicuculline and bezodiazpines.4, 17 High affinity uptake sites for GABA were present
on neuronal cells in RA-treated cultures. Some neurons contained the enzymes of the
catecholamine synthetic pathway, although catecholamine was not detected
chemically11. GABA is the predominant neurotransmitter but neuropeptide Y and
somatostatin are also found in many neurons14. Functional ionotropic glutamate
receptors of both NMDA and AMPA/kainite types (please see section 2.2.2.1) are
also expressed in P19-derived neurons18-20. These receptors are hallmarks of neurons
of the central nervous system and are not expressed in most of the commonly used
neuronal cell lines.
2.2 Synaptic Transmission
A synapse is a specialised zone of contact at which one neuron communicates with
another. The average neuron forms about 1000 synaptic connections and receives
more, perhaps as many as 10 000 connections. Although many of these connections
Literature Review
7
are highly specialised all neurons make use of one of the two basic forms of synaptic
transmission: electrical or chemical. The strength of both forms of synaptic
transmission can be enhanced or diminished by cellular activity. This plasticity in
nerve cells is crucial to memory and other higher brain functions.
2.2.1 Electrical synapses
At electrical synapse the pre- and postsynaptic cells communicate through special
channels called gap junctions channels that serve as conduit between the cytoplasm of
the two cells. The current that depolarises the postsynaptic cell is generated directly
by the voltage gated ion channels of the presynaptic cell. As such, electrical synapses
provide instantaneous signal transmission. Gap junctions can be found between glial
cells as well as neurons. In glia, the gap junctions seek to mediate both intercellular
and intracellular communication. Electrical stimulation of neuronal pathways in brain
slices can trigger a rise of intracellular Ca2+ levels in certain astrocytes, producing a
wave of intracellular Ca2+ throughout the astrocyte network. Although the exact
function of such Ca2+ waves are not known, their existence suggests that glial cells
play an important role in signaling in the central nervous system.
2.2.2 Chemical synapses
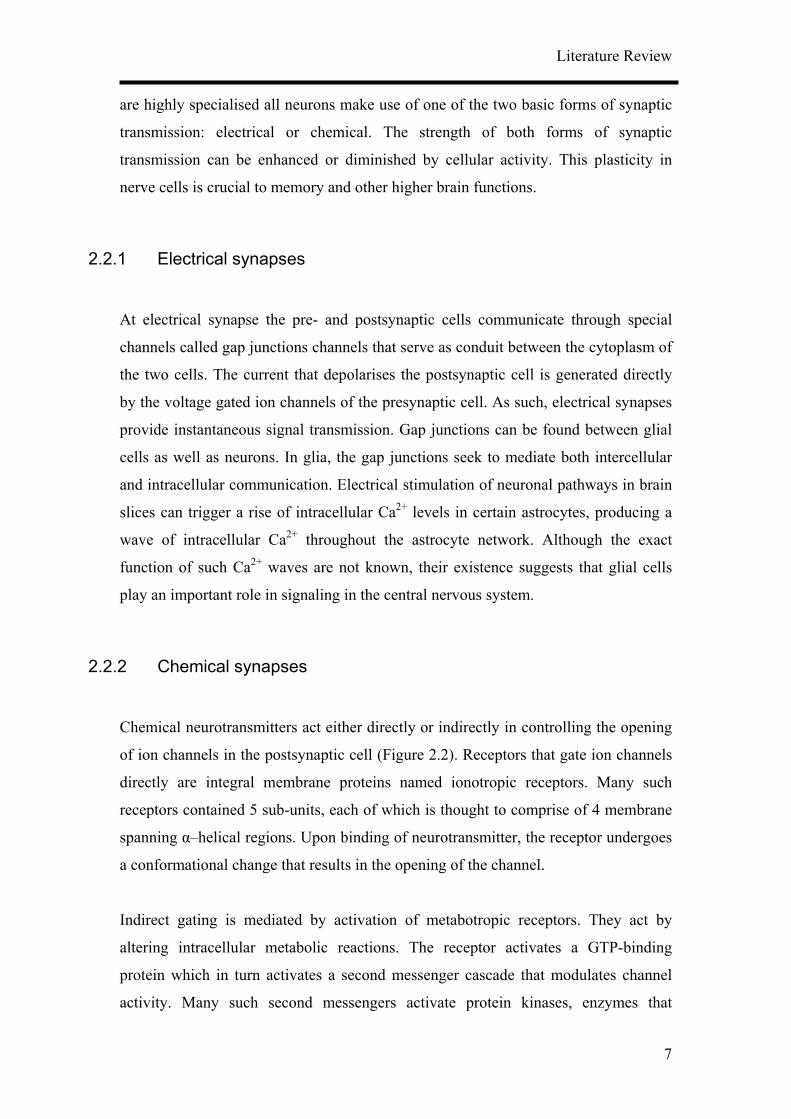
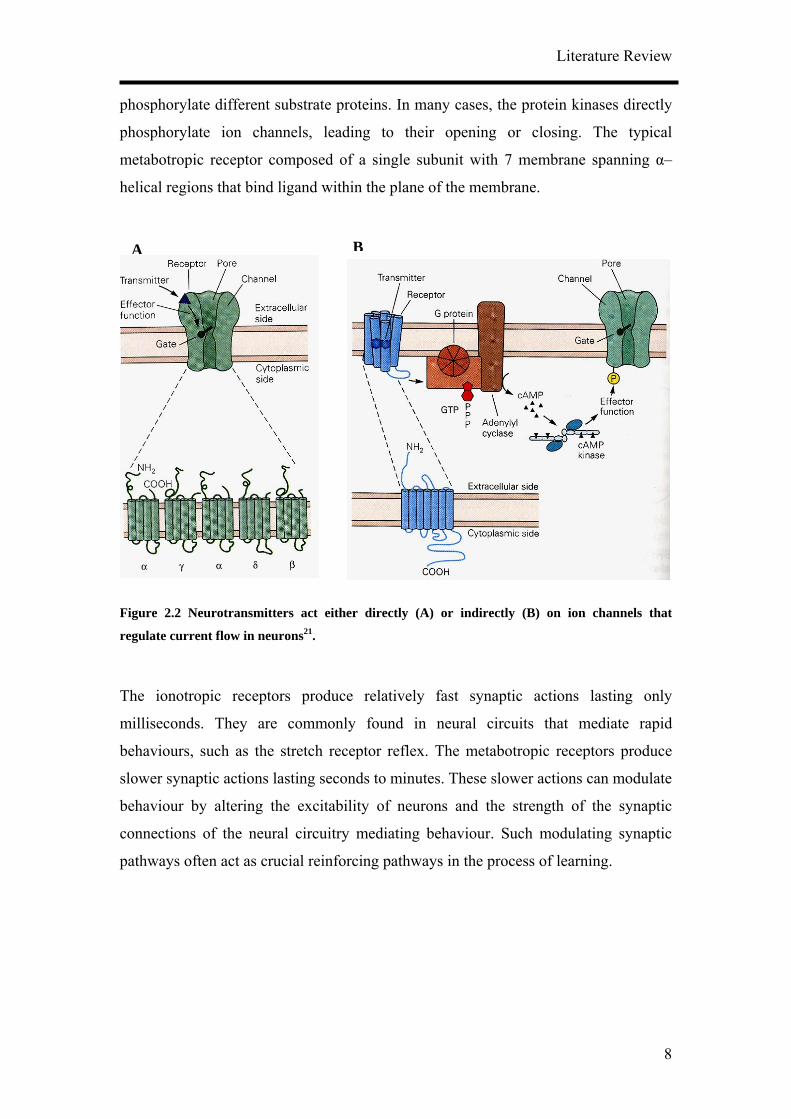
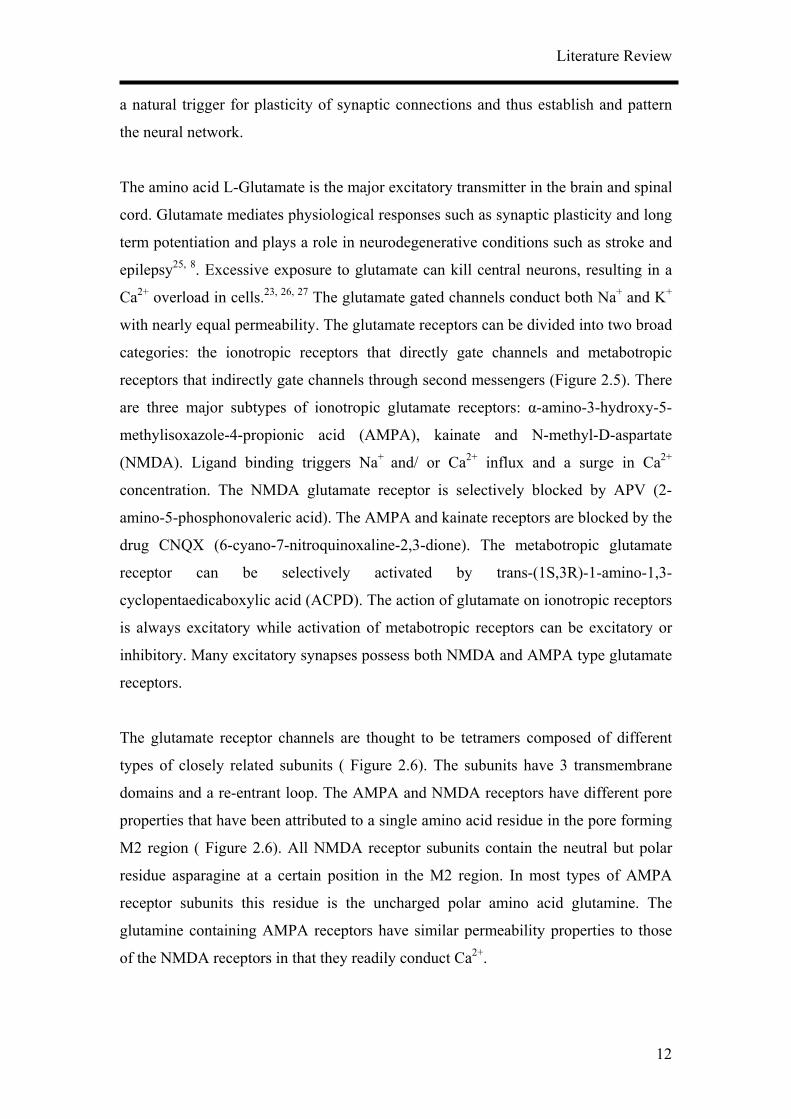
Chemical neurotransmitters act either directly or indirectly in controlling the opening
of ion channels in the postsynaptic cell (Figure 2.2). Receptors that gate ion channels
directly are integral membrane proteins named ionotropic receptors. Many such
receptors contained 5 sub-units, each of which is thought to comprise of 4 membrane
spanning α–helical regions. Upon binding of neurotransmitter, the receptor undergoes
a conformational change that results in the opening of the channel.
Indirect gating is mediated by activation of metabotropic receptors. They act by
altering intracellular metabolic reactions. The receptor activates a GTP-binding
protein which in turn activates a second messenger cascade that modulates channel
activity. Many such second messengers activate protein kinases, enzymes that
Literature Review
8
phosphorylate different substrate proteins. In many cases, the protein kinases directly
phosphorylate ion channels, leading to their opening or closing. The typical
metabotropic receptor composed of a single subunit with 7 membrane spanning α–
helical regions that bind ligand within the plane of the membrane.
Figure 2.2 Neurotransmitters act either directly (A) or indirectly (B) on ion channels that
regulate current flow in neurons21.
The ionotropic receptors produce relatively fast synaptic actions lasting only
milliseconds. They are commonly found in neural circuits that mediate rapid
behaviours, such as the stretch receptor reflex. The metabotropic receptors produce
slower synaptic actions lasting seconds to minutes. These slower actions can modulate
behaviour by altering the excitability of neurons and the strength of the synaptic
connections of the neural circuitry mediating behaviour. Such modulating synaptic
pathways often act as crucial reinforcing pathways in the process of learning.
BA
Literature Review
9
2.2.2.1 Neurotransmitters
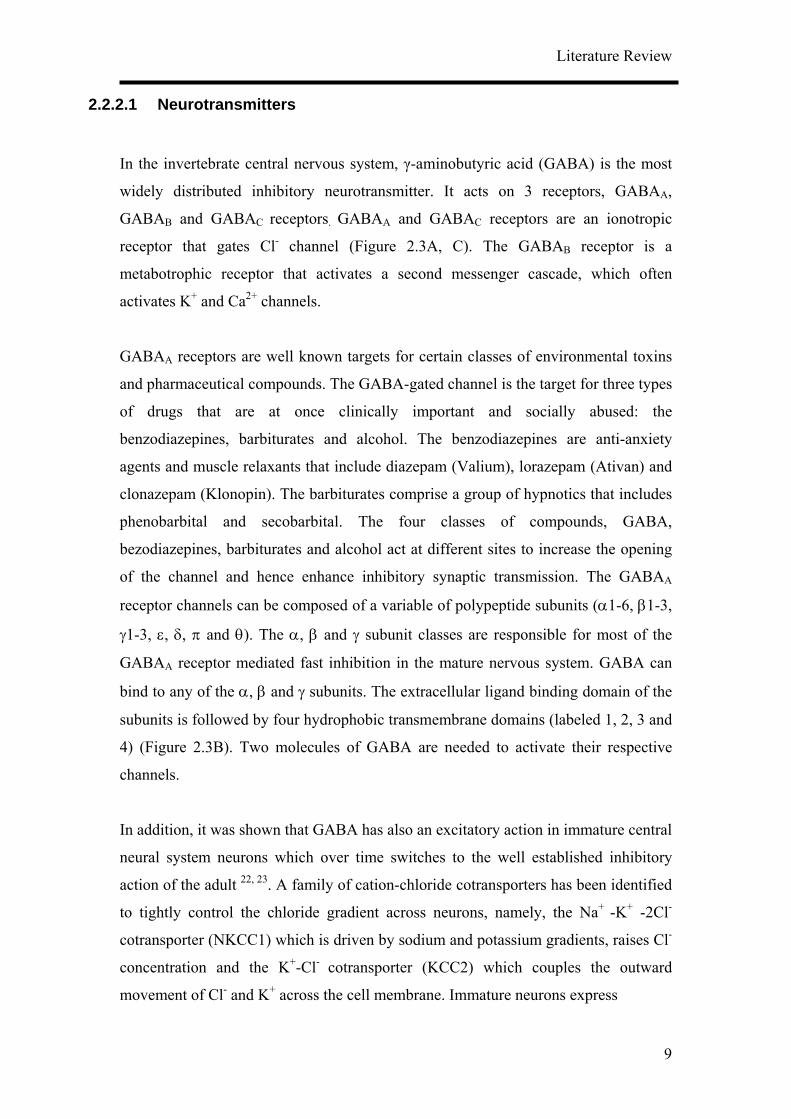
In the invertebrate central nervous system, γ-aminobutyric acid (GABA) is the most
widely distributed inhibitory neurotransmitter. It acts on 3 receptors, GABAA,
GABAB and GABAC receptors. GABAA and GABAC receptors are an ionotropic
receptor that gates Cl- channel (Figure 2.3A, C). The GABAB receptor is a
metabotrophic receptor that activates a second messenger cascade, which often
activates K+ and Ca2+ channels.
GABAA receptors are well known targets for certain classes of environmental toxins
and pharmaceutical compounds. The GABA-gated channel is the target for three types
of drugs that are at once clinically important and socially abused: the
benzodiazepines, barbiturates and alcohol. The benzodiazepines are anti-anxiety
agents and muscle relaxants that include diazepam (Valium), lorazepam (Ativan) and
clonazepam (Klonopin). The barbiturates comprise a group of hypnotics that includes
phenobarbital and secobarbital. The four classes of compounds, GABA,
bezodiazepines, barbiturates and alcohol act at different sites to increase the opening
of the channel and hence enhance inhibitory synaptic transmission. The GABAA
receptor channels can be composed of a variable of polypeptide subunits (α1-6, β1-3,
γ1-3, ε, δ, π and θ). The α, β and γ subunit classes are responsible for most of the
GABAA receptor mediated fast inhibition in the mature nervous system. GABA can
bind to any of the α, β and γ subunits. The extracellular ligand binding domain of the
subunits is followed by four hydrophobic transmembrane domains (labeled 1, 2, 3 and
4) (Figure 2.3B). Two molecules of GABA are needed to activate their respective
channels.
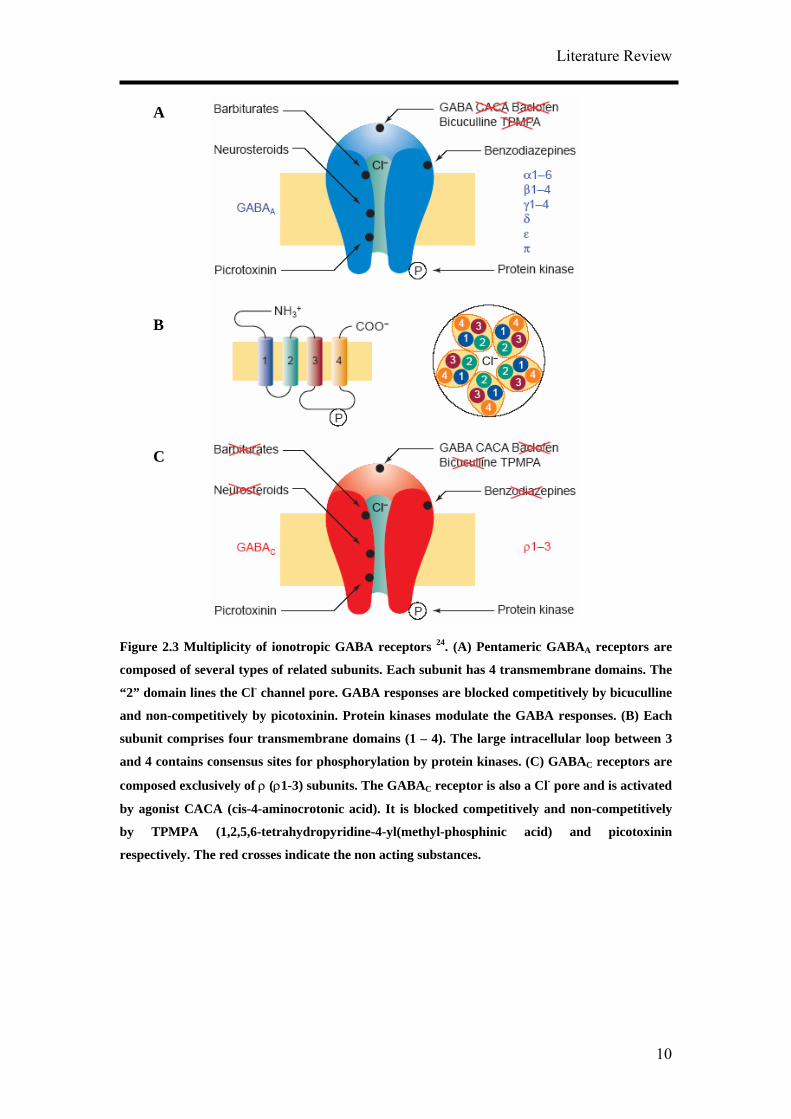
In addition, it was shown that GABA has also an excitatory action in immature central
neural system neurons which over time switches to the well established inhibitory
action of the adult 22, 23. A family of cation-chloride cotransporters has been identified
to tightly control the chloride gradient across neurons, namely, the Na+ -K+ -2Cl-
cotransporter (NKCC1) which is driven by sodium and potassium gradients, raises Cl-
concentration and the K+-Cl- cotransporter (KCC2) which couples the outward
movement of Cl- and K+ across the cell membrane. Immature neurons express
Literature Review
10
Figure 2.3 Multiplicity of ionotropic GABA receptors 24. (A) Pentameric GABAA receptors are
composed of several types of related subunits. Each subunit has 4 transmembrane domains. The
“2” domain lines the Cl- channel pore. GABA responses are blocked competitively by bicuculline
and non-competitively by picotoxinin. Protein kinases modulate the GABA responses. (B) Each
subunit comprises four transmembrane domains (1 – 4). The large intracellular loop between 3
and 4 contains consensus sites for phosphorylation by protein kinases. (C) GABAC receptors are
composed exclusively of ρ (ρ1-3) subunits. The GABAC receptor is also a Cl- pore and is activated
by agonist CACA (cis-4-aminocrotonic acid). It is blocked competitively and non-competitively
by TPMPA (1,2,5,6-tetrahydropyridine-4-yl(methyl-phosphinic acid) and picotoxinin
respectively. The red crosses indicate the non acting substances.
A
B
C
Literature Review
11
Immature CNS neurons
Mature CNS neurons
Figure 2.4 Developmental regulation of chloride homeostasis in neurons 22, 23. (A) Immature
neurons express primarily NKCC1 and to a lesser extent KCC2, resulting in a high intracellular
concentration of Cl-. Levels of intracellular Cl- are high, and the equilibrium potential for Cl-,
ECl, is positive relative to the membrane potential, Vm. (B) In mature neurons the expression of
NKCC1 decreases and KCC2 increases. This results in a low intracellular Cl- concentration. ECl
is negative relative to Vm and the activation GABAA receptor inhibits the cell.
primarily NKCC1 and to a lesser extent KCC2, resulting in a high intracellular
concentration of Cl- so that GABAA activation causes Cl- efflux and depolarization. In
mature neurons the proportion of the cotransporters reverses and this results in a low
intracellular Cl- concentration so that GABAA receptor activation causes Cl- influx
and thus hyperpolarisation. In the developing cerebral cortex, GABA depolarises
immature neurons to the point where calcium enters through both voltage-gated and
N-methyl-D-aspartate receptor activated channels. The increased Ca2+ controls gene
expression and neurotrophin signaling and thus may control axonal connections. In
the hippocampus, GABA depolarization induces a synchrony of cell firing. The large,
rhythmic synaptic events and associated oscillations in intracellular Ca2+ may provide
GABAA R GABAA R
Cl- Cl-
Cl-
2 Cl- Na+
K+ Na+
K+2 Cl-K+
KCC2 K+
Cl-
NKCC1 Cl-
Literature Review
12
a natural trigger for plasticity of synaptic connections and thus establish and pattern
the neural network.
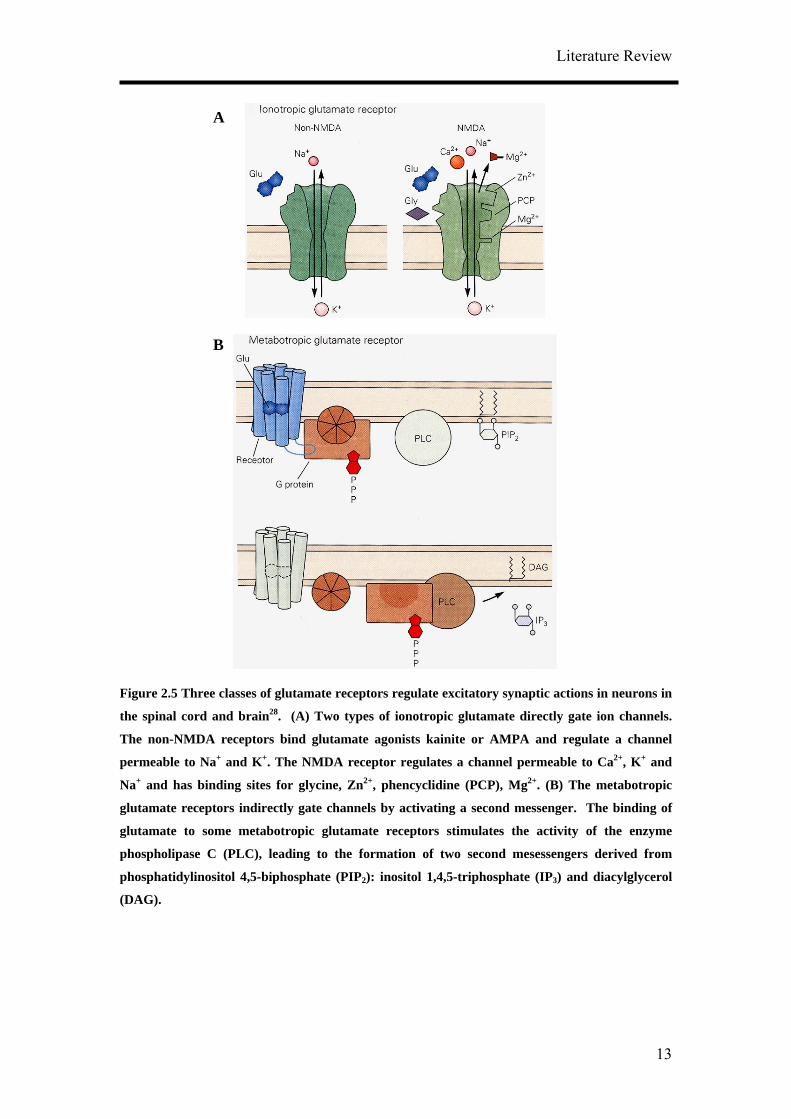
The amino acid L-Glutamate is the major excitatory transmitter in the brain and spinal
cord. Glutamate mediates physiological responses such as synaptic plasticity and long
term potentiation and plays a role in neurodegenerative conditions such as stroke and
epilepsy25, 8. Excessive exposure to glutamate can kill central neurons, resulting in a
Ca2+ overload in cells.23, 26, 27 The glutamate gated channels conduct both Na+ and K+
with nearly equal permeability. The glutamate receptors can be divided into two broad
categories: the ionotropic receptors that directly gate channels and metabotropic
receptors that indirectly gate channels through second messengers (Figure 2.5). There
are three major subtypes of ionotropic glutamate receptors: α-amino-3-hydroxy-5-
methylisoxazole-4-propionic acid (AMPA), kainate and N-methyl-D-aspartate
(NMDA). Ligand binding triggers Na+ and/ or Ca2+ influx and a surge in Ca2+
concentration. The NMDA glutamate receptor is selectively blocked by APV (2-
amino-5-phosphonovaleric acid). The AMPA and kainate receptors are blocked by the
drug CNQX (6-cyano-7-nitroquinoxaline-2,3-dione). The metabotropic glutamate
receptor can be selectively activated by trans-(1S,3R)-1-amino-1,3-
cyclopentaedicaboxylic acid (ACPD). The action of glutamate on ionotropic receptors
is always excitatory while activation of metabotropic receptors can be excitatory or
inhibitory. Many excitatory synapses possess both NMDA and AMPA type glutamate
receptors.
The glutamate receptor channels are thought to be tetramers composed of different
types of closely related subunits ( Figure 2.6). The subunits have 3 transmembrane
domains and a re-entrant loop. The AMPA and NMDA receptors have different pore
properties that have been attributed to a single amino acid residue in the pore forming
M2 region ( Figure 2.6). All NMDA receptor subunits contain the neutral but polar
residue asparagine at a certain position in the M2 region. In most types of AMPA
receptor subunits this residue is the uncharged polar amino acid glutamine. The
glutamine containing AMPA receptors have similar permeability properties to those
of the NMDA receptors in that they readily conduct Ca2+.
Literature Review
13
Figure 2.5 Three classes of glutamate receptors regulate excitatory synaptic actions in neurons in
the spinal cord and brain28. (A) Two types of ionotropic glutamate directly gate ion channels.
The non-NMDA receptors bind glutamate agonists kainite or AMPA and regulate a channel
permeable to Na+ and K+. The NMDA receptor regulates a channel permeable to Ca2+, K+ and
Na+ and has binding sites for glycine, Zn2+, phencyclidine (PCP), Mg2+. (B) The metabotropic
glutamate receptors indirectly gate channels by activating a second messenger. The binding of
glutamate to some metabotropic glutamate receptors stimulates the activity of the enzyme
phospholipase C (PLC), leading to the formation of two second mesessengers derived from
phosphatidylinositol 4,5-biphosphate (PIP2): inositol 1,4,5-triphosphate (IP3) and diacylglycerol
(DAG).
A
B
Literature Review
14
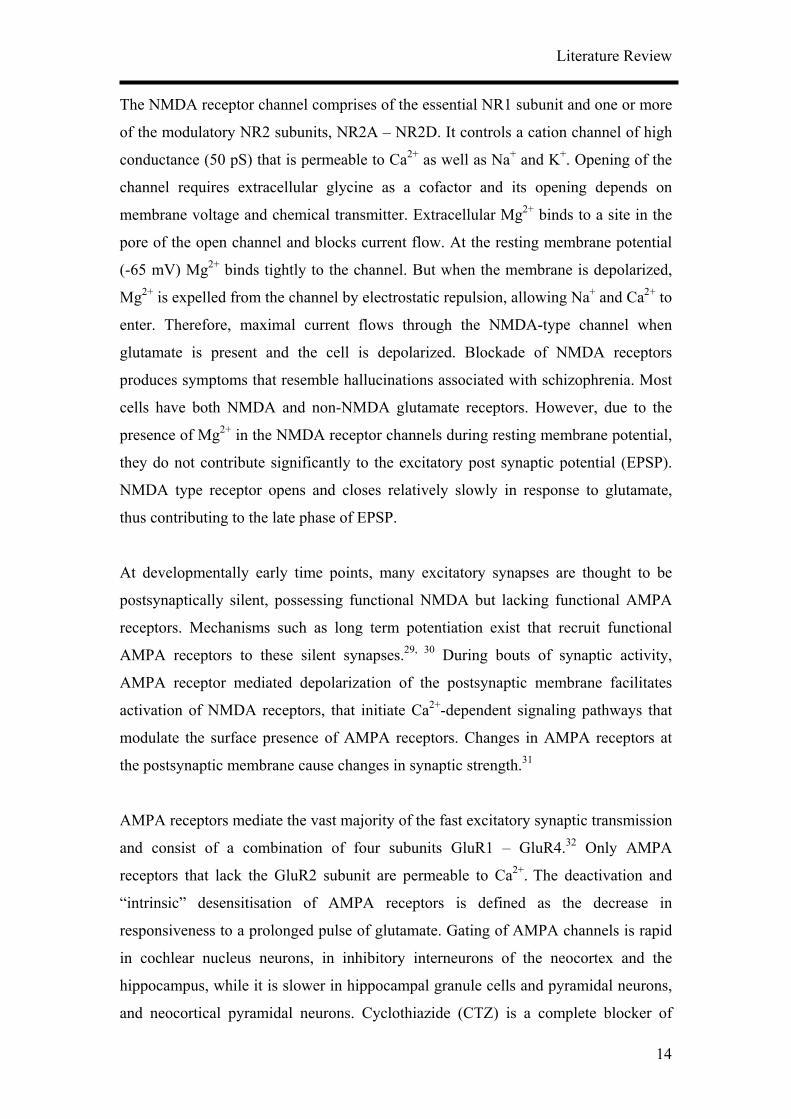
The NMDA receptor channel comprises of the essential NR1 subunit and one or more
of the modulatory NR2 subunits, NR2A – NR2D. It controls a cation channel of high
conductance (50 pS) that is permeable to Ca2+ as well as Na+ and K+. Opening of the
channel requires extracellular glycine as a cofactor and its opening depends on
membrane voltage and chemical transmitter. Extracellular Mg2+ binds to a site in the
pore of the open channel and blocks current flow. At the resting membrane potential
(-65 mV) Mg2+ binds tightly to the channel. But when the membrane is depolarized,
Mg2+ is expelled from the channel by electrostatic repulsion, allowing Na+ and Ca2+ to
enter. Therefore, maximal current flows through the NMDA-type channel when
glutamate is present and the cell is depolarized. Blockade of NMDA receptors
produces symptoms that resemble hallucinations associated with schizophrenia. Most
cells have both NMDA and non-NMDA glutamate receptors. However, due to the
presence of Mg2+ in the NMDA receptor channels during resting membrane potential,
they do not contribute significantly to the excitatory post synaptic potential (EPSP).
NMDA type receptor opens and closes relatively slowly in response to glutamate,
thus contributing to the late phase of EPSP.
At developmentally early time points, many excitatory synapses are thought to be
postsynaptically silent, possessing functional NMDA but lacking functional AMPA
receptors. Mechanisms such as long term potentiation exist that recruit functional
AMPA receptors to these silent synapses.29, 30 During bouts of synaptic activity,
AMPA receptor mediated depolarization of the postsynaptic membrane facilitates
activation of NMDA receptors, that initiate Ca2+-dependent signaling pathways that
modulate the surface presence of AMPA receptors. Changes in AMPA receptors at
the postsynaptic membrane cause changes in synaptic strength.31
AMPA receptors mediate the vast majority of the fast excitatory synaptic transmission
and consist of a combination of four subunits GluR1 – GluR4.32 Only AMPA
receptors that lack the GluR2 subunit are permeable to Ca2+. The deactivation and
“intrinsic” desensitisation of AMPA receptors is defined as the decrease in
responsiveness to a prolonged pulse of glutamate. Gating of AMPA channels is rapid
in cochlear nucleus neurons, in inhibitory interneurons of the neocortex and the
hippocampus, while it is slower in hippocampal granule cells and pyramidal neurons,
and neocortical pyramidal neurons. Cyclothiazide (CTZ) is a complete blocker of
Literature Review
15
desensitisation of AMPA channels and is able to increase glutamate release.33-35 It is a
non-competitive AMPA antagonist that acts as a positive allosteric modulator by
stabilising a non-desensitised agonist bound state of the receptor complex.36 It has
been recently found that CTZ can also directly inhibit GABAA receptors.37 It has the
unique characteristic in acting simultaneously on two prominent synaptic transmission
systems: it significantly enhances excitatory glutamatergic neurotransmission while
suppressing inhibitory GABAergic neurotransmission. The net effect of CTZ on a
neural network will be a significant tilt of the excitation-inhibition balance toward
hyperexcitation. CTZ has been known to increase presynaptic glutamate release. CTZ
acts as a modulator of AMPA and GABAA receptors and is not associated with
significant cell death.38 Chronic treatment (5 µM, 48 hours) and acute treatment (20 –
50 µM, 1 – 2 hours) with CTZ has been shown to cause a permanent alteration of the
functional output of neural networks after the treatment.
Figure 2.6 The glutamate receptor channels are found to be tetramers composed of different
types of closely related subunits. The subunits have 3 transmembrane domains and one region,
M2, that forms a loop that dips into the membrane. Figure modified from Kandel et al.28
Literature Review
16
2.2.3 Olfactory Receptors
Olfactory receptor cells transform the concentration profile of volatile odours in the
air into a train of action potentials that can be conveyed to the olfactory bulb.
Olfactory transduction takes place in the cilia of the olfactory receptor cells which
forms a dense mat in the mucus lining the nasal cavity. Odour molecules dissolve in
the mucus film and bind to one of a large family of receptors (R) in the ciliary
membrane which then activates a G protein-coupled cascade resulting in the synthesis
of cyclic adenosine monophosphate (cAMP) from adenosine triphosphate (ATP) by
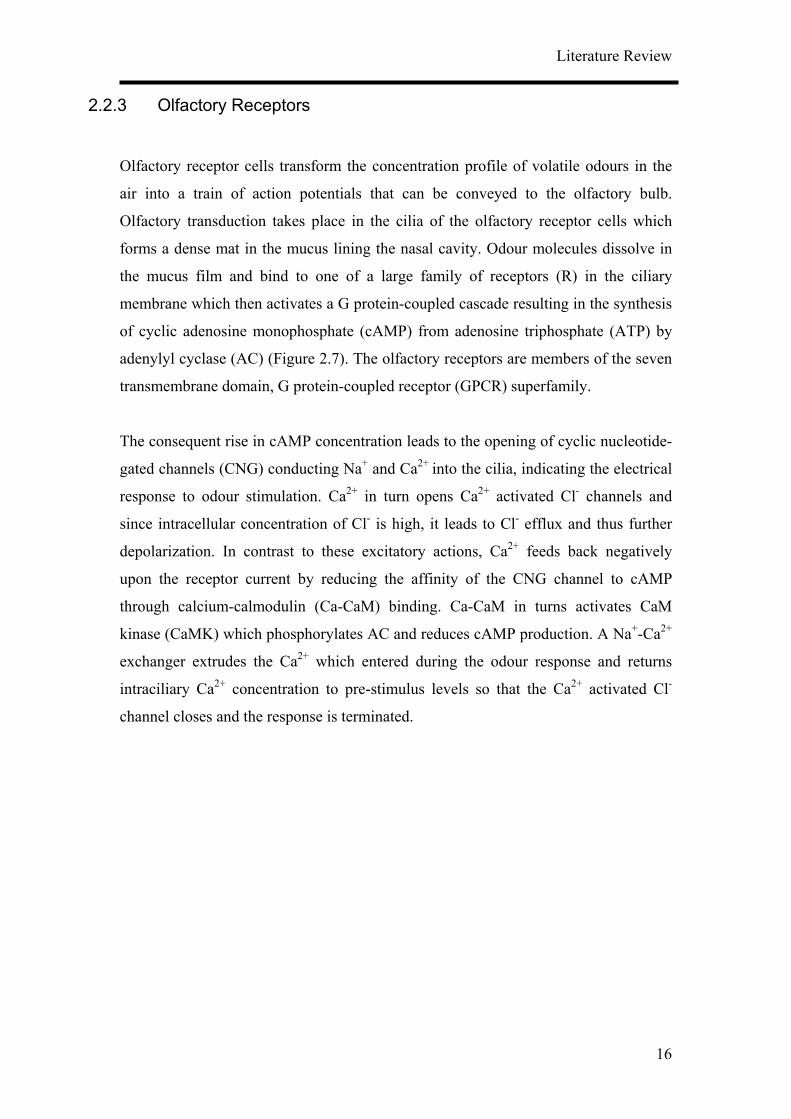
adenylyl cyclase (AC) (Figure 2.7). The olfactory receptors are members of the seven
transmembrane domain, G protein-coupled receptor (GPCR) superfamily.
The consequent rise in cAMP concentration leads to the opening of cyclic nucleotide-
gated channels (CNG) conducting Na+ and Ca2+ into the cilia, indicating the electrical
response to odour stimulation. Ca2+ in turn opens Ca2+ activated Cl- channels and
since intracellular concentration of Cl- is high, it leads to Cl- efflux and thus further
depolarization. In contrast to these excitatory actions, Ca2+ feeds back negatively
upon the receptor current by reducing the affinity of the CNG channel to cAMP
through calcium-calmodulin (Ca-CaM) binding. Ca-CaM in turns activates CaM
kinase (CaMK) which phosphorylates AC and reduces cAMP production. A Na+-Ca2+
exchanger extrudes the Ca2+ which entered during the odour response and returns
intraciliary Ca2+ concentration to pre-stimulus levels so that the Ca2+ activated Cl-
channel closes and the response is terminated.
Literature Review
17
Figure 2.7 A schematic diagram that illustrates the olfactory transduction.39 Blue and red arrows
indicate the inhibitory and excitatory actions of Ca2+ respectively.
2.3 Electrophysiology of P19-derived Neurons
Most neuroblastoma cell lines are not a suitable model for studying neuronal
development because they neither become post-mitotic nor express ionotropic
glutamate receptors of both the NMDA and AMPA/kainite types. Few neural cell
lines also express functional GABAA receptors, the capacity to rapidly screen for
compounds that affect GABAA receptor function is presently limited.2, 3Therefore,
P19 embryonal carcinoma cells with the capability to be differentiated into the
neuronal lineage and amenable to genetic modification were explored for the
application as a cell based biosensor.
P19 neurons were shown to be functional following implantation into the rat brain40.
Grafted P19-derived neurons had been shown by intracellular recordings to survive
and mature in vivo capable of displaying mature, stable neuronal electrophysiological
characteristics after four weeks.40, 41 Membrane input resistance decreased and a
Literature Review
18
resting membrane potential of up to -68 mV was established. Active properties (action
potentials) developed rapidly following the establishment of the resting membrane
potential and decrease in input resistance, resulting in the earliest action potential with
a small amplitude, long duration and without any associated after hyperpolarisation.
The appearance of functional voltage-dependent Na+ channels capable of generating
action potential resulted later in the capability to elicit significant after-
hyperpolarisation showing the presence of K+ channels. Only the combination of both
tetrodotoxin (TTX) and low Ca2+/high Mg2+ completely blocked spiking activity
indicating that both TTX sensitive Na+ channels and Ca2+ channels participate in
spike generation. P19-derived neurons reached a final stage of development
electrophysiologically similar to the adult forebrain neurons including cortical and
hippocampal pyramidal neurons.
2.4 Microelectrode Array
The quick and reliable measurement of harmful substances in the environment, of
medically relevant metabolites and pharmacological substances, and of compounds
important to the food industry, necessitates the development of a great variety of
sophisticated sensor systems. However, the analytical demands for a chemical sensor
such as selectivity, sensitivity, accuracy, stability and rapidity are not easily achieved
for every compound of interest. Biosensors have therefore evolved to expand the
sensing domain and accelerate crucial reactions. Within this group, whole cell-based
sensors are receiving increasing attention because they have the potential to perform
unique sensory functions by relying on the response amplification and reliability
provided by populations of living sensor units.1, 2, 5, 42
Electrical activity of electrogenic cells in neuronal and cardiac tissues can be recorded
by means of microelectrode arrays (MEA) that offer the possibility for non-invasive
extracellular recording from as many as 60 sites simultaneously.5, 43, 44 Since its
introduction thirty years ago, the technology and the related culture methods have
been continually improved and have found their way into many academic and
industrial laboratories. This technology has attracted increased interest due to the
Literature Review
19
industrial need to screen selected compounds against ion channel targets in their
native environment at the organic, cellular and sun-cellular level.5
Recording experiments using MEAs are useful to gain information about interactions
between electrogenic cells at different locations in the same tissue, which may be used
to analyse the spatio-temporal dynamics of activity or the representation of
information in neuronal networks. They can also monitor changes of electrical activity
over periods of time not accessible with individual conventional electrodes such as
glass capillary or tungsten electrodes in vitro. The culture of random networks of
neurons on MEAs were used to perform reliable biochemical sensing45-50 although the
density of synaptic formations in such artificial networks have been found to be lower
than that found in physiological environments.
Nerve cells which have a diameter of 10 – 100 µm are surrounded by an electrically
insulating membrane. The thin phospholipid bilayer of about 5 nm thick separates the
intracellular electrolyte with about 100 mM KCl from the environment with about 100
mM NaCl. The electrical current through the membrane is mediated by specific
protein channels for sodium and potassium ions with a conductance of about 10 – 100
pS.51 In the generation of action potentials only small amounts of ions are actually
involved in the potential change and these are all in the vicinity of the cell
membrane.43 The mechanism of action potential propagation ensures that the action
potential is transmitted unattenuated along the membrane itself. Effectively, this
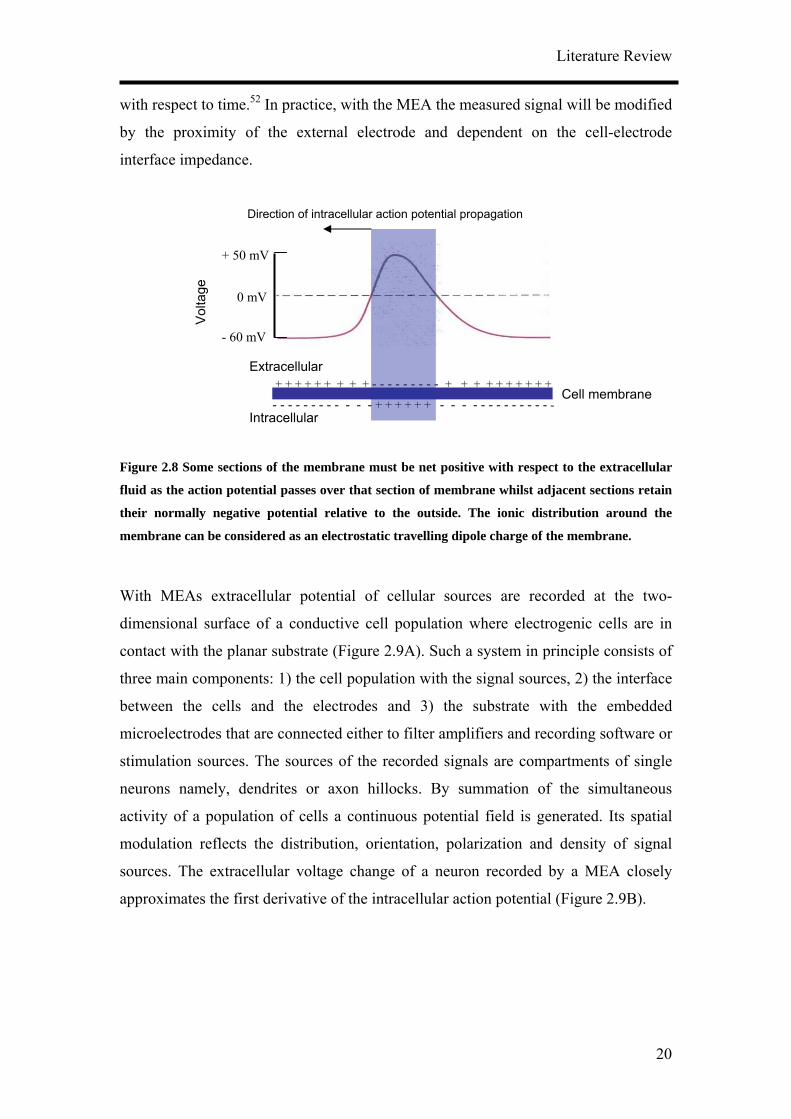
means that some sections of the membrane must be net positive with respect to the
extracellular fluid as the action potential passes over that section of membrane whilst
adjacent sections retain their normally negative potential relative to the outside
(Figure 2.8). The ionic distribution around the membrane can be considered as an
electrostatic travelling dipole charge of the membrane. The extracellular electrode
should detect the action potential first as a negative charge at the membrane followed
by a positive charge as that section of the membrane recovers. This results in a
different waveform for the detected extracellular signal in comparison with the
intracellular signal. Theoretical electrostatic modeling of the membrane has shown
that the extracellular voltage close to the active membrane, for a cell in a volume
conductor can be related to the second differential of the intracellular voltage signal
Literature Review
20
with respect to time.52 In practice, with the MEA the measured signal will be modified
by the proximity of the external electrode and dependent on the cell-electrode
interface impedance.
Figure 2.8 Some sections of the membrane must be net positive with respect to the extracellular
fluid as the action potential passes over that section of membrane whilst adjacent sections retain
their normally negative potential relative to the outside. The ionic distribution around the
membrane can be considered as an electrostatic travelling dipole charge of the membrane.
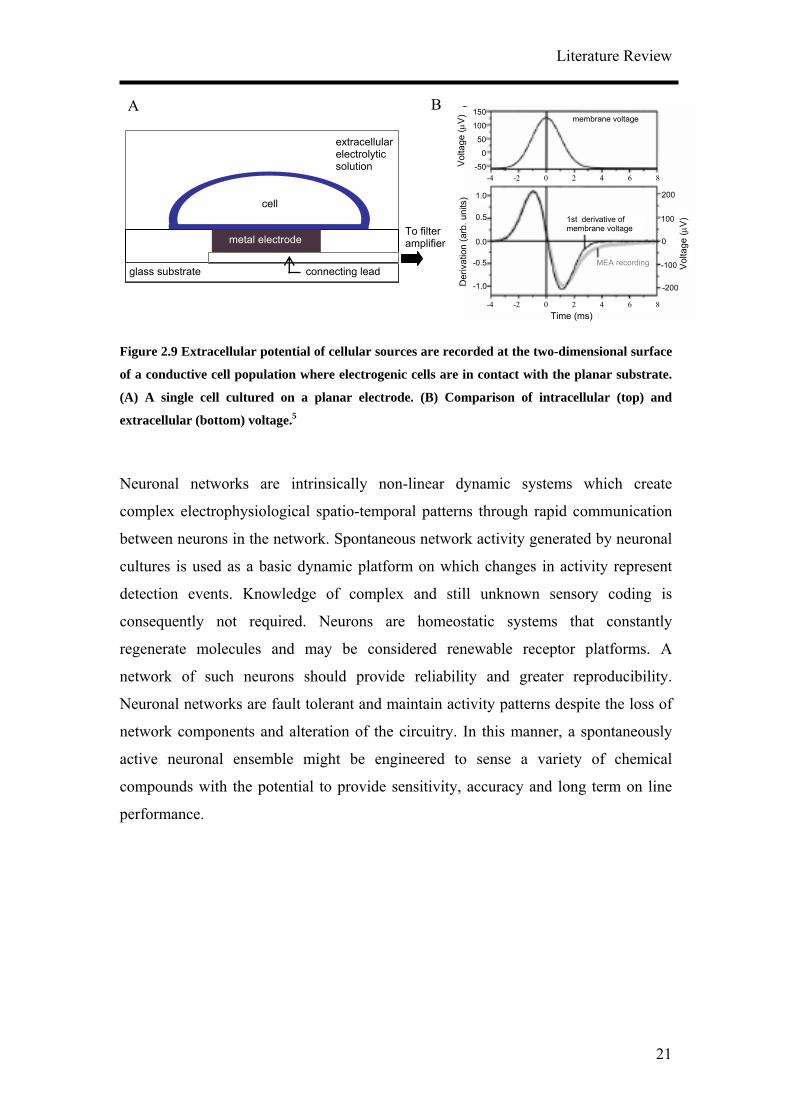
With MEAs extracellular potential of cellular sources are recorded at the two-
dimensional surface of a conductive cell population where electrogenic cells are in
contact with the planar substrate (Figure 2.9A). Such a system in principle consists of
three main components: 1) the cell population with the signal sources, 2) the interface
between the cells and the electrodes and 3) the substrate with the embedded
microelectrodes that are connected either to filter amplifiers and recording software or
stimulation sources. The sources of the recorded signals are compartments of single
neurons namely, dendrites or axon hillocks. By summation of the simultaneous
activity of a population of cells a continuous potential field is generated. Its spatial
modulation reflects the distribution, orientation, polarization and density of signal
sources. The extracellular voltage change of a neuron recorded by a MEA closely
approximates the first derivative of the intracellular action potential (Figure 2.9B).
Direction of intracellular action potential propagation
+ + + + + + + + + - - - - - - - - - + + + + + + + + + +
- - - - - - - - - - - - + + + + + + - - - - - - - - - - - - - -
+ 50 mV
Vol
tage
0 mV
- 60 mV
Extracellular
Cell membrane
Intracellular
Literature Review
A
Figure 2.9 Extracellular potential of cellular sources ar
of a conductive cell population where electrogenic cells
(A) A single cell cultured on a planar electrode. (B
extracellular (bottom) voltage.5
Neuronal networks are intrinsically non-line
complex electrophysiological spatio-temporal pa
between neurons in the network. Spontaneous ne
cultures is used as a basic dynamic platform on
detection events. Knowledge of complex and
consequently not required. Neurons are ho
regenerate molecules and may be considered
network of such neurons should provide rel
Neuronal networks are fault tolerant and maintai
network components and alteration of the circu
active neuronal ensemble might be engineere
compounds with the potential to provide sensiti
performance.
glass substrate
insulator
extracellular electrolytic solution
cell
To filtamplifmetal electrode
connecting lead
B
21
e recorded at the two-dimensional surface
are in contact with the planar substrate.
) Comparison of intracellular (top) and
ar dynamic systems which create
tterns through rapid communication
twork activity generated by neuronal
which changes in activity represent
still unknown sensory coding is
meostatic systems that constantly
renewable receptor platforms. A
iability and greater reproducibility.
n activity patterns despite the loss of
itry. In this manner, a spontaneously
d to sense a variety of chemical
vity, accuracy and long term on line
150
Vol
tage
(µV
) membrane voltage 100
50
0
-50-4 -2 0 2 4 6 8
Der
ivat
ion
(arb
. uni
ts) 1.0
0.5
0.0
-0.5
-1.0
-4 -2 0 2 4 6 8
200
100
0
-100
-200
Vol
tage
(µV
)
Time (ms)
1st derivative of membrane voltage
MEA recording
er ier
Materials and Methods
22
3. Materials and Methods
Protocol 1: Growth and maintenance of P19 cells in culture
P19 cells (ATCC, VA, USA, CRL-1825) culture must be maintained in the
exponential growth phase. P19 cells grow rapidly with a generation time of 12-14
hours.
1. Cells are cultured in α-modified form of Eagle’s minimal essential medium
(MEM α medium, PAA Laboratories, Pasching, Austria, E15-862 with L-
Glutamine) supplemented with 7.5 % (v/v) calf serum (New born calf, Cat.
no.16010-159, Gibco®, Invitrogen Corporation, CA, USA,) and 2.5 % (v/v)
fetal bovine serum (Gibco®).
For 500 ml
a. 37.5 ml calf serum
b. 12.5 ml fetal bovine serum
c. MEM amino acid solution (PAA Laboratories, Cat. no. M11-002,
without glutamine)
i. Stock 50X concentration – 10ml in 500ml medium
d. MEM vitamins (100X) (PAA Laboratories, Cat. no. N11-002)
i. 5 ml in 500 ml medium
2. P19 cells are subcultured at intervals of 48 hours or less in order to maintain
continuous exponential proliferation. Rinse the culture with Ca2+ and Mg2+
free PBS.
3. Add Trypsin-EDTA solution (10X concentration, Gibco®): 1mM EDTA +
0.025 % (w/v) trypsin in phosphate buffered solution (PBS) for a few minutes
or until the cultures are seen detaching.
4. Centrifuge the cell suspension at 1000 rpm for a few minutes.
5. 1 culture flask can be approximately expanded into 3-5 flasks.
Materials and Methods
23
Protocol 2: Induction of neuronal differentiation
1. Differentiation of P19 cells into the neuronal lineage was optimised according to 2
different induction conditions, IC1 and IC2.
a. IC1: 1 day monolayer culture followed by a 1 day suspension culture
b. IC2: 4 day suspension culture
2. Differentiate the P19 cells when they are 70 – 80 % confluent which is usually 2
days after the last passage. Do not allow them to be too confluent before the
initiation of differentiation.
3. Sterile filter high grade ethanol.
4. Dissolve all trans-retinoic acid (RA) in ethanol to a stock solution of 3 mg/ml
(0.01 M).
a. 50 mg retinoic acid (Sigma-Aldrich Co., Saint Louis, USA, Cat. no.
R2625)
b. 16.7 ml ethanol
c. Sensitive to light, wrap falcon tube with aluminum foil and store it at -
20 0C
d. Stock solution is stable for 1 month
5. For IC1 cultures, add 0.5 µM or 1 µM RA to culture flasks at one day after the
previous passage and leave it alone for a day.
6. Trypsinise the cultures as in Protocol 1, step 3.
7. Prepare 60 mm bacteria grade petri dish (Greiner Bio-One GmbH, Frickenhausen,
Germany, Cat. no. 633180) for the suspension culture. Add 10 ml MEM-
α medium with supplements to each petri dish and leave them in the incubator.
8. Resuspend the cell pellet and count the equivalent volume for 1 x 10⁶ cells.
Materials and Methods
24
9. Take the volume of the cell suspension added to the petri dish into account to
make up a final volume of 10 ml. Remove the equivalent volume of medium from
each petri dish. Add 1 x 10⁶ cells per petri dish.
10. Concentration of trans-retinoic acid added to the culture is 0.5 x 10⁻⁶ M or 1 x 10⁻⁶
M
a. Vortex the stock solution to ensure that the precipitate is re-dissolved
(Leaving the stock solution at room temperature for 15 min helps to re-
dissolve it faster)
11. Add 0.5 µl (0.5 µM) or 1 µl (1 µM) of stock RA solution to every 10 ml medium
and cell suspension.
12. Rock the suspension gently to ensure even mixing of cells and RA. Leave the petri
dishes undisturbed in the incubator for 1 day (IC1 cultures) and 4 days (IC2
cultures).
13. After 1 day (IC1 cultures) and 4 days (IC2 cultures), remove and centrifuge the
suspension at 1000 rpm for 5 min at room temperature. Wash the petri dish 1 X to
ensure that most of the cell aggregates are removed.
14. Remove media and rinse the pellet once with 37 0C PBS. Centrifuge the
aggregates again.
15. Prepare 40 ml aliquots of B-27 (50X, Gibco®, Cat. no. 17504) and L-glutamine
(200 mM, Gibco®, Cat. no. 25030-032) supplemented Neurobasal medium
(Gibco®, Cat. no. 21103). Constituents of the Neurobasal medium and B-27 can
be found in Brewer et al.53
For 49.1 ml Neurobasal medium add
a. 800 µl B27 supplement
b. 100 µl L-glutamine
Materials and Methods
25
16. For IC1A cultures, resuspend the aggregates in supplemented Neurobasal medium
in step 14 and seed approximately 40 aggregates / cm2 on poly-D-lysine (PDL)
(Sigma-Aldrich Co., Cat. no. P6407) coated surfaces (Protocol 3). 10 -12 samples
were seeded.
17. Add 0.05 % Trypsin to reduce cell aggregate size (IC1S and IC2S cultures). Add 3
ml 0.05 % trypsin and 15 µl DNAse I (200X stock, Roche Diagnostics GmbH,
Mannheim, Germany, Cat. no. 1284932) for every 3 - 4 petri dishes of aggregate
suspension. Incubate in water bath at 37 0C for 5 min with gentle rocking.
18. Centrifuge at 1000 rpm at room temperature for 10 min.
19. Remove medium and add supplemented Neurobasal medium. Use a fire polished
glass pipette to break up the aggregates into single cells, about 40 – 50 times of
pipetting.
20. Seed the single cells on to coated substrates (see Protocol 3 for preparation of
coated substrates) at either 20 000 cells/cm2 (IC1S-20K) or 40 000 cells/cm2
(IC1S-40K, IC2S-40K). 10 – 12 samples in each experimental group were seeded.
21. The age of the neuronal cultures was then annotated as the number of days post
seeding.
22. On the 5th day, change half the medium with Neurobasal Medium supplemented
with B-27 only. Glutamine encourages glial cell growth and contributes to
neuronal mortality.
23. Medium is changed every 2 days after 12 - 14 days of culture or when medium is
yellow.
Materials and Methods
26
Protocol 3: Coating Substrates
1. Clean substrates before coating:
i. 12 mm diameter glass coverslips (Paul Marienfeld GmbH & Co. KG, Lauda-
Königshofen, Germany) were left in Ethanol – HCl solution (90 % / 10 %)
for 2 – 3 hours
ii. They were then rinsed in ethanol and dried with an air gun.
2. The cleaned coverslips were autoclaved and dried in an oven.
3. All coating solutions were sterile filtered with 0.22 µm PVDF syringe filters
(Rotilabo®, Carl Roth GmbH, Karlsruhe, Germany, Cat. no. P666.1).
4. Coating solutions
a. Poly-D-lysine (PDL) (Sigma-Aldrich Co., Cat. no. P6407) coated
substrates: 70 – 150 kDa, 0.1 mg/ml in PBS
b. P19 laminin fragment (LN) (Sigma-Aldrich Co., Cat. no. C6171)
coated substrates: 10 µg/ml in PBS
c. PDL–LN coated surfaces: 200 µg/ml PDL in PBS
10 µg/ml LN in PBS
d. Polyethylenimine (MW 70 000, Polysciences Europe GmbH,
Eppelheim, Germany, Cat. no. 9002-98-6) – laminin (PEI-LN) coated
surfaces:
1 mg/ml PEI in PBS
10 µg/ml LN in PBS
5. The autoclaved glass coverslips were placed in 12-well plates.
6. The glass coverslips were coated with 80 µl solutions in step 4 overnight at room
temperature under the lamina flow bench.
Materials and Methods
27
7. The coated glass cover slips were rinsed 3 times with sterile MilliQ water
(Millipore Corporation, MA, USA) and allowed to dry under the lamina flow
hood.
8. PDL-LN and PEI-LN samples were coated with the final layer of laminin
fragment and incubated at 37 0C for an hour.
9. PDL-LN and PEI-LN samples were then rinsed in sterile MilliQ water 3 times and
allowed to dry under the lamina flow hood.
Materials and Methods
28
Protocol 4: Immunostaining
1. Media was removed and samples were washed once with warm PBS.
2. Samples were fixed by incubating with 4 % paraformaldehyde, 3 % sucrose
solution (pH 7.4) for 20 minutes at 4 0C.
a. Preparation of fixative solution (50 ml)
i. 25 ml deionised water
ii. 2 g paraformaldehyde
iii. Heat to 60 0C, stir
iv. Add 4 - 5 drops of 1N NaOH
v. Add 1.5 g sucrose
vi. Add PBS and adjust pH to 7.4, making the final volume of 50
ml
3. The samples were rinsed 3 times, 5 min each with cold PBS. The fixed samples
can be stored at 4 0C for up to 2 weeks.
4. The samples were incubated with 5 % goat serum (Dianova, Hamburg, Germany)
in PBS at room temperature for 30 min to block unspecific binding.
5. Wash 3 times with PBS.
6. Incubate with 0.6 % Triton X-100 (Sigma-Aldrich Co.) in PBS at 4 0C for 20 min.
7. Wash 3 times with PBS and tap the remaining liquid off the samples.
8. Dilute primary antibodies in PBS added with 1 % goat serum and 0.15 %
Tween20 (Sigma-Aldrich Co.).
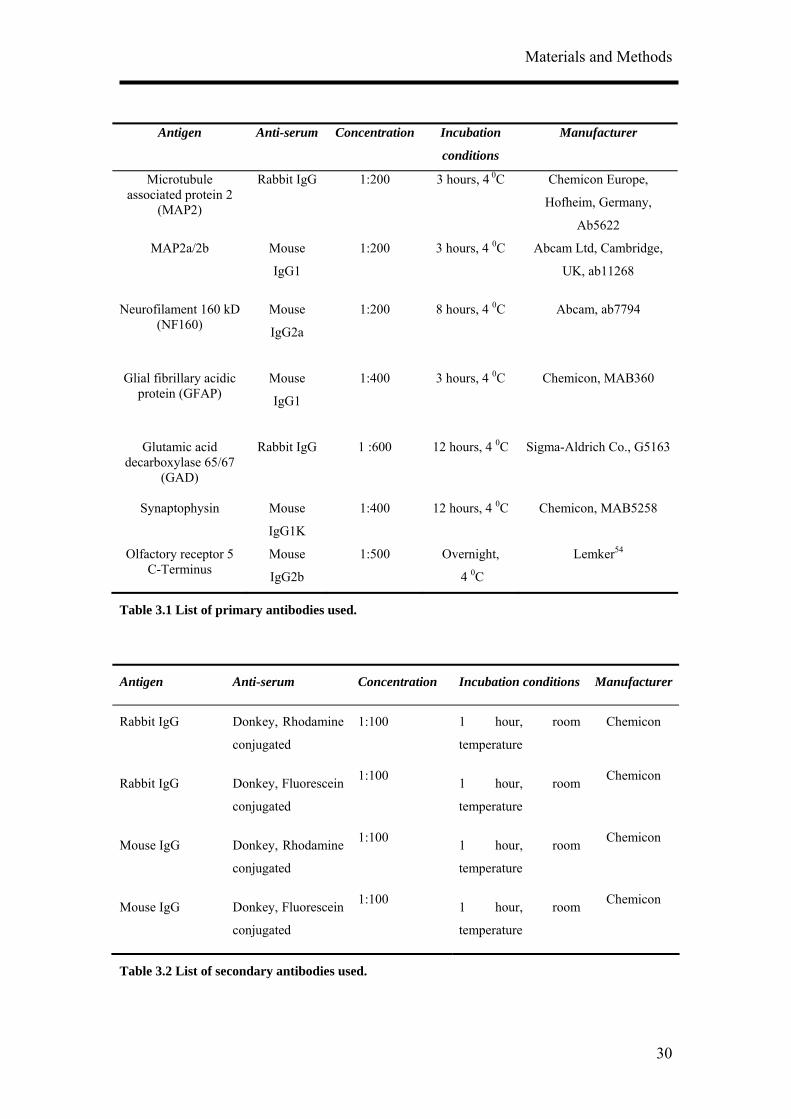
9. Incubate diluted primary antibodies for a specified time shown in Table 3.1.

Materials and Methods
29
10. Wash 3 times with PBS and tap the remaining liquid off the samples onto a piece
of paper.
11. Incubate the samples with secondary antibodies for a specified time shown in
Table 3.2.
12. Wash 3 times with PBS.
13. To stain the nuclei, incubate with 0.25 µg/ml 4, 6-diamidine-2-phenylindol-
dihydrochloride (DAPI) (Roche Diagnostics GmbH) in PBS for 5 min at room
temperature.
14. Wash 3 times with PBS.
15. The samples were mounted with Fluorescence Mount Medium (DakoCytomation,
CA, USA) and sealed with nail polish.
16. The samples were viewed either under a confocal laser microscope (Carl Zeiss
LSM 510, Carl Zeiss AG, Cologne, Germany) or fluorescence microscope
(Olympus IX70 and U-RFL-T power supply unit, Tokyo, Japan).
Materials and Methods
30
Antigen Anti-serum Concentration Incubation
conditions
Manufacturer
Microtubule associated protein 2
(MAP2)
Rabbit IgG 1:200 3 hours, 4 0C Chemicon Europe,
Hofheim, Germany,
Ab5622
MAP2a/2b
Mouse
IgG1
1:200 3 hours, 4 0C Abcam Ltd, Cambridge,
UK, ab11268
Neurofilament 160 kD (NF160)
Mouse
IgG2a
1:200 8 hours, 4 0C Abcam, ab7794
Glial fibrillary acidic protein (GFAP)
Mouse
IgG1
1:400 3 hours, 4 0C Chemicon, MAB360
Glutamic acid decarboxylase 65/67
(GAD)
Rabbit IgG 1 :600 12 hours, 4 0C Sigma-Aldrich Co., G5163
Synaptophysin Mouse
IgG1K
1:400 12 hours, 4 0C Chemicon, MAB5258
Olfactory receptor 5 C-Terminus
Mouse
IgG2b
1:500 Overnight,
4 0C
Lemker54
Table 3.1 List of primary antibodies used.
Antigen Anti-serum Concentration Incubation conditions Manufacturer
Rabbit IgG Donkey, Rhodamine
conjugated
1:100 1 hour, room
temperature
Chemicon
Rabbit IgG Donkey, Fluorescein
conjugated
1:100 1 hour, room
temperature
Chemicon
Mouse IgG Donkey, Rhodamine
conjugated
1:100 1 hour, room
temperature
Chemicon
Mouse IgG Donkey, Fluorescein
conjugated
1:100 1 hour, room
temperature
Chemicon
Table 3.2 List of secondary antibodies used.
Materials and Methods
31
Protocol 5: Co-culturing P19-derived neurons with glial cells
1. Glial cells were either isolated from primary rat cortex or differentiated from
P19 cells and seeded on to sterile PDL coated 12 mm diameter glass
coverslips.
2. PDMS drops were contacted at 3 points of the 12 mm round coverslips leaving
behind tiny rounded polydimethylsiloxane (PDMS) (Sylgard® 182, Dow
Corning Corporation, Michigan USA) stands on the surfaces (Figure 3.1).
Allow the PDMS to harden in an oven heated to 80 0C for an hour.
3. Autoclave the prepared glass coverslips and coat them with PDL according to
Protocol 3.
4. Primary glial cells were prepared from 18 day old embryos of pregnant CD
rats (Charles River, Sulzfeld, Germany).
a. The meninges of the embryonic brain was removed and the cerebral
cortices were separated from the hippocampus. The cortices was then
enzymatically treated with cystein activated papain (L-cystein: 0.2
mg/ml, papain: 2 U/ml, Sigma-Aldrich Co.) and DNAse I (10 mg/ml,
Roche Diagnostics GmbH) in medium. The cortices were then
triturated a few times carefully with a fire polished glass pasteur
pipette and incubated for 30 minutes in a water bath at 37 0C.
b. The enzymes were removed by centrifugation at 1000 rpm for 5
minutes and washing the pellet with PBS. Repeat this one more time.
c. The dissociated cortical pieces were resuspended in MEM (Gibco)
supplemented with 20 mM glucose (Sigma-Aldrich Co.) and 10 % fetal
bovine serum (Gibco) and triturated with a fire polished glass Pasteur
pipette until the tissue pieces could not be seen any more.
5. Glial cells were also selected from RA treated P19 cells.
Materials and Methods
32
a. P19 cells were differentiated in the neuronal lineage as described in
Protocol 2.
b. RA treated P19 cells were dissociated in MEM-a supplemented with
10 % fetal bovine serum instead of supplemented neurobasal medium
and seeded at 80 000 cells/cm2 on PDL coated glass coverslips.
c. Medium was changed 2 days later to MEM supplemented with 20 mM
glucose, 5 % fetal bovine serum and 5 % horse serum.
6. After 2 weeks, a confluent monolayer of flattened cells with few or no neurons
could be observed due to the medium used for the selection of glial cells
survival.
7. Prepare this monolayer culture of glial cells 2 weeks before the culture of P19-
derived neurons.
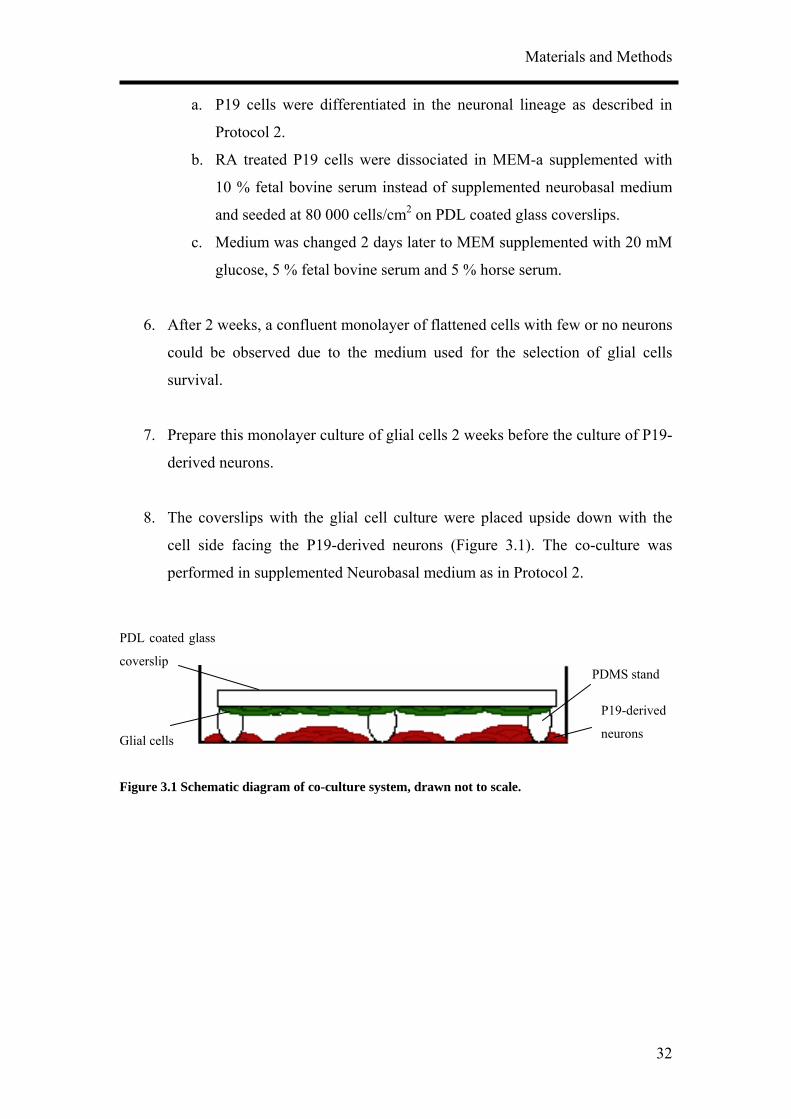
8. The coverslips with the glial cell culture were placed upside down with the
cell side facing the P19-derived neurons (Figure 3.1). The co-culture was
performed in supplemented Neurobasal medium as in Protocol 2.
Figure 3.1 Schematic diagram of co-culture system, drawn not to scale.
PDL coated glass
coverslip PDMS stand
P19-derived
neurons Glial cells
Materials and Methods
33
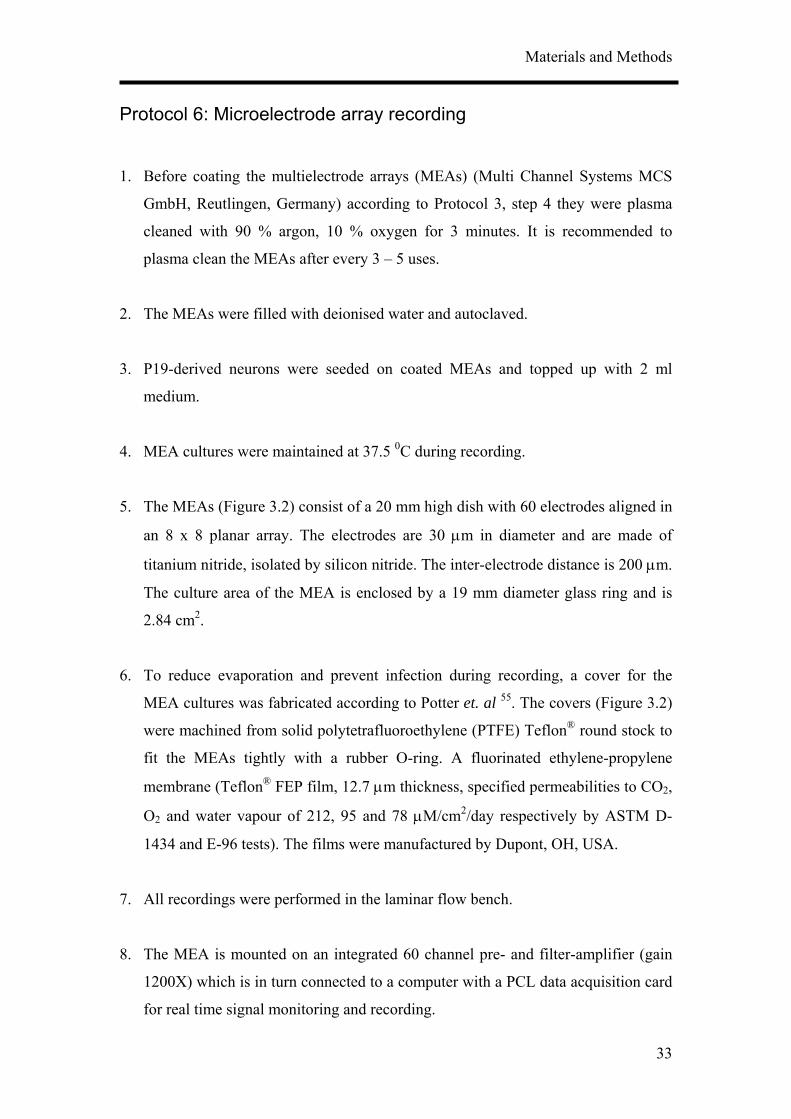
Protocol 6: Microelectrode array recording
1. Before coating the multielectrode arrays (MEAs) (Multi Channel Systems MCS
GmbH, Reutlingen, Germany) according to Protocol 3, step 4 they were plasma
cleaned with 90 % argon, 10 % oxygen for 3 minutes. It is recommended to
plasma clean the MEAs after every 3 – 5 uses.
2. The MEAs were filled with deionised water and autoclaved.
3. P19-derived neurons were seeded on coated MEAs and topped up with 2 ml
medium.
4. MEA cultures were maintained at 37.5 0C during recording.
5. The MEAs (Figure 3.2) consist of a 20 mm high dish with 60 electrodes aligned in
an 8 x 8 planar array. The electrodes are 30 µm in diameter and are made of
titanium nitride, isolated by silicon nitride. The inter-electrode distance is 200 µm.
The culture area of the MEA is enclosed by a 19 mm diameter glass ring and is
2.84 cm2.
6. To reduce evaporation and prevent infection during recording, a cover for the
MEA cultures was fabricated according to Potter et. al 55. The covers (Figure 3.2)
were machined from solid polytetrafluoroethylene (PTFE) Teflon® round stock to
fit the MEAs tightly with a rubber O-ring. A fluorinated ethylene-propylene
membrane (Teflon® FEP film, 12.7 µm thickness, specified permeabilities to CO2,
O2 and water vapour of 212, 95 and 78 µM/cm2/day respectively by ASTM D-
1434 and E-96 tests). The films were manufactured by Dupont, OH, USA.
7. All recordings were performed in the laminar flow bench.
8. The MEA is mounted on an integrated 60 channel pre- and filter-amplifier (gain
1200X) which is in turn connected to a computer with a PCL data acquisition card
for real time signal monitoring and recording.
Materials and Methods
34
9. Recordings of the MEA culture was performed after the 5th day post seeding to
check for spontaneous activity.
10. Signals from all 60 electrodes were sampled at 25 kHz, visualised and stored
using standard software MC_Rack (MultiChannel Systems).
11. Spike detection was done by setting the threshold manually for each active
electrode. The extracellular recorded signals were embedded in biological and
thermal noise of 20 – 30 µV peak to peak.
12. Electrode impedance had been reported to increase with time in culture.43 The
MEAs usually need to be replaced after 1 year’s usage.
Figure 3.2 MEA with 20 mm diameter glass ring fitted with a cover. (A) Top view, (B) Side view.
A
B
Materials and Methods
35
Protocol 7: Pharmacological Recordings
1. Half the media (1 ml) in the MEA cultures were changed 24 hours before
recording with the test substances.
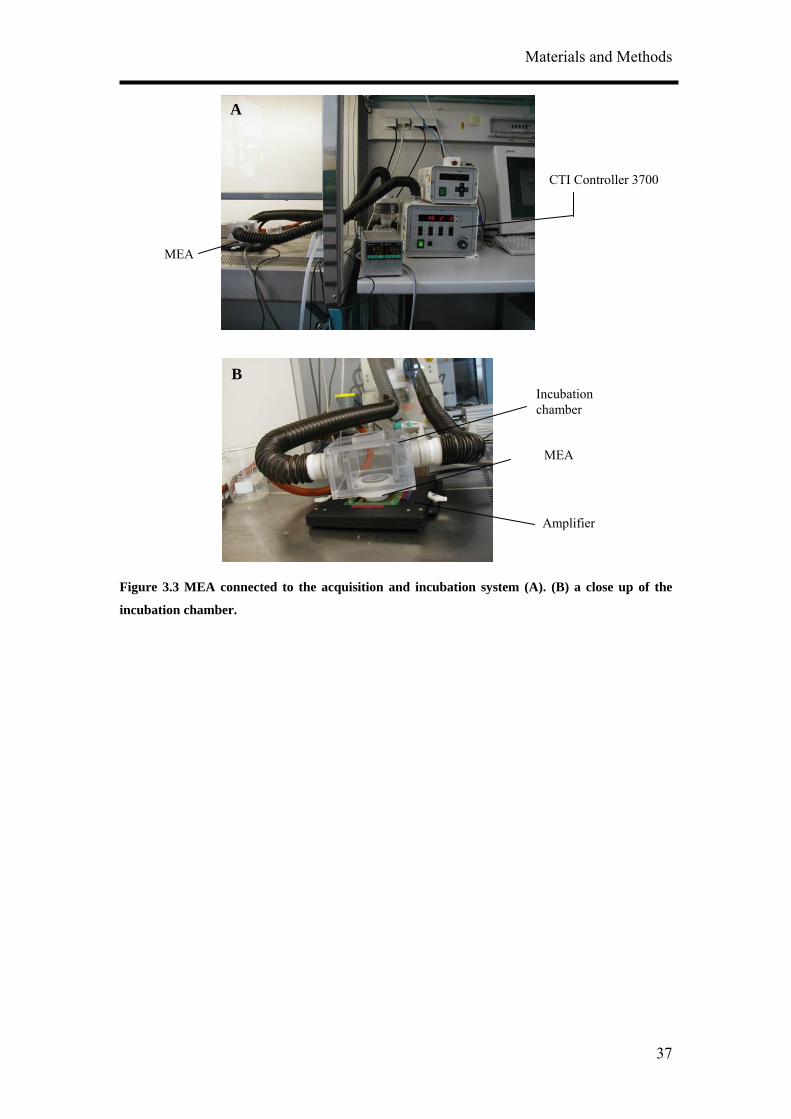
2. Before starting the recording, set up the incubation system (Figure 3.3A) and
let it run for at least an hour. An empty MEA filled with just medium was
fitted with a self made incubation chamber (Figure 3.3B) that was connected
to the CTI-Controller 3700 (Leica microsystem GmbH, Wetzlar, Germany)
maintaining a constant moist air stream of 5 % CO2. The heating stage of the
MEA was set to 37.5 0C.
3. The MEA culture was removed from the incubator and fitted to the incubation
system.
4. Two to three hours extracellular recordings consisting of the native state, the
reference state, test substance application and wash state were performed. The
native state is the original activity before any change in the medium was done
during the long term recording. Reference state is the activity of the cultures
when half the medium was changed.
5. Each state was recorded for between 20 – 30 minutes.
6. 10 % (200 µl) of the medium in the MEA cultures was removed. All test
substances were from Sigma-Aldrich Co. unless otherwise stated. GABA (Cat.
no. A5835), bicuculline Cat. no. B6889), muscimol (Cat. no. G019), glutamate
(Cat. no. G8415) and cyclothiazide (Cat. no. 9847). Cyclothiazide was
dissolved in dimethyl sulfoxide (DMSO) (Cat. no. D2650). A stock solution of
the test substances was prepared and diluted in the culture medium that was
removed taking into account that the final volume should remain the same.
7. The medium containing the test substance was returned to the MEA culture
after pipetting it a few times for even mixing of the test substance. It was then
Materials and Methods
36
carefully added at 4 points of the MEA dish 90 0 from each other to ensure that
the test substance was evenly distributed in the culture medium.
8. Washing of the cultures was performed up to a maximum of 3 half medium
changes to observe if the activity return to the reference state. Half medium
changes have to be performed carefully and slowly to avoid wash induced
damages to the neuronal culture.
9. Mean spike rate (MSR) at 10s bins were computed with the supplied
MC_Rack program and plotted with respect to time to observe the changes in
activity over a long period of time. MSR data was presented together with the
standard deviation. Statistical significance of the changes in MSR relative to
the reference activity was performed with the paired Student’s t-test at a
significance level of P = 0.05, 0.01 and 0.001.
10. To examine the effects of the drugs on activity, the MSR for the first 10
minutes and 20 - 30 minutes after the drug application after were analysed.
11. To examine effects of the drugs on activity relative to reference activity,
activity after the addition of drugs was normalised with the reference activity.
Statistical significance of the change relative to the reference activity was
performed with the paired Student’s t-test at a significance level of P = 0.05,
0.01 and 0.001.
12. The prolongation effect of cyclothiazide on activity was calculated by the time
it takes for MSR to reduce by 1 spike/s, τ.
minmax MSRMSRT−
=τ
Τ = time for MSR to reach baseline activity. T is calculated by the intercept of
the linear fit to the drop in MSR after CTZ application and the linear fit to the
baseline activity; MSRmax is the maximum mean spike rate during CTZ
application; MSRmin is the mean spike rate of the baseline activity.
Materials and Methods
37
Figure 3.3 MEA connected to the acquisition and incubation system (A). (B) a close up of the
incubation chamber.
A
CTI Controller 3700
MEA
BIncubation chamber
MEA
Amplifier
Materials and Methods
38
Protocol 8: Virus Infection
1. Recombinent Semliki forest virus (SFV) particles containing the OR5 gene
was obtained from Eva Lemker (Max Planck Institute for Biochemistry,
Munich, Germany).
2. Prior to infection the recombinant virus was activated by chymotrypsin
treatment.
a. 10 ml of virus stock suspension is incubated with 250 µl α-
chymotrypsin (stock: 20mg.ml) (Roche Diagnostics GmbH,
Mannheim, Germany) at room temperature for 20 minutes.
b. Inactivate chymotrypsin by adding 250 µl aprotinin (stock: 10 mg/ml)
(Sigma-Aldrich Co., Saint Louis, USA).
3. P19-derived neurons grown for 17 days on 3 MEAs and 6 sibling glass
coverslips. Culture medium was removed and the cultures were washed once
with PBS.
4. A small volume of the activated viral particles just enough to cover the
cultures was added and incubated at 37 0C, 5 % CO2 for 1 hour.
5. Medium was removed and fresh culture medium was added. The cultures were
returned to the incubator.
6. Recording was performed after 4 – 15 hours.
7. Glass coverslip cultures were fixed and stained after 15 hours.
Materials and Methods
39
Protocol 9: DNA cloning
1. T-RExTM System (Invitrogen Corporation, CA, USA) was applied according to
manufacturer’s instructions as a mammalian expression system for the
expression of OR5 in P19-derived neurons.
2. T-RExTM System consists of an inducible expression plasmid, pcDNA TM 4/TO
and a regulatory plasmid, pcDNA6/TR©. The expression of the gene of interest
is controlled by the strong human cytomegalovirus immediate-early (CMV)
promoter and two tetracycline operator 2 (TetO2) sites. pcDNA6/TR© encodes
for tetracycline repressor under the control of human CMV.
3. pcDNA TM 4/TO and pcDNA6/TR© plasmids were inoculated and expanded in
chemically competent E. coli cultures (One ShotTM TOP10F’, Invitrogen
Corporation).
4. Plasmids pTNT-OR5 and pcDNATM 4/TO were double restricted by EcoRI
and Not1 enzymes (New England Biolabs Inc, MA, USA) and ligated by DNA
ligase (Rapid DNA Ligation Kit, Roche Diagnostics GmbH, Cat. No. 11
635379 001).
5. DNA samples were diluted in loading buffer (HyperLadder I, Bioline GmbH,
Luckenwalde, Germany) and ran in 1 % agarose gel in TAE buffer at 250 V.
6. Before transfecting into the cells, plasmids were sent to Sequiserve
(Vaterstetten, Germany) for sequencing to ensure that the OR5 gene was
correctly encoded.
7. Minimum concentration of blasticidin and ZeocinTM needed to select
transfected P19 cells was determined to be 5 µg/ml and 50 µg/ml, respectively
by exposing P19 cell cultures to different concentration of both antibiotics in
duplicates.
Materials and Methods
40
Protocol 10: Transfection of P19-derived neurons: electroporation
and calcium phosphate precipitation
1. Plasmids were linearised (Sap I) before transfection.
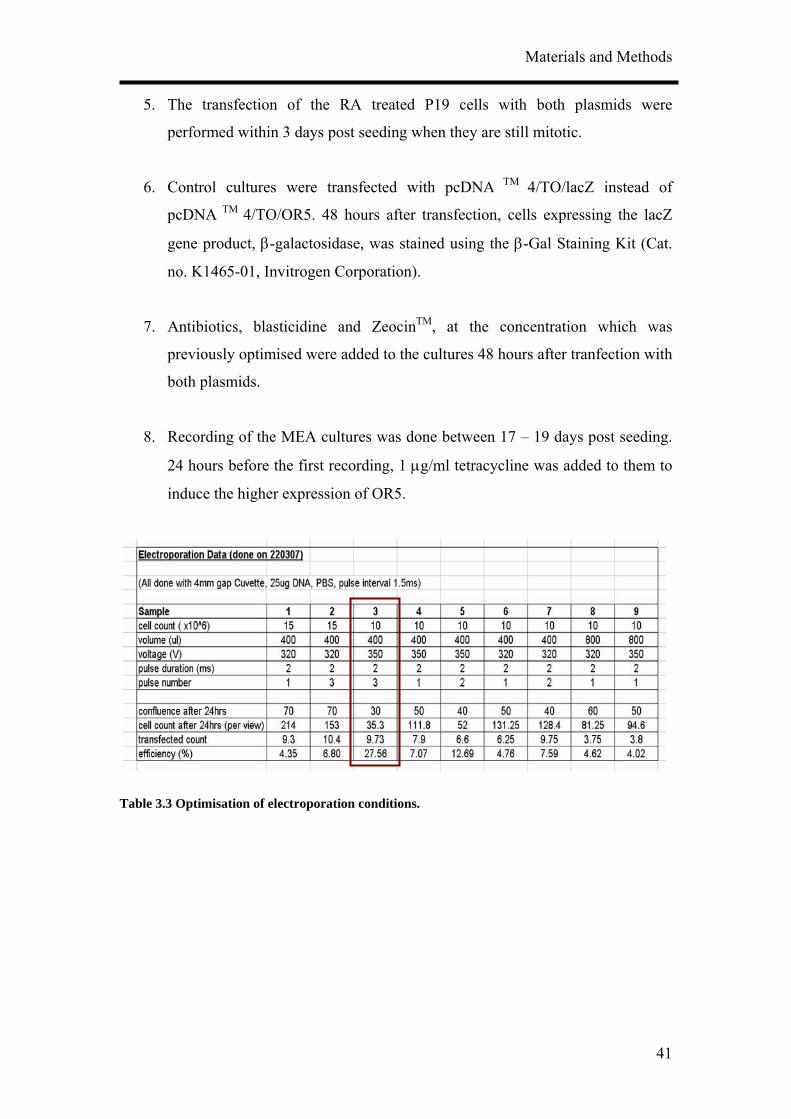
2. Optimisation of electroporation (Electro Square Porator ECM® 830, BTX
Instrument Division of Genetronics, Inc., CA, USA) conditions (Table 3.3) for
P19 cells were first performed with eGFP plasmids supplied by Prof. Wolfrum
(Institute for Zoology, Johannes Gutenberg University, Mainz, Germany).
Cells in 10 different areas at the bottom of culture flasks were counted.
Condition 3 was found to yield the highest transfection efficiency.
3. P19-derived neurons were tranfected with a combination of electroporation
and calcium phosphate precipitation (CalPhosTM Mammalian Transfection Kit,
Clontech Laboratories, Inc., CA, USA) methods. Cultures were incubated with
the calcium phosphate/DNA precipitates for 3 hours. Transfection was
performed immediately after the P19 cells were treated in RA supplemented
suspension culture for 4 days.
a. Group 1 consisted of first electroporating pcDNA TM 4/TO/OR5
plasmids in to the RA treated P19 cells and then introducing
pcDNA6/TR© plasmids by calcium phosphate method 2 days later.
b. Group 2 consisted of first electroporating pcDNA6/TR© plasmids,
followed by transfecting with pcDNA TM 4/TO/OR5 plasmids via
calcium phosphate method 2 days later.
c. Group 3 consisted of transfecting the cells first with pcDNA6/TR©
plasmids and then pcDNA TM 4/TO/OR5 plasmids a day later by
calcium phosphate method.
4. For each group in step 2, P19-derived neurons were seeded on triplicates of
PEI-LN coated MEAs and glass coverslips.
Materials and Methods
41
5. The transfection of the RA treated P19 cells with both plasmids were
performed within 3 days post seeding when they are still mitotic.
6. Control cultures were transfected with pcDNA TM 4/TO/lacZ instead of
pcDNA TM 4/TO/OR5. 48 hours after transfection, cells expressing the lacZ
gene product, β-galactosidase, was stained using the β-Gal Staining Kit (Cat.
no. K1465-01, Invitrogen Corporation).
7. Antibiotics, blasticidine and ZeocinTM, at the concentration which was
previously optimised were added to the cultures 48 hours after tranfection with
both plasmids.
8. Recording of the MEA cultures was done between 17 – 19 days post seeding.
24 hours before the first recording, 1 µg/ml tetracycline was added to them to
induce the higher expression of OR5.
Table 3.3 Optimisation of electroporation conditions.
Results
42
4. Results
4.1 Optimisation of Neuronal Differentiation of P19 cells
It has been reported that P19 derived neurons display different phenotypes depending
on their culture conditions.9, 14, 16 In order to obtain reproducible and reliable
extracellular recordings with MEAs, a high proportion of neurons growing on the
MEA would be necessary. Retinoic acid-treated P19 cell cultures have been shown to
contain neurons, astroglia, microglia and cells resembling vascular smooth muscle.
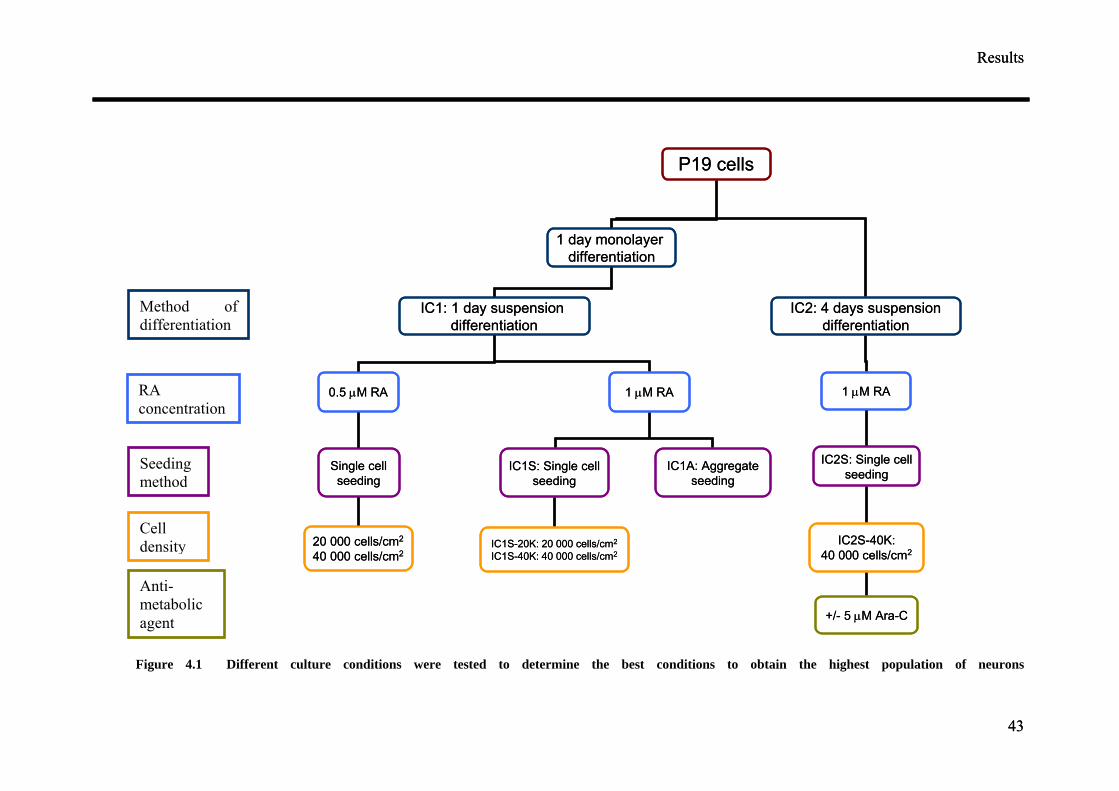
Various differentiation protocols summarised in Figure 4.1 were consequently
examined to obtain the highest population of neurons from P19 cells. Four culture
parameters: duration of aggregate mediated differentiation, the concentration of
retinoic acid (RA), seeding method and cell seeding density were varied to optimise
the differentiation of P19 cells into neurons. Anti-mitotic agent, cytosine arabinoside
(ARA-C), was also added to the differentiated cultures at a later time point to
discourage the growth of non-neuronal cells. 5 µg/ml of ARA-C was added to the
media at two different time points, two and five days post-seeding.
4.1.1 Aggregate seeding vs single cell seeding
4.1.1.1 Morphology
Induction of neuronal differentiation was carried out under IC1: 1 day monolayer
culture followed by a 1 day suspension culture (protocol from Lemker54). 0.5 µM or 1
µM RA was added to the cultures at the beginning of the induction. The efficiency of
neuronal differentiation was compared between two seeding methods. The cells after
2 days of induction with RA were either seeded as single cells (IC1S) or aggregates
(IC1A) on poly-d-lysine (PDL) coated glass cover slips and MEAs. IC1S cultures
were seeded at two different cell seeding density of 20 000 cells/cm2 (IC1S-20K) and
40 0000 cells/cm2 (IC1S-40K). The addition of RA and allowing the cells to grow in
suspension were necessary to induce the P19 cells into the neuronal lineage.
ResultsResults
43
43
Figure 4.1 Different culture conditions were tested to determine the best conditions to obtain the highest population of neurons
Method of differentiation
RA concentration
Seeding method
Cell density
Anti-metabolic agent
P19 cells
1 day monolayer differentiation
IC2: 4 days suspensiondifferentiation
IC1: 1 day suspension differentiation
0.5 µM RA 1 µM RA
IC1S: Single cellseeding
IC1A: Aggregateseeding
Single cellseeding
1 µM RA
IC2S: Single cellseeding
20 000 cells/cm2
40 000 cells/cm2IC1S-20K: 20 000 cells/cm2
IC1S-40K: 40 000 cells/cm2
IC2S-40K:40 000 cells/cm2
+/- 5 µM Ara-C
Results
44
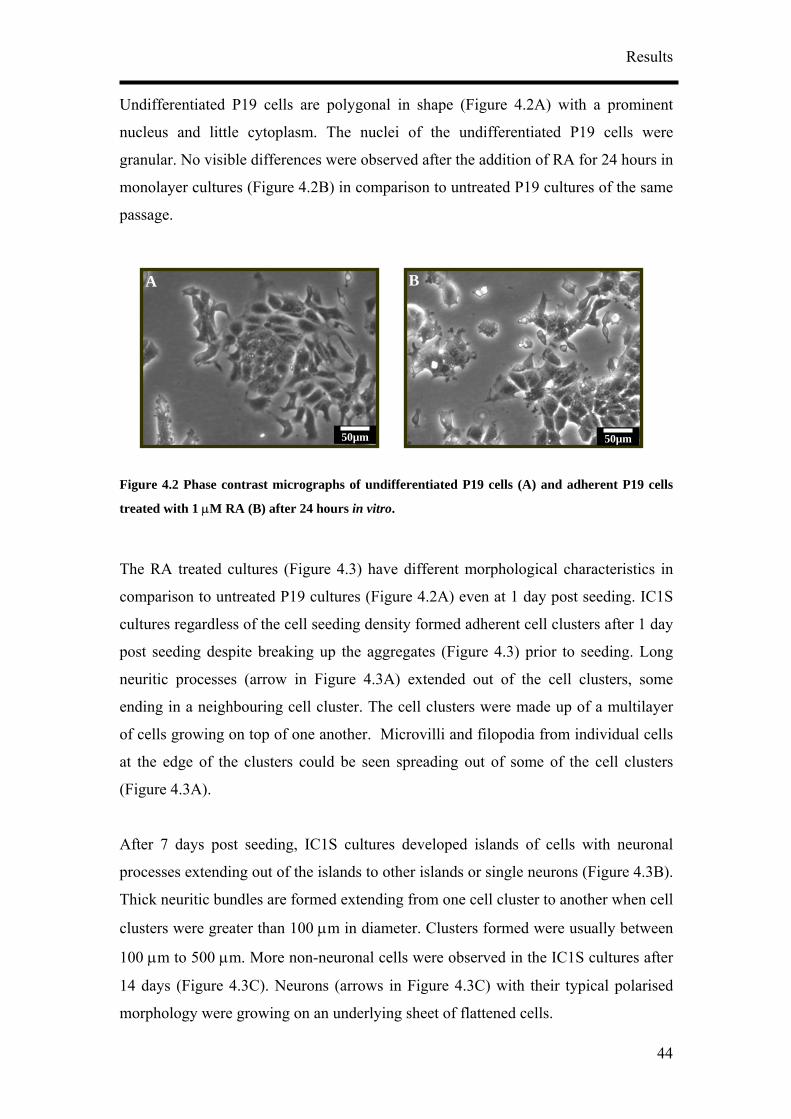
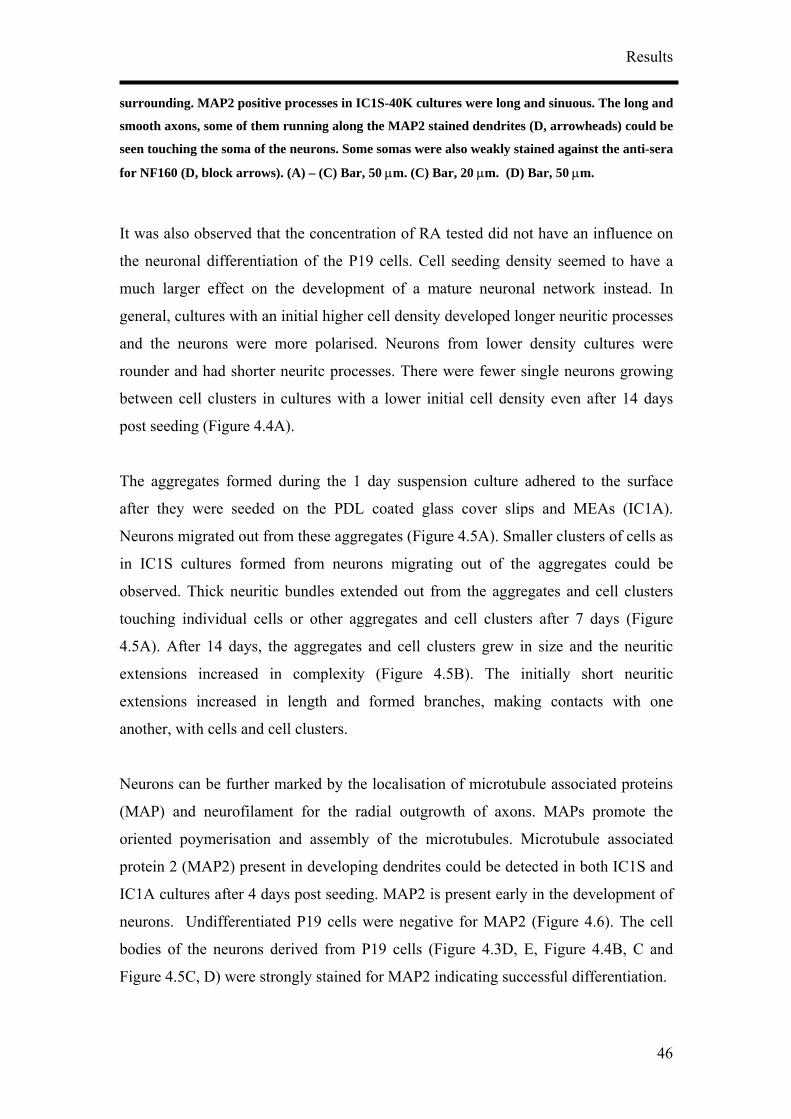
Undifferentiated P19 cells are polygonal in shape (Figure 4.2A) with a prom
nucleus and little cytoplasm. The nuclei of the undifferentiated P19 cells were
granular. No visible differences were observed after the addition of RA for 24 hours in
monolayer cultures (Figure 4.2B) in comparison to untreated P19 cultures of the same
passage.
Figure 4.2 Phase contras 19 cells (A) and adherent P
treated with 1 µM RA (B) after 24 hours in vitro.
The RA treated cultures (Figure 4.3) have different morphological characteristics in
comparison to untreated P19 cultures (Figure 4.2A) even at 1 day post seeding. IC1S
cultures regardless of the cell seeding density formed adherent cell clusters after 1 day
post seeding despite breaking up the aggregates (Figure 4.3) prior to seeding. Long
neuritic processes (arrow in Figure 4.3A) extended out of the cell clusters, some
ending in a neighbouring cell cluster. The cell clusters were made up of a mu
of cells growing on top of one another. Microvilli and filopodia from individual cells
at the edge of the clusters could be seen spreading out of some of the cell c rs
(Figure 4.3A).
After 7 days post seeding, IC1S cultures developed islands of cells with neuronal
processes extending out of the islands to other islands or single neurons (Figure 4.3B).
Thick neuritic bundles are for ed exte g from one cell cluster to another when cell
clusters were greater than 100 µm in diam ter. rs formed were usually be n
100 µm to 500 µm. Mor erved in the IC1S
14 days (Figure 4.3C). Neurons (arrows in Figure 4.3C) with their typical polarised
morphology were growing on an underlying sheet of flattened cells.
inent
19 cells
ltilayer
luste
twee
t micrographs of undifferentiated P
50µm
A
50µm
B
m
e non-neuronal cells were obs
ndin
e Cluste
cultures after
Results
A
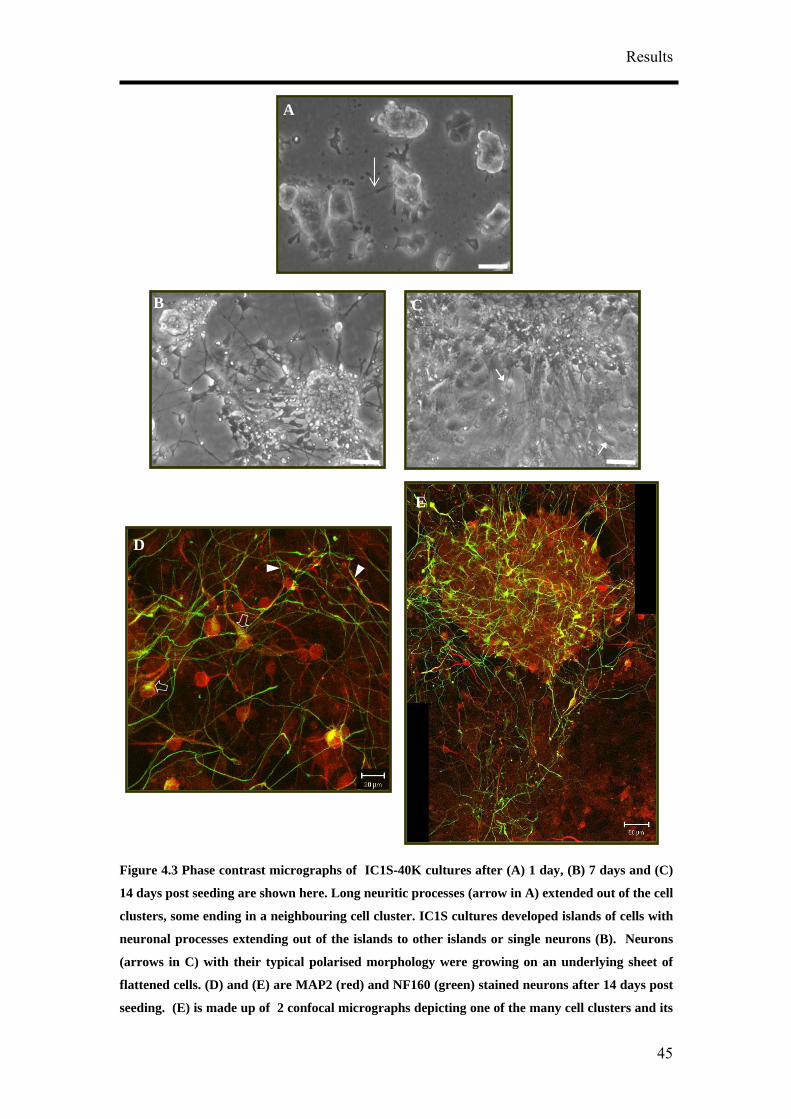
Figure 4.3 Phase contrast micrographs of IC1S-40K cultures after (A) 1 day, (B) 7 days and (C)
14 days post seeding are shown here. Long neuritic processes (arrow in A) extended out of the cell
clusters, some ending in a neighbouring cell cluster. IC1S cultures developed islands of cells with
neuronal processes extending out of the islands to other islands or single neurons (B). Neurons
(arrows in C) with their typical polarised morphology were growing on an underlying sheet of
flattened cells. (D) and (E) are MAP2 (red) and NF160 (green) stained neurons after 14 days post
seeding. (E) is made up of 2 confocal micrographs depicting one of the many cell clusters and its
E
B C
D
45
Results
prosurrounding. MAP2 positive cesses in IC1S-40K cultures were long and sinuous. The long and
smooth axons, some of them running along the MAP2 stained dendrites (D, arrowheads) could be
seen touching the soma of the neurons. Some somas were also weakly stained against the anti-sera
for NF160 (D, block arrows). (A) – (C) Bar, 50 µm. (C) Bar, 20 µm. (D) Bar, 50 µm.
It was also observed that the concentration of RA tested did not have an influence on
the neuronal differentiation of the P19 cells. Cell seeding density seemed to have a
much larger effect on the development of a mature neuronal network instead. In
general, cultures with an initial higher cell de r neuritic processes
and the neurons were more polarised. Neurons from lower density cultures were
rounder and had shorter neuritc processes. There were fewer single neurons growing
between cell clusters in cultures with a lower initial cell density even after 14 days
post seeding (Figure 4.4A).
The aggregates formed during the 1 day suspension culture adhered to the surface
after they were seeded on the PDL coated glass cover slips and MEAs (IC1A).
Neurons migrated out from these aggregates (Figure 4.5A). Smaller clusters of cells as
in IC1S cultures formed from neurons migrating out of the aggregates could be
observed. Thick neuritic bundles extended out from the aggregates and cell clusters
touching individual cells or other aggregates and cell clusters after 7 days (Figure
4.5A). After 14 days, the aggregates and cell clusters grew in size and the neuritic
extensions increased in complexity (Figure 4.5B). The initially short neuritic
extensions increased in length and formed branches, making contacts with one
another, with cells and cell clusters.
Neurons can be further marked by the localisation of microtubule associated proteins
(MAP) and neurofilament for the radial outgrowth of axons. MAPs promote the
oriented poymerisation and assembly of the microtubules. Microtubule associated
nsity developed longe
protein 2 (MAP2) present in developing dendrites could be detected in both IC1S and
IC1A cultures after 4 days post seeding. MAP2 is present early in the development of
neurons. Undifferentiated P19 cells were negative for MAP2 (Figure 4.6). The cell
bodies of the neurons derived from P19 cells (Figure 4.3D, E, Figure 4.4B, C and
Figure 4.5C, D) were strongly stained for MAP2 indicating successful differentiation.
46
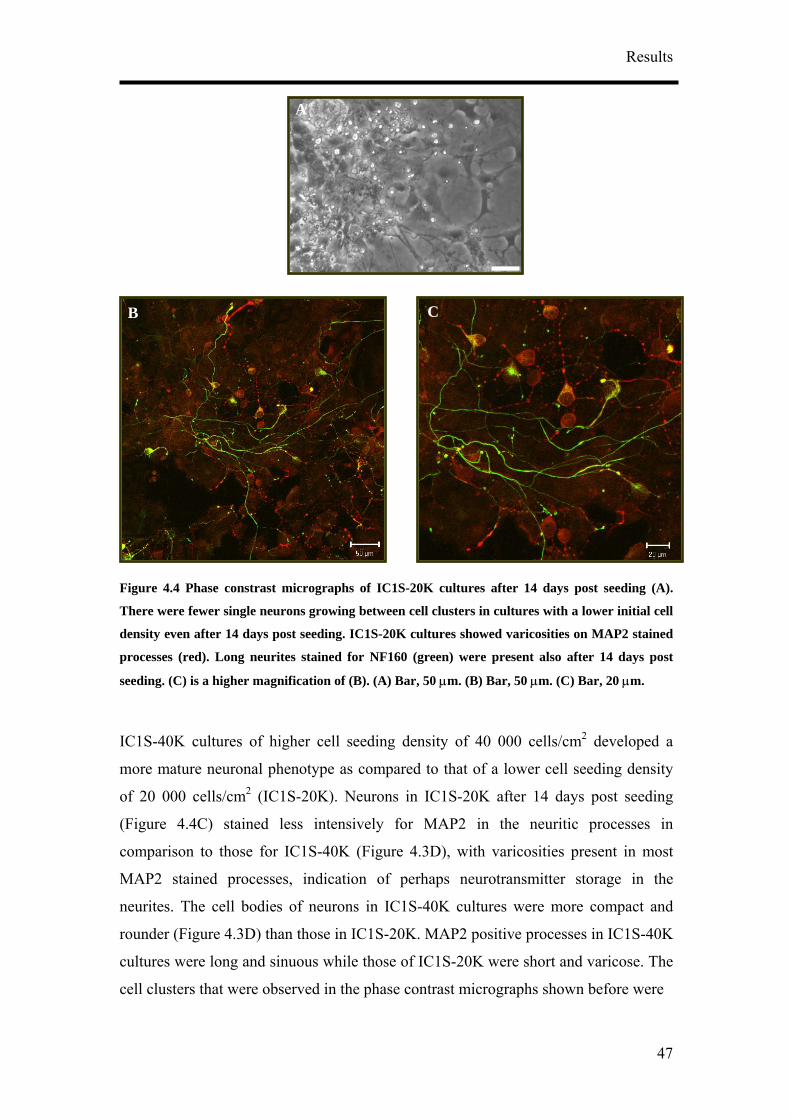
Results
Figure 4.4 Phase constrast micrographs of IC1S-20K cultures after 14 days post seeding (A).
There were fewer single neurons growing between cell clusters in cultures with a lower initial cell
density even after 14 days post seeding. IC1S-20K cultures showed varicosities on MAP2 stained
processes (red). Long neurites stained for NF160 (green) were present also after 14 days post
seeding. (C) is a higher magnification of (B). (A) Bar, 50 µm. (B) Bar, 50 µm. (C) Bar, 20 µm.
IC1S-40K cultures of higher cell seeding density of 40 000 cells/cm2 developed a
ature neuronal phenotype as compared to that of a lower cell seeding density more m
of 20 000 cells/cm2 (IC1S-20K). Neurons in IC1S-20K after 14 days post seeding
(Figure 4.4C) stained less intensively for MAP2 in the neuritic processes in
comparison to those for IC1S-40K (Figure 4.3D), with varicosities present in most
MAP2 stained processes, indication of perhaps neurotransmitter storage in the
neurites. The cell bodies of neurons in IC1S-40K cultures were more compact and
rounder (Figure 4.3D) than those in IC1S-20K. MAP2 positive processes in IC1S-40K
cultures were long and sinuous while those of IC1S-20K were short and varicose. The
cell clusters that were observed in the phase contrast micrographs shown before were
B C
A
47
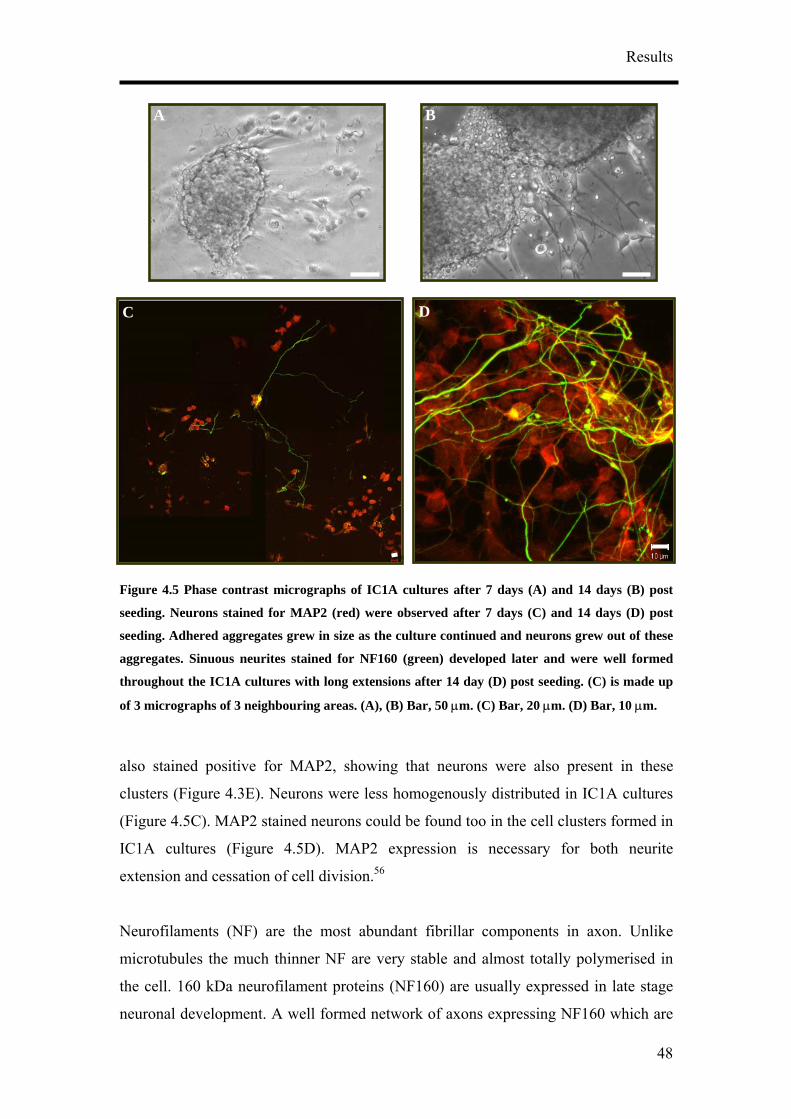
Results
f 3 micrographs of 3 neighbouring areas. (A), (B) Ba
neuronal development. A well formed network
BA
C
Figure 4.5 Phase contrast micrographs of IC1A cul
seeding. Neurons stained for MAP2 (red) were obse
seeding. Adhered aggregates grew in size as the cultu
aggregates. Sinuous neurites stained for NF160 (gr
throughout the IC1A cultures with long extensions a
o
also stained positive for MAP2, showing th
clusters (Figure 4.3E). Neurons were less hom
(Figure 4.5C). MAP2 stained neurons could be
IC1A cultures (Figure 4.5D). MAP2 expre
extension and cessation of cell division.56
Neurofilaments (NF) are the most abundant
microtubules the much thinner NF are very st
the cell. 160 kDa neurofilament proteins (NF1
D
up
r, 50 µm. (C) Bar, 20 µm. (D) Bar, 10 µm.
of axons expressing NF160 which are
tures after 7 days (A) and 14 days (B) post
rved after 7 days (C) and 14 days (D) post
re continued and neurons grew out of these
een) developed later and were well formed
fter 14 day (D) post seeding. (C) is made
at neurons were also present in these
ogenously distributed in IC1A cultures
found too in the cell clusters formed in
ssion is necessary for both neurite
fibrillar components in axon. Unlike
able and almost totally polymerised in
60) are usually expressed in late stage
48
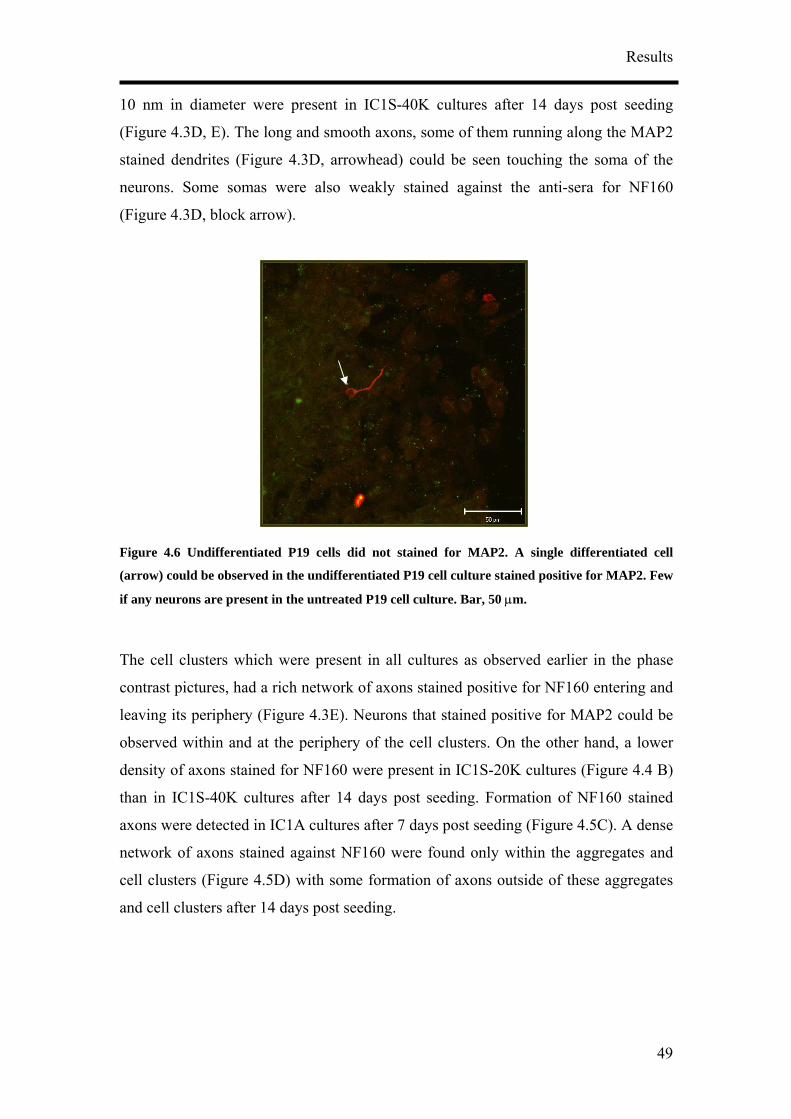
Results
10 nm in diameter were present in IC1S-40K cultures after 14 days post seeding
(Figure 4.3D, E). The long and smooth axons, some of them running along the MAP2
stained dendrites (Figure 4.3D, arrowhead) could be seen touching the soma of the
neurons. Some somas were also weakly stained against the anti-sera for NF160
(Figure 4.3D, block arrow).
Figure 4.6 Undifferentiated P19 cells did not stained for MAP2. A single differentiated cell
(arrow) could be observed in the undifferentiated P19 cell culture stained positive for MAP2. Few
e
bserved within and at the periphery of the cell clusters. On the other hand, a lower
ation of axons outside of these aggregates
nd cell clusters after 14 days post seeding.
if any neurons are present in the untreated P19 cell culture. Bar, 50 µm.
The cell clusters which were present in all cultures as observed earlier in the phase
contrast pictures, had a rich network of axons stained positive for NF160 entering and
leaving its periphery (Figure 4.3E). Neurons that stained positive for MAP2 could b
o
density of axons stained for NF160 were present in IC1S-20K cultures (Figure 4.4 B)
than in IC1S-40K cultures after 14 days post seeding. Formation of NF160 stained
axons were detected in IC1A cultures after 7 days post seeding (Figure 4.5C). A dense
network of axons stained against NF160 were found only within the aggregates and
cell clusters (Figure 4.5D) with some form
a
49
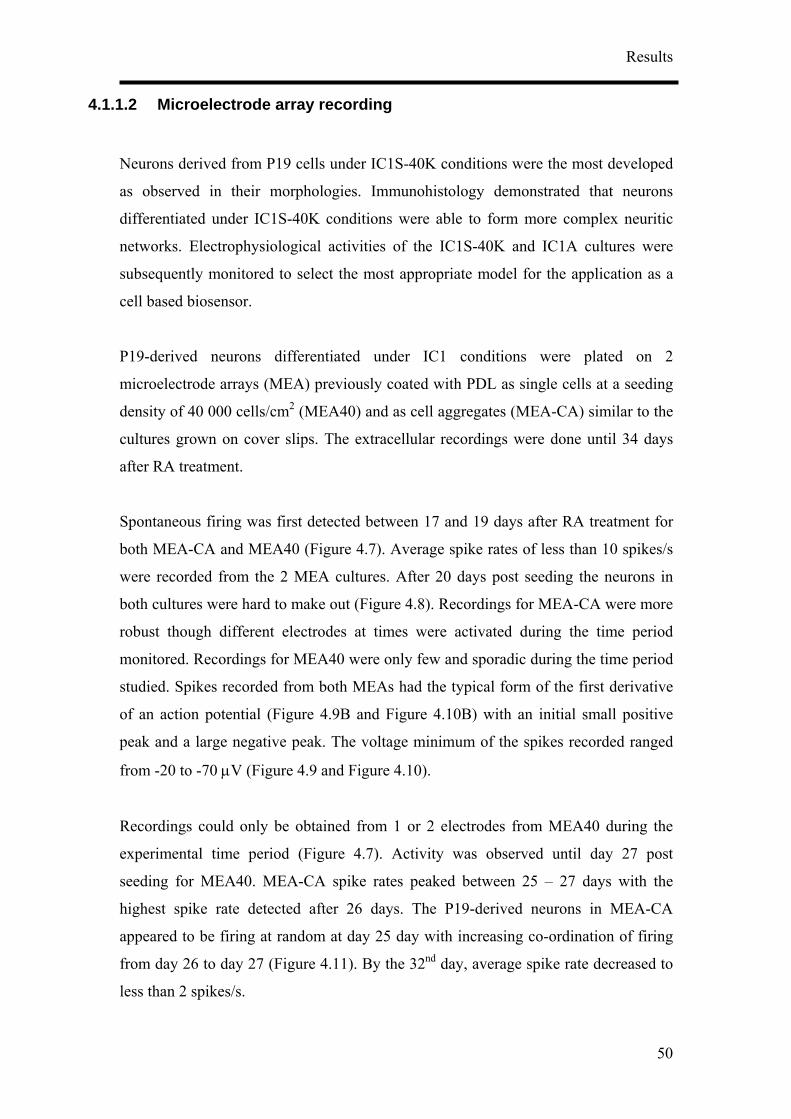
Results
4.1.
cal activities of the IC1S-40K and IC1A cultures were
ubsequently monitored to select the most appropriate model for the application as a
cell based biosensor.
P19-derived neurons differentiated under IC1 conditions were plated on 2
microelectrode arrays (MEA) previously coated with PDL as single cells at a seeding
density of 40 000 cells/cm2 (MEA40) and as cell aggregates (MEA-CA) similar to the
cultures grown on cover slips. The extracellular recordings were done until 34 days
after RA treatment.
Spontaneous firing was first detected between 17 and 19 days after RA treatment for
both MEA-CA and MEA40 (Figure 4.7). Average spike rates of less than 10 spikes/s
ring the time period
onitored. Recordings for MEA40 were only few and sporadic during the time period
ay with increasing co-ordination of firing
om day 26 to day 27 (Figure 4.11). By the 32nd day, average spike rate decreased to
ss than 2 spikes/s.
1.2 Microelectrode array recording
Neurons derived from P19 cells under IC1S-40K conditions were the most developed
as observed in their morphologies. Immunohistology demonstrated that neurons
differentiated under IC1S-40K conditions were able to form more complex neuritic
networks. Electrophysiologi
s
were recorded from the 2 MEA cultures. After 20 days post seeding the neurons in
both cultures were hard to make out (Figure 4.8). Recordings for MEA-CA were more
robust though different electrodes at times were activated du
m
studied. Spikes recorded from both MEAs had the typical form of the first derivative
of an action potential (Figure 4.9B and Figure 4.10B) with an initial small positive
peak and a large negative peak. The voltage minimum of the spikes recorded ranged
from -20 to -70 µV (Figure 4.9 and Figure 4.10).
Recordings could only be obtained from 1 or 2 electrodes from MEA40 during the
experimental time period (Figure 4.7). Activity was observed until day 27 post
seeding for MEA40. MEA-CA spike rates peaked between 25 – 27 days with the
highest spike rate detected after 26 days. The P19-derived neurons in MEA-CA
appeared to be firing at random at day 25 d
fr
le
50
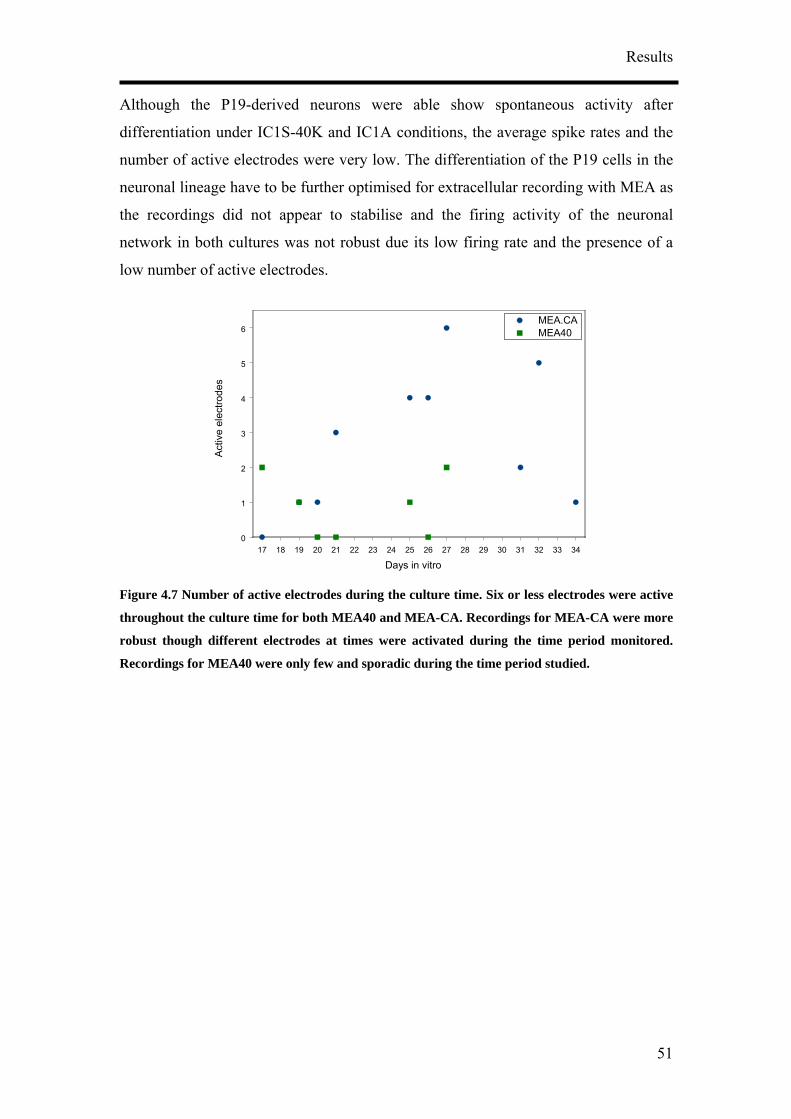
Results
Although the P19-derived neurons were able show spontaneous activity after
differentiation under IC1S-40K and IC1A conditions, the average spike rates and the
The differentiation of the P19 cells in the
euronal lineage have to be further optimised for extracellular recording with MEA as
number of active electrodes were very low.
n
the recordings did not appear to stabilise and the firing activity of the neuronal
network in both cultures was not robust due its low firing rate and the presence of a
low number of active electrodes.
A
Figure 4.7 Number of active
throughout the culture time
robust though different elec
Recordings for MEA40 were
17 10
5
1
2
3
4
6
Act
ive
elec
trode
s
electrodes during the culture time. Six or less electrodes were active
for both MEA40 and MEA-CA. Recordings for MEA-CA were more
trodes at times were activated during the time period monitored.
only few and sporadic during the time period studied.
8 19 20 21 22 23 24 25 26 27 28 29 30 31 32 33 34
MEA.CAMEA40
Days in vitro
51
Results
22
Figure bered
electrodes to make
out after 20 d presented in
the following
83
84 24 B C
A
4.8 Light microscopic images of MEA40 (A) and MEA-CA (B), (C) with num
indicated after 35 days post seeding. The neurons in both cultures were hard
ays post seeding. Signal recordings from electrodes 22, 83 and 24 were
graphs. Bar, 50 µm.
52
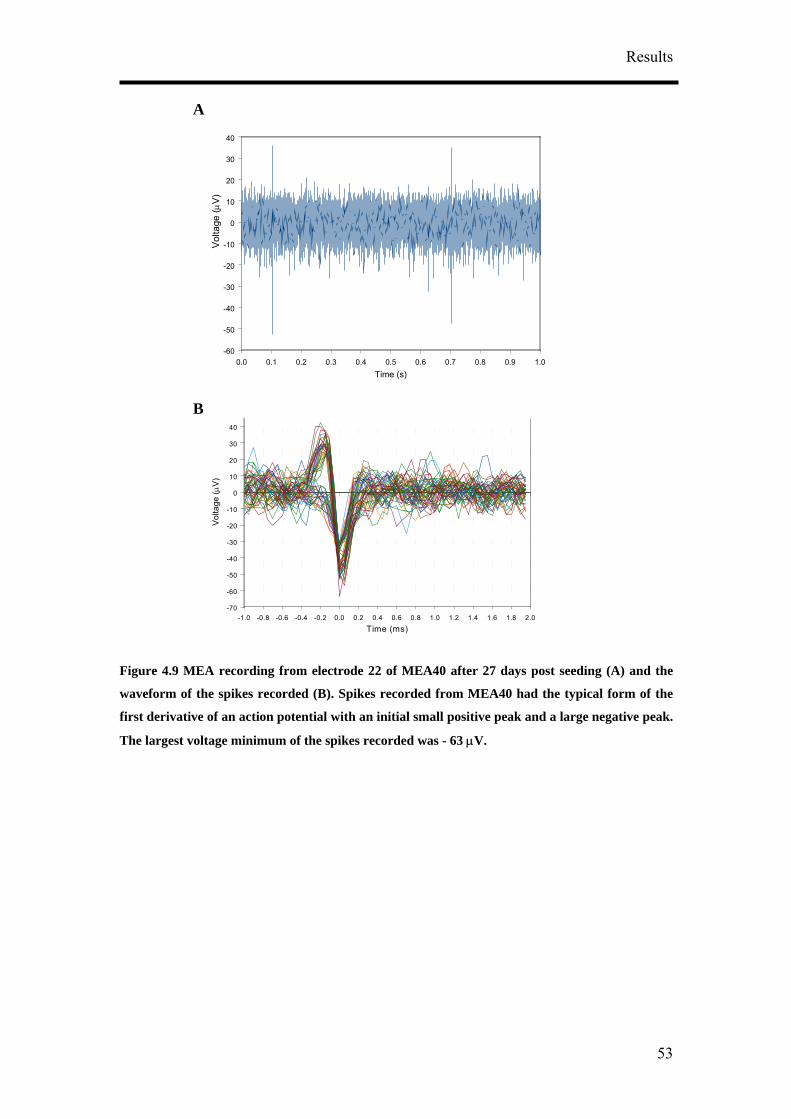
Results
A
0.0 0.1 0.2 0.3 0.4 0.5 0.6 0.7 0.8 0.9 1.0Time (s)
-60
-50
-4
Figure 4.9 MEA recording from electrode 22 of MEA40 after 27 days post seeding (A) and the
waveform of the spikes recorded (B). Spikes recorded from MEA40 had the typical form of the
first derivative of an action potential with an initial small positive peak and a large negative peak.
The largest voltage minimum of the spikes recorded was - 63 µV.
0
-30
-20
-10
0
10
20
30
40
Vol
tage
(µV)
B
-1.0 -0.8 -0.6 -0.4 -0.2 0.0 0.2 0.4 0.6 0.8 1.0 1.2 1.4 1.6 1.8 2.0
Time (ms)
-70
-60
10
20
30
40
Volta
ge (µ
V)
-50
-40
-30
-20
-10
0
53
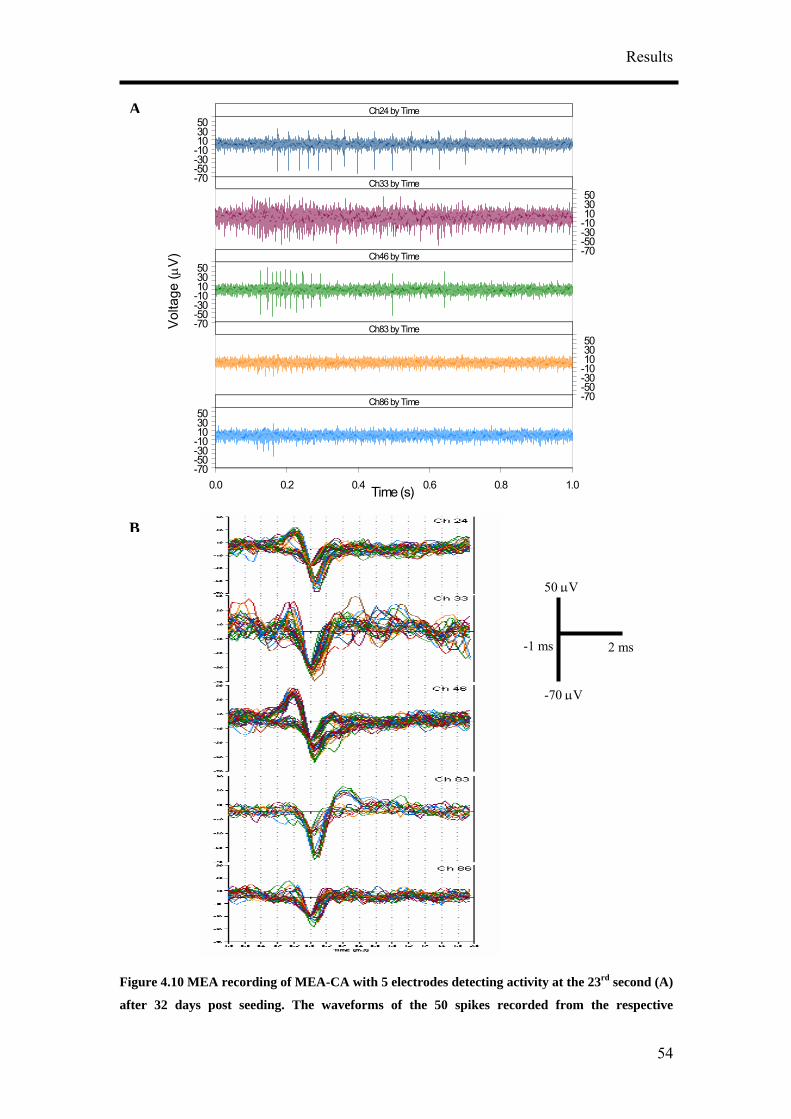
Results
Figure 4.10 MEA recording of MEA-CA with 5 electrodes detecting activity at the 23rd second (A)
after 32 days post seeding. The waveforms of the 50 spikes recorded from the respective
0.0 0.2 0.4 0.6 0.8 1.0Time (s)
-70-50-30-101030
-70-50-30-10103050
-70-50-30-10103050
-70-50-30-10103050
-70-50-30-1010
50
3050
Ch24 by Time
Ch33 by Time
Ch46 by Time
Ch83 by Time
Ch86 by Time
Vol
tage
(µV
)
50 µV
-1 ms 2 ms
A
B
-70 µV
54
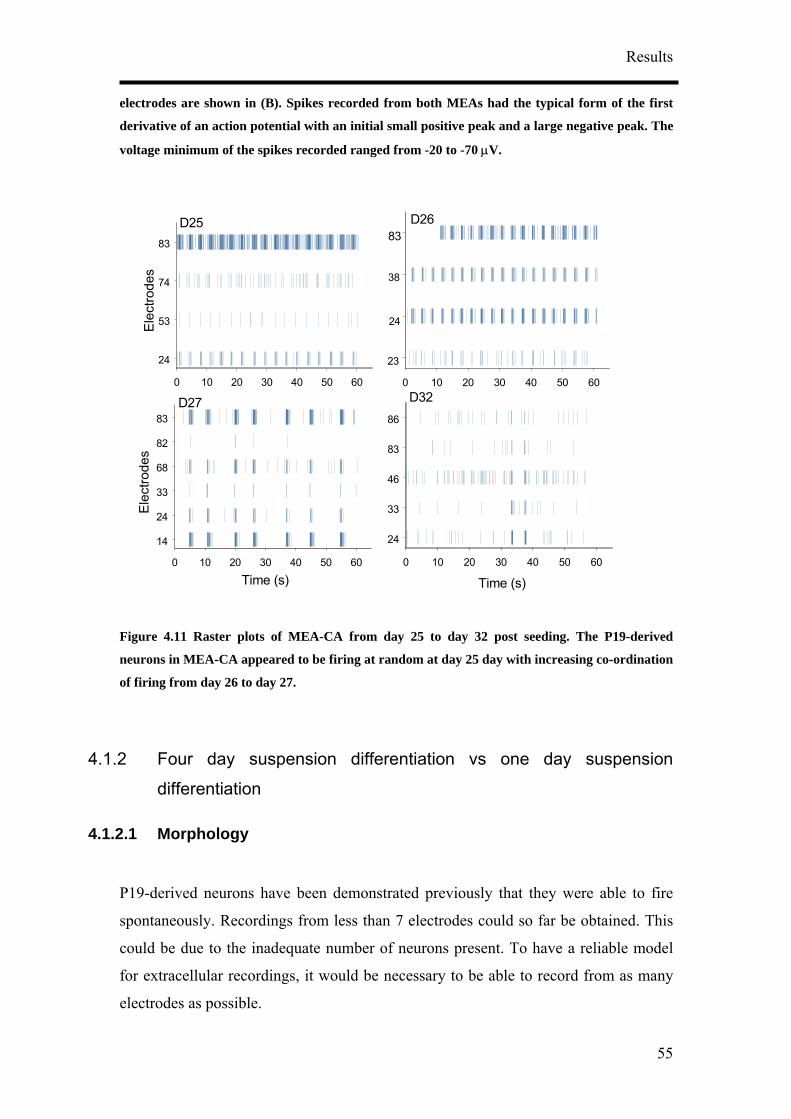
Results
electrodes are shown in (B). Spikes recorded from both MEAs had the typical form of the first
derivative of an action potential with an initial small positive peak and a large negative peak. The
voltage minimum of the spikes recorded ranged from -20 to -70 µV.
Figure 4.11 Raster plots of MEA-CA from day 25 to day 32 post seedi
g. The P19-derived
neurons in MEA-CA appeared to be firing at random at day 25 day with increasing co-ordination
of firing from day 26 to day 27.
4.1.2 Four day suspension differentiation vs one day suspension
differentiation
4.1.2.1 Morphology
P19-derived neurons have been demonstrated previously that they were able to fire
spontaneously. Recordings from less than 7 electrodes could so far be obtained. This
could be due to the inadequate number of neurons present. To have a reliable mode
0 10 20 30 40 50 60
24
53
74
83
Cha
nnel
s
D25
0 10 20 30 40 50 60
23
24
38
83D26
0 10 20 30 40 50 60
14
24
33
68
82
83
Cha
nnel
s
D27
0 10 20 30 40 50 60
Time (s)
24
33
46
83
86
D32
Time (s)
Ele
ctro
des
Ele
ctro
des
n
l
for extracellular recordings, it would be necessary to be able to record from as many
electrodes as possible.
55
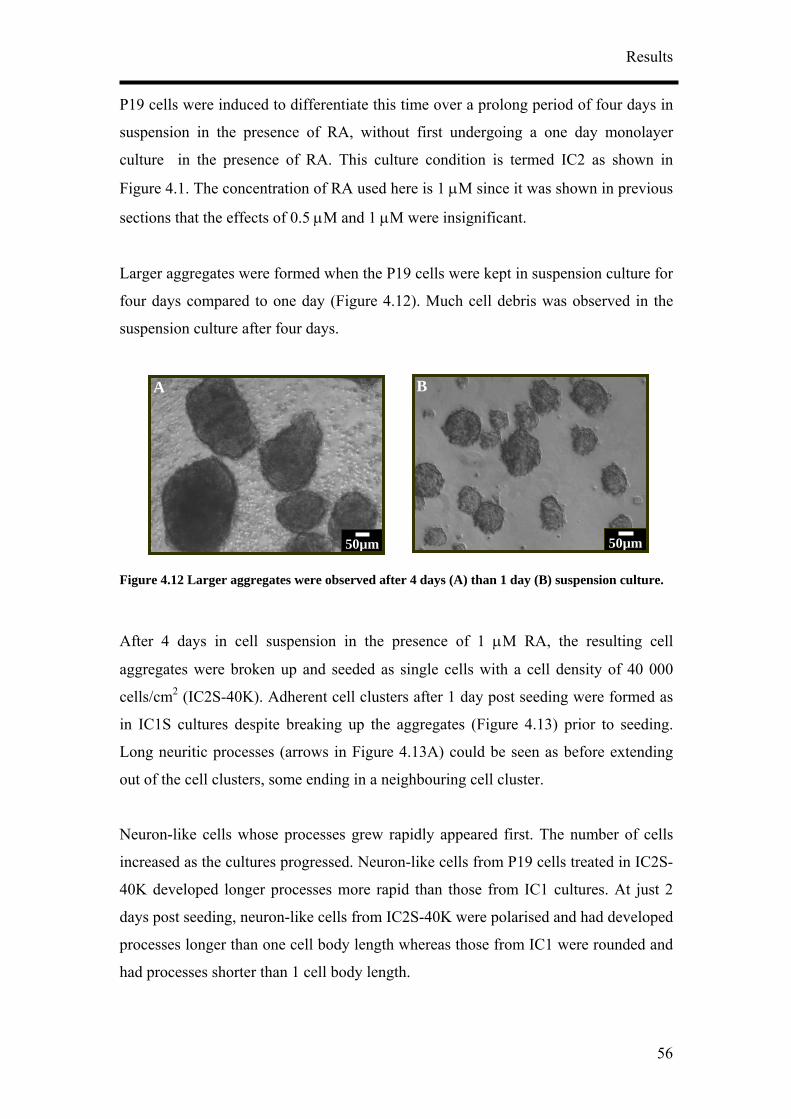
Results
P19 cells were induced to differentiate this time over a prolong period of four days in
suspension in the presence of RA, without first undergoing a one day monolayer
culture in the presence of RA. This culture condition is termed IC2 as shown in
igure 4.1. The concentration of RA used here is 1 µM since it was shown in previous
cells/cm (IC2S-40K). Adherent cell clusters after 1 day post seeding were formed as
IC1S cultures despite breaking up the aggregates (Figure 4.13) prior to seeding.
out of the cell clusters, some ending in a neighbouring cell cluster.
e processes grew rapidly appeared first. The number of cells
creased as the cultures progressed. Neuron-like cells from P19 cells treated in IC2S-
F
sections that the effects of 0.5 µM and 1 µM were insignificant.
Larger aggregates were formed when the P19 cells were kept in suspension culture for
four days compared to one day (Figure 4.12). Much cell debris was observed in the
suspension culture after four days.
Figure 4.12 Larger aggregates were observed after 4 days (A) than 1 day (B) suspension culture.
50µm
A
50µm
B
After 4 days in cell suspension in the presence of 1 µM RA, the resulting cell
aggregates were broken up and seeded as single cells with a cell density of 40 000 2
in
Long neuritic processes (arrows in Figure 4.13A) could be seen as before extending
Neuron-like cells whos
in
40K developed longer processes more rapid than those from IC1 cultures. At just 2
days post seeding, neuron-like cells from IC2S-40K were polarised and had developed
processes longer than one cell body length whereas those from IC1 were rounded and
had processes shorter than 1 cell body length.
56
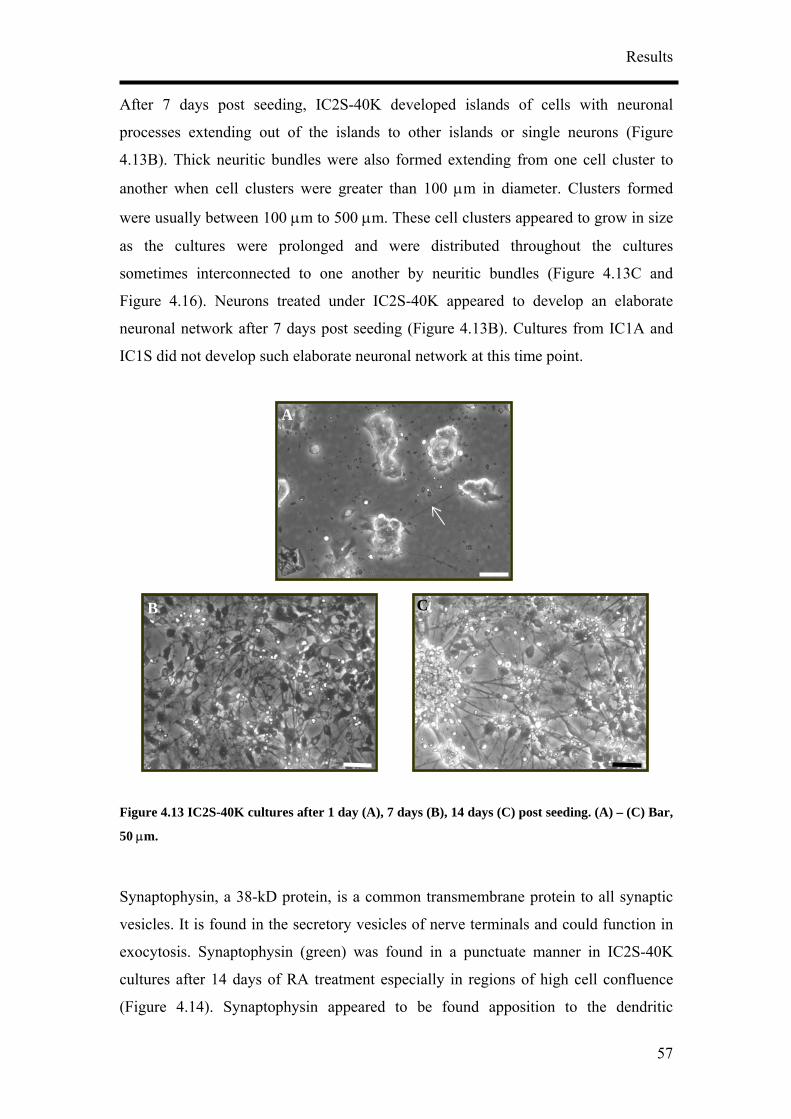
Results
After 7 days post seeding, IC2S-40K developed islands of cells with neuronal
processes extending out of the islands to other islands or single neurons (Figure
4.13B). Thick neuritic bundles were also formed extending from one cell cluster to
another when cell clusters were greater than 100 µm in diameter. Clusters formed
were usually between 100 µm to 500 µm. These cell clusters appeared to grow in size
the cultures were prolonged and were distributed throughout the cultures
seeding (Figure 4.13B). Cultures from IC1A and
1S did not develop such elaborate neuronal network at this time point.
igure 4.13 IC2S-40K cultures after 1 day (A), 7 days (B), 14 days (C) post seeding. (A) – (C) Bar,
ally in regions of high cell confluence
(Figure 4.14). Synaptophysin appeared to be found apposition to the dendritic
as
sometimes interconnected to one another by neuritic bundles (Figure 4.13C and
Figure 4.16). Neurons treated under IC2S-40K appeared to develop an elaborate
neuronal network after 7 days post
IC
F
50 µm.
Synaptophysin, a 38-kD protein, is a common transmembrane protein to all synaptic
vesicles. It is found in the secretory vesicles of nerve terminals and could function in
exocytosis. Synaptophysin (green) was found in a punctuate manner in IC2S-40K
cultures after 14 days of RA treatment especi
B
A
C
57
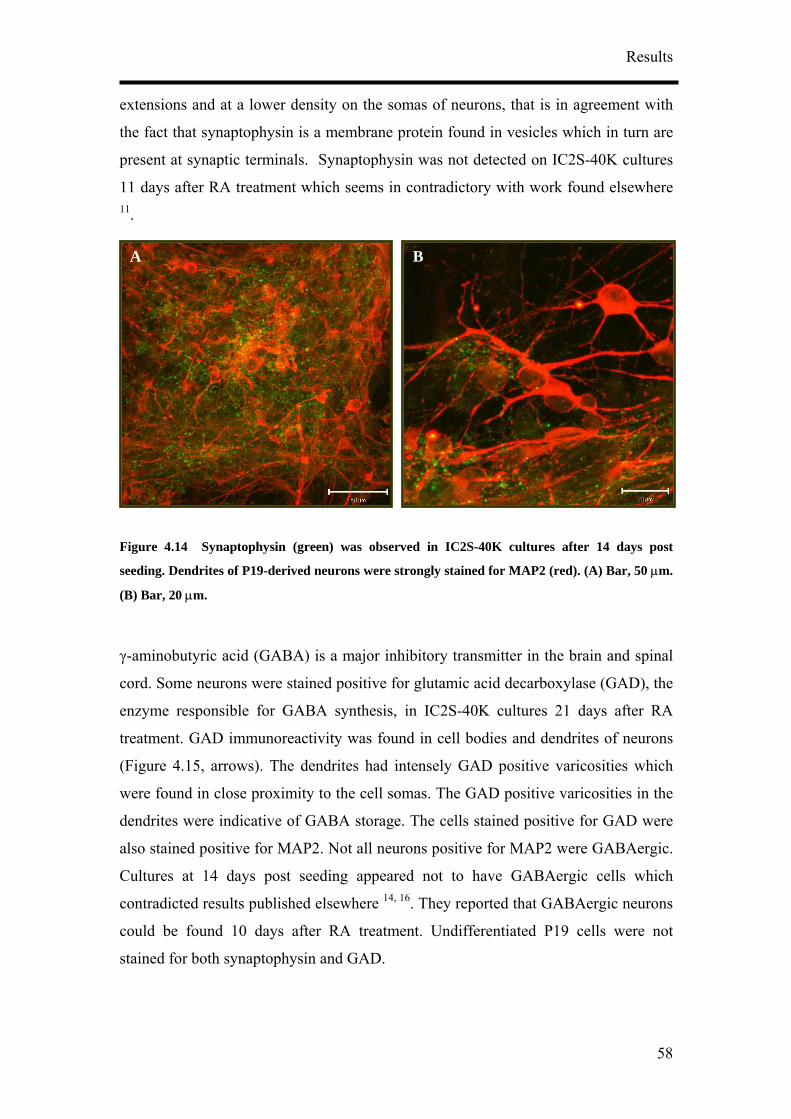
Results
extensions and at a lower density on the somas of neurons, that is in agreement with
the fact that synaptophysin is a membrane protein found in vesicles which in turn are
present at synaptic terminals. Synaptophysin was not detected on IC2S-40K cultures
11 days after RA treatment which seems in contradictory with work found elsewhere 11.
Figure 4.14 Synaptophysin (green) was observed in IC2S-40K cultures after 14 days post
seeding. Dendrites of P19-derived neurons were strongly stained for MAP2 (red). (A) Bar, 50 µm.
(B) B
20 µm.
γ-aminobutyric acid (GABA) is a major inhibitory transmitter in the brain and spinal
cord. Some neurons were stained positive for glutamic acid decarboxylase (GAD), the
enzyme responsible for GABA synthesis, in IC2S-40K cultures 21 days after RA
treatment. GAD immunoreactivity was found in cell bodies and dendrites of neurons
(Figure 4.15, arrows). The dendrites had intensely GAD positive varicosities which
were found in close proximity to the cell somas. The GAD positive varicosities in the
e for MAP2. Not all neurons positive for MAP2 were GABAergic.
ultures at 14 days post seeding appeared not to have GABAergic cells which
ar,
dendrites were indicative of GABA storage. The cells stained positive for GAD were
also stained positiv
C
contradicted results published elsewhere 14, 16. They reported that GABAergic neurons
could be found 10 days after RA treatment. Undifferentiated P19 cells were not
stained for both synaptophysin and GAD.
BA
58
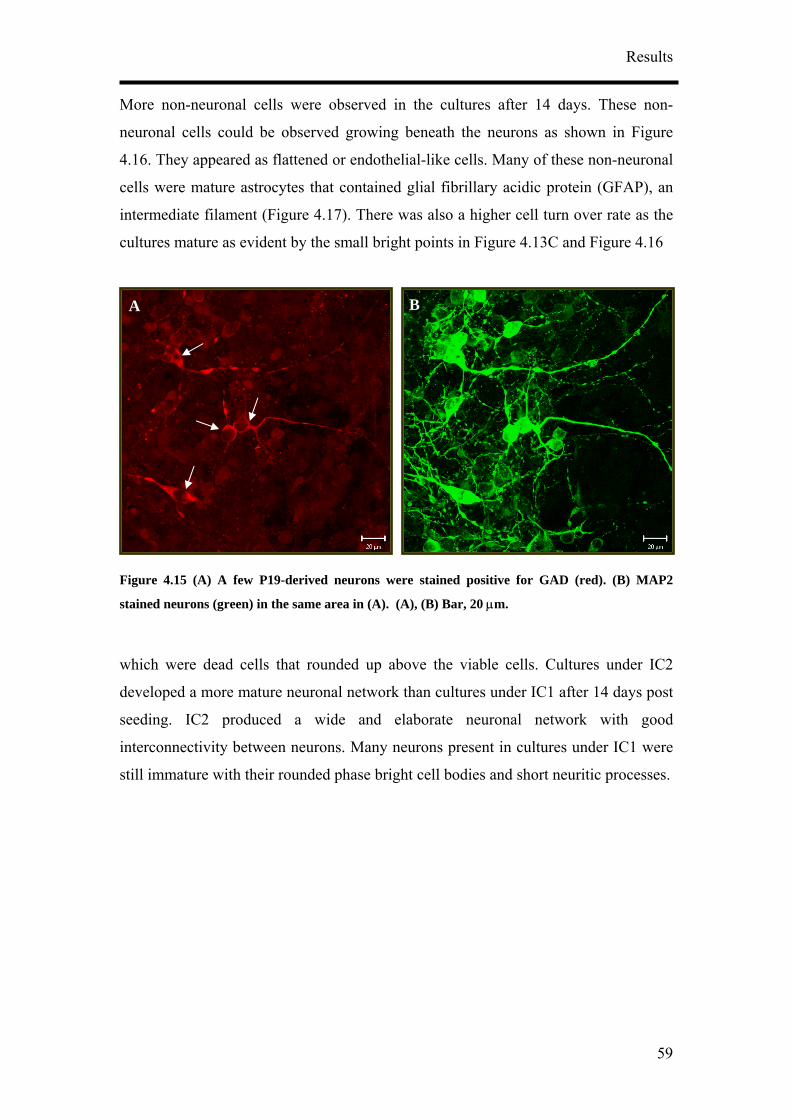
Results
More non-neuronal cells were observed in the cultures after 14 days. These non-
neuronal cells could be observed growing beneath the neurons as shown in Figure
4.16. They appeared as flattened or endothelial-like cells. Many of these non-neuronal
cells were mature astrocytes that contained glial fibrillary acidic protein (GFAP), an
intermediate filament (Figure 4.17). There was also a higher cell turn over rate as the
reen) in the same area in (A). (A), (B) Bar, 20 µm.
cultures mature as evident by the small bright points in Figure 4.13C and Figure 4.16
Figure 4.15 (A) A few P19-derived neurons were stained positive for GAD (red). (B) MAP2
stained neurons (g
which were dead cells that rounded up above the viable cells. Cultures under IC2
developed a more mature neuronal network than cultures under IC1 after 14 days post
seeding. IC2 produced a wide and elaborate neuronal network with good
interconnectivity between neurons. Many neurons present in cultures under IC1 were
still immature with their rounded phase bright cell bodies and short neuritic processes.
BA
59
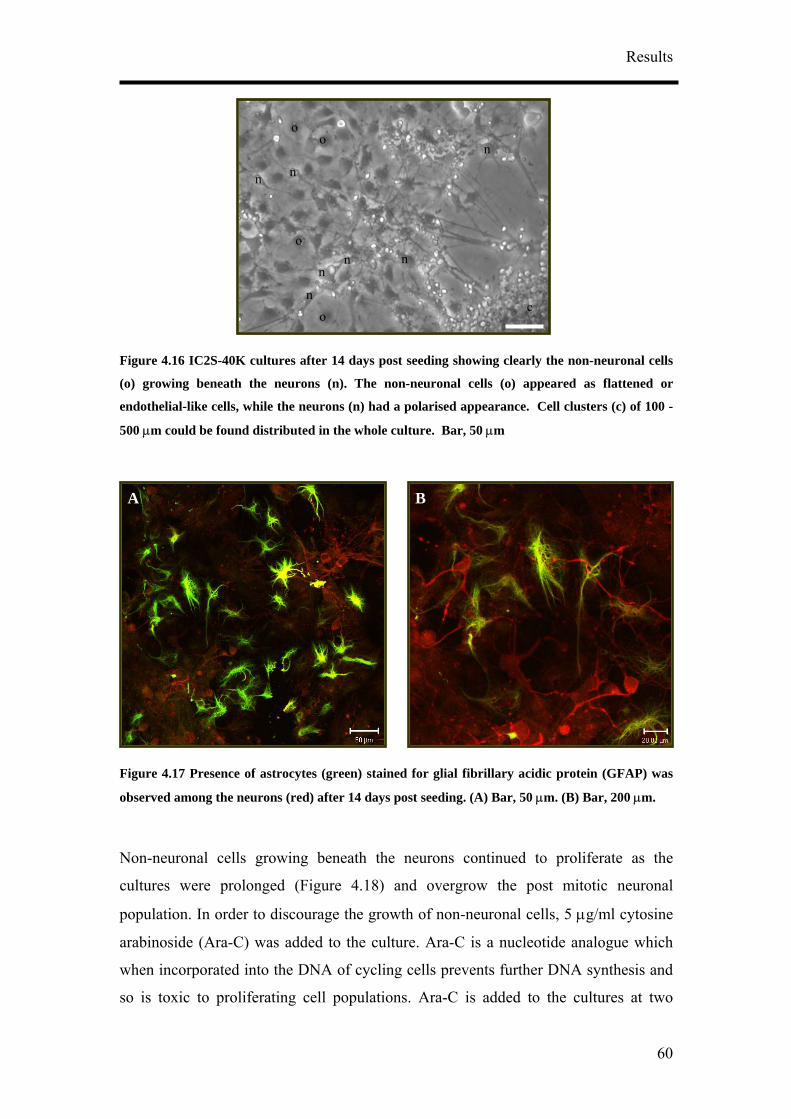
Results
Figure 4.16 IC2S-40K cultures after 14 days post seeding showing clearly the non-neuronal cells
(o) growing beneath the neurons (n). The non-neuronal cells (o) appeared as flattened or
endothelial-like cells, while the neurons (n) had a polarised appearance. Cell clusters (c) of 100 -
500 µm could be found distributed in the whole culture. Bar, 50 µm
bserved among the neurons (red) after 14 days post seeding. (A) Bar, 50 µm. (B) Bar, 200 µm.
Non-neuronal cells growing beneath the neurons continued to proliferate as the
cultures were prolonged (Figure 4.18) and overgrow the post mitotic neuronal
population. In order to discourage the growth of non-neuronal cells, 5 µg/ml cytosine
arabinoside (Ara-C) was added to the culture. Ara-C is a nucleotide analogue which
when incorporated into the DNA of cycling cells prevents further DNA synthesis and
so is toxic to proliferating cell populations. Ara-C is added to the cultures at two
Figure 4.17 Presence of astrocytes (green) stained for glial fibrillary acidic protein (GFAP) was
o
A B
n n
o
o
no
n n
n o
n
c
60
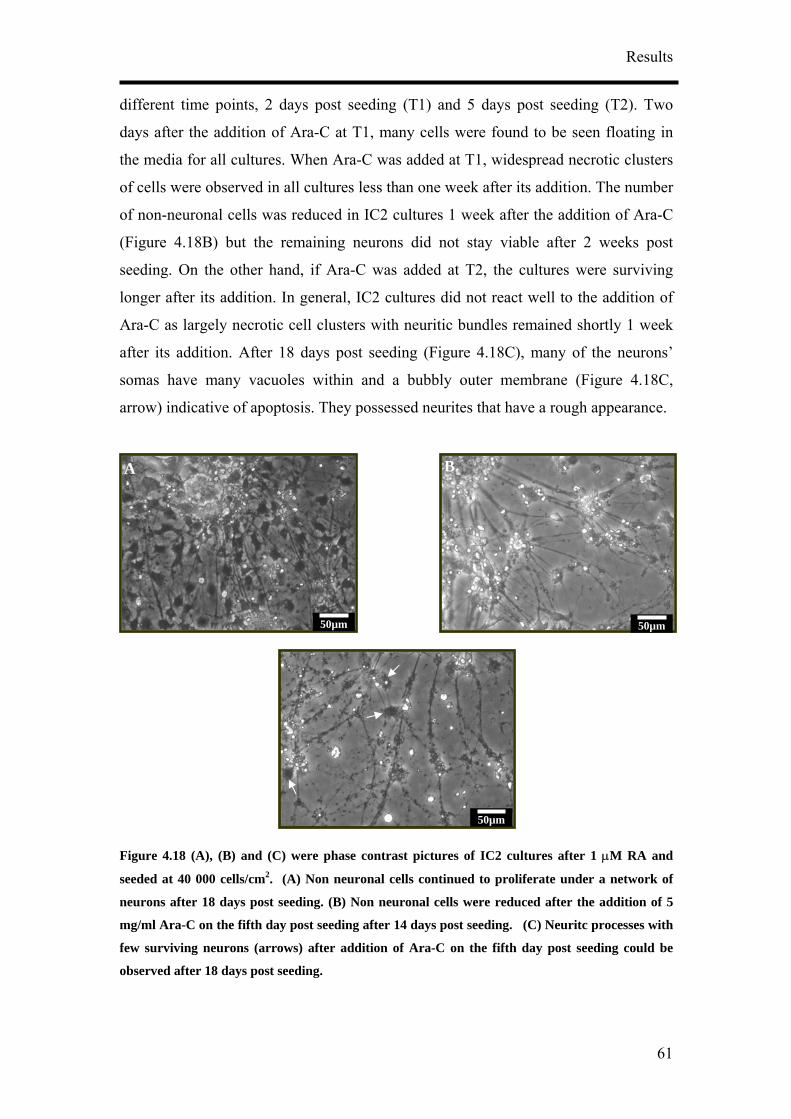
Results
different time points, 2 days post seeding (T1) and 5 days post seeding (T2). Two
days after the addition of Ara-C at T1, many cells were found to be seen floating in
the media for all cultures. When Ara-C was added at T1, widespread necrotic clusters
of cells were observed in all cultures less than one week after its addition. The number
of non-neuronal cells was reduced in IC2 cultures 1 week after the addition of Ara-C
(Figure 4.18B) but the re
ining neurons did not stay viable after 2 weeks post
seeding. On the other hand, if Ara-C was added at T2, the cultures were surviving
longer after its addition. In general, IC2 cultures did not react well to the addition of
Ara-C as largely necrotic cell clusters with neuritic bundles remained shortly 1 week
ma
after its addition. After 18 days post seeding (Figure 4.18C), many of the neurons’
somas have many vacuoles within and a bubbly outer membrane (Figure 4.18C,
arrow) indicative of apoptosis. They possessed neurites that have a rough appearance.
Figure 4.18 (A), (B) and (C) were phase contrast pictures of IC2 cultures after 1 µM RA and
seeded at 40 000 cells/cm2. (A) Non neuronal cells continued to proliferate under a network of
neurons after 18 days post seeding. (B) Non neuronal cells were reduced after the addition of 5
mg/ml Ara-C on the fifth day post seeding after 14 days post seeding. (C) Neuritc processes with
few surviving neurons (arrows) after addition of Ara-C on the fifth day post seeding could be
observed after 18 days post seeding.
50µm 50µm
B
50µm
A
61
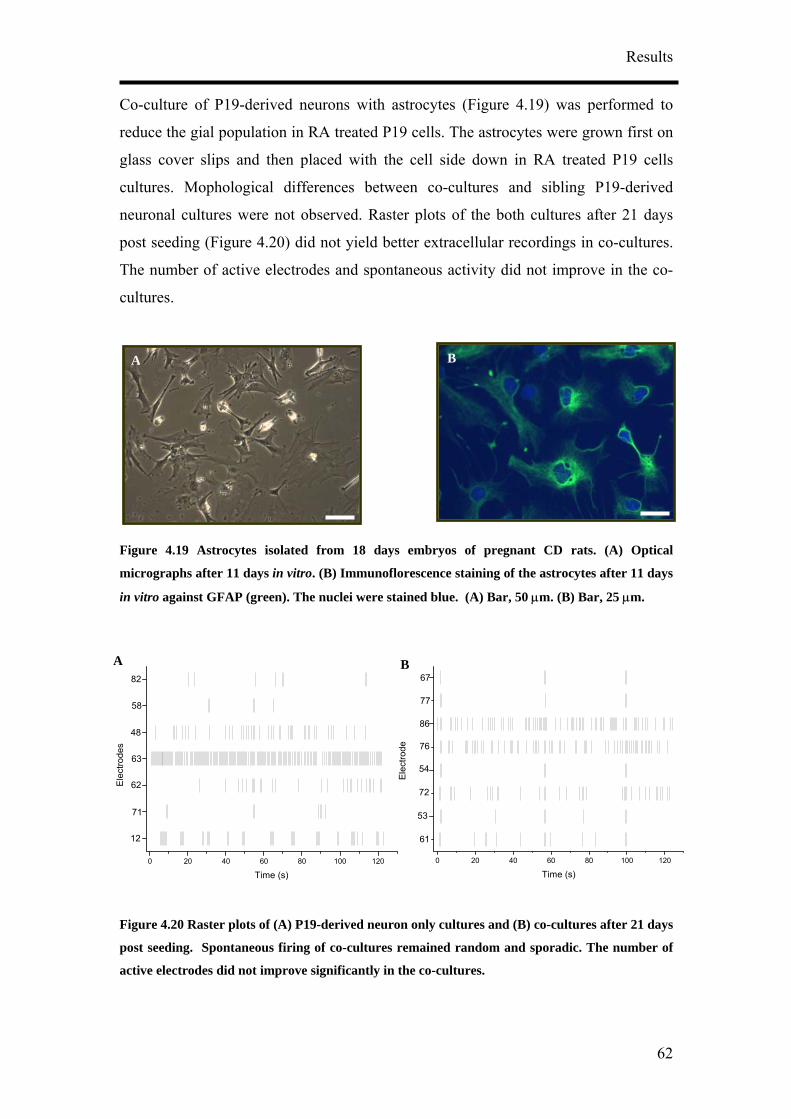
Results
Co-culture of P19-derived neurons with astrocytes (Figure 4.19) was performed to
reduce the gial population in RA treated P19 cells. The astrocytes were grown first on
glass cover slips and then placed with the cell side down in RA treated P19 cells
cultures. Mophological differences between co-cultures and sibling P19-derived
neuronal cultures were not observed. Raster plots of the both cultures after 21 days
post seeding (Figure 4.20) did not yield better extracellular recordings in co-cultures.
The number of active electrodes and spontaneous activity did not improve in the co-
cultures.
Figure 4.19 Astrocytes isolated from 18 days embryos of pregnant CD rats. (A) Optical
micrographs after 11 days in vitro. (B) Immunoflorescence staining of the astrocytes after 11 days
in vitro against GFAP (green). The nuclei were stained blue. (A) Bar, 50 µm. (B) Bar, 25 µm.
ificantly in the co-cultures.
Figure 4.20 Raster plots of (A) P19-derived neuron only cultures and (B) co-cultures after 21 days
post seeding. Spontaneous firing of co-cultures remained random and sporadic. The number of
active electrodes did not improve sign
A B
0 20 40 60 80 100 120
Elec
trode
s
12
71
62
63
48
58
82
A
Time (s)0 20 40 60 80 100 120
Elec
trode
61
53
72
54
76
86
77
67B
Time (s)
62
Results
The non-neuronal cells appeared to be present in a relatively high number in the IC2S-
40K cultures. To reduce the non-neuronal cell population, P19 cells should not be
allowed to be passaged too many times. A master stock of passage 1 P19 cells was
frozen and they were allowed to be expanded in vitro up to the maximum of four
passages before the differentiation. Thereafter, the culture is restarted from the master
stock. It was found that in this way the number of non-neuronal cells in IC2S-40K
cultures was kept low.
Neurons in IC2S-40K cultures were shown to be able to form a more mature neuronal
4.1.3
RA treated P19 cells. Different types of coated surfaces were next explored in this
ection to improve the adherence of P19-derived neurons on the MEAs as well as to
Laminin is the major noncollagenous glycoprotein component of basement
the laminin molecule, was
phenotype in terms of more sophisticated neuritic networks, synaptic formations 14
days after RA treatment and their capability of synthesising and storing GABA.
Cell culture surface coating
4.1.3.1 Morphology
Up till now only PDL was applied on the culture surfaces for the attachment of the
s
further enhance the maturation of the neurons obtained. P19 cells were differentiated
into neurons according to method IC2S-40K.
The culture surfaces were coated with 3 different combinations of polymers. Laminin
(LN) only, Poly-d-lysine-laminin (PDL-LN) and polyethyleneimine-laminin (PEI-LN)
were coated on glass coverslips and MEAs prior to seeding the differentiated P19
cells. The molecular weight of PEI used was 70 000 while that of PDL used was 70 –
150 kDa.
membranes and is a mediator of cell adhesion, migration, growth and differentiation.
Cys-laminin A chain, a fragment between 2091 – 2108 of
63
Results
used in this study. This IKVAV containing segment of laminin has been found to
promote neurite formation 57-59.
It was found that the initial attachment of neurons on laminin only coated cover slip
surfaces was bad. Few neurons were attached. The 16 amino acid long laminin
fragment has been known not to adsorb well to glass surfaces. Therefore, to coat this
laminin fragment on glass surfaces, a polyelectrolyte would be first needed to cover
e glass surfaces. PDL and PEI were both positively charged.
rived
eurons cultured on PDL coated surfaces which were not stained positive for
ynaptophysin after 11 days. Large cell clusters in PDL-LN coated cultures were
observed detaching from the surface. There appear to be much lesser non-neuronal
lls PDL-LN and PEI-LN coated cultures (Figure
A, B). Punctuate synaptophysin were found apposition to
endrites stained positive for MAP2, following along the contours of the dendritic
g of synaptophysin in PEI-LN cultures
s observed by the larger sizes of synaptophysin positive structures in these cultures.
th
P19-derived neurons cultured on PDL-LN and PEI-LN coated surfaces were stained
positive for synaptophysin after just 8 days post seeding in contrast to P19-de
n
s
ce after 14 days post seeding in both
4.21A and Figure 4.22
d
extensions (Figure 4.21B, C and Figure 4.22C, D). Cell clusters present in both
cultures were densely stained positive for synaptophysin (Figure 4.21B and Figure
4.22E). PEI-LN coated cultures appeared to have a higher density of synaptophysin in
regions outside the cell clusters when compared to PDL (Figure 4.14) and PDL-LN
cultures. There appeared to be larger clusterin
a
These synaptophysin clusters indicated that the clustering of synaptic vesicles most
probably at synaptic terminals occurred for the release of neurotransmitters.
64
Results
Figure 4.21 (A) P19-derived neurons cultured on PDL-LN coated coverslips after 14 days post
seeding. Synaptophysin (green) was observed in PDL-LN coated cultures after 14 days post
seeding (B). Dendrites of P19-derived neurons were strongly stained for MAP2 (red). (C) is larger
magnification of (B). (A) Bar, 100 µm. (B) and (C) Bar, 20 µm.
A
B C
65
Results
A B
C D
Figure 4.22 (A), (B) P19-derived neurons cultured on PEI-LN coated coverslips after 14 days post
seeding. Synaptophysin (green) was observed in PEI-LN coated cultures after 14 days post
seeding (C) and (D). (D) is a larger magnification of (C). Dendrites of P19-derived neurons were
strongly stained for MAP2 (red). (A) Bar, 100 µm. (B) Bar, 50 µm. (C), (D) and (E) Bar, 20 µm.
E
66
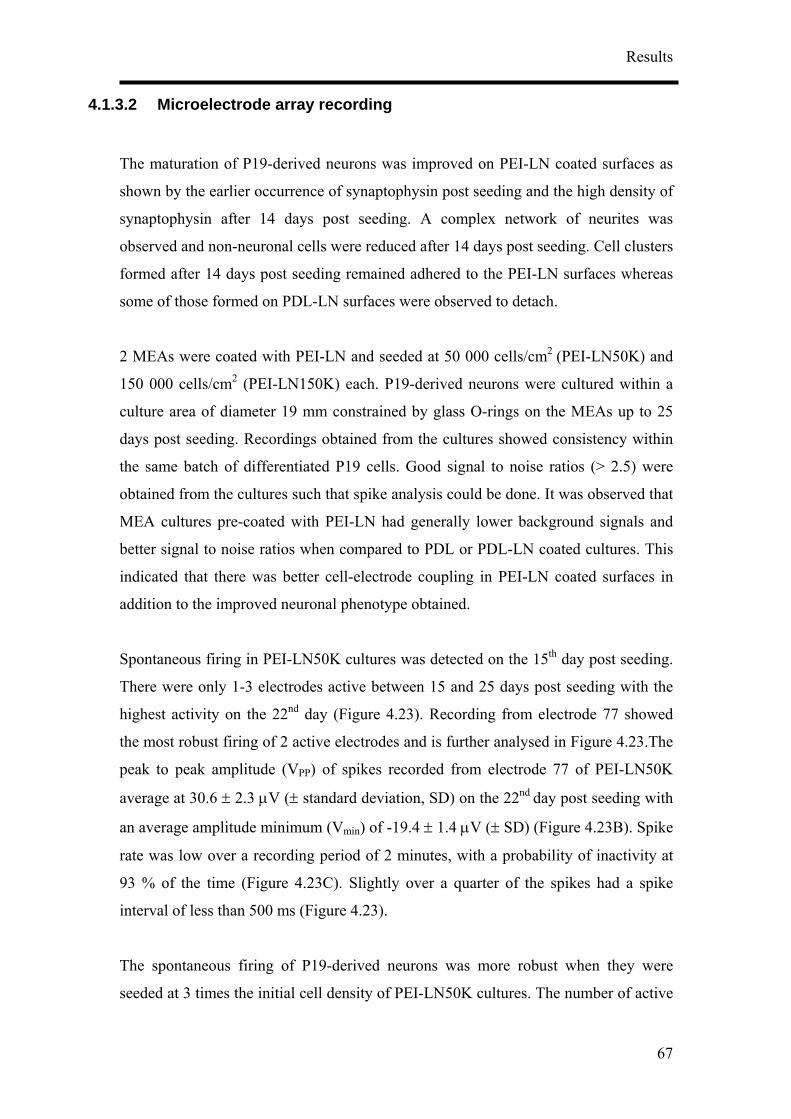
Results
4.1.3.2 Microelectrode array recording
The maturation of P19-derived neurons was improved on PEI-LN coated surfaces as
shown by the earlier occurrence of synaptophysin post seeding and the high density of
synaptophysin after 14 days post seeding. A complex network of neurites was
observed and non-neuronal cells were reduced after 14 days post seeding. Cell clusters
formed after 14 days post seeding remained adhered to the PEI-LN surfaces whereas
some of those formed on PDL-LN surfaces were observed to detach.
2 MEAs were coated with PEI-LN and seeded at 50 000 cells/cm2 (PEI-LN50K) and
150 000 cells/cm2 (PEI-LN150K) each. P19-derived neurons were cultured within a
culture area of diameter 19 mm constrained by glass O-rings on the MEAs up to 25
days post seeding. Recordings obtained from the cultures showed consistency within
the same batch of differentiated P19 cells. Good signal to noise ratios (> 2.5) were
obtained from the cultures such that spike analysis could be done. It was observed that
MEA cultures pre-coated with PEI-LN had generally lower background signals and
better signal to noise ratios when compared to PDL or PDL-LN coated cultures. This
indicated that there was better cell-electrode coupling in PEI-LN coated surfaces in
addition to the improved neuronal phenotype obtained.
Spontaneous firing in PEI-LN50K cultures was detected on the 15th day post seeding.
There were only 1-3 electrodes active between 15 and 25 days post seeding with the
highest activity on the 22nd day (Figure 4.23). Recording from electrode 77 showed
the most robust firing of 2 active electrodes and is further analysed in Figure 4.23.The
peak to peak amplitude (VPP) of spikes recorded from electrode 77 of PEI-LN50K
average at 30.6 ± 2.3 µV (± standard deviation, SD) on the 22nd day post seeding with
an average amplitude minimum (Vmin) of -19.4 ± 1.4 µV (± SD) (Figure 4.23B). Spike
rate was low over a recording period of 2 minutes, with a probability of inactivity at
93 % of the time (Figure 4.23C). Slightly over a quarter of the spikes had a spike
interval of less than 500 ms (Figure 4.23).
The spontaneous firing of P19-derived neurons was more robust when they were
eeded at 3 times the initial cell density of PEI-LN50K cultures. The number of active s
67
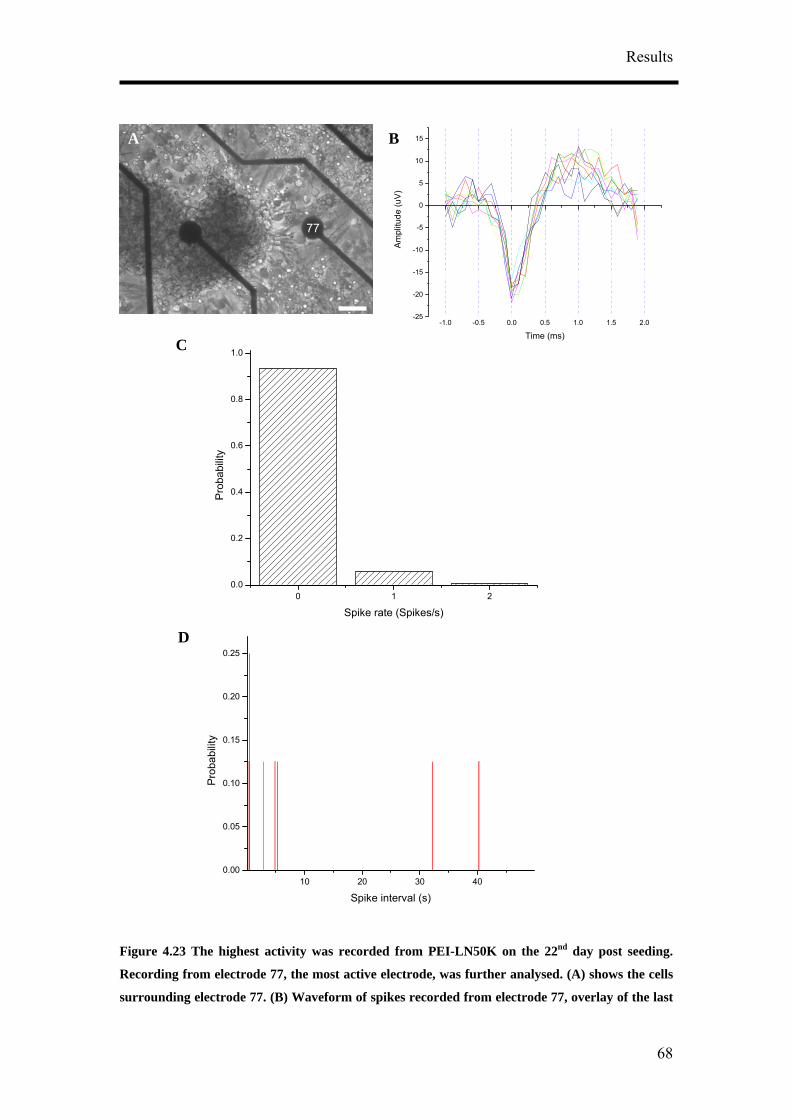
Results
gure 4.23 The highest activity was recorded from PEI-LN50K on the 22nd day post seeding. Fi
Recording from electrode 77, the most active electrode, was further analysed. (A) shows the cells
surrounding electrode 77. (B) Waveform of spikes recorded from electrode 77, overlay of the last
0 1 20.0
0.2
0.4
0.6
0.8
1.0
Pro
babi
lity
Spike rate (Spikes/s)
10 20 30 400.00
0.05
0.15
0.20
0.25
0.10Pro
babi
lity
Spike interval (s)
77
A
D
B
C -1.0 -0.5 0.0 0.5 1.0 1.5 2.0
-25
15
-20
-15
-10
-5
0
5
10
Am
plitu
de (u
V)
Time (ms)
68
Results
50 spikes. Probability of spike rate (C) and (D) spike interval of electrode 77 over 2 minutes were
plotted. (A) Bar, 50 µm
electrodes increased significantly (F
10 – 16 electrodes after 18 days post seeding fo
000 cells/cm2. Spontaneous synchronised activ
cultures on the 17th day post seedin
4.25A). A recording from electrode 73 of
seeding is shown in Figure 4.25. The V
20th day post seeding averaged at 44.7
Vmin obtained from the same electrode was -23.4 ± 3.3 µV (± SD). The Vmin recorded
across all active electrodes from PEI-LN150K cultures ranged from -18.9 to -32.7 µV
on the 20th post seeding. The population of neurons growing on electrode 73 appeared
to be inhomogenous as seen from the different spike forms with significant
differences in amplitudes and temporal events (Figure 4.25B). Electrode 73 has a
more random firing pattern compared to the other 10 electrodes (Figure 4.25A). The
more homogenous waveform recorded from electrode 63 relative to electrode 73 is
shown in Figure 4.26. A wider range of spike rate was recorded from electrode 73.
The maximum spike rate recorded was 90 spikes/s (Figure 4.25C) with 25 % of the
recording time of 2 minutes registering at 1 spike/s (Figure 4.25C insert). 87 % of the
spikes occurring had a spike interval of less than 100 ms (Figure 4.25D).
Electrodes that were active in both PEI-LN50K and PEI-LN150K cultures were
usually under cell clusters or in the close proximity of these cell clusters (Figure
4.23A, Figure 4.24). After 14 days post seeding PEI-LN150K cultures were especially
confluent and many more cell clusters were observed dispersed randomly throughout
the MEA surfaces as compared to PEI-LN50K cultures.
igure 4.24). Recordings could be obtained from
r the 2 MEAs that were seeded at 150
ity was observed in PEI-LN150K
g continuing into the 25th day of culture (Figure
PEI-LN150K cultures on the 20th day post
PP of spikes recorded from electrode 73 on the
± 9.9 µV (± SD) (Figure 4.25B). The average
69
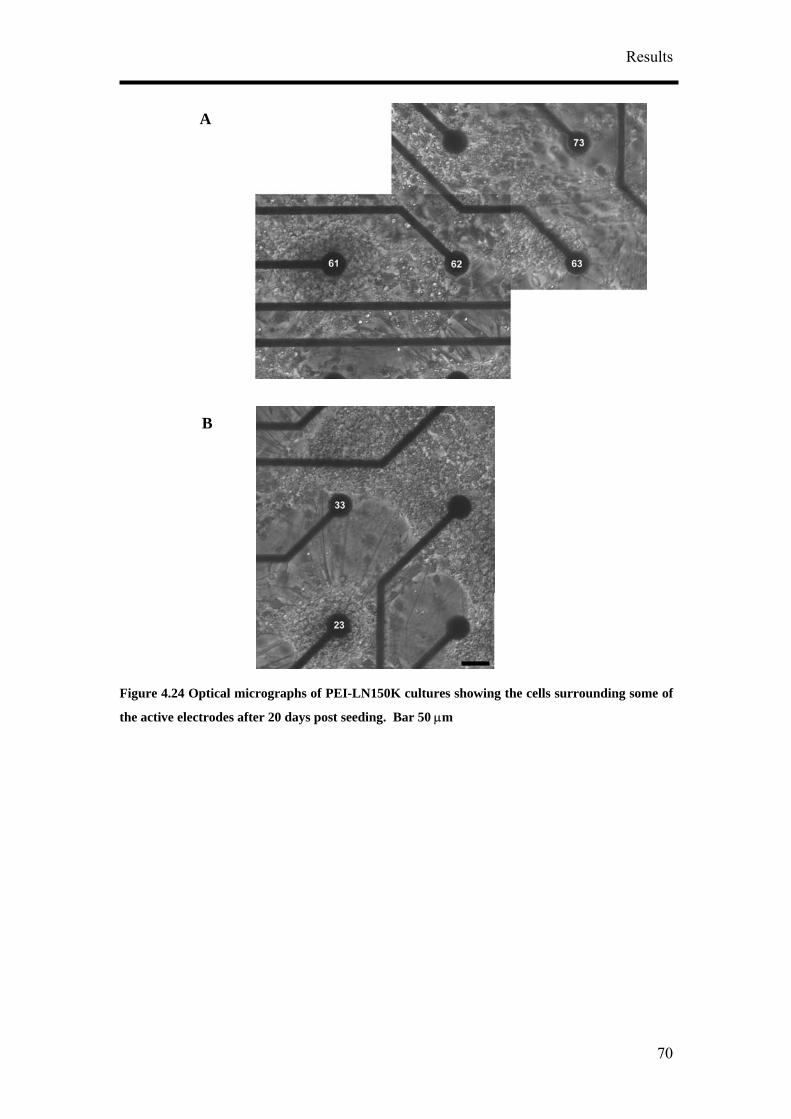
Results
igure 4.24 Optical micrographs of PEI-LN150K cultures showing the cells surrounding some of F
the active electrodes after 20 days post seeding. Bar 50 µm
A
B
70
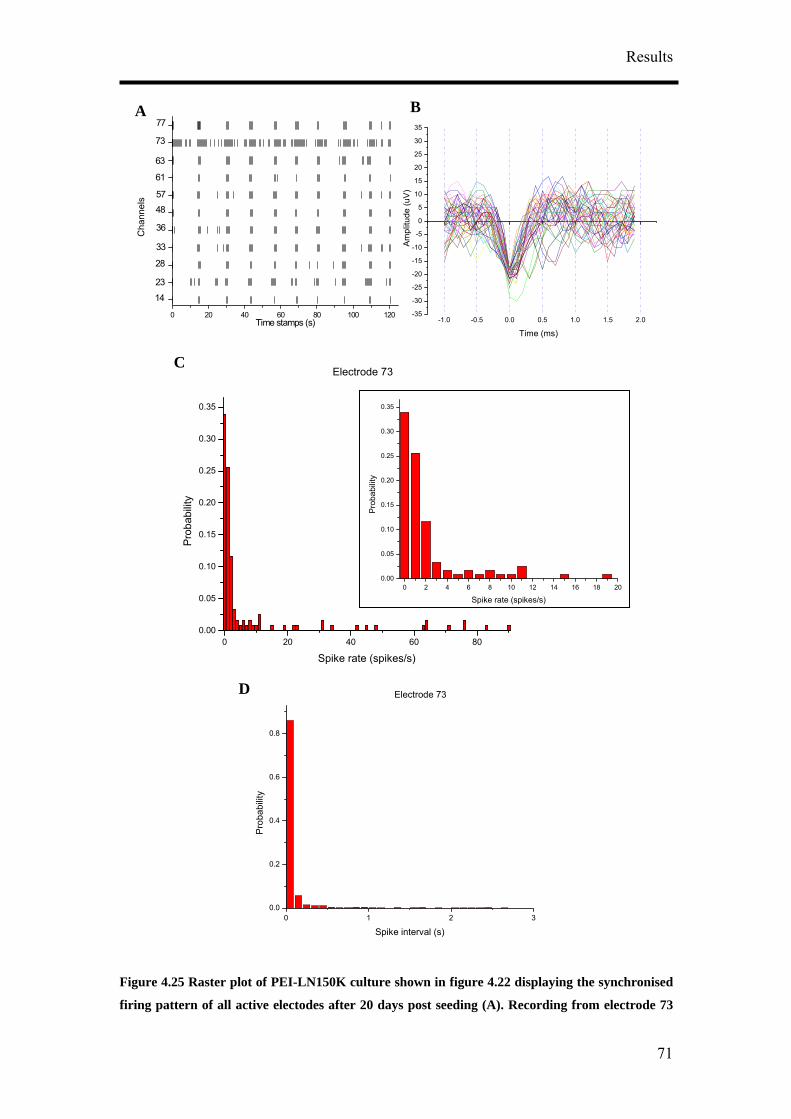
Results
C
0 20 40 60 800.00
0.05
0.10
0.15
0.20
0.25
0.30
0.35
Prob
abili
ty
Spike rate (spikes/s)
Electrode 73
0 2 4 6 8 10 12 14 16 18 200.00
0.05
0.10
0.15
0.20
0.25
0.30
0.35
Prob
abili
ty
Spike rate (spikes/s)
A B
0 20 40 60 80 100 120
Cha
nnel
s
14
23
28
33
36
57
61
73
77
63
48
Time stamps (s) -1.0 -0.5 0.0 0.5 1.0 1.5 2.0-35
-30
-25
-20
-15
-10
-5
0
5
10
15
20
25
30
35
Ampl
itude
(uV
)
Time (ms)
D Electrode 73
Figure 4.25 Raster plot of PEI-LN150K culture shown in figure 4.22 displaying the synchronised
firing pattern of all active electodes after 20 days post seeding (A). Recording from electrode 73
0 1 2 30.0
0.2
0.4
0.6
0.8
Pro
babi
lity
Spike interval (s)
71
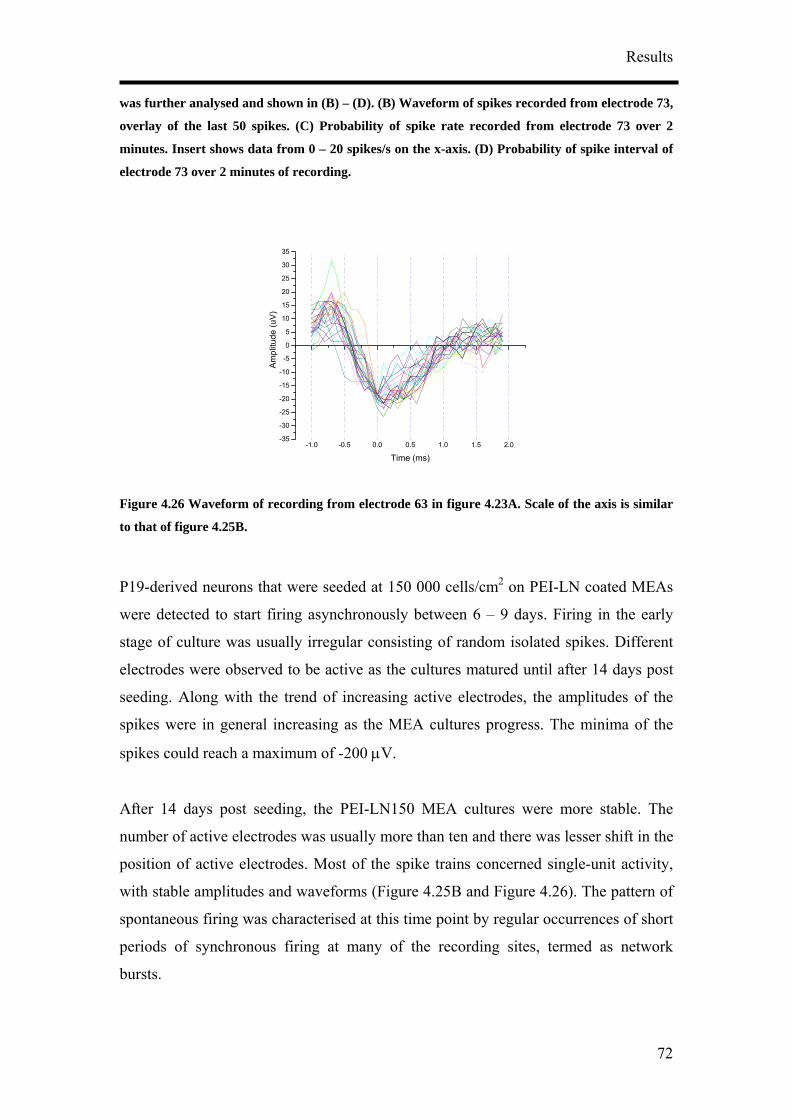
Results
s fu
a
wa rther analysed and shown in (B) – (D). (B eform of spikes recorded from electrode 73,
overl y of the last 50 spikes. (C) Probability of spike rate recorded from electrode 73 over 2
minutes. Insert shows data from 0 – 20 spikes/s on the x-axis. (D) Probability of spike interval of
electrode 73 over 2 minutes of recording.
Figure 4.26 Waveform of recording from electrode 63 in figure 4.23A. Scale of the axis is similar
to that of figure 4.25B.
P19-derived neurons that were seeded at 150 000 cells/cm2 on PEI-LN coated MEAs
were detected to start firing asynchronously between 6 – 9 days. Firing in the early
stage of culture was usually irregular consisting of random isolated spikes. Different
electrodes were observed to be active as the cultures matured until after 14 days post
seeding. Along with the trend of increasing active electrodes, the amplitudes of the
spikes were in general increasing as the MEA cultures progress. The minima of the
spikes could reach a maximum of -200 µV.
After 14 days post seeding, the PEI-LN150 MEA cultures were more stable. The
number of active electrodes was usually more than ten and there was lesser shift in the
position of active electrodes. Most of the spike trains concerned single-unit activity,
with stable amplitudes and waveforms (Figure 4.25B and Figure 4.26). The pattern of
spontaneous firing was characterised at this time point by regular occurrences of short
periods of synchronous firing at many of the recording sites, termed as network
) Wav
-1.0 -0.5 0.0 0.5 1.0 1.5 2.0-35
-30
-25
-20
-15
-10
-5
0
5
10
15
20
25
30
35
Am
plitu
de (u
V)
Time (ms)
bursts.
72
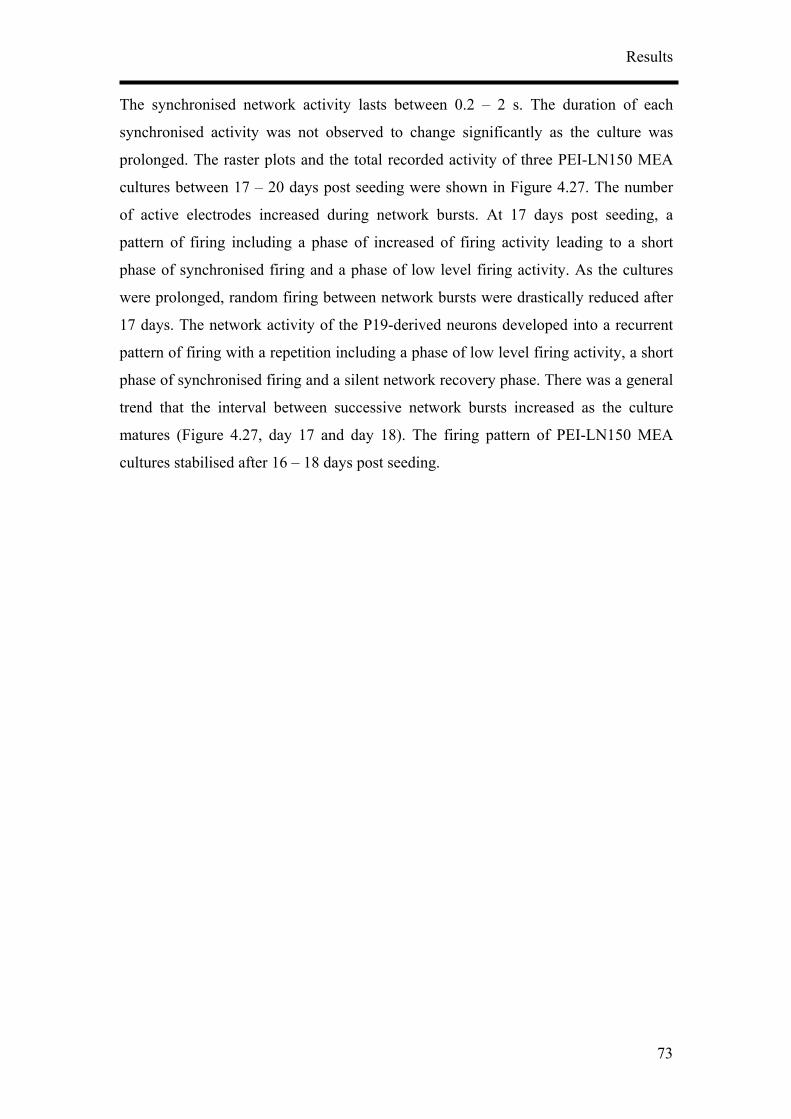
Results
The synchronised network activity lasts between 0.2 – 2 s. The duration of each
synchronised activity was not observed to change significantly as the culture was
prolonged. The raster plots and the total recorded activity of three PEI-LN150 MEA
cultures between 17 – 20 days post seeding were shown in Figure 4.27. The number
f active electrodes increased during network bursts. At 17 days post seeding, a
o
pattern of firing including a phase of increased of firing activity leading to a short
phase of synchronised firing and a phase of low level firing activity. As the cultures
were prolonged, random firing between network bursts were drastically reduced after
17 days. The network activity of the P19-derived neurons developed into a recurrent
pattern of firing with a repetition including a phase of low level firing activity, a short
phase of synchronised firing and a silent network recovery phase. There was a general
trend that the interval between successive network bursts increased as the culture
matures (Figure 4.27, day 17 and day 18). The firing pattern of PEI-LN150 MEA
cultures stabilised after 16 – 18 days post seeding.
73
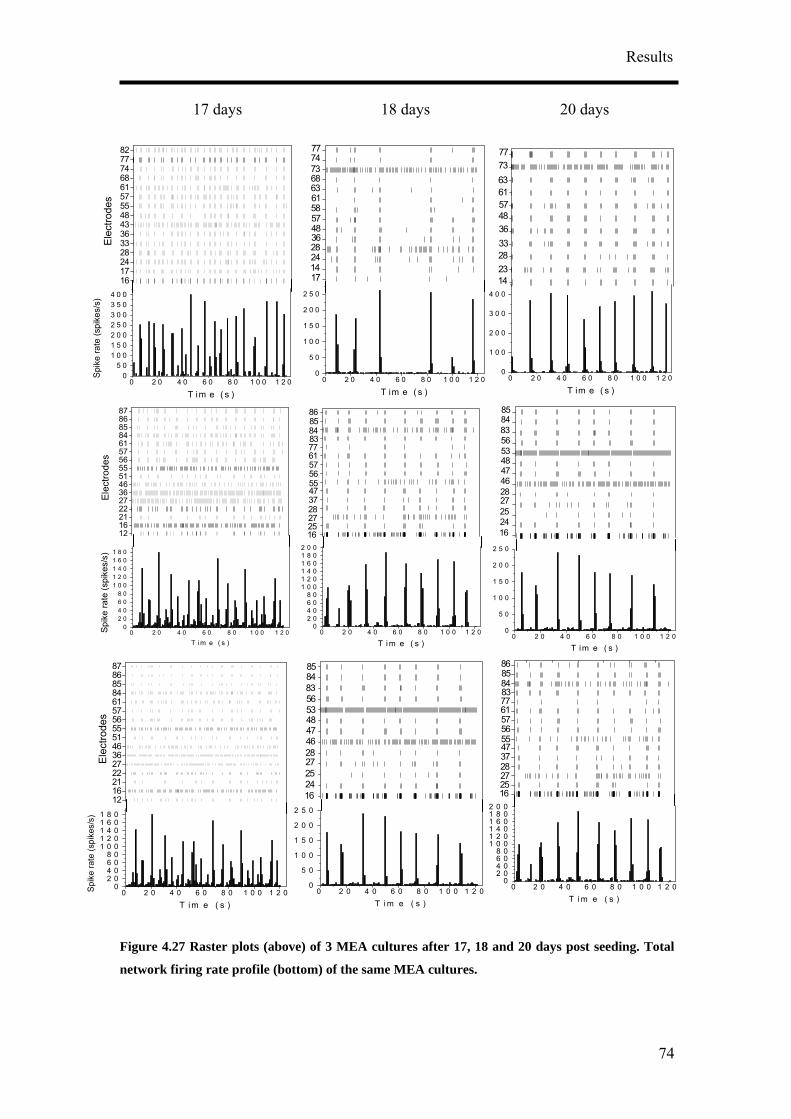
Results
17 days 18 days 20 days
0 2 0 4 0 6 0 8 0 1 0 0 1 2 00
1 0 0
2 0 0
3 0 0
4 0 0
T im e ( s )0 2 0 4 0 6 0 8 0 1 0 0 1 2 0
0
5 0
1 0 0
1 5 0
2 0 0
2 5 0
T im e ( s )
17142428364857
616368
7477
73
58
0 2 0 4 0 6 0 8 0 1 0 0 1 2 00
2 04 06 08 0
1 0 01 2 01 4 01 6 01 8 02 0 0
T im e ( s )
16252728
4755
37
Figure 4.27 Raster plots (above) of 3 MEA cultures after 17, 18 and 20 days post seeding. Total
network firing rate profile (bottom) of the same MEA cultures.
5657617783848586
16252728
47555657617783848586
37
0 2 0 4 0 6 0 8 0 1 0 0 1 2 00
2 04 06 08 0
1 0 01 2 01 4 01 6 01 8 02 0 0
T i m e ( s )
16
252728
47485356838485
24
46
0 2 0 4 0 6 0 8 0 1 0 0 1 2 00
5 0
1 0 0
1 5 0
2 0 0
2 5 0
T i m e ( s )
16
252728
474853
24
46
56838485
0 2 0 4 0 6 0 8 0 1 0 0 1 2 00
5 0
1 0 0
1 5 0
2 0 0
2 5 0
T im e ( s )
0 2 0 4 0 6 0 8 0 1 0 0 1 2 00
0 05 00 05 00 05 00 0
5 01122334
T im e ( s )
Spi
ke ra
te (s
pike
s/s)
161724283336434855576168747782
Elec
trode
s
1423283336
5761
7377
63
48
0 2 0 4 0 6 0 8 0 1 0 0 1 2 00
2 04 06 08 0
1 0 01 2 01 4 01 6 01 8 0
Spik
e ra
te (s
pike
s/s)
T i m e ( s )
12162122273646515556576184858687
Ele
ctro
des
12162122273646515556576184858687
Elec
trode
s
0 2 0 4 0 6 0 8 0 1 0 0 1 2 00
2 04 06 08 0
1 0 01 2 01 4 01 6 01 8 0
Spik
e ra
te (s
pike
s/s)
T im e ( s )
74
Results
4.2 Response of P19-de Ne k to
rentiate into neurons by suspending them for 4 days in
dia. They were seeded as single cells at a density of 150
on PEI-LN coated MEAs. Robust spiking was observed usually
the central nervous system are γ-aminobutyric acid
The effects of these neurotransmitters and their antagonists
s, their agonists and antagonists
onolayer culture since P19-derived neurons
se cultures are shallow three dimensional layers in
al processes and may generate drug
Therefore, to observe the effects of different drugs on the
d neuronal network, continuous recording of between 2
After 12 -14 days post seeding, half of the media in the
gh metabolism of the cells as seen in the
cator within the media from orange-pink to yellow after 1
. The media in the MEAs was changed 24
the day recording was done the MEAs
the incubator and connected to the amplifier and incubation unit.
s immediately recorded. A half medium
is is referred to as the reference state.
test substance comprised of the native state,
ition of test substance and wash state in order to exclude
– 30 minutes. Half medium
washes were performed to remove the test substances so as to minimise wash induced
rived uronal Networ
Neurotransmitters
P19 cells were induced to diffe
1 µM RA supplemented me
000 cells/cm2
between 17 – 26 days post seeding.
The major neurotransmitters of
(GABA) and glutamate.
are investigated in the following sections.
4.2.1 Effects of neurotransmitter
P19-derived neurons do not form a m
tended to form cell clusters. The
which glia are found below and above neur
concentration gradients.
three dimensional P19-derive
to 3 hours would be necessary.
MEAs had to be changed daily due to the hi
colour change of the pH-indi
day indicating acidification of the medium
hours the day before recording was done. On
were removed from
The native state of the MEA cultures wa
change was done before the addition of drugs; th
A complete measurement with the
reference state, the add
possible systematic baseline trends in electrophysiological activity during long-time
measurements. Each state was measured for between 20
75
Results
damages to the cells. When the neuronal spontaneous activity was not returned to the
reference state after washing of the test substance was performed their activity was
then referred to as a new state. The native state was measured to compare with the
ference state.
t investigated. Figure 4.28A shows the spike rate
er second taken at 10s bins recorded continuously from six among thirteen active
re represented the general activity of the
ulture, following closely the activity trend recorded at the individual electrode
larger standard deviation in MSR (1.09 spikes/s) in the native state was due to the
ynchronized network firing of MEA culture with little spontaneous activity in
re
Before studying the responses of P19-derived neurons to the drugs, the stability of
recording over a period of 2 hours and also after the addition of DMSO in which some
of the drugs were dissolved was firs
p
electrodes of one MEA culture after 17 days post seeding in the native state, reference
state and for 60 minutes after the half medium change. The mean spike rate (MSR) for
all active electrodes for one MEA cultu
c
(Figure 4.28B). In the native state, the MSR of the network had a large variance. The
s
between the synchronized activity as seen in the raster plot in Figure 4.29A. Higher
spike rates from twelve of the thirteen electrodes were obtained in the reference state.
A decrease in spike rate was recorded from one electrode after the half medium
change. There was an initial surge in spike rate directly after the half medium change
which gradually decreased to a new state in the next 30 minutes. The initial surge in
spike rate was due to the change in the ion concentration of the culture medium in the
MEA. This sensitivity to sudden medium changes has been reported by Gross et al.45
as well. They have shown that such sensitivity is not due to mechanical effect but by
unknown factors in different media such as glucose levels, amino acid concentrations
and hormones which affect the spontaneous activity. The MSR during the native state
was 0.80 ± 1.09 spikes/s (± standard deviation) and that 20 - 30 minutes after the half
medium change was 1.18 ± 0.39 spikes/s which was not significantly different than
that of the native state (P > 0.05, n = 13). The standard deviation of the MSR dropped
from 1.09 to 0.39 spikes/s during that same period. The raster plot between 27 – 30
minutes after the half medium change revealed that the firing pattern was random with
some synchrony in the reference state (Figure 4.29B). At 30 – 40 minutes after the
half medium change, the MSR of 0.83 ± 0.36 spikes/s was similar to that of the native
76

Results
state (P > 0.05, n = 13). The MSR was further maintained at the native state level
between 40 – 50 minutes after the half medium change. The MSR 30 – 50 minutes
after the half medium change was within 10 % of the MSR of the native state.
Thereafter, the MSR continued to decrease at a slower rate until the recording was
topped after two hours. The recording of the MEA appeared to stabilise 30 minutes s
after the half medium change.
77
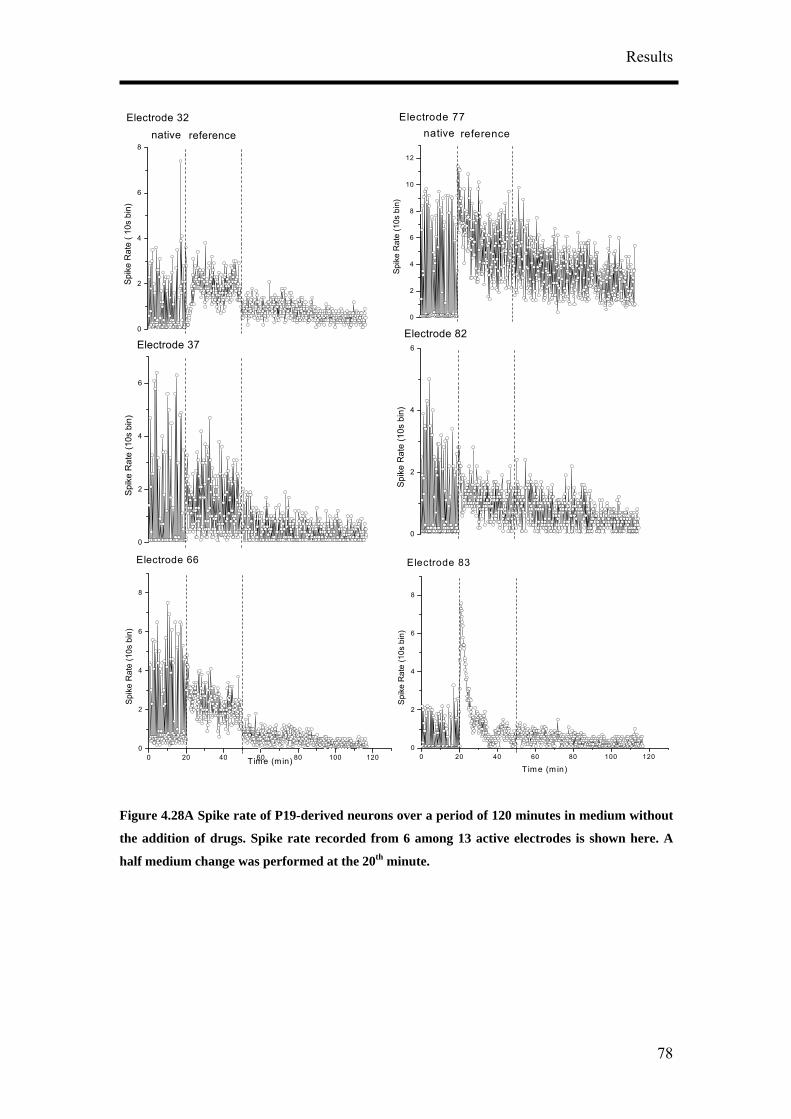
Results
Figure 4.28A Spike rate of P19-derived neurons over a period of 120 minutes in medium without
the addition of drugs. Spike rate recorded from 6 among 13 active electrodes is shown here. A
half medium change was performed at the 20th minute.
0
2
4
6
8
10
12
Spik
e R
ate
(10s
bin
)
Electrode 77native reference
0
2
4
6
Electrode 82
Spi
ke R
ate
(10s
bin
)
0 20 40 60 80 100 1200
2
4
6
8
Electrode 83
Spi
ke R
ate
(10s
bin
)
T ime (m in)
0
2
4
6
Electrode 37
Spi
ke R
ate
(10s
bin
)
0
2
4
6
8
Spi
ke R
ate
( 10s
bin
)Electrode 32
referencenative
0 20 40 60 80 100 1200
2
4
6
8
Electrode 66
Time (min)
Spi
ke R
ate
(10s
bin
)
78
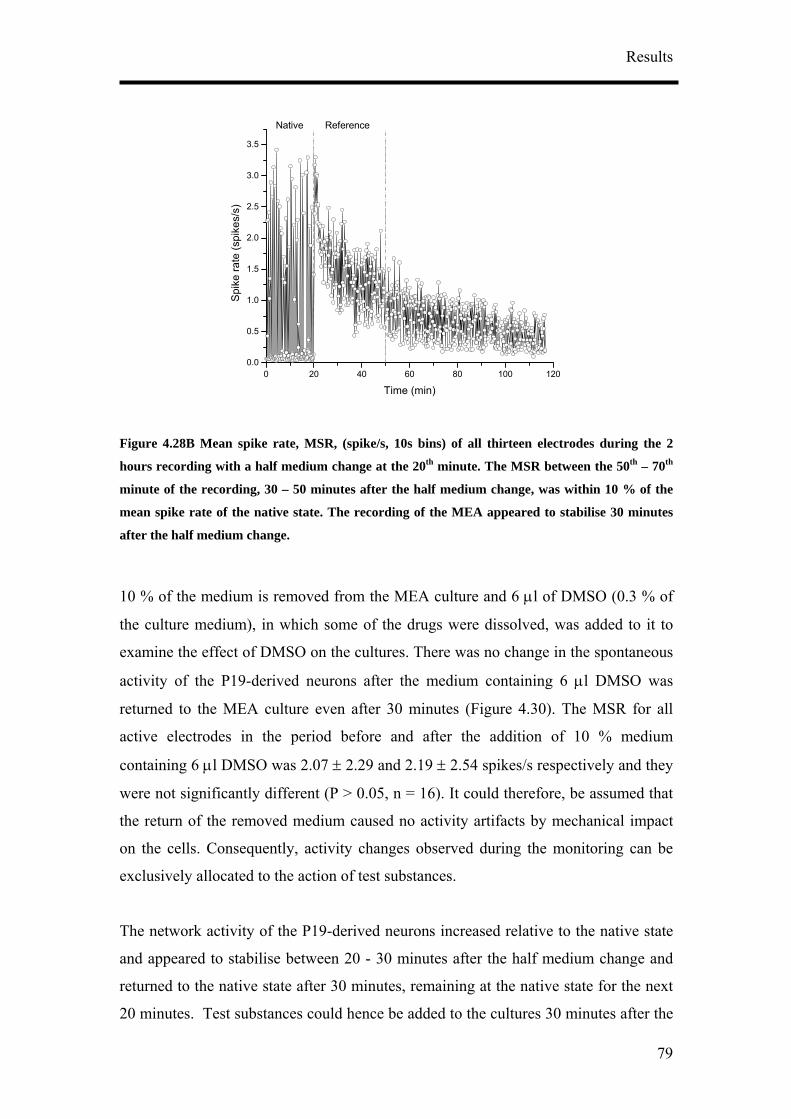
Results
Figure 4.28B Mean spike rate, MSR, (spike/s, 10s bins) of all thirteen electrodes during the 2
hours recording with a half medium change at the 20th minute. The MSR between the 50th – 70th
minute of the recording, 30 – 50 minutes after the half medium change, was within 10 % of the
mean spike rate of the native state. The recording of the MEA appeared to stabilise 30 minutes
after the half medium change.
10 % of the medium is removed from the MEA culture and 6 µl of DMSO (0.3 % of
the culture medium), in which some of the drugs were dissolved, was added to it to
examine the effect of DMSO on the cultures. There was no change in the spontaneous
activity of the P19-derived neurons after the medium containing 6 µl DMSO was
returned to the MEA culture even after 30 minutes (Figure 4.30). The MSR for all
active electrodes in the period before and after the addition of 10 % medium
containing 6 µl DMSO was 2.07 ± 2.29 and 2.19 ± 2.54 spikes/s respectively and they
were not significantly different (P > 0.05, n = 16). It could therefore, be assumed that
the return of the removed medium caused no activity artifacts by mechanical impact
on the cells. Consequently, activity changes observed during the monitoring can be
exclusively allocated to the action of test substances.
The network activity of the P19-derived neurons increased relative to the native state
and appeared to stabilise between 20 - 30 minutes after the half medium change and
returned to the native state after 30 minutes, remaining at the native state for the next
20 minutes. Test substances could hence be added to the cultures 30 minutes after the
0 20 40 60 80 100 1200.0
0.5
1.0
1.5
2.0
2.5
3.0
3.5
Spi
ke ra
te (s
pike
s/s)
Time (min)
Native Reference
79
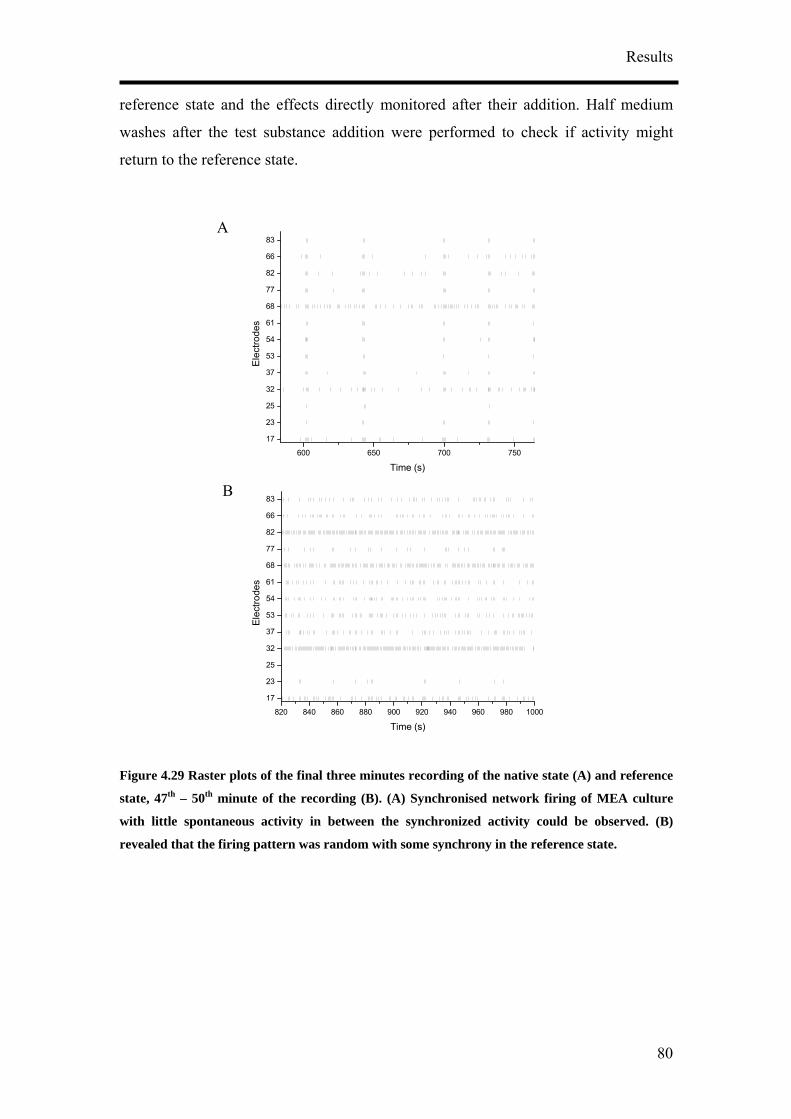
Results
reference state and the effects directly monitored after their addition. Half medium
washes after the test substance addition were performed to check if activity might
return to the reference state.
Figure 4.29 Raster plots of the final three minutes recording of the native state (A) and reference
state, 47th – 50th minute of the recording (B). (A) Synchronised network firing of MEA culture
with little spontaneous activity in between the synchronized activity could be observed. (B)
revealed that the firing pattern was random with some synchrony in the reference state.
600 650 700 750
17
23
25
32
37
53
54
61
68
77
82
66
83
Ele
ctro
des
A
Time (s)
B
820 840 860 880 900 920 940 960 980 1000
17
23
25
32
37
53
54
61
68
77
82
66
83
Elec
trode
s
Time (s)
80
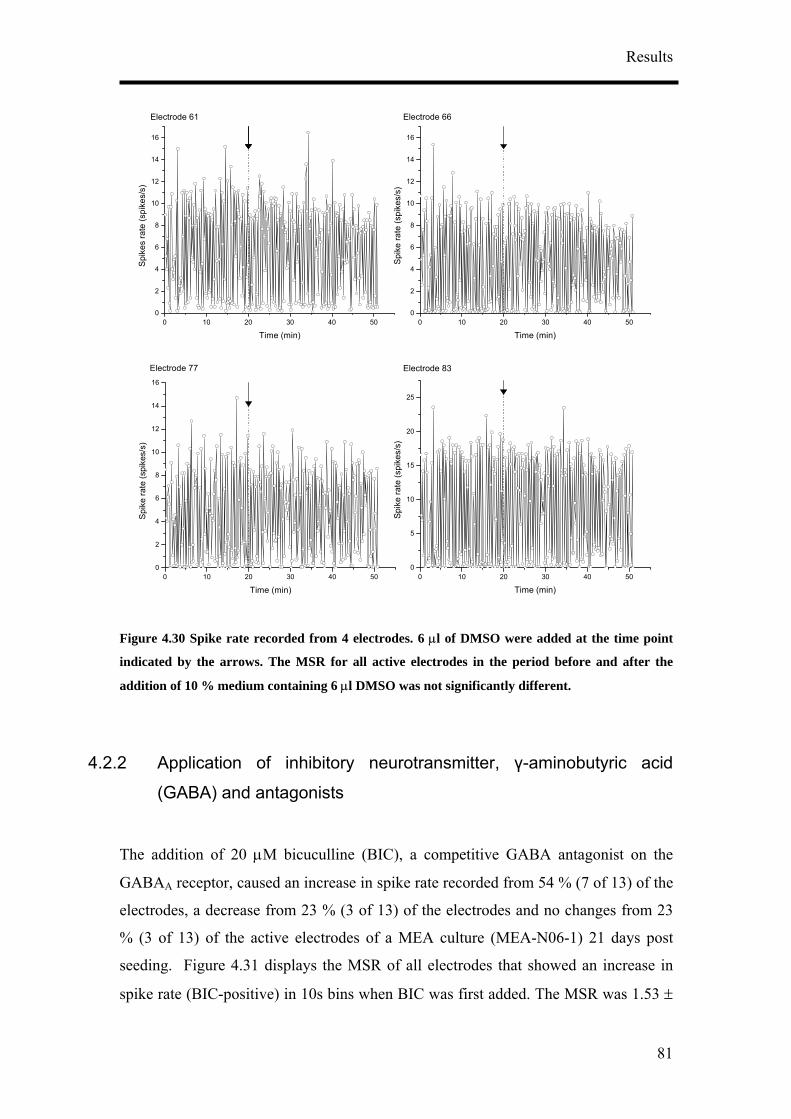
Results
Figure 4.30 Spike rate recorded from 4 electrodes. 6 µl of DMSO were added at the time point
indicated by the arrows. The MSR for all active electrodes in the period before and after the
addition of 10 % medium containing 6 µl DMSO was not significantly different.
4.2.2 Application of inhibitory neurotransmitter, γ-aminobutyric acid
A ) of the
lectrodes, a decrease from 23 % (3 of 13) of the electrodes and no changes from 23
% (3 of 13) of the active electrodes of a MEA culture (MEA-N06-1) 21 days post
seeding. Figure 4.31 displays the MSR of all electrodes that showed an increase in
spike rate (BIC-positive) in 10s bins when BIC was first added. The MSR was 1.53 ±
0 10 20 30 40 50
(GABA) and antagonists
The addition of 20 µM bicuculline (BIC), a competitive GABA antagonist on the
GABA receptor, caused an increase in spike rate recorded from 54 % (7 of 13
e
0
2
4
6
8
10
12
14
16S
pike
s ra
te (s
pike
s
Time (min)
/s)
Electrode 61 Electrode 66
0 10 20 30 40 500
2
4
6
8
10
12
14
16
Spi
ke ra
te (s
pike
s/s)
Time (min)
0 10 20 30 40 500
5
10
15
20
25Sp
ike
rate
(spi
kes/
s)
Time (min)
Electrode 83
0 10 20 30 40 500
2
4
6
8
10
12
14
16
Time (min)
Spi
ke ra
te (s
pike
s/s)
Electrode 77
81
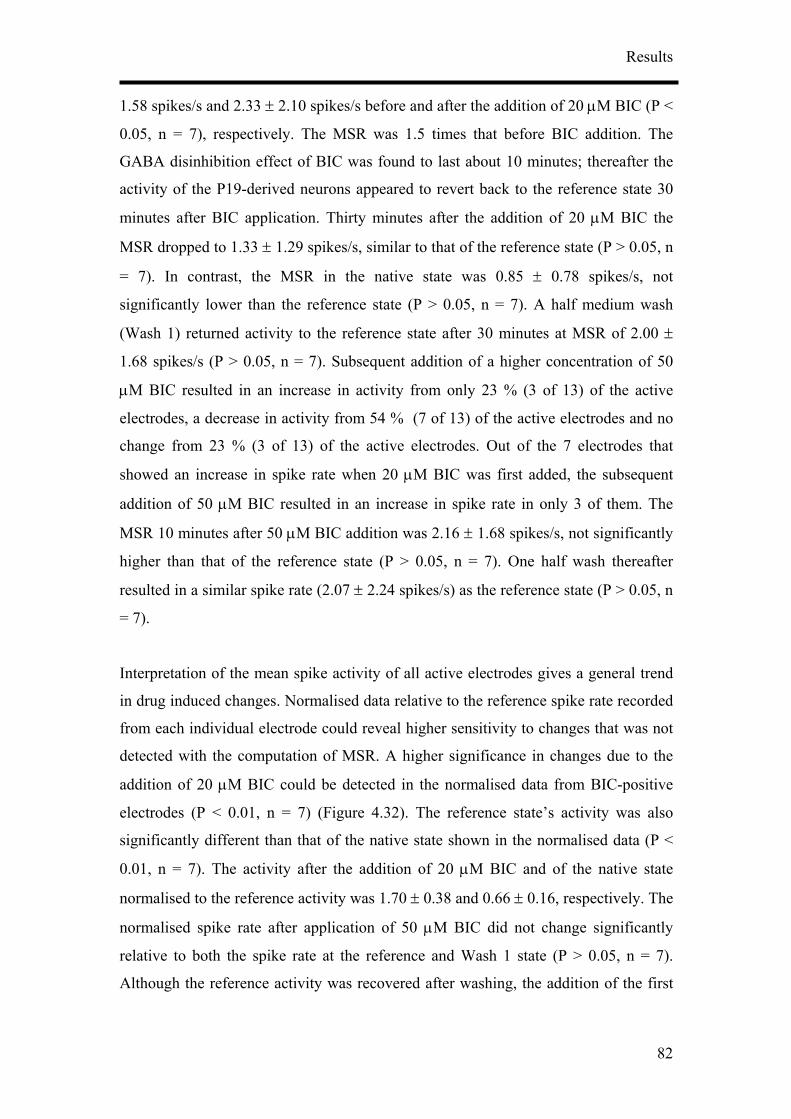
Results
1.58 spikes/s and 2.33 ± 2.10 spikes/s before and after the addition of 20 µM BIC (P <
0.05, n = 7), respectively. The MSR was 1.5 times that before BIC addition. The
GABA disinhibition effect of BIC was found to last about 10 minutes; thereafter the
activity of the P19-derived neurons appeared to revert back to the reference state 30
minutes after BIC application. Thirty minutes after the addition of 20 µM BIC the
MSR dropped to 1.33 ± 1.29 spikes/s, similar to that of the reference state (P > 0.05, n
= 7). In contrast, the MSR in the native state was 0.85 ± 0.78 spikes/s, not
significantly lower than the reference state (P > 0.05, n = 7). A half medium wash
(Wash 1) returned activity to the reference state after 30 minutes at MSR of 2.00 ±
1.68 spikes/s (P > 0.05, n = 7). Subsequent addition of a higher concentration of 50
µM BIC resulted in an increase in activity from only 23 % (3 of 13) of the active
electrodes, a decrease in activity from 54 % (7 of 13) of the active electrodes and no
change from 23 % (3 of 13) of the active electrodes. Out of the 7 electrodes that
showed an increase in spike rate when 20 µM BIC was first added, the subsequent
addition of 50 µM BIC resulted in an increase in spike rate in only 3 of them. The
MSR 10 minutes after 50 µM BIC addition was 2.16 ± 1.68 spikes/s, not significantly
higher than that of the reference state (P > 0.05, n = 7). One half wash thereafter
resulted in a similar spike rate (2.07 ± 2.24 spikes/s) as the reference state (P > 0.05, n
= 7).
in drug induced changes. Normalised data relative to the reference spike rate recorded
om each individual electrode could reveal higher sensitivity to changes that was not
additi tected in the normalised data from BIC-positive
electrodes (P < 0.01, n = 7) (Figure 4.32). The reference state’s activity was also
of the native state shown in the normalised data (P <
Interpretation of the mean spike activity of all active electrodes gives a general trend
fr
detected with the computation of MSR. A higher significance in changes due to the
on of 20 µM BIC could be de
significantly different than that
0.01, n = 7). The activity after the addition of 20 µM BIC and of the native state
normalised to the reference activity was 1.70 ± 0.38 and 0.66 ± 0.16, respectively. The
normalised spike rate after application of 50 µM BIC did not change significantly
relative to both the spike rate at the reference and Wash 1 state (P > 0.05, n = 7).
Although the reference activity was recovered after washing, the addition of the first
82
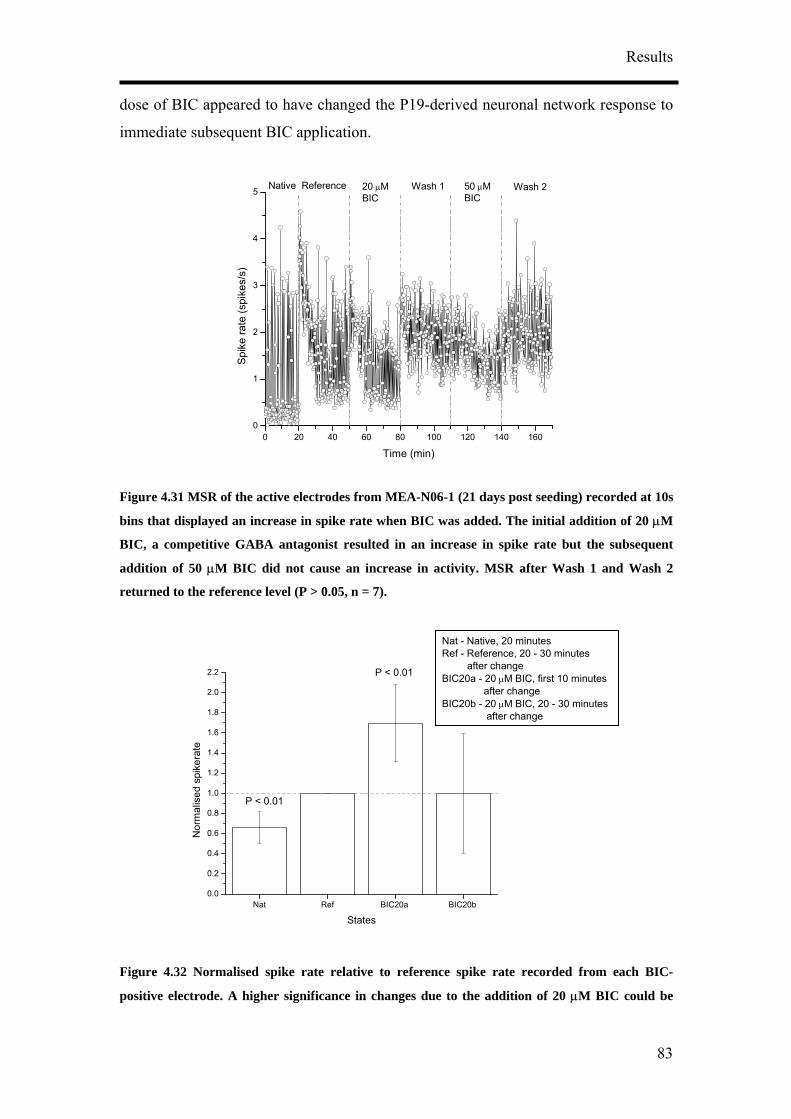
Results
dose of BIC appeared to have changed the P19-derived neuronal network response to
immediate subsequent BIC application.
Figure 4.31 MSR of the active electrodes from MEA-N06-1 (21 days post seeding) recorded at 10s
bins that displayed an increase in spike rate when BIC was added. The initial addition of 20 µM
BIC, a competitive GABA antagonist resulted in an increase in spike rate but the subsequent
addition of 50 µM BIC did not cause an increase in activity. MSR after Wash 1 and Wash 2
returned to the reference level (P > 0.05, n = 7).
0 20 40 60 80 100 120 140 160
Figure 4.32 Normalised spike rate relative to reference spike rate recorded from each BIC-
positive electrode. A higher significance in changes due to the addition of 20 µM BIC could be
0
1
2
3
4
5 50 µMBIC
Spi
ke ra
te (s
pike
s/s)
Time (min)
Native Reference 20 µMBIC
Wash 1 Wash 2
Nat Ref BIC20a BIC20b 0.0
0.2
0.6
0.8
1.0
1.2
1.4
1.6
1.8
2.0
2.2
0.4
Nat - Native, 20 minutesRef - Reference, 20 - 30 minutes after changeBIC20a - 20 µM BIC, first 10 minutes after changeBIC20b - 20 µM BIC, 20 - 30 minutes after change
P < 0.01
Nor
mal
ised
spi
kera
te
States
P < 0.01
83
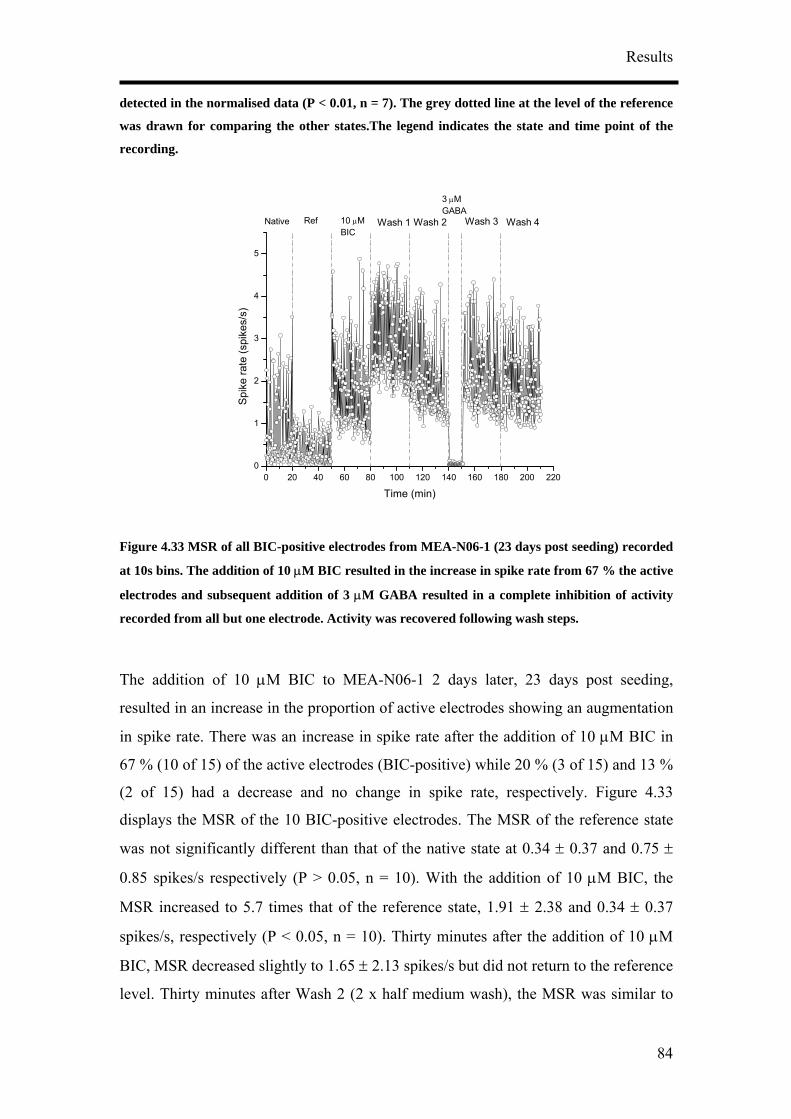
Results
detected in the normalised data (P < 0.01, n = 7). The grey dotted line at the level of the reference
was drawn for comparing the other states.The legend indicates the state and time point of the
recording.
BA resulted in a complete inhibition of activity
recorded from all but one electrode. Activity was recovered following wash steps.
The addition of 10 µM BIC to MEA-N06-1 2 days later, 23 days post seeding,
resulted in an increase in the proportion of active electrodes showing an augmentation
in spike rate. There was an increase in spike rate after the addition of 10 µM BIC in
67 % (10 of 15) of the active electrodes (BIC-positive) while 20 % (3 of 15) and 13 %
(2 of 15) had a decrease and no change in spike rate, respectively. Figure 4.33
displays the MSR of the 10 BIC-positive electrodes. The MSR of the reference state
was not significantly different than that of the native state at 0.34 ± 0.37 and 0.75 ±
0.85 spikes/s respectively (P > 0.05, n = 10). With the addition of 10 µM BIC, the
MSR increased to 5.7 times that of the reference state, 1.91 ± 2.38 and 0.34 ± 0.37
spikes/s, respectively (P < 0.05, n = 10). Thirty minutes after the addition of 10 µM
Figure 4.33 MSR of all BIC-positive electrodes from MEA-N06-1 (23 days post seeding) recorded
at 10s bins. The addition of 10 µM BIC resulted in the increase in spike rate from 67 % the active
electrodes and subsequent addition of 3 µM GA
BIC, MSR decreased slightly to 1.65 ± 2.13 spikes/s but did not return to the reference
level. Thirty minutes after Wash 2 (2 x half medium wash), the MSR was similar to
0 20 40 60 80 100 120 140 160 180 200 2200
1
2
3
4
5
3 µMGABA
Wash 4Wash 3Wash 2
Spi
ke ra
te (s
pike
s/s)
Native Ref 10 µMBIC
Wash 1
Time (min)
84
Results
that after 10 µM BIC at 1.63 ± 3.22 spikes/s (P > 0.05, n = 10). BIC seemed to have
changed the firing activity of the P19-derived neurons after its addition since 2 half
medium washes did not return activity to the reference state. The spontaneous firing
recorded from all active electrodes except one was inhibited (MSR = 0.036 ± 0.051
spikes/s, n = 14) with the addition of 3 µM GABA at the 140th minute. That single
electrode recorded an increase in spike rate when 3 µM GABA was added.
Spontaneous activity recorded from all BIC-positive electrodes was inhibited when 3
µM GABA was added at the 140th minute (MSR = 0.041 ± 0.060 spikes/s, n = 10),
indicating the presence of GABAergic neurons containing GABAA receptors.
Subsequent wash (Wash 3) returned activity to MSR of 1.72 ± 3.30 spikes/s similar to
the MSR prior to GABA treatment (P > 0.05, n = 10). MSR remained at this level
until the 210th minute of recording.
Recording from a different MEA culture (MEA-A07-2) is shown in Figure 4.34.
Muscimol, a GABA agonist at GABAA receptors, was added at 3 µM to two MEA
cultures, MEA-A07-2 and MEA-A07-3, after18 days post seeding at the 40th minute.
0 ± 0.90 and
.89 ± 1.72 spikes/s, respectively. For both MEAs, spike rate from all active
not a gradual recovery as one might expect as washing would cause a slow
The MSR during the reference state for the MEA culture shown in Figure 4.34 was
significantly higher (P < 0.01, n = 13) than that in the native state. The MSR for the
native state and during the last 10 minutes of the reference state was 1.1
1
electrodes was reduced instantaneously after the addition of 3 µM muscimol which
binds to high affinity sites on the GABAA receptors. This instantaneous decrease in
spike rate was also observed with the addition of GABA in other cultures (Figure
4.33, Figure 4.38). For the MEA culture shown in Figure 4.34, the MSR was reduced
from 1.89 ± 1.72 to 0.18 ± 0.32 spikes/s with the addition of 3 µM muscimol (P <
0.01, n = 13). The inhibition on network firing remained for the whole 20 minutes that
muscimol was applied and activity was recovered when a half medium change was
done, returning activity to an average spike rate of 1.90 ± 2.48 spikes/s after 30
minutes similar to that prior to muscimol addition (P > 0.01, n = 13). However, a half
medium wash after muscimol application caused an instantaneous increase in MSR,
dissociation of muscimol which binds to high affinity binding sites on the GABAA
85
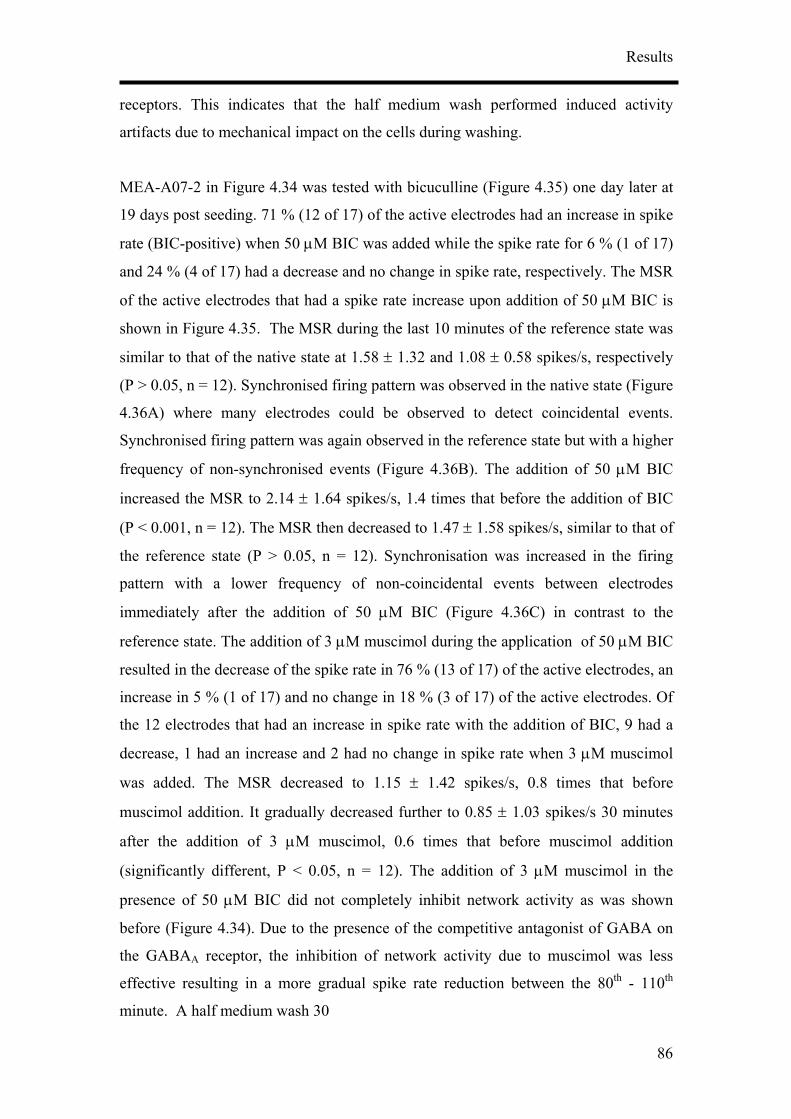
Results
receptors. This indicates that the half medium wash performed induced activity
artifacts due to mechanical impact on the cells during washing.
MEA-A07-2 in Figure 4.34 was tested with bicuculline (Figure 4.35) one day later at
19 days post seeding. 71 % (12 of 17) of the active electrodes had an increase in spike
rate (BIC-positive) when 50 µM BIC was added while the spike rate for 6 % (1 of 17)
and 24 % (4 of 17) had a decrease and no change in spike rate, respectively. The MSR
of the active electrodes that had a spike rate increase upon addition of 50 µM BIC is
shown in Figure 4.35. The MSR during the last 10 minutes of the reference state was
similar to that of the native state at 1.58 ± 1.32 and 1.08 ± 0.58 spikes/s, respectively
(P > 0.05, n = 12). Synchronised firing pattern was observed in the native state (Figure
4.36A) where many electrodes could be observed to detect coincidental events.
ynchronised firing pattern was again observed in the reference state but with a higher
minute. A half medium wash 30
S
frequency of non-synchronised events (Figure 4.36B). The addition of 50 µM BIC
increased the MSR to 2.14 ± 1.64 spikes/s, 1.4 times that before the addition of BIC
(P < 0.001, n = 12). The MSR then decreased to 1.47 ± 1.58 spikes/s, similar to that of
the reference state (P > 0.05, n = 12). Synchronisation was increased in the firing
pattern with a lower frequency of non-coincidental events between electrodes
immediately after the addition of 50 µM BIC (Figure 4.36C) in contrast to the
reference state. The addition of 3 µM muscimol during the application of 50 µM BIC
resulted in the decrease of the spike rate in 76 % (13 of 17) of the active electrodes, an
increase in 5 % (1 of 17) and no change in 18 % (3 of 17) of the active electrodes. Of
the 12 electrodes that had an increase in spike rate with the addition of BIC, 9 had a
decrease, 1 had an increase and 2 had no change in spike rate when 3 µM muscimol
was added. The MSR decreased to 1.15 ± 1.42 spikes/s, 0.8 times that before
muscimol addition. It gradually decreased further to 0.85 ± 1.03 spikes/s 30 minutes
after the addition of 3 µM muscimol, 0.6 times that before muscimol addition
(significantly different, P < 0.05, n = 12). The addition of 3 µM muscimol in the
presence of 50 µM BIC did not completely inhibit network activity as was shown
before (Figure 4.34). Due to the presence of the competitive antagonist of GABA on
the GABAA receptor, the inhibition of network activity due to muscimol was less
effective resulting in a more gradual spike rate reduction between the 80th - 110th
86
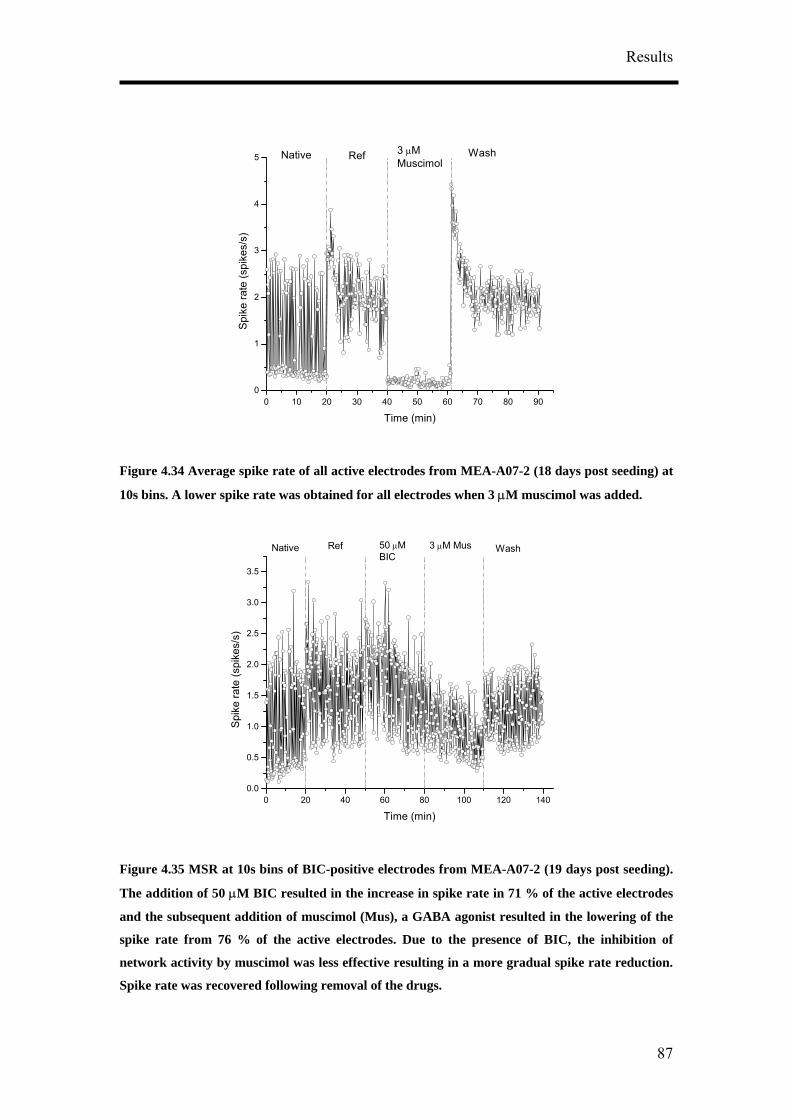
Results
Figure 4.34 Average spike rate of all active electrodes from MEA-A07-2 (18 days post seeding) at
10s bins. A lower spike rate was obtained for all electrodes when 3 µM muscimol was added.
Figure 4.35 MSR at 10s bins of BIC-positive electrodes from MEA-A07-2 (19 days post seeding).
The addition of 50 µM BIC resulted in the increase in spike rate in 71 % of the active electrodes
and the subsequent addition of muscimol (Mus), a GABA agonist resulted in the lowering of the
spike rate from 76 % of the active electrodes. Due to the presence of BIC, the inhibition of
network activity by muscimol was less effective resulting in a more gradual spike rate reduction.
Spike rate was recovered following removal of the drugs.
0 10 20 30 40 50 60 70 80 900
1
2
3
4
5
Spi
ke ra
te (s
pike
s/s)
Time (min)
Native Ref 3 µMMuscimol
Wash
0 20 40 60 80 100 120 1400.0
0.5
1.0
1.5
2.0
2.5
3.0
3.5
Spi
ke ra
te (s
pike
s/s)
Time (min)
Native Ref 50 µMBIC
3 µM Mus Wash
87
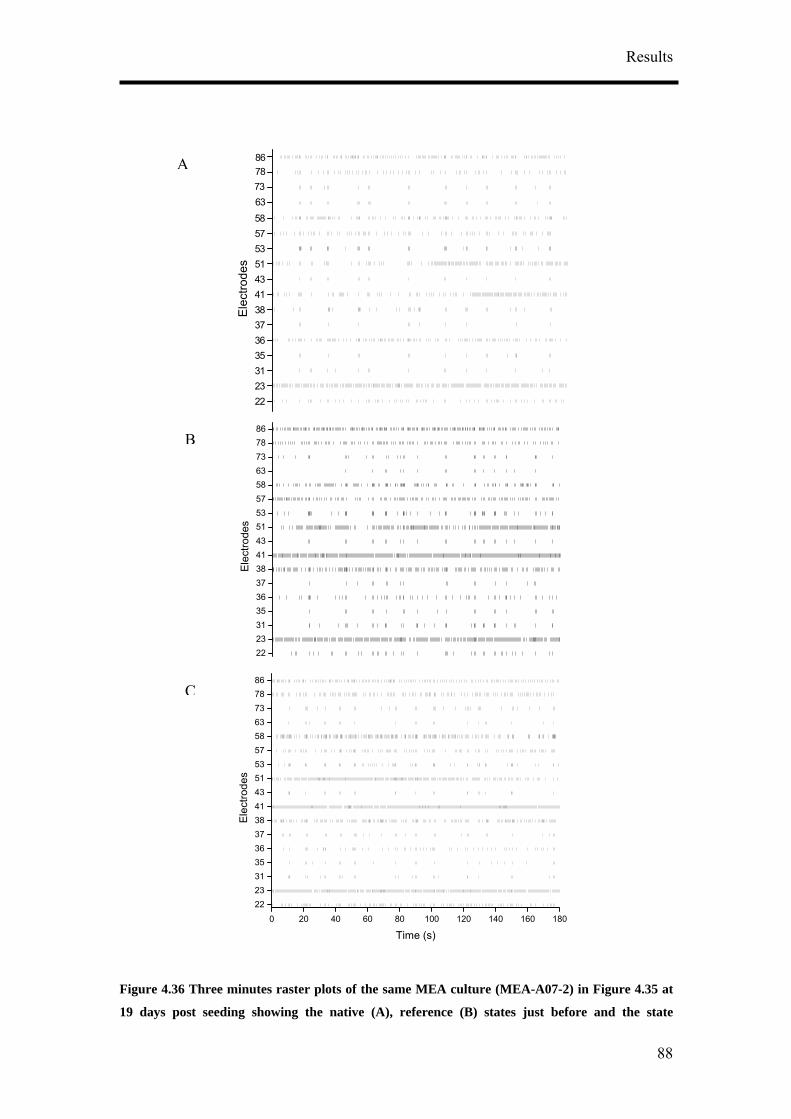
Results
Figure 4.36 Three minutes raster plots of the same MEA
22233135363738414351535758
Ele
ctro
des
63737886
culture (MEA-A07-2) in Figure 4.35 at
19 days post seeding showing the native (A), reference (B) states just before and the state
0 20 40 60 80 100 120 140 160 1802223313536373841435153575863737886
Elec
trode
s
2223313536373841435153
737886
Time (s)
575863
Elec
trode
s
A
B
C
88
Results
immediately after the application of 50 µM BIC (C). Synchronised firing pattern was observed in
with a lower frequency of non-coincidental events between electrodes immediately
after the addition of 50 µM BIC (C).
minutes after the addition of muscimol returned the average spike rate to that of the
reference state at 1.42 ± 1.28 spikes/s (P >0.05, n = 12).
The activity normalised to the reference activity from each electrode (Figure 4.37)
upon 50 µM BIC application was 1.52 ± 0.35 (P < 0.001, n = 12). Figure 4.37 shows
that as in the MSR data that the normalised activity of the native state, 30 minutes
after BIC application and Wash state was not significantly different than that at the
reference state. Without washing away BIC, the normalised activity due to the
addition of 3µM muscimol (Mus 1 in Figure 4.37) and 20 – 30 minutes after
muscimol application (Mus 2) was 0.69 ± 0.40 and 0.51 ± 0.46, respectively.
Normalised activities at ‘Mus 1’ and ‘Mus 2’ periods were significantly lower than
the reference state (P < 0.05, P < 0.01, respectively; n = 12). The rate of spike rate
decrease during BIC application was different than that during muscimol application
as can be seen from Figure 4.37. The spike rate decrease during muscimol application
could therefore, be attributed to the action of muscimol. It appeared that the presence
of BIC modulated the inhibitory activity of muscimol. Activity returned to the
reference state after washing was performed to remove the drugs showing that the
effects of both BIC and muscimol were reversible.
the native state (A). Synchronised firing pattern was again observed in the reference state but
with a higher frequency of non-synchronised events (B). The firing pattern was again more
synchronised
89
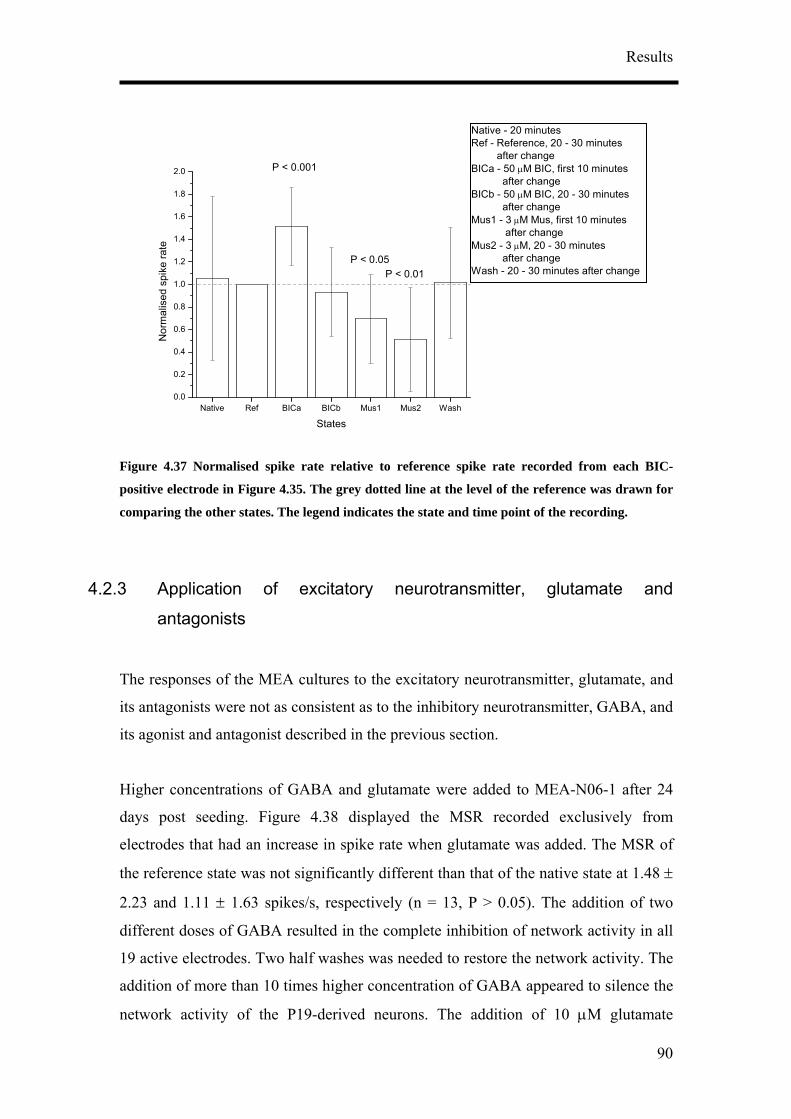
Results
Figure 4.37 Normalised spike rate relative to reference spike rate recorded from each BIC-
positive electrode in Figure 4.35. The grey dotted line at the level of the reference was drawn for
comparing the other states. The legend indicates the state and time point of the recording.
3 Application of excitatory neurotransmitter, glutamate and
antagonists
The responses of the MEA cultures to the excitatory neurotransmitter, glutamate, and
its antagonists were not as consistent as to the inhibitory neurotransmitter, GABA, and
its agonist and antagonist described in the previous
4.2.
section.
Higher concentrations of GABA and glutamate were added to MEA-N06-1 after 24
days post seeding. Figure 4.38 displayed the MSR recorded exclusively from
electrodes that had an increase in spike rate when glutamate was added. The MSR of
the reference state was not significantly different than that of the native state at 1.48 ±
2.23 and 1.11 ± 1.63 spikes/s, respectively (n = 13, P > 0.05). The addition of two
different doses of GABA resulted in the complete inhibition of network activity in all
19 active electrodes. Two half washes was needed to restore the network activity. The
addition of more than 10 times higher concentration of GABA appeared to silence the
network activity of the P19-derived neurons. The addition of 10 µM glutamate
Native Ref BICa BICb Mus1 Mus2 Wash0.0
0.2
0.4
0.6
0.8
1.4
1.6
1.0
1.2
1.8
2.0
Native - 20 minutesRef - Reference, 20 - 30 minutes after changeBICa - 50 µM BIC, first 10 minutes after changeBICb - 50 µM BIC, 20 - 30 minutes after changeMus1 - 3 µM Mus, first 10 minutes after change
Wash - 20 - 30 minutes after change
rmal
Mus2 - 3 µM, 20 - 30 minutes after change
P < 0.01P < 0.05
ised
spi
ke ra
teN
o
States
P < 0.001
90
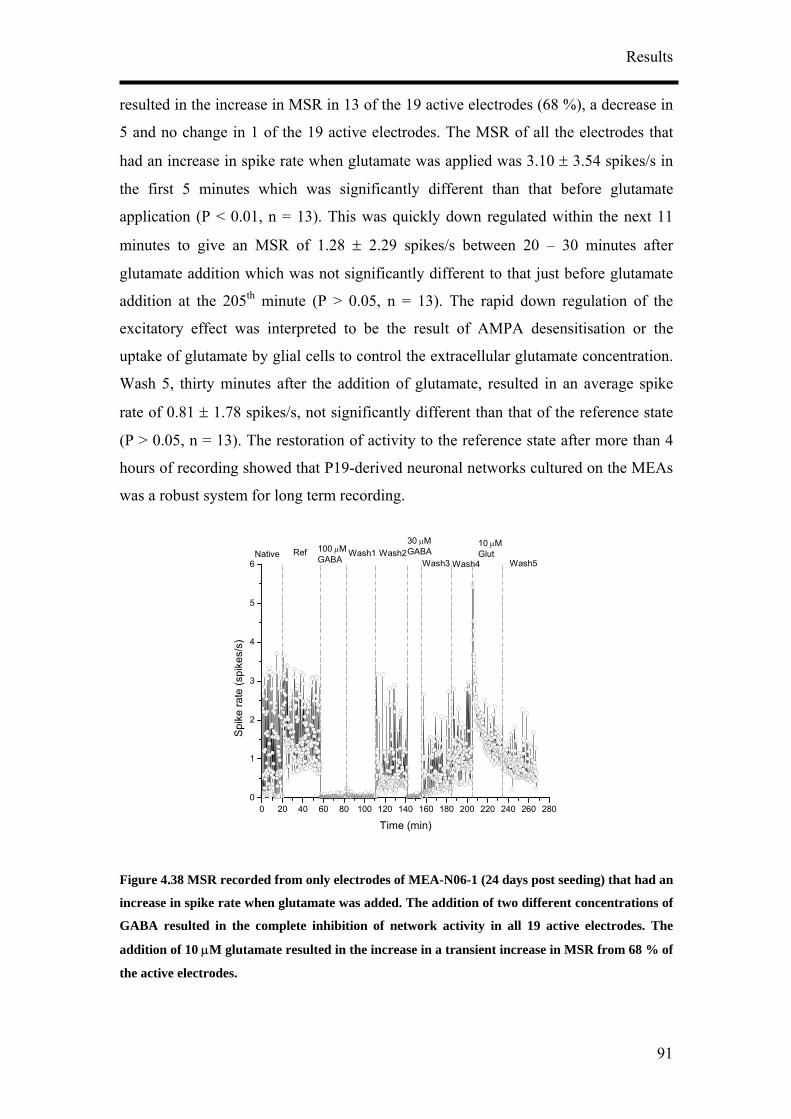
Results
resulted in the increase in MSR in 13 of the 19 active electrodes (68 %), a decrease in
5 and no change in 1 of the 19 active electrodes. The MSR of all the electrodes that
had an increase in spike rate when glutamate was applied was 3.10 ± 3.54 spikes/s in
the first 5 minutes which was significantly different than that before glutamate
application (P < 0.01, n = 13). This was quickly down regulated within the next 11
minutes to give an MSR of 1.28 ± 2.29 spikes/s between 20 – 30 minutes after
glutamate addition which was not significantly different to that just before glutamate
addition at the 205th minute (P > 0.05, n = 13). The rapid down regulation of the
excitatory effect was interpreted to be the result of AMPA desensitisation or the
uptake of glutamate by glial cells to control the extracellular glutamate concentration.
Wash 5, thirty minutes after the addition of glutamate, resulted in an average spike
rate of 0.81 ± 1.78 spikes/s, not significantly different than that of the reference state
(P > 0.05, n = 13). The restoration of activity to the reference state after more than 4
hours of recording showed that P19-derived neuronal networks cultured on the MEAs
was a robust system for long term recording.
Figure 4.38 MSR recorded from only electrodes of MEA-N06-1 (24 days post seeding) that had an
increase in spike rate when glutamate was added. The addition of two different concentrations of
GABA resulted in the complete inhibition of network activity in all 19 active electrodes. The
addition of 10 µM glutamate resulted in the increase in a transient increase in MSR from 68 % of
the active electrodes.
0 20 40 60 80 100 120 140 160 180 200 220 240 260 2800
1
4
6
2
3
5
Wash5
10 µMGlut
Wash4Wash3
30 µMGABA
Spi
ke ra
te (s
pike
s/s)
Time (min)
Native Ref 100 µMGABA
Wash1 Wash2
91
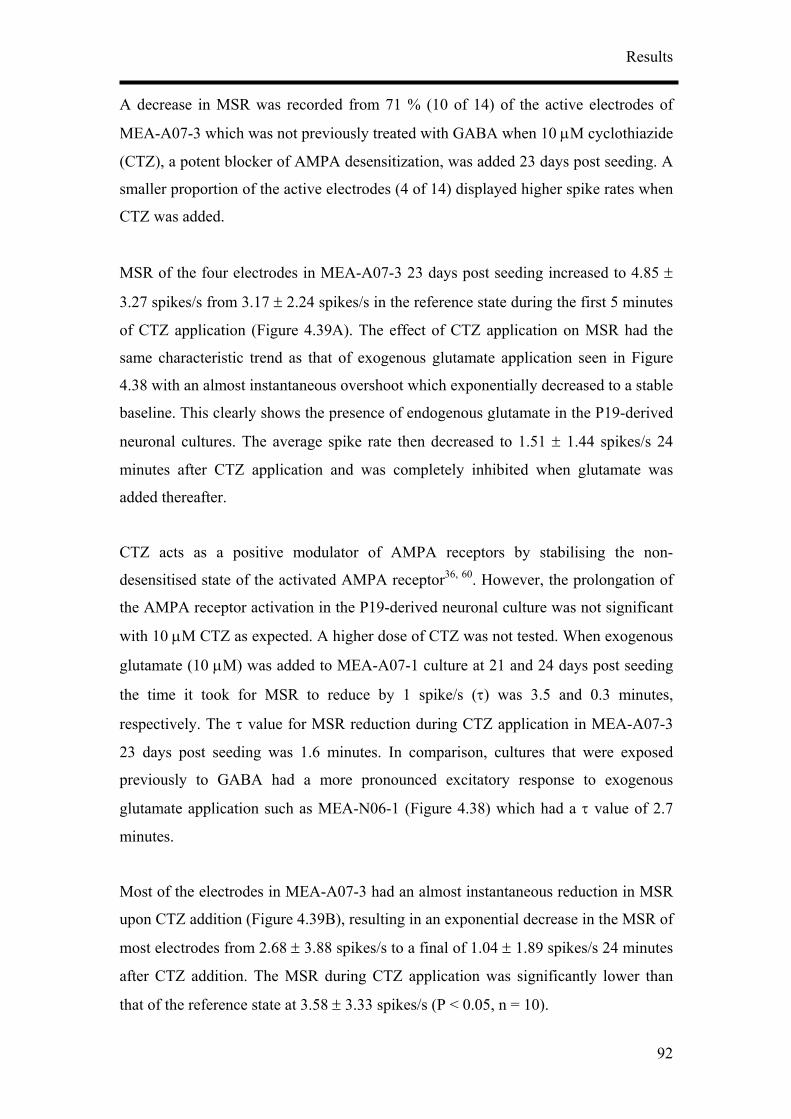
Results
A decrease in MSR was recorded from 71 % (10 of 14) of the active electrodes of
MEA-A07-3 which was not previously treated with GABA when 10 µM cyclothiazide
(CTZ), a potent blocker of AMPA desensitization, was added 23 days post seeding. A
smaller proportion of the active electrodes (4 of 14) displayed higher spike rates when
CTZ was added.
MSR of the four electrodes in MEA-A07-3 23 days post seeding increased to 4.85 ±
3.27 spikes/s from 3.17 ± 2.24 spikes/s in the reference state during the first 5 minutes
of CTZ application (Figure 4.39A). The effect of CTZ application on MSR had the
same characteristic trend as that of exogenous glutamate application seen in Figure
4.38 with an almost instantaneous overshoot which exponentially decreased to a stable
baseline. This clearly shows the presence of endogenous glutamate in the P19-derived
neuronal cultures. The average spike rate then decreased to 1.51 ± 1.44 spikes/s 24
minutes after CTZ application and was completely inhibited when glutamate was
added thereafter.
CTZ acts as a positive modulator of AMPA receptors by stabilising the non-
desensitised state of the activated AMPA receptor36, 60. However, the prolongation of
the AMPA receptor activation in the P19-derived neuronal culture was not significant
with 10 µM CTZ as expected. A higher dose of CTZ was not tested. When exogenous
glutamate (10 µM) was added to MEA-A07-1 culture at 21 and 24 days post seeding
the time it took for MSR to reduce by 1 spike/s (τ) was 3.5 and 0.3 minutes,
respectively. The τ value for MSR reduction during CTZ application in MEA-A07-3
23 days post seeding was 1.6 minutes. In comparison, cultures that were exposed
previously to GABA had a more pronounced excitatory response to exogenous
glutamate application such as MEA-N06-1 (Figure 4.38) which had a τ value of 2.7
minutes.
Most of the electrodes in MEA-A07-3 had an almost instantaneous reduction in MSR
state at 3.58 ± 3.33 spikes/s (P < 0.05, n = 10).
upon CTZ addition (Figure 4.39B), resulting in an exponential decrease in the MSR of
most electrodes from 2.68 ± 3.88 spikes/s to a final of 1.04 ± 1.89 spikes/s 24 minutes
after CTZ addition. The MSR during CTZ application was significantly lower than
that of the reference
92
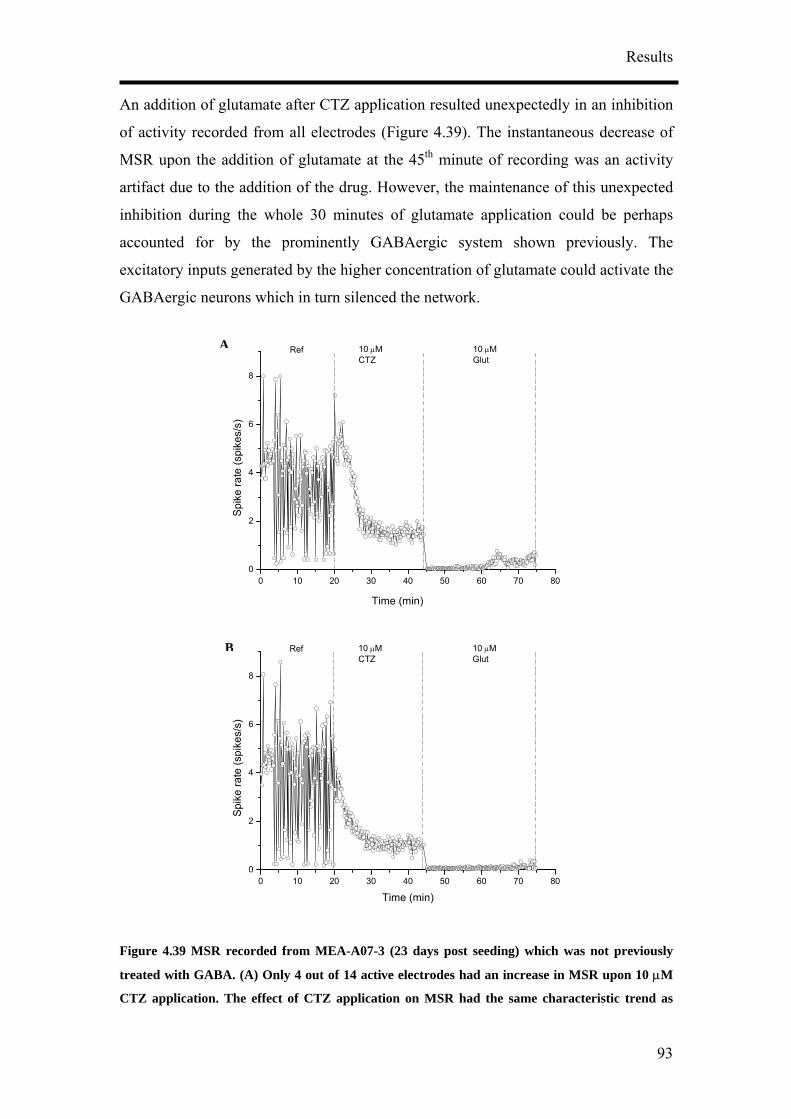
Results
An addition of glutamate after CTZ application resulted unexpectedly in an inhibition
the prominently GABAergic system shown previously. The
xcitatory inputs generated by the higher concentration of glutamate could activate the
CTZ application. The effect of CTZ application on MSR had the same characteristic trend as
of activity recorded from all electrodes (Figure 4.39). The instantaneous decrease of
MSR upon the addition of glutamate at the 45th minute of recording was an activity
artifact due to the addition of the drug. However, the maintenance of this unexpected
inhibition during the whole 30 minutes of glutamate application could be perhaps
accounted for by
e
GABAergic neurons which in turn silenced the network.
Figure 4.39 MSR recorded from MEA-A07-3 (23 days post seeding) which was not previously
treated with GABA. (A) Only 4 out of 14 active electrodes had an increase in MSR upon 10 µM
0 10 20 30 40 50 60 70 800
2
4
6
8
Spi
ke ra
te (s
pike
s/s)
Time (min)
Ref 10 µMCTZ
10 µMGlut
0 10 20 30 40 50 60 70 800
2
4
6
8
Spi
ke ra
te (s
pike
s/s)
Time (min)
Ref 10 µMCTZ
10 µMGlut
A
B
93
Results
that of exogenous glutamate application seen in Figure 4.38 with an almost instantaneous
overshoot which exponentially decreased to a stable baseline. (B) MSR recorded from 71 % (10 of
Figure 4.40 MSR of 16 active electrodes in MEA-A07-3 (24 days post seeding). The addition of 0.3
µM TTX eliminated all spikes and remained so during the time of 8 minutes that it was applied.
0 10 20 30 80
14) of the active electrodes decreased when 10 µM CTZ was added.
The addition of 0.3 µM TTX to MEA-A07-3 the next day eliminated all spikes and
remained so during the period of 8 minutes that it was applied. Half medium wash
was performed three times but the spike activity of the network was not recovered.
Activity was increased the next day. The elimination of activity due to TTX showed
that sodium channels were active during action potential generation.
0.0
0.5
1.0
1.5
2.0
Spik
e ra
te (s
pike
s/s)
Time (min)
Ref0.3 µMTTX
25th daynative
10
94
Results
4.3
virus (SFV) infection,
phosphate coprecipitaion.
4.3.
fter 7 days post
eeding. P19-derived neurons cultured on MEAs and sibling culture flasks were
OR5 Transfection
Transfection of P19-derived neurons for the expression of OR5 receptor was
performed via various ways, recombinant semliki forest
electroporation and DNA / calcium
1 Viral infection
P19 cells were differentiated according to method IC2S and seeded on PEI-LN coated
surfaces at 150 000 cells/cm2. Spontaneous activity was detected a
s
infected with replication deficient SFV particles after 18 days post seeding, the time
point when synchronised network activity was observed. MEA recording from SVF
infected P19-derived neurons could not be obtained as the cells failed to
spontaneously fire after the infection, although confocal laser microscopy of sibling
cultures showed that OR5 receptors were detected (Figure 4.41). It was also observed
that clusters of cells in the MEA cultures were floating off 15 hours after infection.
Electron micrograph showed that there was active formation of receptors on the
surface of infected cells (Figure 4.42). This was not observed in control cultures. The
exocytosis of a vesicle containing membrane proteins could be seen in Figure 4.42B.
The overexpression of OR5 receptor could have disrupted the process of action
potential generation and transmission in the SFV infected P19-derived neurons.
95
Results
Figure 4.41 Immunostaining of SFV infected RA treated P19 cells. DAPI stained nuclei (blue)
nd OR5 stained (green) neuron (arrow in A) and non neuronal cell (B) could be observed on the
Figure 4.42 Electron micrographs of infected cells showing active membrane bound receptor
formation. (B) is an enlarged region indicated in (A). (A) Bar, 1 µm. (B) Bar, 200 nm.
a
same day in sibling cultures when MEA recording was performed at the 18th day post seeding.
A
B
BA
96
Results
4.3.2 DNA cloning
T-RexTM System, a tetracycline (Tet) regulated expression system for mammalian
cells was used to express OR5 in P19-derived neurons. Tet regulation in the system is
based on the binding of Tet to the Tet repressor and subsequent derepression of the
promoter controlling expression of gene of interest. The expression of the gene of
interest was controlled in this system by the strong human cytomegalovirus
immediate-early (CMV) promoter and two tetracycline operator 2 (TetO2) sites.
lasmids pTNT-OR5 and pcDNA4/TO were double restricted by EcoRI and Not1
enzymes and ligated by DNA ligase. The recombinant plasmid pcDNA4/TO–OR5
had a size of 6057 base pairs. PCR of the recombinant plasmid showed that a product
of 1000 bp was present (Figure 4.43) using OR5 reverse and forward primers. The
OR5 encoding DNA sequence is 942 bp in size.
Figure 4.43 1 % agarose gel showing a 1000 bp PCR product of recombinant pcDNA4/TO-OR5
in lanes 2 and 4. Lane 1 – without plasmid (negative control), lane 2 and 4 – pcDNA4/TO-OR5,
Lane 3 – pTNT-OR5 (positive control).
1 000 bp
Another plasmid, pcDNA6/TR©, encoding for the Tet repressor under the control of
the CMV promoter regulates the expression.
P
1 2 3 4
97
Results
Figure 4.44 Recombinant pcDNA4/TO-OR5 was linearised with Sap 1, desalted and ethanol
recipitated. 1 % agarose gel showed that the 6057 bp plasmid was present after ethanol
equence (position 19 – 27). The recombinant plasmid was missing a thymine
nucleotide at position 15. Since the mismatch was at an inconsequential site, the
recombinant pcDNA4/TO-OR5 plasmid s t sfected into the cells.
4.3.3 Electroporation and calcium phosphate precipitation
Transfection by both electroporation and calcium phosphate were performed on RA
treated P19 cells to introduce the 2 plasmids into the cells. Three combinations of
transfection methods were performed. Group 1 consisted of first electroporating
pcDNA TM 4/TO/OR5 plasmids in to the RA treated P19 cells and then introducing
pcDNA6/TR© plasmids by calcium phosphate method. Group 2 consisted of first
electroporating pcDNA6/TR© plasmids, followed by transfecting with pcDNA TM
ls for group 1 and group 3 stained for b-Gal were
hown in Figure 4.45 and Figure 4.46. Transfection efficiency by both electroporation
and calcium phosphate method appeared to be within 10 %.
p
precipitation.
Prior to transfecting the cells with the recombinant pcDNA4/TO-OR5 plasmids
(Figure 4.44), the plasmids were sent for sequencing to verify that OR5 was correctly
encoded. There was one mismatch at position 15 (Appendix), before the Kozak
s
wa ran
4/TO/OR5 plasmids via calcium phosphate method. Group 3 consisted of transfecting
the cells first with pcDNA6/TR© plasmids and then pcDNA TM 4/TO/OR5 plasmids by
calcium phosphate method. Contro
s
Band size (bp)
10 000 8 000 6 000 5 000
98
Results
Transfection of the RA treated P19 cells were performed within three days after RA
induction, the time period when the cells still undergo mitotic division. Cultures that
were first transfected with pcDNA TM 4/TO/OR5 appeared to be not as robust as
cultures that were first cted with pcDNA6/TR©. There was more cell death in
these cultures. The expression of OR5 in the P19-derived neurons without the
repression mechanism of pcDNA6/TR© appeared to compromise growth and
proliferation of the cells. Spontaneous activity of the sibling MEA cultures for all
groups was not detected. The addition of OR5 ligand, lilial, to the MEA cultures
difficult to perform as the cells were easily washed away during the
rocess of staining. Few OR5 expressing cells could be detected in group 3 cultures
transfe
between 17 – 19 days post seeding at concentrations of 0.5 µM up to 200 µM did not
stimulate any firing the cultures. Immunostaining of the sibling glass coverslip
cultures was
p
(Figure 4.47B) and the neuronal morphology of group 3 cultures could be clearly seen
(Figure 4.47D). Transfection of both plasmids into P19-derived neurons appeared to
disrupt the inherent generation of firing activity.
Figure 4.45 RA treated P19 cells stained for β-Gal a day after electroporated with pcDNA TM
4/TO/lacZ plasmids. (A) Bar, 50 µm. (B) Bar, 20 µm.
A B
99
Results
Figure 4.46 Two different areas of P19-derived neuronal cultures stained for β-Gal 3 days post
seeding. pcDNA6/TR© and pcDNA TM 4/TO/lacZ plasmids were transfected into the P19-derived
neurons by the calcium phosphate precipitation method. Bar, 100 µm.
Figure 4.47 P19-derived neurons stained against OR5 (green) and MAP2 (red) after 7 days post
seeding (4 days after transfection). pcDNA TM 4/TO/lacZ and pcDNA6/TR© plasmids were
BA
C D
F
100

Results
transfected into the P19-derived neurons by the calcium phosphate precipitation method. The
nuclei were stained blue (DAPI). (A) and (B) show the same area. (C) - (F) show the same area.
(A) – (F) Bar, 20 µm.
101
Discussion
5.
5.1 Optimisation of Neuronal Differentiation of P19 EC Cells
5.1.1 Culture conditions
The population of P19-derived neurons was heterogeneous with respect to the
morphology and neurotransmitters they synthesise as reported by others11, 14, 16. Up to
five days culture on surfaces, RA treated P19 EC cells displayed characteristics of
neuronal progenitor cells, maturing into post-mitotic neurons and glial cells after 5
days in vitro.61 Therefore, these cells are sensitive to culture conditions before
achieving the terminal differentiated phenotype. To perform reliable MEA recordings,
P19-derived neurons need to be able form mature and stable neuronal networks.
The vitamin A derivative retinoic acid has been implicated to play a central role in
several processes occurring during vertebrate development. Presence of this
morphogen is believed to provide positional information necessary for the proper
formation of the nervous system62. It can have a profound effect on cell proliferation
and is a potent inducer of differentiation in several cell types. Although it was shown
that differentiation of P19 EC cells was initiated after only one hour of RA
treatment12, differentiation into the neuronal lineage was not efficient after only one
day in suspension as seen from the immature neuronal morphology and the low
proportion of neurons. Jonk et al.12 has shown that the expression of retinoic acid
receptor mRNA was maximal after four days RA treatment. Aggregation in
suspension culture helps to accelerate the rate of RA mediated retinoic acid receptor
induction. Embryoid body-like aggregates were formed in the RA supplemented
suspension cultures. Embryonal carcinoma cell lines are analogue of early embryo
cells.7, 63 When these cells are detached from the substratum, they form embryoid
bodies consisting of an outer layer of endodermal cells surrounding an embryonic
carcinoma cell core after four days in suspension. A variety of differentiated cells
could be obtained when the embryoid bodies are attached to a substratum.6, 7, 63 With
the addition of RA, the appearance of neurons was accompanied by the disappearance
of embryonal carcinoma cells. It was found that for RA concentrations above 5 x 10⁻⁸
Discussion
102
Discussion
103
M, all of the aggregates contained cells with neuron-like processes after three days10
res resembled untreated controls and contained only
embryonal carcinom
he e und to
h the results of Jones-Villeneuve et al.10
spersed and might more closely resemble cells of the
3
events which occur during terminal differentiation of P19 cells . Dendrites containing
and below 5 x 10⁻⁸ M, the cultu
a cells and small amounts of extraembryonic endoderm like cells.
T ffect of RA above 0.5 x 10⁻⁶ M on the differentiation of P19 cells was fo
be insignificant in agreement wit
Aggregated seeded cultures resulted in localised high density pockets of well
developed neuronal populations that possessed long sinuous neuritic formations. A
more homogeneous coverage of neuronal network on culture surfaces was naturally
observed when RA treated P19 cells were dissociated and seeded as single cells.
There was a range of distinct morphological types based on cell body size and
dendritic morphology. Some neurons form clusters and give rise to fascicles of axons,
suggesting that these cells might resemble those destined to become projection
neurons. Other neurons were di
interneuronal type. Networks develop from isolated neurons into fully connected
neuronal network, passing through phases of massive overproduction of synaptic
connections and subsequent synaptic elimination and stabilisation.
Parnas et al.64 have reported that increased culture density accelerates the coordinated
maturation of P19-derived neurons in several aspects such as protein expression, basal
release, neurotransmitter release, neurite outgrowth and segregation of cytoskeletal
elements. Similarly, enhanced acquisition of neuronal polarity was also observed in
high cell density cultures. Many factors such as higher growth factor density and
increased cell to cell contracts contribute to the enhanced neuronal maturation in
denser cultures. Cell density affects many cellular aspects such as gene expression,
cell growth and cell morphology. One of the classical effects of increased cell density
is the inhibition of cell growth and proliferation. Increased cell density has been
known to affect the expression of several receptors, mainly receptor protein tyrosine
kinases. 4, 65
MAP2 is expressed in P19-derived neurons but not in undifferentiated P19 EC cells. It
was shown that when MAP2 expression was blocked in differentiating P19 cells by
antisense RNA, these cells did not extend neurites nor withdraw from the cell cycle 56
Discussion
104
MAP2 were detected early in P19-derived neurons and axons containing NF160
developed later in vitro.
The most complex form of regulated secretion occurs perhaps in the nervous system
where neurotransmitter release is tightly regulated both temporally and spatially.66
ynaptic vesicles are the storage organelles which are found in all synapses S
participating in quantal release of classical neurotransmitters. The expression of
synaptophysin correlates with synapse formation.67 Neurons overexpressing
synaptophysin has been reported to show increased frequency of spontaneous release
which in turn stimulates the maturation of synapses.66
It has been reported than the proportion of GAD positive neurons in P19-derived
neuronal population is 10 % regardless of the cell density.16 A small proportion of
MAP2 stained P19-derived neurons was stained also for GAD.
A mix population consisting of neurons and glial cells was obtained after the
differentiation of RA treated P19 cells. It is known that glial cells play an important
le in ensuring brain development and function.68-72 They guide the migration of
ported to be initially present early in the culture15 were affected by the
resence of Ara-C. However, the addition of Ara-C later in culture still resulted in the
ro
neurons, promote the survival and differentiation of neurons, insulate and nourish
neurons as well as enhance neuronal synaptic efficacy70, 71. However, due to a concern
that the overgrowth of non-neuronal cells could result in interference of neuron-
electrode coupling since the non-neuronal cells consisting largely of glial cells grow
and proliferate beneath the neuronal network. The monolayer of non-neuronal cells
could result in an insulating layer between the electrodes and neurons causing a
reduction in the detection of neuronal firing and hence the low number of active
electrodes. The reduction of the still mitotic non-neuronal cells was performed by the
addition of Ara-C, an anti-metabolic agent. P19-derived neurons was observed to
survive longer when Ara-C was added later in vitro. Mitotic neuronal progenitor cells
have been re
p
death of the neuronal culture. A co-culture of spatially separated glial cells either
isolated from day 18 embryos of pregnant CD rats or purified from RA treated P19
cells with P19-derived neurons was attempted to reduce the non-neuronal cells in
P19-derived neuronal cultures. The co-culture method neither decreased the
Discussion
105
proportion of non-neuronal cells nor increased the number of firing events in P19-
derived neuronal culture. Direct glial-neuron contacts were found to be necessary for
rowth and maturation of neurons as reported by others73.
5.1.
ation.74, 75 Two major types of
henomena, both of which involve various types of forces (i.e. electrostatic,
cise recognition and
inding. In the latter, however, interaction is less precise and does not depend on
g
2 Cell culture surface coating
The cell membrane is composed of a lipid bilayer associated with integral and
peripheral proteins and polysaccharides. Communication and interaction of a cell with
its environment thus take place principally through the particular characteristics of
each of these species as well as through their combin
p
electrodynamic), may be distinguished: specific and non-specific interactions. In the
former, where ligand/receptors are involved, the complex structure of these molecules
and also the charges associated with them allows very pre
b
complex charge specificity.
Presence of specific charges on the biomaterial surface may induce electrostatic
and/or electrodynamic interaction with cell membrane components. Polylysine is a
basic poly-amino acid with a net positive charge that is frequently used to cover the
surface to which neurons attach. It is often used in cell studies to augment the
attachment of cells to tissue culture flasks. It is believed that polylysine enhances cell
adhesion to substrates by means of electrostatic interaction between anionic sites
located on lipids, proteins and/or polysaccharides of plasma membranes and cationic
sites of polylysine molecules.76 Polyethyleneimine is an organic polymer that has a
high density of amino groups that can be protonated. It has been frequently used in the
built up of polyelectrolyte layers and some of the applications of such multilayered
polyelectrolyte films were for cell attachment77, 78. Similar to PDL coatings, pre-
coating with PEI was also found to enhance cell attachment79. Laminin is an
extracellular matrix protein found in basement membranes of human brains. Its
function is to activate focal adhesion proteins for neuronal development.10, 80 Laminin
may stimulate the development of longer neuronal processes than polylysine.10, 81 The
binding of neurons on laminin could be more specific physiologically than it does on
polylysine. Several synthetic peptides based on laminin sequences have been
Discussion
106
described as similar to those of the whole laminin molecule.57-59, 82 Laminin based
peptides that have biological activity include the well known Arg-Gly-Asp (RGD)
sequence from the short arm of the A chain and the Ile-Lys-Val-Ala-Val (IKVAV)
containing peptide from the long arm of the A chain. IKVAV containing peptides
wth.83
ar weight molecule has more attachment sites for the
minin fragment perhaps resulting in a stronger electrostatic adsorption of the
5.1.
were observed to promote neurite outgro
The laminin fragment is electrostatically attracted to the positively charged layer of
PEI or PDL which is first adsorbed to the substrate.77, 84 The P19-derived neurons
were found to be able to produce synaptophysin earlier when grown on PEI-LN
coated surfaces as compared to those growing on PDL coated surfaces. The formation
of a higher concentration of synaptophysin in localized areas in PEI-LN cultures is
associated with improved synapse maturation and the ability of P19-derived neurons
to release neurotransmitters 14 days post seeding. P19-derived neurons appeared to
show a more mature phenotype when cultured on PEI-LN surfaces compared to PDL-
LN surfaces. The PDL used had a much higher molecular weight than the PEI
applied. The higher molecul
la
laminin fragment. Extracellular matrix proteins that were found to be strongly
attached to the surface were found to reduce cellular motility and proliferation as
remodeling of the extracellular environment is impeded.74, 75, 85
Appropriate cell-adhesive substrates, diffusible neurotrophic activity and cell bound
signals and their synergistic interactions were essential requirements for maturation
and long term survival of P19-derived neurons.
3 Extracellular Recording with Microelectrode Array
Micro-electrode array technology initiated by Pine and Gross86, 87 have now become a
reliable interfacing technique capable of establishing a bi-directional communication
between a population of neurons and the external world.5, 43, 47, 48, 50 Cultured neuronal
networks are a well accepted experimental model in neuroscience research. They have
been successfully utilised for studying pharmacological effects48-50, for investigating
Discussion
107
synapse formation and change in connectivity during development88 and for studying
learning and plasticity mechanisms at the network level89.
MEA biosensor (8X8) from Multi Channel Systems® has a square recording area of
4500 µm with 64 flat TiN electrodes of 30 µm diameter and 200 µm inter-electrode
istance. Spike activity can be detected at distances up to 100 µm from a neuron in an
5.1.
ctivity is expected to
ave an important structuring role especially during early development.88 Although
ltures. Neuronal network maturation
flect changes in synaptic efficacy90. The observation that PEI-LN precoated cultures
produced a more mature neuronal network activity coincides with the observation that
igh .
although the number of active electrodes remained low. Asynchronous single spike
d
acute brain slice. Typically, signal sources are within 30 µm radius around the
electrode center. The smaller the distance the higher are the extracellular signals.
3.1 Spontaneous activity
Differences in amplitude and shape of spikes recorded from the neurons were
observed due to the distance between the source and electrode and due to the
mechanisms of the coupling between cell membrane and electrode in single-cell
contacts, respectively. Spikes recorded from spontaneously firing P19-derived
neurons in all culture conditions studied typically have characteristics of the first
derivative of the intracellular action potential indicating that voltage gated ion
currents in these neurons operate properly independent of the culture conditions
exposed to. Once neuronal differentiation was initiated, the neurons derived from P19
EC cells were able to generate action potential. Spontaneous a
h
P19-derived neurons were capable of generating action potentials in the sub-optimal
culture conditions, the firing pattern did not develop beyond asynchronised single
spikes pattern unlike in the PEI-LN150K cu
re
a h er density of synaptophysin was detected in PEI-LN cultures
Low density neuronal cultures of between 20 000 to 50 000 cells/cm2 showed little if
any synchronized network activity although the P19-derived neurons in these cultures
showed a very significant development and maturation in neuronal phenotype.
Neuronal cultures developed from aggregate seeded cultures on the other hand, have
the capability of developing neuronal networks that have synchronous firing ability
Discussion
108
firing activity usually indicates reduced synaptic efficacy caused by incomplete
development of functional synapses for example in immature cortical neurons.90 Such
duced synaptic efficacy results in a higher failure probability that an action potential
s as
oculture of low density neurons with increased glial cell population did not prolong
neuronal survival significantly73. The increased in number of neurons in such high
ffective self-conditioning of the culture medium by
res progressed in
itro showing the stability of cell electrode coupling. The increase in the amplitude of
re
would be communicated between neurons. Networks with high cell densities often
show a spontaneous, partly synchronised, activity pattern. Higher neuronal densities
of above 100 000 cells/cm2 have been shown to promote long term neuronal
survival.73 This survival enhancement of neurons at high density cultures could not be
simply explained for by the concomitant increase in endogenous glial cell
c
density culture also leads to more e
diffusible neuron derived autocrine factors.
Randomly cultured neurons form multiple connections yielding a largely intractable
network. Increasing the cell density to 150 000 cells/cm2 on the MEAs resulted in an
improved synchronization of spike activity. However, high density P19-derived
neuronal cultures studied here still exhibit a lower frequency of spike activity and of
synchronised network activity in comparison to primary cultures of embryonic rat
cortical neurons91. The frequency of synchronised spontaneous bursts is thought to
indicate the excitability of cells due to the number of functional synapses per cell and
their synaptic density which affect the probability of successful signal propagation
over the whole network.92
Although the number of active electrodes and the signal to noise ratios achieved
varied from culture to culture and are influenced by neuronal cell density, glial
density and size of the adhesion island over the recording matrix there is no change in
these two variables after 17 days post seeding as the individual cultu
v
recorded spikes suggested a progressive increase in the degree of electrical coupling
between electrodes and overlying neurons in addition to the rising expression of the
voltage-dependent inward channels underlying the spike.
Spikes were first recorded usually on the 7th day post seeding on the MEAs. 1-3 active
electrodes were obtained early in the culture of the P19-derived neurons. It was not
Discussion
109
until after 14 days post seeding that more robust and multiple recordings could be
obtained from more than 10 active electrodes. A sufficient time, in this case after 14
days post seeding, must be allowed for neurite promoting activity and spontaneous
activity related to the development of glutamate receptors. The development of
neuronal electrophysiological properties has been found by others to plateau between
15 and 28 days in vivo19, 40 which was also observed with MEA recordings performed
here.
Spontaneous firing activity in the cultured P19-derived neuronal network displayed a
characteristic time structure with the regular occurrence of short phases of
synchronised firing (network burst activity) later in vitro. The spontaneous firing
activity, developed from random firing from single neurons into a pattern of firing
cluding a phase of increased firing activity leading to a short phase of synchronised
ltures due to their larger deviations in bursts activity than
the primary cortical neuronal cultures.
ording electrodes increased.
heir usual behaviour was made up of local spiking and bursts. At 21 DIV, the
in
firing and a phase of low level firing activity. As the cultures were prolonged, the
network activity of the P19-derived neurons developed into a recurrent pattern of
firing with a repetition including a phase of low level firing activity, a short phase of
synchronised firing and a silent network recovery phase. During such network bursts
the number of active electrodes as well as spike rate was increased. Analysis of the
network burst activities in the P19-derived neuronal cultures was attempted with a self
made program (MEA-SPAT) developed for primary cultures of embryonic rat cortical
neurons93. The program was unable to detect reliably the network bursts observed in
the P19-derived neuronal cu
in
It has been reported that spontaneously bursting networks are recommended for
applications as biosensors because pattern changes can be more readily identified.46, 47,
94 Dissociated cortical neurons grown on MEAs similarly show activities that undergo
changes as the cultures develop in vitro.92, 95, 96, 88, 88 The dissociated cortical neurons
go through a first stage of development at 7 days in vitro (DIV) characterized by the
absence of organized activity and the occurrences low frequency randomly generated
spikes. At 14 DIV, the mean firing rate for all active rec
T
network showed a different behaviour where sporatic bursts were preceded and
followed by nearly silent periods. The maturation of network electrophysiology
Discussion
110
appeared to coincide with the formation and maturation of synapses in dissociated
cortical neurons shown by Ichikawa et al.90. They showed that the number of synapses
per neuron increased with DIV until the 4th or 5th week. During the 4th and 5th week in
these cortical cultures, the network reaches a stable condition of maturation exhibiting
a richer and elaborate temporal pattern of bursting activity suggesting an
accommodation of the synaptic connections and a balance between excitatory and
inhibitory components92.
5.2
5.2.1
Responses to Neurotransmitters
P19 cells have been reported to differentiate into populations of diverse neuronal cell
types expressing a variety of neurotransmitters similar to the neocortical neurons.
Responses to neurotransmitters and their antagonists or agonists were performed after
18 days post seeding when spontaneous activity was stabilised. Extracellular
recordings of P19-derived neurons exposed to two major neurotransmitters in the
neocortex, the inhibitory GABA and excitatory glutamate, and their antagonists or
agonists were not similar across the whole population of active electrodes. Recording
from the electrodes reveals the summation of the simultaneous activity of a population
of cells.
Response to inhibitory neurotransmitter, GABA and its agonist and
antagonist
In general, a larger proportion of active electrodes were showing higher spike rates
when BIC was added, causing a disinhibition of GABAA receptors. The presence of
endogenous GABA in the P19-derived neuronal cultures was clearly shown by the
disinhibitory effect of BIC. BIC, a plant convulsant, is known to compete with GABA
for binding to GABAA receptors and reduce GABAA receptor currents by decreasing
open frequency and mean duration of the receptor.97 BIC could elicit a higher rate of
activity in the P19-derived neurons which also show temporary increased partial
synchronisation. The higher spike rate induced dropped 10 minutes after BIC
application. A second addition of BIC directly after mostly did not increase the spike
rate in comparison to the previous wash state even when the BIC concentration was
Discussion
111
increased. The proportion of active electrodes with a higher spike rate increased
significantly in the same MEA culture when exposed to BIC the next day. The initial
addition of BIC could cause activity induced modulation of firing activity resulting in
the changed sensitivity to BIC.
P19-derived neurons were shown to possess functional GABA receptors and
specifically GABAA receptors4, 17, showing responses to GABA via intracellular
cordings.19, 98 It was reported that GABA induced depolarisation in immature P19-
derived neurons19, 61 while in mature P19-derived neurons either had a biphasic
epol inhibitory response to GABA4, 17.
ABA induced responses in P19-derived neurons were shown to be sensitive to BIC,
were sensitive to BIC most of them showed spontaneous activity that was
A C
Virtually all neurons in the adult mammalian CNS respond to GABA although only
pproximately 30 % of the total neurons in the adult mammalian CNS are
re
d arizing/hyperpolarizing19 or a completely
G
a GABAA receptor antagonist.19, 61, 98
The silencing of all spontaneous activity across the MEAs when GABA was applied
although the application of BIC affected only a subpopulation of P19-derived neurons
indicated that other subtypes of GABA receptors exist in the cultures. Firing activity
of P19-derived neurons was also completely inhibited with the addition of the
selective GABAA receptor agonist, muscimol which is a conformationally restricted
GABA analogue. Although not all populations of neurons in the proximity of the
electrodes
inhibited when muscimol was applied. This could be an indication of the presence of
GAB C receptors since muscimol is also a partial agonist of the GABA receptor24.
a
GABAergic. GABAA receptors have been known to mediate the bulk of fast
inhibitory neurotransmission in the mammalian brain.99
The inhibitory effectiveness of muscimol on the P19-derived neurons was reduced in
the presence of BIC. BIC is a competitive GABA antagonist on the GABA receptors
directly competing for the same ligand site as muscimol. The spontaneous activity of
the P19-derived neurons was only reduced when the same concentration of muscimol
was added in the presence of BIC unlike when only muscimol was added to the
cultures causing an instantaneous inhibition of spontaneous activity. However, the
instantaneous increase in spike activity during removal of BIC and muscimol
A
Discussion
112
indicated that the mechanical effect of washing caused activity artifacts. A slow
recovery of the activity after muscimol application would be expected as muscimol
binds to GABA receptors with high affinity. The installation of a perfusion system to
the MEA setup would get rid of A
activity artifacts due to washing.
5.2.
excitatory neurotransmitter later on in vitro.
ate had an excitatory effect on many of the neurons that were exposed
-NMDA receptors were not
ould mean that the non-NMDA receptors do 2+
2 Response to excitatory neurotransmitter, glutamate and
antagonists
P19-derived neurons that were treated previously with GABA appeared to have well
developed responses to the major
Glutam
previously to GABA. GABA receptors are predominantly present in the early stages
of the development of the mammalian cortical neurons mediating excitatory responses
which subsequently shapes the maturation of the neuronal system.22, 23 The later
development of NMDA type glutamate receptors take over the excitatory role of the
neuronal system and GABA receptors switch to its well known inhibitory function.
Synaptic connections have been known to undergo use dependent modifications
leading to strengthening or weakening of their efficacy.89 The increased synaptic
efficacy also increased probability of glutamate release which stimulates the
trafficking of AMPA receptors into initially silent synapses consisting of only NMDA
receptors, thus strengthening excitatory synaptic contacts8, 30. P19-derived neurons
possess functional NMDA and AMPA receptors that exhibit excitatory post-synaptic
currents that respond to NMDA and non-NMDA antagonists19, 20, 98, 100, although
Morley et al.100 reported that Ca2+ surges due to non
detected in P19-derived neurons which c
not mediate Ca permeable channels. The exponential decrease in average spike rate
after a brief upsurge in average spike rate during glutamate application in these cells
seemed to demonstrate that the fast acting AMPA type of glutamate receptors were
predominant. The long term extracellular recordings of the P19-derived neurons were
in B27 supplemented Neurobasal medium that contained 0.8 mM Mg2+. Extracellular
concentrations of Mg2+ inhibits NMDA receptors which could explain why the
response of the neuronal spontaneous activity to glutamate had a predominantly
Discussion
113
AMPA type characteristic. It would be interesting in this case to perform the
recording in Mg2+ deficient medium to examine the full range of glutamate responses.
Arnold et al.89 reported that NMDA receptor is a key regulator of activity dependent
change in network activity by increasing Ca2+ entry though NMDA receptors which in
rn triggers downstream signal regulated kinases. Gene transcription responses
triggered by Ca2+ flux are important for the sustenance of synchronous bursting. In the
crucia turation.
In contrast, glutamate had a prominently inhibitory effect on cultures that were not
tu
developing brain, self sustaining (input independent) recurrent network activity is
l to network ma
previously exposed to exogenous application of GABA. Only a small population of
P19-derived neurons in cultures not previously treated with GABA showed excitatory
responses to glutamate in these cultures.
Similar to glutamate response, the addition of CTZ, a potent blocker of AMPA
desensitisation, caused an exponential decrease after an initial rise in average spike
rate. The addition of CTZ however, did not cause a significant prolongation of the
period of excitation of endogenous glutamate. In fact, in cultures that were exposed to
doses of GABA glutamate could elicit a more robust excitatory response in terms of
the high proportion of active electrodes that recorded increased activity and the longer
period of excitation before desensitisation. In cultures that were not exposed to GABA
previously the subsequent addition of glutamate after CTZ application inhibited
network activity. This smaller excitatory response was an indication of a low density
of glutamate receptors present in P19-derived neurons that were not exposed to
exogenous dose of GABA.
AMPA receptors have a lower affinity for glutamate than NMDA receptors. Network
activity might require highly controlled activation of glutamate ionotropic receptors
and the neuron excitability might depend on short term activation of the receptor. The
finding would be consistent with the crucial role played by the neuronal and glial
uptake mechanisms, keeping low extracellular glutamate concentrations in the
functioning of glutamatergic transmission at central synapses.
Discussion
114
The spontaneous activity of these cells as in the mammalian central nervous system
(CNS) was controlled by a delicate balance of inhibitory and excitatory
neurotransmitters. Extracellular recordings with MEAs are a result of integration of
synaptic inputs. It appeared that P19-derived neuronal network was a predominantly
GABAergic system with low excitatory inputs. P19-derived neuronal networks on
MEAs were able to show reasonable physiological response to the drugs added.
5.3 OR5 Transfection
tation have been applied to P19-derived
eurons for the expression of OR5 in this study. Lemker54 had been able to show by
It has been reported that immature P19-derived neurons
ad excitatory responses to GABA19, 61 showing that intracellular concentration of Cl-
tion of GABA to the
etwork during this time had a complete inhibitory effect on the spontaneous activity,
showing that intracellular Cl- concentration is lower than the extracellular
Postmitotic cells such as neurons have been proven to be notoriously difficult to
transfect. A range of methods such as Semliki Forest virus vectors, electroporation
and calcium phosphate-DNA coprecipi
n
Real-Time PCR that P19-derived neurons possess the components essential for the
olfactory signaling cascade. She showed a four times increase in fluorescence due to
the influx of Ca2+ ions when OR5 ligand, lilial, was added to OR5-SFV infected
cultures proving the functional incorporation of OR5 in the plasma membrane of P19-
derived neurons.
However, extracellular recording of OR5 transfected cultures 17 days post seeding did
not detect an increase in activity due to the addition of the OR5 ligand. The reason for
the apparent discrepancy of the result could lie in the time frame of the transfection.
Lemker54 performed the infection with OR5-SFV vectors and calcium imaging within
1 week after RA treatment.
h
were higher than the extracellular environment. Such a higher intracellular Cl-
concentration would be necessary too for the activation of the olfactory receptor
signaling cascade in the olfactory receptor neurons of the olfactory epithelium.
However, robust network activities were recorded by MEA only 17 days after RA
treatment due to the increased maturation of the P19-derived neuronal network which
was necessary for robust neuronal firing activities. Applica
n
Discussion
115
environment in the mature P19-derived neurons. Therefore, although OR5 was
expressed in mature P19-derived neurons as shown by immunostaining, changes in
activity could not be detected in MEA cultures when the OR5 ligand was added.
Moreover, the OR5 transfection of P19-derived neurons appeared to impede the
generation of spontaneous activity as seen by the cessation of signals after OR5-SFV
vectors infection of cultures 18 days post seeding and no spontaneous activity was
etected in cultures transfected by both electroporation and calcium phosphate
precipitation method.
d
Conclusions and Outlook
6.
cid. Rapid and increased maturation of P19-derived neurons
were observed when the neurons were dissociated and plated at high cell density on
PEI-LN coated surfaces.
The improved neuronal maturation observed morphologically coincided with the
increased firing activity of the P19-derived neurons detected by extracellular
recording with microelectrode array. Extracellular recording of spontaneous firing
activity was detected one week post seeding. Synchronised network activity of the
P19-derived neurons was detected two weeks post seeding. Such spontaneously
synchronised networks are recommended for applications as biosensors because
pattern changes can be more readily identified. Network activities of the P19-derived
neurons were reproducible and robust over a two to three hour recording period.
Mature P19-derived neuronal network display synchronised network activities that
were controlled by a balance of excitatory and inhibitory neurotransmitters.
Extracellular recordings due to the addition of two major neurotransmitters in the
central nervous system, GABA and glutamate, and their agonists and antagonists
showed the presence of endogenous GABA and glutamate in the cultures. P19-
derived neurons displayed heterogeneous responses to the two major
neurotransimitters, GABA and glutamate, due to the presence of a heterogeneous
population of neurons. Signal induced changes in network activity could be observed
showing that P19-derived neurons have the capability to undergo synaptic plasticity.
This suggests that P19-derived neurons could be applied as a model for the study of
synaptic plasticity.
Conclusions and Outlook
Culture conditions were optimised to obtain a high efficiency of neuronal
differentiation of P19 EC cells for extracellular recordings with MEAs. The highest
efficiency of neuronal differentiation from pluripotent P19 EC cells were obtained
when the undifferentiated cells were treated for four days in suspension cultures in the
presence of retinoic a
116
Conclusions and Outlook
117
Extracellular recording with microelectrode array showed the presence of GABA and
glutam ABAA receptors and non-NMDA type
lutamate receptors were also shown to be present in these cultures. P19-derived
de arrays.
ate receptors in P19-derived neurons. G
g
neuronal networks formed on microeletrode arrays were predominantly GABAergic.
Extracellular recording with microelectrode array of OR5 transfected P19-derived
neurons could not be obtained although OR5 was found to be expressed in culture. It
would be interesting to transfect P19-derived neurons with “alternative”
transmembrane receptors such as acetylcholine receptors and observe the network
responses on microelectro
P19-derived neurons grown on microelectrode arrays have reasonably good
physiological responses to the drugs that were added. P19-derived neuronal networks
grown on MEAs could be used as a platform for biosensor application.
References1. Pancrazio, J. J.; Whelan, J. P.; Borkholder, D. A.; Ma, W.; Stenger, D. A.,
Development and application of cell-basedEngineering 1999, 27, (6), 697-711.
biosensors. Annals of Biomedical
. Stenger, D. A.; Gross, G. W.; Keefer, E. W.; Shaffer, K. M.; Andreadis, J. D.;
eptors. Journal of Neuroscience 1994, 14, (9), 5429-36. N.; Prasad, A.; Gillespie, L. L.; Paterno, G. D., Developmental
expression of functional GABAA receptors containing the gamma 2 subunit in
, Biological application of microelectrode arrays in drug sic research. Analytical & Bioanalytical Chemistry 2003, 377,
(3), 486-95.
erica 1975, 72, (4), 1441-5. . Isaac, J. T.; Ashby, M.; McBain, C. J., The role of the GluR2 subunit in
AMPA receptor function and synaptic plasticity. Neuron 2007, 54, (6), 859-
0. Jones-Villeneuve, E. M.; McBurney, M. W.; Rogers, K. A.; Kalnins, V. I., Retinoic acid induces embryonal carcinoma cells to differentiate into neurons
n P19 embryonal carcinoma cells. Mechanisms of Development 1992, 36, (3), 165-72.
3. Levine, J. M.; Flynn, P., Cell surface changes accompanying the neural
development of P19 embryonal carcinoma stem cells. Journal of Neuroscience Research 2000, 62, (3), 363-73.
2Ma, W.; Pancrazio, J. J., Detection of physiologically active compounds using cell-based biosensors. Trends in Biotechnology 2001, 19, (8), 304-9.
3. Hales, T. G.; Tyndale, R. F., Few cell lines with GABAA mRNAs have functional rec
4. Reynolds, J.
neurons derived from embryonal carcinoma (P19) cells. Brain Research. Molecular Brain Research 1996, 35, (1-2), 11-8.
5. Stett, A.; Egert, U.; Guenther, E.; Hofmann, F.; Meyer, T.; Nisch, W.; Haemmerle, H.discovery and ba
6. Hogan, B. L.; Taylor, A.; Adamson, E., Cell interactions modulate embryonal carcinoma cell differentiation into parietal or visceral endoderm. Nature 1981, 291, (5812), 235-7.
7. Martin, G. R.; Evans, M. J., Differentiation of clonal lines of teratocarcinoma cells: formation of embryoid bodies in vitro. Proceedings of the National Academy of Sciences of the United States of Am
8
71. 9. MacPherson, P. A.; McBurney, M. W., P19 embryonic carcinoma cells: a
source of cultured neurons amenable to genetic manipulation. Methods: A Companion to Methods in Enzymology 1995, 7, 238-252.
1
and glial cells. Journal of Cell Biology 1982, 94, (2), 253-62. 11. McBurney, M. W.; Reuhl, K. R.; Ally, A. I.; Nasipuri, S.; Bell, J. C.; Craig, J.,
Differentiation and maturation of embryonal carcinoma-derived neurons in cell culture. Journal of Neuroscience 1988, 8, (3), 1063-73.
12. Jonk, L. J.; de Jonge, M. E.; Kruyt, F. A.; Mummery, C. L.; van der Saag, P. T.; Kruijer, W., Aggregation and cell cycle dependent retinoic acid receptor mRNA expression i
1differentiation of an embryonal carcinoma cell line. Journal of Neuroscience 1986, 6, (11), 3374-84.
14. Staines, W. A.; Morassutti, D. J.; Reuhl, K. R.; Ally, A. I.; McBurney, M. W., Neurons Derived from P19 Embryonal Carcinoma Cells Have Varied Morphologies and Neurotransmitters. Neuroscience 1994, 58, (4), 735-751.
15. Liour, S. S.; Kapitonov, D.; Yu, R. K., Expression of gangliosides in neuronal
119
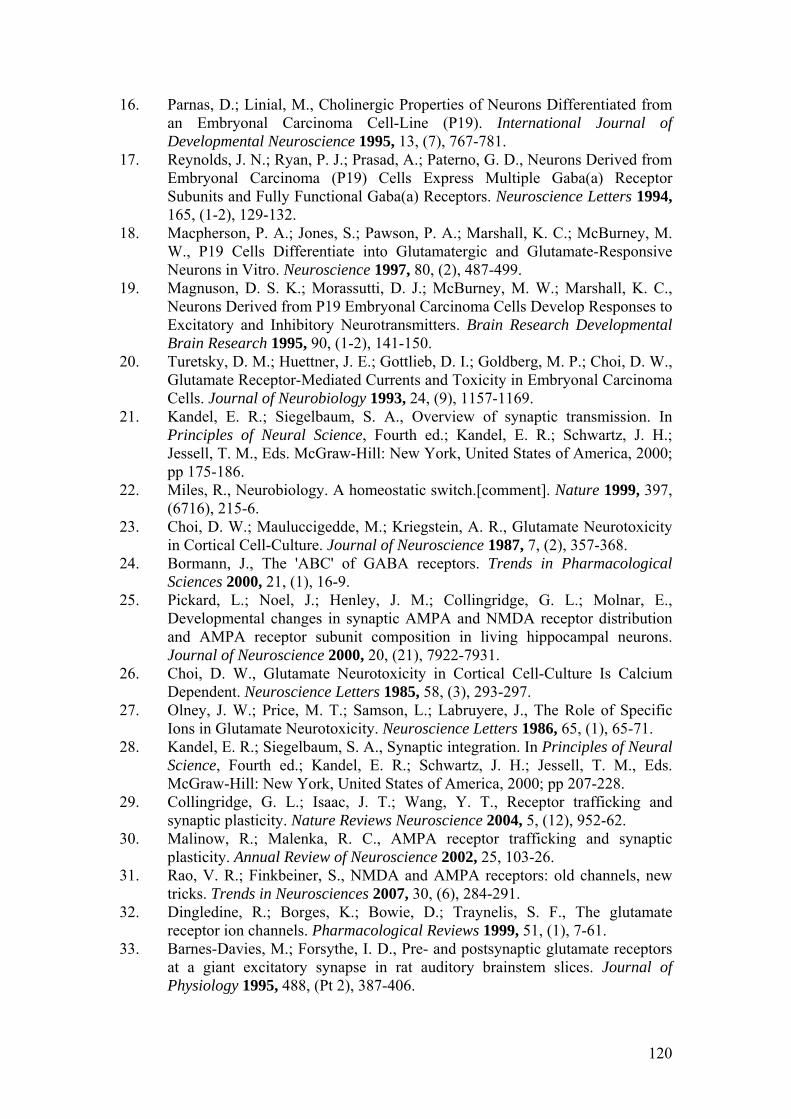
16. Parnas, D.; Linial, M., Cholinergic Properties of Neurons Differentiated from mbryonal Carcinoma Cell-Line (P19). International Journal of
tal Neuroscience 1995, 13, (7), 767-781.
a) Receptors. Neuroscience Letters 1994,
18. sponsive
19. l, K. C.,
20. oldberg, M. P.; Choi, D. W.,
21. f Neural Science, Fourth ed.; Kandel, E. R.; Schwartz, J. H.;
22. ogy. A homeostatic switch.[comment]. Nature 1999, 397,
23.
25. ard, L.; Noel, J.; Henley, J. M.; Collingridge, G. L.; Molnar, E.,
27. Role of Specific
28. sell, T. M., Eds.
29.
30. MPA receptor trafficking and synaptic
31. ciences 2007, 30, (6), 284-291.
33. rs
an EDevelopmen
17. Reynolds, J. N.; Ryan, P. J.; Prasad, A.; Paterno, G. D., Neurons Derived from Embryonal Carcinoma (P19) Cells Express Multiple Gaba(a) Receptor Subunits and Fully Functional Gaba(165, (1-2), 129-132. Macpherson, P. A.; Jones, S.; Pawson, P. A.; Marshall, K. C.; McBurney, M. W., P19 Cells Differentiate into Glutamatergic and Glutamate-ReNeurons in Vitro. Neuroscience 1997, 80, (2), 487-499. Magnuson, D. S. K.; Morassutti, D. J.; McBurney, M. W.; MarshalNeurons Derived from P19 Embryonal Carcinoma Cells Develop Responses to Excitatory and Inhibitory Neurotransmitters. Brain Research Developmental Brain Research 1995, 90, (1-2), 141-150. Turetsky, D. M.; Huettner, J. E.; Gottlieb, D. I.; GGlutamate Receptor-Mediated Currents and Toxicity in Embryonal Carcinoma Cells. Journal of Neurobiology 1993, 24, (9), 1157-1169. Kandel, E. R.; Siegelbaum, S. A., Overview of synaptic transmission. In Principles oJessell, T. M., Eds. McGraw-Hill: New York, United States of America, 2000; pp 175-186. Miles, R., Neurobiol(6716), 215-6. Choi, D. W.; Mauluccigedde, M.; Kriegstein, A. R., Glutamate Neurotoxicity in Cortical Cell-Culture. Journal of Neuroscience 1987, 7, (2), 357-368.
24. Bormann, J., The 'ABC' of GABA receptors. Trends in Pharmacological Sciences 2000, 21, (1), 16-9. PickDevelopmental changes in synaptic AMPA and NMDA receptor distribution and AMPA receptor subunit composition in living hippocampal neurons. Journal of Neuroscience 2000, 20, (21), 7922-7931.
26. Choi, D. W., Glutamate Neurotoxicity in Cortical Cell-Culture Is Calcium Dependent. Neuroscience Letters 1985, 58, (3), 293-297. Olney, J. W.; Price, M. T.; Samson, L.; Labruyere, J., The Ions in Glutamate Neurotoxicity. Neuroscience Letters 1986, 65, (1), 65-71. Kandel, E. R.; Siegelbaum, S. A., Synaptic integration. In Principles of Neural Science, Fourth ed.; Kandel, E. R.; Schwartz, J. H.; JesMcGraw-Hill: New York, United States of America, 2000; pp 207-228. Collingridge, G. L.; Isaac, J. T.; Wang, Y. T., Receptor trafficking and synaptic plasticity. Nature Reviews Neuroscience 2004, 5, (12), 952-62. Malinow, R.; Malenka, R. C., Aplasticity. Annual Review of Neuroscience 2002, 25, 103-26. Rao, V. R.; Finkbeiner, S., NMDA and AMPA receptors: old channels, new tricks. Trends in Neuros
32. Dingledine, R.; Borges, K.; Bowie, D.; Traynelis, S. F., The glutamate receptor ion channels. Pharmacological Reviews 1999, 51, (1), 7-61. Barnes-Davies, M.; Forsythe, I. D., Pre- and postsynaptic glutamate receptoat a giant excitatory synapse in rat auditory brainstem slices. Journal of Physiology 1995, 488, (Pt 2), 387-406.
120
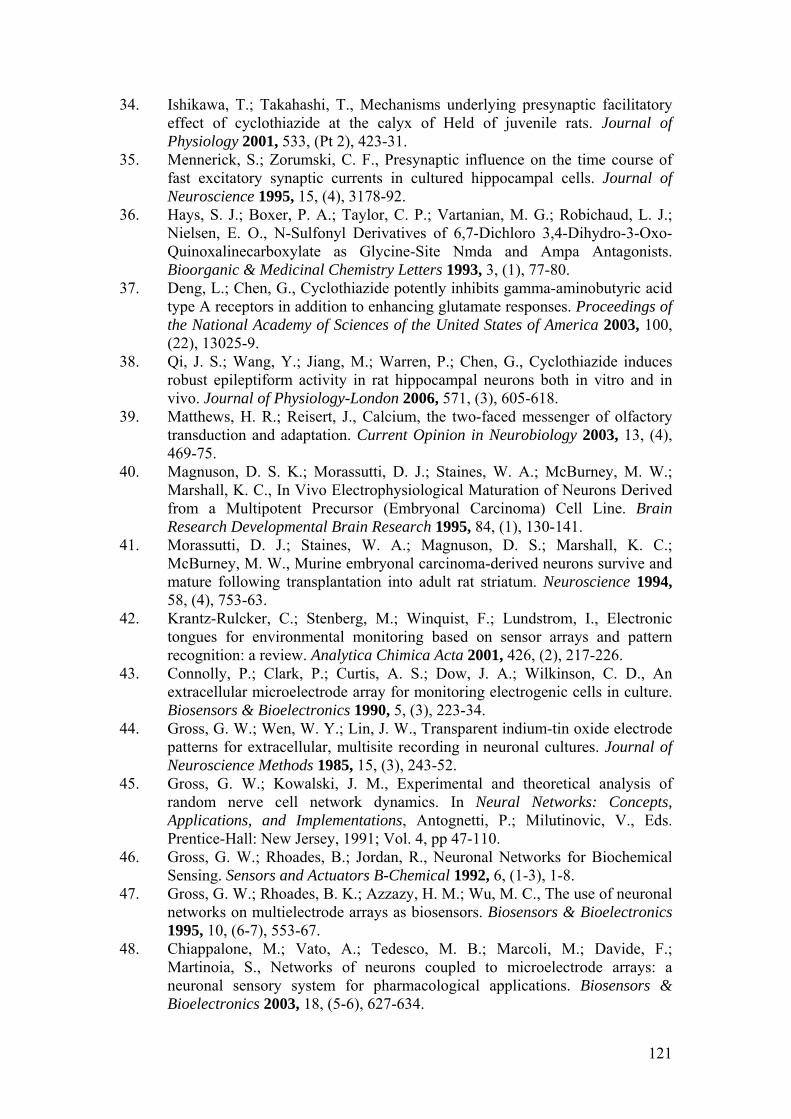
34. Ishikawa, T.; Takahashi, T., Mechanisms underlying presynaptic facilitatory effect of cyclothiazide at the calyx of Held of juvenile rats. Journal of Physiology 2001, 533, (Pt 2), 423-31.
35. Mennerick, S.; Zorumski, C. F., Presynaptic influence on the time course of fast excitatory synaptic currents in cultured hippocampal cells. Journal of Neuroscience 1995, 15, (4), 3178-92. Hays, S. J.; Boxer, P36. . A.; Taylor, C. P.; Vartanian, M. G.; Robichaud, L. J.;
77-80.
8.
40. . S. K.; Morassutti, D. J.; Staines, W. A.; McBurney, M. W.;
otent Precursor (Embryonal Carcinoma) Cell Line. Brain
41. . C.;
tion into adult rat striatum. Neuroscience 1994,
42.
enic cells in culture.
44. e
45. sis of
Eds.
46. for Biochemical
47. ., The use of neuronal
ological applications. Biosensors & Bioelectronics 2003, 18, (5-6), 627-634.
Nielsen, E. O., N-Sulfonyl Derivatives of 6,7-Dichloro 3,4-Dihydro-3-Oxo-Quinoxalinecarboxylate as Glycine-Site Nmda and Ampa Antagonists. Bioorganic & Medicinal Chemistry Letters 1993, 3, (1),
37. Deng, L.; Chen, G., Cyclothiazide potently inhibits gamma-aminobutyric acid type A receptors in addition to enhancing glutamate responses. Proceedings of the National Academy of Sciences of the United States of America 2003, 100, (22), 13025-9.
38. Qi, J. S.; Wang, Y.; Jiang, M.; Warren, P.; Chen, G., Cyclothiazide induces robust epileptiform activity in rat hippocampal neurons both in vitro and in vivo. Journal of Physiology-London 2006, 571, (3), 605-61
39. Matthews, H. R.; Reisert, J., Calcium, the two-faced messenger of olfactory transduction and adaptation. Current Opinion in Neurobiology 2003, 13, (4), 469-75. Magnuson, DMarshall, K. C., In Vivo Electrophysiological Maturation of Neurons Derived from a MultipResearch Developmental Brain Research 1995, 84, (1), 130-141. Morassutti, D. J.; Staines, W. A.; Magnuson, D. S.; Marshall, KMcBurney, M. W., Murine embryonal carcinoma-derived neurons survive and mature following transplanta58, (4), 753-63. Krantz-Rulcker, C.; Stenberg, M.; Winquist, F.; Lundstrom, I., Electronic tongues for environmental monitoring based on sensor arrays and pattern recognition: a review. Analytica Chimica Acta 2001, 426, (2), 217-226.
43. Connolly, P.; Clark, P.; Curtis, A. S.; Dow, J. A.; Wilkinson, C. D., An extracellular microelectrode array for monitoring electrogBiosensors & Bioelectronics 1990, 5, (3), 223-34. Gross, G. W.; Wen, W. Y.; Lin, J. W., Transparent indium-tin oxide electrodpatterns for extracellular, multisite recording in neuronal cultures. Journal of Neuroscience Methods 1985, 15, (3), 243-52. Gross, G. W.; Kowalski, J. M., Experimental and theoretical analyrandom nerve cell network dynamics. In Neural Networks: Concepts, Applications, and Implementations, Antognetti, P.; Milutinovic, V.,Prentice-Hall: New Jersey, 1991; Vol. 4, pp 47-110. Gross, G. W.; Rhoades, B.; Jordan, R., Neuronal NetworksSensing. Sensors and Actuators B-Chemical 1992, 6, (1-3), 1-8. Gross, G. W.; Rhoades, B. K.; Azzazy, H. M.; Wu, M. Cnetworks on multielectrode arrays as biosensors. Biosensors & Bioelectronics 1995, 10, (6-7), 553-67.
48. Chiappalone, M.; Vato, A.; Tedesco, M. B.; Marcoli, M.; Davide, F.; Martinoia, S., Networks of neurons coupled to microelectrode arrays: a neuronal sensory system for pharmac
121
49. Martinoia, S.; Bonzano, L.; Chiappalone, A.; Tedesco, A.; Marcoli, A.; Maura, G., In vitro cortical neuronal networks as a new high-sensitive system for biosensing applications. Biosensors & Bioelectronics 2005, 20, (10), 2071-
50. s cultured on microelectrode arrays.
51.
52. ductor fields.
53.
dium Combination. Journal of Neuroscience Research 1993,
54. Rezeptor. PhD
55. ies. Journal of Neuroscience Methods 2001, 110, (1-2), 17-24.
57. ized laminin
58. ashiro, K.; Sasaki, M.; Kandel, S.; Yamada, Y.; Kleinman, H.
59. G. R.;
437, (3), 471-478.
nteroposterior
63. Experimental teratoma. Current Topics in Physiology
64.
2078. Morefield, S. I.; Keefer, E. W.; Chapman, K. D.; Gross, G. W., Drug evaluations using neuronal networkBiosensors & Bioelectronics 2000, 15, (7-8), 383-396. Fromherz, P., Electrical interfacing of nerve cells and semiconductor chips. Chemphyschem 2002, 3, (3), 276-284. Plonsey, R., Action potential sources and their volume conProcedures of IEEE 1977, 65, 601-611. Brewer, G. J.; Torricelli, J. R.; Evege, E. K.; Price, P. J., Optimized Survival of Hippocampal-Neurons in B27-Supplemented Neurobasal(Tm), a New Serum-Free Me35, (5), 567-576. Lemker, E. S. Expression, Isolierung und Funktionanalyse des OR5 Reruchsrezeptors: einem Vertreter der G-Protein gekoppeltenThesis, Ludwig-Maximilians-Universität München, München, 2005. Potter, S. M.; DeMarse, T. B., A new approach to neural cell culture for long-term stud
56. Dinsmore, J. H.; Solomon, F., Inhibition of MAP2 expression affects both morphological and cell division phenotypes of neuronal differentiation. Cell 1991, 64, 817-826. Massia, S. P.; Rao, S. S.; Hubbell, J. A., Covalently immobilpeptide Tyr-Ile-Gly-Ser-Arg (YIGSR) supports cell spreading and co-localization of the 67-kilodalton laminin receptor with alpha-actinin and vinculin. Journal of Biological Chemistry 1993, 268, (11), 8053-9. Sephel, G. C.; TK., A laminin-pepsin fragment with cell attachment and neurite outgrowth activity at distinct sites. Developmental Biology 1989, 135, (1), 172-81. Sephel, G. C.; Tashiro, K. I.; Sasaki, M.; Greatorex, D.; Martin, Yamada, Y.; Kleinman, H. K., Laminin A chain synthetic peptide which supports neurite outgrowth. Biochemical & Biophysical Research Communications 1989, 162, (2), 821-9.
60. Atassi, B.; Glavinovic, M. I., Effect of cyclothiazide on spontaneous miniature excitatory postsynaptic currents in rat hippocampal pyramidal cells. Pflugers Archiv-European Journal of Physiology 1999,
61. Lin, P. X.; Kusano, K.; Zhang, Q. L.; Felder, C. C.; Geiger, P. M.; Mahan, L. C., GABA(A) receptors modulate early spontaneous excitatory activity in differentiating P19 neurons. Journal of Neurochemistry 1996, 66, (1), 233-242.
62. Durston, A. J.; Timmermans, J. P.; Hage, W. J.; Hendriks, H. F.; de Vries, N. J.; Heideveld, M.; Nieuwkoop, P. D., Retinoic acid causes an atransformation in the developing central nervous system. Nature 1989, 340, (6229), 140-4. Damjanov, I.; Solter, D., 1974, 59, 69-130. Parnas, D.; Linial, M., Acceleration of Neuronal Maturation of P19 Cells by Increasing Culture Density. Brain Research Developmental Brain Research 1997, 101, (1-2), 115-124.
122
65. Rizzino, A.; Kazakoff, P.; Nebelsick, J., Density-Induced down Regulation of Epidermal Growth-Factor Receptors. In Vitro Cellular & Developmental Biology 1990, 26, (5), 537-542. Linial,66. M.; Parnas, D., Deciphering neuronal secretion: Tools of the trade.
67. , C., Expression of
e. Journal of Neuroscience Research
68. ctive intestinal peptide is important to
69. , (3), 403-411.
ng 2005, 26, (5), 705-715.
74. lar matrix.
75. mistry
76.
h 1997, 35, (2), 165-74.
78. Vautier, D.;
79. ha, A. R.; Govindaraju, S.; Parsa, K. V. L.; Jasti, M.; Gonzalez-Garcia,
80. ad preferentially to laminin. Journal of Neuroscience Research
81. , G. A.; Higgins, D., Laminin Selectively Enhances Axonal
Biochimica Et Biophysica Acta-Reviews on Biomembranes 1996, 1286, (2), 117-152. Schilling, K.; Barco, E. B.; Rhinehart, D.; PilgrimSynaptophysin and Neuron-Specific Enolase during Neuronal Differentiation Invitro - Effects of Dimethyl-Sulfoxid1989, 24, (3), 347-354. Brown, D. R., Neuronal release of vasoaastrocytic protection of neurons from glutamate toxicity. Molecular and Cellular Neuroscience 2000, 15, (5), 465-475. Hatton, G. I., Dynamic neuronal-glial interactions: an overview 20 years later. Peptides 2004, 25
70. Oliet, S. H. R.; Piet, R.; Poulain, D. A., Control of glutamate clearance and synaptic efficacy by glial coverage of neurons. Science 2001, 292, (5518), 923-926.
71. Pfrieger, F. W.; Barres, B. A., Synaptic efficacy enhanced by glial cells in vitro. Science 1997, 277, (5332), 1684-1687.
72. Rozovsky, I.; Wei, M.; Morgan, T. E.; Finch, C. E., Reversible age impairments in neurite outgrowth by manipulations of astrocytic GFAP. Neurobiology of Agi
73. Schmalenbach, C.; Muller, H. W., Astroglia Neuron Interactions That Promote Long-Term Neuronal Survival. Journal of Chemical Neuroanatomy 1993, 6, (4), 229-237. Juliano, R. L.; Haskill, S., Signal transduction from the extracelluJournal of Cell Biology 1993, 120, (3), 577-85. Kaverina, I.; Krylyshkina, O.; Small, J. V., Regulation of substrate adhesion dynamics during cell motility [Review]. International Journal of Bioche& Cell Biology 2002, 34, (7), 746-761. Santini, M. T.; Cametti, C.; Indovina, P. L.; Morelli, G.; Donelli, G., Polylysine induces changes in membrane electrical properties of K562 cells. Journal of Biomedical Materials Researc
77. He, W.; Bellamkonda, R. V., Nanoscale neuro-integrative coatings for neural implants. Biomaterials 2005, 26, (16), 2983-2990. Vodouhe, C.; Schmittbuhl, M.; Boulmedais, F.; Bagnard, D.; Schaaf, P.; Egles, C.; Voegel, J. C.; Ogier, J., Effect of functionalization of multilayered polyelectrolyte films on motoneuron growth. Biomaterials 2005, 26, (5), 545-554. VancM.; Ballestero, R. P., Use of polyethyleneimine polymer in cell culture as attachment factor and lipofection enhancer. Bmc Biotechnology 2004, 4, -. Liesi, P.; Dahl, D.; Vaheri, A., Neurons cultured from developing rat brain attach and spre1984, 11, (3), 241-51. Lein, P. J.; BankerGrowth and Accelerates the Development of Polarity by Hippocampal-Neurons in Culture. Developmental Brain Research 1992, 69, (2), 191-197.
123
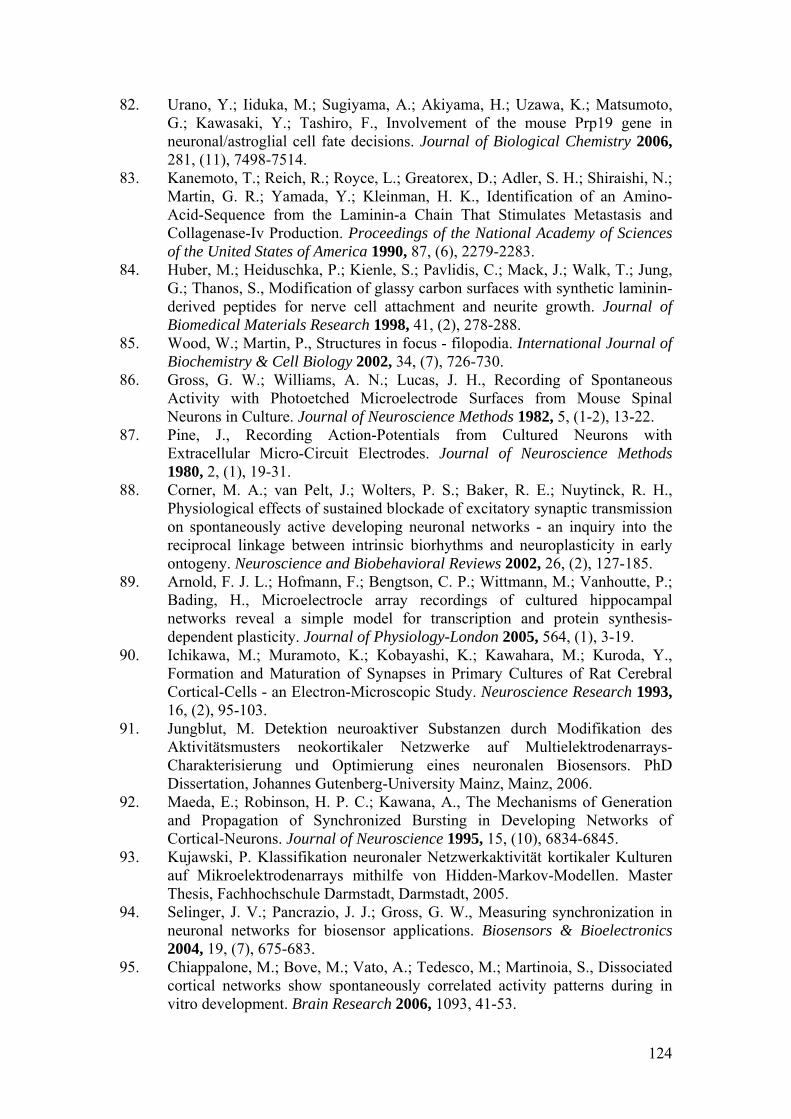
82. Urano, Y.; Iiduka, M.; Sugiyama, A.; Akiyama, H.; Uzawa, K.; Matsumoto, G.; Kawasaki, Y.; Tashiro, F., Involvement of the mouse Prp19 gene in neuronal/astroglial cell fate decisions. Journal of Biological Chemistry 2006,
83. . R.; Yamada, Y.; Kleinman, H. K., Identification of an Amino-
84. P.; Kienle, S.; Pavlidis, C.; Mack, J.; Walk, T.; Jung,
78-288.
, 34, (7), 726-730.
Culture. Journal of Neuroscience Methods 1982, 5, (1-2), 13-22.
rnal of Neuroscience Methods
88. xcitatory synaptic transmission
roscience and Biobehavioral Reviews 2002, 26, (2), 127-185.
s of cultured hippocampal
90. shi, K.; Kawahara, M.; Kuroda, Y.,
f Multielektrodenarrays-
92. of Synchronized Bursting in Developing Networks of
93. ster
94. biosensor applications. Biosensors & Bioelectronics
95. in
vitro development. Brain Research 2006, 1093, 41-53.
281, (11), 7498-7514. Kanemoto, T.; Reich, R.; Royce, L.; Greatorex, D.; Adler, S. H.; Shiraishi, N.; Martin, GAcid-Sequence from the Laminin-a Chain That Stimulates Metastasis and Collagenase-Iv Production. Proceedings of the National Academy of Sciences of the United States of America 1990, 87, (6), 2279-2283. Huber, M.; Heiduschka,G.; Thanos, S., Modification of glassy carbon surfaces with synthetic laminin-derived peptides for nerve cell attachment and neurite growth. Journal of Biomedical Materials Research 1998, 41, (2), 2
85. Wood, W.; Martin, P., Structures in focus - filopodia. International Journal of Biochemistry & Cell Biology 2002
86. Gross, G. W.; Williams, A. N.; Lucas, J. H., Recording of Spontaneous Activity with Photoetched Microelectrode Surfaces from Mouse Spinal Neurons in
87. Pine, J., Recording Action-Potentials from Cultured Neurons with Extracellular Micro-Circuit Electrodes. Jou1980, 2, (1), 19-31. Corner, M. A.; van Pelt, J.; Wolters, P. S.; Baker, R. E.; Nuytinck, R. H., Physiological effects of sustained blockade of eon spontaneously active developing neuronal networks - an inquiry into the reciprocal linkage between intrinsic biorhythms and neuroplasticity in early ontogeny. Neu
89. Arnold, F. J. L.; Hofmann, F.; Bengtson, C. P.; Wittmann, M.; Vanhoutte, P.; Bading, H., Microelectrocle array recordingnetworks reveal a simple model for transcription and protein synthesis-dependent plasticity. Journal of Physiology-London 2005, 564, (1), 3-19. Ichikawa, M.; Muramoto, K.; KobayaFormation and Maturation of Synapses in Primary Cultures of Rat Cerebral Cortical-Cells - an Electron-Microscopic Study. Neuroscience Research 1993, 16, (2), 95-103.
91. Jungblut, M. Detektion neuroaktiver Substanzen durch Modifikation des Aktivitätsmusters neokortikaler Netzwerke auCharakterisierung und Optimierung eines neuronalen Biosensors. PhD Dissertation, Johannes Gutenberg-University Mainz, Mainz, 2006. Maeda, E.; Robinson, H. P. C.; Kawana, A., The Mechanisms of Generation and Propagation Cortical-Neurons. Journal of Neuroscience 1995, 15, (10), 6834-6845. Kujawski, P. Klassifikation neuronaler Netzwerkaktivität kortikaler Kulturen auf Mikroelektrodenarrays mithilfe von Hidden-Markov-Modellen. MaThesis, Fachhochschule Darmstadt, Darmstadt, 2005. Selinger, J. V.; Pancrazio, J. J.; Gross, G. W., Measuring synchronization in neuronal networks for2004, 19, (7), 675-683. Chiappalone, M.; Bove, M.; Vato, A.; Tedesco, M.; Martinoia, S., Dissociated cortical networks show spontaneously correlated activity patterns during
124
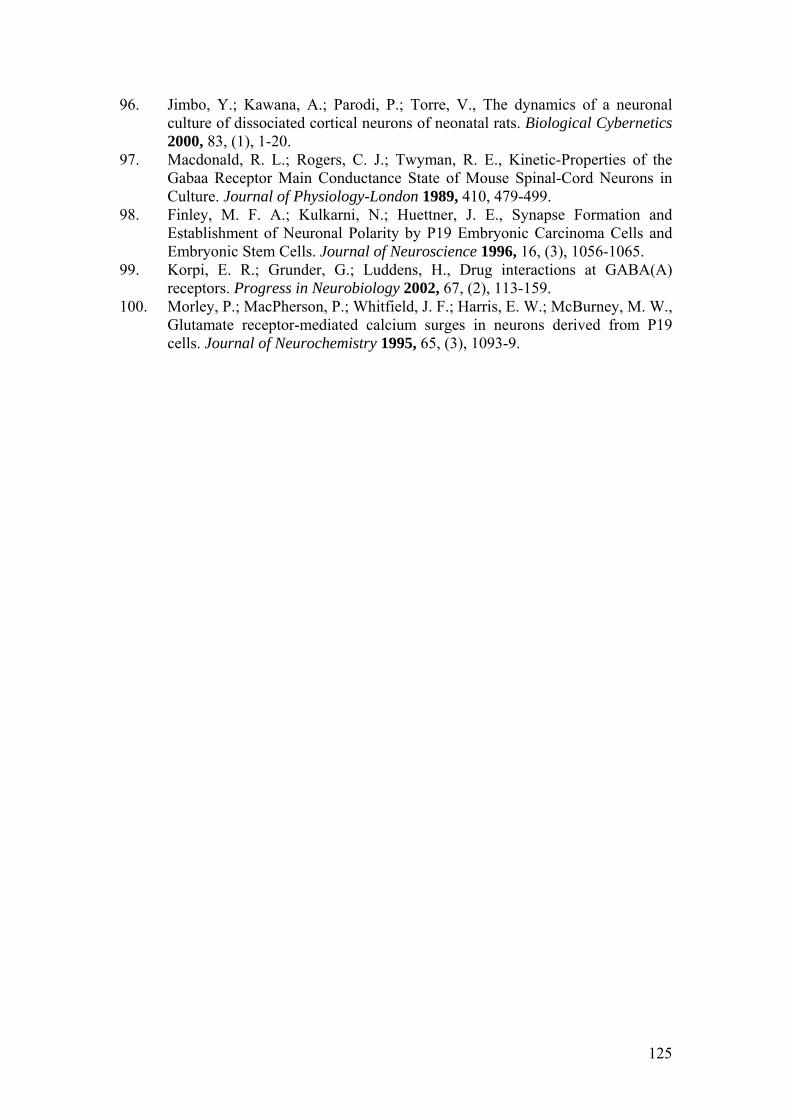
96. Jimbo, Y.; Kawana, A.; Parodi, P.; Torre, V., The dynamics of a neuronal culture of dissociated cortical neurons of neonatal rats. Biological Cybernetics 2000, 83, (1), 1-20. Macdonald, R. L.; Ro97. gers, C. J.; Twyman, R. E., Kinetic-Properties of the
98.
(3), 1056-1065.
100. ns derived from P19
Gabaa Receptor Main Conductance State of Mouse Spinal-Cord Neurons in Culture. Journal of Physiology-London 1989, 410, 479-499. Finley, M. F. A.; Kulkarni, N.; Huettner, J. E., Synapse Formation and Establishment of Neuronal Polarity by P19 Embryonic Carcinoma Cells and Embryonic Stem Cells. Journal of Neuroscience 1996, 16,
99. Korpi, E. R.; Grunder, G.; Luddens, H., Drug interactions at GABA(A) receptors. Progress in Neurobiology 2002, 67, (2), 113-159. Morley, P.; MacPherson, P.; Whitfield, J. F.; Harris, E. W.; McBurney, M. W., Glutamate receptor-mediated calcium surges in neurocells. Journal of Neurochemistry 1995, 65, (3), 1093-9.
125
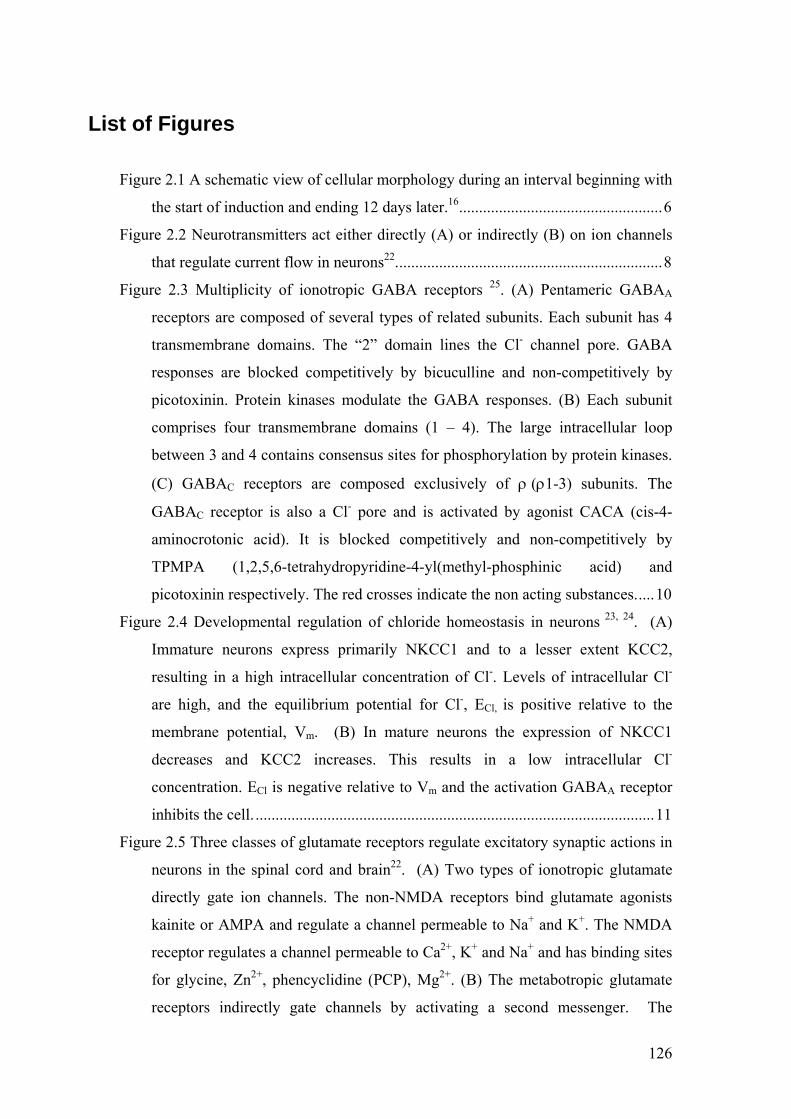
List of F
Figure
th
Figure
th
Figure tameric GABA
e
tra
responses are blocked competitively by bicuculline and non-competitively by
picotoxinin. Protein kinases modulate the GABA responses. (B) Each subunit
comprises four transmembrane domains (1 – 4). The large intracellular loop
between 3 and 4 contains consensus sites for phosphorylation by protein kinases.
(C) GABAC receptors are composed exclusively of ρ (ρ1-3) subunits. The
GABAC receptor is also a Cl- pore and is activated by agonist CACA (cis-4-
aminocrotonic acid). It is blocked competitively and non-competitively by
TPMPA (1,2,5,6-tetrahydropyridine-4-yl(methyl-phosphinic acid) and
picotoxinin respectively. The red crosses indicate the non acting substances.....10
Figure 2.4 Developmental regulation of chloride homeostasis in neurons 23, 24. (A)
Immature neurons express primarily NKCC1 and to a lesser extent KCC2,
resulting in a high intracellular concentration of Cl-. Levels of intracellular Cl-
are high, and the equilibrium potential for Cl-, ECl, is positive relative to the
membrane potential, Vm. (B) In mature neurons the expression of NKCC1
decreases and KCC2 increases. This results in a low intracellular Cl-
concentration. ECl is negative relative to Vm and the activation GABAA receptor
inhibits the cell. ....................................................................................................11
Figure 2.5 Three classes of glutamate receptors regulate excitatory synaptic actions in
neurons in the spinal cord and brain22. (A) Two types of ionotropic glutamate
directly gate ion channels. The non-NMDA receptors bind glutamate agonists
kainite or AMPA and regulate a channel permeable to Na+ and K+. The NMDA
receptor regulates a channel permeable to Ca2+, K+ and Na+ and has binding sites
for glycine, Zn2+, phencyclidine (PCP), Mg2+. (B) The metabotropic glutamate
receptors indirectly gate channels by activating a second messenger. The
igures
2.1 A schematic view of cellular morphology during an interval beginning with 16e start of induction and ending 12 days later. ...................................................6
2.2 Neurotransmitters act either directly (A) or indirectly (B) on ion channels 22at regulate current flow in neurons ...................................................................8
2.3 Multiplicity of ionotropic GABA receptors 25. (A) Pen A
r ceptors are composed of several types of related subunits. Each subunit has 4
nsmembrane domains. The “2” domain lines the Cl- channel pore. GABA
126
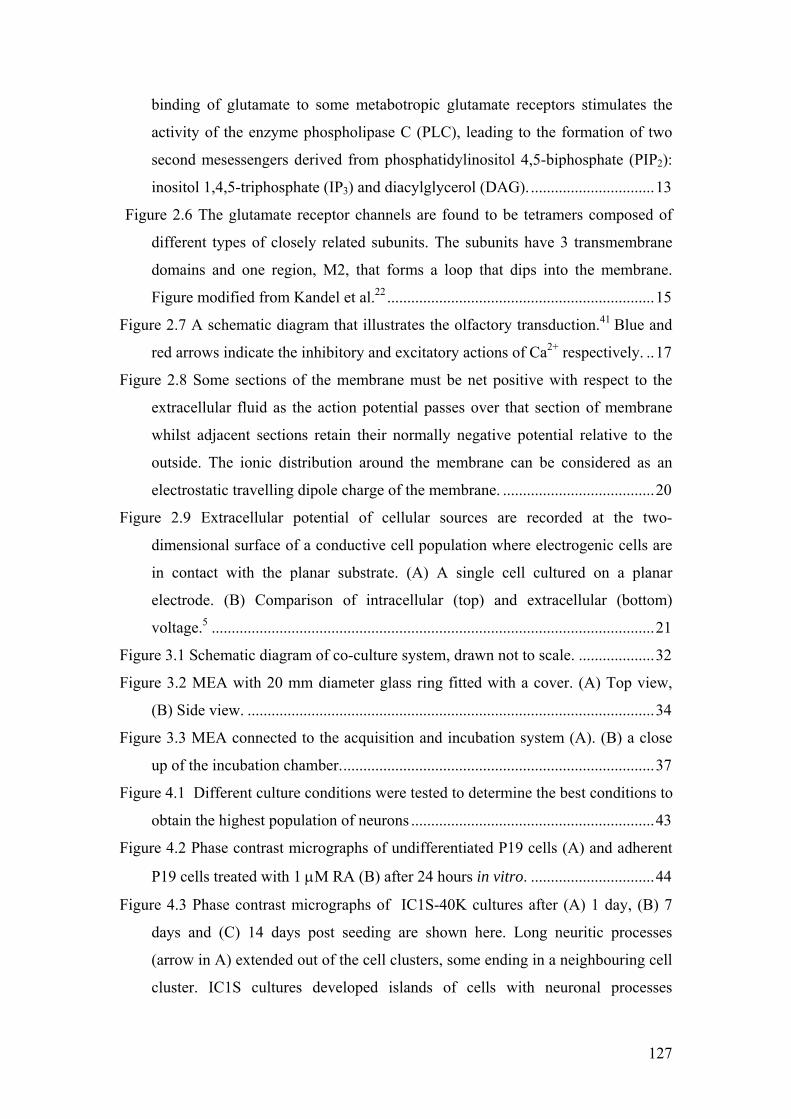
binding of glutamate to some metabotropic glutamate receptors stimulates the
enzyme phospholipase C (PLC), leading to the formation of two
second mesessengers derived from phosphatidylinositol 4,5-biphosphate (PIP2):
Fig
Figu
Figu
Figu
Figu
Figu
Figu
Figu
Figu
o
activity of the
inositol 1,4,5-triphosphate (IP3) and diacylglycerol (DAG). ...............................13
ure 2.6 The glutamate receptor channels are found to be tetramers composed of
different types of closely related subunits. The subunits have 3 transmembrane
domains and one region, M2, that forms a loop that dips into the membrane.
Figure modified from Kandel et al.22 ...................................................................15
re 2.7 A schematic diagram that illustrates the olfactory transduction.41 Blue and
red arrows indicate the inhibitory and excitatory actions of Ca2+ respectively. ..17
re 2.8 Some sections of the membrane must be net positive with respect to the
extracellular fluid as the action potential passes over that section of membrane
whilst adjacent sections retain their normally negative potential relative to the
outside. The ionic distribution around the membrane can be considered as an
electrostatic travelling dipole charge of the membrane. ......................................20
re 2.9 Extracellular potential of cellular sources are recorded at the two-
dimensional surface of a conductive cell population where electrogenic cells are
in contact with the planar substrate. (A) A single cell cultured on a planar
electrode. (B) Comparison of intracellular (top) and extracellular (bottom)
voltage.5 ...............................................................................................................21
re 3.1 Schematic diagram of co-culture system, drawn not to scale. ...................32
re 3.2 MEA with 20 mm diameter glass ring fitted with a cover. (A) Top view,
(B) Side view. ......................................................................................................34
re 3.3 MEA connected to the acquisition and incubation system (A). (B) a close
up of the incubation chamber...............................................................................37
re 4.1 Different culture conditions were tested to determine the best conditions to
obtain the highest population of neurons .............................................................43
Figure 4.2 Phase contrast micrographs of undifferentiated P19 cells (A) and adherent
P19 cells treated with 1 µM RA (B) after 24 hours in vitro. ...............................44
re 4.3 Phase contrast micrographs of IC1S-40K cultures after (A) 1 day, (B) 7
days and (C) 14 days post seeding are shown here. Long neuritic processes
(arrow in A) extended out of the cell clusters, some ending in a neighbouring cell
cluster. IC1S cultures developed islands f cells with neuronal processes
127
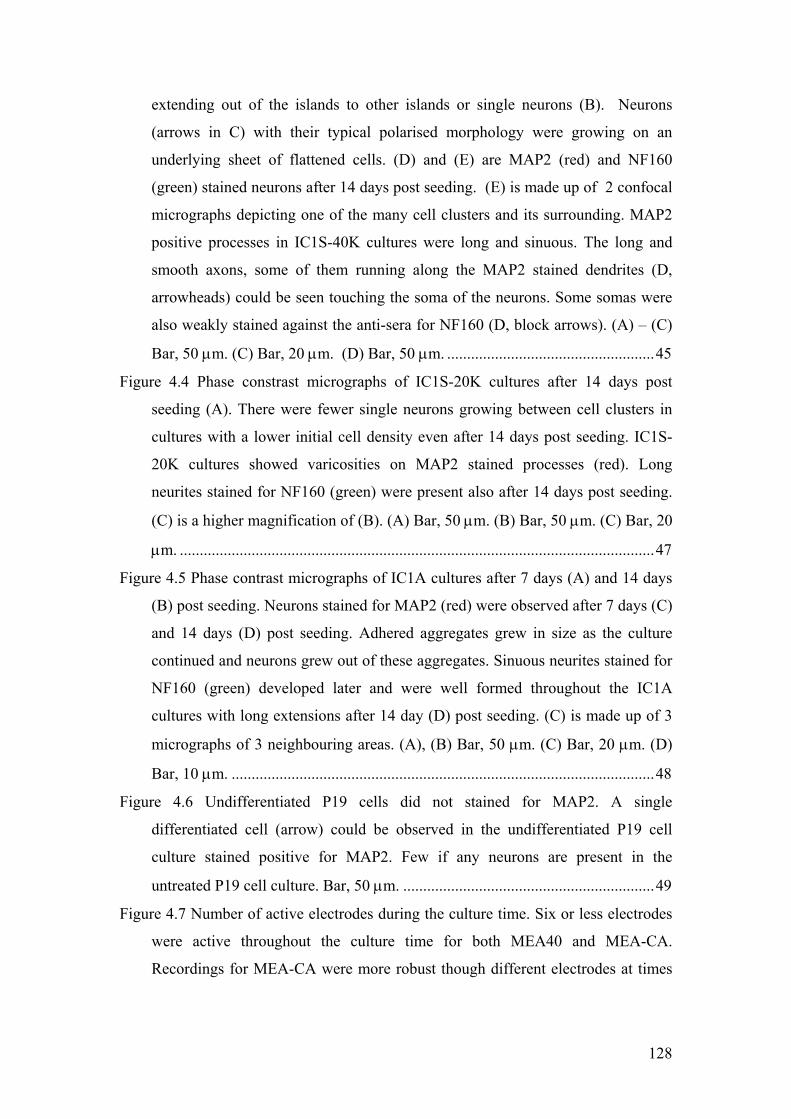
extending out of the islands to other islands or single neurons (B). Neurons
(arrows in C) with their typical polarised morphology were growing on an
underlying sheet of flattened cells. (D) and (E) are MAP2 (red) and NF160
(green) stained neurons after 14 days post seeding. (E) is made up of 2 confocal
micrographs depicting one of the many cell clusters and its surrounding. MAP2
positive processes in IC1S-40K cultures were long and sinuous. The long and
smooth axons, some of them running along the MAP2 stained dendrites (D,
arrowheads) could be seen touching the soma of the neurons. Some somas were
also weakly stained against the anti-sera for NF160 (D, block arrows). (A) – (C)
Bar, 50 µm. (C) Bar, 20 µm. (D) Bar, 50 µm. ....................................................45
Figure 4.4 Phase constrast micrographs of IC1S-20K cultures after 14 days post
seeding (A). There were fewer single neurons growing between cell clusters in
cultures with a lower initial cell density even after 14 days post seeding. IC1S-
20K cultures showed varicosities on MAP2 stained processes (red). Long
neurites stained for NF160 (green) were present also after 14 days post seeding.
(C) is a higher magnification of (B). (A) Bar, 50 µm. (B) Bar, 50 µm. (C) Bar, 20
µm. .......................................................................................................................47
re 4.5 Phase contrast micrographs of IC1A cultures after 7 days (A) and 14 days
(B) post seeding. Neurons stained for MAP2 (red) were observed after 7 days (C)
and 14 days (D) post seeding. Adhered aggregates grew in size as the culture
Figu
continued and neurons grew out of these aggregates. Sinuous neurites stained for
NF160 (green) developed later and were well formed throughout the IC1A
cultures with long extensions after 14 day (D) post seeding. (C) is made up of 3
micrographs of 3 neighbouring areas. (A), (B) Bar, 50 µm. (C) Bar, 20 µm. (D)
Bar, 10 µm. ..........................................................................................................48
Figure 4.6 Undifferentiated P19 cells did not stained for MAP2. A single
differentiated cell (arrow) could be observed in the undifferentiated P19 cell
culture stained positive for MAP2. Few if any neurons are present in the
untreated P19 cell culture. Bar, 50 µm. ...............................................................49
Figure 4.7 Number of active electrodes during the culture time. Six or less electrodes
were active throughout the culture time for both MEA40 and MEA-CA.
Recordings for MEA-CA were more robust though different electrodes at times
128
were activated during the time period monitored. Recordings for MEA40 were
only few and sporadic during the time period studied.........................................51
re 4.8 Light microscopic images of MEA40 (A) and MEA-CA (B), (C) with
numbered electrodes indicated after 35 days post seeding. The neurons in both
cultures were hard to make out after 20 days post seeding. Signal recordings
from electrodes 22, 83 and 24 were presented in the following graphs. Bar, 50
µm.
Figu
Figu
Figu
Figu
Figu
Figu
Figu
Figu
appeared as flattened or endothelial-like cells, while the neurons (n) had a
.......................................................................................................................52
re 4.9 MEA recording from electrode 22 of MEA40 after 27 days post seeding
(A) and the waveform of the spikes recorded (B). Spikes recorded from MEA40
had the typical form of the first derivative of an action potential with an initial
small positive peak and a large negative peak. The largest voltage minimum of
the spikes recorded was - 63 µV..........................................................................53
re 4.10 MEA recording of MEA-CA with 5 electrodes detecting activity at the
23rd second (A) after 32 days post seeding. The waveforms of the 50 spikes
recorded from the respective electrodes are shown in (B). Spikes recorded from
both MEAs had the typical form of the first derivative of an action potential with
an initial small positive peak and a large negative peak. The voltage minimum of
the spikes recorded ranged from -20 to -70 µV. ..................................................54
re 4.11 Raster plots of MEA-CA from day 25 to day 32 post seeding. The P19-
derived neurons in MEA-CA appeared to be firing at random at day 25 day with
increasing co-ordination of firing from day 26 to day 27. ...................................55
re 4.12 Larger aggregates were observed after 4 days (A) than 1 day (B)
suspension culture. ...............................................................................................56
re 4.13 IC2S-40K cultures after 1 day (A), 7 days (B), 14 days (C) post seeding.
(A) – (C) Bar, 50 µm. ..........................................................................................57
Figure 4.14 Synaptophysin (green) was observed in IC2S-40K cultures after 14 days
post seeding. Dendrites of P19-derived neurons were strongly stained for MAP2
(red). (A) Bar, 50 µm. (B) Bar, 20 µm. ...............................................................58
re 4.15 (A) A few P19-derived neurons were stained positive for GAD (red). (B)
MAP2 stained neurons (green) in the same area in (A). (A), (B) Bar, 20 µm....59
re 4.16 IC2S-40K cultures after 14 days post seeding showing clearly the non-
neuronal cells (o) growing beneath the neurons (n). The non-neuronal cells (o)
129
polarised appearance. Cell clusters (c) of 100 - 500 µm could be found
distributed in the whole culture. Bar, 50 µm ......................................................60
Figure 4.17 Presence of astrocytes (green) stained for glial fibrillary acidic protein
(GFAP) was observed among the neurons (red) after 14 days post seeding. (A)
Bar, 50 µm. (B) Bar, 200 µm...............................................................................60
re 4.18 (A), (B) and (C) were phase contrast pictures of IC2 cultures after 1 µM
RA and seeded at 40 000 cells/cm
Figu
Figu
Figu
2. (A) Non neuronal cells continued to
proliferate under a network of neurons after 18 days post seeding. (B) Non
neuronal cells were reduced after the addition of 5 mg/ml Ara-C on the fifth day
post seeding after 14 days post seeding. (C) Neuritc processes with few
surviving neurons (arrows) after addition of Ara-C on the fifth day post seeding
could be observed after 18 days post seeding......................................................61
Figure 4.19 Astrocytes isolated from 18 days embryos of pregnant CD rats. (A)
Optical micrographs after 11 days in vitro. (B) Immunoflorescence staining of
the astrocytes after 11 days in vitro against GFAP (green). The nuclei were
stained blue. (A) Bar, 50 µm. (B) Bar, 25 µm. ...................................................62
re 4.20 Raster plots of (A) P19-derived neuron only cultures and (B) co-cultures
after 21 days post seeding. Spontaneous firing of co-cultures remained random
and sporadic. The number of active electrodes did not improve significantly in
the co-cultures. .....................................................................................................62
re 4.21 (A) P19-derived neurons cultured on PDL-LN coated coverslips after 14
days post seeding. Synaptophysin (green) was observed in PDL-LN coated
cultures after 14 days post seeding (B). Dendrites of P19-derived neurons were
strongly stained for MAP2 (red). (C) is larger magnification of (B). (A) Bar, 100
µm. (B) and (C) Bar, 20 µm.................................................................................65
Figure 4.22 (A), (B) P19-derived neurons cultured on PEI-LN coated coverslips after
14 days post seeding. Synaptophysin (green) was observed in PEI-LN coated
cultures after 14 days post seeding (C) and (D). (D) is a larger magnification of
(C). Dendrites of P19-derived neurons were strongly stained for MAP2 (red). (A)
Bar, 100 µm. (B) Bar, 50 µm. (C), (D) and (E) Bar, 20 µm................................66
Figure 4.23 The highest activity was recorded from PEI-LN50K on the 22nd day post
seeding. Recording from electrode 77, the most active electrode, was further
analysed. (A) shows the cells surrounding electrode 77. (B) Waveform of spikes
130
recorded from electrode 77, overlay of the last 50 spikes. Probability of spike
rate (C) and (D) spike interval of electrode 77 over 2 minutes were plotted. (A)
Bar, 50 µm ...........................................................................................................68
re 4.24 Optical micrographs of PEI-LN150K cultures showing the cells
surrounding some of the active electrodes after 20 days post seeding. Bar 50 µm
Figu
Figu
Figu
Figu
Figu
Figu
Figu
..............................................................................................................................70
re 4.25 Raster plot of PEI-LN150K culture shown in figure 4.22 displaying the
synchronised firing pattern of all active electodes after 20 days post seeding (A).
Recording from electrode 73 was further analysed and shown in (B) – (D). (B)
Waveform of spikes recorded from electrode 73, overlay of the last 50 spikes.
(C) Probability of spike rate recorded from electrode 73 over 2 minutes. Insert
shows data from 0 – 20 spikes/s on the x-axis. (D) Probability of spike interval of
electrode 73 over 2 minutes of recording. ...........................................................71
re 4.26 Waveform of recording from electrode 63 in figure 4.23A. Scale of the
axis is similar to that of figure 4.25B...................................................................72
re 4.27 Raster plots (above) of 3 MEA cultures after 17, 18 and 20 days post
seeding. Total network firing rate profile (bottom) of the same MEA cultures. .74
re 4.28A Spike rate of P19-derived neurons over a period of 120 minutes in
medium without the addition of drugs. Spike rate recorded from 6 among 13
active electrodes is shown here. A half medium change was performed at the 20th
minute. .................................................................................................................78
re 4.29 Raster plots of the final three minutes recording of the native state (A)
and reference state, 47th – 50th minute of the recording (B). (A) Synchronised
network firing of MEA culture with little spontaneous activity in between the
synchronized activity could be observed. (B) revealed that the firing pattern was
random with some synchrony in the reference state. ...........................................80
re 4.30 Spike rate recorded from 4 electrodes. 6 µl of DMSO were added at the
time point indicated by the arrows. The MSR for all active electrodes in the
period before and after the addition of 10 % medium containing 6 µl DMSO was
not significantly different.....................................................................................81
Figure 4.31 MSR of the active electrodes from MEA-N06-1 (21 days post seeding)
recorded at 10s bins that displayed an increase in spike rate when BIC was
added. The initial addition of 20 µM BIC, a competitive GABA antagonist
131
resulted in an increase in spike rate but the subsequent addition of 50 µM BIC
did not cause an increase in activity. MSR after Wash 1 and Wash 2 returned to
the reference level (P > 0.05, n = 7).....................................................................83
Figure 4.32 Normalised spike rate relative to reference spike rate recorded from each
BIC-positive electrode. A higher significance in changes due to the addition of
20 µM BIC could be detected in the normalised data (P < 0.01, n = 7). The grey
dotted line at the level of the reference was drawn for comparing the other
states.The legend indicates the state and time point of the recording..................83
re 4.33 MSR of all BIC-positive electrodes from MEA-N06-1 (23 days post
seeding) recorded at 10s bins. The addition of 10 µM BIC resulted in the
increase in spike rate from 67 % the active electrodes and subsequent addition of
3 µM GABA resulted in a complete inhibition of activity recorded from all but
one electrode. Activity was recovered following wash steps.
Figu
Figu
Figu
Figu
.............................84
Figure 4.34 Average spike rate of all active electrodes from MEA-A07-2 (18 days
post seeding) at 10s bins. A lower spike rate was obtained for all electrodes when
3 µM muscimol was added. .................................................................................87
re 4.35 MSR at 10s bins of BIC-positive electrodes from MEA-A07-2 (19 days
post seeding). The addition of 50 µM BIC resulted in the increase in spike rate in
71 % of the active electrodes and the subsequent addition of muscimol (Mus), a
GABA agonist resulted in the lowering of the spike rate from 76 % of the active
electrodes. Due to the presence of BIC, the inhibition of network activity by
muscimol was less effective resulting in a more gradual spike rate reduction.
Spike rate was recovered following removal of the drugs...................................87
re 4.36 Three minutes raster plots of the same MEA culture (MEA-A07-2) in
Figure 4.35 at 19 days post seeding showing the native (A), reference (B) states
just before and the state immediately after the application of 50 µM BIC (C).
Synchronised firing pattern was observed in the native state (A). Synchronised
firing pattern was again observed in the reference state but with a higher
frequency of non-synchronised events (B). The firing pattern was again more
synchronised with a lower frequency of non-coincidental events between
electrodes immediately after the addition of 50 µM BIC (C)..............................88
re 4.37 Normalised spike rate relative to reference spike rate recorded from each
BIC-positive electrode in Figure 4.35. The grey dotted line at the level of the
132
reference was drawn for comparing the other states. The legend indicates the
state and time point of the recording....................................................................90
re 4.38 MSR recorded from only electrodes of MEA-N06-1 (24 days post Figu
Figu
Figu
Figu
Figu
Figu
seeding) that had an increase in spike rate when glutamate was added. The
addition of two different concentrations of GABA resulted in the complete
inhibition of network activity in all 19 active electrodes. The addition of 10 µM
glutamate resulted in the increase in a transient increase in MSR from 68 % of
the active electrodes. ............................................................................................91
Figure 4.39 MSR recorded from MEA-A07-3 (23 days post seeding) which was not
previously treated with GABA. (A) Only 4 out of 14 active electrodes had an
increase in MSR upon 10 µM CTZ application. The effect of CTZ application on
MSR had the same characteristic trend as that of exogenous glutamate
application seen in Figure 4.38 with an almost instantaneous overshoot which
exponentially decreased to a stable baseline. (B) MSR recorded from 71 % (10 of
14) of the active electrodes decreased when 10 µM CTZ was added..................93
re 4.40 MSR of 16 active electrodes in MEA-A07-3 (24 days post seeding). The
addition of 0.3 µM TTX eliminated all spikes and remained so during the time of
8 minutes that it was applied................................................................................94
re 4.41 Immunostaining of SFV infected RA treated P19 cells. DAPI stained
nuclei (blue) and OR5 stained (green) neuron (arrow in A) and non neuronal cell
(B) could be observed on the same day in sibling cultures when MEA recording
was performed at the 18th day post seeding. ........................................................96
re 4.42 Electron micrographs of infected cells showing active membrane bound
receptor formation. (B) is an enlarged region indicated in (A). (A) Bar, 1 µm.
(B) Bar, 200 nm. ..................................................................................................96
re 4.43 1 % agarose gel showing a 1000 bp PCR product of recombinant
pcDNA4/TO-OR5 in lanes 2 and 4. Lane 1 – without plasmid (negative control),
lane 2 and 4 – pcDNA4/TO-OR5, Lane 3 – pTNT-OR5 (positive control). .......97
re 4.44 Recombinant pcDNA4/TO-OR5 was linearised with Sap 1, desalted and
ethanol precipitated. 1 % agarose gel showed that the 6057 bp plasmid was
present after ethanol precipitation........................................................................98
Figure 4.45 RA treated P19 cells stained for β-Gal a day after electroporated with
pcDNA TM 4/TO/lacZ plasmids. (A) Bar, 50 µm. (B) Bar, 20 µm. ....................99
133
Figu
Figu
List of TTabl
Tabl
re 4.46 Two different areas of P19-derived neuronal cultures stained for β-Gal 3
days post seeding. pcDNA6/TR© and pcDNA TM 4/TO/lacZ plasmids were
transfected into the P19-derived neurons by the calcium phosphate precipitation
method. Bar, 100 µm. .......................................................................................100
re 4.47 P19-derived neurons stained against OR5 (green) and MAP2 (red) after 7
days post seeding (4 days after transfection). pcDNA TM 4/TO/lacZ and
pcDNA6/TR© plasmids were transfected into the P19-derived neurons by the
calcium phosphate precipitation method. The nuclei were stained blue (DAPI).
(A) and (B) show the same area. (C) - (F) show the same area. (A) – (F) Bar, 20
µm. .....................................................................................................................100
ables e 3.1 List of primary antibodies used. ..................................................................30
e 3.2 List of secondary antibodies used. ...............................................................30
Table 3.3 Optimisation of electroporation conditions. ................................................41
134
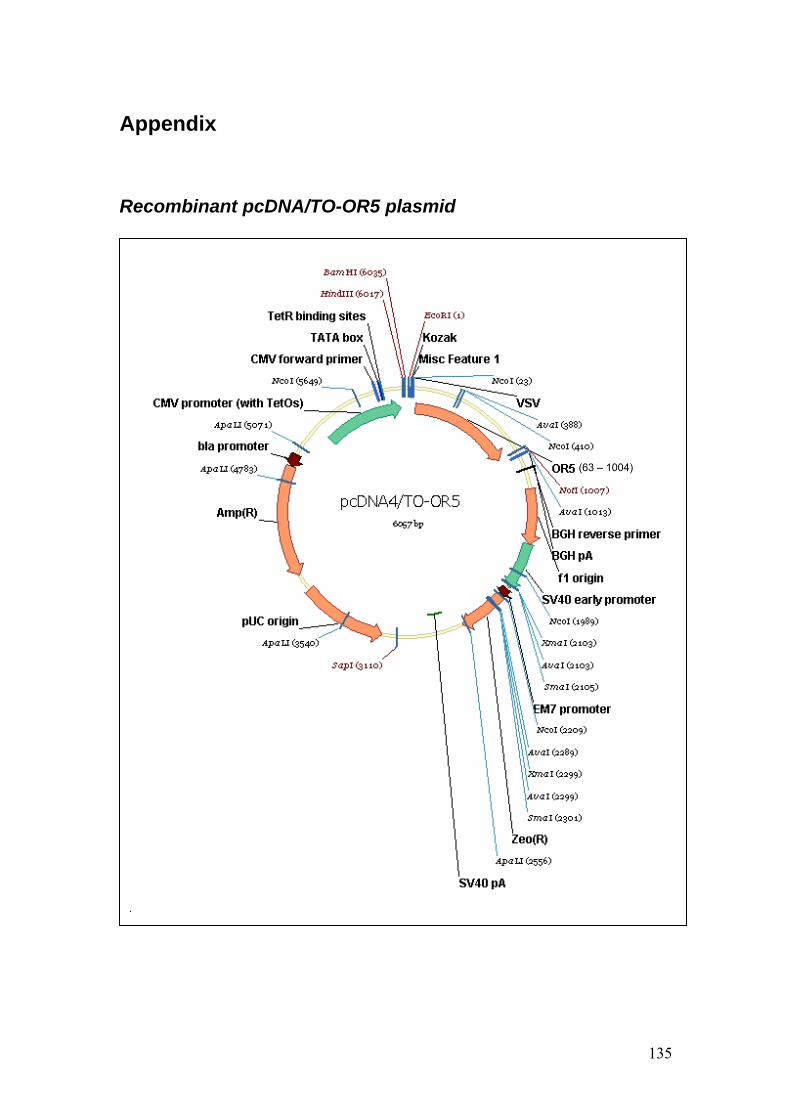
Ap
pendix
Recombinant pcDNA/TO-OR5 plasmid
(63 – 1004)
135
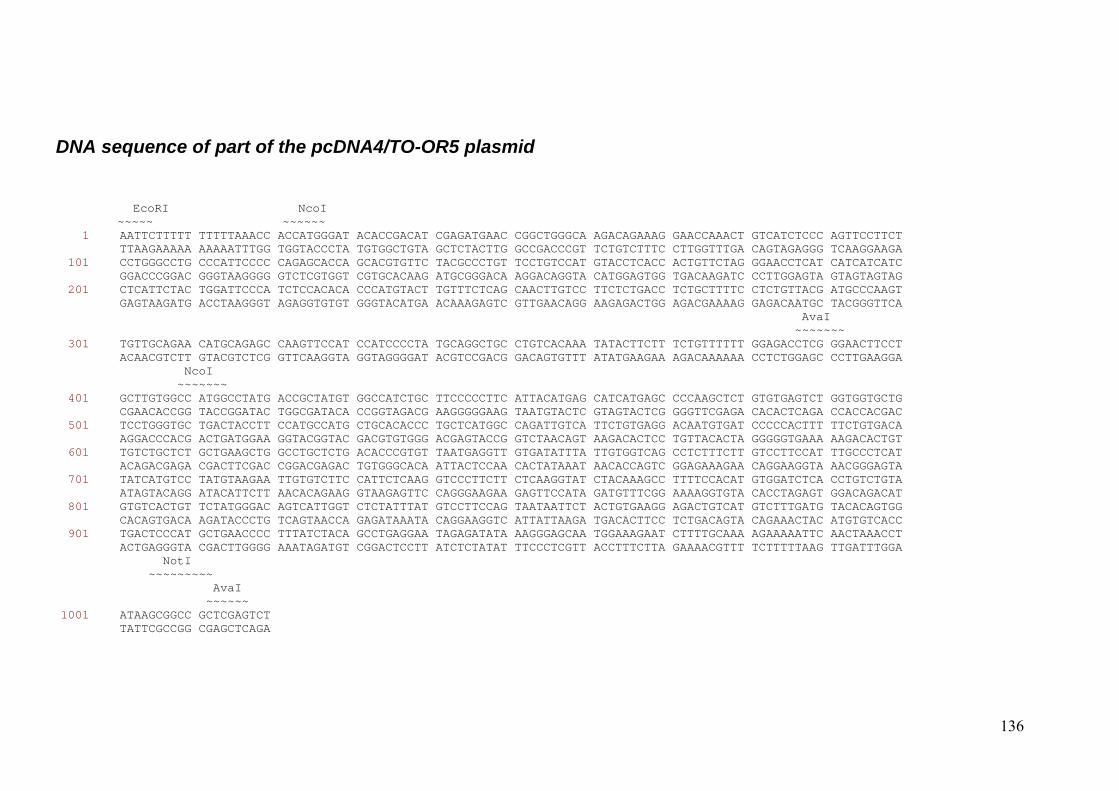
136
DNA sequence of part of the pcDNA4/TO-OR5 plasmid
EcoRI NcoI ~~~~~ ~~~~~~ 1 AATTCTTTTT TTTTTAAACC ACCATGGGAT ACACCGACAT CGAGATGAAC CGGCTGGGCA AGACAGAAAG GAACCAAACT GTCATCTCCC AGTTCCTTC TTAAGAAAAA AAAAATTTGG TGGTACCCTA TGTGGCTGTA GCTCTACTTG GCCGACCCGT TCTGTCTTTC CTTGGTTTGA CAGTAGAGGG TCAAGGAAG 101 CCTGGGCCTG CCCATTCCCC CAGAGCACCA GCACGTGTTC TACGCCCTGT TCCTGTCCAT GTACCTCACC ACTGTTCTAG GGAACCTCAT CATCATCAT GGACCCGGAC GGGTAAGGGG GTCTCGTGGT CGTGCACAAG ATGCGGGACA AGGACAGGTA CATGGAGTGG TGACAAGATC CCTTGGAGTA GTAGTAGTA 201 CTCATTCTAC TGGATTCCCA TCTCCACACA CCCATGTACT TGTTTCTCAG CAACTTGTCC TTCTCTGACC TCTGCTTTTC CTCTGTTACG ATGCCCAAG GAGTAAGATG ACCTAAGGGT AGAGGTGTGT GGGTACATGA ACAAAGAGTC GTTGAACAGG AAGAGACTGG AGACGAAAAG GAGACAATGC TACGGGTTC AvaI ~~~~~~~ 301 TGTTGCAGAA CATGCAGAGC CAAGTTCCAT CCATCCCCTA TGCAGGCTGC CTGTCACAAA TATACTTCTT TCTGTTTTTT GGAGACCTCG GGAACTTCC ACAACGTCTT GTACGTCTCG GTTCAAGGTA GGTAGGGGAT ACGTCCGACG GACAGTGTTT ATATGAAGAA AGACAAAAAA CCTCTGGAGC CCTTGAAGG NcoI ~~~~~~~ 401 GCTTGTGGCC ATGGCCTATG ACCGCTATGT GGCCATCTGC TTCCCCCTTC ATTACATGAG CATCATGAGC CCCAAGCTCT GTGTGAGTCT GGTGGTGCT CGAACACCGG TACCGGATAC TGGCGATACA CCGGTAGACG AAGGGGGAAG TAATGTACTC GTAGTACTCG GGGTTCGAGA CACACTCAGA CCACCACGA 501 TCCTGGGTGC TGACTACCTT CCATGCCATG CTGCACACCC TGCTCATGGC CAGATTGTCA TTCTGTGAGG ACAATGTGAT CCCCCACTTT TTCTGTGAC AGGACCCACG ACTGATGGAA GGTACGGTAC GACGTGTGGG ACGAGTACCG GTCTAACAGT AAGACACTCC TGTTACACTA GGGGGTGAAA AAGACACTG 601 TGTCTGCTCT GCTGAAGCTG GCCTGCTCTG ACACCCGTGT TAATGAGGTT GTGATATTTA TTGTGGTCAG CCTCTTTCTT GTCCTTCCAT TTGCCCTCA ACAGACGAGA CGACTTCGAC CGGACGAGAC TGTGGGCACA ATTACTCCAA CACTATAAAT AACACCAGTC GGAGAAAGAA CAGGAAGGTA AACGGGAGTA 701 TATCATGTCC TATGTAAGAA TTGTGTCTTC CATTCTCAAG GTCCCTTCTT CTCAAGGTAT CTACAAAGCC TTTTCCACAT GTGGATCTCA CCTGTCTGTA ATAGTACAGG ATACATTCTT AACACAGAAG GTAAGAGTTC CAGGGAAGAA GAGTTCCATA GATGTTTCGG AAAAGGTGTA CACCTAGAGT GGACAGACAT 801 GTGTCACTGT TCTATGGGAC AGTCATTGGT CTCTATTTAT GTCCTTCCAG TAATAATTCT ACTGTGAAGG AGACTGTCAT GTCTTTGATG TACACAGTGG CACAGTGACA AGATACCCTG TCAGTAACCA GAGATAAATA CAGGAAGGTC ATTATTAAGA TGACACTTCC TCTGACAGTA CAGAAACTAC ATGTGTCACC 901 TGACTCCCAT GCTGAACCCC TTTATCTACA GCCTGAGGAA TAGAGATATA AAGGGAGCAA TGGAAAGAAT CTTTTGCAAA AGAAAAATTC AACTAAACCT ACTGAGGGTA CGACTTGGGG AAATAGATGT CGGACTCCTT ATCTCTATAT TTCCCTCGTT ACCTTTCTTA GAAAACGTTT TCTTTTTAAG TTGATTTGGA NotI ~~~~~~~~~ AvaI ~~~~~~ 1001 ATAAGCGGCC GCTCGAGTCT TATTCGCCGG CGAGCTCAGA
T A C G T A
T A
G C A T T