Embed Size (px)
Citation preview
New Challenges in Agricultural Statistics
Haluk KasnakogluStatistics Division, FAO
MEXSAI, Third International Conference on Agricultural Statistics2-4 November, 2004
Cancun, Mexico
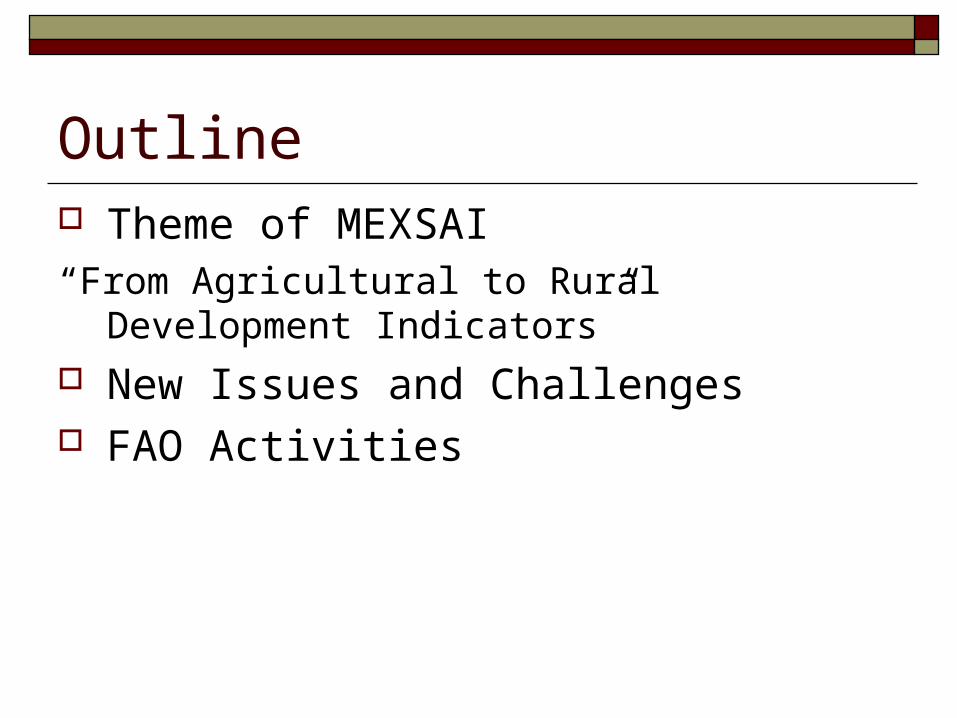
Outline Theme of MEXSAI“From Agricultural to Rural Development Indicators” New Issues and Challenges FAO Activities
Is There a Need to Review the Domain of Agricultural Statistics?
Why do we ask? Agriculture is loosing importance so we should shift to
other domains? We have exhausted agriculture and have time remaining
to do other things? We could not manage agriculture and try our luck in other
domains? No demand for current domains? The problems and issues to be addressed are changing?
Is Agriculture Getting Less Important?
Share in Population Share in Labour Force Share in Value of Output Share in International Trade Share in Public Expenditures Share in Household Expenditures
Share of Agriculture in Population
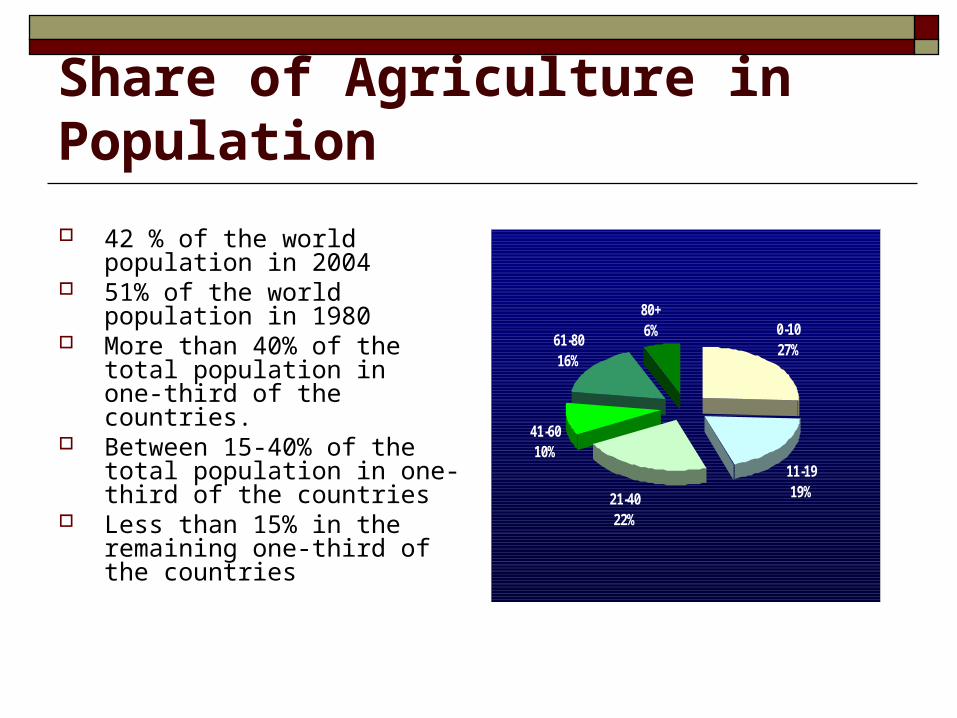
42 % of the world population in 2004
51% of the world population in 1980
More than 40% of the total population in one-third of the countries.
Between 15-40% of the total population in one-third of the countries
Less than 15% in the remaining one-third of the countries
0-1027%
11-1919%21-40
22%
41-6010%
61-8016%
80+6%
Share of Agriculture in Output Value
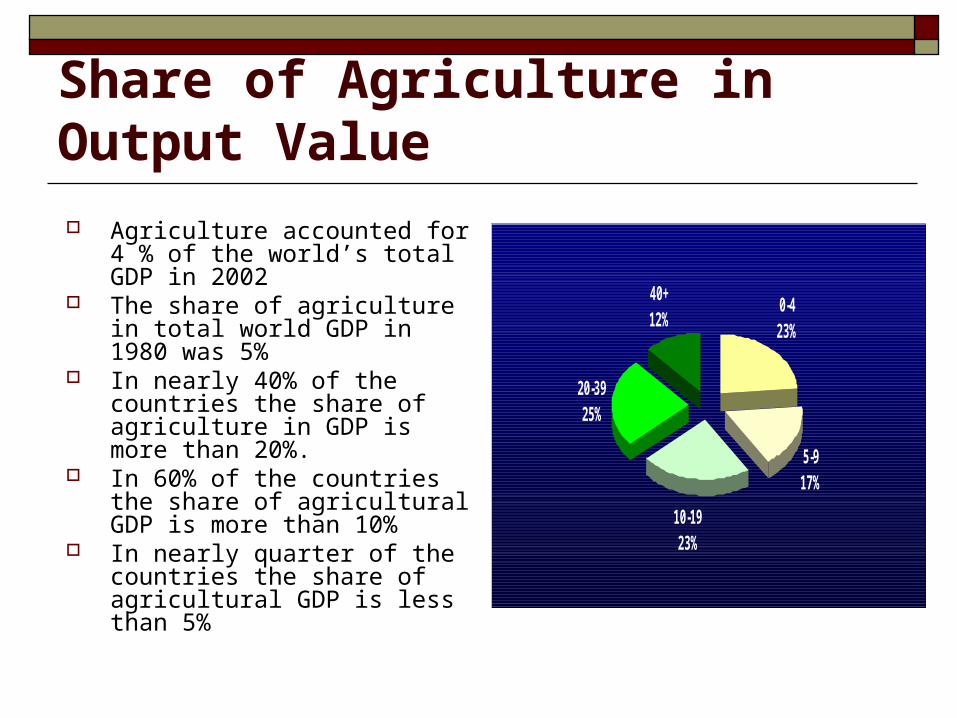
Agriculture accounted for 4 % of the world’s total GDP in 2002
The share of agriculture in total world GDP in 1980 was 5%
In nearly 40% of the countries the share of agriculture in GDP is more than 20%.
In 60% of the countries the share of agricultural GDP is more than 10%
In nearly quarter of the countries the share of agricultural GDP is less than 5%
0-423%
5-917%
10-1923%
20-3925%
40+12%
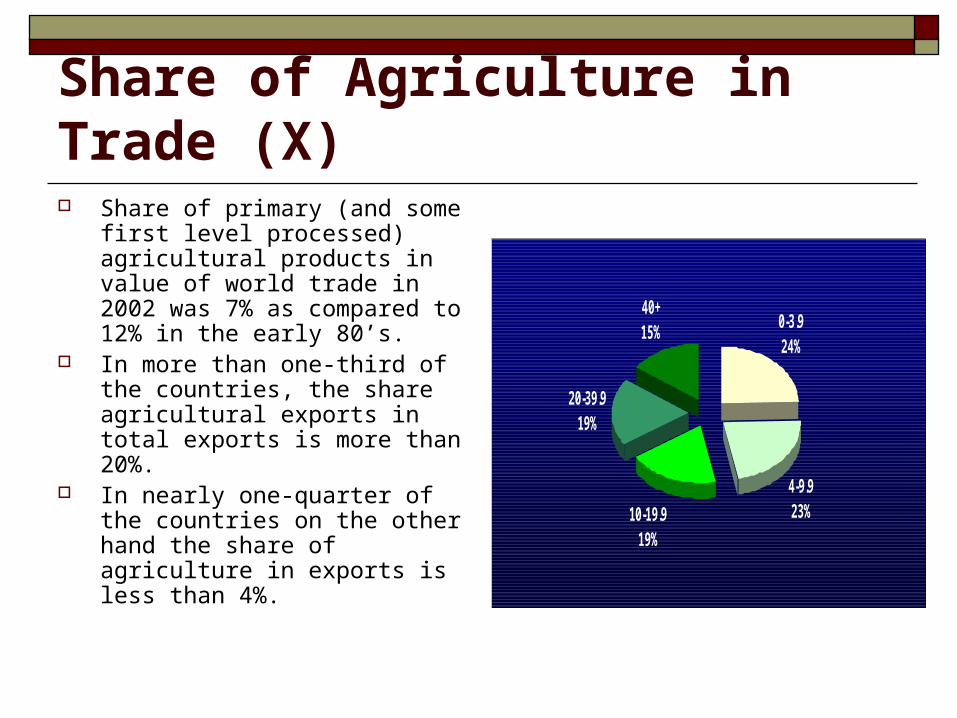
Share of Agriculture in Trade (X) Share of primary (and some first
level processed) agricultural products in value of world trade in 2002 was 7% as compared to 12% in the early 80’s.
In more than one-third of the countries, the share agricultural exports in total exports is more than 20%.
In nearly one-quarter of the countries on the other hand the share of agriculture in exports is less than 4%.
0-3.924%
4-9.923%10-19.9
19%
20-39.919%
40+15%
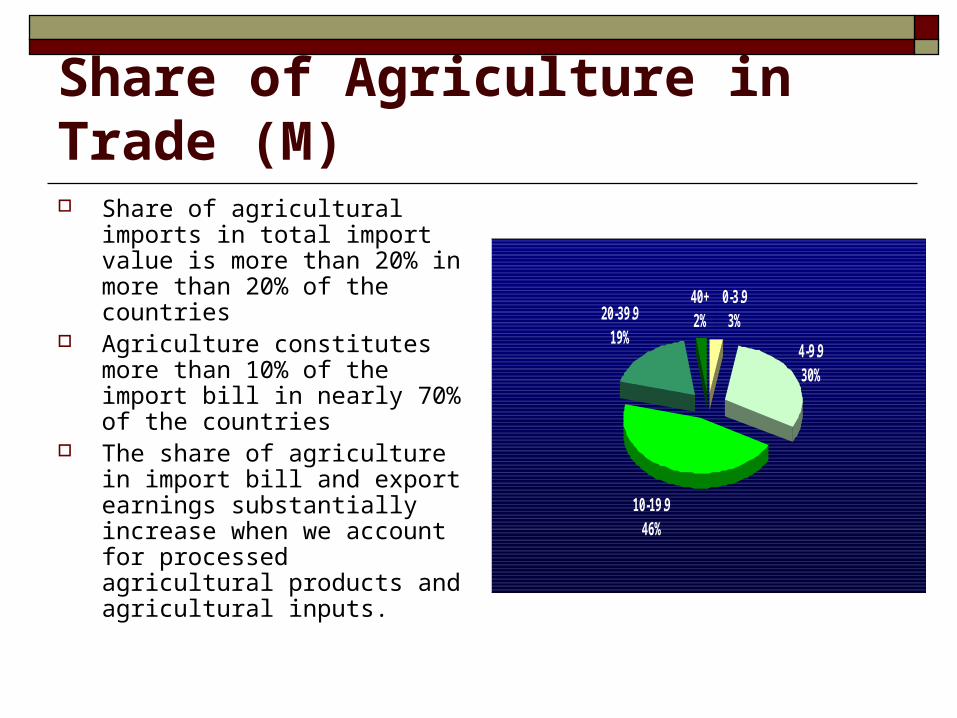
Share of Agriculture in Trade (M) Share of agricultural imports in
total import value is more than 20% in more than 20% of the countries
Agriculture constitutes more than 10% of the import bill in nearly 70% of the countries
The share of agriculture in import bill and export earnings substantially increase when we account for processed agricultural products and agricultural inputs.
4-9.930%
10-19.946%
20-39.919%
40+2%
0-3.93%
Share in Public and Private Expenditures Share of Support to Agriculture in GDP’s
About 1.5% in OECD countries About 5-10% in many developing countries
Share of Food in Household Budgets About 10-20% in developed countries About 20-40% in fast developing countries Over 50% in least developed countries Share of all agriculture related items (clothing,
wood) is higher
In summary, Agriculture preserves its importance as an economic activity
for populations in most countries The monetary value of agriculture’s output is low as before. The importance of agricultural trade in primary products is
diminishing but that of processed agricultural commodities is increasing.
Public expenditures in agriculture are in a downward trend Share in household expenditures of food and agricultural
commodities diminishes in higher income countries. The range for importance of agriculture is large And…
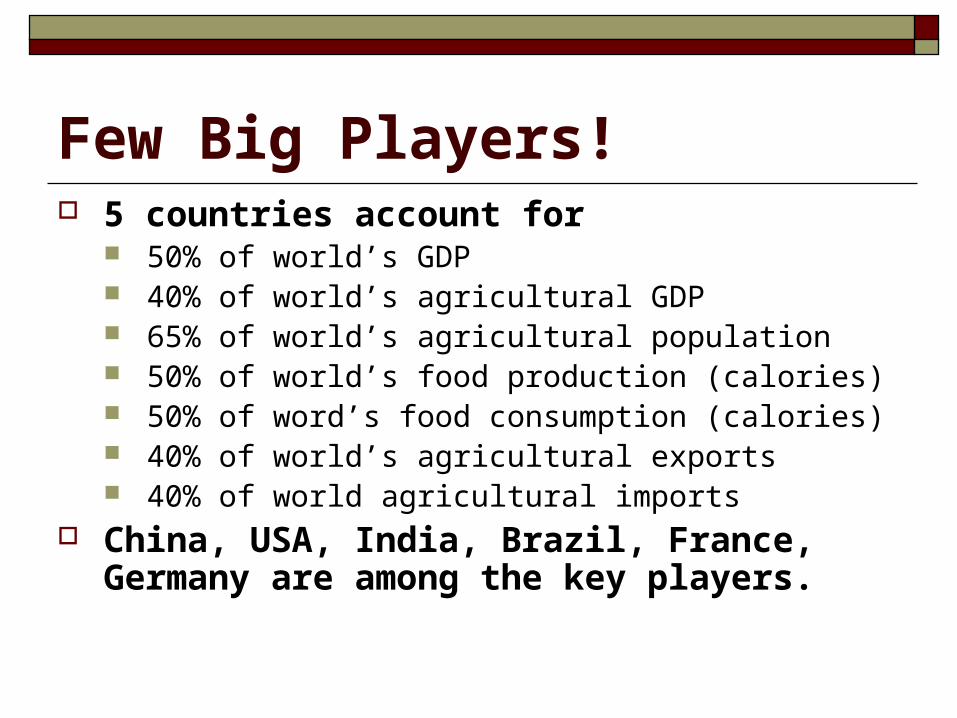
Few Big Players! 5 countries account for
50% of world’s GDP 40% of world’s agricultural GDP 65% of world’s agricultural population 50% of world’s food production (calories) 50% of word’s food consumption (calories) 40% of world’s agricultural exports 40% of world agricultural imports
China, USA, India, Brazil, France, Germany are among the key players.
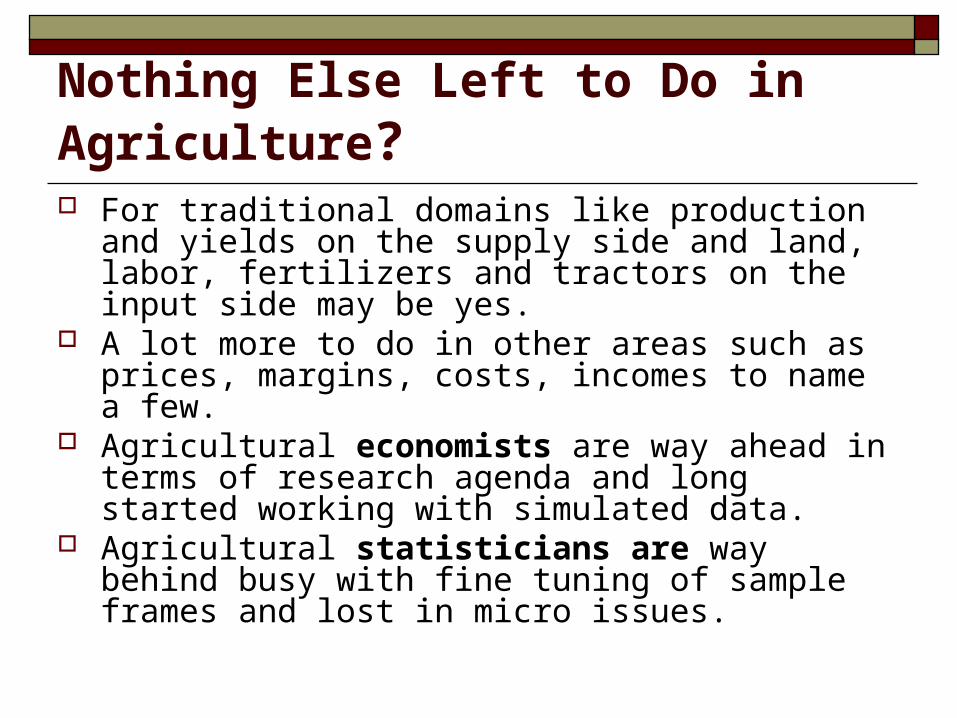
Nothing Else Left to Do in Agriculture? For traditional domains like production and yields
on the supply side and land, labor, fertilizers and tractors on the input side may be yes.
A lot more to do in other areas such as prices, margins, costs, incomes to name a few.
Agricultural economists are way ahead in terms of research agenda and long started working with simulated data.
Agricultural statisticians are way behind busy with fine tuning of sample frames and lost in micro issues.
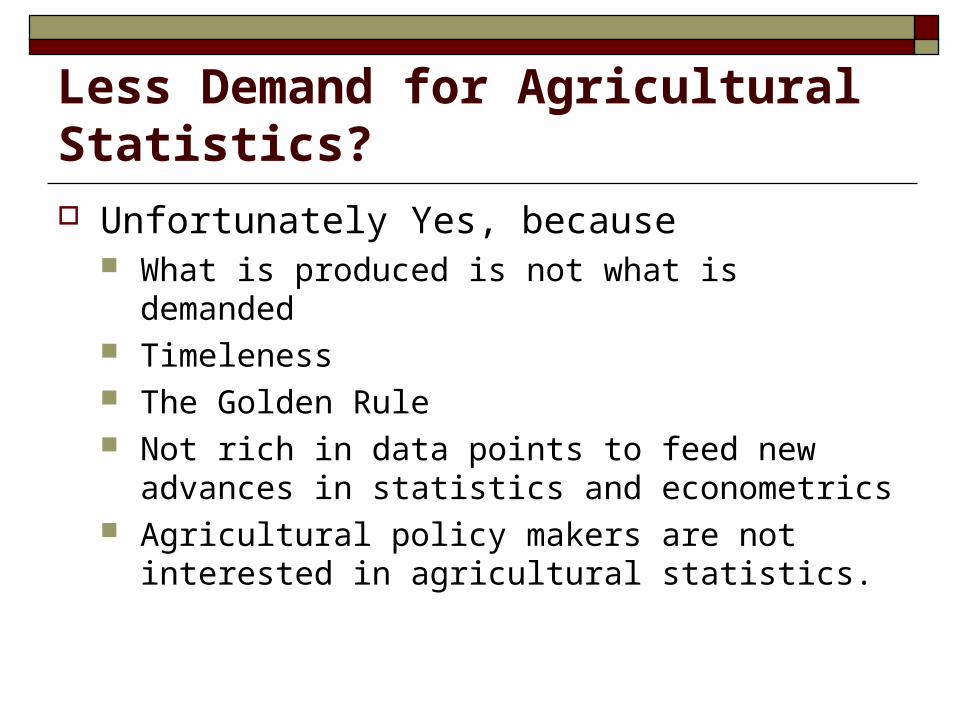
Less Demand for Agricultural Statistics?
Unfortunately Yes, because What is produced is not what is demanded Timeleness The Golden Rule Not rich in data points to feed new advances in
statistics and econometrics Agricultural policy makers are not interested in
agricultural statistics.
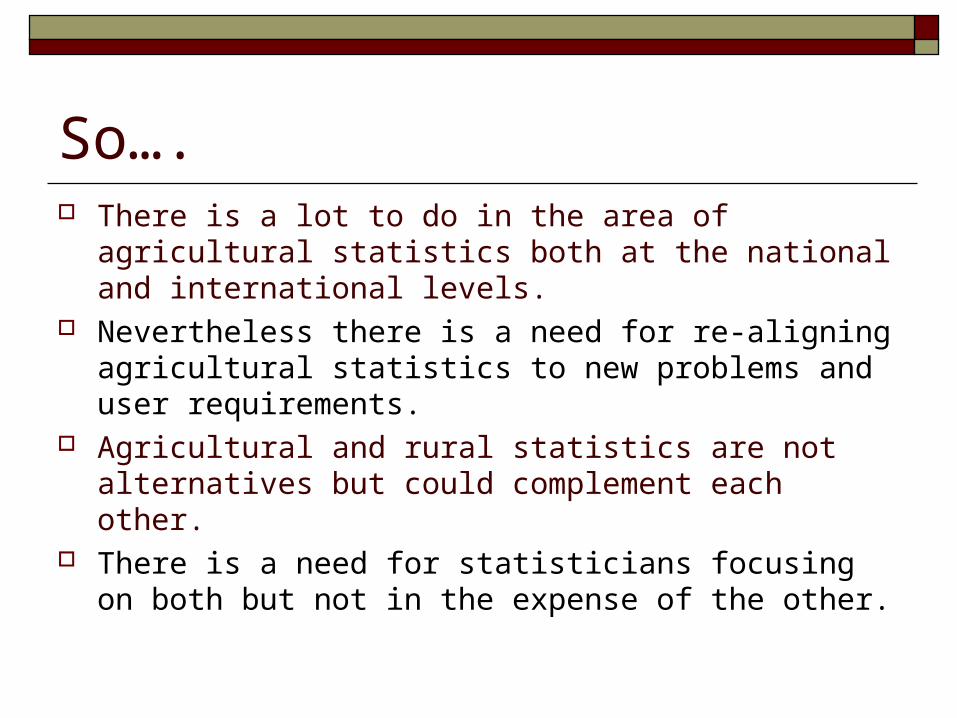
So…. There is a lot to do in the area of agricultural
statistics both at the national and international levels. Nevertheless there is a need for re-aligning
agricultural statistics to new problems and user requirements.
Agricultural and rural statistics are not alternatives but could complement each other.
There is a need for statisticians focusing on both but not in the expense of the other.
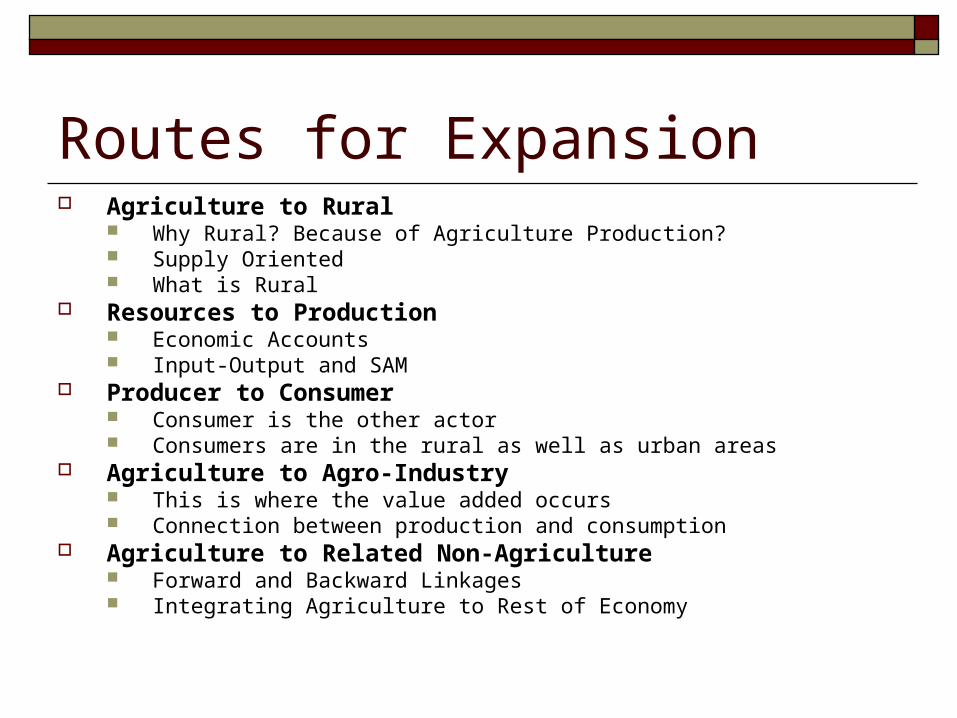
Routes for Expansion Agriculture to Rural
Why Rural? Because of Agriculture Production? Supply Oriented What is Rural
Resources to Production Economic Accounts Input-Output and SAM
Producer to Consumer Consumer is the other actor Consumers are in the rural as well as urban areas
Agriculture to Agro-Industry This is where the value added occurs Connection between production and consumption
Agriculture to Related Non-Agriculture Forward and Backward Linkages Integrating Agriculture to Rest of Economy
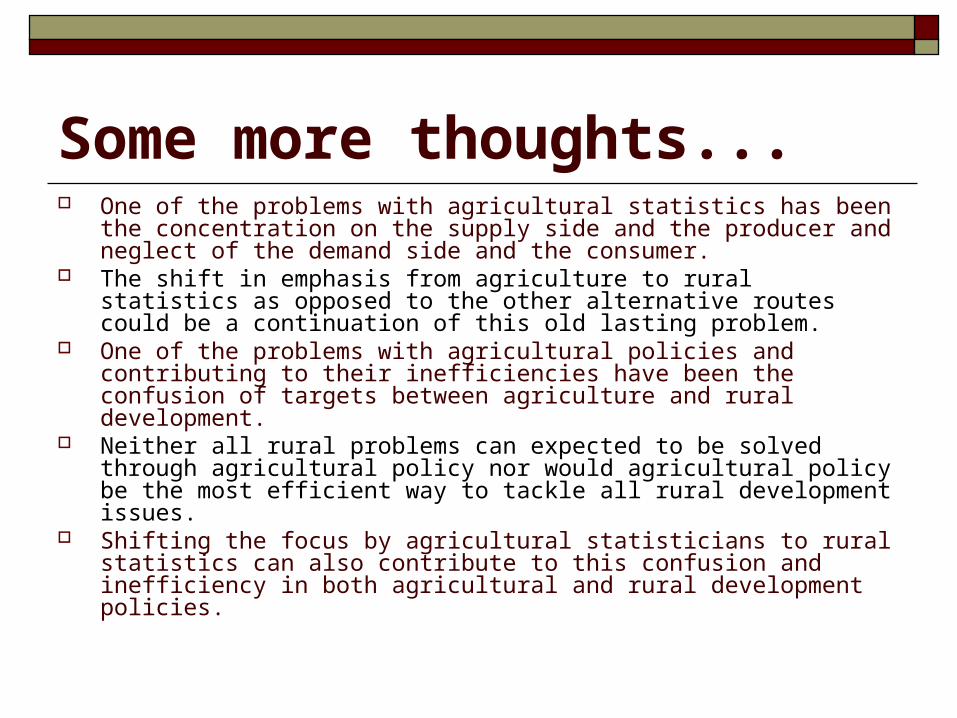
Some more thoughts... One of the problems with agricultural statistics has been the concentration
on the supply side and the producer and neglect of the demand side and the consumer.
The shift in emphasis from agriculture to rural statistics as opposed to the other alternative routes could be a continuation of this old lasting problem.
One of the problems with agricultural policies and contributing to their inefficiencies have been the confusion of targets between agriculture and rural development.
Neither all rural problems can expected to be solved through agricultural policy nor would agricultural policy be the most efficient way to tackle all rural development issues.
Shifting the focus by agricultural statisticians to rural statistics can also contribute to this confusion and inefficiency in both agricultural and rural development policies.
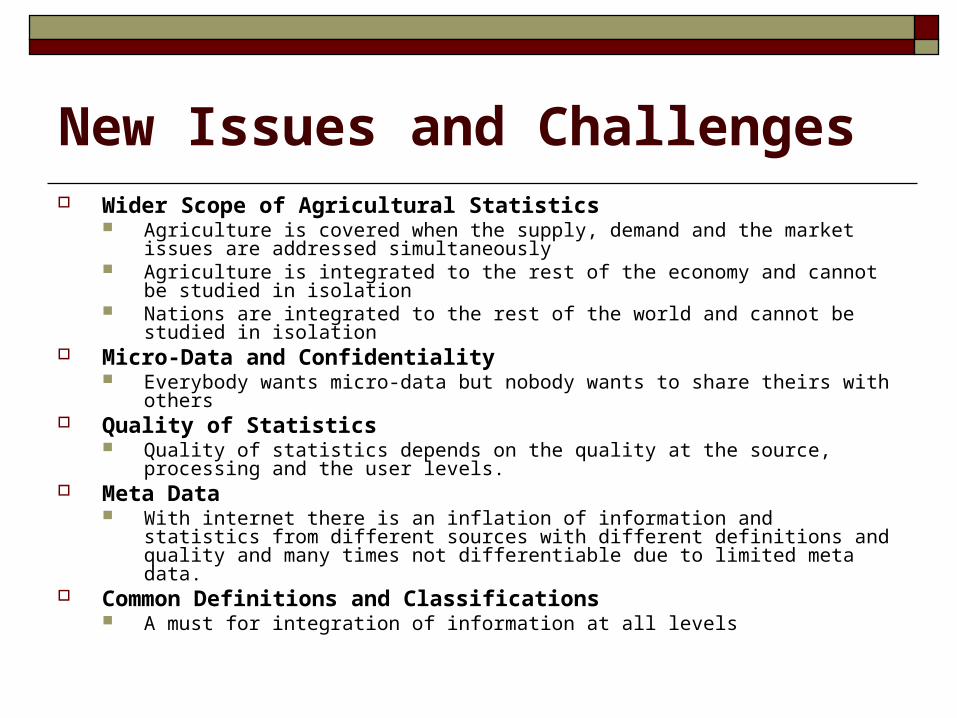
Wider Scope of Agricultural Statistics Agriculture is covered when the supply, demand and the market issues are addressed
simultaneously Agriculture is integrated to the rest of the economy and cannot be studied in isolation Nations are integrated to the rest of the world and cannot be studied in isolation
Micro-Data and Confidentiality Everybody wants micro-data but nobody wants to share theirs with others
Quality of Statistics Quality of statistics depends on the quality at the source, processing and the user levels.
Meta Data With internet there is an inflation of information and statistics from different sources
with different definitions and quality and many times not differentiable due to limited meta data.
Common Definitions and Classifications A must for integration of information at all levels
New Issues and Challenges
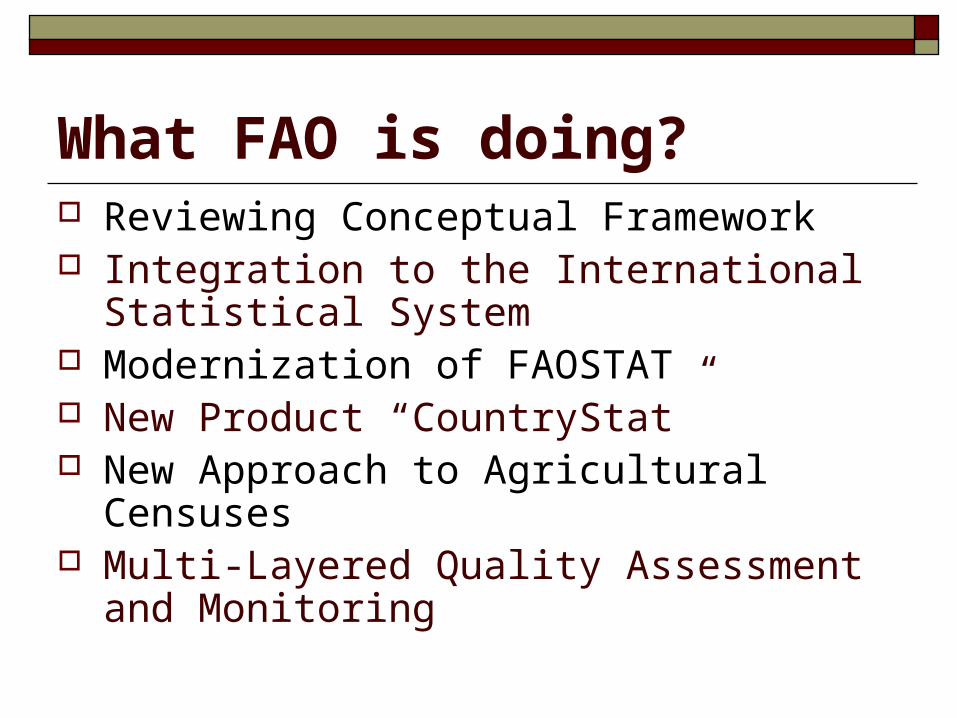
What FAO is doing? Reviewing Conceptual Framework Integration to the International Statistical
System Modernization of FAOSTAT New Product “CountryStat” New Approach to Agricultural Censuses Multi-Layered Quality Assessment and
Monitoring
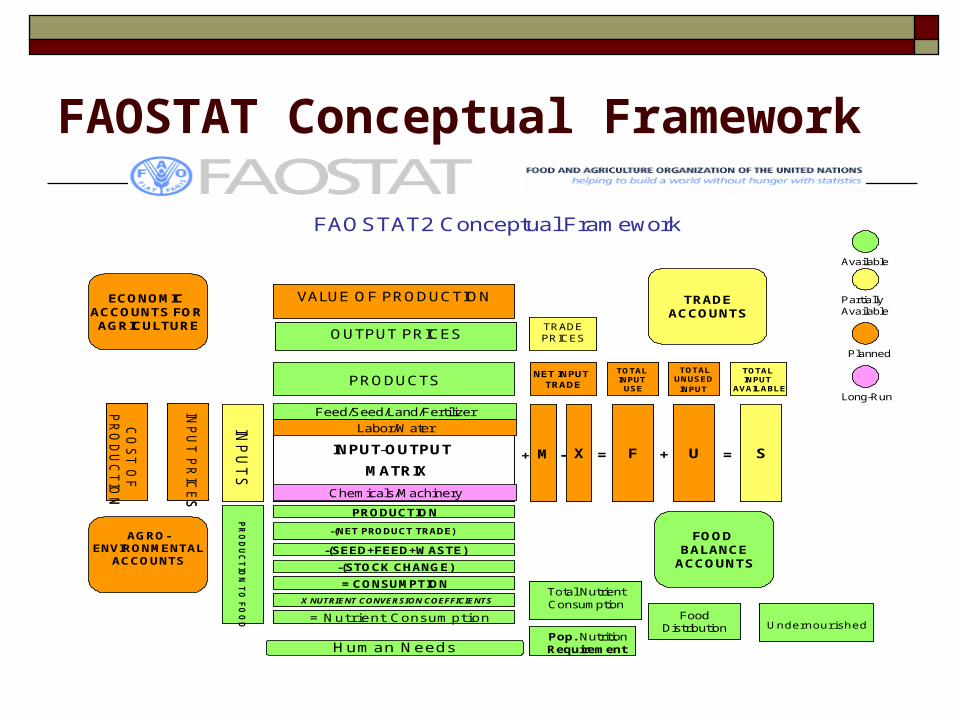
FAOSTAT Conceptual Framework
FAOSTAT2 Conceptual Framework
PRODUCTSNET INPUT
TRADE
TOTAL INPUT
USE
INP
UT
S
INPUT-OUTPUT
MATRIX
PRODUCTION
-(NET PRODUCT TRADE)
-(SEED+FEED+WASTE)
-(STOCK CHANGE)
= CONSUMPTION
X NUTRIENT CONVERSION COEFFICIENTS
= Nutrient Consumption
PR
OD
UC
TIO
N T
O F
OO
D
M X-
Total NutrientConsumptionTotal NutrientConsumption
F+ =
TOTAL INPUT
AVAILABLE
TOTALUNUSED
INPUT
U S+ =
FoodDistribution
Pop. NutritionRequirement
Undernourished
OUTPUT PRICESOUTPUT PRICES
CO
ST
OF
PR
OD
UC
TIO
N
CO
ST
OF
PR
OD
UC
TIO
N
INP
UT
PR
ICE
SIN
PU
T P
RIC
ES
VALUE OF PRODUCTIONVALUE OF PRODUCTION
TRADE PRICESTRADE PRICES
AGRO-ENVIRONMENTAL
ACCOUNTS
FOOD BALANCE
ACCOUNTS
ECONOMIC ACCOUNTS FOR AGRICULTURE
Human Needs
TRADEACCOUNTS
Available
Partially Available
Planned
Long-Run
Feed/Seed/Land/Fertilizer
Labor/Water
Chemicals/Machinery
Integration to International Statistical System
Review of Agriculture Related Classifications HS, CPC, ISIC Others (Occupation, Resources, Country, etc)
Collaboration in Compilation and Processing Trade – UNSD, OECD, FAO Labour –ILO
Data/Knowledge Exchange
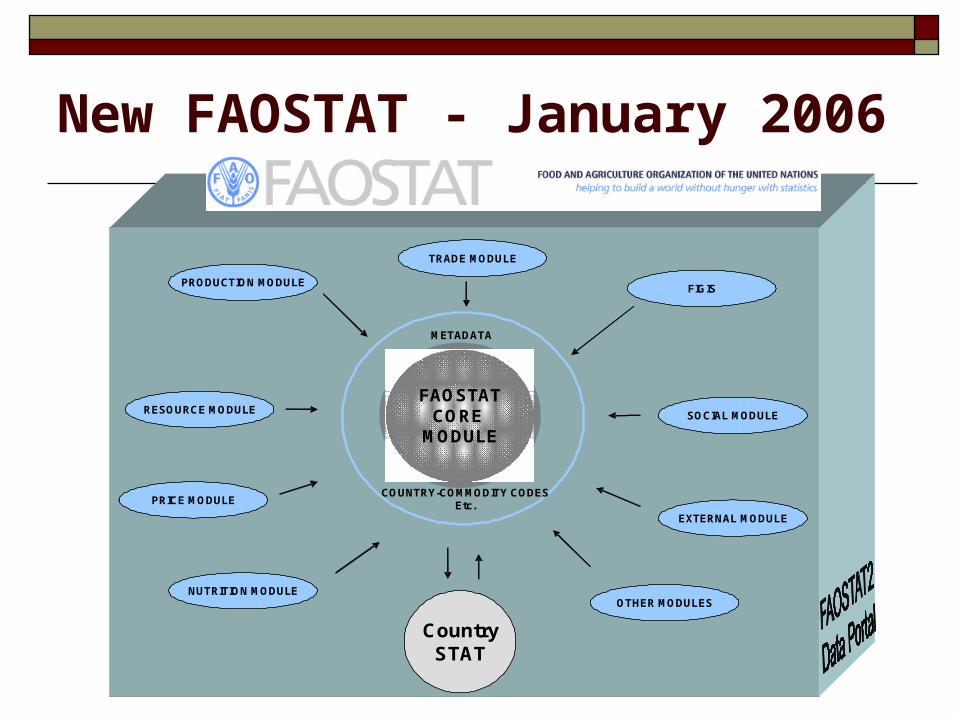
New FAOSTAT - January 2006
FAOSTATCORE
MODULE
PRODUCTION MODULEFIGIS
TRADE MODULE
PRICE MODULE
RESOURCE MODULE
EXTERNAL MODULE
SOCIAL MODULE
CountrySTAT
METADATA
COUNTRY-COMMODITY CODESEtc.
NUTRITION MODULEOTHER MODULES
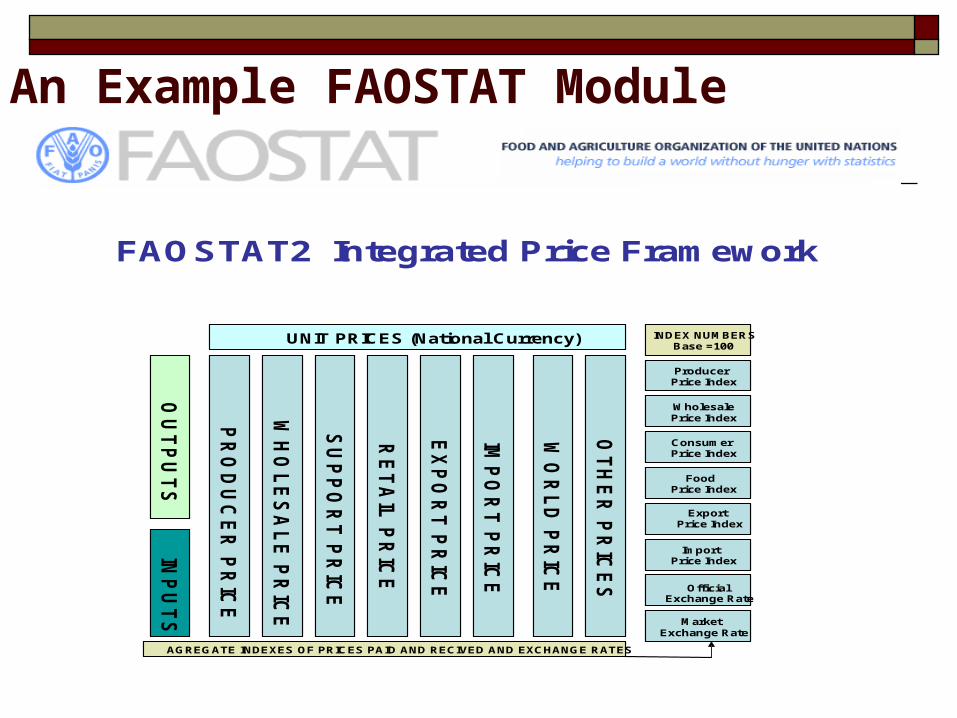
An Example FAOSTAT Module
FAOSTAT2 Integrated Price Framework
OU
TP
UT
SIN
PU
TS
PR
OD
UC
ER
PR
ICE
WH
OL
ES
AL
E P
RIC
E
SU
PP
OR
T P
RIC
E
RE
TA
IL P
RIC
E
EX
PO
RT
PR
ICE
IMP
OR
T P
RIC
E
WO
RL
D P
RIC
E
UNIT PRICES (National Currency)O
TH
ER
PR
ICE
SINDEX NUMBERS
Base =100
Producer Price Index
WholesalePrice Index
Consumer Price Index
Food Price Index
Export Price Index
Import Price Index
Market Exchange Rate
Official Exchange Rate
AGREGATE INDEXES OF PRICES PAID AND RECIVED AND EXCHANGE RATES
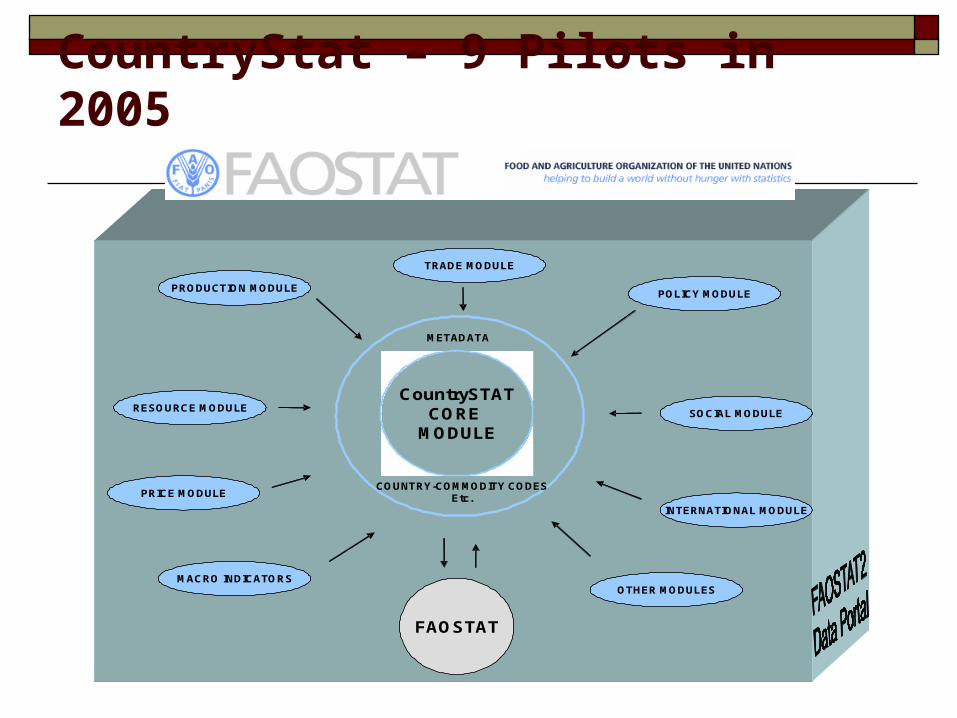
CountryStat – 9 Pilots in 2005
CountrySTATCORE
MODULE
PRODUCTION MODULEPOLICY MODULE
TRADE MODULE
PRICE MODULE
RESOURCE MODULE
INTERNATIONAL MODULE
SOCIAL MODULE
FAOSTAT
METADATA
COUNTRY-COMMODITY CODESEtc.
MACRO INDICATORSOTHER MODULES
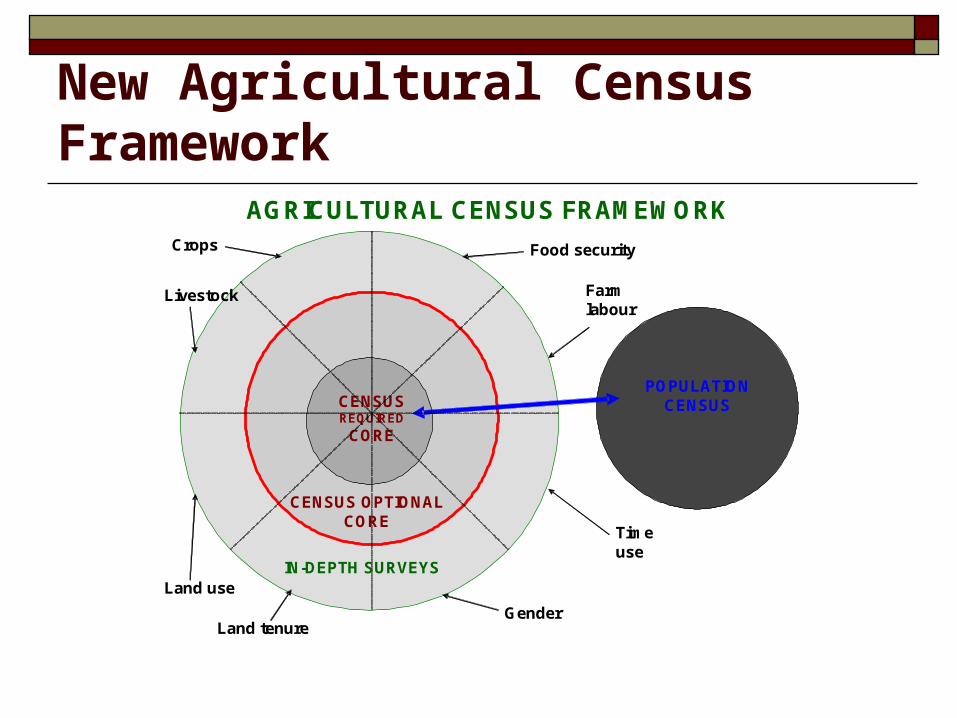
New Agricultural Census Framework
CENSUSREQUIRED
CORE
POPULATION CENSUS
AGRICULTURAL CENSUS FRAMEWORK
CENSUS OPTIONAL CORE
IN-DEPTH SURVEYS
Crops
Livestock
Land use
Land tenure
Food security
Gender
Farm labour
Time use
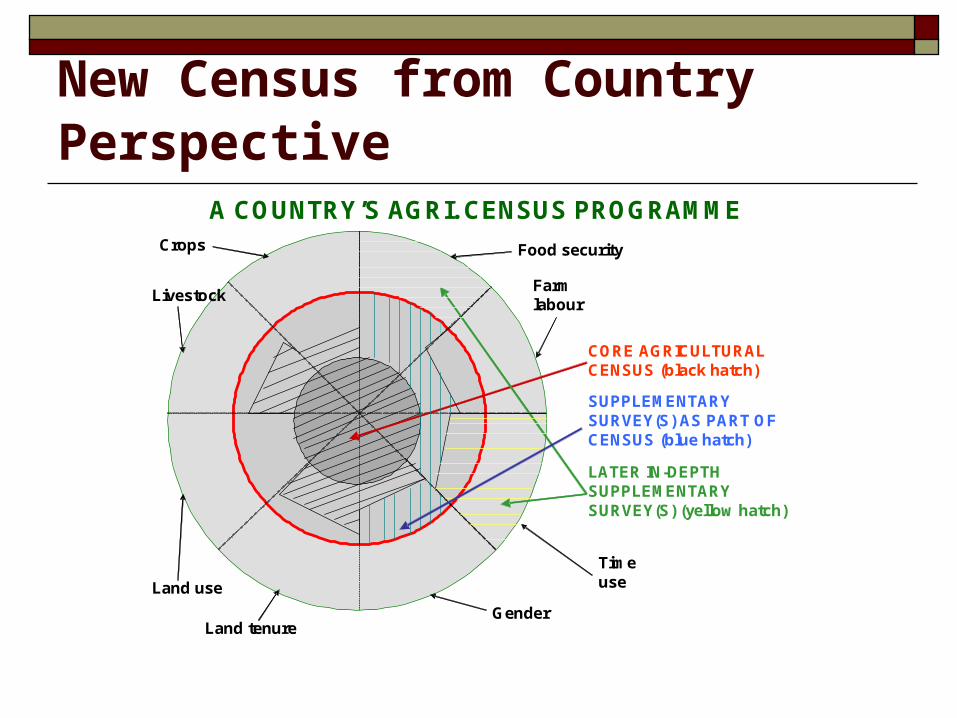
New Census from Country Perspective A COUNTRY’S AGRI. CENSUS PROGRAMME
Crops
Livestock
Land use
Land tenure
Food security
Gender
Farm labour
Time use
CORE AGRICULTURAL CENSUS (black hatch)
SUPPLEMENTARY SURVEY(S) AS PART OF CENSUS (blue hatch)
LATER IN-DEPTH SUPPLEMENTARY SURVEY(S) (yellow hatch)
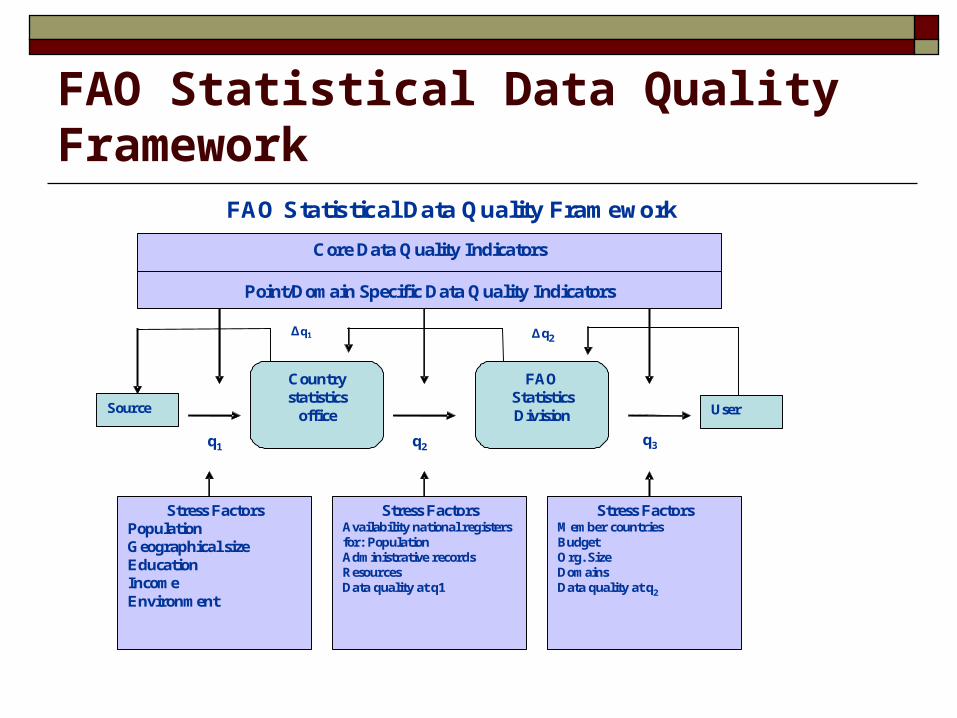
FAO Statistical Data Quality Framework
Countrystatistics
office
FAOStatisticsDivision
q1 q2
Source User
Δq1 Δq2
Stress FactorsPopulationGeographical sizeEducationIncomeEnvironment
Stress FactorsMember countriesBudgetOrg. SizeDomainsData quality at q2
Stress FactorsAvailability national registers for: Population Administrative recordsResourcesData quality at q1
Core Data Quality Indicators
Point/Domain Specific Data Quality Indicators
q3
FAO Statistical Data Quality Framework
Thank you......I invite you to visit the
FAO Statistics DivisionWeb Pagewww.fao.org/es/ess/
for our work on these new initiatives and the FAOSTAT Web Page
www.fao.org/faostat/to follow the progress in FAOSTAT and
CountryStat.