Embed Size (px)
Citation preview
New perspective on spring vegetation phenologyand global climate change based on TibetanPlateau tree-ring dataBao Yanga,1, Minhui Hea,b,1, Vladimir Shishovc,d, Ivan Tychkovc, Eugene Vaganove, Sergio Rossif,g,Fredrik Charpentier Ljungqvisth,i, Achim Bräuningb, and Jussi Grießingerb
aKey Laboratory of Desert and Desertification, Northwest Institute of Eco-Environment and Resources, Chinese Academy of Sciences, 730000 Lanzhou,China; bInstitute of Geography, University of Erlangen-Nürnberg, D-91058 Erlangen, Germany; cMathematical Methods and Information TechnologyDepartment, Siberian Federal University, 660075 Krasnoyarsk, Russia; dLaboratory of Tree-Ring Structure, V.N. Sukachev Institute of Forest, Siberian Branchof the Russian Academy of Sciences, 660036 Krasnoyarsk, Russia; eSiberian Federal University, 660041 Krasnoyarsk, Russia; fDépartement des SciencesFondamentales, Université du Québec à Chicoutimi, Chicoutimi, G7H2B1 QC, Canada; gKey Laboratory of Vegetation Restoration and Management ofDegraded Ecosystems, Provincial Key Laboratory of Applied Botany, South China Botanical Garden, Chinese Academy of Sciences, 510650 Guangzhou,China; hDepartment of History, Stockholm University, SE-106 91 Stockholm, Sweden; and iBolin Centre for Climate Research, Stockholm University, SE-10691 Stockholm, Sweden
Edited by William H. Schlesinger, Cary Institute of Ecosystem Studies, Millbrook, NY, and approved May 22, 2017 (received for review October 7, 2016)
Phenological responses of vegetation to climate, in particular to theongoing warming trend, have received much attention. However,divergent results from the analyses of remote sensing data havebeen obtained for the Tibetan Plateau (TP), the world’s largest high-elevation region. This study provides a perspective on vegetationphenology shifts during 1960–2014, gained using an innovative ap-proach based on a well-validated, process-based, tree-ring growthmodel that is independent of temporal changes in technical proper-ties and image quality of remote sensing products. Twenty compos-ite site chronologies were analyzed, comprising about 3,000 treesfrom forested areas across the TP. We found that the start of thegrowing season (SOS) has advanced, on average, by 0.28 d/y overthe period 1960–2014. The end of the growing season (EOS) hasbeen delayed, by an estimated 0.33 d/y during 1982–2014. No sig-nificant changes in SOS or EOS were observed during 1960–1981.April–June and August–September minimum temperatures are themain climatic drivers for SOS and EOS, respectively. An increase of1 °C in April–June minimum temperature shifted the dates of xylemphenology by 6 to 7 d, lengthening the period of tree-ring forma-tion. This study extends the chronology of TP phenology fartherback in time and reconciles the disparate views on SOS derived fromremote sensing data. Scaling up this analysis may improve under-standing of climate change effects and related phenological andplant productivity on a global scale.
tree rings | cambial activity | plant phenology | climate change |Tibetan Plateau
Phenology has a profound impact on vegetation growth (1),carbon balances of terrestrial ecosystems (2), and climate
change feedback mechanisms (3). The importance of phenology hasprompted many studies, mainly using ground-based observations(4–7), which provide useful phenological information at the specieslevel. However, such studies are also quite time-intensive and typ-ically focus on a few individuals in restricted geographic areas,which often limits their applicability to larger spatiotemporal scales.Changes in plant phenology can be detected on larger spatial scalesthrough near-surface remote sensing, using digital repeat photog-raphy (8), but this approach remains limited to the stand level.Another commonly used approach is satellite remote sensing, whichcan cover large areas (9–11); however, this method has yieldedinconsistent results on the Tibetan Plateau (TP) (9, 12, 13).The TP, with an average altitude of over 4,000 m above sea level
(a.s.l.), covers more than 2 million square kilometers and is stronglyaffected by ongoing climate change. Due to its vast area, and itsposition in subtropical latitudes with high incoming solar radiation,changes in vegetation period duration may have major conse-quences for regional climate and for carbon sequestration in
regional ecosystems. Trends of the Normalized Difference Vege-tation Index (NDVI) derived from Global Inventory Modelingand Mapping Studies (GIMMS) data, which are obtained fromAdvanced Very High Resolution Radiometer (AVHRR) data,have indicated that the regionally averaged onset of the springgrowth season for alpine steppes and meadows started early from1982 to the mid-1990s but was delayed from the mid-1990s to2006 (12). Yu et al. (12) hypothesized that winter and springwarming had resulted in delayed spring growth seasons on theTP. In contrast, Zhang et al. (9) identified a continuous ad-vancing trend in vegetation green-up from 1982 to 2011 on theTP after merging data from the GIMMS NDVI-based start ofthe vegetation growing season from 1982 to 2000 with SystemeProbatoire d’Observation dela Tarre (SPOT) NDVI-based startof the growing season from 2001 to 2011. Shen et al. (13) arguedthat the method used by Zhang et al. (9) did not consider theeffects of the nongrowing season NDVI on retrieved green-updates, and spring phenology showed no significant trend dur-ing the period 2000–2011 after correcting for the increasednongrowing season NDVI. These claims sparked considerable
Significance
Inconsistent results regarding the rate of change in springphenology and its relation to climatic drivers on the TibetanPlateau have been obtained in the past. We introduce anddescribe here an innovative approach based on tree-ring data,which converts daily weather data into indices of the start (andend) of the growing season. This method provides a uniquelong-term record of vegetation phenological variability overthe period 1960–2014. This approach could further be extendedto other forested regions of the world. Scaling up the analysiswould provide additional information on phenological re-sponses of terrestrial ecosystems to the ongoing climatechange across the Northern Hemisphere.
Author contributions: B.Y. and M.H. designed research; B.Y. and M.H. performed research;V.S., I.T., and E.V. contributed new reagents/analytic tools; B.Y., M.H., V.S., I.T., and E.V.analyzed data; and B.Y., M.H., V.S., E.V., S.R., F.C.L., A.B., and J.G. wrote the paper.
The authors declare no conflict of interest.
This article is a PNAS Direct Submission.
Freely available online through the PNAS open access option.
Data deposition: Tree-ring SOS and EOS data are available from the World Data Centerfor Paleoclimatology (https://www.ncdc.noaa.gov/paleo/).1To whom correspondence may be addressed. Email: [email protected] or [email protected].
This article contains supporting information online at www.pnas.org/lookup/suppl/doi:10.1073/pnas.1616608114/-/DCSupplemental.
6966–6971 | PNAS | July 3, 2017 | vol. 114 | no. 27 www.pnas.org/cgi/doi/10.1073/pnas.1616608114
controversy regarding the rate and amplitude of change in TPspring phenology, and the extent to which climatic drivers wereresponsible for any of these purported changes (10, 14–16). It hasbeen suggested that the observed delay in spring growth detectedfrom the mid-1990s to 2006 was a measurement artifact due to thereduced quality of the AVHRR NDVI data since 2001 (9).These conflicting results can be attributed to inherent defects
in satellite remote sensing data quality (9), such as coarse spa-tiotemporal resolution and limitations in phenology retrievalmethodology (13, 17). It is claimed that satellite-derived vege-tation indices are easily contaminated by adverse atmosphericconditions, such as varying aerosol concentrations (10, 15).Other background factors, including changes in snow cover (16)or vegetation coverage due to grassland degradation and/orfreezing−thawing cycles (10, 14), have been identified as possiblecauses of inaccuracy, especially in cases in which the signal isweak in vegetation green-up times detected by satellites (13). It isclear that large uncertainties remain in estimates of the remotesensing-derived variability of vegetation phenology and its cli-mate drivers on the TP. Moreover, datasets from satellite remotesensing and ground-based observations only cover the last 30 y,which limits statistical confidence in trend detection. A datasetcovering a much longer period would therefore help to resolvecurrent disagreements and increase statistical confidence levels.Herein, we suggest a method, based on well-validated, process-
based, Vaganov−Shashkin (VS)-oscilloscope model simulations oftree-ring growth data (18), to provide a unique record of vegeta-tion phenological variability over the period 1960–2014. In thismodel (SI Appendix, Materials and Methods), daily weather stationrecords are used to estimate the daily tree-ring growth rate, whichis transformed into a daily rate of xylem cell production. Theseestimates identify the dates of the first and last differentiated xy-lem cells, representing the start and the end of the growing seasonfor each year (SOS and EOS, respectively). The simulated integralgrowth rate during the growing season can be transformed to tree-ring indices by specific procedures used in the model (SI Appendix,Materials and Methods). Resulting predictions of tree-ring widthchronologies can be compared with the actual tree-ring widthdata. In this study, the model was adjusted until a significantcorrelation with observations was achieved (P < 0.05) (SI Ap-pendix, Materials and Methods and Fig. S4). Each year of thechronology was thus tied to SOS and EOS values. The method hasbeen validated for conifers using field observations of the re-lationship between daily temperature and cambial cell divisionrates (Materials and Methods). The objective of this study was (i) toprovide robust evidence for the variability of phenological recordsmodeled from TP tree-ring data for 1960–2014, and to assessdifferences between the subperiods 1960–1981 and 1982–2014—the modeled phenological time series are compared with satelliteremote sensing-derived phenological data; and (ii) to evaluate therelative effects of temperature and precipitation (including snow),with different seasonal targets, on the variability of tree-ringphenology, from the arid to humid TP subregions.
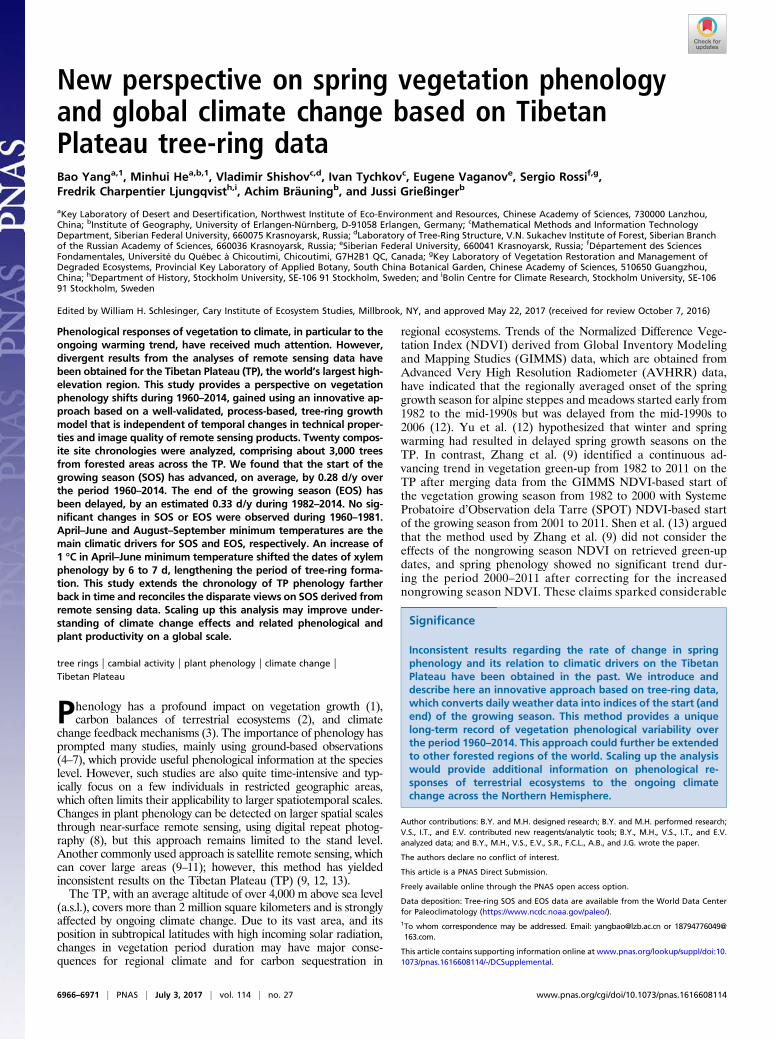
ResultsCharacteristics of Tree-Ring Phenology over the Period 1960–2014. Aclear, advancing trend in SOS was observed across the TP during1960–2014. The averaged SOS ranged from the middle of May tothe middle of June with a site-specific SD (σ) ranging from 8.8 dto 24.9 d (1960–2014) (Fig. 1A). The SOS advanced over time ateach of the 20 combined sites (SI Appendix, Fig. S5). The trendin 60% of the analyzed series was significant at P ≤ 0.01. In anadditional 15% of all series, the trend was significant at P ≤ 0.05,resulting in a total of 75% of series passing the significance level.However, the advancing trend of SOS was not significant duringthe period 1960–1981 in any of the four subregions (SI Appendix,Table S3), or over the entire study region (Fig. 1A). In contrast,during the subperiod 1982–2014, clear (P < 0.01) advancing
trends were observed in the semihumid and humid subregions(SI Appendix, Table S3). Continued but statistically insignificant(P > 0.01) SOS advance was seen in each of the four subregionsfrom 2000 to 2014, probably due to the short calibration period(SI Appendix, Fig. S6). Over the full study period (1960–2014),significant (P < 0.01) advancing trends were observed in allfour subregions (SI Appendix, Table S3). The rate of advancewas −0.28 d/y for the entire study region. From 2000 to 2011, wealso found a continued but insignificant advancing trend of allof the averaged SOS (slope = −0.41, P = 0.17). However, theadvancing trend (slope = −0.80, P = 0.05) was significant during2000−2009. EOS mainly occurred in the middle of Septemberduring the period 1960–2014 (Fig. 1B). From 1960 to 2014, 80%of the combined sites showed significant (P < 0.10) delays (SIAppendix, Fig. S7). When the values for all sites were averaged,we noted clear delaying trends for 1960–2014 (0.16 d/y) and1982–2014 (0.33 d/y) (both P < 0.01); whereas the trend for thesubperiod 1960–1981 (−0.01 d/y) was not significant (P = 0.95) (Fig.1B). Over the period 1960–2014, the length of the growing season(LOS) increased significantly (P < 0.01) across all subregions, as wellas over the entire TP. From 1982 to 2014, significantly (P < 0.05)extended LOSs were identified in all four subregions. On average,the advancing SOS (−0.28 d/y) contributed 64% of the significantly(P < 0.01) extended LOSs during the period 1960−2014, whereas43% of the extension was contributed during the period 1982–2014.In total, due to earlier SOS and delayed EOS, the growing seasonlength increased by 24.2 d during 1960–2014.
Tree-Ring Phenology Response to Climate Variation. The correlation(SI Appendix, Fig. S8) between climate factors and SOS from1960 to 1981 showed that pregrowing season temperatures, es-pecially April through June temperatures, significantly affectedSOS at 16 of the tree-ring combined sites (P < 0.05; henceforth,all significant correlations refer to P < 0.05). Similar temperaturefactors appeared to drive SOS during 1982–2014 (SI Appendix,Fig. S9). Seventeen out of 20 combined sites were significantlyinfluenced by April through June mean, minimum, or maximumtemperatures. Such an intensified climatic signal was consistent
Fig. 1. Characteristics of all of the averaged (A) SOS and (B) EOS across thestudy region during the period 1960–2014. Dashed lines indicate lineartrends for the periods 1960–2014 (black line), 1982–2014 (red line), and1960–1981 (blue line). Error bars indicate the SD among the 20 compositesites. Significant (P < 0.01) advancing (delaying) trends in SOS (EOS) weredetected for the periods 1960–2014 and 1982–2014. During 1960–1981,however, only an insignificant (P > 0.05) tendency was identified.
Yang et al. PNAS | July 3, 2017 | vol. 114 | no. 27 | 6967
EART
H,A
TMOSP
HER
IC,
ANDPL
ANET
ARY
SCIENCE
SEC
OLO
GY
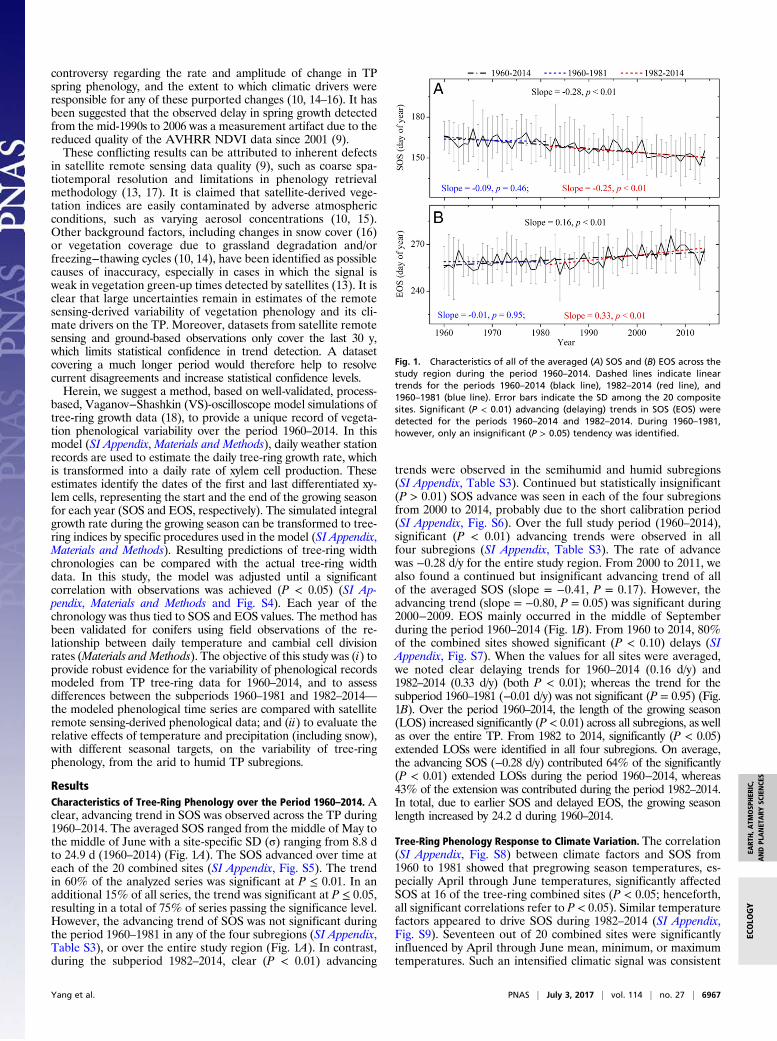
with a significant (P < 0.01) and recognizable spring warmingtrend since 1982 (SI Appendix, Fig. S10). Over the full studyperiod (1960–2014; SI Appendix, Fig. S11), April through Juneminimum temperatures significantly affected SOS at 18 (90%) ofthe combined sites. Negative effects of April through June pre-cipitation on SOS were also significant at most of the sampledsites (80% of sites in the arid and semiarid subregions; 60% ofsites in the semihumid and humid subregions during the twoperiods 1982–2014 and 1960–2014) (SI Appendix, Figs. S9 andS11). Such correlations indicate that higher preseason pre-cipitation generally results in earlier SOS in the study region. Wealso checked correlations for SOS and monthly mean and max-imum snow depth (SI Appendix, Fig. S12). There was no de-tectable trend or pattern in the snow depth data, suggesting thatthe influence of snow depth on SOS was, at best, ambiguous. Wenoted that, on the regional scale, there was a strong correlationwith temperature and precipitation from April to June. Thiscorrelation was stable during 1982–2014 and throughout theentire study period 1960–2014 (SI Appendix, Fig. S13). Partialcorrelation analyses further revealed that, when controlling forApril through June precipitation, the correlation between SOSand April through June minimum temperature was –0.69; whencontrolling for temperature, the correlation with precipitationwas –0.35 during the full period 1960–2014. We thus suggest thatthe April through June mean minimum temperature has thestrongest influence on TP SOS. EOS for all our study subregionswas mainly determined by temperatures in the late summer orearly autumn (August through September), whereas the effectsof precipitation on EOS were statistically insignificant (SI Ap-pendix, Figs. S14−16). At most sites, the temperature influencein the subperiod 1960–1981 was lower than that during 1982–2014. However, the September mean, maximum, and minimumtemperatures positively (P < 0.05) affected TP EOS during allinvestigated periods (SI Appendix, Fig. S17). The highest corre-lation (r = 0.78, P < 0.01) was detected between August throughSeptember minimum temperatures and EOS during the full1960–2014 period (Fig. 2). An increase of 1 °C in August throughSeptember minimum temperatures resulted in a delay of 6.20 din EOS.
DiscussionThis study developed an innovative approach that combineslong-term phenology from remote sensing measurements andtree-ring formation for detecting land surface components inearth system models. Based on the validation of our modelingresults with the available monitoring data (SI Appendix,Materialsand Methods), our long-term (1960–2014) tree-ring phenologyseries is the longest and most robust yet available for the TP.
Comparison with Remote Sensing Data. According to our modelingresults, all averaged tree-ring xylem phenology series showedsignificant (P < 0.01) advancing trends from 1982 to 2014, al-though different rates were detected within the four subregionsof the TP. Contrasting and inconsistent results derived fromremote sensing data are mainly explainable by different investi-gation periods. During the period 1998–2011, a continuous ad-vancing trend (slope = –0.32 d/y, P = 0.16) of our averaged SOSwas identified. Such an advance was also detected by differentremote sensing data from AVHRR, SPOT, and Moderate Res-olution Imaging Spectroradiometer (MODIS) (9) over the sameperiod. Moreover, for the different periods of 1998−2014(slope = –0.24 d/y, P = 0.18), 2000–2009 (−0.80 d/y, P = 0.05),2000–2011 (slope = –0.41 d/y, P = 0.16), and 2000–2014 (slope =–0.28 d/y, P = 0.22), consistent advancing trends of SOS werefound by our study. We therefore argue that analysis of a shorttime series is not sufficient for reliable trend detection, and,instead, a much longer phenological period is critical in resolvingcurrent inconsistencies in results derived from remote sensingdata. Our approach to establish the longest record of vegetationphenological variability that is also independent of changes inthe technical properties of satellite sensors, data coverage, andimage quality (e.g., cloudiness) is thus appropriate for addressingsuch issues.The methods in determining phenological dates from the re-
mote sensing datasets may also impart some bias. The trendtoward earlier vegetation green-up dates (1.9 d per 10 y) de-tected by the Gaussian-Midpoint and Harmonic Analysis ofTime Series (HANTS)-Maximum methods was almost 5 timesgreater than that detected by the Timesat-Savitzky–Golay(SG) method (0.4 d per 10 y) (19), indicating the uncertaintyinherent in such remote sensing methods. The latest vegetationphenological data are based on integrated results by applyingmultiple methods to remote sensing data (20). The green-uponset dates represent the consolidated annual mean of theplateau-scale green-up date. For the period 2000–2011, thephenological data were derived from four vegetation indices:three NDVIs from AVHRR, SPOT, and MODIS, and one En-hanced Vegetation Index (EVI) from MODIS. For the period1982–1999, the data were determined from AVHRR NDVI.Five methods were used to derive each vegetation index (fordetails, see ref. 21). We compared our tree-ring-based pheno-logical series with the remote sensing results of green-up onsetdates (20) over the period 1982–2011. They showed similar de-creasing trends, confirming that a marked advance of springphenology has occurred during the past 30 y. Good year-by-yearsimilarity between our modeled SOS and the remote sensing re-sults (20) was also achieved during the common period 1982–2011(Fig. 3A), as indicated by their significant correlation of 0.63 (P <0.01). Moreover, we also found a significant correlation (r = 0.70,P < 0.01) with the data of regionally averaged green-up dates (9)for meadow and steppe vegetation types throughout the TPduring the period 1982–2011 (Fig. 3A). It was noted that theremote sensing-retrieved green-up dates were validated by in situphenological observations from 18 agrometeorological stationson the TP during 2003–2011. However, when comparing ourmodeled SOS with the AVHRR SOS of meadow vegetationderived using White et al.’s (22) method (12), we found no sig-nificant correlation (r = –0.15, P = 0.58, 1982–1997), probablydue to the SOS retrieval method used. We also found significantcorrelations (Fig. 3B) with the end date of the growing season forall vegetation types throughout the TP extracted from AVHRRLeaf Area Index (LAI) data (23) during the period 1982–2011.Moreover, a correlation (Fig. 3B) (r = 0.41, P = 0.11) close to thesignificant level was found between our modeled EOS and theend date of the growing season for vegetation (meadow) on the TPbetween 1982–1997 (12), compared with weak negative cor-relation (r = –0.15) between our modeled SOS with the AVHRR
Fig. 2. Comparisons between climate factors and (A and C) SOS and (B andD) EOS for the period 1960–2014. Averaged SOS and EOS were mainly drivenby April through June minimum temperatures and August through Sep-tember minimum temperatures, respectively.
6968 | www.pnas.org/cgi/doi/10.1073/pnas.1616608114 Yang et al.
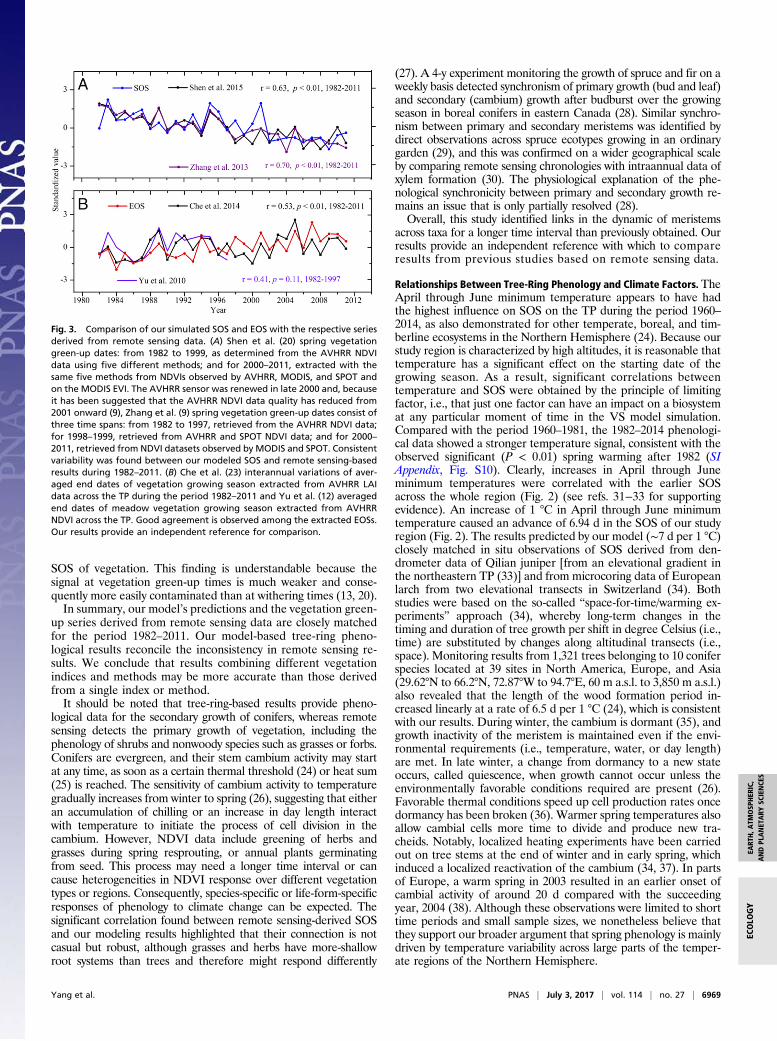
SOS of vegetation. This finding is understandable because thesignal at vegetation green-up times is much weaker and conse-quently more easily contaminated than at withering times (13, 20).In summary, our model’s predictions and the vegetation green-
up series derived from remote sensing data are closely matchedfor the period 1982–2011. Our model-based tree-ring pheno-logical results reconcile the inconsistency in remote sensing re-sults. We conclude that results combining different vegetationindices and methods may be more accurate than those derivedfrom a single index or method.It should be noted that tree-ring-based results provide pheno-
logical data for the secondary growth of conifers, whereas remotesensing detects the primary growth of vegetation, including thephenology of shrubs and nonwoody species such as grasses or forbs.Conifers are evergreen, and their stem cambium activity may startat any time, as soon as a certain thermal threshold (24) or heat sum(25) is reached. The sensitivity of cambium activity to temperaturegradually increases from winter to spring (26), suggesting that eitheran accumulation of chilling or an increase in day length interactwith temperature to initiate the process of cell division in thecambium. However, NDVI data include greening of herbs andgrasses during spring resprouting, or annual plants germinatingfrom seed. This process may need a longer time interval or cancause heterogeneities in NDVI response over different vegetationtypes or regions. Consequently, species-specific or life-form-specificresponses of phenology to climate change can be expected. Thesignificant correlation found between remote sensing-derived SOSand our modeling results highlighted that their connection is notcasual but robust, although grasses and herbs have more-shallowroot systems than trees and therefore might respond differently
(27). A 4-y experiment monitoring the growth of spruce and fir on aweekly basis detected synchronism of primary growth (bud and leaf)and secondary (cambium) growth after budburst over the growingseason in boreal conifers in eastern Canada (28). Similar synchro-nism between primary and secondary meristems was identified bydirect observations across spruce ecotypes growing in an ordinarygarden (29), and this was confirmed on a wider geographical scaleby comparing remote sensing chronologies with intraannual data ofxylem formation (30). The physiological explanation of the phe-nological synchronicity between primary and secondary growth re-mains an issue that is only partially resolved (28).Overall, this study identified links in the dynamic of meristems
across taxa for a longer time interval than previously obtained. Ourresults provide an independent reference with which to compareresults from previous studies based on remote sensing data.
Relationships Between Tree-Ring Phenology and Climate Factors. TheApril through June minimum temperature appears to have hadthe highest influence on SOS on the TP during the period 1960–2014, as also demonstrated for other temperate, boreal, and tim-berline ecosystems in the Northern Hemisphere (24). Because ourstudy region is characterized by high altitudes, it is reasonable thattemperature has a significant effect on the starting date of thegrowing season. As a result, significant correlations betweentemperature and SOS were obtained by the principle of limitingfactor, i.e., that just one factor can have an impact on a biosystemat any particular moment of time in the VS model simulation.Compared with the period 1960–1981, the 1982–2014 phenologi-cal data showed a stronger temperature signal, consistent with theobserved significant (P < 0.01) spring warming after 1982 (SIAppendix, Fig. S10). Clearly, increases in April through Juneminimum temperatures were correlated with the earlier SOSacross the whole region (Fig. 2) (see refs. 31−33 for supportingevidence). An increase of 1 °C in April through June minimumtemperature caused an advance of 6.94 d in the SOS of our studyregion (Fig. 2). The results predicted by our model (∼7 d per 1 °C)closely matched in situ observations of SOS derived from den-drometer data of Qilian juniper [from an elevational gradient inthe northeastern TP (33)] and from microcoring data of Europeanlarch from two elevational transects in Switzerland (34). Bothstudies were based on the so-called “space-for-time/warming ex-periments” approach (34), whereby long-term changes in thetiming and duration of tree growth per shift in degree Celsius (i.e.,time) are substituted by changes along altitudinal transects (i.e.,space). Monitoring results from 1,321 trees belonging to 10 coniferspecies located at 39 sites in North America, Europe, and Asia(29.62°N to 66.2°N, 72.87°W to 94.7°E, 60 m a.s.l. to 3,850 m a.s.l.)also revealed that the length of the wood formation period in-creased linearly at a rate of 6.5 d per 1 °C (24), which is consistentwith our results. During winter, the cambium is dormant (35), andgrowth inactivity of the meristem is maintained even if the envi-ronmental requirements (i.e., temperature, water, or day length)are met. In late winter, a change from dormancy to a new stateoccurs, called quiescence, when growth cannot occur unless theenvironmentally favorable conditions required are present (26).Favorable thermal conditions speed up cell production rates oncedormancy has been broken (36). Warmer spring temperatures alsoallow cambial cells more time to divide and produce new tra-cheids. Notably, localized heating experiments have been carriedout on tree stems at the end of winter and in early spring, whichinduced a localized reactivation of the cambium (34, 37). In partsof Europe, a warm spring in 2003 resulted in an earlier onset ofcambial activity of around 20 d compared with the succeedingyear, 2004 (38). Although these observations were limited to shorttime periods and small sample sizes, we nonetheless believe thatthey support our broader argument that spring phenology is mainlydriven by temperature variability across large parts of the temper-ate regions of the Northern Hemisphere.
Fig. 3. Comparison of our simulated SOS and EOS with the respective seriesderived from remote sensing data. (A) Shen et al. (20) spring vegetationgreen-up dates: from 1982 to 1999, as determined from the AVHRR NDVIdata using five different methods; and for 2000–2011, extracted with thesame five methods from NDVIs observed by AVHRR, MODIS, and SPOT andon the MODIS EVI. The AVHRR sensor was renewed in late 2000 and, becauseit has been suggested that the AVHRR NDVI data quality has reduced from2001 onward (9), Zhang et al. (9) spring vegetation green-up dates consist ofthree time spans: from 1982 to 1997, retrieved from the AVHRR NDVI data;for 1998–1999, retrieved from AVHRR and SPOT NDVI data; and for 2000–2011, retrieved from NDVI datasets observed by MODIS and SPOT. Consistentvariability was found between our modeled SOS and remote sensing-basedresults during 1982–2011. (B) Che et al. (23) interannual variations of aver-aged end dates of vegetation growing season extracted from AVHRR LAIdata across the TP during the period 1982–2011 and Yu et al. (12) averagedend dates of meadow vegetation growing season extracted from AVHRRNDVI across the TP. Good agreement is observed among the extracted EOSs.Our results provide an independent reference for comparison.
Yang et al. PNAS | July 3, 2017 | vol. 114 | no. 27 | 6969
EART
H,A
TMOSP
HER
IC,
ANDPL
ANET
ARY
SCIENCE
SEC
OLO
GY
Some studies (39–41) emphasized that snow depth and totalprecipitation also play an important role in regulating spring veg-etation phenology. For example, a study based on 3 y of woodanatomical data (2009–2011) from five sampled trees in the aridsubregion of the northeastern TP (42) indicated that late springand early summer precipitation played a critical role in the onsetof xylogenesis. If this finding were true, we could expect a strongcorrelation between SOS and moisture variability in the arid orsemiarid subregions, a somewhat weaker correlation in the semi-humid or humid subregions and so on, with the limiting role ofprecipitation decreasing as the subregion becomes more humid.Indeed, we see such a pattern in our results (SI Appendix, Fig.S18). We found a stronger influence of May through June pre-cipitation on SOS in the arid and semiarid subregions comparedwith that in the semihumid and humid subregions during bothsubperiods 1960–1981 and 1982–2014, as well as in the full studyperiod 1960–2014 (SI Appendix, Fig. S18). Remote sensing basedresults also confirmed that SOS was more sensitive to interannualvariations in preseason precipitation in the more arid areas than inthe wetter areas of the TP (20).In conclusion, this study presents an independent series of
vegetation phenological records for the TP, covering the period1960–2014. It is an example of an effective, robust approach tothe study of phenological variability in a long-term perspective.The approach, converting daily weather data into the SOS andEOS dates over the growing season based on a well-validated,process-based tree-ring VS model, represents a major advance inthe emerging field of phenoclimatology. The generated pheno-logical series serve as a baseline against which to assess previousresults based on other methods. Regular studies using this ap-proach should be conducted to cross-validate observational, re-mote sensing, and in situ (phenocam) estimates of climate-driventrends in phenological patterns. Scaling up this analysis wouldprovide additional information on phenological responses ofterrestrial ecosystems to ongoing climate change across theNorthern Hemisphere.
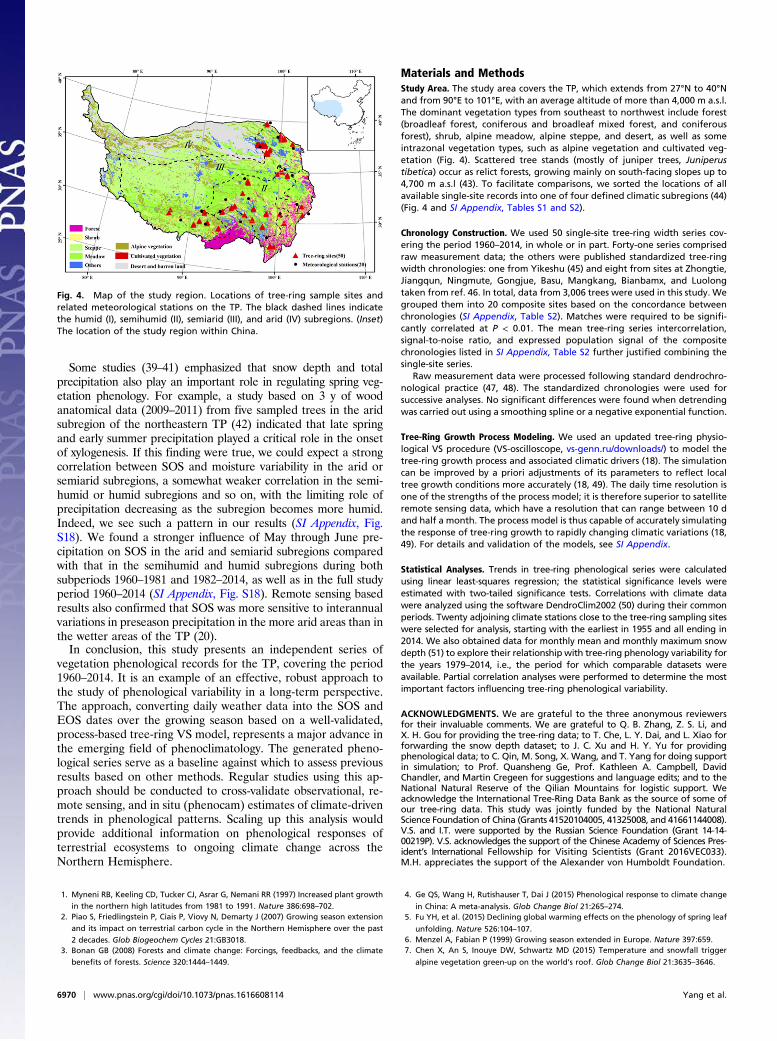
Materials and MethodsStudy Area. The study area covers the TP, which extends from 27°N to 40°Nand from 90°E to 101°E, with an average altitude of more than 4,000 m a.s.l.The dominant vegetation types from southeast to northwest include forest(broadleaf forest, coniferous and broadleaf mixed forest, and coniferousforest), shrub, alpine meadow, alpine steppe, and desert, as well as someintrazonal vegetation types, such as alpine vegetation and cultivated veg-etation (Fig. 4). Scattered tree stands (mostly of juniper trees, Juniperustibetica) occur as relict forests, growing mainly on south-facing slopes up to4,700 m a.s.l (43). To facilitate comparisons, we sorted the locations of allavailable single-site records into one of four defined climatic subregions (44)(Fig. 4 and SI Appendix, Tables S1 and S2).
Chronology Construction. We used 50 single-site tree-ring width series cov-ering the period 1960–2014, in whole or in part. Forty-one series comprisedraw measurement data; the others were published standardized tree-ringwidth chronologies: one from Yikeshu (45) and eight from sites at Zhongtie,Jiangqun, Ningmute, Gongjue, Basu, Mangkang, Bianbamx, and Luolongtaken from ref. 46. In total, data from 3,006 trees were used in this study. Wegrouped them into 20 composite sites based on the concordance betweenchronologies (SI Appendix, Table S2). Matches were required to be signifi-cantly correlated at P < 0.01. The mean tree-ring series intercorrelation,signal-to-noise ratio, and expressed population signal of the compositechronologies listed in SI Appendix, Table S2 further justified combining thesingle-site series.
Raw measurement data were processed following standard dendrochro-nological practice (47, 48). The standardized chronologies were used forsuccessive analyses. No significant differences were found when detrendingwas carried out using a smoothing spline or a negative exponential function.
Tree-Ring Growth Process Modeling. We used an updated tree-ring physio-logical VS procedure (VS-oscilloscope, vs-genn.ru/downloads/) to model thetree-ring growth process and associated climatic drivers (18). The simulationcan be improved by a priori adjustments of its parameters to reflect localtree growth conditions more accurately (18, 49). The daily time resolution isone of the strengths of the process model; it is therefore superior to satelliteremote sensing data, which have a resolution that can range between 10 dand half a month. The process model is thus capable of accurately simulatingthe response of tree-ring growth to rapidly changing climatic variations (18,49). For details and validation of the models, see SI Appendix.
Statistical Analyses. Trends in tree-ring phenological series were calculatedusing linear least-squares regression; the statistical significance levels wereestimated with two-tailed significance tests. Correlations with climate datawere analyzed using the software DendroClim2002 (50) during their commonperiods. Twenty adjoining climate stations close to the tree-ring sampling siteswere selected for analysis, starting with the earliest in 1955 and all ending in2014. We also obtained data for monthly mean and monthly maximum snowdepth (51) to explore their relationship with tree-ring phenology variability forthe years 1979–2014, i.e., the period for which comparable datasets wereavailable. Partial correlation analyses were performed to determine the mostimportant factors influencing tree-ring phenological variability.
ACKNOWLEDGMENTS. We are grateful to the three anonymous reviewersfor their invaluable comments. We are grateful to Q. B. Zhang, Z. S. Li, andX. H. Gou for providing the tree-ring data; to T. Che, L. Y. Dai, and L. Xiao forforwarding the snow depth dataset; to J. C. Xu and H. Y. Yu for providingphenological data; to C. Qin, M. Song, X. Wang, and T. Yang for doing supportin simulation; to Prof. Quansheng Ge, Prof. Kathleen A. Campbell, DavidChandler, and Martin Cregeen for suggestions and language edits; and to theNational Natural Reserve of the Qilian Mountains for logistic support. Weacknowledge the International Tree-Ring Data Bank as the source of some ofour tree-ring data. This study was jointly funded by the National NaturalScience Foundation of China (Grants 41520104005, 41325008, and 41661144008).V.S. and I.T. were supported by the Russian Science Foundation (Grant 14-14-00219P). V.S. acknowledges the support of the Chinese Academy of Sciences Pres-ident’s International Fellowship for Visiting Scientists (Grant 2016VEC033).M.H. appreciates the support of the Alexander von Humboldt Foundation.
1. Myneni RB, Keeling CD, Tucker CJ, Asrar G, Nemani RR (1997) Increased plant growth
in the northern high latitudes from 1981 to 1991. Nature 386:698–702.2. Piao S, Friedlingstein P, Ciais P, Viovy N, Demarty J (2007) Growing season extension
and its impact on terrestrial carbon cycle in the Northern Hemisphere over the past
2 decades. Glob Biogeochem Cycles 21:GB3018.3. Bonan GB (2008) Forests and climate change: Forcings, feedbacks, and the climate
benefits of forests. Science 320:1444–1449.
4. Ge QS, Wang H, Rutishauser T, Dai J (2015) Phenological response to climate change
in China: A meta-analysis. Glob Change Biol 21:265–274.5. Fu YH, et al. (2015) Declining global warming effects on the phenology of spring leaf
unfolding. Nature 526:104–107.6. Menzel A, Fabian P (1999) Growing season extended in Europe. Nature 397:659.7. Chen X, An S, Inouye DW, Schwartz MD (2015) Temperature and snowfall trigger
alpine vegetation green-up on the world’s roof. Glob Change Biol 21:3635–3646.
Fig. 4. Map of the study region. Locations of tree-ring sample sites andrelated meteorological stations on the TP. The black dashed lines indicatethe humid (I), semihumid (II), semiarid (III), and arid (IV) subregions. (Inset)The location of the study region within China.
6970 | www.pnas.org/cgi/doi/10.1073/pnas.1616608114 Yang et al.

8. Richardson AD, Klosterman S, Toomey M (2013) Near-surface sensor derived phe-nology. Phenology: An Integrative Environmental Science, ed Schwartz MD (KluwerAcademic, Dordrecht, The Netherlands).
9. Zhang G, Zhang Y, Dong J, Xiao X (2013) Green-up dates in the Tibetan Plateau havecontinuously advanced from 1982 to 2011. Proc Natl Acad Sci USA 110:4309–4314.
10. Luedeling E, Yu H, Xu J (2011) Replies to Shen, Chen et al., and Yi and Zhou: Linearregression analysis misses effects of winter temperature on Tibetan vegetation. ProcNatl Acad Sci USA 108:E95.
11. Garonna I, et al. (2014) Strong contribution of autumn phenology to changes insatellite-derived growing season length estimates across Europe (1982-2011). GlobChange Biol 20:3457–3470.
12. Yu H, Luedeling E, Xu J (2010) Winter and spring warming result in delayed springphenology on the Tibetan Plateau. Proc Natl Acad Sci USA 107:22151–22156.
13. Shen M, et al. (2013) No evidence of continuously advanced green-up dates in theTibetan Plateau over the last decade. Proc Natl Acad Sci USA 110:E2329.
14. Chen H, Zhu Q, Wu N, Wang Y, Peng CH (2011) Delayed spring phenology on theTibetan Plateau may also be attributable to other factors than winter and springwarming. Proc Natl Acad Sci USA 108:E93.
15. Yi S, Zhou Z (2011) Increasing contamination might have delayed spring phenologyon the Tibetan Plateau. Proc Natl Acad Sci USA 108:E94.
16. Dong J, Zhang G, Zhang Y, Xiao X (2013) Reply to Wang et al.: Snow cover and airtemperature affect the rate of changes in spring phenology in the Tibetan Plateau.Proc Natl Acad Sci USA 110:E2856–E2857.
17. Ding M, et al. (2015) Start of vegetation growing season on the Tibetan Plateau in-ferred from multiple methods based on GIMMS and SPOT NDVI data. J Geogr Sci 25:131–148.
18. Shishov VV, et al. (2016) VS-oscilloscope: A new tool to parameterize tree radialgrowth based on climate conditions. Dendrochronologia 39:42–50.
19. Cong N, et al. (2013) Changes in satellite-derived spring vegetation green-up dateand its linkage to climate in China from 1982 to 2010: A multimethod analysis. GlobChange Biol 19:881–891.
20. Shen M, et al. (2015) Plant phenological responses to climate change on the TibetanPlateau: Research status and challenges. Natl Sci Rev 2:1–14.
21. Shen M, et al. (2014) Increasing altitudinal gradient of spring vegetation phenologyduring the last decade on the Qinghai–Tibetan Plateau. Agric For Meteorol 189-190:71–80.
22. White MA, Thornton PE, Running SW (1997) A continental phenology model formonitoring vegetation responses to interannual climatic variability. Glob BiogeochemCycles 11:217–234.
23. Che M, et al. (2014) Spatial and temporal variations in the end date of the vegetationgrowing season throughout the Qinghai–Tibetan Plateau from 1982 to 2011. AgricFor Meteorol 189-190:81–90.
24. Rossi S, et al. (2016) Pattern of xylem phenology in conifers of cold ecosystems at theNorthern Hemisphere. Glob Change Biol 22:3804–3813.
25. Seo JW, Eckstein D, Jalkanen R, Rickebusch S, Schmitt U (2008) Estimating the onset ofcambial activity in Scots pine in northern Finland by means of the heat-sum approach.Tree Physiol 28:105–112.
26. Oribe Y, Kubo T (1997) Effect of heat on cambial reactivation during winter dormancyin evergreen and deciduous conifers. Tree Physiol 17:81–87.
27. Eggemeyer KD, et al. (2009) Seasonal changes in depth of water uptake for en-croaching trees Juniperus virginiana and Pinus ponderosa and two dominant C4
grasses in a semiarid grassland. Tree Physiol 29:157–169.28. Huang JG, Deslauriers A, Rossi S (2014) Xylem formation can be modeled statistically
as a function of primary growth and cambium activity. New Phytol 203:831–841.
29. Perrin M, Rossi S, Isabel N (2017) Synchronisms between bud and cambium phenologyin black spruce: Early-flushing provenances exhibit early xylem formation. TreePhysiol 37:593–603.
30. Antonucci S, et al. (2017) Large-scale estimation of xylem phenology in black sprucethroughremote sensing. Agric For Meteorol 233:92–100.
31. Rossi S, et al. (2008) Critical temperatures for xylogenesis in conifers of cold climates.Glob Ecol Biogeogr 17:696–707.
32. Rossi S, Deslauriers A, Anfodillo T, Carraro V (2007) Evidence of threshold tempera-tures for xylogenesis in conifers at high altitudes. Oecologia 152:1–12.
33. Wang Z, Yang B, Deslauriers A, Bräuning A (2014) Intra-annual stem radial incrementresponse of Qilian juniper to temperature and precipitation along an altitudinalgradient in northwestern China. Trees (Berl) 29:25–34.
34. Moser L, et al. (2010) Timing and duration of European larch growing season alongaltitudinal gradients in the Swiss Alps. Tree Physiol 30:225–233.
35. Begum S, Nakaba S, Oribe Y, Kubo T, Funada R (2007) Induction of cambial re-activation by localized heating in a deciduous hardwood hybrid poplar (Populussieboldii x P. grandidentata). Ann Bot (Lond) 100:439–447.
36. Rossi S, et al. (2013) A meta-analysis of cambium phenology and growth: Linear andnon-linear patterns in conifers of the northern hemisphere. Ann Bot (Lond) 112:1911–1920.
37. Gricar J, Zupancic M, �Cufar K, Oven P (2007) Regular cambial activity and xylem andphloem formation in locally heated and cooled stem portions of Norway spruce.Wood Sci Technol 41:463–475.
38. Deslauriers A, Rossi S, Anfodillo T, Saracino A (2008) Cambial phenology, wood for-mation and temperature thresholds in two contrasting years at high altitude insouthern Italy. Tree Physiol 28:863–871.
39. Wu X, Liu H (2013) Consistent shifts in spring vegetation green-up date across tem-perate biomes in China, 1982–2006. Glob Change Biol 19:870–880.
40. Wang T, Peng S, Lin X, Chang J (2013) Declining snow cover may affect spring phe-nological trend on the Tibetan Plateau. Proc Natl Acad Sci USA 110:E2854–E2855.
41. Shen M, Piao S, Cong N, Zhang G, Jassens IA (2015) Precipitation impacts on vege-tation spring phenology on the Tibetan Plateau. Glob Change Biol 21:3647–3656.
42. Ren P, Rossi S, Gricar J, Liang E, Cufar K (2015) Is precipitation a trigger for the onsetof xylogenesis in Juniperus przewalskii on the north-eastern Tibetan Plateau? AnnBot (Lond) 115:629–639.
43. Miehe G, et al. (2009) How old is pastoralism in Tibet? An ecological approach to themaking of a Tibetan Landscape. Palaeogeogr Palaeoclimatol Palaeoecol 276:130–147.
44. Zheng JY, et al. (2013) [The climate regionalization in China for 1981–2010]. Chin SciBull 58:3088–3099. Chinese, with English abstract.
45. Zhang J, et al. (2015) Forward modeling analyses of Qilian Juniper (Sabina prze-walskii ) growth in response to climate factors in different regions of the QilianMountains, northwestern China. Trees (Berl) 30:175–188.
46. Zhang QB, Evans MN, Lyu L (2015) Moisture dipole over the Tibetan Plateau duringthe past five and a half centuries. Nat Commun 6:8062.
47. Holmes RL (1983) Computer-assisted quality control in tree-ring dating and mea-surement. Tree-Ring Bull 43:69–78.
48. Cook ER, Peters K (1997) Calculating unbiased tree-ring indices for the study of cli-matic and environmental change. Holocene 7:361–370.
49. He MH, et al. (2017) Process-based modeling of tree-ring formation and its rela-tionships with climate on the Tibetan Plateau. Dendrochronologia 42:31–41.
50. Biondi F, Waikul K (2004) DENDROCLIM2002: A C++ program for statistical calibra-tion of climate signals in tree-ring chronologies. Comput Geosci 30:303–311.
51. Che T, Li X, Jin R, Armstrong R, Zhang TJ (2008) Snow depth derived from passivemicrowave remote-sensing data in China. Ann Glaciol 49:145–154.
Yang et al. PNAS | July 3, 2017 | vol. 114 | no. 27 | 6971
EART
H,A
TMOSP
HER
IC,
ANDPL
ANET
ARY
SCIENCE
SEC
OLO
GY