Embed Size (px)
Citation preview

University of Pisa
Department of Pharmacy
Doctoral School Clinical Pathophysiology and Science of Medicine
Research Program Medical Pathophysiology and Pharmacology
New pharmacological strategies for cutaneous
malignant melanoma
Candidate:
Sara Carpi ([email protected])
Tutor:
Prof.ssa Paola Nieri
Dean
Prof.ssa Maria Cristina Breschi Cycle
XXVII
Scientific Area
BIO/14
Academic year
2013/2014
I
Scientific products
Publications:
1 “Theranostic properties of a survivin-directed molecular beacon in
human melanoma cells”
S. Carpi, S. Fogli, A. Giannetti, B. Adinolfi, S. Tombelli, E. Da
Pozzo, A. Vanni, E. Martinotti, C. Martini, M. C. Breschi, M.
Pellegrino, P. Nieri, F. Baldini
Plos One, 2014 Dec 11;9(12):e114588.
2 “Complex nanostructures based on oligonucleotide optical switches
and nanoparticles for intracellular mRNA sensing and silencing”
B. Adinolfi, S. Carpi, A. Giannetti, P. Nieri, M. Pellegrino, G.
Sotgiu, S. Tombelli, C. Trono, G. Varchi, F. Baldini
Procedia Engineering 87 ( 2014 ) 751 – 754.
3 “Selection of a human butyrylcholinesterase-like antibody single-
chain variable fragment resistant to AChE inhibitors from a phage
library expressed in E. coli.”
Podestà A, Rossi S, Massarelli I, Carpi S, Adinolfi B, Fogli S,
Bianucci AM, Nieri P.
MAbs. 2014 Jul-Aug;6(4):1084-93.
4 “AM251 induces apoptosis and G2/M cell cycle arrest in A375
human melanoma cells”
S. Carpi, S. Fogli, A. Romanini, M. Pellegrino, B. Adinolfi, A.
Podestà, B. Costa, E. Da Pozzo, C. Martini, M.C. Breschi, P. Nieri
Submitted to British Journal of Pharmacology, manuscript ID:
2014-BJP-1571-RP.
5 “New quinolone- and 1,8-naphthyridine-3-carboxamides as
selective CB2 receptor agonists with anticancer and immuno-
modulatory activity”
C. Manera; A. M. Malfitano; T. Parkkari; V. Lucchesi; S. Carpi; S.
Fogli; S. Bertini; C. Laezza; A. Ligresti; G. Saccomanni; J. R.
Savinainen; E. Ciaglia; S. Pisanti; P. Gazzerro; V. Di Marzo; P.
Nieri; M. Macchia; M. Bifulco
Submitted to European Journal of Medicinal Chemistry, manuscript
ID: EJMECH-S-14-02633-1.
Oral communications:
1 S. Carpi, S. Fogli, A. Giannetti, B. Adinolfi, S. Tombelli, F.
Baldini, E. Da Pozzo, A. Vanni, E. Martinotti, C. Martini, M. C.
Breschi, M. Pellegrino, P. Nieri. Theranostic properties of a
survivin-directed molecular beacon in human melanoma cells.
“XVII Seminario Società Italiana di Farmacologia” September 16-
18, 2014 Rimini (Italy).
II
2 B. Adinolfi, S. Carpi, A. Giannetti, P. Nieri, M. Pellegrino, G.
Sotgiu, S. Tombelli, C. Trono, G. Varchi, F. Baldini. Complex
nanostructures based on oligonucleotide optical switches and
nanoparticles for intracellular mRNA sensing and silencing.
“Eurosensors” September 7-10, 2014 Brescia (Italy).
3 B. Adinolfi, S. Tombelli, A. Giannetti, C. Trono, M. Pellegrino, S.
Carpi, P. Nieri, G. Sotgiu, G. Varchi, F. Baldini. Complex
nanostructures based on a specific molecular beacon and PMMA
nanoparticles for the detection and silencing of survivin mRNA in
human cancer cells. “Nanomedicine” September 17-19, 2014
Viterbo (Italy).
4 S. Tombelli,, B. Adinolfi, A. Giannetti, C. Trono, M. Pellegrino, S.
Carpi, P. Nieri, G. Sotgiu, G. Varchi, F.Baldini. Molecular beacons
and PMMA nanoparticles for the detection and silencing of mRNA
in human cancer cells. “Functional DNA Nanotechnology
Workshop” June 19-20, 2014 Rome (Italy).
5 B. Adinolfi , A. Giannetti, S. Tombelli, C. Trono, F. Chiavaioli, S.
Carpi, P. Nieri, S. Fogli, M. Pellegrino, G. Sotgiu, G. Varchi, F.
Baldini. Detection and silencing of survivin mRNA by bi-color
imaging based on PMMA nanoparticles/molecular beacon in
human cancer cells. “5th International BioNanoMed” March 26-28,
2014 Krems (Austria).
6 F. Baldini, M. Ballestri, S. Carpi, S.G. Conticello, G. Giambastiani,
A. Giannetti, A. Guerrini, R. Mercatelli, P. Nieri, F. Quercioli, F.
Severi, G. Sotgiu, S. Tombelli, C. Trono, G. Tuci, G. Varchi.
Molecular beacon as oligonucleotide nanosensors for intracellular
mRNA. “The Italian National Conference on Condensed Matter
Physics (Including Optics, Photonics, Liquids, Soft Matter) FisMat”
September 9-13, 2013 Milan (Italy).
7 F. Baldini, M. Ballestri, S. Carpi, S.G. Conticello, G. Giambastiani,
A. Giannetti, A. Guerrini, R. Mercatelli, P. Nieri, F. Quercioli, F.
Severi, G. Sotgiu, S. Tombelli, C. Trono, G. Tuci, G. Varchi.
Oligonucletide Switches and Nanomaterials for Intracellular mRNA
Sensing. “European Conferences on Biomedical Optics (ECBO)”
May 12-16, 2013 Messe Munchen (Germany).
8 Adinolfi B, Carpi S, Fogli S, Giannetti A, Baldini F, Pellegrino M,
Vanni A, Martinotti E, Breschi MC, Nieri P. Survivin mRNA
detection and silencing by a Molecular Beacon
Oligodeoxynucleotide in living cutaneous melanoma cells. “VI
Convegno Monotematico SIF, Gruppo di Lavoro Farmacologia
Oncologica, La Farmacologia oncologica tra innovazione ed
evidenza clinica” November 30, December 1, 2012 Siena (Italy).
III
9 F. Baldini, M. Ballestri, S. Carpi, S.G. Conticello, G. Giambastiani,
A. Giannetti, A. Guerrini, R. Mercatelli, P. Nieri, F. Quercioli, F.
Severi, G. Sotgiu, S. Tombelli, C. Trono, G. Tuci, G. Varchi.
Molecular beacon-coated PMMA nanoparticles for the intracellular
detection of tumour associated mRNA. “Nanotechitaly2012”
November 21-23, 2012 Venezia (Italy).
Poster:
1 S. Carpi, B. Adinolfi, S. Fogli, A. Giannetti, S. Tombelli, F.
Baldini, E. Da Pozzo, A. Vanni, E. Martinotti, M.C. Breschi, M.
Pellegrino, P. Nieri. Survivin-directed molecular beacon as
potential theranostic agent in melanoma cells. “Global
Biotechnology Congress” June 16-19, 2014 Boston MA (USA).
2 S. Tombelli, A. Giannetti, C.Trono, B. Adinolfi, M. Pellegrino, S.
Carpi, P. Nieri, G. Sotgiu, G. Varchi, F.Baldini. Complex
nanostructures based on oligonucleotide optical switches and
nanoparticles for intracellular sensing. “EUROPT(R)ODE XII”
April 13-16, 2014 Athens (Greece).
3 S. Carpi, B. Adinolfi, S. Fogli, A. Giannetti, S. Tombelli, F.
Baldini, A. Vanni, E. Martinotti, M.C. Breschi, M. Pellegrino, P.
Nieri. Survivin directed molecular beacon as potential “theranostic
agent” in melanoma cells. “36° Congresso Nazionale SIF” October
23-26, 2013 Torino (Italy).
4 A.Giannetti, S.Tombelli, C.Trono, M.Ballestri, G.Giambastiani,
S.Carpi, S.G.Conticello, A.Guerrini, R.Mercatelli, P.Nieri,
F.Quercioli, F Severi, G Sotgiu, G.Tuci, G.Varchi, F.Baldini.
PMMA nanopaticles and carbon nanotubes as intracellular carriers
of molecular beacons for mRNA sensig and imaging. “3rd
Conference on Innovation in Drug Delivery: Advances in Local
Drug Delivery (Apgi and Adritelf)” September 22-25, 2013 Pisa
(Italy).
5 S. Carpi, A. Giannetti, F. Baldini, M. Pellegrino, B. Adinolfi, A.
Vanni, E. Martinotti, P. Nieri. Survivin mRNA detection and
silencing by a molecular beacon oligodeoxynucleotide in living
melanoma cells. “XVI Seminario SIF Dottorandi e Assegnisti di
Ricerca” September 16-19, 2012 Rimini (Italy).
IV
Abstract
Human cutaneous melanoma is an aggressive and chemotherapy resistant
type of cancer. Although the development of new targeted therapies and
immunologic agents has completely changed the treatment guidelines, one
of the most important tasks for the future will be to overcome acquired
resistance. In this thesis we investigated different pharmacological
strategies against human melanoma cells. Particularly, we demonstrated the
theranostic properties (i.e., the ability of imaging and pharmacological
silencing activity) of a molecular beacon-oligodeoxynucleotide (MB) that
targets survivin mRNA. This may represent an innovative approach for
cancer diagnosis and treatment in melanoma patients because survivin is an
inhibitor of apoptosis overexpressed in tumor cells and almost undetectable
in human melanocytes. We also provide evidence of the pro-apoptotic
effect and cell cycle arrest ability of AM251, a cannabinoid type 1 receptor
antagonist/inverse agonist with an anticancer potency comparable to that
observed for cisplatin. This compound may be a potential prototype for the
development of promising diarylpyrazole derivatives to be evaluated in
human cutaneous melanoma. Finally, we demonstrated that the
cannabinoid type 1 receptor is markedly expressed in stem-like cells and
not expressed in the BRAF-wild type parental cells. Otherwise, both
primary BRAF-mutated melanoma cultures and their correspondent
melanoma-initiating cells expressed high levels of this receptor subtype.
These findings suggest a possible role of the endocannabinoid system in
determining the phenotype of melanoma cells and their potential to cause
central nervous system metastases.
V
Sommario
Il melanoma è un tumore aggressivo e resistente alla chemioterapia. Lo
sviluppo di nuove terapie mirate e immunoterapie ha completamente
cambiato le linee guida del trattamento del melanoma ma, il compito più
importante per il futuro è quello di superare la resistenza. In questa tesi
abbiamo studiato diverse strategie farmacologiche contro le cellule di
melanoma umano. In particolare, abbiamo dimostrato le proprietà
teranostiche (cioè, capacità di imaging coniugata con attività farmacologica
di silenziamento) di un oligodesossinucleotide antisenso molecular beacon
(MB) diretto verso l’mRNA codificante per la survivina. Questo può
rappresentare un approccio innovativo per la diagnosi ed il trattamento in
pazienti affetti da melanoma perché la survivina è un inibitore dell’apoptosi
sovraespresso in diversi tipi di tumore e non rilevabile nella maggior parte
dei tessuti sani (melanociti). Abbiamo anche valutato le capacità di blocco
del ciclo cellulare e pro-apoptotica di AM251, un antagonista/agonista
inverso del recettore dei cannabinoidi di tipo 1 (CB1) con una potenza
antitumorale paragonabile a quella osservata per il cisplatino. Questo
composto può pertanto rappresentare un potenziale prototipo per lo
sviluppo di derivati diaril-pirazolici con attività nel melanoma cutaneo
umano. Infine, abbiamo dimostrato la marcata espressione del recettore
CB1 in cellule simil-staminali derivanti da pazienti e la sua non espressione
nelle cellule parentali tipo BRAF non mutato. Invece, le culture primarie di
melanoma con mutazione BRAF e le cellule simil-staminali derivanti
esprimono alti livelli di questo sottotipo recettoriale. Questi risultati
suggeriscono un possibile ruolo del sistema endocannabinoide sia nel
determinare il fenotipo di melanoma sia nel causare metastasi a livello del
sistema nervoso centrale.
VI
Contents
Scientific products ......................................................................................... I
Abstract ...................................................................................................... IV
Sommario .................................................................................................... V
Contents ..................................................................................................... VI
List of Figures ............................................................................................ X
Chapter 1: Introduction ................................................................................ 1
1.1 Definition of melanoma ......................................................................... 1
1.2 Epidemiology ......................................................................................... 1
1.3 Risk Factors ............................................................................................ 3
1.4 Melanoma pathogenesis ......................................................................... 4
1.4.1 Rb/E2F ............................................................................................ 5
1.4.2 CDKN2A ......................................................................................... 6
1.4.3 MAPK/ERK .................................................................................... 7
1.4.4 PI3K/Akt/mTOR ............................................................................. 9
1.4.5 NF-kB ............................................................................................ 12
1.4.6 Melanoma stem cells ..................................................................... 14
1.4.7 Melanoma immune escape ............................................................ 15
1.5 Cancer staging ...................................................................................... 15
1.6 Treatment ............................................................................................. 17
. 1.6.1 Chemotherapy…………………………………………………...19
1.6.2 Immunotherapy ............................................................................ 19
1.6.3 Targeted Therapy ......................................................................... 23
Experimental Section: Theranostic properties of a survivin-directed
molecular beacon in human melanoma cells .............................................. 26
2.1 Introduction .......................................................................................... 26
VII
2.2 Materials and Methods ......................................................................... 28
2.2.1 Cell cultures ................................................................................... 28
2.2.2 Drugs ............................................................................................. 28
2.2.3 Transfection ................................................................................... 28
2.2.4 In vitro confocal microscopy in living cells .................................. 29
2.2.5 RT-PCR and quantitative real-time PCR analyses ........................ 29
2.2.6 Western blot analysis .................................................................... 30
2.2.7 Internucleosomal DNA fragmentation .......................................... 30
2.2.8 Mitochondrial membrane potential (ΔΨm) ................................... 31
2.2.9 Determination of nuclear morphology .......................................... 31
2.2.10 Statistical analysis ....................................................................... 31
2.3 Results .................................................................................................. 31
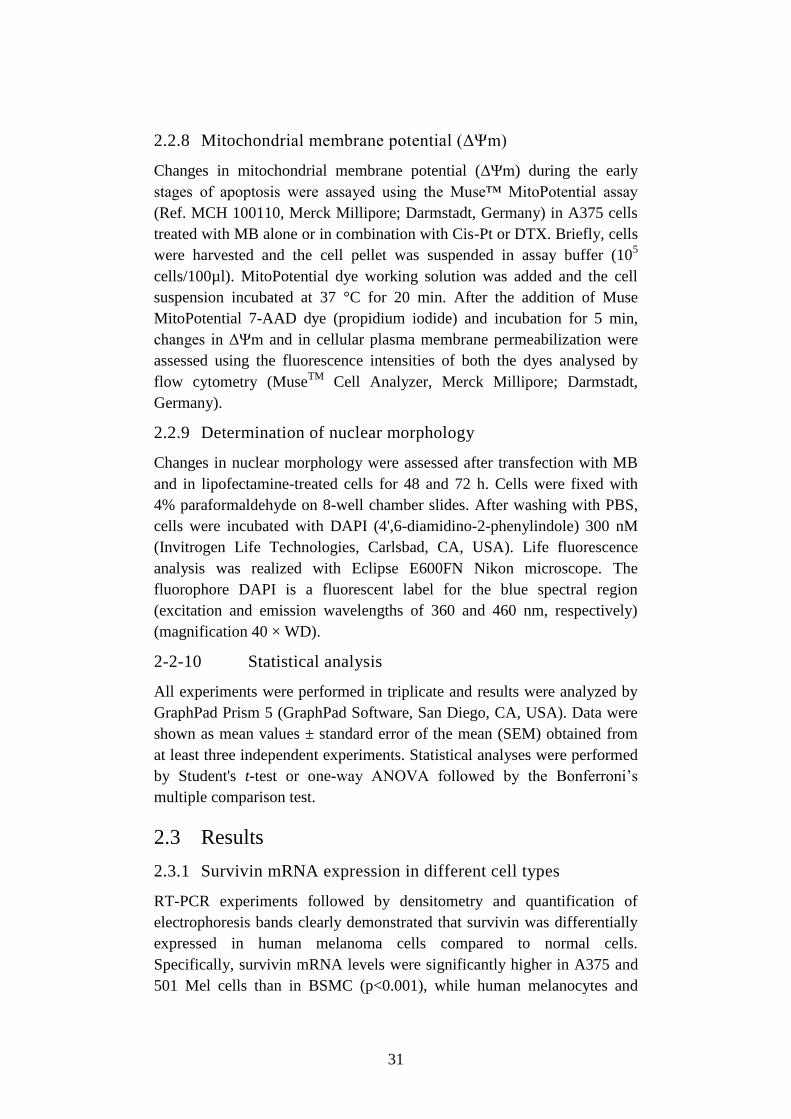
2.3.1 Survivin mRNA expression in different cell types ....................... 31
2.3.2 MB specific binding to survivin mRNA ....................................... 32
2.3.3 MB downregulation of survivin expression and protein synthesis 38
2.3.4 MB induction of apoptosis ............................................................ 40
2.3.5 MB enhancement of chemotherapy-induced apoptosis ................ 43
2.4 Discussion ............................................................................................ 45
Experimental Section: AM251 induces apoptosis and G2/M cell cycle
arrest in A375 human melanoma cells ....................................................... 48
3.1 Introduction .......................................................................................... 48
3.2 Materials and Methods ......................................................................... 49
3.2.1 Cell cultures ................................................................................... 49
3.2.2 Drugs ............................................................................................. 49
3.2.3 Cell viability assay ........................................................................ 49
3.2.4 Transfection ................................................................................... 50
VIII
3.2.5 RT-PCR and quantitative real-time PCR analyses ........................ 50
3.2.6 Determination of nuclear morphology .......................................... 51
3.2.7 Fluorescent microscope analysis of [Ca2+]i ................................. 51
3.2.8 Cell Cycle ...................................................................................... 51
3.2.9 Statistical analysis ......................................................................... 52
3.3 Results .................................................................................................. 52
3.3.1 Effect of AM251 on cell viability ................................................. 52
3.3.2 Effect of AM251 on apoptosis ...................................................... 53
3.3.3 Effect of AM251 on cell cycle ...................................................... 54
3.3.4 Effect of AM251 on GPR55 and TRPA1...................................... 55
3.3.5 Role of COX-2 in AM251-induced cytotoxicity ........................... 57
3.4 Discussion ............................................................................................ 58
Experimental Section: Endocannabinoid System In Human Melanoma
Stem-Like Cells .......................................................................................... 61
4.1 Introduction .......................................................................................... 61
4.2 Materials and Methods ......................................................................... 61
4.2.1 Cell cultures ................................................................................... 62
4.2.2 Melanoma sphere cultures ............................................................. 62
4.2.3 RT-PCR and quantitative real-time PCR analyses ........................ 62
4.3 Results .................................................................................................. 63
4.3.1 Cannabinoid CB1 receptor expression .......................................... 63
4.3.2 Cannabinoid CB2 receptor expression .......................................... 65
4.4 Conclusion ............................................................................................ 65
4.5 Future directions ................................................................................... 66
Nomenclature ............................................................................................. 67
References ................................................................................................. 71
IX
List of Figures
Figure 1.1 Schematic representation of normal skin. .............................. 1
Figure 1.2 Estimated number of cancer cases (x1000) of melanoma. ..... 2
Figure 1.3 Incidence and mortality of melanoma worldwide .................. 3
Table 1.1 Risk factors for melanoma. .................................................... 4
Figure 1.4 Pathway Rb/E2F. ................................................................... 5
Figure 1.5 Eukaryotic cell cycle .............................................................. 6
Figure 1.6 CDKN2A mutations in hereditary melanoma. ....................... 7
Figure 1.7 MAPK/ERK signalling pathway. ........................................... 8
Figure 1.8 PI3k/AKT pathway............................................................... 10
Figure 1.9 mTOR signaling pathways. ................................................. 12
Figure 1.10 The NF-κB-related signaling pathway. ................................ 13
Figure 1.11 Malignant melanoma-initiating cells……………………....14
Figure 1.12 Overview of cancer stagin. .................................................. 16
Table 1.2 AJCC for cutaneous melanoma. ........................................... 16
Figure 1.13 Guidelines for treatment of melanoma. ................................ 18
Figure 1.14 Timeline of FDA-approved medications for melanoma…...19
Figure 1.15 Ipilimumab. .......................................................................... 21
Figure 1.16 PD-1 Checkpoint. ................................................................. 22
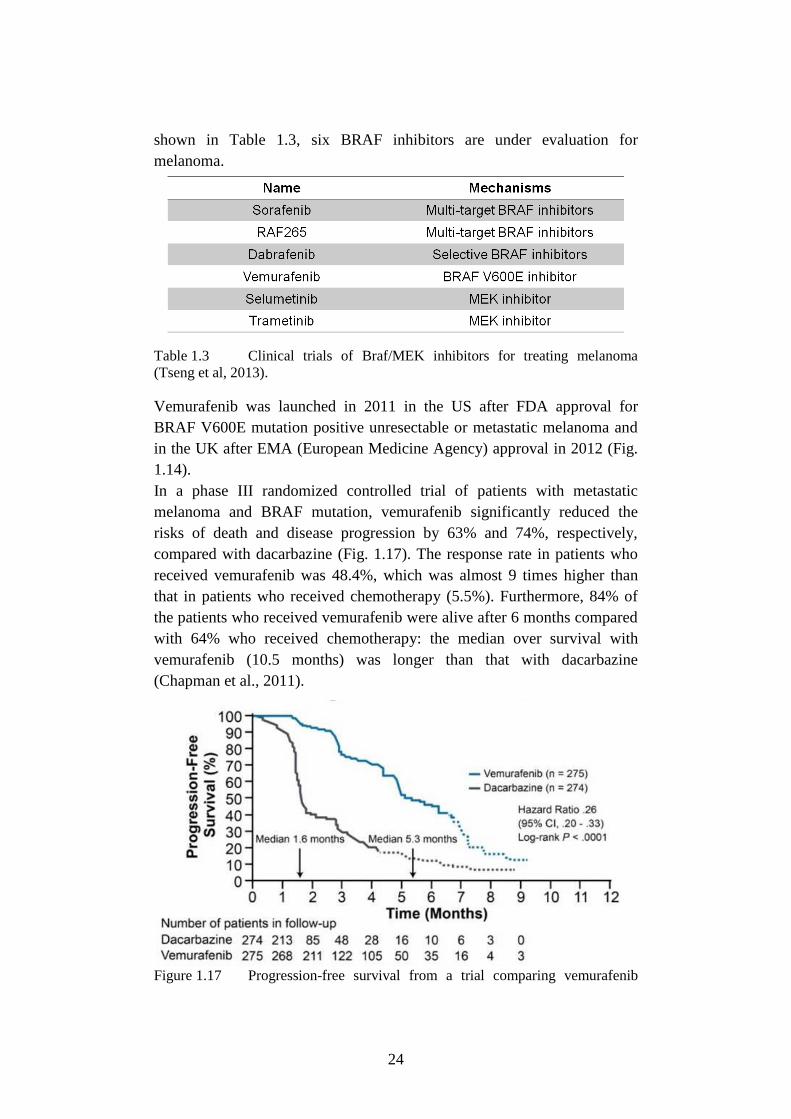
Table 1.3 Clinical trials of BRaf/MEK inhibitors. ............................... 24
Figure 1.17 Trial comparing vemurafenib with dacarbazine. ................. 24
Figure 2.1 Molecular beacon structure and mechanism of action……..27
Table 2.1 Oligonucleotide sequences of Molecular Beacon (MB) and
probe. .................................................................................... 29
Figure 2.2 Survivin gene espression in A375, 501 Mel, melanocytes,
BSMC, and monocytes. ........................................................ 32
Figure 2.3 Confocal microscopy images of survivin expression in the
cytoplasm of A375 ............................................................... 33
Figure 2.4 Confocal microscopy images of survivin expression in the
cytoplasm of 501 Mel. .......................................................... 34
Figure 2.5 Confocal microscopy images of survivin expression in the
cytoplasm of BSMC ............................................................. 35
Figure 2.6 Confocal microscopy images of survivin expression in the
cytoplasm of melanocytes .................................................... 36
Figure 2.7 Confocal microscopy images of survivin expression in the
cytoplasm of monocytes ....................................................... 37
Figure 2.8 Confocal microscopy images of probe. ................................ 38
Figure 2.9 Real-time PCR assessment of survivin in A375. ................. 38
Figure 2.10 Real-time PCR assessment of survivin in 501 Mel………...39
Figure 2.11 Detection of survivin protein levels. .................................... 40
X
Figure 2.12 Dissipation of the mitochondrial membrane potential……..41
Figure 2.13 Fragmentation of internucleosomal DNA ............................ 42
Figure 2.14 Nuclear morphology revealed by DAPI ............................... 43
Figure 2.15 Dissipation of the mitochondrial membrane potential (ΔΨm)
induced by MB and docetaxel (DTX) .................................. 44
Figure 2.16 Dissipation of the mitochondrial membrane potential (ΔΨm)
induced by MB and cisplatin (CisPt). .................................. 44
Figure 2.17 Overview of theranostic properties of MB. .......................... 45
Table 3.1 Primer nucleotide sequences, Ta and amplicon length used
for PCR experiments. ........................................................... 50
Figure 3.1 Molecular structure of AM251. ............................................ 48
Figure 3.2 Concentration-dependent cell viability decrease to AM251.52
Figure 3.3 Concentration-response curves to AM251 in HDFa……….53
Figure 3.4 Real-time PCR. ..................................................................... 53
Figure 3.5 Nuclear morphology revealed by DAPI staining…………..54
Figure 3.6 [Ca2+]i levels in Fura-2 AM loaded A375. ......................... 54
Figure 3.7 Cell cycle analyses for asynchronized A375 cells…………55
Figure 3.8 Real-time PCR results for GPR55 expression. ..................... 55
Figure 3.9 Concentration-response curve to AM251............................. 56
Figure 3.10 TRPA1 gene espression in A375 cells. ................................ 56
Figure 3.11 Absence of changes in Fluo-3. ............................................. 57
Figure 3.12 Concentration-response curves to celecoxib, rofecoxib and
indomethacin. ....................................................................... 57
Table 4.1 Clinical features of melanomas used in this study. .............. 62
Table 4.2 Expression of CB1R. ............................................................ 63
Table 4.3 Expression of CB2R. ............................................................ 65
Figure 4.1 Quantitative real-time PCR of CB1R. .................................. 64
Figure 4.2 Quantitative real-time PCR of CB1R. .................................. 64
1
Chapter 1
Introduction
1.1 Definition of melanoma
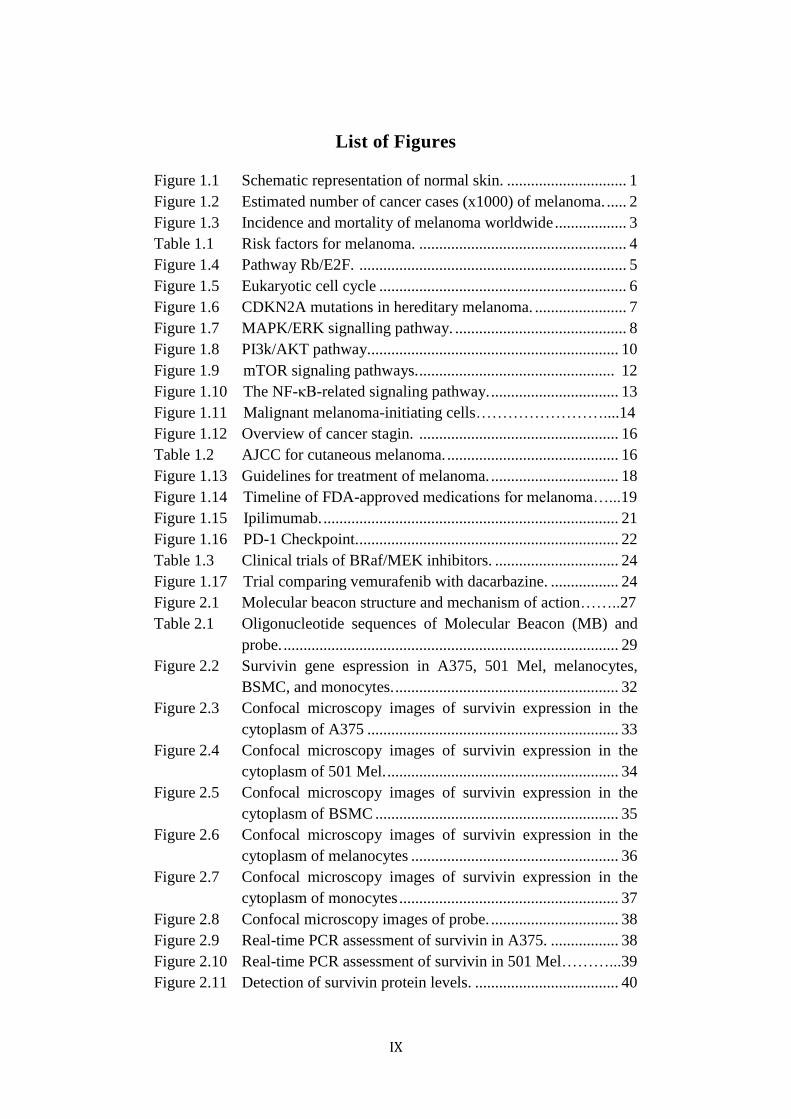
Melanoma is a form of cancer that begins in melanocytes, cells that make
the pigment melanin (Fig. 1.1). It may begin in a mole (skin melanoma),
but can also begin in other pigmented tissues, such as in the eye or in the
intestines (National Cancer Institute, Melanoma, 2014). It is called also
malignant melanoma, melanocarcinoma, melanoepithelioma,
melanosarcoma (Merriam-Webster, 2014).
Figure 1.1 Schematic representation of normal skin. The pullout shows a
close-up of the squamous cell and basal cell layers of the epidermis, the basement
membrane in between the epidermis and dermis, and the dermis with blood
vessels. Melanin is shown in the cell (National Cancer Institute, Melanoma
Anatomy, 2014).
1.2 Epidemiology
Until a few years ago, melanoma was considered a tumor rare, and very
rare until adolescence, while currently it represents an incidence in
continued growth (Tsao et al., 2004) and the second most common cancer
in adolescents (Kauffmann et al., 2014).
2
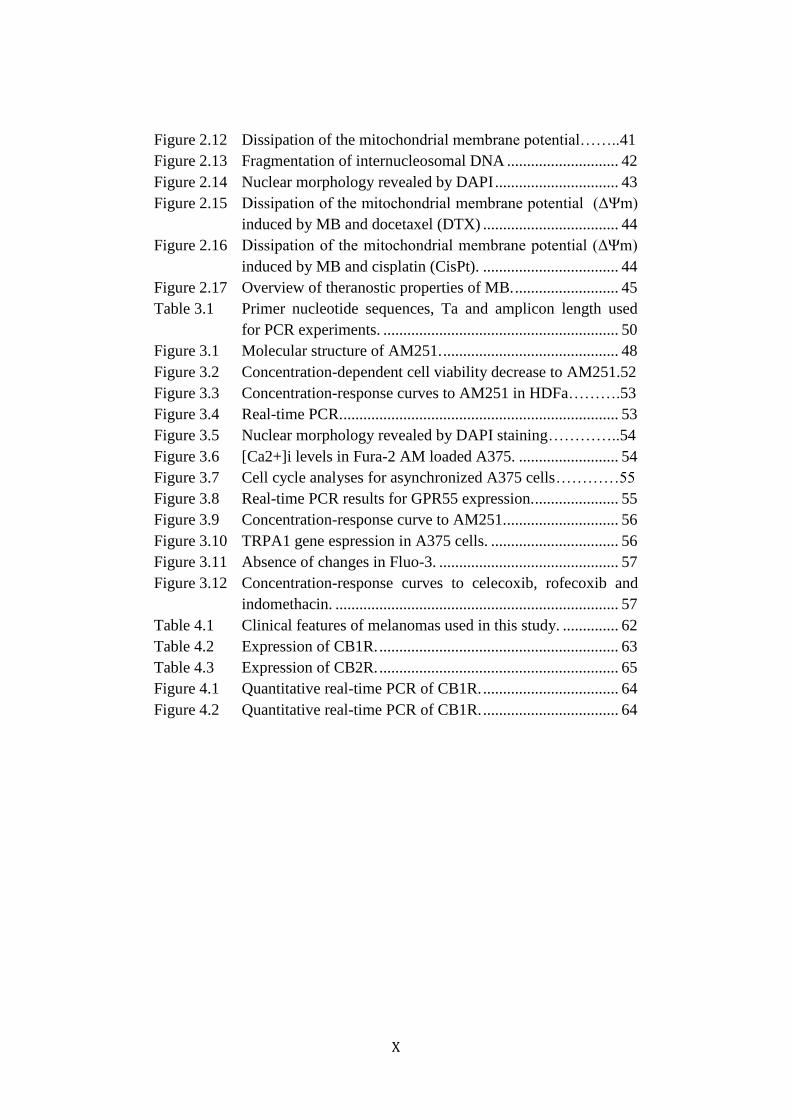
It is estimated that in the last decade, melanoma skin has reached the
132,000 new cases a year worldwide: an increase of about 15% compared
to the previous decade (Tsao et al., 2004). Its incidence varies considerably
between different areas of the world. Melanoma affects predominantly
caucasians, but there are significant geographical differences: the highest
rates are observed in populations of Australia and New Zealand, which
have values 2-3 times higher than North America and Europe. In Europe
there is a gradual reduction from north to south. Incidence rates are low in
Asian and black people (Globacan 2012, 2014). About 80% of cutaneous
melanomas that arise annually in the world affects the populations of North
America, Europe and Oceania (Fig. 1.2) (Globacan 2012, 2014). The
current melanoma risk for Australian and New Zealander populations may
be as high as 1 out of 50 (Rigel, 2010).
Figure 1.2 Estimated number of cancer cases (x1000) of melanoma of skin in
all ages and both sexes (Globacan 2012, 2014).
In 2014, an estimated, 76,100 patients will be diagnosed and about 9700
patients will die of melanoma in the United States (Siegel et al., 2014). In
Italy, an estimated 11,000 new cases in 2014 (with a slight predominance
in males) (Aiom-airtum, 2014). Melanoma is increasing in men more
rapidly than any other malignancy except lung cancer (Fig. 1.3) (Jemal et
al., 2011). Although melanoma can affect persons of essentially any age, it
is mainly a disease of adulthood, with median ages of diagnosis and death
between 61 and 68 years, respectively (Weinstock, 2012).
3
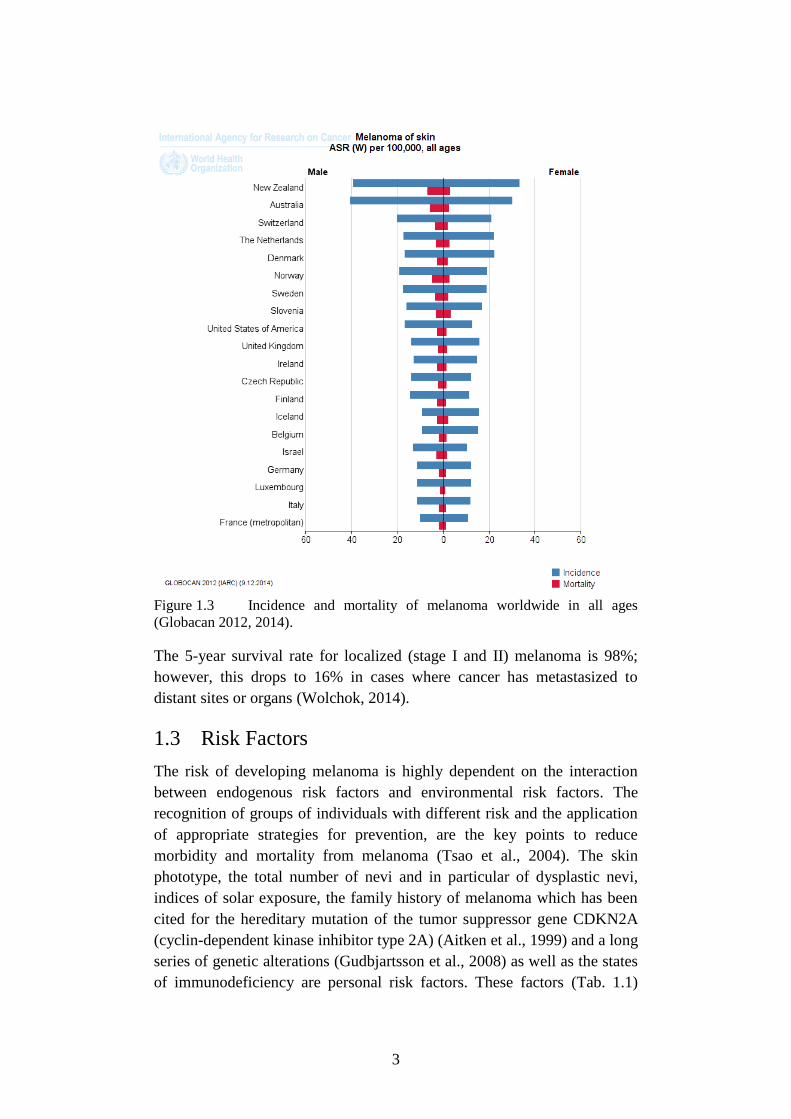
Figure 1.3 Incidence and mortality of melanoma worldwide in all ages
(Globacan 2012, 2014).
The 5-year survival rate for localized (stage I and II) melanoma is 98%;
however, this drops to 16% in cases where cancer has metastasized to
distant sites or organs (Wolchok, 2014).
1.3 Risk Factors
The risk of developing melanoma is highly dependent on the interaction
between endogenous risk factors and environmental risk factors. The
recognition of groups of individuals with different risk and the application
of appropriate strategies for prevention, are the key points to reduce
morbidity and mortality from melanoma (Tsao et al., 2004). The skin
phototype, the total number of nevi and in particular of dysplastic nevi,
indices of solar exposure, the family history of melanoma which has been
cited for the hereditary mutation of the tumor suppressor gene CDKN2A
(cyclin-dependent kinase inhibitor type 2A) (Aitken et al., 1999) and a long
series of genetic alterations (Gudbjartsson et al., 2008) as well as the states
of immunodeficiency are personal risk factors. These factors (Tab. 1.1)
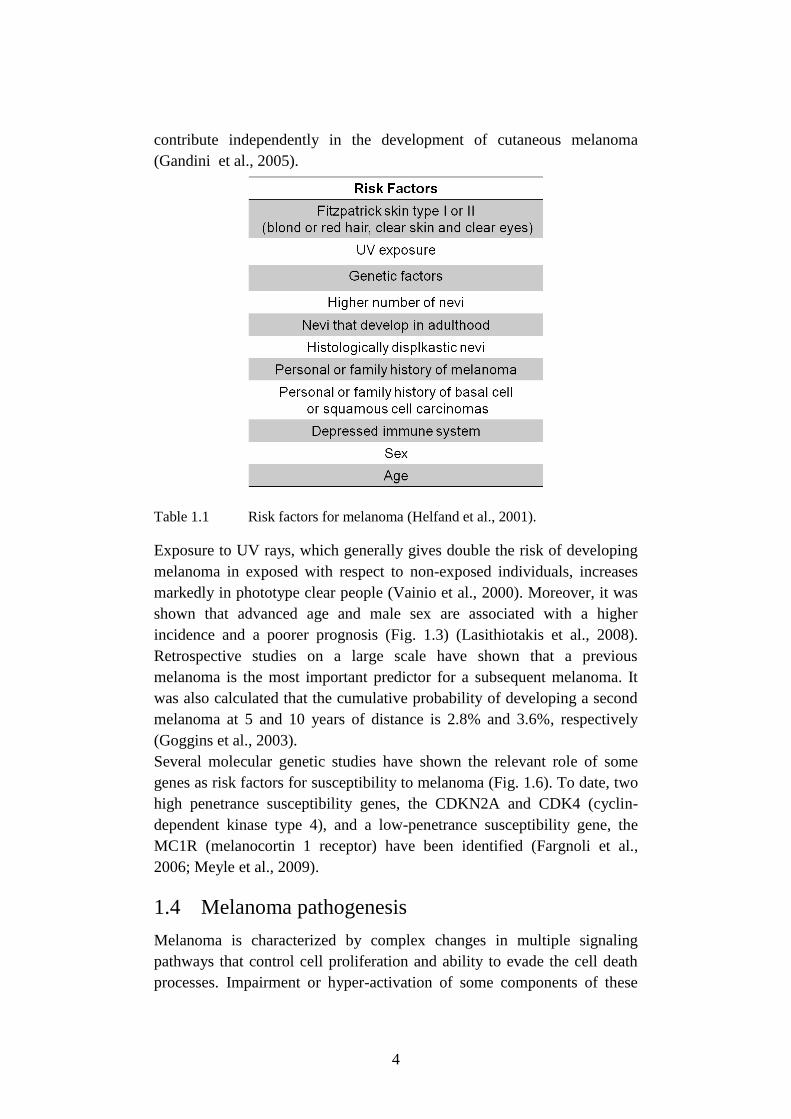
4
contribute independently in the development of cutaneous melanoma
(Gandini et al., 2005).
Table 1.1 Risk factors for melanoma (Helfand et al., 2001).
Exposure to UV rays, which generally gives double the risk of developing
melanoma in exposed with respect to non-exposed individuals, increases
markedly in phototype clear people (Vainio et al., 2000). Moreover, it was
shown that advanced age and male sex are associated with a higher
incidence and a poorer prognosis (Fig. 1.3) (Lasithiotakis et al., 2008).
Retrospective studies on a large scale have shown that a previous
melanoma is the most important predictor for a subsequent melanoma. It
was also calculated that the cumulative probability of developing a second
melanoma at 5 and 10 years of distance is 2.8% and 3.6%, respectively
(Goggins et al., 2003).
Several molecular genetic studies have shown the relevant role of some
genes as risk factors for susceptibility to melanoma (Fig. 1.6). To date, two
high penetrance susceptibility genes, the CDKN2A and CDK4 (cyclin-
dependent kinase type 4), and a low-penetrance susceptibility gene, the
MC1R (melanocortin 1 receptor) have been identified (Fargnoli et al.,
2006; Meyle et al., 2009).
1.4 Melanoma pathogenesis
Melanoma is characterized by complex changes in multiple signaling
pathways that control cell proliferation and ability to evade the cell death
processes. Impairment or hyper-activation of some components of these
5
pathways may lead to malignant transformation and cancer development.
The most relevant signaling pathways involved in development and
progression of melanoma are Rb/E2F, MAPK/ERK, PI3K/Akt/, NF-kB,
Wnt/β-catenin, Notch, Jak/STAT, cyclin/CDK, JNK/c-Jun/AP-1, MITF
and some growth factors.
In the following sub-paragraphs further insights on the principal pathways
are given for their relevance in the comprehension of the action mechanism
of drugs cited in the 1.6 paragraph.
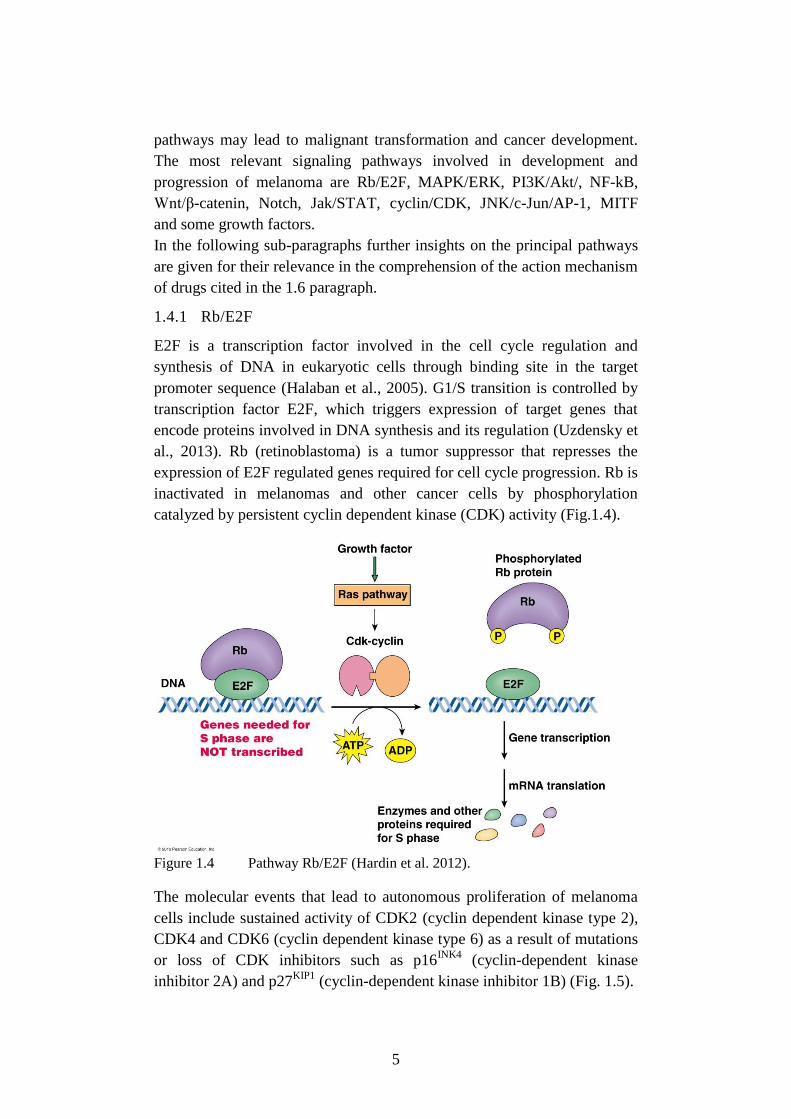
1.4.1 Rb/E2F
E2F is a transcription factor involved in the cell cycle regulation and
synthesis of DNA in eukaryotic cells through binding site in the target
promoter sequence (Halaban et al., 2005). G1/S transition is controlled by
transcription factor E2F, which triggers expression of target genes that
encode proteins involved in DNA synthesis and its regulation (Uzdensky et
al., 2013). Rb (retinoblastoma) is a tumor suppressor that represses the
expression of E2F regulated genes required for cell cycle progression. Rb is
inactivated in melanomas and other cancer cells by phosphorylation
catalyzed by persistent cyclin dependent kinase (CDK) activity (Fig.1.4).
Figure 1.4 Pathway Rb/E2F (Hardin et al. 2012).
The molecular events that lead to autonomous proliferation of melanoma
cells include sustained activity of CDK2 (cyclin dependent kinase type 2),
CDK4 and CDK6 (cyclin dependent kinase type 6) as a result of mutations
or loss of CDK inhibitors such as p16INK4
(cyclin-dependent kinase
inhibitor 2A) and p27KIP1
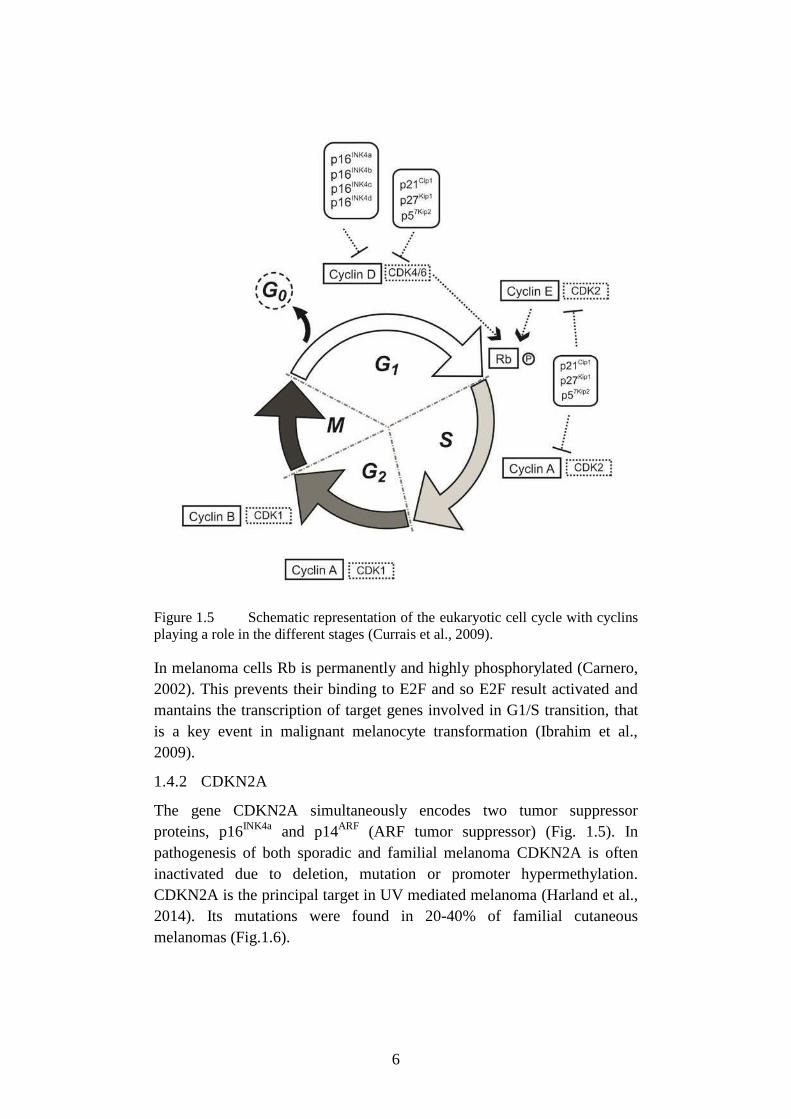
(cyclin-dependent kinase inhibitor 1B) (Fig. 1.5).
6
Figure 1.5 Schematic representation of the eukaryotic cell cycle with cyclins
playing a role in the different stages (Currais et al., 2009).
In melanoma cells Rb is permanently and highly phosphorylated (Carnero,
2002). This prevents their binding to E2F and so E2F result activated and
mantains the transcription of target genes involved in G1/S transition, that
is a key event in malignant melanocyte transformation (Ibrahim et al.,
2009).
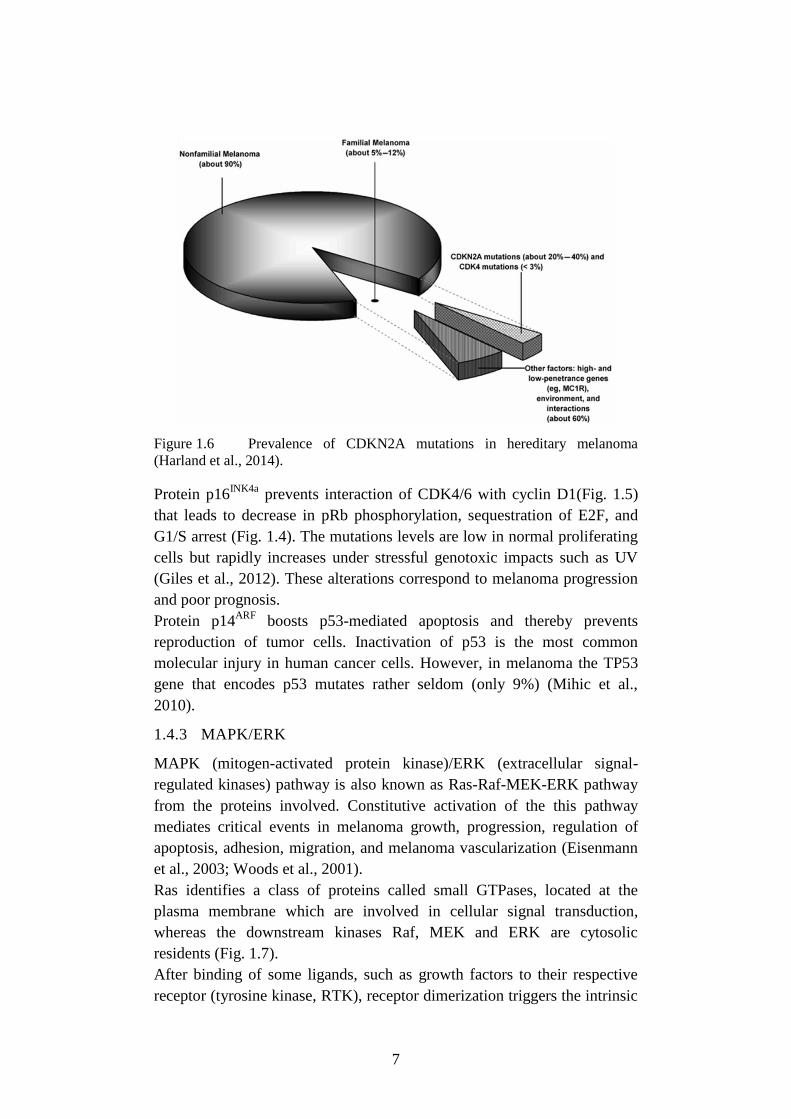
1.4.2 CDKN2A
The gene CDKN2A simultaneously encodes two tumor suppressor
proteins, p16INK4a
and p14ARF
(ARF tumor suppressor) (Fig. 1.5). In
pathogenesis of both sporadic and familial melanoma CDKN2A is often
inactivated due to deletion, mutation or promoter hypermethylation.
CDKN2A is the principal target in UV mediated melanoma (Harland et al.,
2014). Its mutations were found in 20-40% of familial cutaneous
melanomas (Fig.1.6).
7
Figure 1.6 Prevalence of CDKN2A mutations in hereditary melanoma
(Harland et al., 2014).
Protein p16INK4a
prevents interaction of CDK4/6 with cyclin D1(Fig. 1.5)
that leads to decrease in pRb phosphorylation, sequestration of E2F, and
G1/S arrest (Fig. 1.4). The mutations levels are low in normal proliferating
cells but rapidly increases under stressful genotoxic impacts such as UV
(Giles et al., 2012). These alterations correspond to melanoma progression
and poor prognosis.
Protein p14ARF
boosts p53-mediated apoptosis and thereby prevents
reproduction of tumor cells. Inactivation of p53 is the most common
molecular injury in human cancer cells. However, in melanoma the TP53
gene that encodes p53 mutates rather seldom (only 9%) (Mihic et al.,
2010).
1.4.3 MAPK/ERK
MAPK (mitogen-activated protein kinase)/ERK (extracellular signal-
regulated kinases) pathway is also known as Ras-Raf-MEK-ERK pathway
from the proteins involved. Constitutive activation of the this pathway
mediates critical events in melanoma growth, progression, regulation of
apoptosis, adhesion, migration, and melanoma vascularization (Eisenmann
et al., 2003; Woods et al., 2001).
Ras identifies a class of proteins called small GTPases, located at the
plasma membrane which are involved in cellular signal transduction,
whereas the downstream kinases Raf, MEK and ERK are cytosolic
residents (Fig. 1.7).
After binding of some ligands, such as growth factors to their respective
receptor (tyrosine kinase, RTK), receptor dimerization triggers the intrinsic
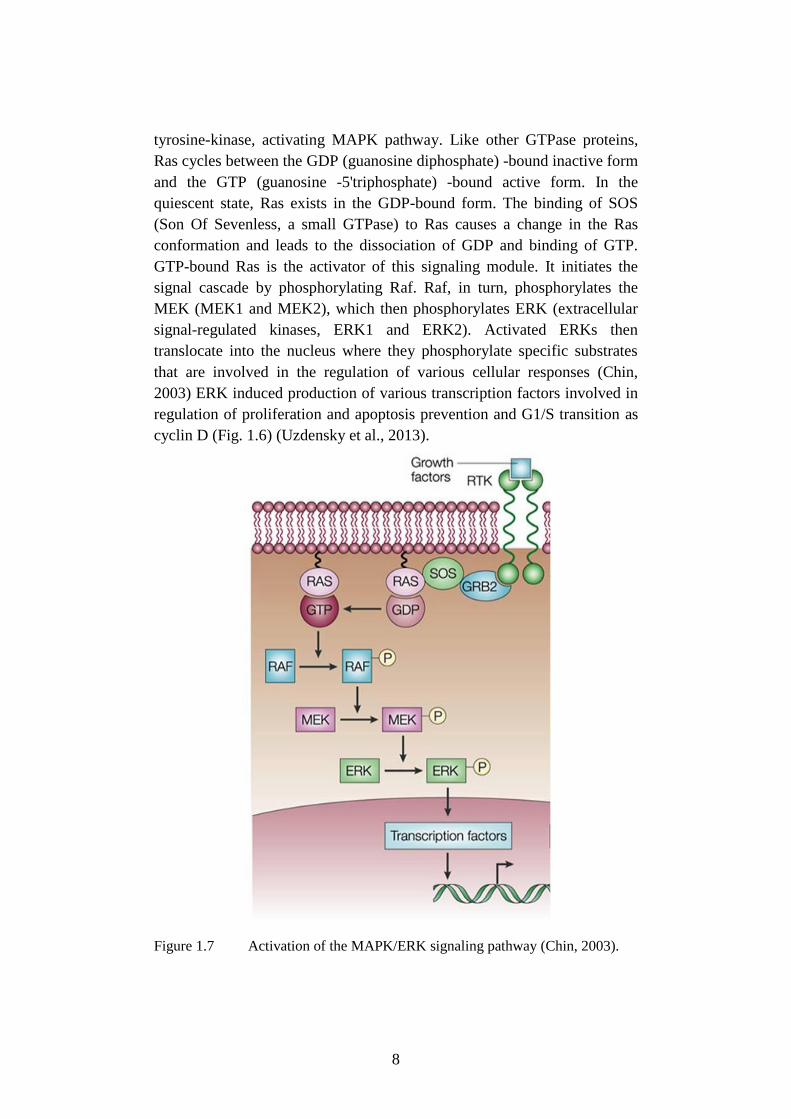
8
tyrosine-kinase, activating MAPK pathway. Like other GTPase proteins,
Ras cycles between the GDP (guanosine diphosphate) -bound inactive form
and the GTP (guanosine -5'triphosphate) -bound active form. In the
quiescent state, Ras exists in the GDP-bound form. The binding of SOS
(Son Of Sevenless, a small GTPase) to Ras causes a change in the Ras
conformation and leads to the dissociation of GDP and binding of GTP.
GTP-bound Ras is the activator of this signaling module. It initiates the
signal cascade by phosphorylating Raf. Raf, in turn, phosphorylates the
MEK (MEK1 and MEK2), which then phosphorylates ERK (extracellular
signal-regulated kinases, ERK1 and ERK2). Activated ERKs then
translocate into the nucleus where they phosphorylate specific substrates
that are involved in the regulation of various cellular responses (Chin,
2003) ERK induced production of various transcription factors involved in
regulation of proliferation and apoptosis prevention and G1/S transition as
cyclin D (Fig. 1.6) (Uzdensky et al., 2013).
Figure 1.7 Activation of the MAPK/ERK signaling pathway (Chin, 2003).
9
Mutated Ras or Raf proteins permanently stimulate cell proliferation, tumor
invasion and metastasis. Such mutations were observed in >90% of clinical
cases of melanoma (Smalley, 2010).
The Ras subfamily consists of three isoforms: H-Ras, K-Ras and N-Ras.
NRAS is mainly related to melanoma pathogenesis. NRAS mutations were
found in 15-30% of melanoma cases (Sekulic et al., 2008).
The Raf subfamily consists of isoforms A-Raf, B-Raf and C-Raf (also
called Raf-1). Braf mutations are the most relevant in melanoma and have
been found in 60-70% of primary melanoma but also in a high % of
cutaneous melanocyte nevi; it is considered a risk factor involved in
initiation rather than in progression of melanomas. Although more than 40
different mutations in BRAF gene have been described, the most clinically
relevant mutation is the BRAF T1799A, which results in the substitution of
valine by glutamic acid (V600E) in the kinase domain of the protein.
Mutated Braf protein permanently activates ERK and stimulates
proliferation. The mutation V600E, is found in 80-90% of all BRAF
mutations in melanoma. ARAF and CRAF are found seldom in melanoma
and actually are not considered relevant (Platz et al., 2008).
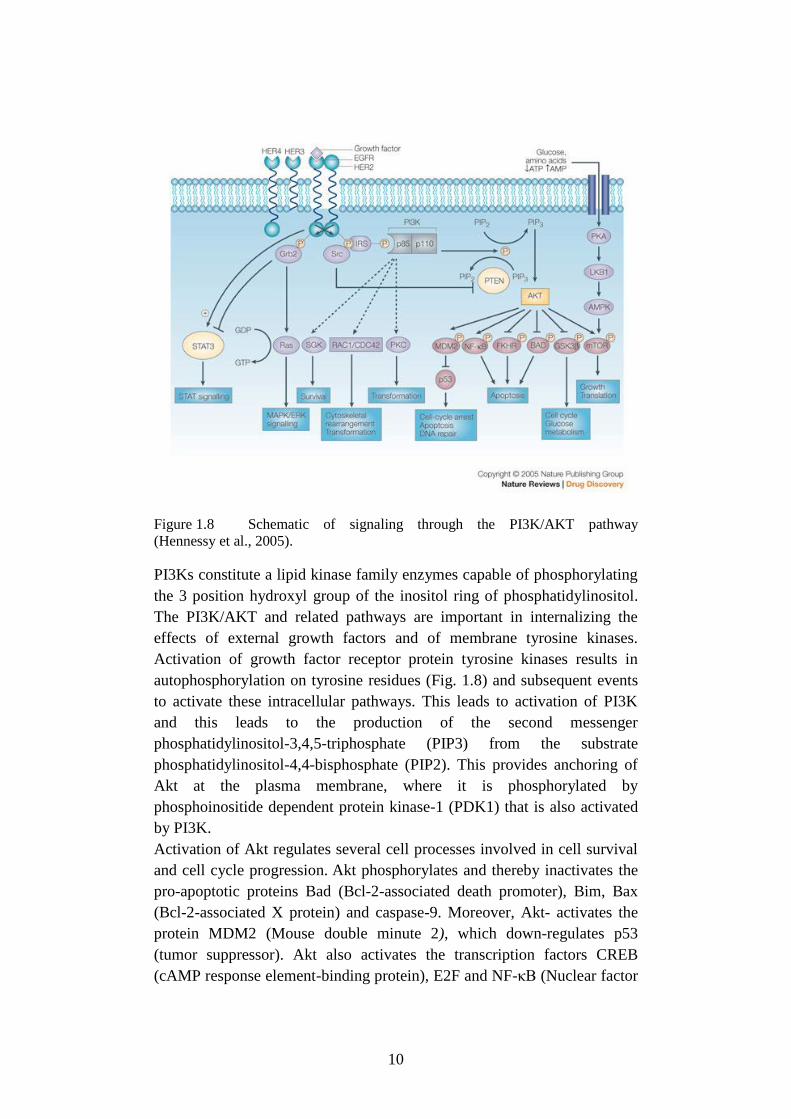
1.4.4 PI3K/Akt/mTOR
The phosphatidylinositol-3-kinase (PI3K)/ protein kinase B (Akt) and the
mammalian target of rapamycin (mTOR) signaling pathways (Fig. 1.8)
make a crucial network to many aspects of cell growth and survival, in
physiological as well as in pathological conditions (e.g., cancer) (Porta et
al., 2014).
The PI3K/Akt pathway is a key regulator of survival during cellular stress
(Datta et al., 1999). Since tumors exist in an intrinsically stressful
environment (characterized by limited nutrient and oxygen supply, as well
as by low pH), the role of this pathway in cancer appears to be crucial.
10
Figure 1.8 Schematic of signaling through the PI3K/AKT pathway
(Hennessy et al., 2005).
PI3Ks constitute a lipid kinase family enzymes capable of phosphorylating
the 3 position hydroxyl group of the inositol ring of phosphatidylinositol.
The PI3K/AKT and related pathways are important in internalizing the
effects of external growth factors and of membrane tyrosine kinases.
Activation of growth factor receptor protein tyrosine kinases results in
autophosphorylation on tyrosine residues (Fig. 1.8) and subsequent events
to activate these intracellular pathways. This leads to activation of PI3K
and this leads to the production of the second messenger
phosphatidylinositol-3,4,5-triphosphate (PIP3) from the substrate
phosphatidylinositol-4,4-bisphosphate (PIP2). This provides anchoring of
Akt at the plasma membrane, where it is phosphorylated by
phosphoinositide dependent protein kinase-1 (PDK1) that is also activated
by PI3K.
Activation of Akt regulates several cell processes involved in cell survival
and cell cycle progression. Akt phosphorylates and thereby inactivates the
pro-apoptotic proteins Bad (Bcl-2-associated death promoter), Bim, Bax
(Bcl-2-associated X protein) and caspase-9. Moreover, Akt- activates the
protein MDM2 (Mouse double minute 2), which down-regulates p53
(tumor suppressor). Akt also activates the transcription factors CREB
(cAMP response element-binding protein), E2F and NF-κB (Nuclear factor
11
kappa-light-chain-enhancer of activated B cells) involved in cell protection
and survival. Activated Akt stimulates proliferation and tumorigenesis
through up-regulation of cyclin D1, which controls G1/S transition, and
inhibition of p21 (cyclin-dependent kinase inhibitor 1) and p27, which
prevent G1/S transition (Fig. 1.5). Akt-mediated activation of mTOR also
suppresses apoptosis and stimulates protein synthesis, proliferation and
angiogenesis. Other effects of PI3K/Akt/mTOR is mediated by the
transcription factor HIF1 (hypoxia-inducible factor-1) and VEGF (vascular
endothelial growth factor) (Madhunapantula et al, 2009).
The Akt family comprises three isoforms: Akt1, Akt 2 and Akt3, but only
Akt3 is the predominant isoform in melanoma cells. Overexpression and
overactivation of Akt3 are characteristic for 60-70% of sporadic
melanomas. Significant phosphorylation of Akt3 was registered in 17%,
43%, 49% and 77% of biopsies from normal nevi, dysplastic nevi, primary
melanoma and melanoma metastases, respectively (Stahl et al., 2004).
The PI3K/Akt pathway is regulated by the lipid phosphatase PTEN,
(phosphatase and tensin homolog) that acts as a tumor suppressor by
inhibiting cell growth and enhancing cellular sensitivity to apoptosis.
PTEN removes phosphate groups from PIP3 and converts it into PIP2 (Fig.
1.8), preventing Akt binding and activation. PTEN also inhibits the
Raf/ERK pathway (Stahl et al., 2003) and its impairment has been found
related to about 40-50% cases of sporadic melanoma (Stahl et al., 2003).
Sun ultraviolet radiation, the major risk factor for skin cancer, induces
PTEN mutations that promote melanoma promotes melanoma growth
(Hocker et al., 2007). The PTEN and NRAS or BRAF mutations cooperate
in melanoma development and metastasis (Dankort et al., 2009).
mTOR is a bioenergetic sensor and it is a master regulator of protein
synthesis, proliferation, autophagy, apoptosis and other cellular processes.
It serves as a sensor of abundance of metabolites and energy depletion in
the cell (Fig. 1.8). It is stimulated by protein Rag, which is activated by free
amino acids. AMP-activated protein kinase (AMPK) inhibits mTOR and
thereby mTOR-mediated protein synthesis, when ATP (adenosine
triphosphate) depletion induces accumulation of AMP (adenosine
monophosphate). Activation of the PI3K/Akt pathway by growth factors
stimulates mTOR (Fig. 1.9). mTOR forms two signaling complexes:
mTORC1 and mTORC2. mTORC1 contains proteins mTOR, GβL (G
protein β-like) and RAPTOR (regulatory-associated protein of mTOR),
whereas in mTOR2 RAPTOR is substituted by RICTOR (rapamycin-
insensitive companion of mammalian target of rapamycin). mTORC1
stimulates protein synthesis and inhibits autophagy. mTORC2 regulates
remodeling of the actin cytoskeleton and the cell shape. It also activates
12
Akt thereby creating the regulatory feedback, which results in Akt-
mediated inhibition of the pro-apoptotic protein GSK3 (glycogen synthase
kinase 3), and stimulates proliferation through activation of cyclin D1 and
inhibition of p27. The activity of Akt and cell survival depends on the fine
balance between mTORC1 and mTORC2 activities because the two
different mTORC complexes have opposite effects on Akt signaling, with
mTORC1 suppressing Akt signaling and mTORC2 directly activating Akt
through a phosphorylation event at Ser473 (Sarbassov et al., 2004;
Uzdensky et al., 2013).
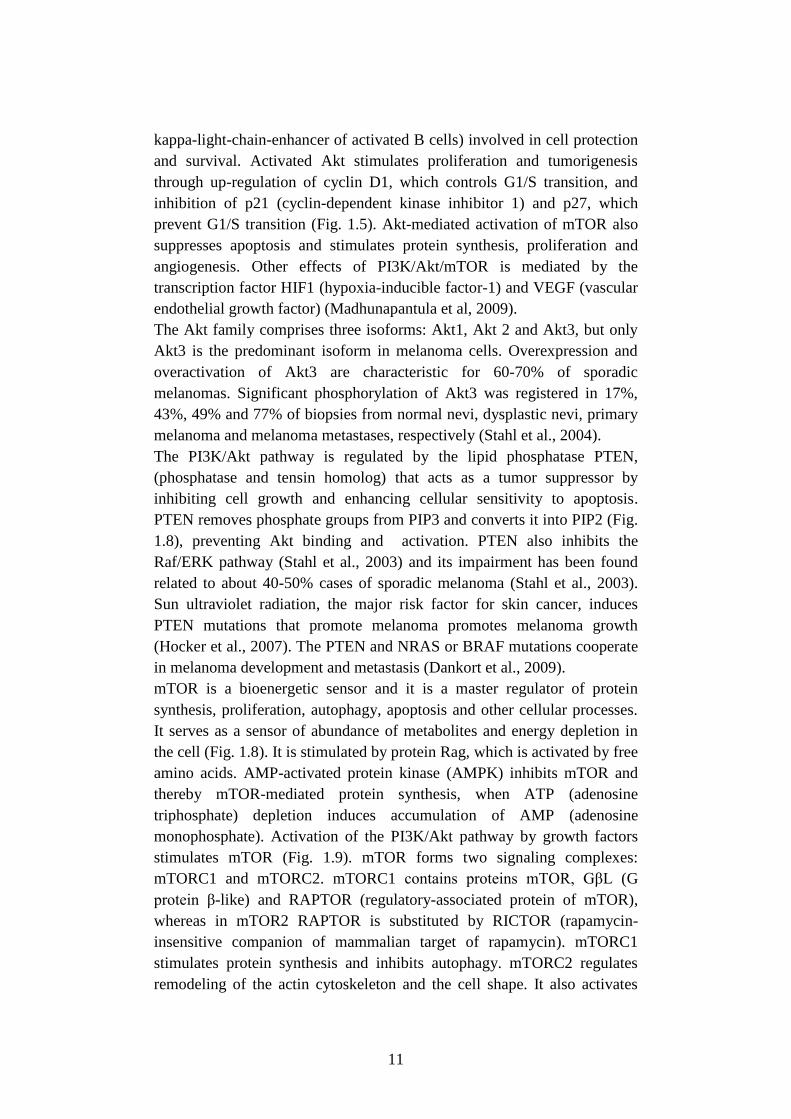
Figure 1.9 mTOR signaling pathways (Guertin, 2009).
mTOR involvement in melanoma development has been suggested since it
is activated in 73% of malignant melanomas versus 4% in benign nevi
(Karbowniczek et al., 2008). Activation of the mTOR pathway in
cutaneous melanoma is associated with poor prognosis (Populo et al.,
2011). Activation of mTOR in response to growth, nutrient and energy
signals leads to an increase in protein synthesis, which is required for
tumor development (Dancey, 2010).
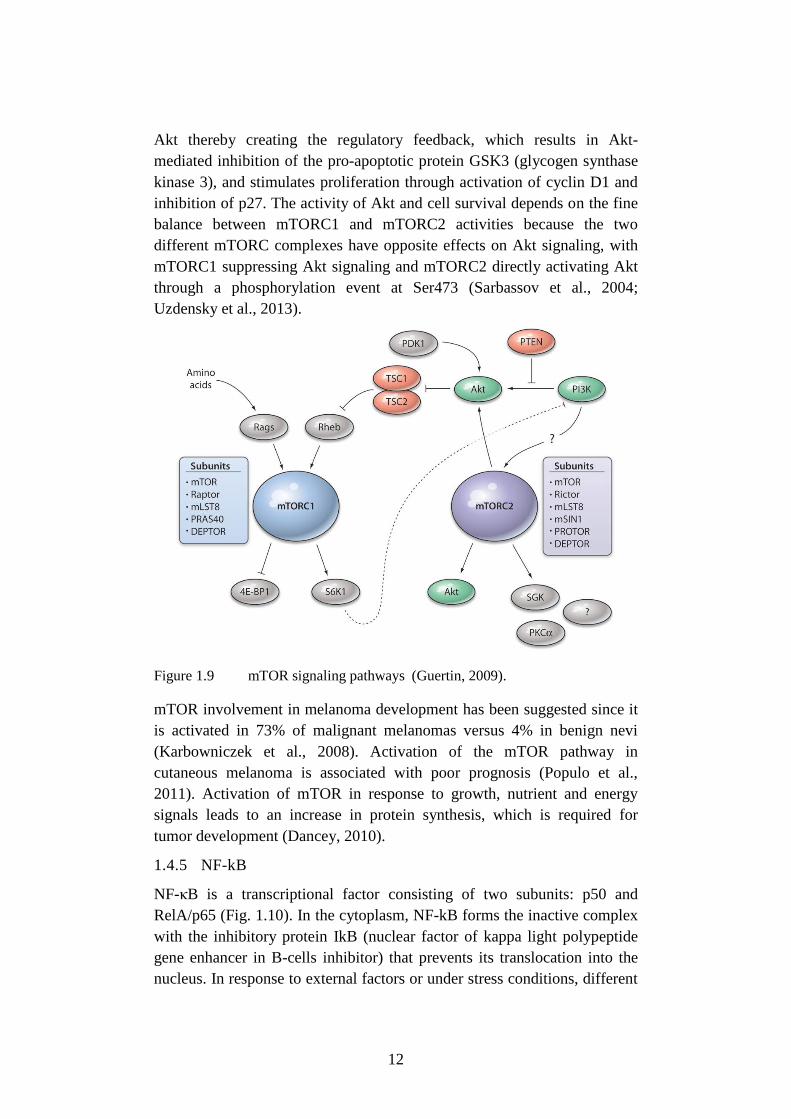
1.4.5 NF-kB
NF-κB is a transcriptional factor consisting of two subunits: p50 and
RelA/p65 (Fig. 1.10). In the cytoplasm, NF-kB forms the inactive complex
with the inhibitory protein IkB (nuclear factor of kappa light polypeptide
gene enhancer in B-cells inhibitor) that prevents its translocation into the
nucleus. In response to external factors or under stress conditions, different
13
signaling proteins such as Akt, ERK, p38 (mitogen-activated protein
kinases) and NIK (NF-kappa-B-inducing kinase) phosphorylate IkB kinase
(IKK, inhibitor of nuclear factor kappa-B kinase) that induces detachment
and proteasomal degradation of IkB. Free NF-kB (p50/p65), which may be
additionally phosphorylated/activated by a variety of other enzymes, is
transferred into the nucleus, where it initiates transcription of more than
150 target genes involved in regulation of apoptosis, proliferation,
inflammation, immune reactions, metastasis and tumor angiogenesis
(Uzdensky et al., 2013; Madonna et al., 2012). Constitutive activation of
Akt3 in melanoma leads to up-regulation of NF-kB and contributes to
tumor progression. Akt3 phosphorylates and activates NF-kB either
directly or through phosphorylation of IKKα. This is followed by IKKα-
mediated phosphorylation of p65 that stimulates nuclear localization and
DNA-binding of NF-kB (Amiri et al., 2005).
Figure 1.10 The NF-kB-related signaling pathway (Uzdensky et al., 2013).
Up-regulation and constitutive activation of various components of the NF-
kB pathway have been found related to progression and metastasis of
melanoma. The NF-kB-mediated expression of anti-apoptotic proteins such
as IAP (Inhibitor of apoptosis), survivin, TRAF1/2 (tumor necrosis factor
14
receptor associated factor 1/2), and Bcl-2 (B-cell lymphoma 2) family
members increases along with melanoma progression to invasive and
metastatic phases. NF-kB also controls the expression of cyclin D1 and
CDK2 that regulate proliferation. Overexpression of these proteins allows
melanoma cells to escape the cell-cycle control and initiate tumor growth.
The activation of NF-kB in melanoma cells is associated with deregulation
of upstream signaling pathways, such as Ras/Raf/MAPK, PI3K/Akt, and
TRAF/NIK/NF-κB. In melanoma tumorigenesis and progression, in
addition to the role played by specific melanoma cell pathways, as above
reported, there are other features which must be considered, i.e. the
relevance of stem cells and the role played by the immune system.
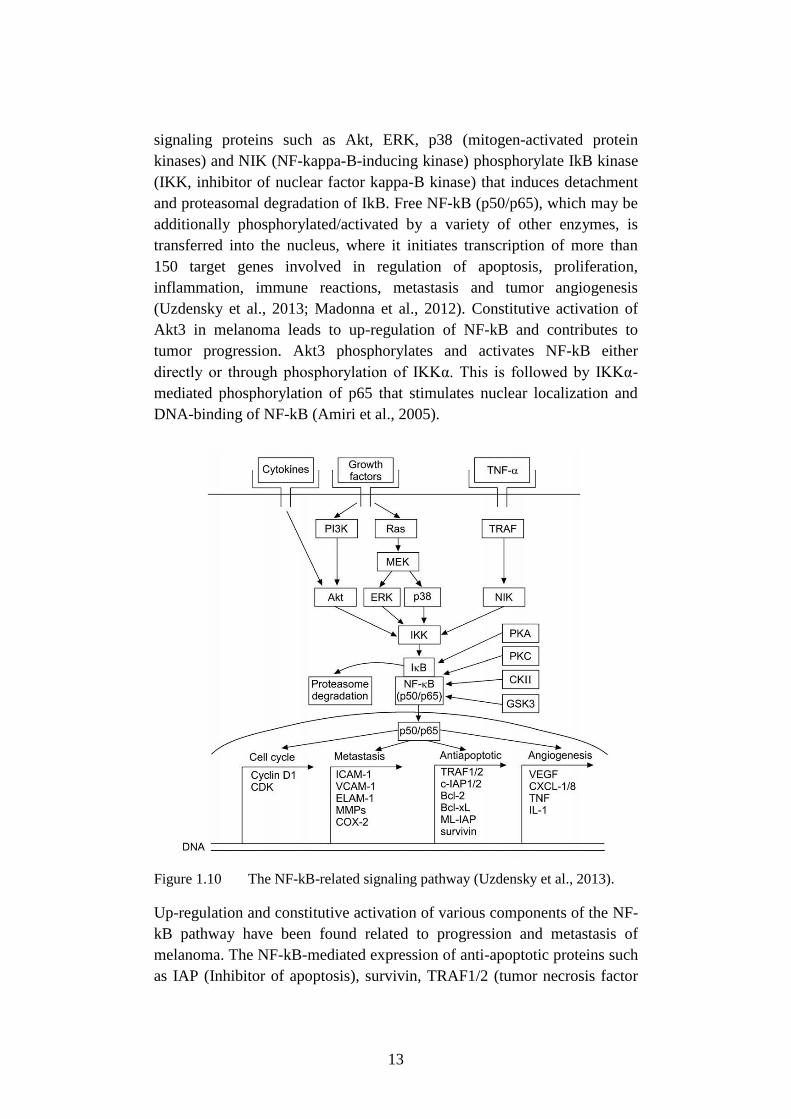
1.4.6 Melanoma stem cells
Cancer stem cells (CSC) are the subset of cells found in a malignancy that
is responsible not only for the formation of tumors, but also for their
inexorable progression. These primitive melanoma cells (Fig. 1.11) are not
only capable of self-renewal (produce new stem cells), reprogramming and
phenotype-switching capability but also it gives rise to a diversity of cells
that differentiate and after a finite number of divisions, eventually succumb
to programmed cell death (differentiation plasticity). Cancer stem cells may
also confer virulence via immune evasion and multidrug resistance, and
potentially via vasculogenic mimicry and transition to migratory and
metastasizing derivatives (Girouard et al., 2011).
Figure 1.11 Malignant melanoma-initiating cells (MMICs) (Lee et al., 2014).
The presence of a minor subpopulation of CSC is observed in the
melanoma tissue and drives tumor initiation and progression.
Chemotherapy and/or radiotherapy of a tumor kills a bulk of rapidly
proliferating cancer cells but not quiescent CSC that are more resistant and
15
can survive and reinitiate tumor growth (Schatton et al., 2008). Melanoma
biopsies contain from 1 to 20% of melanoma stem cells (Na et al., 2009;
Schatton et al., 2008). Quintana and collaborators (2008) have shown that 1
in 4 melanoma cells can initiate a new tumor in immune-deficient animals,
i.e. up to 25% melanoma cells are potentially tumorigenic.
The future development of the anti-melanoma therapy will involve the
searches of specific markers of melanoma-initiating cells different from
markers of normal stem cells.
1.4.7 Melanoma immune escape
The immune system’s natural capacity to detect and destroy abnormal cells
may prevent the development of many cancers. However, some cancers, as
melanoma, are able to avoid detection and destruction by the immune
system. The hypothesis is that tumor variants become more resistant to
identification and/or elimination by the immune system with a consequent
tumor growth. This process has been called “cancer immunoediting”. This
hypothesis explains the observation that tumors often become clinically
evident years after their molecular origin. At the end of this equilibrium
between the immune system and tumor growth, the immune response
allows for the outgrowth of a subpopulation of tumor cells (Herrera-
Gonzalez, 2013). For deepening also Gajewski et al., 2013.
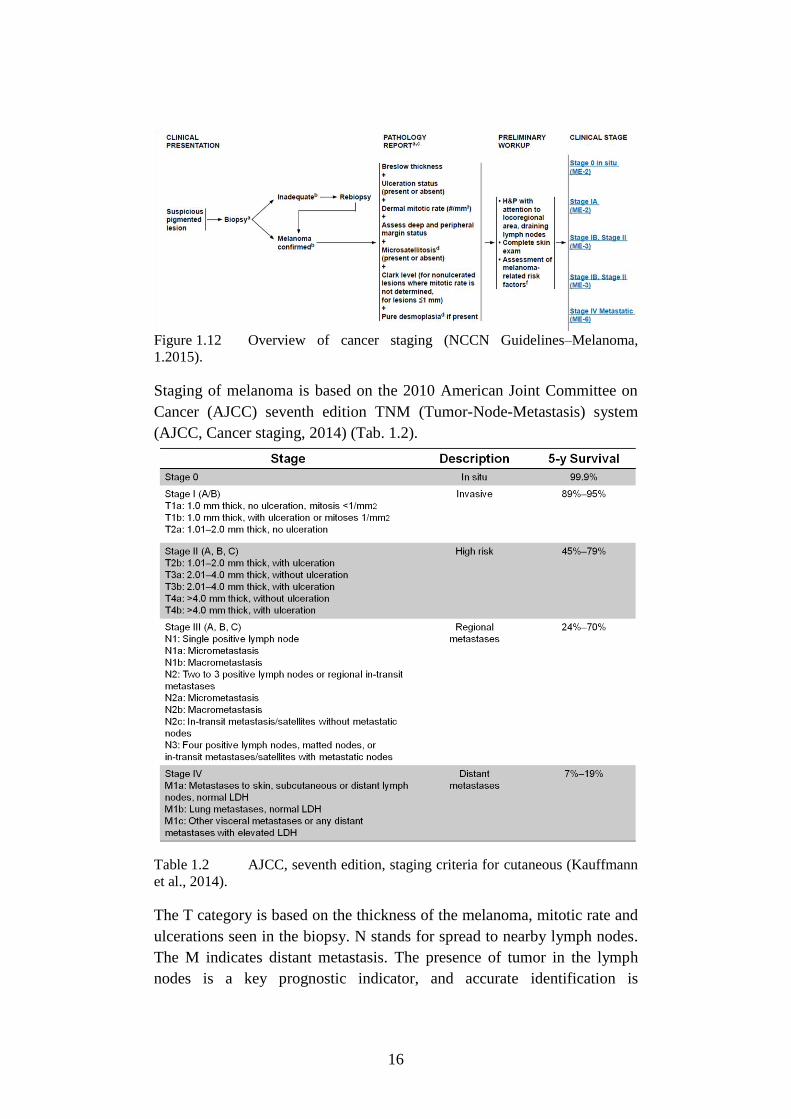
1.5 Cancer staging
Staging is based on detailed information regarding the histologic subtype,
Clark level, Breslow depth, dermal mitotic rate per square millimeter,
degree of atypia, presence of lymphocytic invasion, presence of ulceration
or tumor regression, presence of lymphovascular or perineural invasion,
microsatellitosis, and margin assessment (Fig. 1.12) (Kauffmann et al.,
2014).
16
Figure 1.12 Overview of cancer staging (NCCN Guidelines–Melanoma,
1.2015).
Staging of melanoma is based on the 2010 American Joint Committee on
Cancer (AJCC) seventh edition TNM (Tumor-Node-Metastasis) system
(AJCC, Cancer staging, 2014) (Tab. 1.2).
Table 1.2 AJCC, seventh edition, staging criteria for cutaneous (Kauffmann
et al., 2014).
The T category is based on the thickness of the melanoma, mitotic rate and
ulcerations seen in the biopsy. N stands for spread to nearby lymph nodes.
The M indicates distant metastasis. The presence of tumor in the lymph
nodes is a key prognostic indicator, and accurate identification is
17
paramount for both accurate staging and decision-making on further
therapy.
Understanding the cancer’s stage is also critical to identifying clinical trials
that may be appropriate for particular patients (AJCC, Cancer staging,
2014).
1.6 Treatment
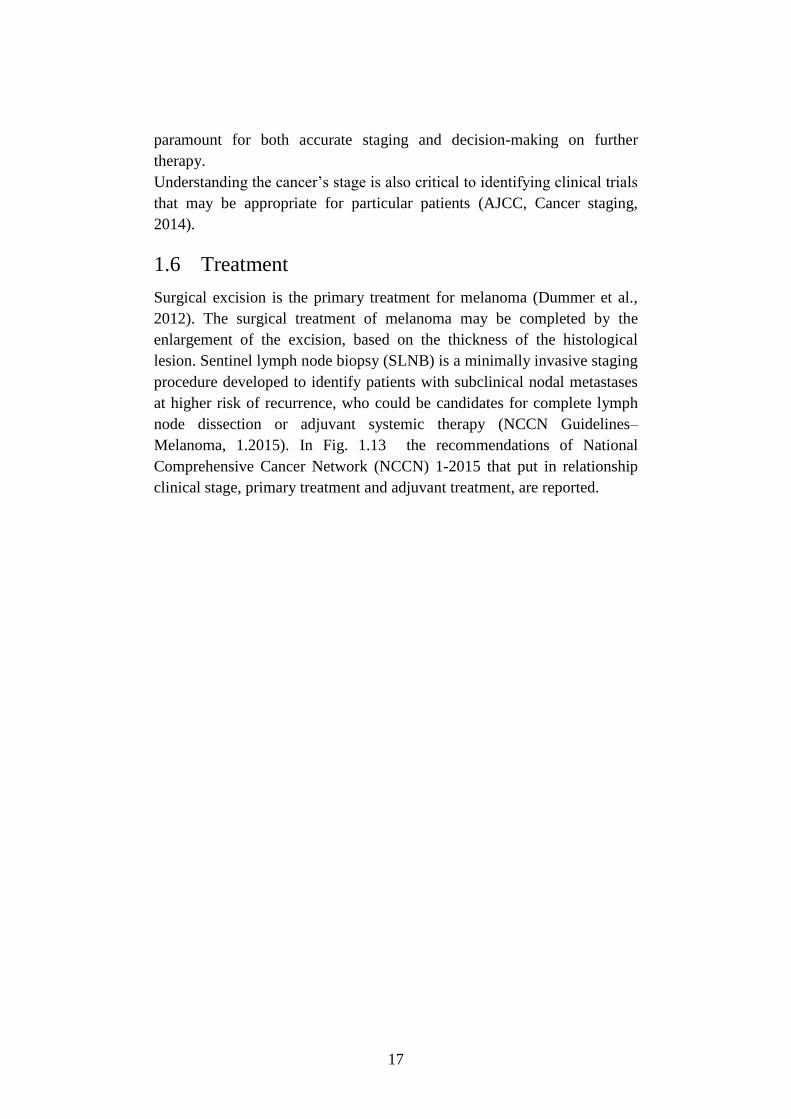
Surgical excision is the primary treatment for melanoma (Dummer et al.,
2012). The surgical treatment of melanoma may be completed by the
enlargement of the excision, based on the thickness of the histological
lesion. Sentinel lymph node biopsy (SLNB) is a minimally invasive staging
procedure developed to identify patients with subclinical nodal metastases
at higher risk of recurrence, who could be candidates for complete lymph
node dissection or adjuvant systemic therapy (NCCN Guidelines–
Melanoma, 1.2015). In Fig. 1.13 the recommendations of National
Comprehensive Cancer Network (NCCN) 1-2015 that put in relationship
clinical stage, primary treatment and adjuvant treatment, are reported.
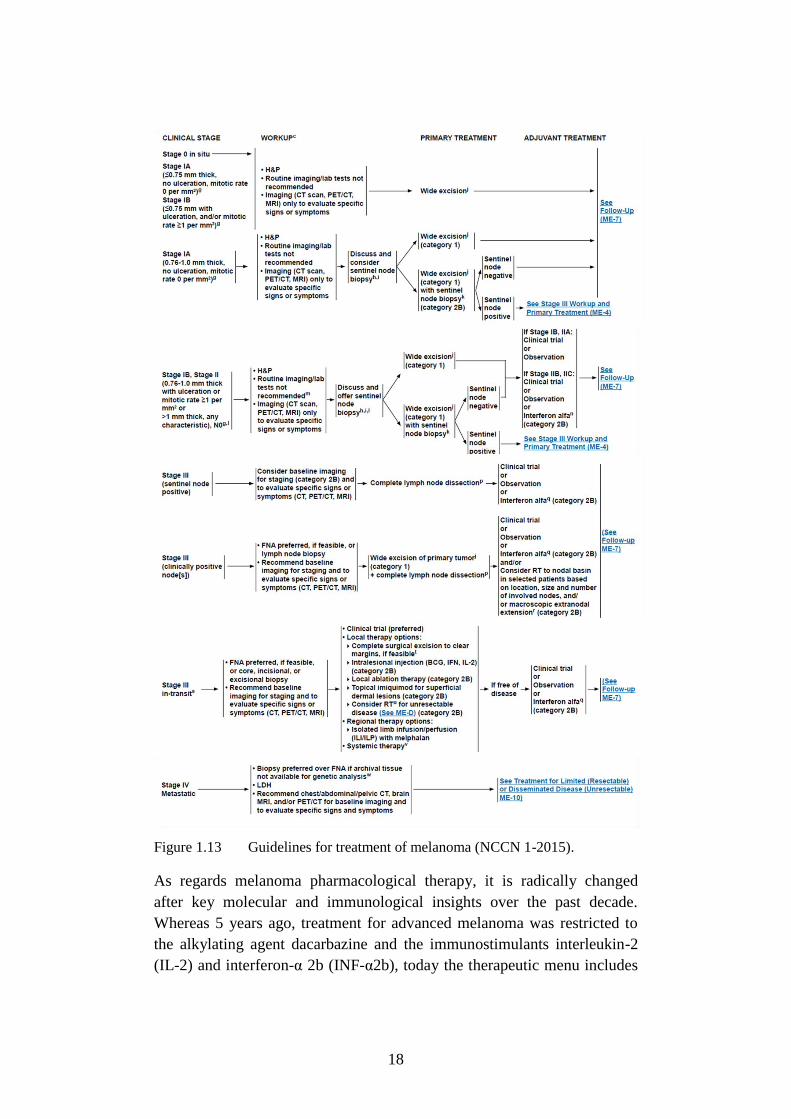
18
Figure 1.13 Guidelines for treatment of melanoma (NCCN 1-2015).
As regards melanoma pharmacological therapy, it is radically changed
after key molecular and immunological insights over the past decade.
Whereas 5 years ago, treatment for advanced melanoma was restricted to
the alkylating agent dacarbazine and the immunostimulants interleukin-2
(IL-2) and interferon-α 2b (INF-α2b), today the therapeutic menu includes
19
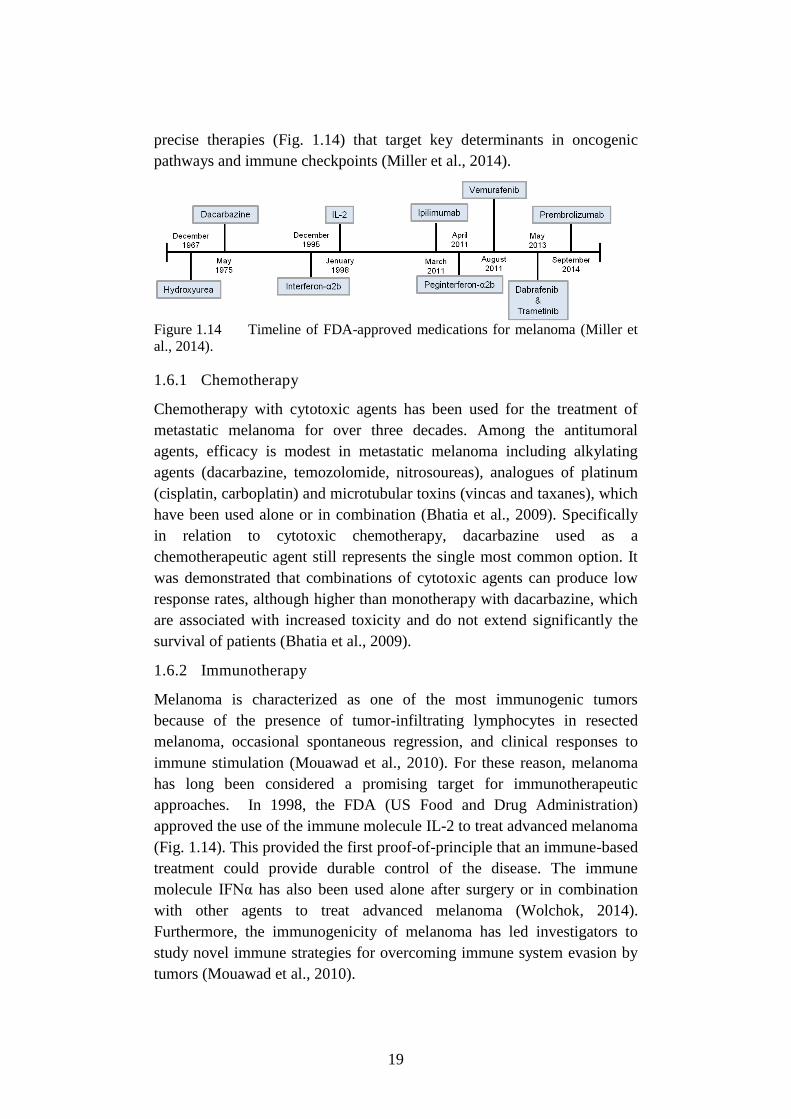
precise therapies (Fig. 1.14) that target key determinants in oncogenic
pathways and immune checkpoints (Miller et al., 2014).
Figure 1.14 Timeline of FDA-approved medications for melanoma (Miller et
al., 2014).
1.6.1 Chemotherapy
Chemotherapy with cytotoxic agents has been used for the treatment of
metastatic melanoma for over three decades. Among the antitumoral
agents, efficacy is modest in metastatic melanoma including alkylating
agents (dacarbazine, temozolomide, nitrosoureas), analogues of platinum
(cisplatin, carboplatin) and microtubular toxins (vincas and taxanes), which
have been used alone or in combination (Bhatia et al., 2009). Specifically
in relation to cytotoxic chemotherapy, dacarbazine used as a
chemotherapeutic agent still represents the single most common option. It
was demonstrated that combinations of cytotoxic agents can produce low
response rates, although higher than monotherapy with dacarbazine, which
are associated with increased toxicity and do not extend significantly the
survival of patients (Bhatia et al., 2009).
1.6.2 Immunotherapy
Melanoma is characterized as one of the most immunogenic tumors
because of the presence of tumor-infiltrating lymphocytes in resected
melanoma, occasional spontaneous regression, and clinical responses to
immune stimulation (Mouawad et al., 2010). For these reason, melanoma
has long been considered a promising target for immunotherapeutic
approaches. In 1998, the FDA (US Food and Drug Administration)
approved the use of the immune molecule IL-2 to treat advanced melanoma
(Fig. 1.14). This provided the first proof-of-principle that an immune-based
treatment could provide durable control of the disease. The immune
molecule IFNα has also been used alone after surgery or in combination
with other agents to treat advanced melanoma (Wolchok, 2014).
Furthermore, the immunogenicity of melanoma has led investigators to
study novel immune strategies for overcoming immune system evasion by
tumors (Mouawad et al., 2010).
20
A promising avenue of clinical research in melanoma is the use of immune
checkpoint inhibitors. By blocking inhibitory molecules or, alternatively,
activating stimulatory molecules, these treatments are designed to unleash
or enhance pre-existing anti-cancer immune responses. Several checkpoint
inhibitors, targeting multiple different checkpoints, are currently in
development (Wolchok et al., 2014). T cells self-regulate their activation
through CTLA-4 (Cytotoxic T-Lymphocyte Antigen 4) expression. CTLA-
4 functions as a negative co-stimulatory molecule for the T cell; therefore,
therapies that antagonize CTLA-4 remove the brakes from T cells leading
to a net effect of T cell hyper-responsiveness (Melero et al., 2007). Several
human monoclonal antibodies, i.e. ipilimumab (Yervoy®, MDX-010;
Bristol-Myers Squibb, Medarex, Princeton, NJ), tremelimumab (CP-
675,206; Pfizer Pharmaceuticals, New York), and others. These antibodies
have been demonstrated to induce tumor regression and may prolong time
to disease progression free and are in clinical development.
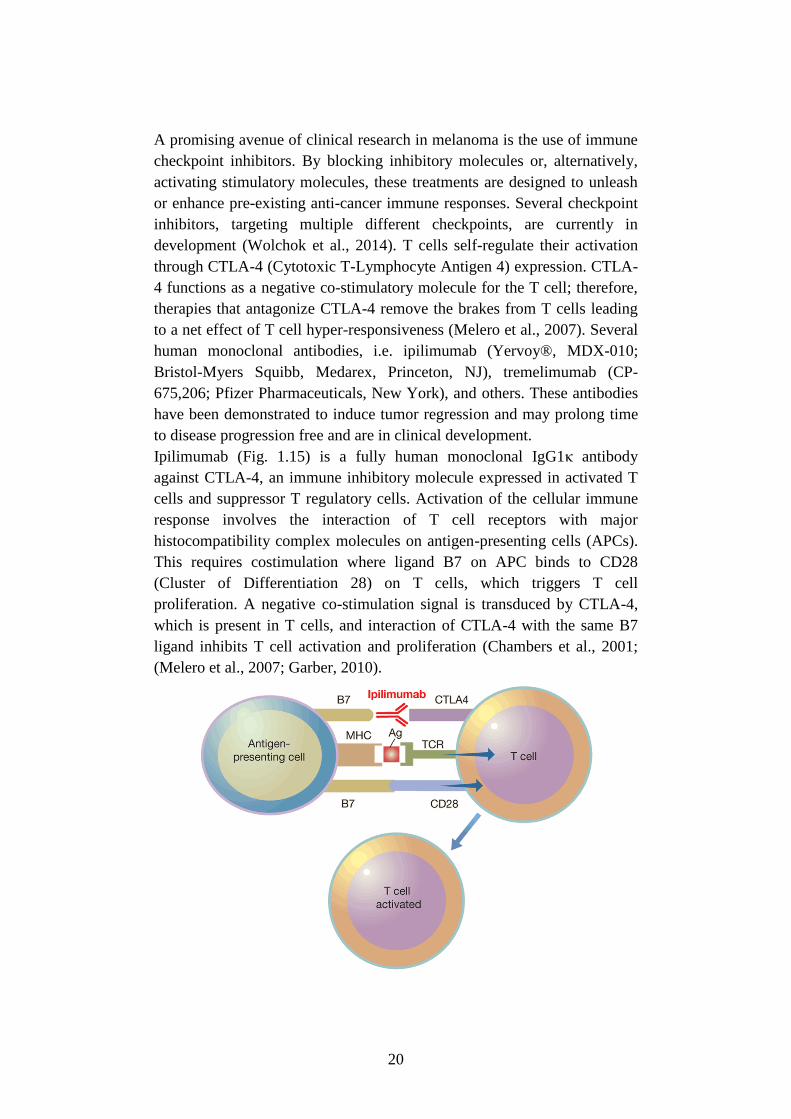
Ipilimumab (Fig. 1.15) is a fully human monoclonal IgG1κ antibody
against CTLA-4, an immune inhibitory molecule expressed in activated T
cells and suppressor T regulatory cells. Activation of the cellular immune
response involves the interaction of T cell receptors with major
histocompatibility complex molecules on antigen-presenting cells (APCs).
This requires costimulation where ligand B7 on APC binds to CD28
(Cluster of Differentiation 28) on T cells, which triggers T cell
proliferation. A negative co-stimulation signal is transduced by CTLA-4,
which is present in T cells, and interaction of CTLA-4 with the same B7
ligand inhibits T cell activation and proliferation (Chambers et al., 2001;
(Melero et al., 2007; Garber, 2010).
21
Figure 1.15 Ipilimumab stimulates antitumor immunity by blocking CTLA4,
a natural brake on T cells, and allowing their unimpeded 'costimulation' (Garber,
2010).
Ipilimumab was approved by the FDA in February 2011 (Fig. 1.14) and by
the European Medicines Agency in July 2011 for use in the treatment of
advanced malignant melanoma in patients not responding to chemotherapy,
with or without previous exposure to immunotherapy (Hanaizi et al., 2012);
moreover,multiple clinical trials using this drug for the treatment of other
malignancies are ongoing.
In 2011, the immunotherapy Ipilimumab (Yervoy®) became the first drug
ever shown to extend survival for patients with metastatic melanoma.
Results from a large, phase III trial of Ipilimumab demonstrated that it
reduced the risk of death by 32% and nearly doubled the patients surviving
to 1 and 2 years, with some patients experiencing complete and durable
clinical regressions lasting for years (Wolchok, 2014). Ipilimumab induces
a significant increase in the frequency of circulating regulatory T cells
(Tregs) and increase in the induction of tumor infiltrating Tregs at 6 weeks
(Tarhini et al., 2012). Ipilimumab is the first agent that has been
demonstrated to improve overall survival (OS) in patients with metastatic
melanoma, which has a very poor prognosis, in randomized phase III
clinical trials (Graziani et al., 2012).
Tremelimumab is a fully human IgG2 antibody, which is directed against
human CTLA-4, as ipilimumab. Tremelimumab did not produce a
statistically significant advantage in overall survival compared to first-line
standard-of-care chemotherapy in a phase III randomized trial reported in
the Journal of Clinical Oncology in patients with advanced melanoma
(Ribas et al, 2013).
Urelumab is a humanized agonistic monoclonal antibody targeting the
CD137 receptor with potential immunostimulatory and antineoplastic
activities. CD137 is a member of the tumor necrosis factor receptor
(TNFR) family and functions as a costimulatory molecule. Urelumab
specifically binds to and activates CD137-expressing immune cells,
stimulating an immune response, in particular a cytotoxic T cell response
against tumor cells (Molckovsky et al., 2008).
Pembrolizumab is a humanized monoclonal IgG4 antibody directed against
human cell surface receptor PD-1 (programmed death-1 or programmed
cell death-1) with immune-potentiating activity. Upon administration,
pembrolizumab binds to PD-1, an inhibitory signaling receptor expressed
on the surface of activated T cells, and blocks the binding of PD-1 by its
ligands, which results in the activation of T-cell-mediated immune
responses against tumor cells (Fig. 1.16). The ligands for PD-1 include PD-
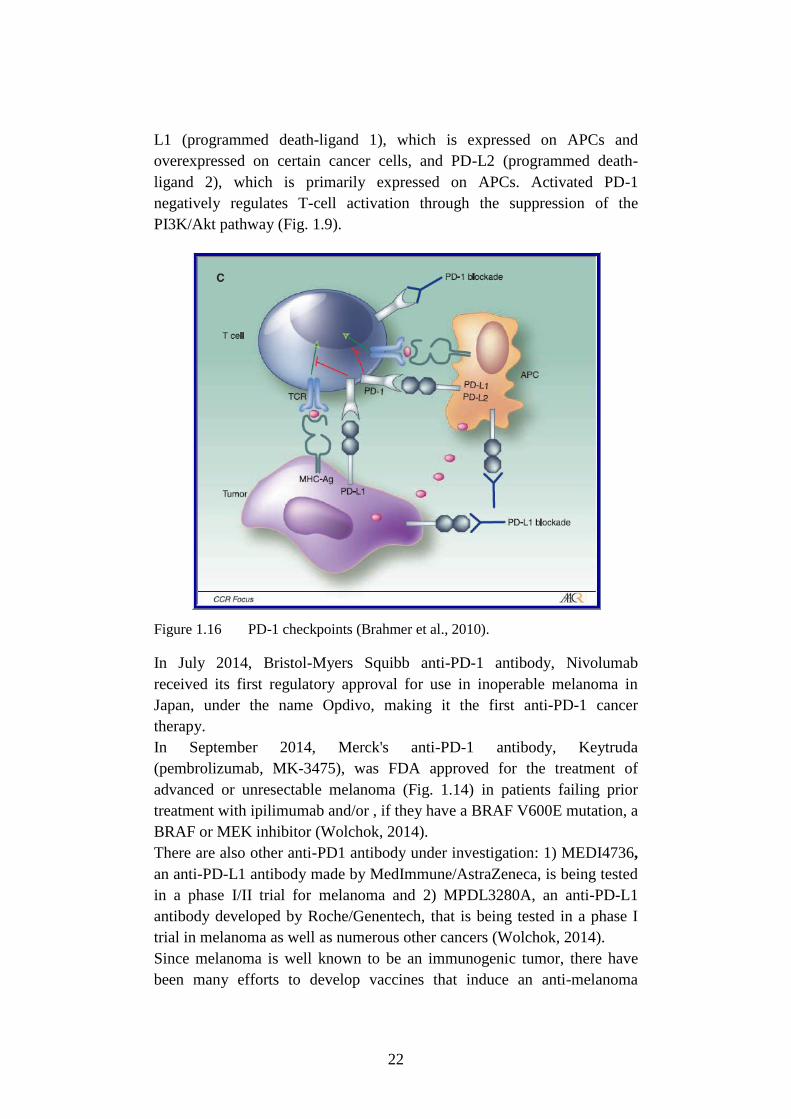
22
L1 (programmed death-ligand 1), which is expressed on APCs and
overexpressed on certain cancer cells, and PD-L2 (programmed death-
ligand 2), which is primarily expressed on APCs. Activated PD-1
negatively regulates T-cell activation through the suppression of the
PI3K/Akt pathway (Fig. 1.9).
Figure 1.16 PD-1 checkpoints (Brahmer et al., 2010).
In July 2014, Bristol-Myers Squibb anti-PD-1 antibody, Nivolumab
received its first regulatory approval for use in inoperable melanoma in
Japan, under the name Opdivo, making it the first anti-PD-1 cancer
therapy.
In September 2014, Merck's anti-PD-1 antibody, Keytruda
(pembrolizumab, MK-3475), was FDA approved for the treatment of
advanced or unresectable melanoma (Fig. 1.14) in patients failing prior
treatment with ipilimumab and/or , if they have a BRAF V600E mutation, a
BRAF or MEK inhibitor (Wolchok, 2014).
There are also other anti-PD1 antibody under investigation: 1) MEDI4736,
an anti-PD-L1 antibody made by MedImmune/AstraZeneca, is being tested
in a phase I/II trial for melanoma and 2) MPDL3280A, an anti-PD-L1
antibody developed by Roche/Genentech, that is being tested in a phase I
trial in melanoma as well as numerous other cancers (Wolchok, 2014).
Since melanoma is well known to be an immunogenic tumor, there have
been many efforts to develop vaccines that induce an anti-melanoma
23
response (Ozao-Choy et al., 2014). Vaccine strategies are highly varied and
options vary from the simplest peptide vaccines to the most complex
autologous whole-tumor cells.
After several decades of failed attempts at developing potent therapeutic
cancer vaccines, the first was approved in prostate cancer by FDA in 2010
Sipuleucel-T (Provenge, Dendreon Corporation). A trial of gp100:209-
217(210M) peptide vaccination in melanoma showed a response rate
higher and progression-free survival longer with vaccine and IL-2 than
with IL-2 alone. Nevertheless, additional work is required to optimize
vaccine strategies using peptides (Schwartzentruber et al., 2011).
1.6.3 Targeted Therapy
The main characteristics of targeted antineoplastic treatment is that the
drugs act specifically on their intended target which have specific effects
on the tumor (Martí et al., 2012). The number of possible therapeutic
targets in melanoma is increasing with an improvement in our
understanding of the biology of melanoma.
c-KIT inhibitors
c-KIT(tyrosine-protein kinase or CD117) is a growth factor receptor in
epidermal melanocytes and has an essential role in the differentiation and
migration of melanocytic cells during embryonic development. The ligand
for KIT (tyrosine-protein kinase) is stem cell factor (SCF) and binding of
SCF to c-KIT induces the activation of downstream signaling pathways
that mediate growth and survival signals within the cell, including the
PI3K-Akt-mTOR (Fig. 1.9) and Ras-Raf-MEK-ERK (Fig. 1.8) pathways.
C-KIT is mutated in approximately 20% of sun-induced skin damage. For
these reasons, c-KIT has been considered a potential therapeutic target in
melanoma and two c-KIT inhibitors, i.e., imatinib (Gleevec, Novartis
Pharmaceuticals Corporation) and dasatinib (Bristol-Myers Squibb), are
under evaluation for treating melanoma. Imatinib (Gleevec) have shown
promise in improving clinical outcomes in patients with advanced
melanoma (Miller et al., 2014).
Braf/ERK inhibitors
One of the most common signaling pathways affected by mutations in
melanoma is the Braf/ERK pathway (paragraph 1.4.3 of the present
manuscript) (Fig. 1.8). The V600E mutation, which comprises nearly 90%
of the observed mutations in Braf obviates the need for activation by Ras
and results in constitutive activation and unregulated phosphorylation of
downstream effectors such as MEK (Cantwell-Dorris et al., 2011). As
24
shown in Table 1.3, six BRAF inhibitors are under evaluation for
melanoma.
Table 1.3 Clinical trials of Braf/MEK inhibitors for treating melanoma
(Tseng et al, 2013).
Vemurafenib was launched in 2011 in the US after FDA approval for
BRAF V600E mutation positive unresectable or metastatic melanoma and
in the UK after EMA (European Medicine Agency) approval in 2012 (Fig.
1.14).
In a phase III randomized controlled trial of patients with metastatic
melanoma and BRAF mutation, vemurafenib significantly reduced the
risks of death and disease progression by 63% and 74%, respectively,
compared with dacarbazine (Fig. 1.17). The response rate in patients who
received vemurafenib was 48.4%, which was almost 9 times higher than
that in patients who received chemotherapy (5.5%). Furthermore, 84% of
the patients who received vemurafenib were alive after 6 months compared
with 64% who received chemotherapy: the median over survival with
vemurafenib (10.5 months) was longer than that with dacarbazine
(Chapman et al., 2011).
Figure 1.17 Progression-free survival from a trial comparing vemurafenib
25
with dacarbazine in patients with BRAFV600E-mutated melanoma (Chapman et
al.,2011).
Despite this initial success, numerous challenges remain with selective Braf
inibithors. For example, only half of melanomas possess activating
mutations in BRAF gene. In addition, the duration of response to Braf-
inhibitor is relatively short secondary to acquired and adaptive resistance.
Lastly, selective Braf inhibition has been associated with rare, but serious,
adverse effects such as the rise of secondary malignancies (Sullivan et al.,
2013).
Trametinib specifically binds to and inhibits MEK 1 and 2, resulting in an
inhibition of growth factor-mediated cell signaling and cellular
proliferation. Trametinib was found to improve progression free survival
compared to dacarbazine (4.8 months vs 1.5 months) in a phase III trial
suggesting that MEK could be a valid therapeutic target in BRAF-mutant
melanoma. There were no reports of cutaneous squamous cell carcinoma or
hyperproliferative skin lesions, such as those seen with the Braf inhibitors.
Based on the clinical benefit of the MEK-inhibitor, the FDA (Fig. 1.14)
approved trametinib (Mekinist) in May of 2013 (Miller et al., 2014).
The resistance to Braf-inhibitors is associated with reactivation of the
MAPK pathway; so future strategies will include rationally designed, triple
and quadruple therapeutic regimens targeting complementary oncogenic
pathways. Additional targets include PI3K, mTOR, MDM2, BCL-2, PDGF
(platelet-derived growth factor), HSP90 (Heat-shock protein 90), IGF
(insulin-like growth factor), MITF (microphthalmia-associated
transcription factor), Notch and several other cyclin-dependent kinases
(Miller et al., 2014).
26
Chapter 2
Experimental Section: Theranostic
properties of a survivin-directed
molecular beacon in human
melanoma cells
2.1 Introduction
Survivin is a member of the inhibitor of apoptosis family (Ambrosini et
al., 1997) that plays a key role in the regulation of cell division, apoptosis,
cell migration and metastasis (Altieri, 2008; Groner et al., 2014; Mita et al.,
2008). Furthermore, survivin is involved in the promotion of angiogenesis
and chemoresistance (Mita et al., 2008). Unlike other anti-apoptotic
proteins, survivin is undetectable in most terminally differentiated normal
tissues, while it is overexpressed in human cancer (Altieri, 2001). For
instance, survivin is highly overexpressed in malignant melanoma cells
compared with normal melanocytic nevi and normal differentiated skin
tissues (Grossman et al., 1999). Furthermore, a retrospective analysis
performed in melanoma patients has revealed that survivin up-regulation is
correlated with decreased survival rate, increased relapse, and
chemoresistance occurrence (Hartman et al., 2013; Takeuchi et al., 2005;
Chen et al., 2009). These features make survivin a promising target against
which novel anti-cancer drugs could be developed.
Pharmacological modulation of survivin was tagged with its evolving
functional complexity associated with various cell-signaling cascades
including PI3K/AKT, mTOR, ERK, MAPK, signal transducer and
activator of transcription (STAT), hypoxia-inducible factor-1α, HSP90,
p53, Bcl2, epidermal growth factor receptor (EGFR), VEGF etc (Kanwar et
al., 2013). It is widely recognised that therapeutic strategies targeting
surviving or surviving expression (e.g., antisense oligonucleotides and
short interfering RNA, siRNA) can induce tumor cell death, circumvent
drug resistance and sensitize cancer cells to chemotherapeutic drugs (Mita
et al., 2008).
More recently, much attention has been directed to molecular beacons
(MBs) as potential theranostic agents (Wang et al., 2013). MBs are stem-
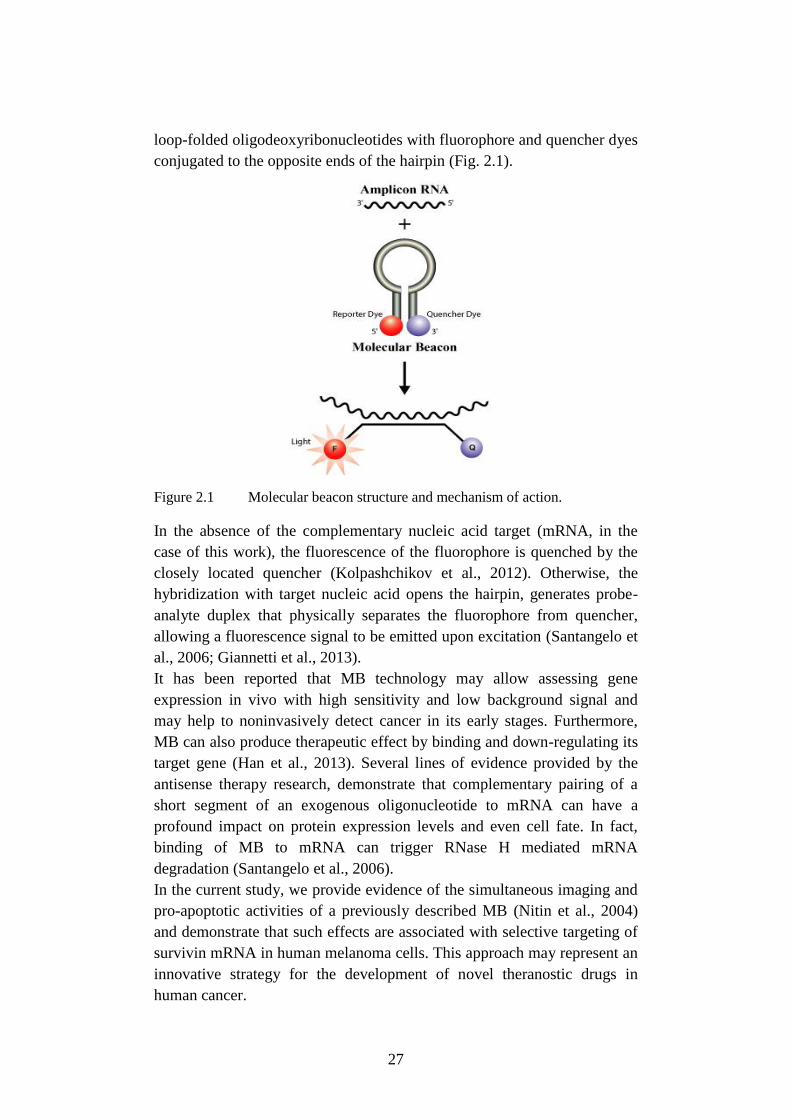
27
loop-folded oligodeoxyribonucleotides with fluorophore and quencher dyes
conjugated to the opposite ends of the hairpin (Fig. 2.1).
Figure 2.1 Molecular beacon structure and mechanism of action.
In the absence of the complementary nucleic acid target (mRNA, in the
case of this work), the fluorescence of the fluorophore is quenched by the
closely located quencher (Kolpashchikov et al., 2012). Otherwise, the
hybridization with target nucleic acid opens the hairpin, generates probe-
analyte duplex that physically separates the fluorophore from quencher,
allowing a fluorescence signal to be emitted upon excitation (Santangelo et
al., 2006; Giannetti et al., 2013).
It has been reported that MB technology may allow assessing gene
expression in vivo with high sensitivity and low background signal and
may help to noninvasively detect cancer in its early stages. Furthermore,
MB can also produce therapeutic effect by binding and down-regulating its
target gene (Han et al., 2013). Several lines of evidence provided by the
antisense therapy research, demonstrate that complementary pairing of a
short segment of an exogenous oligonucleotide to mRNA can have a
profound impact on protein expression levels and even cell fate. In fact,
binding of MB to mRNA can trigger RNase H mediated mRNA
degradation (Santangelo et al., 2006).
In the current study, we provide evidence of the simultaneous imaging and
pro-apoptotic activities of a previously described MB (Nitin et al., 2004)
and demonstrate that such effects are associated with selective targeting of
survivin mRNA in human melanoma cells. This approach may represent an
innovative strategy for the development of novel theranostic drugs in
human cancer.
28
2.2 Materials and Methods
2.2.1 Cell cultures
The human malignant melanoma A375 cell line (American Type Culture
Collection, Rockville, MD, USA) was cultured at 37°C in a humidified
atmosphere containing 5% CO2 in DMEM (Dulbecco's modified Eagle's
medium) supplemented with l-glutamine (2 mM), 10% heat-inactivated
fetal bovine serum (FBS) and 1% (w/v) penicillin/streptomycin (Sigma-
Aldrich, Milan, Italy). The human metastatic melanoma 501 Mel cell line
was a kind gift from Dr. Poliseno (Oncogenomics Unit, Core Research
Laboratory, Istituto Toscano Tumori c/o IFC-CNR, Pisa, Italy). 501 Mel
cells were cultured in the same condition of A375 with glucose
supplement. Human bronchial smooth muscle cells (BSMC; Lonza,
Walkersville, MD, USA) were maintained exactly as recommended by the
manufacturer in an optimized medium containing 5% fetal bovine serum,
5.5 mM glucose, 50 μg/ml gentamicin, 50 ng/ml amphotericin-B, 5 ng/ml
insulin, 2 ng/ml basic fibroblast growth factor and 0.5 ng/ml epidermal
growth factor (SmGM-2 Bullet Kit, Lonza). Human melanocytes
(PromoCell GmbH, Germany) were cultured at 37°C in a humidified
atmosphere containing 5% CO2 in Melanocyte Growth Medium M2
(PromoCell GmbH, Germany). Human monocytes were a kind gift from
Dr. Celi (Department of Surgery, Medical, Molecular, and Critical Area
Pathology). Monocyte isolation was performed as described previously
(Neri et al., 2012). The procedure was approved by the local ethics
committee at the University of Pisa and was in accordance with the
Declaration of Helsinki. A signed consent was obtained from all donors.
2.2.2 Drugs
Docetaxel (DTX) and Cisplatin (CisPt) were purchased from Sigma–
Aldrich, Milan, Italy. DTX was dissolved in dimethyl sulfoxide (DMSO)
and diluted with culture medium (DMSO final concentration of 0.0001%,
v/v), while CisPt was dissolved in water.
2.2.3 Transfection
Cells were transfected with 100 nM antisense oligodeoxynucleotides using
Lipofectamine 2000 (Ref. 11668-027, Invitrogen Life Technologies,
Carlsbad, CA, USA), which has been reported to yield high transfection
efficiency (≈70%) in A375 cells (Zhou et al., 2013). A molecular beacon
(MB), which targets nucleotides 149–163 of survivin mRNA, and the other
oligodeoxynucleotides were synthesized by IBA (Göttingen, Germany)
(Nitin et al., 2004). ATTO647N (λabs 644 nm, λem 669 nm) and Blackberry
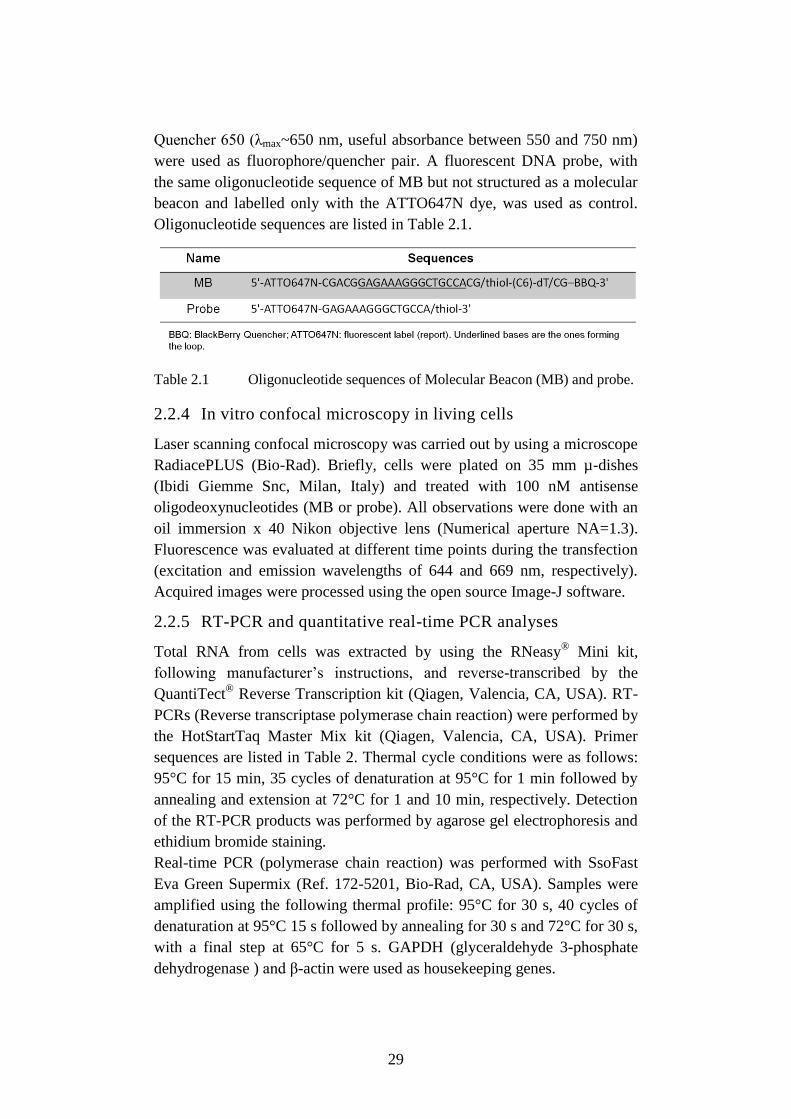
29
Quencher 650 (λmax~650 nm, useful absorbance between 550 and 750 nm)
were used as fluorophore/quencher pair. A fluorescent DNA probe, with
the same oligonucleotide sequence of MB but not structured as a molecular
beacon and labelled only with the ATTO647N dye, was used as control.
Oligonucleotide sequences are listed in Table 2.1.
Table 2.1 Oligonucleotide sequences of Molecular Beacon (MB) and probe.
2.2.4 In vitro confocal microscopy in living cells
Laser scanning confocal microscopy was carried out by using a microscope
RadiacePLUS (Bio-Rad). Briefly, cells were plated on 35 mm µ-dishes
(Ibidi Giemme Snc, Milan, Italy) and treated with 100 nM antisense
oligodeoxynucleotides (MB or probe). All observations were done with an
oil immersion x 40 Nikon objective lens (Numerical aperture NA=1.3).
Fluorescence was evaluated at different time points during the transfection
(excitation and emission wavelengths of 644 and 669 nm, respectively).
Acquired images were processed using the open source Image-J software.
2.2.5 RT-PCR and quantitative real-time PCR analyses
Total RNA from cells was extracted by using the RNeasy®
Mini kit,
following manufacturer’s instructions, and reverse-transcribed by the
QuantiTect® Reverse Transcription kit (Qiagen, Valencia, CA, USA). RT-
PCRs (Reverse transcriptase polymerase chain reaction) were performed by
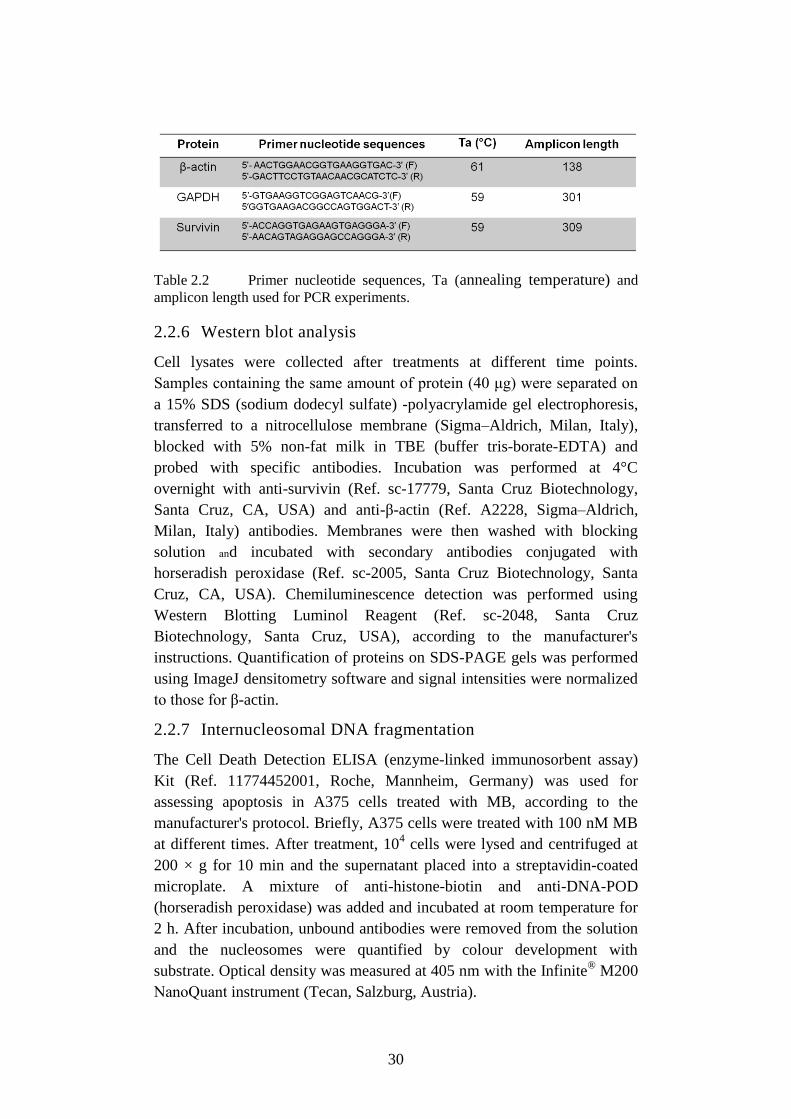
the HotStartTaq Master Mix kit (Qiagen, Valencia, CA, USA). Primer
sequences are listed in Table 2. Thermal cycle conditions were as follows:
95°C for 15 min, 35 cycles of denaturation at 95°C for 1 min followed by
annealing and extension at 72°C for 1 and 10 min, respectively. Detection
of the RT-PCR products was performed by agarose gel electrophoresis and
ethidium bromide staining.
Real-time PCR (polymerase chain reaction) was performed with SsoFast
Eva Green Supermix (Ref. 172-5201, Bio-Rad, CA, USA). Samples were
amplified using the following thermal profile: 95°C for 30 s, 40 cycles of
denaturation at 95°C 15 s followed by annealing for 30 s and 72°C for 30 s,
with a final step at 65°C for 5 s. GAPDH (glyceraldehyde 3-phosphate
dehydrogenase ) and β-actin were used as housekeeping genes.
30
Table 2.2 Primer nucleotide sequences, Ta (annealing temperature) and
amplicon length used for PCR experiments.
2.2.6 Western blot analysis
Cell lysates were collected after treatments at different time points.
Samples containing the same amount of protein (40 μg) were separated on
a 15% SDS (sodium dodecyl sulfate) -polyacrylamide gel electrophoresis,
transferred to a nitrocellulose membrane (Sigma–Aldrich, Milan, Italy),
blocked with 5% non-fat milk in TBE (buffer tris-borate-EDTA) and
probed with specific antibodies. Incubation was performed at 4°C
overnight with anti-survivin (Ref. sc-17779, Santa Cruz Biotechnology,
Santa Cruz, CA, USA) and anti-β-actin (Ref. A2228, Sigma–Aldrich,
Milan, Italy) antibodies. Membranes were then washed with blocking
solution and incubated with secondary antibodies conjugated with
horseradish peroxidase (Ref. sc-2005, Santa Cruz Biotechnology, Santa
Cruz, CA, USA). Chemiluminescence detection was performed using
Western Blotting Luminol Reagent (Ref. sc-2048, Santa Cruz
Biotechnology, Santa Cruz, USA), according to the manufacturer's
instructions. Quantification of proteins on SDS-PAGE gels was performed
using ImageJ densitometry software and signal intensities were normalized
to those for β-actin.
2.2.7 Internucleosomal DNA fragmentation
The Cell Death Detection ELISA (enzyme-linked immunosorbent assay)
Kit (Ref. 11774452001, Roche, Mannheim, Germany) was used for
assessing apoptosis in A375 cells treated with MB, according to the
manufacturer's protocol. Briefly, A375 cells were treated with 100 nM MB
at different times. After treatment, 104 cells were lysed and centrifuged at
200 × g for 10 min and the supernatant placed into a streptavidin-coated
microplate. A mixture of anti-histone-biotin and anti-DNA-POD
(horseradish peroxidase) was added and incubated at room temperature for
2 h. After incubation, unbound antibodies were removed from the solution
and the nucleosomes were quantified by colour development with
substrate. Optical density was measured at 405 nm with the Infinite®
M200
NanoQuant instrument (Tecan, Salzburg, Austria).
31
2.2.8 Mitochondrial membrane potential (ΔΨm)
Changes in mitochondrial membrane potential (ΔΨm) during the early
stages of apoptosis were assayed using the Muse™ MitoPotential assay
(Ref. MCH 100110, Merck Millipore; Darmstadt, Germany) in A375 cells
treated with MB alone or in combination with Cis-Pt or DTX. Briefly, cells
were harvested and the cell pellet was suspended in assay buffer (105
cells/100µl). MitoPotential dye working solution was added and the cell
suspension incubated at 37 °C for 20 min. After the addition of Muse
MitoPotential 7-AAD dye (propidium iodide) and incubation for 5 min,
changes in ΔΨm and in cellular plasma membrane permeabilization were
assessed using the fluorescence intensities of both the dyes analysed by
flow cytometry (MuseTM
Cell Analyzer, Merck Millipore; Darmstadt,
Germany).
2.2.9 Determination of nuclear morphology
Changes in nuclear morphology were assessed after transfection with MB
and in lipofectamine-treated cells for 48 and 72 h. Cells were fixed with
4% paraformaldehyde on 8-well chamber slides. After washing with PBS,
cells were incubated with DAPI (4',6-diamidino-2-phenylindole) 300 nM
(Invitrogen Life Technologies, Carlsbad, CA, USA). Life fluorescence
analysis was realized with Eclipse E600FN Nikon microscope. The
fluorophore DAPI is a fluorescent label for the blue spectral region
(excitation and emission wavelengths of 360 and 460 nm, respectively)
(magnification 40 × WD).
2-2-10 Statistical analysis
All experiments were performed in triplicate and results were analyzed by
GraphPad Prism 5 (GraphPad Software, San Diego, CA, USA). Data were
shown as mean values ± standard error of the mean (SEM) obtained from
at least three independent experiments. Statistical analyses were performed
by Student's t-test or one-way ANOVA followed by the Bonferroni’s
multiple comparison test.
2.3 Results
2.3.1 Survivin mRNA expression in different cell types
RT-PCR experiments followed by densitometry and quantification of
electrophoresis bands clearly demonstrated that survivin was differentially
expressed in human melanoma cells compared to normal cells.
Specifically, survivin mRNA levels were significantly higher in A375 and
501 Mel cells than in BSMC (p<0.001), while human melanocytes and
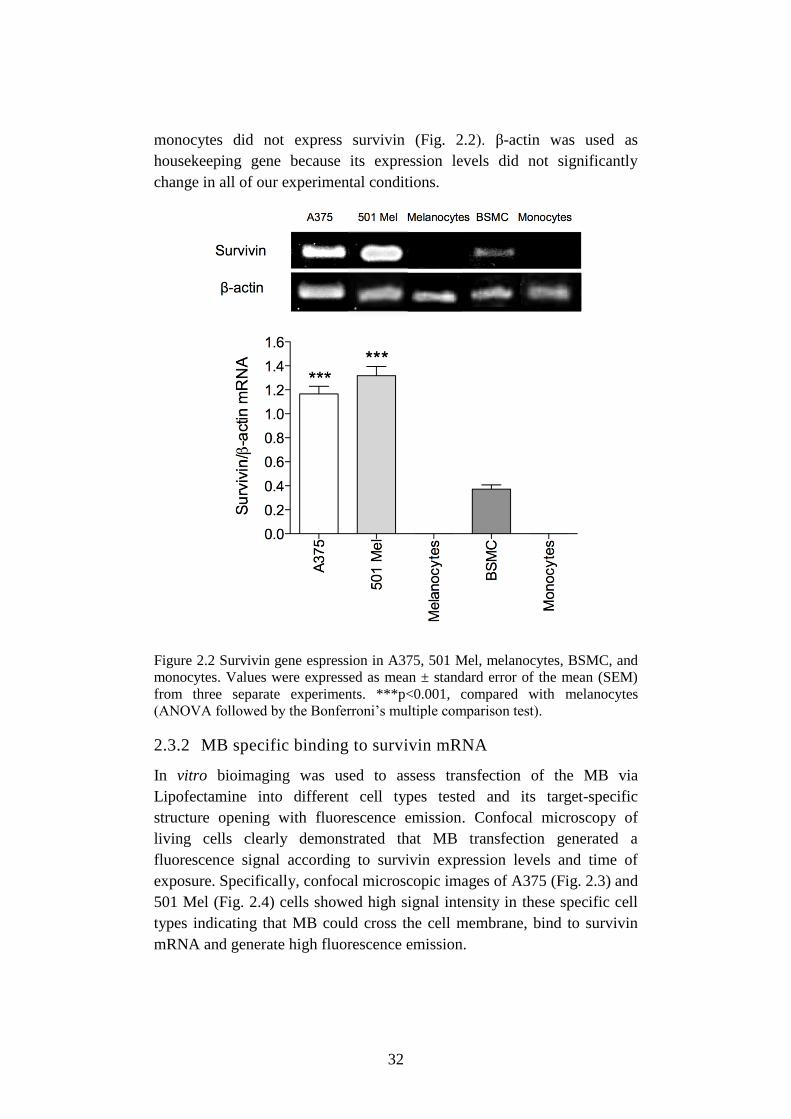
32
monocytes did not express survivin (Fig. 2.2). β-actin was used as
housekeeping gene because its expression levels did not significantly
change in all of our experimental conditions.
Figure 2.2 Survivin gene espression in A375, 501 Mel, melanocytes, BSMC, and
monocytes. Values were expressed as mean ± standard error of the mean (SEM)
from three separate experiments. ***p<0.001, compared with melanocytes
(ANOVA followed by the Bonferroni’s multiple comparison test).
2.3.2 MB specific binding to survivin mRNA
In vitro bioimaging was used to assess transfection of the MB via
Lipofectamine into different cell types tested and its target-specific
structure opening with fluorescence emission. Confocal microscopy of
living cells clearly demonstrated that MB transfection generated a
fluorescence signal according to survivin expression levels and time of
exposure. Specifically, confocal microscopic images of A375 (Fig. 2.3) and
501 Mel (Fig. 2.4) cells showed high signal intensity in these specific cell
types indicating that MB could cross the cell membrane, bind to survivin
mRNA and generate high fluorescence emission.
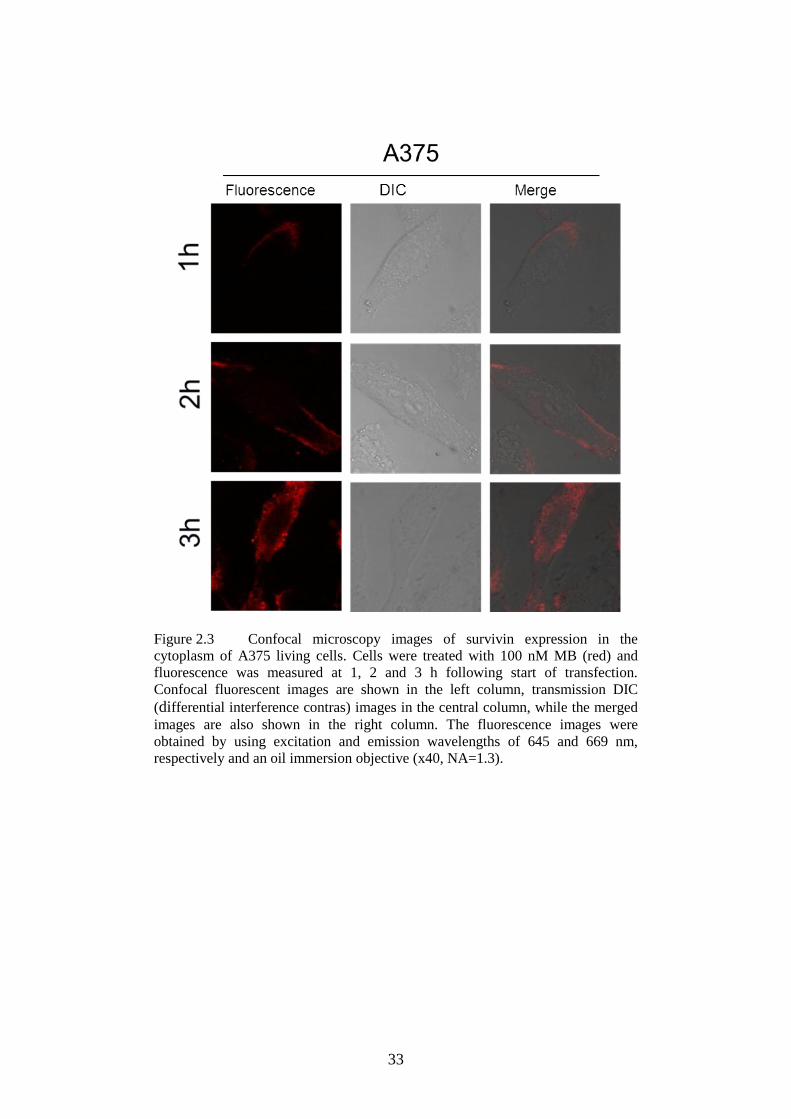
33
Figure 2.3 Confocal microscopy images of survivin expression in the
cytoplasm of A375 living cells. Cells were treated with 100 nM MB (red) and
fluorescence was measured at 1, 2 and 3 h following start of transfection.
Confocal fluorescent images are shown in the left column, transmission DIC
(differential interference contras) images in the central column, while the merged
images are also shown in the right column. The fluorescence images were
obtained by using excitation and emission wavelengths of 645 and 669 nm,
respectively and an oil immersion objective (x40, NA=1.3).
34
Figure 2.4 Confocal microscopy images of survivin expression in the
cytoplasm of 501 Mel living cells. Cells were treated with 100 nM MB (red) and
fluorescence was measured at 1, 2 and 3 h following start of transfection.
Confocal fluorescent images are shown in the left column, transmission DIC
images in the central column, while the merged images are also shown in the right
column. The fluorescence images were obtained by using excitation and emission
wavelengths of 645 and 669 nm, respectively and an oil immersion objective
(x40, NA=1.3).
Otherwise, the fluorescence signal was significantly lower in the case of
BSMC cells (Fig. 2.5), while no fluorescence could be detected in human
melanocytes (Fig. 2.6) and monocytes (Fig. 2.7).
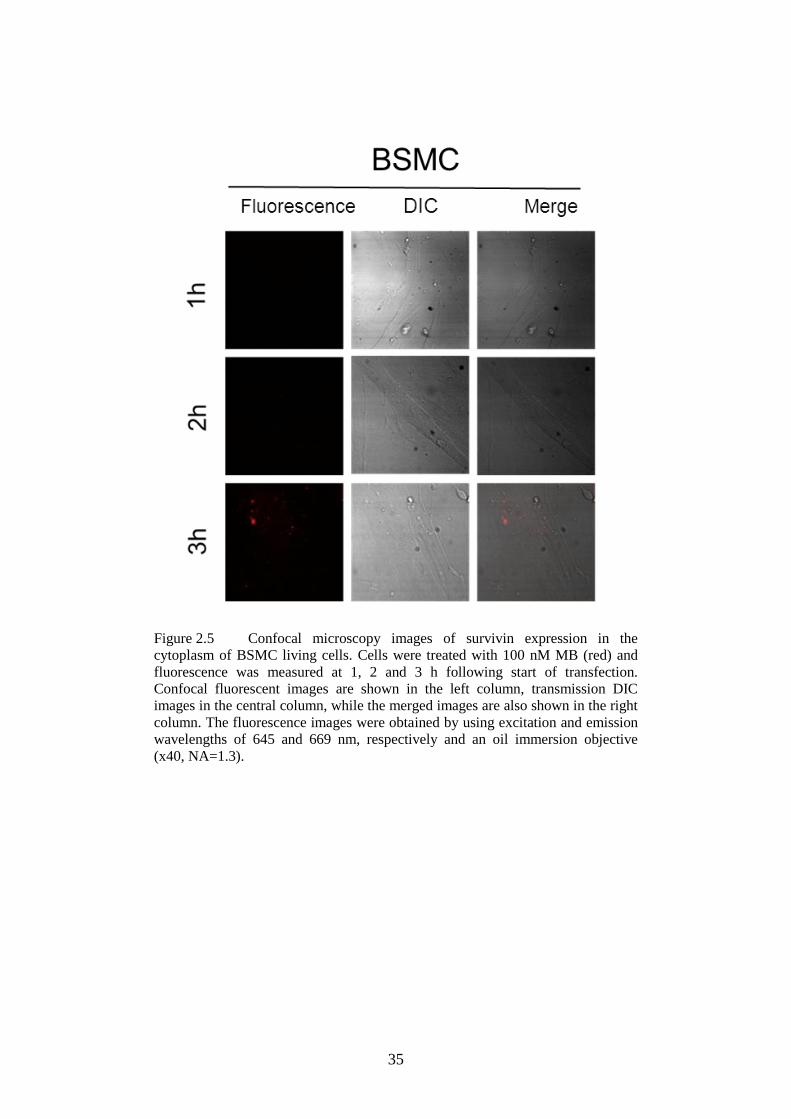
35
Figure 2.5 Confocal microscopy images of survivin expression in the
cytoplasm of BSMC living cells. Cells were treated with 100 nM MB (red) and
fluorescence was measured at 1, 2 and 3 h following start of transfection.
Confocal fluorescent images are shown in the left column, transmission DIC
images in the central column, while the merged images are also shown in the right
column. The fluorescence images were obtained by using excitation and emission
wavelengths of 645 and 669 nm, respectively and an oil immersion objective
(x40, NA=1.3).
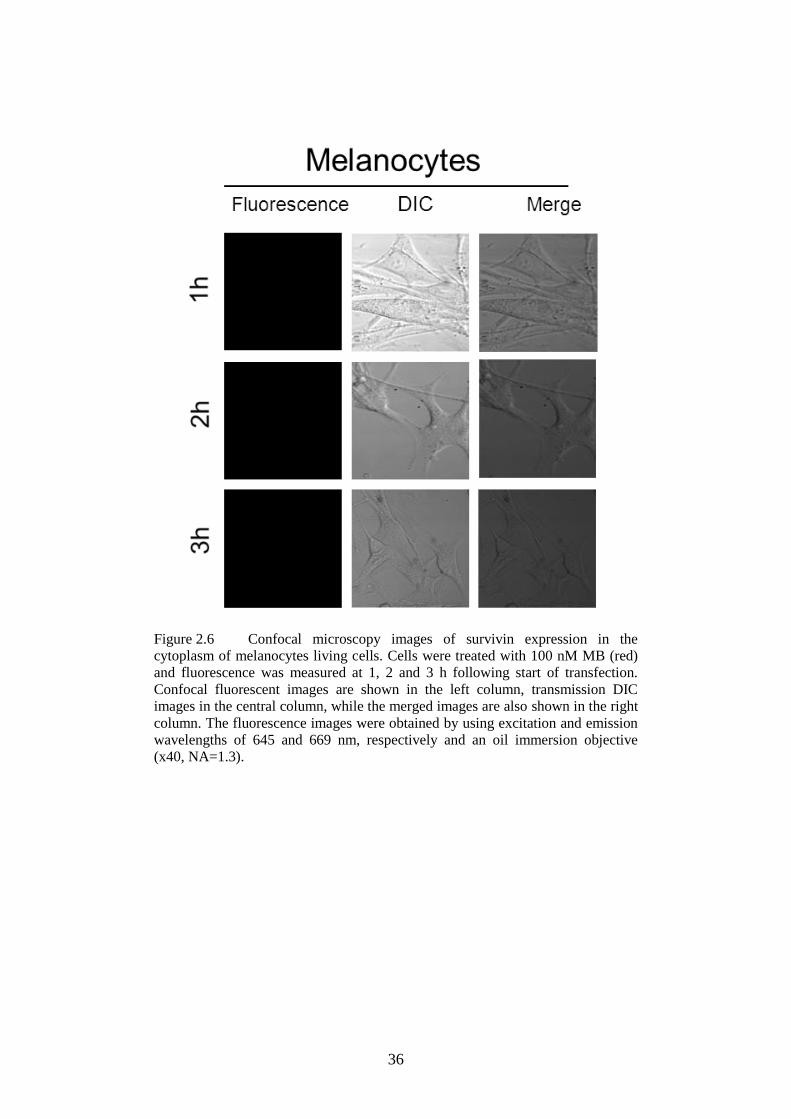
36
Figure 2.6 Confocal microscopy images of survivin expression in the
cytoplasm of melanocytes living cells. Cells were treated with 100 nM MB (red)
and fluorescence was measured at 1, 2 and 3 h following start of transfection.
Confocal fluorescent images are shown in the left column, transmission DIC
images in the central column, while the merged images are also shown in the right
column. The fluorescence images were obtained by using excitation and emission
wavelengths of 645 and 669 nm, respectively and an oil immersion objective
(x40, NA=1.3).
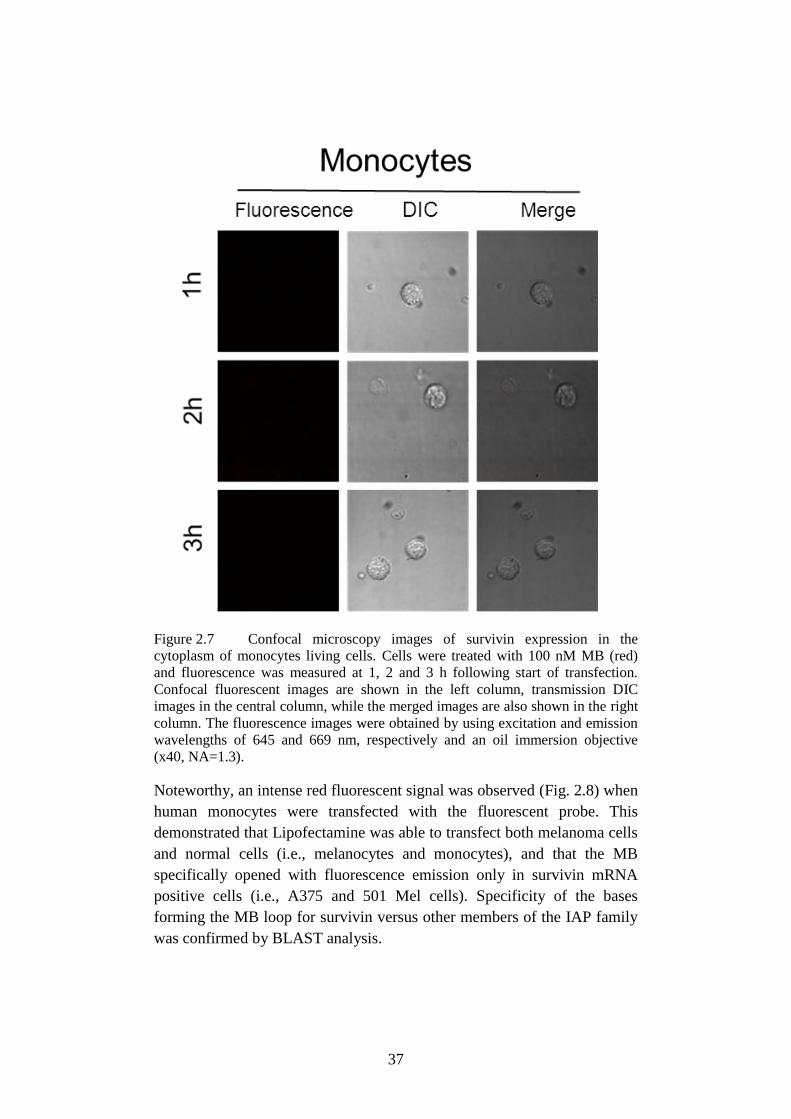
37
Figure 2.7 Confocal microscopy images of survivin expression in the
cytoplasm of monocytes living cells. Cells were treated with 100 nM MB (red)
and fluorescence was measured at 1, 2 and 3 h following start of transfection.
Confocal fluorescent images are shown in the left column, transmission DIC
images in the central column, while the merged images are also shown in the right
column. The fluorescence images were obtained by using excitation and emission
wavelengths of 645 and 669 nm, respectively and an oil immersion objective
(x40, NA=1.3).
Noteworthy, an intense red fluorescent signal was observed (Fig. 2.8) when
human monocytes were transfected with the fluorescent probe. This
demonstrated that Lipofectamine was able to transfect both melanoma cells
and normal cells (i.e., melanocytes and monocytes), and that the MB
specifically opened with fluorescence emission only in survivin mRNA
positive cells (i.e., A375 and 501 Mel cells). Specificity of the bases
forming the MB loop for survivin versus other members of the IAP family
was confirmed by BLAST analysis.
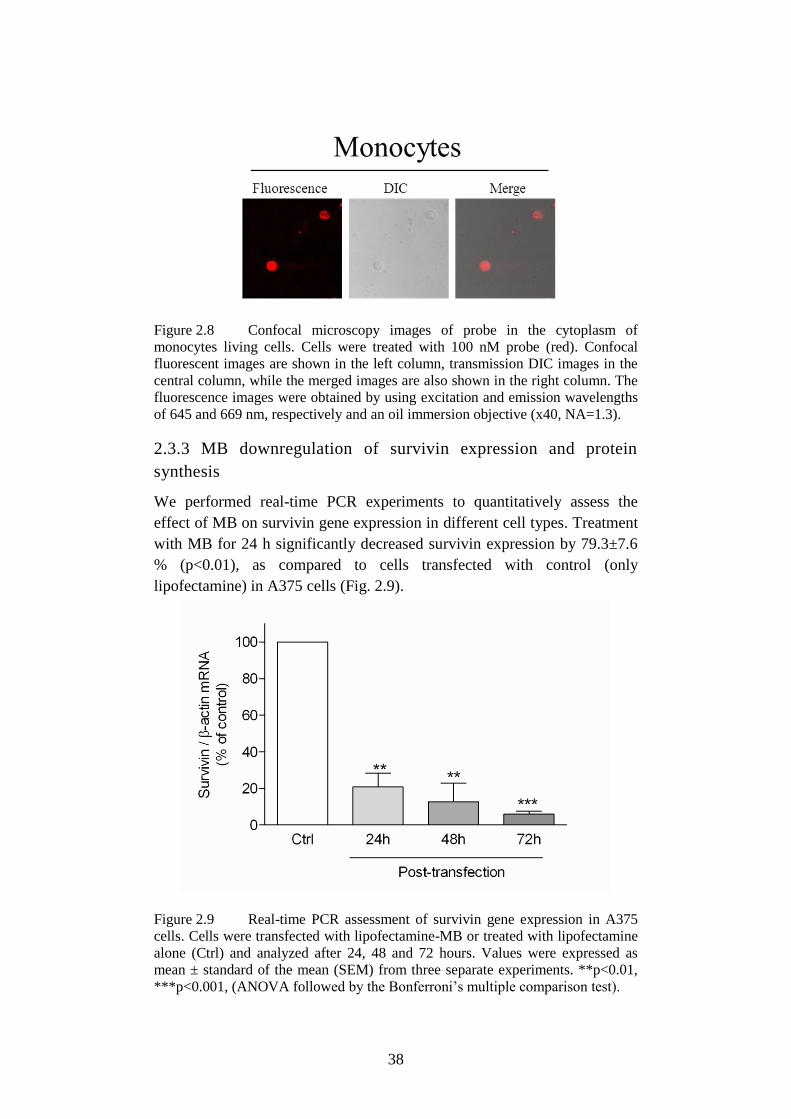
38
Figure 2.8 Confocal microscopy images of probe in the cytoplasm of
monocytes living cells. Cells were treated with 100 nM probe (red). Confocal
fluorescent images are shown in the left column, transmission DIC images in the
central column, while the merged images are also shown in the right column. The
fluorescence images were obtained by using excitation and emission wavelengths
of 645 and 669 nm, respectively and an oil immersion objective (x40, NA=1.3).
2.3.3 MB downregulation of survivin expression and protein
synthesis
We performed real-time PCR experiments to quantitatively assess the
effect of MB on survivin gene expression in different cell types. Treatment
with MB for 24 h significantly decreased survivin expression by 79.3±7.6
% (p<0.01), as compared to cells transfected with control (only
lipofectamine) in A375 cells (Fig. 2.9).
Figure 2.9 Real-time PCR assessment of survivin gene expression in A375
cells. Cells were transfected with lipofectamine-MB or treated with lipofectamine
alone (Ctrl) and analyzed after 24, 48 and 72 hours. Values were expressed as
mean ± standard of the mean (SEM) from three separate experiments. **p<0.01,
***p<0.001, (ANOVA followed by the Bonferroni’s multiple comparison test).
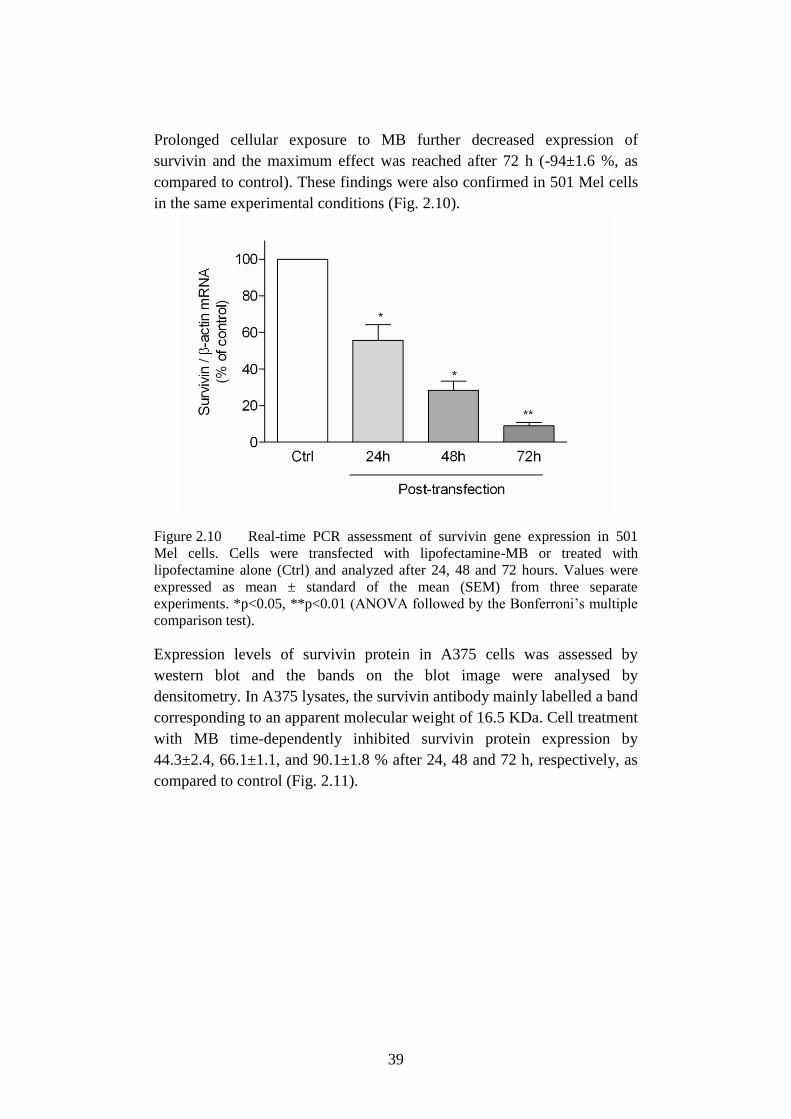
39
Prolonged cellular exposure to MB further decreased expression of
survivin and the maximum effect was reached after 72 h (-94±1.6 %, as
compared to control). These findings were also confirmed in 501 Mel cells
in the same experimental conditions (Fig. 2.10).
Figure 2.10 Real-time PCR assessment of survivin gene expression in 501
Mel cells. Cells were transfected with lipofectamine-MB or treated with
lipofectamine alone (Ctrl) and analyzed after 24, 48 and 72 hours. Values were
expressed as mean ± standard of the mean (SEM) from three separate
experiments. *p<0.05, **p<0.01 (ANOVA followed by the Bonferroni’s multiple
comparison test).
Expression levels of survivin protein in A375 cells was assessed by
western blot and the bands on the blot image were analysed by
densitometry. In A375 lysates, the survivin antibody mainly labelled a band
corresponding to an apparent molecular weight of 16.5 KDa. Cell treatment
with MB time-dependently inhibited survivin protein expression by
44.3±2.4, 66.1±1.1, and 90.1±1.8 % after 24, 48 and 72 h, respectively, as
compared to control (Fig. 2.11).
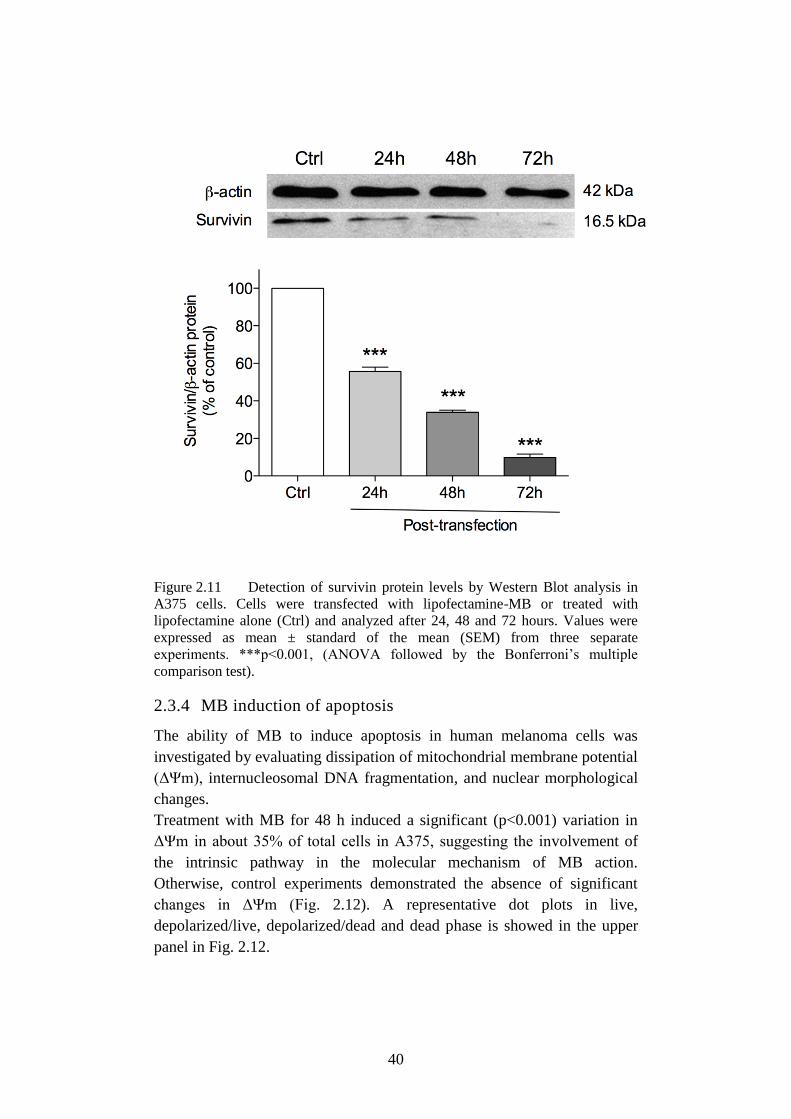
40
Figure 2.11 Detection of survivin protein levels by Western Blot analysis in
A375 cells. Cells were transfected with lipofectamine-MB or treated with
lipofectamine alone (Ctrl) and analyzed after 24, 48 and 72 hours. Values were
expressed as mean ± standard of the mean (SEM) from three separate
experiments. ***p<0.001, (ANOVA followed by the Bonferroni’s multiple
comparison test).
2.3.4 MB induction of apoptosis
The ability of MB to induce apoptosis in human melanoma cells was
investigated by evaluating dissipation of mitochondrial membrane potential
(ΔΨm), internucleosomal DNA fragmentation, and nuclear morphological
changes.
Treatment with MB for 48 h induced a significant (p<0.001) variation in
ΔΨm in about 35% of total cells in A375, suggesting the involvement of
the intrinsic pathway in the molecular mechanism of MB action.
Otherwise, control experiments demonstrated the absence of significant
changes in ΔΨm (Fig. 2.12). A representative dot plots in live,
depolarized/live, depolarized/dead and dead phase is showed in the upper
panel in Fig. 2.12.
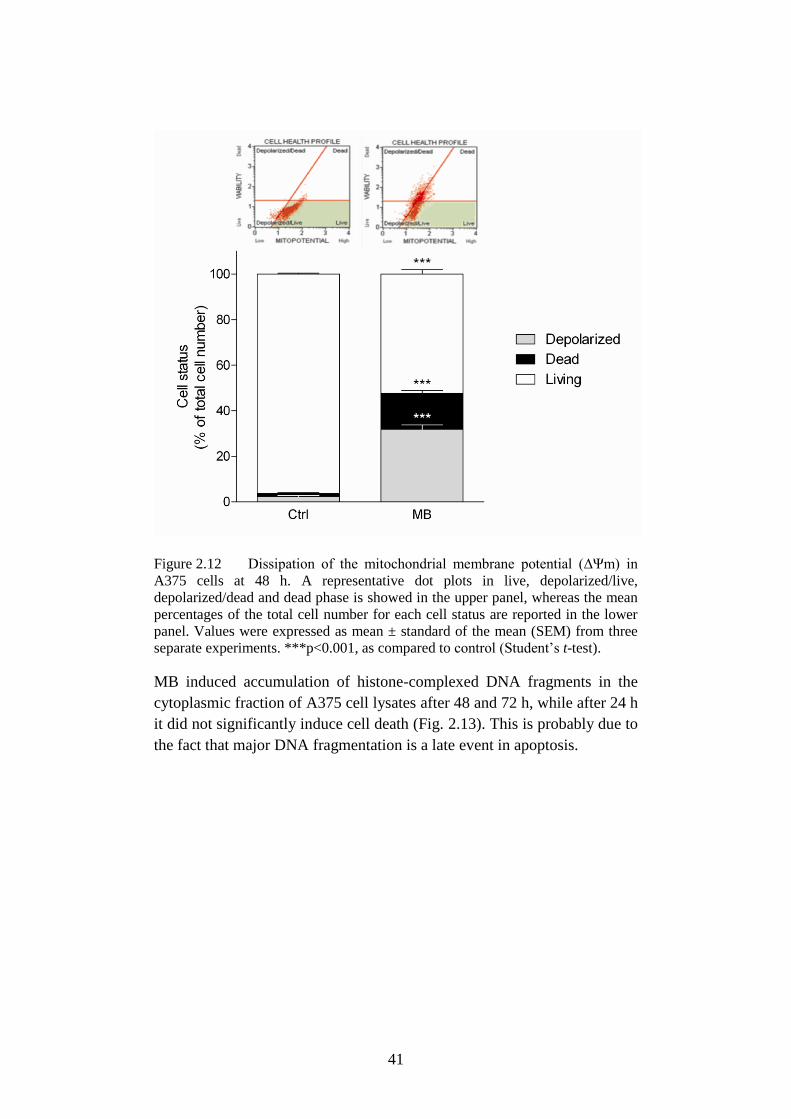
41
Figure 2.12 Dissipation of the mitochondrial membrane potential (ΔΨm) in
A375 cells at 48 h. A representative dot plots in live, depolarized/live,
depolarized/dead and dead phase is showed in the upper panel, whereas the mean
percentages of the total cell number for each cell status are reported in the lower
panel. Values were expressed as mean ± standard of the mean (SEM) from three
separate experiments. ***p<0.001, as compared to control (Student’s t-test).
MB induced accumulation of histone-complexed DNA fragments in the
cytoplasmic fraction of A375 cell lysates after 48 and 72 h, while after 24 h
it did not significantly induce cell death (Fig. 2.13). This is probably due to
the fact that major DNA fragmentation is a late event in apoptosis.
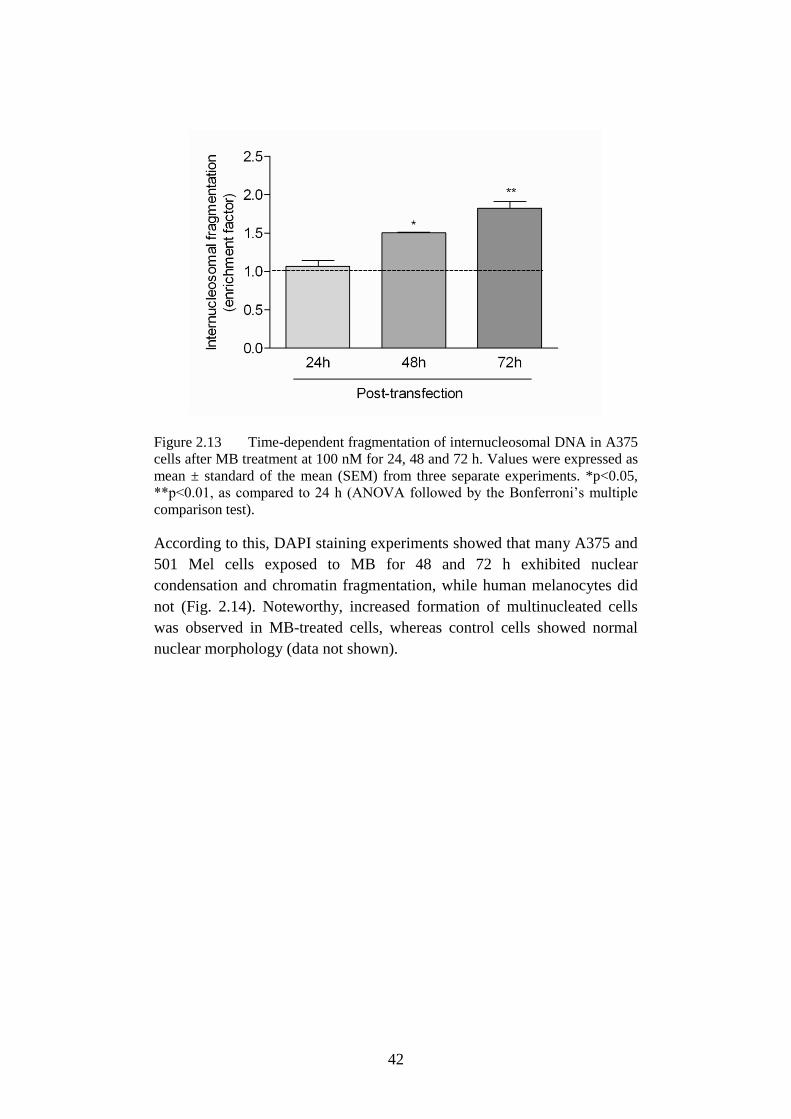
42
Figure 2.13 Time-dependent fragmentation of internucleosomal DNA in A375
cells after MB treatment at 100 nM for 24, 48 and 72 h. Values were expressed as
mean ± standard of the mean (SEM) from three separate experiments. *p<0.05,
**p<0.01, as compared to 24 h (ANOVA followed by the Bonferroni’s multiple
comparison test).
According to this, DAPI staining experiments showed that many A375 and
501 Mel cells exposed to MB for 48 and 72 h exhibited nuclear
condensation and chromatin fragmentation, while human melanocytes did
not (Fig. 2.14). Noteworthy, increased formation of multinucleated cells
was observed in MB-treated cells, whereas control cells showed normal
nuclear morphology (data not shown).
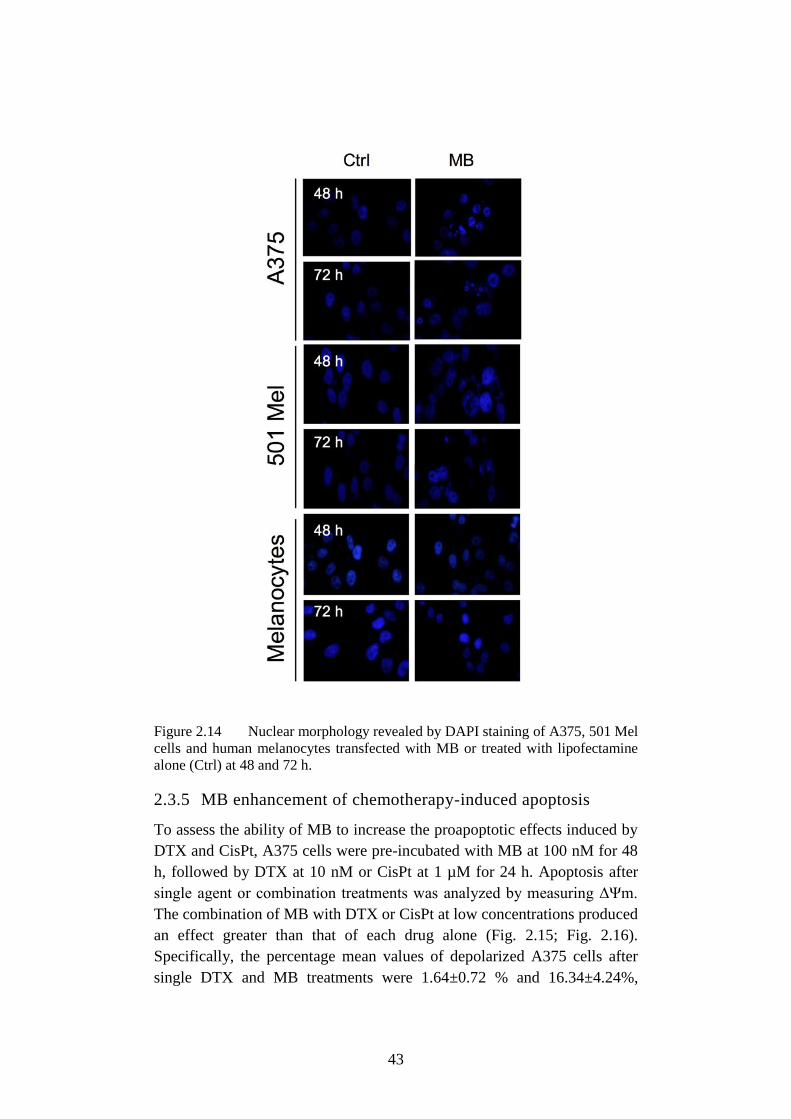
43
Figure 2.14 Nuclear morphology revealed by DAPI staining of A375, 501 Mel
cells and human melanocytes transfected with MB or treated with lipofectamine
alone (Ctrl) at 48 and 72 h.
2.3.5 MB enhancement of chemotherapy-induced apoptosis
To assess the ability of MB to increase the proapoptotic effects induced by
DTX and CisPt, A375 cells were pre-incubated with MB at 100 nM for 48
h, followed by DTX at 10 nM or CisPt at 1 µM for 24 h. Apoptosis after
single agent or combination treatments was analyzed by measuring ΔΨm.
The combination of MB with DTX or CisPt at low concentrations produced
an effect greater than that of each drug alone (Fig. 2.15; Fig. 2.16).
Specifically, the percentage mean values of depolarized A375 cells after
single DTX and MB treatments were 1.64±0.72 % and 16.34±4.24%,
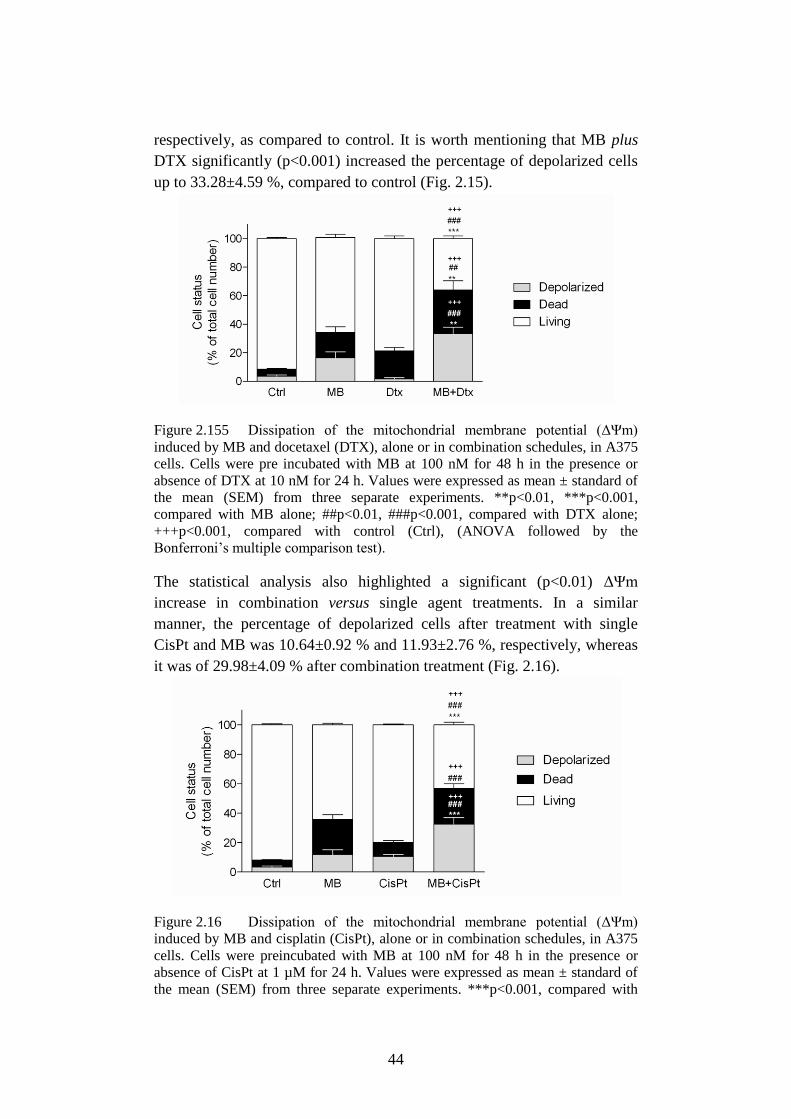
44
respectively, as compared to control. It is worth mentioning that MB plus
DTX significantly (p<0.001) increased the percentage of depolarized cells
up to 33.28±4.59 %, compared to control (Fig. 2.15).
Figure 2.155 Dissipation of the mitochondrial membrane potential (ΔΨm)
induced by MB and docetaxel (DTX), alone or in combination schedules, in A375
cells. Cells were pre incubated with MB at 100 nM for 48 h in the presence or
absence of DTX at 10 nM for 24 h. Values were expressed as mean ± standard of
the mean (SEM) from three separate experiments. **p<0.01, ***p<0.001,
compared with MB alone; ##p<0.01, ###p<0.001, compared with DTX alone;
+++p<0.001, compared with control (Ctrl), (ANOVA followed by the
Bonferroni’s multiple comparison test).
The statistical analysis also highlighted a significant (p<0.01) ΔΨm
increase in combination versus single agent treatments. In a similar
manner, the percentage of depolarized cells after treatment with single
CisPt and MB was 10.64±0.92 % and 11.93±2.76 %, respectively, whereas
it was of 29.98±4.09 % after combination treatment (Fig. 2.16).
Figure 2.16 Dissipation of the mitochondrial membrane potential (ΔΨm)
induced by MB and cisplatin (CisPt), alone or in combination schedules, in A375
cells. Cells were preincubated with MB at 100 nM for 48 h in the presence or
absence of CisPt at 1 µM for 24 h. Values were expressed as mean ± standard of
the mean (SEM) from three separate experiments. ***p<0.001, compared with
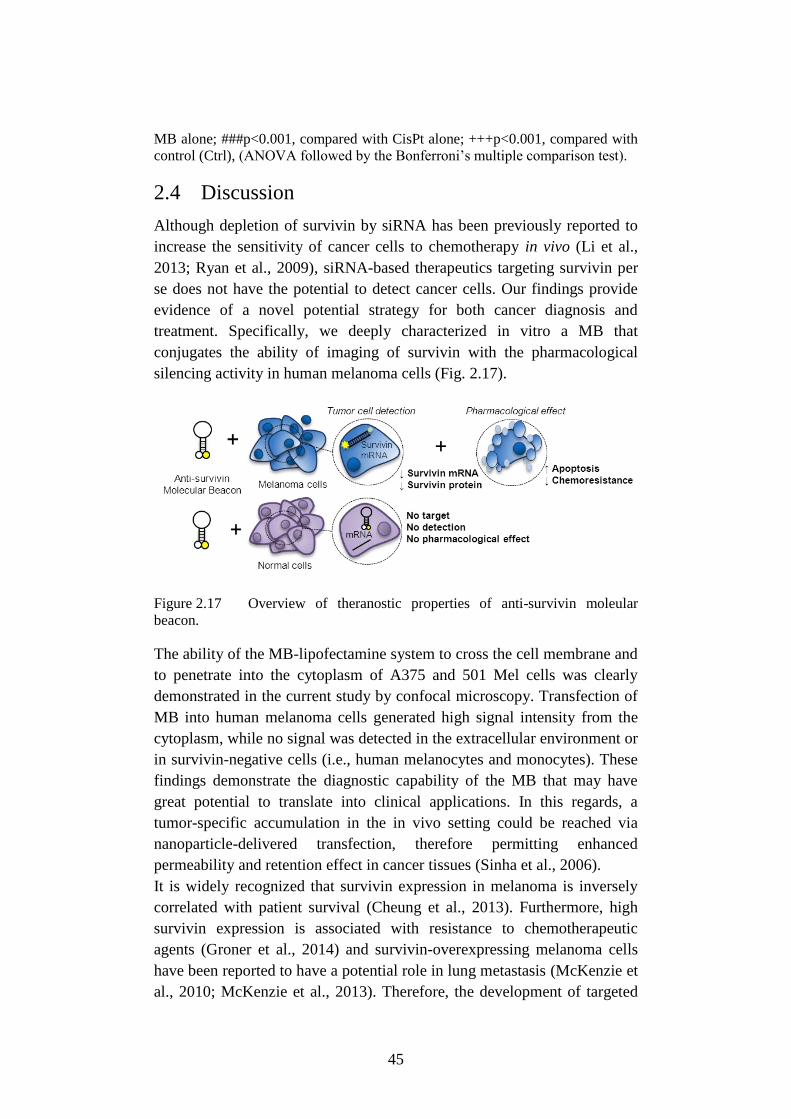
45
MB alone; ###p<0.001, compared with CisPt alone; +++p<0.001, compared with
control (Ctrl), (ANOVA followed by the Bonferroni’s multiple comparison test).
2.4 Discussion
Although depletion of survivin by siRNA has been previously reported to
increase the sensitivity of cancer cells to chemotherapy in vivo (Li et al.,
2013; Ryan et al., 2009), siRNA-based therapeutics targeting survivin per
se does not have the potential to detect cancer cells. Our findings provide
evidence of a novel potential strategy for both cancer diagnosis and
treatment. Specifically, we deeply characterized in vitro a MB that
conjugates the ability of imaging of survivin with the pharmacological
silencing activity in human melanoma cells (Fig. 2.17).
Figure 2.17 Overview of theranostic properties of anti-survivin moleular
beacon.
The ability of the MB-lipofectamine system to cross the cell membrane and
to penetrate into the cytoplasm of A375 and 501 Mel cells was clearly
demonstrated in the current study by confocal microscopy. Transfection of
MB into human melanoma cells generated high signal intensity from the
cytoplasm, while no signal was detected in the extracellular environment or
in survivin-negative cells (i.e., human melanocytes and monocytes). These
findings demonstrate the diagnostic capability of the MB that may have
great potential to translate into clinical applications. In this regards, a
tumor-specific accumulation in the in vivo setting could be reached via
nanoparticle-delivered transfection, therefore permitting enhanced
permeability and retention effect in cancer tissues (Sinha et al., 2006).
It is widely recognized that survivin expression in melanoma is inversely
correlated with patient survival (Cheung et al., 2013). Furthermore, high
survivin expression is associated with resistance to chemotherapeutic
agents (Groner et al., 2014) and survivin-overexpressing melanoma cells
have been reported to have a potential role in lung metastasis (McKenzie et
al., 2010; McKenzie et al., 2013). Therefore, the development of targeted
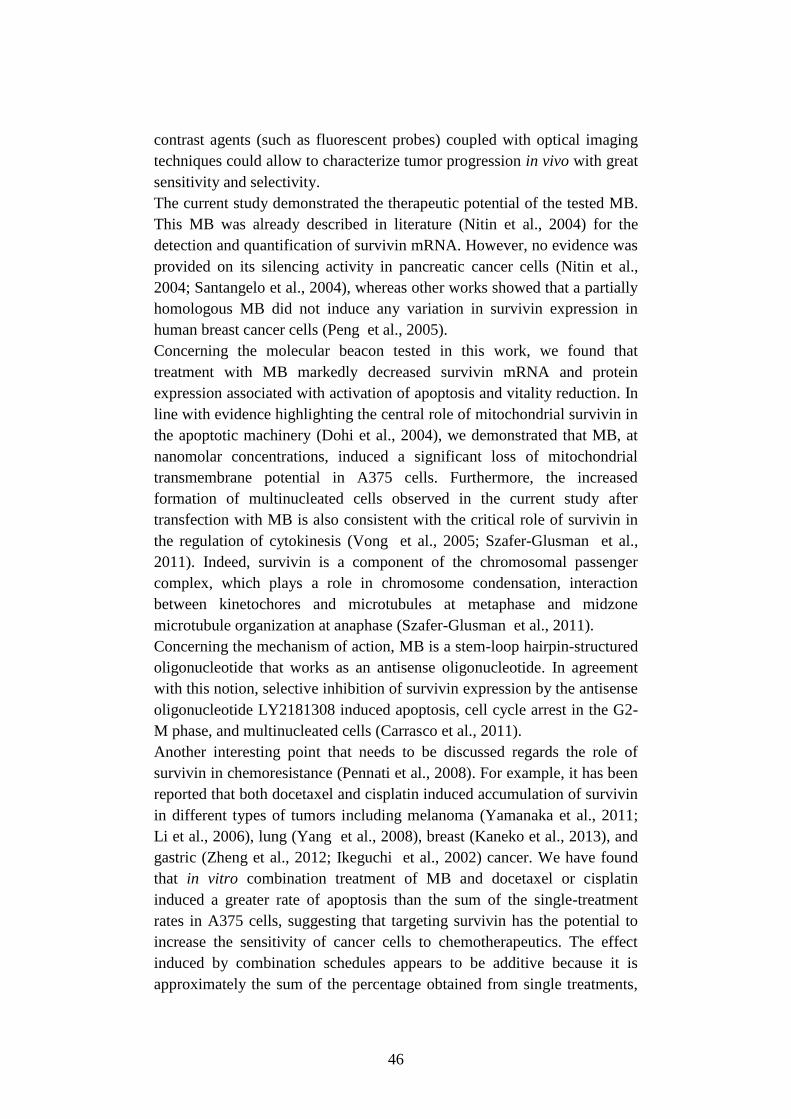
46
contrast agents (such as fluorescent probes) coupled with optical imaging
techniques could allow to characterize tumor progression in vivo with great
sensitivity and selectivity.
The current study demonstrated the therapeutic potential of the tested MB.
This MB was already described in literature (Nitin et al., 2004) for the
detection and quantification of survivin mRNA. However, no evidence was
provided on its silencing activity in pancreatic cancer cells (Nitin et al.,
2004; Santangelo et al., 2004), whereas other works showed that a partially
homologous MB did not induce any variation in survivin expression in
human breast cancer cells (Peng et al., 2005).
Concerning the molecular beacon tested in this work, we found that
treatment with MB markedly decreased survivin mRNA and protein
expression associated with activation of apoptosis and vitality reduction. In
line with evidence highlighting the central role of mitochondrial survivin in
the apoptotic machinery (Dohi et al., 2004), we demonstrated that MB, at
nanomolar concentrations, induced a significant loss of mitochondrial
transmembrane potential in A375 cells. Furthermore, the increased
formation of multinucleated cells observed in the current study after
transfection with MB is also consistent with the critical role of survivin in
the regulation of cytokinesis (Vong et al., 2005; Szafer-Glusman et al.,
2011). Indeed, survivin is a component of the chromosomal passenger
complex, which plays a role in chromosome condensation, interaction
between kinetochores and microtubules at metaphase and midzone
microtubule organization at anaphase (Szafer-Glusman et al., 2011).
Concerning the mechanism of action, MB is a stem-loop hairpin-structured
oligonucleotide that works as an antisense oligonucleotide. In agreement
with this notion, selective inhibition of survivin expression by the antisense
oligonucleotide LY2181308 induced apoptosis, cell cycle arrest in the G2-
M phase, and multinucleated cells (Carrasco et al., 2011).
Another interesting point that needs to be discussed regards the role of
survivin in chemoresistance (Pennati et al., 2008). For example, it has been
reported that both docetaxel and cisplatin induced accumulation of survivin
in different types of tumors including melanoma (Yamanaka et al., 2011;
Li et al., 2006), lung (Yang et al., 2008), breast (Kaneko et al., 2013), and
gastric (Zheng et al., 2012; Ikeguchi et al., 2002) cancer. We have found
that in vitro combination treatment of MB and docetaxel or cisplatin
induced a greater rate of apoptosis than the sum of the single-treatment
rates in A375 cells, suggesting that targeting survivin has the potential to
increase the sensitivity of cancer cells to chemotherapeutics. The effect
induced by combination schedules appears to be additive because it is
approximately the sum of the percentage obtained from single treatments,
47
both in terms of depolarized cells (i.e., cells committed to die) and dead
cells. Moreover, it is also possible that survivin silencing may restore
sensitivity to targeted therapy. In line with this notion, it has been recently
demonstrated that blood survivin mRNA positivity was strongly related to
a poor treatment outcome of EGFR-tyrosine kinase inhibitors in non-small
cell lung cancer patients (Shi et al., 2014).
Although general transfection techniques (including those employing
liposomes or dendrimers) might result in false positive signals, we
demonstrated that cellular lipofection of tested MB was specific with no
false positive results. Indeed, a bright red fluorescent signal was observed
when cells that did not express survivin (i.e., monocytes) were transfected
with the linear probe (the same fluorescent antisense oligonucleotide of
MB lacking the quencher molecule), while no signal was detected after MB
transfection.
Taken together, our findings provide evidence of a novel potential
anticancer strategy for the simultaneous imaging and targeted therapy in
human cutaneous melanoma. The ability to image specific RNAs in vivo
may offer new opportunities in terms of development of clinical diagnostic
procedure for the early detection of cancer, pharmacological monitoring of
silencing effect, and follow-up after surgery or chemotherapy treatment.
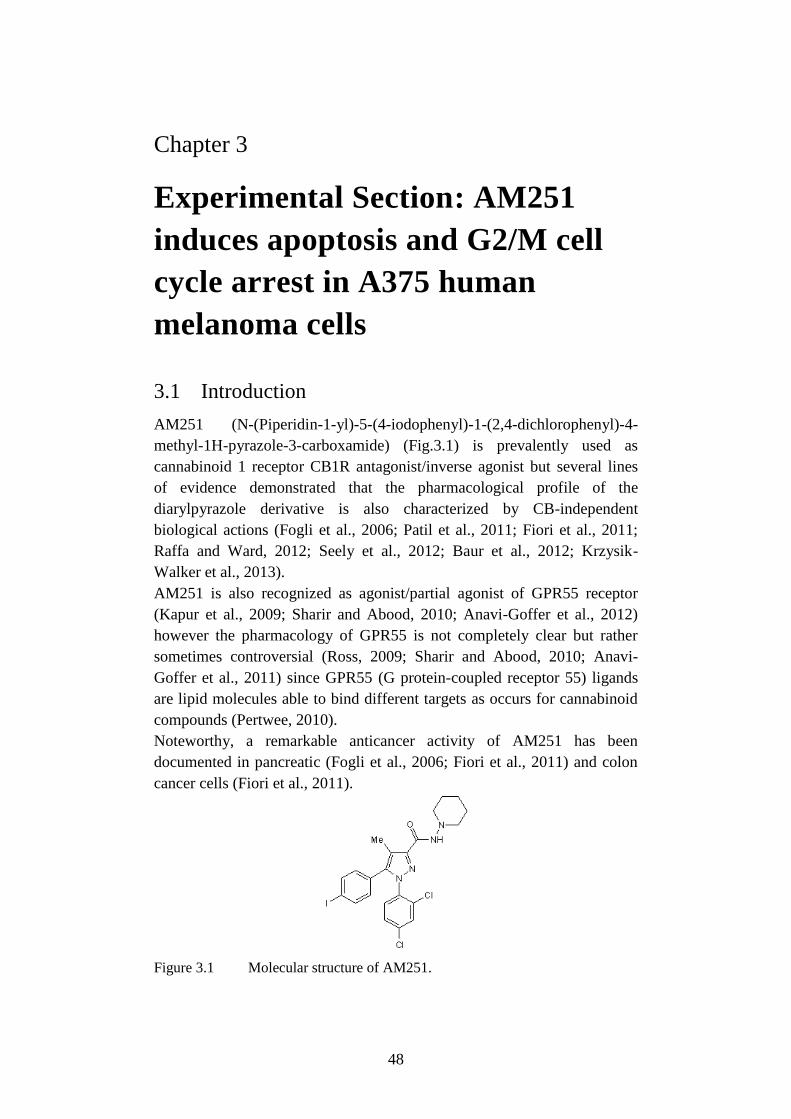
48
Chapter 3
Experimental Section: AM251
induces apoptosis and G2/M cell
cycle arrest in A375 human
melanoma cells
3.1 Introduction
AM251 (N-(Piperidin-1-yl)-5-(4-iodophenyl)-1-(2,4-dichlorophenyl)-4-
methyl-1H-pyrazole-3-carboxamide) (Fig.3.1) is prevalently used as
cannabinoid 1 receptor CB1R antagonist/inverse agonist but several lines
of evidence demonstrated that the pharmacological profile of the
diarylpyrazole derivative is also characterized by CB-independent
biological actions (Fogli et al., 2006; Patil et al., 2011; Fiori et al., 2011;
Raffa and Ward, 2012; Seely et al., 2012; Baur et al., 2012; Krzysik-
Walker et al., 2013).
AM251 is also recognized as agonist/partial agonist of GPR55 receptor
(Kapur et al., 2009; Sharir and Abood, 2010; Anavi-Goffer et al., 2012)
however the pharmacology of GPR55 is not completely clear but rather
sometimes controversial (Ross, 2009; Sharir and Abood, 2010; Anavi-
Goffer et al., 2011) since GPR55 (G protein-coupled receptor 55) ligands
are lipid molecules able to bind different targets as occurs for cannabinoid
compounds (Pertwee, 2010).
Noteworthy, a remarkable anticancer activity of AM251 has been
documented in pancreatic (Fogli et al., 2006; Fiori et al., 2011) and colon
cancer cells (Fiori et al., 2011).
Figure 3.1 Molecular structure of AM251.
49
The aim of the present study was to characterize the anti-melanoma activity
of AM251 against the BRAF V600E mutant cell line, A375, in terms of
proapototic activity and mechanism of action.
3.2 Materials and Methods
3.2.1 Cell cultures
The human melanoma A375 cell line (American Type Culture Collection,
Rockville, MD, USA) was cultured at 37°C in a humidified atmosphere
containing 5% CO2 in DMEM supplemented with l-glutamine (2 mM),
10% FBS and 1% penicillin/streptomycin (Sigma-Aldrich, Milan, Italy).
Adult human dermal fibroblasts (HDFa; Ref. C-013-5C, Gibco, Life
Technologies, CA, USA) were cultured in an optimized medium containing
10% FBS and 1% (w/v) penicillin/streptomycin, as recommended by the
manufacturer.
3.2.2 Drugs
AM251 (selective CB1 receptor antagonist/inverse agonist and GPR55
agonist), CID16020046 (selective GPR55 antagonist) and forskolin
(adenylyl cyclase activator) were obtained from Tocris Bioscience
(Northpoint, UK). Cisplatin (CisPt), L-α-lysophosphatidylinositol (LPI),
celecoxib, rofecoxib and indomethacin were purchased from Sigma–
Aldrich, Milan, Italy. Compounds were dissolved in their specific solvents
(DMSO for AM251, CID16020046, LPI and rofecoxib, water for Cis-Pt,
and ethanol for others) and further diluted in sterile culture medium
immediately before their use. DMSO did never exceed 0.33% v/v in the
culture medium.
3.2.3 Cell viability assay
Cell viability was measured using a method based on the cleavage of the 4-
(3-(4-iodophenyl)-2-(4-nitrophenyl)-2H-5-tetrazolium)-1,3-benzene
disulfonate (WST-1) to formazan by mitochondrial dehydrogenase activity
following manufacturer's instructions (Cell proliferation reagent WST-1;
Roche, Mannheim, Germany). Briefly, cells (5×10⁴/well) were seeded in
96-well plate in 10% FBS medium; after 24 h, the complete medium was
replaced with compound-containing 1% FBS medium. Each compound
was dissolved in its specific solvent and then diluted in medium up to the
concentrations to be tested. Freshly stock solutions were prepared. AM251
was tested in a concentration range of 0.1–50 µM and its effects evaluated
in the presence or absence of different antagonists added 2 h before. After
drug treatment, WST-1 was added and, after 1 h, the absorbance was
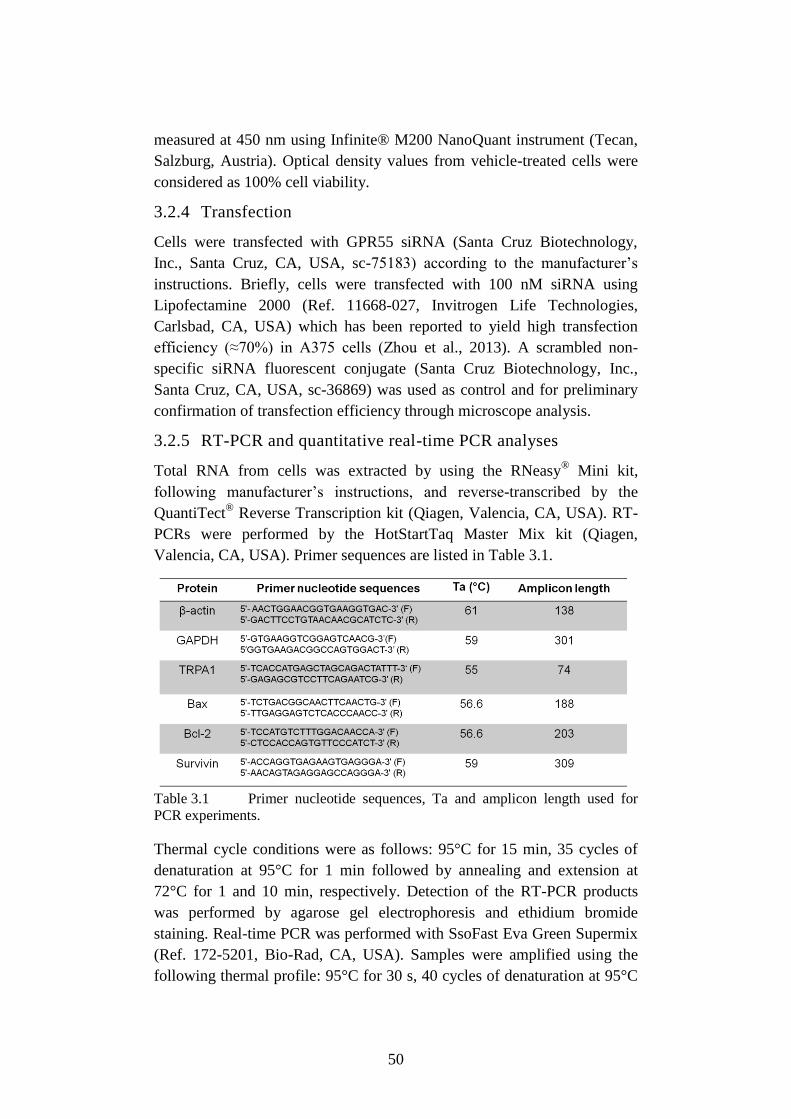
50
measured at 450 nm using Infinite® M200 NanoQuant instrument (Tecan,
Salzburg, Austria). Optical density values from vehicle-treated cells were
considered as 100% cell viability.
3.2.4 Transfection
Cells were transfected with GPR55 siRNA (Santa Cruz Biotechnology,
Inc., Santa Cruz, CA, USA, sc-75183) according to the manufacturer’s
instructions. Briefly, cells were transfected with 100 nM siRNA using
Lipofectamine 2000 (Ref. 11668-027, Invitrogen Life Technologies,
Carlsbad, CA, USA) which has been reported to yield high transfection
efficiency (≈70%) in A375 cells (Zhou et al., 2013). A scrambled non-
specific siRNA fluorescent conjugate (Santa Cruz Biotechnology, Inc.,
Santa Cruz, CA, USA, sc-36869) was used as control and for preliminary
confirmation of transfection efficiency through microscope analysis.
3.2.5 RT-PCR and quantitative real-time PCR analyses
Total RNA from cells was extracted by using the RNeasy®
Mini kit,
following manufacturer’s instructions, and reverse-transcribed by the
QuantiTect® Reverse Transcription kit (Qiagen, Valencia, CA, USA). RT-
PCRs were performed by the HotStartTaq Master Mix kit (Qiagen,
Valencia, CA, USA). Primer sequences are listed in Table 3.1.
Table 3.1 Primer nucleotide sequences, Ta and amplicon length used for
PCR experiments.
Thermal cycle conditions were as follows: 95°C for 15 min, 35 cycles of
denaturation at 95°C for 1 min followed by annealing and extension at
72°C for 1 and 10 min, respectively. Detection of the RT-PCR products
was performed by agarose gel electrophoresis and ethidium bromide
staining. Real-time PCR was performed with SsoFast Eva Green Supermix
(Ref. 172-5201, Bio-Rad, CA, USA). Samples were amplified using the
following thermal profile: 95°C for 30 s, 40 cycles of denaturation at 95°C
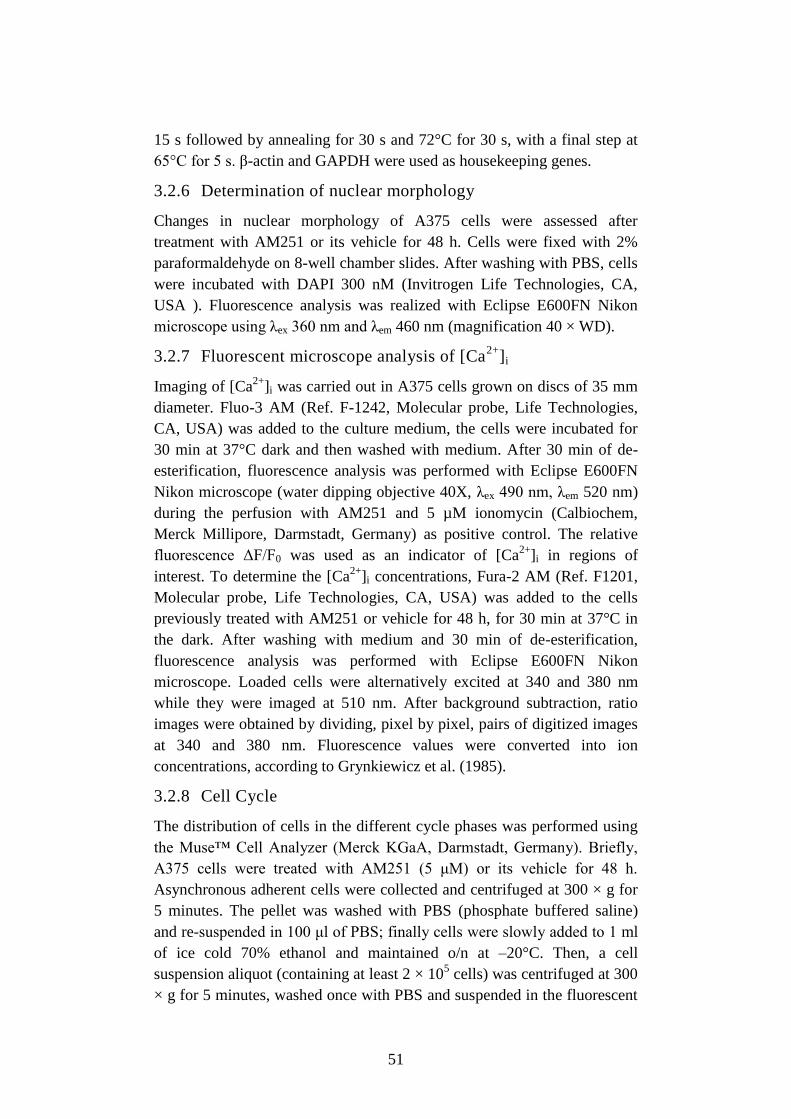
51
15 s followed by annealing for 30 s and 72°C for 30 s, with a final step at
65°C for 5 s. β-actin and GAPDH were used as housekeeping genes.
3.2.6 Determination of nuclear morphology
Changes in nuclear morphology of A375 cells were assessed after
treatment with AM251 or its vehicle for 48 h. Cells were fixed with 2%
paraformaldehyde on 8-well chamber slides. After washing with PBS, cells
were incubated with DAPI 300 nM (Invitrogen Life Technologies, CA,
USA ). Fluorescence analysis was realized with Eclipse E600FN Nikon
microscope using λex 360 nm and λem 460 nm (magnification 40 × WD).
3.2.7 Fluorescent microscope analysis of [Ca2+
]i
Imaging of [Ca2+
]i was carried out in A375 cells grown on discs of 35 mm
diameter. Fluo-3 AM (Ref. F-1242, Molecular probe, Life Technologies,
CA, USA) was added to the culture medium, the cells were incubated for
30 min at 37°C dark and then washed with medium. After 30 min of de-
esterification, fluorescence analysis was performed with Eclipse E600FN
Nikon microscope (water dipping objective 40X, λex 490 nm, λem 520 nm)
during the perfusion with AM251 and 5 µM ionomycin (Calbiochem,
Merck Millipore, Darmstadt, Germany) as positive control. The relative
fluorescence ΔF/F0 was used as an indicator of [Ca2+
]i in regions of
interest. To determine the [Ca2+
]i concentrations, Fura-2 AM (Ref. F1201,
Molecular probe, Life Technologies, CA, USA) was added to the cells
previously treated with AM251 or vehicle for 48 h, for 30 min at 37°C in
the dark. After washing with medium and 30 min of de-esterification,
fluorescence analysis was performed with Eclipse E600FN Nikon
microscope. Loaded cells were alternatively excited at 340 and 380 nm
while they were imaged at 510 nm. After background subtraction, ratio
images were obtained by dividing, pixel by pixel, pairs of digitized images
at 340 and 380 nm. Fluorescence values were converted into ion
concentrations, according to Grynkiewicz et al. (1985).
3.2.8 Cell Cycle
The distribution of cells in the different cycle phases was performed using
the Muse™ Cell Analyzer (Merck KGaA, Darmstadt, Germany). Briefly,
A375 cells were treated with AM251 (5 μM) or its vehicle for 48 h.
Asynchronous adherent cells were collected and centrifuged at 300 × g for
5 minutes. The pellet was washed with PBS (phosphate buffered saline)
and re-suspended in 100 μl of PBS; finally cells were slowly added to 1 ml
of ice cold 70% ethanol and maintained o/n at –20°C. Then, a cell
suspension aliquot (containing at least 2 × 10⁵ cells) was centrifuged at 300
× g for 5 minutes, washed once with PBS and suspended in the fluorescent
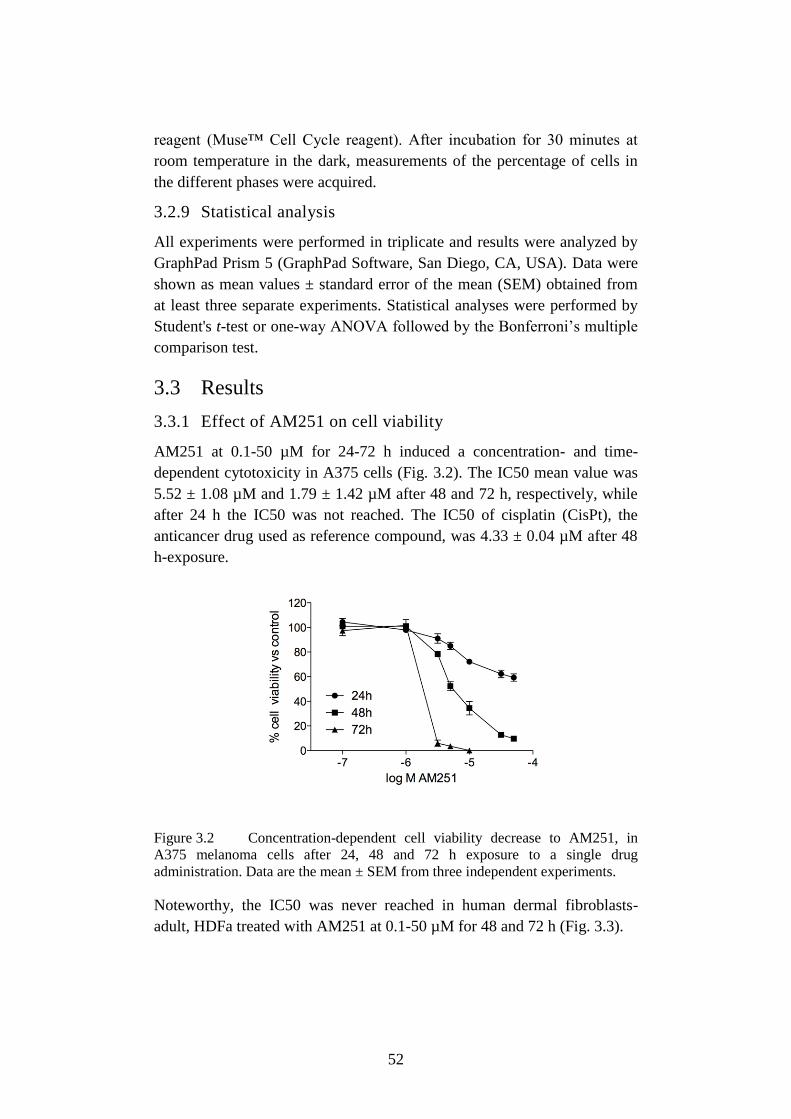
52
reagent (Muse™ Cell Cycle reagent). After incubation for 30 minutes at
room temperature in the dark, measurements of the percentage of cells in
the different phases were acquired.
3.2.9 Statistical analysis
All experiments were performed in triplicate and results were analyzed by
GraphPad Prism 5 (GraphPad Software, San Diego, CA, USA). Data were
shown as mean values ± standard error of the mean (SEM) obtained from
at least three separate experiments. Statistical analyses were performed by
Student's t-test or one-way ANOVA followed by the Bonferroni’s multiple
comparison test.
3.3 Results
3.3.1 Effect of AM251 on cell viability
AM251 at 0.1-50 µM for 24-72 h induced a concentration- and time-
dependent cytotoxicity in A375 cells (Fig. 3.2). The IC50 mean value was
5.52 ± 1.08 µM and 1.79 ± 1.42 µM after 48 and 72 h, respectively, while
after 24 h the IC50 was not reached. The IC50 of cisplatin (CisPt), the
anticancer drug used as reference compound, was 4.33 ± 0.04 µM after 48
h-exposure.
Figure 3.2 Concentration-dependent cell viability decrease to AM251, in
A375 melanoma cells after 24, 48 and 72 h exposure to a single drug
administration. Data are the mean ± SEM from three independent experiments.
Noteworthy, the IC50 was never reached in human dermal fibroblasts-
adult, HDFa treated with AM251 at 0.1-50 µM for 48 and 72 h (Fig. 3.3).
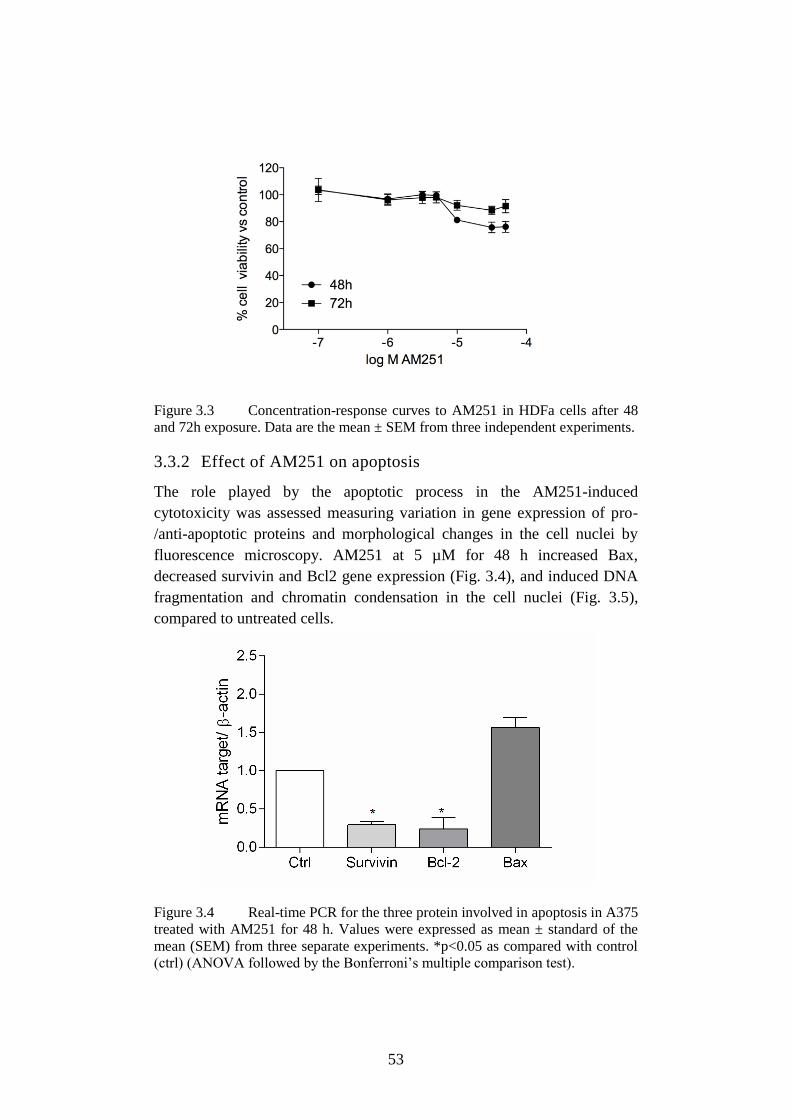
53
Figure 3.3 Concentration-response curves to AM251 in HDFa cells after 48
and 72h exposure. Data are the mean ± SEM from three independent experiments.
3.3.2 Effect of AM251 on apoptosis
The role played by the apoptotic process in the AM251-induced
cytotoxicity was assessed measuring variation in gene expression of pro-
/anti-apoptotic proteins and morphological changes in the cell nuclei by
fluorescence microscopy. AM251 at 5 µM for 48 h increased Bax,
decreased survivin and Bcl2 gene expression (Fig. 3.4), and induced DNA
fragmentation and chromatin condensation in the cell nuclei (Fig. 3.5),
compared to untreated cells.
Figure 3.4 Real-time PCR for the three protein involved in apoptosis in A375
treated with AM251 for 48 h. Values were expressed as mean ± standard of the
mean (SEM) from three separate experiments. *p<0.05 as compared with control
(ctrl) (ANOVA followed by the Bonferroni’s multiple comparison test).
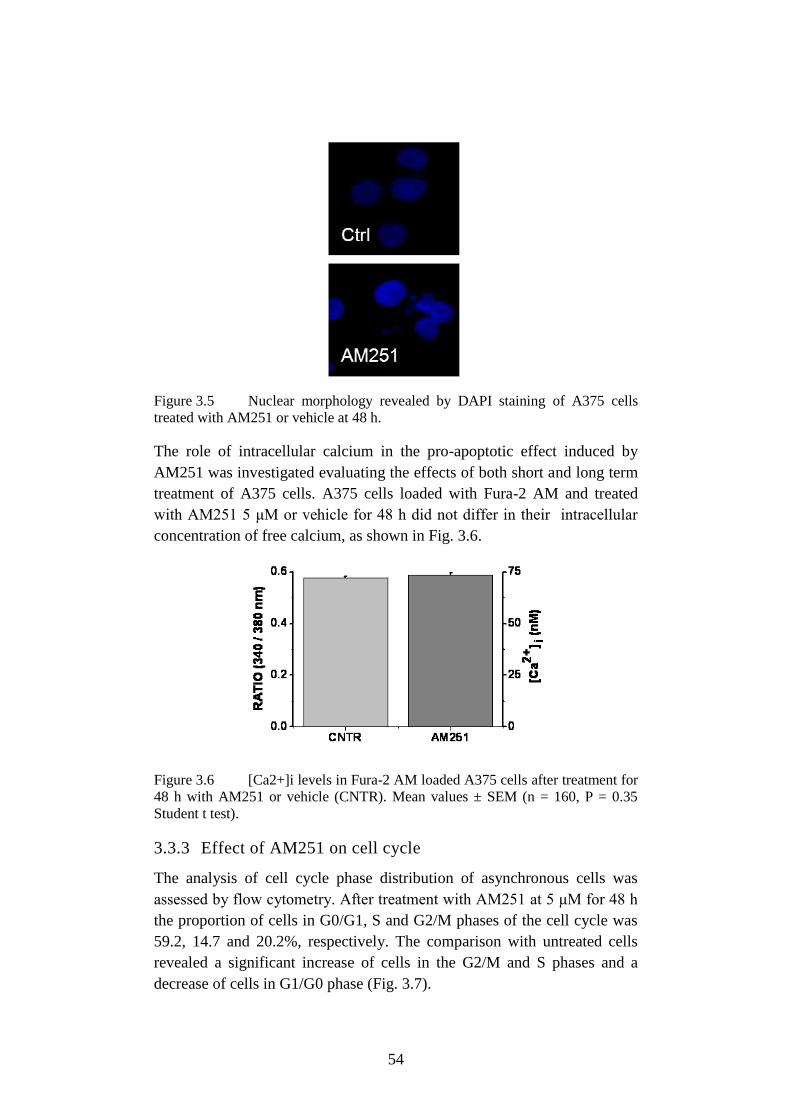
54
Figure 3.5 Nuclear morphology revealed by DAPI staining of A375 cells
treated with AM251 or vehicle at 48 h.
The role of intracellular calcium in the pro-apoptotic effect induced by
AM251 was investigated evaluating the effects of both short and long term
treatment of A375 cells. A375 cells loaded with Fura-2 AM and treated
with AM251 5 μM or vehicle for 48 h did not differ in their intracellular
concentration of free calcium, as shown in Fig. 3.6.
Figure 3.6 [Ca2+]i levels in Fura-2 AM loaded A375 cells after treatment for
48 h with AM251 or vehicle (CNTR). Mean values ± SEM (n = 160, P = 0.35
Student t test).
3.3.3 Effect of AM251 on cell cycle
The analysis of cell cycle phase distribution of asynchronous cells was
assessed by flow cytometry. After treatment with AM251 at 5 μM for 48 h
the proportion of cells in G0/G1, S and G2/M phases of the cell cycle was
59.2, 14.7 and 20.2%, respectively. The comparison with untreated cells
revealed a significant increase of cells in the G2/M and S phases and a
decrease of cells in G1/G0 phase (Fig. 3.7).
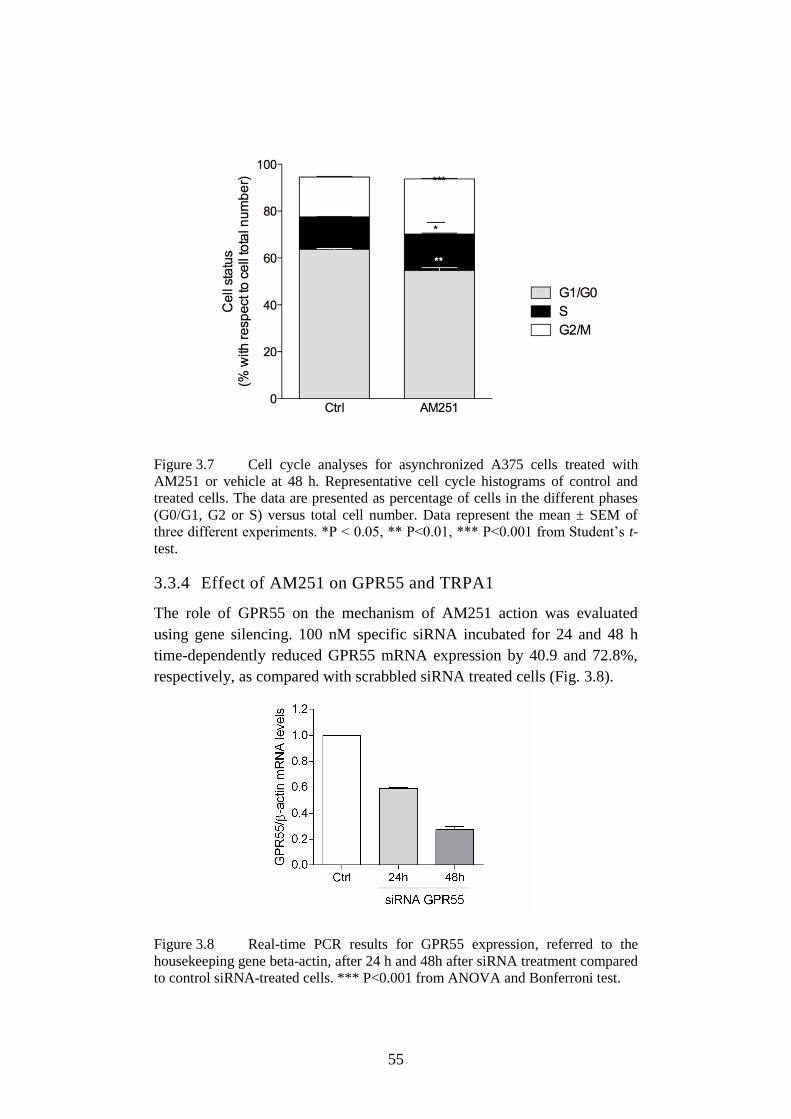
55
Figure 3.7 Cell cycle analyses for asynchronized A375 cells treated with
AM251 or vehicle at 48 h. Representative cell cycle histograms of control and
treated cells. The data are presented as percentage of cells in the different phases
(G0/G1, G2 or S) versus total cell number. Data represent the mean ± SEM of
three different experiments. *P < 0.05, ** P<0.01, *** P<0.001 from Student’s t-
test.
3.3.4 Effect of AM251 on GPR55 and TRPA1
The role of GPR55 on the mechanism of AM251 action was evaluated
using gene silencing. 100 nM specific siRNA incubated for 24 and 48 h
time-dependently reduced GPR55 mRNA expression by 40.9 and 72.8%,
respectively, as compared with scrabbled siRNA treated cells (Fig. 3.8).
Figure 3.8 Real-time PCR results for GPR55 expression, referred to the
housekeeping gene beta-actin, after 24 h and 48h after siRNA treatment compared
to control siRNA-treated cells. *** P<0.001 from ANOVA and Bonferroni test.
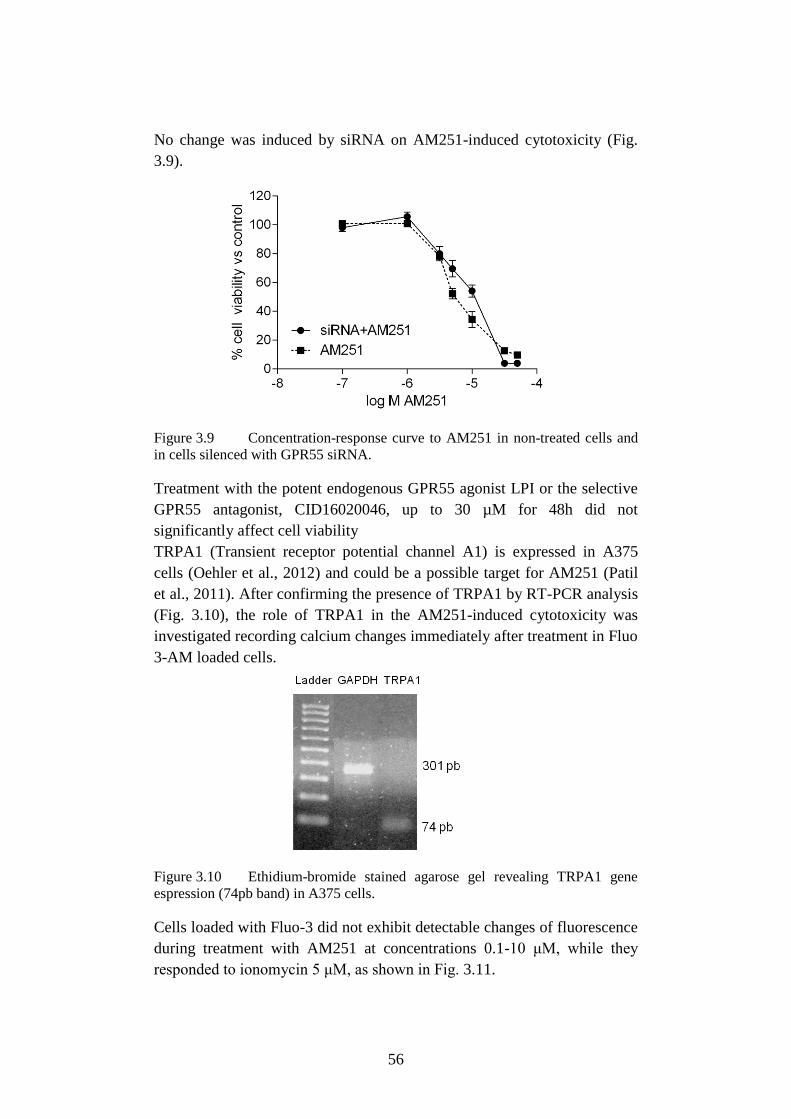
56
No change was induced by siRNA on AM251-induced cytotoxicity (Fig.
3.9).
Figure 3.9 Concentration-response curve to AM251 in non-treated cells and
in cells silenced with GPR55 siRNA.
Treatment with the potent endogenous GPR55 agonist LPI or the selective
GPR55 antagonist, CID16020046, up to 30 µM for 48h did not
significantly affect cell viability
TRPA1 (Transient receptor potential channel A1) is expressed in A375
cells (Oehler et al., 2012) and could be a possible target for AM251 (Patil
et al., 2011). After confirming the presence of TRPA1 by RT-PCR analysis
(Fig. 3.10), the role of TRPA1 in the AM251-induced cytotoxicity was
investigated recording calcium changes immediately after treatment in Fluo
3-AM loaded cells.
Figure 3.10 Ethidium-bromide stained agarose gel revealing TRPA1 gene
espression (74pb band) in A375 cells.
Cells loaded with Fluo-3 did not exhibit detectable changes of fluorescence
during treatment with AM251 at concentrations 0.1-10 μM, while they
responded to ionomycin 5 μM, as shown in Fig. 3.11.
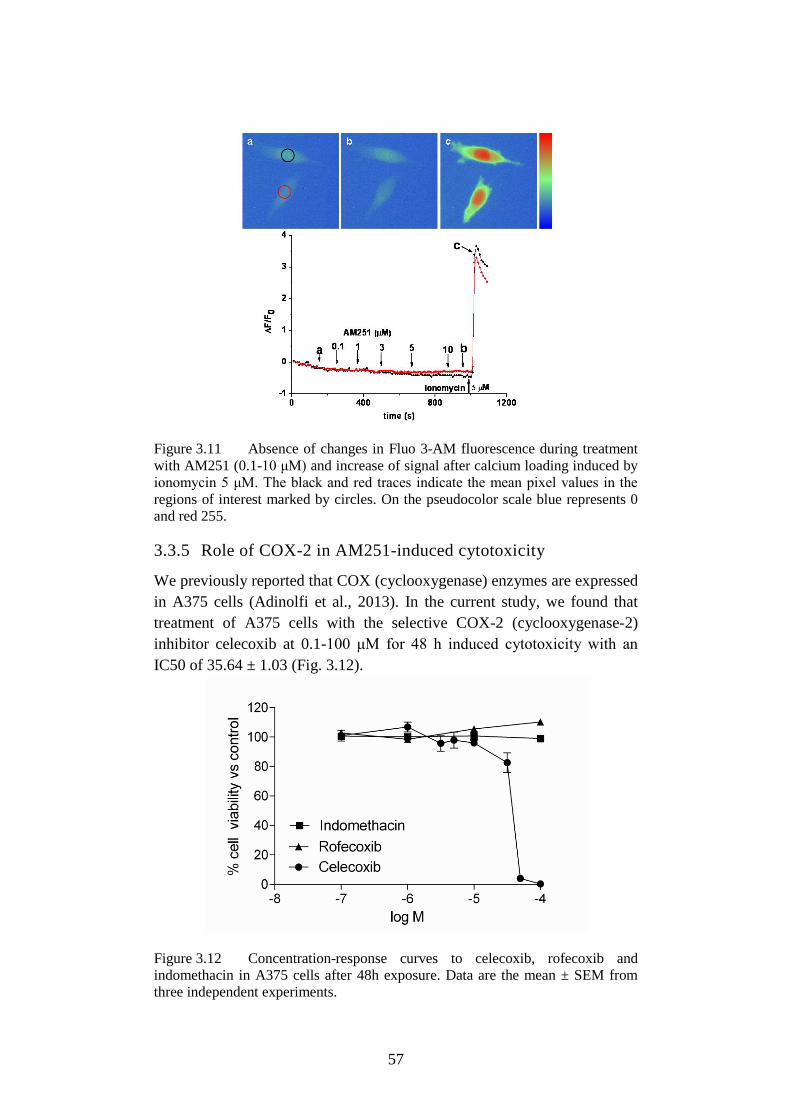
57
Figure 3.11 Absence of changes in Fluo 3-AM fluorescence during treatment
with AM251 (0.1-10 μM) and increase of signal after calcium loading induced by
ionomycin 5 μM. The black and red traces indicate the mean pixel values in the
regions of interest marked by circles. On the pseudocolor scale blue represents 0
and red 255.
3.3.5 Role of COX-2 in AM251-induced cytotoxicity
We previously reported that COX (cyclooxygenase) enzymes are expressed
in A375 cells (Adinolfi et al., 2013). In the current study, we found that
treatment of A375 cells with the selective COX-2 (cyclooxygenase-2)
inhibitor celecoxib at 0.1-100 μM for 48 h induced cytotoxicity with an
IC50 of 35.64 ± 1.03 (Fig. 3.12).
Figure 3.12 Concentration-response curves to celecoxib, rofecoxib and
indomethacin in A375 cells after 48h exposure. Data are the mean ± SEM from
three independent experiments.
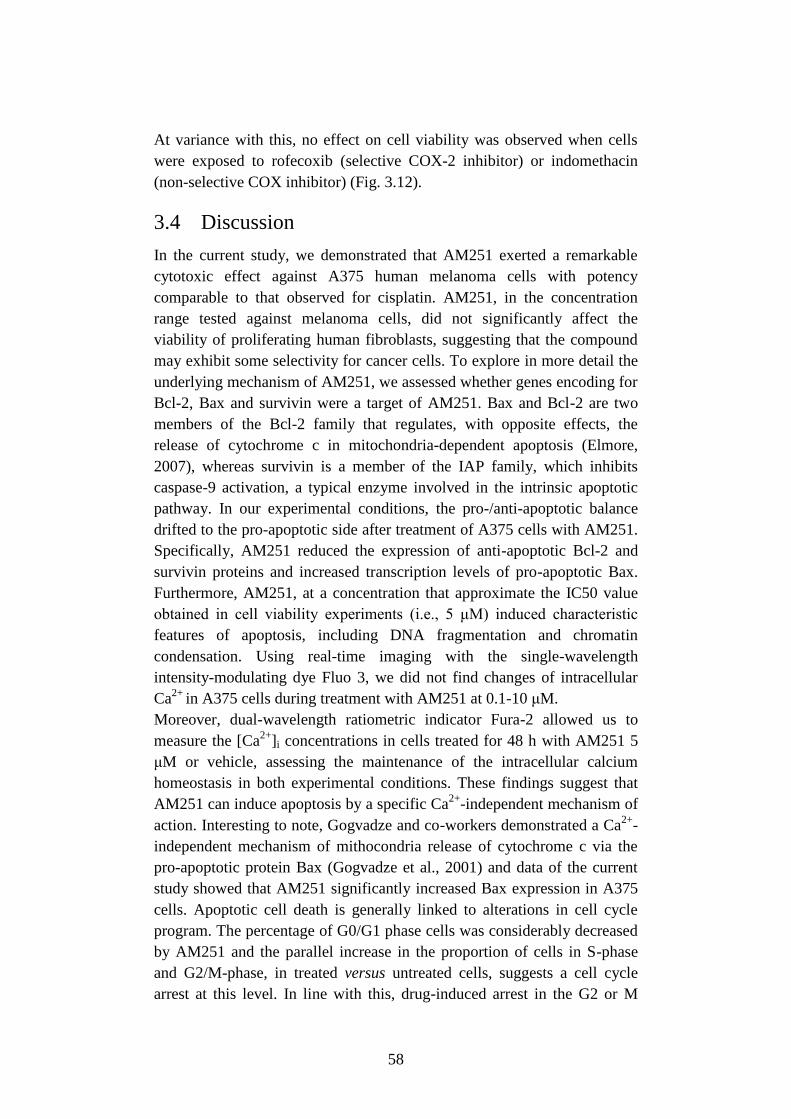
58
At variance with this, no effect on cell viability was observed when cells
were exposed to rofecoxib (selective COX-2 inhibitor) or indomethacin
(non-selective COX inhibitor) (Fig. 3.12).
3.4 Discussion
In the current study, we demonstrated that AM251 exerted a remarkable
cytotoxic effect against A375 human melanoma cells with potency
comparable to that observed for cisplatin. AM251, in the concentration
range tested against melanoma cells, did not significantly affect the
viability of proliferating human fibroblasts, suggesting that the compound
may exhibit some selectivity for cancer cells. To explore in more detail the
underlying mechanism of AM251, we assessed whether genes encoding for
Bcl-2, Bax and survivin were a target of AM251. Bax and Bcl-2 are two
members of the Bcl-2 family that regulates, with opposite effects, the
release of cytochrome c in mitochondria-dependent apoptosis (Elmore,
2007), whereas survivin is a member of the IAP family, which inhibits
caspase-9 activation, a typical enzyme involved in the intrinsic apoptotic
pathway. In our experimental conditions, the pro-/anti-apoptotic balance
drifted to the pro-apoptotic side after treatment of A375 cells with AM251.
Specifically, AM251 reduced the expression of anti-apoptotic Bcl-2 and
survivin proteins and increased transcription levels of pro-apoptotic Bax.
Furthermore, AM251, at a concentration that approximate the IC50 value
obtained in cell viability experiments (i.e., 5 μM) induced characteristic
features of apoptosis, including DNA fragmentation and chromatin
condensation. Using real-time imaging with the single-wavelength
intensity-modulating dye Fluo 3, we did not find changes of intracellular
Ca2+
in A375 cells during treatment with AM251 at 0.1-10 μM.
Moreover, dual-wavelength ratiometric indicator Fura-2 allowed us to
measure the [Ca2+
]i concentrations in cells treated for 48 h with AM251 5
μM or vehicle, assessing the maintenance of the intracellular calcium
homeostasis in both experimental conditions. These findings suggest that
AM251 can induce apoptosis by a specific Ca2+
-independent mechanism of
action. Interesting to note, Gogvadze and co-workers demonstrated a Ca2+
-
independent mechanism of mithocondria release of cytochrome c via the
pro-apoptotic protein Bax (Gogvadze et al., 2001) and data of the current
study showed that AM251 significantly increased Bax expression in A375
cells. Apoptotic cell death is generally linked to alterations in cell cycle
program. The percentage of G0/G1 phase cells was considerably decreased
by AM251 and the parallel increase in the proportion of cells in S-phase
and G2/M-phase, in treated versus untreated cells, suggests a cell cycle
arrest at this level. In line with this, drug-induced arrest in the G2 or M
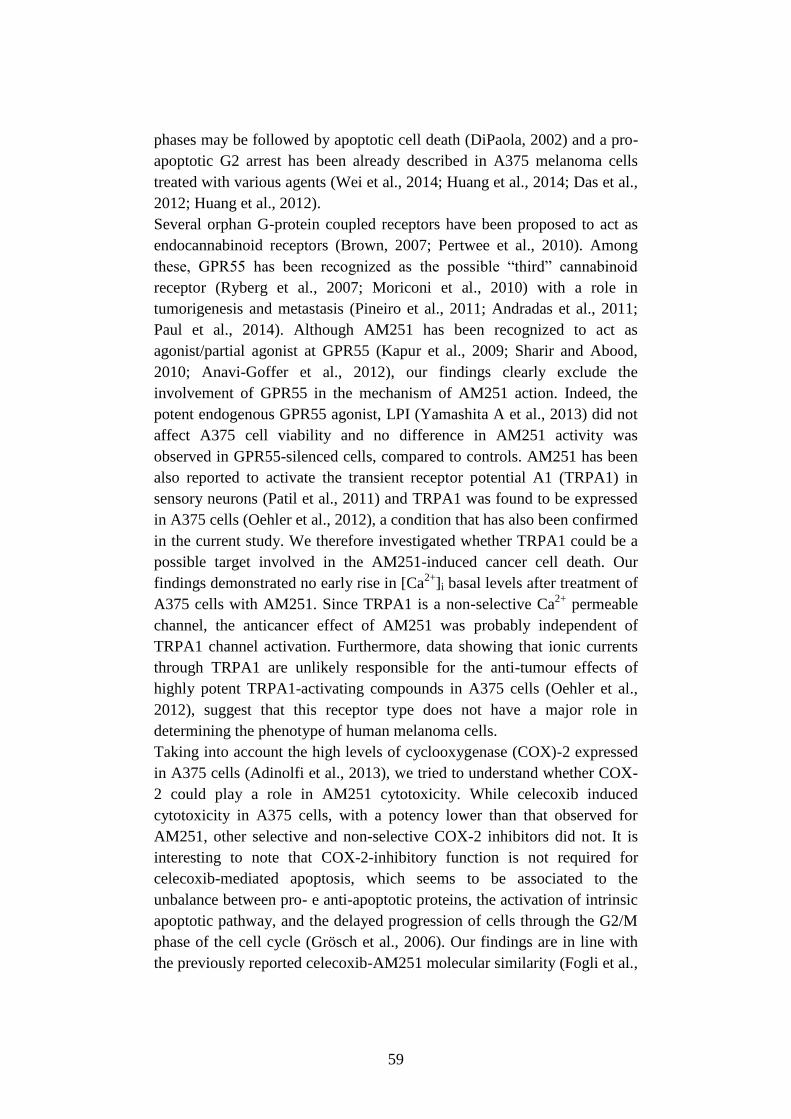
59
phases may be followed by apoptotic cell death (DiPaola, 2002) and a pro-
apoptotic G2 arrest has been already described in A375 melanoma cells
treated with various agents (Wei et al., 2014; Huang et al., 2014; Das et al.,
2012; Huang et al., 2012).
Several orphan G-protein coupled receptors have been proposed to act as
endocannabinoid receptors (Brown, 2007; Pertwee et al., 2010). Among
these, GPR55 has been recognized as the possible “third” cannabinoid
receptor (Ryberg et al., 2007; Moriconi et al., 2010) with a role in
tumorigenesis and metastasis (Pineiro et al., 2011; Andradas et al., 2011;
Paul et al., 2014). Although AM251 has been recognized to act as
agonist/partial agonist at GPR55 (Kapur et al., 2009; Sharir and Abood,
2010; Anavi-Goffer et al., 2012), our findings clearly exclude the
involvement of GPR55 in the mechanism of AM251 action. Indeed, the
potent endogenous GPR55 agonist, LPI (Yamashita A et al., 2013) did not
affect A375 cell viability and no difference in AM251 activity was
observed in GPR55-silenced cells, compared to controls. AM251 has been
also reported to activate the transient receptor potential A1 (TRPA1) in
sensory neurons (Patil et al., 2011) and TRPA1 was found to be expressed
in A375 cells (Oehler et al., 2012), a condition that has also been confirmed
in the current study. We therefore investigated whether TRPA1 could be a
possible target involved in the AM251-induced cancer cell death. Our
findings demonstrated no early rise in [Ca2+
]i basal levels after treatment of
A375 cells with AM251. Since TRPA1 is a non-selective Ca2+
permeable
channel, the anticancer effect of AM251 was probably independent of
TRPA1 channel activation. Furthermore, data showing that ionic currents
through TRPA1 are unlikely responsible for the anti-tumour effects of
highly potent TRPA1-activating compounds in A375 cells (Oehler et al.,
2012), suggest that this receptor type does not have a major role in
determining the phenotype of human melanoma cells.
Taking into account the high levels of cyclooxygenase (COX)-2 expressed
in A375 cells (Adinolfi et al., 2013), we tried to understand whether COX-
2 could play a role in AM251 cytotoxicity. While celecoxib induced
cytotoxicity in A375 cells, with a potency lower than that observed for
AM251, other selective and non-selective COX-2 inhibitors did not. It is
interesting to note that COX-2-inhibitory function is not required for
celecoxib-mediated apoptosis, which seems to be associated to the
unbalance between pro- e anti-apoptotic proteins, the activation of intrinsic
apoptotic pathway, and the delayed progression of cells through the G2/M
phase of the cell cycle (Grösch et al., 2006). Our findings are in line with
the previously reported celecoxib-AM251 molecular similarity (Fogli et al.,
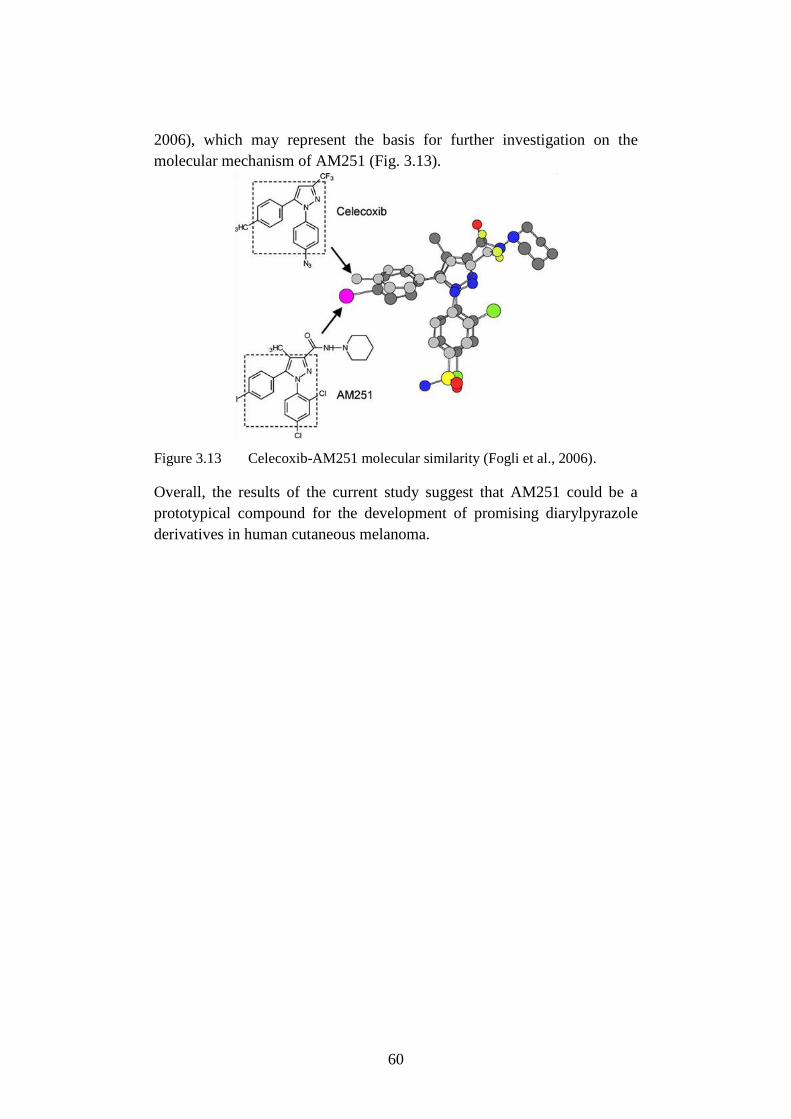
60
2006), which may represent the basis for further investigation on the
molecular mechanism of AM251 (Fig. 3.13).
Figure 3.13 Celecoxib-AM251 molecular similarity (Fogli et al., 2006).
Overall, the results of the current study suggest that AM251 could be a
prototypical compound for the development of promising diarylpyrazole
derivatives in human cutaneous melanoma.
Nomenclature
501-Mel Metastatic melanoma cell line
A375 Metastatic melanoma cell line
AJCC American Joint Committee on Cancer
Akt Protein kinase B (PKB)
AM251 (N-(Piperidin-1-yl)-5-(4-iodophenyl)-1-(2,4-
dichlorophenyl)-4-methyl-1H-pyrazole-3-carboxamide)
AMP Adenosine monophosphate
AMPK AMP-activated protein kinase
AP-1 Activator protein 1
APC Antigen-presenting cell
ATP Adenosine triphosphate
Bad Bcl-2-associated death promoter
Bax Bcl-2-associated X protein
Bcl-2 B-cell lymphoma 2
BSMC Human Bronchial Smooth Muscle Cells
CB1R Cannabinoid receptor subtypes 1
CB2R Cannabinoid receptor subtypes 2
CD271 Low affinity nerve growth factor receptor
CD28 Cluster of Differentiation 28
CDK Cyclin dependent kinase
CDK2 Cyclin dependent kinase type 2
CDK4 Cyclin dependent kinase type 4
CDK6 Cyclin dependent kinase type 6
CDKN2A Cyclin-dependent kinase inhibitor 2A
CisPt Cisplatin
CK2 Protein kinase 2 or casein kinase II
CKII Casein kinase II or protein kinase 2
c-KIT Tyrosine-protein kinase or CD117
COX Cyclooxygenase
COX-2 Cyclooxygenase-2
CREB cAMP response element-binding protein
CSC Cancer stem cells
CTLA-4 Cytotoxic T-Lymphocyte Antigen 4
CTRL Control
DAPI 4',6-diamidino-2-phenylindole
DIC Differential interference contrast
DMEM Dulbecco's modified Eagle's medium
DMSO Dimethyl sulfoxide
DTX Docetaxel
ECS Endocannabinoid system
EGFR Epidermal growth factor receptor
ELISA Enzyme-linked immunosorbent assay
EMA European Medicine Agency
ERK Extracellular signal-regulated kinases
ERK1 Extracellular signal-regulated kinase 1
ERK2 Extracellular signal-regulated kinase 2
FBS Fetal bovine serum
FDA US Food and Drug Administration
GAPDH Glyceraldehyde 3-phosphate dehydrogenase
GDP Guanosine diphosphate
GPR55 G protein-coupled receptor 55
GSK3 Glycogen synthase kinase 3
GTP Guanosine -5'triphosphate
GβL G protein β-like
HDFa Adult Human Dermal Fibroblasts
HIF1 Hypoxia-inducible factor-1
HSP90 Heat-shock protein 90
IAP Inhibitor of apoptosis
IGF Insulin-like growth factor
IkB Nuclear factor of kappa light polypeptide gene enhancer in
B-cells inhibitor
IKK Inhibitor of nuclear factor kappa-B kinase
IL-2 Interleukin-2
INF-α2b Interferon alpha 2b
Jak Janus kinase
JNK Jun N-terminal kinases
LPI L-α-lysophosphatidylinositol
MAPK Mitogen-activated protein kinase
MB Molecular beacon oligodeoxyribonucleotides
MC1R Melanocortin 1 receptor
MDM2 Mouse double minute 2
MIMIC Malignant melanoma-initiating cell
MITF Microphthalmia-associated transcription factor
mTOR Mammalian target of rapamycin
mTORC1 Mammalian target of rapamycin complex 1
mTORC2 Mammalian target of rapamycin complex 2
NA Numerical aperture
NCCN National Comprehensive Cancer Network
NF-κB Nuclear factor kappa-light-chain-enhancer of activated B
cells
NIK NF-kappa-B-inducing kinase
OS Overall survival
p14ARF
ARF tumor suppressor
p16INK4
Cyclin-dependent kinase inhibitor 2A
p21 Cyclin-dependent kinase inhibitor 1
p27KIP1
Cyclin-dependent kinase inhibitor 1B
p38 Mitogen-activated protein kinases
p53 Cellular tumor antigen p53
p65 Transcription factor p65
PBS Phosphate buffered saline
PCR Polymerase chain reaction
PD-1 Programmed death-1 or programmed cell death-1
PDGF Platelet-derived growth factor
PDK1 Phosphoinositide dependent protein kinase-1
PD-L1 Programmed death-ligand 1
PD-L2 Programmed death-ligand 2
PI3K Phosphatidylinositol-3-kinase
PIP2 Phosphatidylinositol-4,4-bisphosphate
PIP3 Phosphatidylinositol-3,4,5-triphosphate
PKA Protein kinase A
PKB Protein kinase B
PKC Protein kinase C
POD Horseradish peroxidase
PTEN Phosphatase and tensin homolog
RAPTOR Regulatory-associated protein of mTOR
Rb Retinoblastoma
RICTOR Rapamycin-insensitive companion of mammalian target of
rapamycin
RTK Receptor tyrosine kinase
RT-PCR Reverse transcriptase polymerase chain reaction
SCF Stem cell factor
SDS Sodium dodecyl sulfate
SEM Standard error of the mean
siRNA Small or short interfering RNA
SLNB Sentinel lymph node biopsy
SOS Son of sevenless
STAT Signal transducer and activator of transcription
Ta Annealing temperature
TBE Buffer tris-borate-EDTA

TNF Tumor necrosis factor
TNFR Tumor necrosis factor receptor
TNM Tumor-Node-Metastasis
TRAF Tumor necrosis factor receptor associated factor
TRPA1 Transient receptor potential channel A1
VEGF Vascular endothelial growth factor
WST-1 4-(3-(4-iodophenyl)-2-(4-nitrophenyl)-2H-5-tetrazolium)-
1,3-benzene disulfonate
ΔΨm Mitochondrial membrane potential
71
Bibliografy
Adinolfi B, Romanini A, Vanni A, Martinotti E, Chicca A, Fogli S, et al.
(2013). Anticancer activity of anandamide in human cutaneous melanoma
cells. Eur J Pharmacol 718: 154-159.
Aguado T, Carracedo A, Julien B, Velasco G, Milman G, Mechoulam R et
al., (2007) Cannabinoids induce glioma stem-like cell differentiation and
inhibit gliomagenesis. J Biol Chem. 282:6854-62.
Aiom-airtum, I numeri del cancro in Italia 2014, Aviable:
[http://www.registri-tumori.it/cms/it/node/3412] Accessed December 12,
2014.
Aitken J, Welch J, Duffy D, Milligan A, Green A, Martin N et al. (1999)
CDKN2A variants in a population-based sample of Queensland families
with melanoma. J Natl Cancer Inst. 91:446-452.
AJCC, Cancer staging. Available: [https://cancerstaging.org/references-
tools/Pages/What-is-Cancer-Staging.aspx] Accessed December 12, 2014.
Altieri DC (2008) Survivin, cancer netwoks and pathway-directed drug
discovery. Nat Rev Cancer 8:61-70.
Altieri DC, Grossman D (2001) Drug Resistance in Melanoma:
Mechanisms, Apoptosis, and New Potential Therapeutic Targets. Cancer
Metastasis Rev 20:3-11.
Ambrosini G, Adida C, Altieri DC (1997) A novel anti-apoptosis gene,
survivin, expressed in cancer and lymphoma. Nat med 3:917-21.
Amiri KI, Richmond A (2005) Role of nuclear factor-kappa B in
melanoma. Cancer Metastasis Rev. 24:301-313.
Anavi-Goffer S et al., (2012) Modulation of L-α-
lysophosphatidylinositol/GPR55 mitogen-activated protein kinase (MAPK)
signaling by cannabinoids. J Biol Chem 287(1):91-104.
Anavi-Goffer S, Baillie G, Irving AJ, Gertsch J, Greig IR, Pertwee RG, et
al. (2012). Modulation of L-α-lysophosphatidylinositol/GPR55 mitogen-
activated protein kinase (MAPK) signaling by cannabinoids. J Biol Chem.
287: 91-104.
Andradas C, Caffarel MM, Pérez-Gómez E, Salazar M, Lorente M,
Velasco G, et al. (2011). The orphan G protein-coupled receptor GPR55
promotes cancer cell proliferation via ERK. Oncogene 30: 245-252.
Baur R, Gertsch J, Sigle E (2012). The cannabinoid CB1 receptor
antagonists rimonabant (SR141716) and AM251 directly potentiate
GABA(A) receptors. Br J Pharmacol 165: 2479-2484.
Bhatia S, Tykodi SS, Thompson JA (2009) Treatment of metastatic
melanoma: an overview. Oncology (Williston Park) 23:488-496.
72
Blázquez C, Carracedo A, Barrado L, Real PJ, Fernández-Luna JL,
Velasco G, et al. (2006). Cannabinoid receptors as novel targets for the
treatment of melanoma. FASEB J 20: 2633-2635.
Blázquez C, Carracedo A, Barrado L, Real PJ, Fernández-Luna JL,
Velasco G et al., (2006) Cannabinoid receptors as novel targets for the
treatment of melanoma. FASEB J. 20(14):2633-5.
Boiko AD, Razorenova OV, Van de Rijn M, Swetter SM, Johnson DL, Ly
DP et al. (2010) Human melanoma-initiating cells express neural crest
nerve growth factor receptor CD271. Nature 466:133–7.
Brahmer JR, Drake CG, Wollner I, Powderly JD, Picus J, Sharfman WH et
al., (2010) Phase I study of single-agent anti-programmed death-1 (MDX-
1106) in refractory solid tumors: safety, clinical activity,
pharmacodynamics, and immunologic correlates. 28:3167-3175.
Brown A (2007). Novel cannabinoid receptors. Br J Pharmacol 152: 567-
575.
Cantwell-Dorris ER, O’Leary JJ, Sheils OM (2011) BRAFV600E:
implications for carcinogenesis and molecular therapy. Mol Cancer
Ther.10:385-394.
Capiod T (2011). Cell proliferation, calcium influx and calcium channels.
Biochimie 93: 2075-2079.
Carnero A (2002) Targeting the cell cycle for cancer therapy. Br. J.Cancer.
87:129-133.
Carrasco RA, Stamm B, Marcusson E, Sandusky G, Iversen P, Patel BK
(2011) Antisense inhibition of survivin expression as a cancer therapeutic.
Mol Cancer Ther 10: 221-232.
Chakravarti B, Ravi J, Ganju RK (2014) Cannabinoids as therapeutic
agents in cancer: current status and future implications. Oncotarget.
5:5852-72.
Chambers CA, Kuhns MS, Egen JG, Allison JP (2001) CTLA-4-mediated
inhibition in regulation of T cell responses: mechanisms and manipulation
in tumor immunotherapy. Annu. Rev. Immunol. 19:565-594.
Chapman PB, Hauschild A, Robert C, Haanen JB, Ascierto P, Larkin J et
al. (2011) Improved survival with vemurafenib in melanoma with BRAF
mutation. N. Engl. J. Med. 364: 2507-2516.
Cheever MA, Higano CS (2011) PROVENGE (Sipuleucel-T) in prostate
cancer: the first FDA-approved therapeutic cancer vaccine. Clin Cancer
Res 17:3520–6.
Chen N, Gong J, Chen X, Meng W, Huang Y, Zhao F, et al. (2009)
Caspases and inhibitor of apoptosis proteins in cutaneous and mucosal
melanoma: expression profile and clinicopathologic significance. Hum
Pathol 40:950-956.
73
Cheung CHA, Huang CC, Tsai FY, Lee JYC, Cheng SM, Chang YC, et al.
(2013) Survivin-biology and potential as a therapeutic target in oncology.
Onco Targets Ther 6:1453-1462.
Chin L (2003) The genetics of malignant melanoma: lessons from mouse
and man. Nature Reviews Cancer 3:559-570.
Cho RW, Clarke MF (2008) Recent advances in cancer stem cells. Curr
Opin Genet Dev. 18:48–53.
Compagnucci C, Di Siena S, Bustamante MB, Di Giacomo D, Di
Tommaso M, Maccarrone M et al. (2013) Type-1 (CB1) cannabinoid
receptor promotes neuronal differentiation and maturation of neural stem
cells. PLoS One 8:5427.
Cully M, You H, Levine AJ, Mak, TW (2006) Beyond PTEN mutations:
the PI3K pathway as an integrator of multiple inputs during tumorigenesis.
Nat. Rev.Cancer. 6:184-192.
Currais A, Hortobágyi T, Soriano S (2009) The neuronal cell cycle as a
mechanism of pathogenesis in Alzheimer's disease. Aging (Albany NY).
1:363-371.
Dancey J (2010) mTOR signaling and drug development in cancer. Nature
Reviews Clinical Oncology 7:209-219.
Dankort D, Curley DP, Cartlidge RA, Nelson B, Karnezis AN, Damsky
WE et al., (2009) Braf(V600E) cooperates with Pten loss to induce
metastatic melanoma. Nat. Genet. 41:544-552.
Das S, Das J, Samadder A, Boujedaini N, Khuda-Bukhsh AR (2012).
Apigenin-induced apoptosis in A375 and A549 cells through selective
action and dysfunction of mitochondria. Exp Biol Med 237: 1433-1448.
Datta SR, Brunet A, Greenberg ME (1999) Cellular survival: a play in
three Akts. Genes Dev. 13:2905–27.
Davis MI, Ronesi J, Lovinger DM. (2003) A predominant role for
inhibition of the adenylate cyclase/protein kinase A pathway in ERK
activation by cannabinoid receptor 1 in N1E-115 neuroblastoma cells. J
Biol Chem. 278:48973-80.
DiPaola RS (2002). To arrest or not to G(2)-M Cell-cycle arrest :
commentary re: A. K. Tyagi et al., Silibinin strongly synergizes human
prostate carcinoma DU145 cells to doxorubicin-induced growth inhibition,
G(2)-M arrest, and apoptosis. Clin cancer res 8: 3311-3314.
Dirks P (2010) Cancer stem cells: invitation to a second round. Nature
466:40–41.
Dohi T, Beltrami E, Wall NR, Plescia J, Altieri DC (2004) Mitochondrial
survivin inhibits apoptosis and promotes tumorigenesis. J Clin Invest
114:1117-1127.
74
Dummer R, Hauschild A, Guggenheim M, Keilholz U, Pentheroudakis G,
on behalf of the ESMO Guidelines Working Group (2012) Cutaneous
melanoma: ESMO Clinical Practice Guidelines for diagnosis, treatment
and follow-up Ann Oncol 23:vii86-vii91.
Eisenmann KM, VanBrocklin MW, Staffend NA, Kitchen SM, Koo
HM.(2003) Mitogen-activated protein kinase pathway-dependent tumor-
specific survival signaling in melanoma cells through inactivation of the
proapoptotic protein bad. Cancer Res 63:8330-7.
Elmore S (2007). Apoptosis: a review of programmed cell death. Toxicol
Pathol 35: 495-516.
Fargnoli MC, Argenziano G, Zalaudek I, Peris K. (2006) Highandlow-
penetrance cutaneous melanoma susceptibility genes. Expert Rev
Anticancer Ther. 6:657-670.
Fiori JL, Sanghvi M, O'Connell MP, Krzysik-Walker SM, Moaddel R,
Bernier M (2011). The cannabinoid receptor inverse agonist AM251
regulates the expression of the EGF receptor and its ligands via
destabilization of oestrogen-related receptor α protein. Br J Pharmacol 164:
1026-1040.
Fogli S, Nieri P, Chicca A, Adinolfi B, Mariotti V, Iacopetti P et al. (2006).
Cannabinoid derivatives induce cell death in pancreatic MIA PaCa-2 cells
via a receptor-independent mechanism. FEBS Lett 580: 1733-1739.
Follin-Arbelet V, Hofgaard PO, Hauglin H, Naderi S, Sundan A, Blomhoff
R et al. (2011). Cyclic AMP induces apoptosis in multiple myeloma cells
and inhibits tumor development in a mouse myeloma model. BMC Cancer
11: 301.
Gajewski TF, Schreiber H, Fu YX (2013) Innate and adaptive immune
cells in the tumor microenvironment. Nat Immunol. 14(10):1014-22.
Galve R, Chiurchiù V, Díaz-Alonso J, Bari M, Guzmán M, Maccarrone M
(2013) Cannabinoid receptor signaling in progenitor/stem cell proliferation
and differentiation. Prog Lipid Res. 52:633-50.
Gandini S, Sera F, Cattaruzza MS, Pasquini P, Zanetti R, Masini C et al.
(2005) Meta-analysis of risk factors for cutaneous melanoma: I. Common
and atypical naevi. Eur J Cancer. 41:28–44.
Gandini S, Sera F, Cattaruzza MS, Pasquini P, Zanetti R, Masini C et al.
(2005) Meta-analysis of risk factors for cutaneous melanoma: II. Sun
exposure. Eur J Cancer. 41:45–60.
Gandini S, Sera F, Cattaruzza MS, Pasquini P, Zanetti R, Masini C et al.
(2005) Meta-analysis of risk factors for cutaneous melanoma: III. Family
history, actinic damage and phenotypic factors. Eur J Cancer. 41:2040–
2059.
Garber K (2010) Industry makes strides in melanoma. Nature
Biotechnology 28:763–764.
75
Giannetti A, Tombelli S, Baldini F (2013) Oligonucleotide optical switches
for intracellular sensing. Anal Bioanal Chem 405:6181-6196.
Giles N, Pavey S, Pinder A, Gabrielli B (2012) Multiple melanoma
susceptibility factors function in an ultraviolet radiation response pathway
in skin. Br. J. Dermatol. 166:362-371.
Girouard SD, Murphy GF (2011) Melanoma stem cells: not rare, but well
done Lab. Invest. 91:647-64.
Globacan 2012, (2014) Available:
[http://globocan.iarc.fr/old/pie_site.asp?selection=16120&title=Melanoma
+of+skin&sex=0&type=0&populations=0&window=1&join=1&submit=%
C2%A0Execute%C2%A0] Accessed December 12, 2014.
Goggins WB, Tsao H. (2003) A population-based analysis of risk factors
for a second primary cutaneous melanoma among melanoma survivors.
Cancer. 97:639-643.
Gogvadze V, Robertson JD, Zhivotovsky B, Orrenius S (2001).
Cytochrome c release occurs via Ca2+-dependent and Ca2+-independent
mechanisms that are regulated by Bax. J Biol Chem 276: 19066-19071.
Graziani G, Tentori L, Navarra P. (2012) Ipilimumab: a novel
immunostimulatory monoclonal antibody for the treatment of cancer.
Pharmacol. Res. 65:9-22.
Groner B. Weiss A (2014) Targeting survivin in cancer: novel drug
development approaches. BioDrugs 28:27-39.
Grösch S, Maier TJ, Schiffmann S, Geisslinger G (2006). Cyclooxygenase-
2 (COX-2)-independent anticarcinogenic effects of selective COX-2
inhibitors. J Natl Cancer Inst 98: 736-747.
Grossman D, McNiff JM, Li F, Altieri DC (1999) Expression and targeting
of the apoptosis inhibitor, survivin, in human melanoma. J Invest Dermatol
113:1076-1081.
Grynkiewicz G, Poenie M, Tsien RY (1985). A new generation of Ca2+
indicators with greatly improved fluorescence properties. J Biol Chem 260:
3440–3450.
Gudbjartsson DF, Sulem P, Stacey SN, Goldstein AM, Rafnar T,
Sigurgeirsson B et al. (2008) ASIP and TYR pigmentation variants
associate with cutaneous melanoma and basal cell carcinoma. Nat Genet.
40:886-91.
Guertin DA, Sabatini DM (2009) The Pharmacology of mTOR Inhibition.
Sci Signal. 2 (67):24.
Gustafsson SB, Wallenius A, Zackrisson H, Popova D, Plym Forshell L,
Jacobsson SO (2013) Effects of cannabinoids and related fatty acids upon
the viability of P19 embryonal carcinoma cells. Arch Toxicol. 87:1939-51.
76
Halaban R (2005) Rb/E2F: a two-edged sword in the melanocytic system.
Cancer Metastasis Rev. 24:339-356.
Han SX, Jia X, Ma JL, Zhu Q (2013) Molecular beacons: a novel optical
diagnostic tool. Arch Immunol Ther Exp 61:139-148.
Hanaizi Z, Van Zwieten-boot B, Calvo G, Lopez AS, Van Dartel M,
Camarero J et al. (2012). The European Medicines Agency review of
ipilimumab (Yervoy) for the treatment of advanced (unresectable or
metastatic) melanoma in adults who have received prior therapy: summary
of the scientific assessment of the Committee for Medicinal Products for
Human Use. Eur. J. Cancer. 48:237-242.
Hardin, Bertoni, Kleinsmith (2012) Principles of Cell Biology Aviable:
[http://www.mun.ca/biology/desmid/brian/BIOL2060/BIOL2060-
19/19_39.jpg] Accessed December 12, 2014.
Harland M, Cust AE, Badenas C, Chang YM, Holland EA, Aguilera P
(2014) Prevalence and predictors of germline CDKN2A mutations for
melanoma cases from Australia, Spain and the United Kingdom.
Hereditary Cancer in Clinical Practice. 12:20.
Hartman MM, Czyz M (2013) Anti-apoptotic proteins on guard of
melanoma cell survival. Cancer Lett 331: 24-34.
Haskó J, Fazakas C, Molnár J, Nyúl-Tóth Á, Herman H, Hermenean A et
al., (2014) CB2 Receptor Activation Inhibits Melanoma Cell
Transmigration through the Blood-Brain Barrier. Int. J. Mol. Sci.
15(5):8063-8074.
Helfand M, Mahon S, Eden K. (2001) Screening for Skin Cancer [Internet].
Rockville (MD): Agency for Healthcare Research and Quality (US);
Report No.: 01-S002.U.S. Preventive Services Task Force Evidence
Syntheses, formerly Systematic Evidence Reviews.
Hennessy BT, Smith DL, Ram PT, Lu Y, Mills GB (2005) Exploiting the
PI3K/AKT Pathway for Cancer Drug Discovery. Nature Reviews Drug
Discovery 4:988-1004.
Herrera-Gonzalez NE (2013) Interaction Between the Immune System and
Melanoma, in Recent Advances in the Biology, Therapy and Management
of Melanoma. Eited Lester MD.
Hocker T, Tsao H (2007) Ultraviolet radiation and melanoma: a systematic
review and analysis of reported sequence variants. Hum. Mutat. 28: 578-
588.
Holderfield M, Deuker M, McCormick F, McMahon M (2014). Targeting
RAF kinases for cancer therapy: BRAF-mutated melanoma and beyond.
Nat Rev Cancer 14: 455-467.
77
Huang H, Wang X, Ding X, Xu Q, Hwang SK, Wang F et al. (2014). Effect
and mechanism of tacrolimus on melanogenesis on A375 human melanoma
cells. Chin Med J (Engl) 127: 2966-2971.
Huang SH, Wu LW, Huang AC, Yu CC, Lien JC, Huang YP et al. (2012).
Benzyl isothiocyanate (BITC) induces G2/M phase arrest and apoptosis in
human melanoma A375.S2 cells through reactive oxygen species (ROS)
and both mitochondria-dependent and death receptor-mediated multiple
signaling pathways. J Agric Food Chem 60: 665-675.
Hu-Lieskovan S, Robert L, Homet Moreno B, Ribas A (2014). Combining
targeted therapy with immunotherapy in BRAF-mutant melanoma: promise
and challenges. J Clin Oncol 32: 2248-2255.
Ibrahim N, Haluska FG (2009) Molecular pathogenesis of cutaneous
melanocytic neoplasms. Annu. Rev. Pathol. 4:551-579.
Ikeguchi M, Liu J, Kaibara N (2002) Expression of survivin mRNA and
protein in gastric cancer cell line (MKN-45) during cisplatin treatment.
Apoptosis 1:23-9.
Jemal A, Saraiya M, Patel P, Cherala SS, Barnholtz-Sloan J, Kim J et al.
(2011) Recent trends in cutaneous melanoma incidence and death rates in
the United States, 1992-2006. J Am Acad Dermatol. 65:S17-25.
Johns DG, Behm DJ, Walker DJ, Ao Z, Shapland EM, Daniels DA, et al.
(2007). The novel endocannabinoid receptor GPR55 is activated by
atypical cannabinoids but does not mediate their vasodilator effects. Br J
Pharmacol 152: 825-831.
Johnson JD, Young B (1996) Demographics of brain metastasis. Neurosurg
Clin N Am.7:337-44.
Kaneko N, Yamanaka K, Kita A, Tabata K, Akabane T, Mori M (2013)
Synergistic antitumor activities of sepantronium bromide (YM155), a
survivin suppressant, in combination with microtubule-targeting agents in
triple-negative breast cancer cells. Biol Pharm Bull 36:1921-7.
Kanwar JR, Kamalapuram SK, Kanwar RK (2013) Survivin signaling in
clinical oncology: a multifaceted dragon. Med Res Rev. 33:765-89.
Kapur A, Zhao P, Sharir H, Bai Y, Caron M, Barak L, et al. (2009).
Atypical responsiveness of the orphan receptor GPR55 to cannabinoid
ligands. J Biol Chem 284: 29817-29827.
Kapur A, Zhao P, Sharir Y, Caron M, Barak L, Abood M (2009) Atypical
responsiveness of the orphan receptor GPR55 to cannabinoid ligands. J
Biol Chem 284(43):29817-27.
Karbowniczek M, Spittle CS, Morrison T, Wu H, Henske EP (2008)
mTOR is activated in the majority of malignant melanomas. J. Invest.
Dermatol. 128:980-987.
78
Kauffmann RM, Chen SL (2014) Workup and staging of malignant
melanoma. Surg Clin North Am. 94:963-72.
Kolpashchikov DM (2012) An elegant biosensor molecular beacon probe:
challenges and recent solutions. Scientifica 2012:1-17.
Krzysik-Walker S, González-Mariscal I, Scheibye-Knudsen M, Indig F,
Bernier M (2013). The biarylpyrazole compound AM251 alters
mitochondrial physiology via proteolytic degradation of ERRα. Mol
Pharmacol 83: 157-166.
Lasithiotakis K, Leiter U, Meier F, Eigentler T, Metzler G, Moehrle M et
al. (2008) Age and gender are significant independent predictors of
survival in primary cutaneous melanoma. Cancer. 112:1795-1804.
Lee N, Barthel SR, Schatton T (2014) Melanoma Stem Cells and
Metastasis: Mimicking Hematopoietic Cell Trafficking? Lab Invest. 94:13–
30.
Li G, Chang H, Zhai YP, Xu W. (2013) Targeted silencing of inhibitors of
apoptosis proteins with siRNAs: a potential anti-cancer strategy for
hepatocellular carcinoma. Asian Pac J Cancer Prev. 14(9):4943-52.
Li H, Niederkon JY, Neelam S, Alizadeh H (2006) Downregulation of
survivin expression enhances sensitivity of cultured uveal melanoma cells
to cisplatin treatment. Exp Eye Res 83:176-182.
Ligresti A, Petrosino S, Di Marzo V (2009) From endocannabinoid
profiling to ’endocannabinoid therapeutics’. Curr. Opin. Chem. Biol.
13:321–331.
Madhunapantula SV, Robertson GP (2009) The PTEN-AKT3 signaling
cascade as a therapeutic target in melanoma. Pigment Cell Melanoma Res.
22: 400-419.
Madonna G, Ullman CD, Gentilcore G, Palmieri G, Ascierto PA (2012)
NF-kappaB as potential target in the treatment of melanoma. J. Transl.
Med. 10:53.
Martí RM, Sorolla A, Yeramian A (2012) New therapeutic targets in
melanoma. Actas. Dermosifiliogr. 103: 579-590.
McKenzie JA, Liu T, Goodson AG, Grossman D (2010) Survivin enhances
motility of melanoma cells by supporting Akt activation and {alpha}5
integrin upregulation. Cancer Res 70:7927-7937.
McKenzie JA, Liu T, Jung JY, Jones BB, Ekiz HA, Welm AL, et al. (2013)
Survivin promotion of melanoma metastasis requires upregulation of α5
integrin. Carcinogenesis 34:2137-2144.
Melero I, Hervas-stubbs S, Glennie M, Pardoll DM, Chen L (2007)
Immunostimulatory monoclonal antibodies for cancer therapy. Nature
Reviews Cancer. 7:95-106.
79
Merriam-Webster. Melanoma. Available: [http://www.merriam-
webster.com/medical/melanoma] Accessed December 12, 2014
Meyle KD, Guldberg P. (2009) Genetic risk factors for melanoma. Hum
Genet. 126:499-510.
Mihic LL, Bulat V, Situm M, Krolo I, Seserko A (2010) The role of
apoptosis in the pathogenesis of malignant melanoma. Coll. Antropol.
34:303-306.
Miller DM, Flaherty KT, Tsao H (2014) Current status and future
directions of molecularly targeted therapies and immunotherapies for
melanoma. Semin Cutan Med Surg. 33:60-7.
Mita AC, Mita MM, Nawrocki ST, Giles FJ (2008) Survivin: key regulator
of mitosis and apoptosis and novel target for cancer therapeutics. Clin
Cancer Res 14:5000-5005.
Molckovsky A, Siu LL (2008) First-in-class, first-in-human phase I results
of targeted agents: highlights of the 2008 American society of clinical
oncology meeting. J. Hematol. Oncol. 29:1-20.
Moriconi A, Cerbara I, Maccarrone M, Topai A (2010). GPR55: Current
knowledge and future perspectives of a purported "Type-3" cannabinoid
receptor. Curr Med Chem 17: 1411-1429.
Mouawad R, Sebert M, Michels J, Bloch J, Spano JP, Khayat D.(2010)
Treatment for metastatic malignant melanoma: old drugs and new
strategies. Crit Rev Oncol Hematol 74:27-39.
Na YR, Seok SH, Kim DJ, Han JH, Kim TH, Jung H et al., (2009) Isolation
and characterization of spheroid cells from human malignant melanoma
cell line WM-266-4. Tumor Biology 30:300-309.
National Cancer Istitute. Melanoma Anatomy. Available:
[https://visualsonline.cancer.gov/details.cfm?imageid=8284] Accessed
December 12, 2014.
National Cancer Istitute. Melanoma. Available:
[http://www.cancer.gov/cancertopics/types/melanoma] Accessed December
12, 2014 NCCN Guidelines–Melanoma –Version 1.2015.
Neri T, Cordazzo C, Carmazzi Y, Petrini S, Balìa C, Stefanelli F,
Brunelleschi S, Breschi MC, Pedrinelli R, Paggiaro P, Celi A (2012)
Effects of peroxisome proliferator-activated receptor-γ agonists on the
generation of microparticles by monocytes/macrophages. Cardiovasc Res.
94:537-44.
Nitin N, Santangelo PJ, Kim G, Nie S, Bao G (2004) Peptide linked
molecular beacons for efficient delivery and rapid mRNA detection in
living cells. Nucleic Acids Res 32:58.
Oehler B, Scholze A, Schaefer M, Hill K (2012). TRPA1 is functionally
expressed in melanoma cells but is not critical for impaired proliferation
80
caused by allyl isothiocyanate or cinnamaldehyde. Naunyn Schmiedebergs
Arch Pharmacol 385: 555-563.
Ozao-Choy J, Lee DJ, Faries MB (2014) Melanoma vaccines: mixed past,
promising future. Surg Clin North Am. 94:1017-30.
Patil M, Patwardhan A, Slas M, Hargreaves K, Akopian A (2011).
Cannabinoid receptor antagonists AM251 and AM630 activate TRPA1 in
sensory neurons. Neuropharmacology 61: 778-788.
Paul RK, Wnorowski A, Gonzalez-Mariscal I, Nayak SK, Pajak K,
Moaddel R et al. (2014). (R,R')-4'-methoxy-1-naphthylfenoterol targets
GPR55-mediated ligand internalization and impairs cancer cell motility.
Biochem Pharmacol 87: 547-556.
Peng XH, Cao ZH, Xia JT, Carlson GW, Lewis MM, Wood WC, Yang L
(2005) Real-time detection of gene expression in cancer cells using
molecular beacon imaging: new strategies for cancer research. Cancer Res
65:1909-17.
Pennati M, Folini M, Zaffaroni N. Targeting survivin in cancer therapy
(2008) Expert Opin Ther Targets 124:463-476.
Pertwee R (2010). Receptors and channels targeted by synthetic
cannabinoid receptor agonists and antagonists. Curr Med Chem 17: 1360-
1381.
Pertwee R, (2010) Receptors and channels targeted by synthetic
cannabinoid receptor agonists and antagonists. Curr Med Chem
17(14):1360-81.
Picard M, Pham Dang N, D'Incan M, Mansard S, Dechelotte P, Pereira B et
al. (2014). Is BRAF a prognostic factor in stage III skin melanoma? A
retrospective study of 72 patients after positive sentinel lymph node
dissection. Br J Dermatol 171: 108-114.
Piñeiro R, Maffucci T, Falasca M (2011). The putative cannabinoid
receptor GPR55 defines a novel autocrine loop in cancer cell proliferation.
Oncogene 30: 142-152.
Pisanti S, Picardi P, D’Alessandro A, Laezza C, Bifulco M (2013) The
endocannabinoid signaling system in cancer. Trends Pharmacol. Sci.
34:273–82.
Platz A, Egyhazi S, Ringborg U, Hansson J (2008) Human cutaneous
melanoma; a review of NRAS and BRAF mutation frequencies in relation
to histogenetic subclass and body site. Mol. Oncol. 1:395-405.
Populo H, Soares P, Faustino A, Rocha AS, Silva P, Azevedo F et al.
(2011) mTOR pathway activation in cutaneous melanoma is associated
with poorer prognosis characteristics. Pigment Cell Melanoma Res. 24:
254-257.
Porta C, Paglino C, Mosca A (2014) Targeting PI3K/Akt/mTOR Signaling
in Cancer. Front Oncol. 4:64.
81
Pucci M, Pasquariello N, Battista N, Di Tommaso M, Rapino C, Fezza F et
al., (2012) Endocannabinoids stimulate human melanogenesis via type-1
cannabinoid receptor. J Biol Chem. 287(19):15466-78.
Quintana E, Shackleton M, Sabel MS, Fullen DR, Johnson TM, Morrison
SJ (2008) Efficient tumour formation by single human melanoma cells.
Nature. 456:593-598.
Raffa R, Ward S (2012). CB₁-independent mechanisms of Δ⁹-THCV,
AM251 and SR141716 (rimonabant). J Clin Pharm Ther 37: 260-265.
Repetto G, del Peso A, Zurita JL (2008) Neutral red uptake assay for the
estimation of cell viability/cytotoxicity. Nat Protoc. 3(7):1125-31.
Ribas A, Kefford R, Marshall MA, Punt CJA, Haanen JB, Marmol M et al.
(2013) Phase III Randomized Clinical Trial Comparing Tremelimumab
With Standard-of-Care Chemotherapy in Patients With Advanced
Melanoma. J Clin Oncol. 31:616-622.
Rigel DS (2010) Trends in dermatology: melanoma incidence. Arch
Dermatol 146:318.
Ross R (2009) The enigmatic pharmacology of GPR55. Trends Pharmacol
Sci 30(3):156-63.
Ryan MB, O'Donovan N, Duffy MJ (2009) Survivin: a new target for anti-
cancer therapy. Cancer Treat Rev 35:553-562.
Ryberg E, Larsson N, Sjögren S, Hjorth S, Hermansson NO, Leonova J et
al. (2007). The orphan receptor GPR55 is a novel cannabinoid receptor. Br
J Pharmacol 152: 1092-1101.
Sánchez MG, Ruiz-Llorente L, Sánchez AM, Díaz-Laviada I (2003)
Activation of phosphoinositide 3-kinase/PKB pathway by CB(1) and CB(2)
cannabinoid receptors expressed in prostate PC-3 cells. Involvement in
Raf-1 stimulation and NGF induction. Cell Signal. 15:851-9.
Santangelo P, Nitin N, Bao G (2006) Nanostructured probes for RNA
detection in living cells. Ann biomed eng 34:39-50.
Santangelo PJ, Nix B, Tsourkas A, Bao G (2004) Dual FRET molecular
beacons for mRNA detection in living cells. Nucleic Acids Res 32:57.
Santini R, Pietrobono S, Pandolfi S, Montagnani V, D'Amico M,
Penachioni JY et al., (2014) SOX2 regulates self-renewal and
tumorigenicity of human melanoma-initiating cells. Oncogene. 33:4697-
708.
Santini R, Vinci MC, Pandolfi S, Penachioni JY, Montagnani V, Olivito B
et al., (2012) Hedgehog-GLI signaling drives self-renewal and
tumorigenicity of human melanoma-initiating cells. Stem Cells. 30:1808-
18.
82
Sarbassov DD, Ali SM, Kim DH, Guertin DA, Latek RR, Erdjument-
Bromage H et al. (2004) Rictor, a novel binding partner of mTOR, defines
a rapamycin-insensitive and raptorindependent pathway that regulates the
cytoskeleton. Curr Biol 14:1296–302.
Schatton T, Frank M.H.(2008) Cancer stem cells and human malignant
melanoma. Pigment Cell Melanoma Res. 21:39-55.
Schwartzentruber DJ, Lawson DH, Richards JM, et al. (2011) gp100
peptide vaccine and interleukin-2 in patients with advanced melanoma. N
Engl J Med. 364:2119–27.
Seely K Brents LK, Franks LN, Rajasekaran M, Zimmerman SM,
Fantegrossi WE, et al. (2012). AM-251 and rimonabant act as direct
antagonists at mu-opioid receptors: implications for opioid/cannabinoid
interaction studies. Neuropharmacology 63: 905-915.
Sekulic A, Haluska PJr, Miller AJ, Genebriera De Lamo JES, Pulido JS et
al. (2008) Malignant melanoma in the 21st century: the emerging
molecular landscape. Mayo. Clin. Proc. 83:825-846.
Shakhova O (2014) Neural crest stem cells in melanoma development.
Curr Opin Oncol. 26:215-221.
Sharir H, Abood M (2010) Pharmacological characterization of GPR55, a
putative cannabinoid receptor. Pharmacol Ther 126(3):301-13.
Sharir H, Abood M (2010). Pharmacological characterization of GPR55, a
putative cannabinoid receptor. Pharmacol Ther 126: 301-313.
Shi W, Li J, Bao Q, Wu J, Ge L, Zhu L, Wang Y, Zhu W (2014) Survivin
mRNA expression in blood as a predictor of the response to EGFR-tyrosine
kinase inhibitors and prognosis in patients with non-small cell lung cancer.
Med Oncol 31:893.
Siegel R, Ma J, Zou Z, Jemal A (2014) Cancer statistics, 2014. CA Cancer
J Clin. 64:9-29.
Sinha R, Kim GJ, Nie S, Shin DM (2006) Nanotechnology in cancer
therapeutics: bioconjugated nanoparticles for drug delivery. Mol Cancer
Ther 5:1909-17.
Smalley KS (2010) Understanding melanoma signaling networks as the
basis for molecular targeted therapy. J. Invest. Dermatol. 130:28-37.
Sosman J, Unger J, Liu P, et al. (2002) Adjuvant immunotherapy of
resected, intermediate-thickness, node-negative melanoma with an
allogeneic tumor vaccine: impact of HLA class I antigen expression on
outcome. J Clin Oncol. 20:2067–75.
Stahl JM, Cheung M, Sharma A, Trivedi NR, Shanmugam S, Robertson
GP (2003) Loss of PTEN promotes tumor development in malignant
melanoma. Cancer Res. 63:2881-2890.
83
Stahl JM, Sharma A, Cheung M, Zimmerman M, Cheng JQ, Bosenberg
MW et al. (2004) Deregulated Akt3 activity promotes development of
malignant melanoma. Cancer Res. 64:7002-7010.
Stecca B, Santini R, Pandolfi S, Penachioni JY (2013) Culture and isolation
of melanoma-initiating cells. Curr Protoc Stem Cell Biol. 3,6
Sullivan RJ, Flaherty KT (2013) Resistance to BRAF-targeted therapy in
melanoma. Eur J Cancer. 49:1297-1304.
Szafer-Glusman E, Fuller M, Giansanti M (2011) Role of survivin in
cytokinesis revealed by a separation of function allele. Mol Biol Cell
20:3779-2790.
Takeuchi H, Morton DL, Elashoff D, Hoon DSB (2005) Survivin
expression by metastatic melanoma predicts poor disease outcome in
patients receiving adjuvant polyvalent vaccine. Int J Cancer 117:1032-8.
Tarhini AA, Edington H, Butterfield LH, Sinha M, Moschos SJ, Tawbi H,
Shuai Y (2011) Neoadjuvant ipilimumab in patients with stage IIIB/C
melanoma: immunogenicity and biomarker analysis. J. Clin. Oncol. 29:
8536.
Tsao H, Atkins MB, Sober AJ. (2004) Management of cutaneous
melanoma. N Engl J Med. 351:998–1012.
Tseng HW, Li WT, Hsieh JF (2013) Targeted Agents for the Treatment of
Melanoma: An Overview, in Recent Advances in the Biology, Therapy and
Management of Melanoma. Eited Lester MD.
Uzdensky AB, Demyanenko SV, Bibov MY (2013) Signal Transduction in
Human Cutaneous Melanoma and Target Drugs. Curr Cancer Drug
Targets. 13:843-866.
Vainio H, Miller AB, Bianchini F. (2000) An international evaluation of
the cancer-preventive potential of sunscreens. Int J Cancer. 88:838-42.
Vong Q, Cao K, Li H, Iglesias P, Zheng Y (2005) Chromosome alignement
and segregation regulated by ubiquitination of survivin. Science 310:1499-
1505.
Wang Q, Chen L, Long Y, Tian H, Wu J (2013) Molecular beacons of
xeno-nucleic acid for detecting nucleic acid. Theranostics 3:395-408.
Wei G, Wang S, Cui S, Guo J, Liu Y, Liu Y, et al. (2014). Synthesis and
evaluation of the anticancer activity of albiziabioside A and its analogues
as apoptosis inducers against human melanoma cells. Org Biomol Chem
12: 5928-5935.
Weinstock MA (2012) Reducing death from melanoma and standards of
evidence. J Invest Dermatol. 132: 1311-1312.
Wolchok JD (2014) Melanoma Aviable:
[http://www.cancerresearch.org/cancer-immunotherapy/impacting-all-
cancers/melanoma] Accessed: December 12, 2014.
84
Woods D, Cherwinski H, Venetsanakos E, Bhat A, Gysin S, Humbert M et
al. (2001) Induction of beta3-integrin gene expression by sustained
activation of the Ras-regulated Raf-MEK-extracellular signal-regulated
kinase signaling pathway. Mol. Cell. Biol. 21:319-3205.
Yamanaka K, Nakahara T, Yamauchi T, Kita A, Takeuchi M, Kiyonaga F,
et al. (2011) Antitumor activity of YM155, a selective small-molecule
survivin suppressant, alone and in combination with docetaxel in human
malignant melanoma models. Clin Cancer Res 17:5423-5431.
Yamashita A, Oka S, Tanikawa T, Hayashi Y, Nemoto-Sasaki Y, Sugiura
T (2013). The actions and metabolism of lysophosphatidylinositol, an
endogenous agonist for GPR55. Prostaglandins Other Lipid Mediat 107:
103-116.
Yang H, Fu JH, Hu Y, Huang WZ, Zheng B, Wang G, et al. (2008)
Influence of siRNA targetingsurvivin on chemosensitivity of H460/cDDP
lung cancer cells. J Int Med Res 36:734-747.
Zhao Z, Yang J, Zhao H, Fang X, Li H. (2012) Cannabinoid receptor 2 is
upregulated in melanoma. J Cancer Res Ther. 8(4):549-54.
Zheng W, Chen H, Yuan S, Wu L, Zhang W, Sun H, et al. (2012)
Overexpression of βIII-tubulin and survivin associated with drug resistance
to docetaxel-based chemotherapy in advanced gastric cancer. J Buon
17:284-290.
Zhou L, Chen Z, Wang F, Yang X, Zhang B (2013) Multifunctional
triblock co-polymer mP3/4HB-b-PEG-b-lPEI for efficient intracellular
siRNA delivery and gene silencing. Acta Biomater. 9(4):6019-31.


![Surgical Management of Primary Cutaneous Mucinous Carcinoma · represents 0.005% of all malignant epithelial neoplasms [1]. These adnexal tumours have been thought to be of eccrine](https://img.pdfslide.net/doc/110x75/5f0b6f0f7e708231d4307f6a/surgical-management-of-primary-cutaneous-mucinous-represents-0005-of-all-malignant.jpg)