Embed Size (px)
Citation preview
Technical Report Documentation Page 1. Report No. FHWA/TX-06/0-4774-1
2. Government Accession No.
3. Recipient's Catalog No.
4. Title and Subtitle NEW TECHNOLOGIES FOR EVALUATING FLEXIBLE PAVEMENT CONSTRUCTION: YEAR 1 REPORT
5. Report Date November 2004 Resubmitted: January 2006 Resubmitted: April 2006 Published: June 2006
6. Performing Organization Code
7. Author(s) Stephen Sebesta, Cindy Estakhri, Tom Scullion, and Wenting Liu
8. Performing Organization Report No. Report 0-4774-1 10. Work Unit No. (TRAIS)
9. Performing Organization Name and Address Texas Transportation Institute The Texas A&M University System College Station, Texas 77843-3135
11. Contract or Grant No. Project 0-4774 13. Type of Report and Period Covered Technical Report: September 2003-August 2004
12. Sponsoring Agency Name and Address Texas Department of Transportation Research and Technology Implementation Office P. O. Box 5080 Austin, Texas 78763-5080
14. Sponsoring Agency Code
15. Supplementary Notes Project performed in cooperation with the Texas Department of Transportation and the Federal Highway Administration. Project Title: New Technologies and Approaches to Controlling the Quality of Flexible Pavement Construction URL: http://tti.tamu.edu/documents/0-4774-1.pdf 16. Abstract Historically in Texas, acceptance of flexible pavement layers has been based upon density control, where the density of the layer must meet or exceed some minimum value. The Texas Department of Transportation (TxDOT) utilizes the nuclear density gauge to perform this acceptance testing for subgrade and base layers. However, TxDOT desires to find a non-nuclear method for measuring density; additionally, TxDOT desires to investigate the feasibility of a fundamental shift from density to mechanistic properties for acceptance. This report describes the search for a replacement for the nuclear gauge and also summarizes new techniques that could potentially be used for acceptance of flexible pavement construction. Currently no direct replacement exists for the nuclear density gauge; the most similar devices are the Pavement Quality Indicator and the Pavetracker Plus. However, these two devices are only applicable to hot-mix asphalt layers and are best suited for measuring differential density. Several systems exist that are not density-based that potentially could control flexible pavement construction. These systems include the Vertek and AquaPro moisture probes, the portable falling weight deflectometer, the dynamic cone penetrometer, instrumented vibratory rollers, automated proof rollers, ground-penetrating radar, and infrared imaging. The latter four systems provide near 100 percent coverage and could serve as screening tools to identify where to perform spot tests. This report describes preliminary testing of the most promising systems and outlines a framework for continued testing with the most promising devices for use during the remainder of this project. 17. Key Words Quality Control, Quality Assurance, Flexible Pavements, Pavement Density, Soil Moisture Content
18. Distribution Statement No restrictions. This document is available to the public through NTIS: National Technical Information Service Springfield, Virginia 22161 http://www.ntis.gov
19. Security Classif.(of this report) Unclassified
20. Security Classif.(of this page) Unclassified
21. No. of Pages 48
22. Price
Form DOT F 1700.7 (8-72) Reproduction of completed page authorized

NEW TECHNOLOGIES FOR EVALUATING FLEXIBLE PAVEMENT CONSTRUCTION: YEAR 1 REPORT
by
Stephen Sebesta Associate Transportation Researcher
Texas Transportation Institute
Cindy Estakhri, P.E. Program Manager
Texas Transportation Institute
Tom Scullion, P.E. Research Engineer
Texas Transportation Institute
and
Wenting Liu, P.E. Associate Research Scientist
Texas Transportation Institute
Report 0-4774-1 Project Number 0-4774
Project Title: New Technologies and Approaches to Controlling the Quality of Flexible Pavement Construction
Performed in cooperation with the Texas Department of Transportation
and the Federal Highway Administration
Resubmitted: April 2006
TEXAS TRANSPORTATION INSTITUTE The Texas A&M University System College Station, Texas 77843-3135

v
DISCLAIMER
The contents of this report reflect the views of the authors, who are responsible for the
facts and the accuracy of the data presented herein. The contents do not necessarily reflect the
official views or policies of the Texas Department of Transportation or the Federal Highway
Administration. The United States Government and the State of Texas do not endorse products
or manufacturers. Trade or manufacturers’ names appear herein solely because they are
considered essential to the object of this report. This report does not constitute a standard,
specification, or regulation. The engineer in charge was Tom Scullion, P.E. (Texas, # 62683).
vi
ACKNOWLEDGMENTS
This project was made possible by the Texas Department of Transportation and the
Federal Highway Administration. Special thanks must be extended to Mike Arellano, P.E., for
serving as the project director, and Lynn Passmore, P.E., for serving as the program coordinator.
The following project advisors also provided valuable input throughout the course of the project:
• Darlene Goehl, P.E.
• James Klotz, P.E.
• Frank Phillips, P.E.
• Amitis Meshkani
• Walter Smith, P.E.
vii
TABLE OF CONTENTS
Page List of Figures .............................................................................................................................. viii
List of Tables ................................................................................................................................. ix
Executive Summary ........................................................................................................................1
Chapter 1. Search for New Technologies .......................................................................................3
Summary .....................................................................................................................................3
Potential Replacements for Measuring Moisture and Density ....................................................3
Technologies for Measuring Mechanistic Properties ................................................................12
Full Coverage QC/QA Systems .................................................................................................16
Recommended Systems for Future Work ..................................................................................19
Chapter 2. Controlled Tests of New Devices................................................................................21
Summary ...................................................................................................................................21
Controlled Tests at Riverside Campus.......................................................................................21
Laboratory Testing with New Moisture-Measurement Systems ...............................................22
Conclusions from Controlled Testing........................................................................................26
Chapter 3. Field Testing on SH 40................................................................................................27
Summary ..................................................................................................................................27
Description of Construction Site................................................................................................27
Results from Ammann ACE Roller ...........................................................................................28
Results from Verification Testing..............................................................................................29
Conclusions from Test Site........................................................................................................30
Chapter 4. Recommendations for Future Project Efforts..............................................................31
Summary ...................................................................................................................................31
Recommended Devices for Future Efforts ................................................................................31
Recommended Approach to Instrumented Vibratory Rollers ...................................................32
Recommended Data Collection and Evaluation Plan for Future Work.....................................36
Conclusions ...............................................................................................................................37
viii
LIST OF FIGURES Figure Page 1.1. Sand Cone Test ....................................................................................................................4
1.2. Density Tube Sampler..........................................................................................................5
1.3. Speedy Moisture Tester .......................................................................................................6
1.4. Adek Down Hole Dielectric Probe ......................................................................................7
1.5. AquaPro Moisture Probe......................................................................................................9
1.6. Vertek SMR Probe.............................................................................................................10
1.7. Pavement Quality Indicator ...............................................................................................11
1.8. Pavetracker Plus.................................................................................................................12
1.9. Soil Compaction Supervisor ..............................................................................................13
1.10. Single-Sensor PFWD.........................................................................................................14
1.11. Testing with Dynamic Cone Penetrometer ........................................................................15
1.12. Automated Proof Rolling Concept.....................................................................................17
1.13. Three-Channel GPR System..............................................................................................18
1.14. TTI’s Infrared Temperature Bar ........................................................................................19
2.1. Mixing Soil for Laboratory Calibration of Moisture Probes .............................................23
2.2. Tamping Mixed Soil in Preparation for Testing with Moisture Probes.............................23
2.3. Installing Vertek Probe into Prepared Calibration Bucket ................................................24
2.4. Collecting AquaPro Readings in Prepared Calibration Bucket .........................................24
2.5. Collecting Control Sample from Soil Moisture Calibration Bucket..................................25
2.6. True Moisture Content versus AquaPro Readings for Sand Soil Calibration ...................26
3.1. Ammann ACE-Equipped Vibratory Roller .......................................................................27
3.2. Main Components of Ammann Instrumentation System...................................................28
3.3. Example Data from Ammann Roller on SH 40 .................................................................29
4.1. Accelerometer Instrumentation System for Vibratory Rollers ..........................................33
4.2. TTI Roller Instrumentation System in Operation on Construction Site ............................33
4.3. Frequencies of Accelerometer Response on Instrumented Roller .....................................34
4.4. Raw (top) versus Filtered (bottom) Instrumented Roller Data ..........................................34
4.5. Total Displacement of Vibratory Roller Drum with Distance...........................................35
ix
LIST OF TABLES Table Page 2.1. Results from Preliminary Testing at Riverside Campus with New Devices .....................22
2.2. Results from Laboratory Calibration of Moisture Probes to Sandy Soil ...........................25
3.1. Spot Test Results on SH 40 ...............................................................................................29
4.1. Summary of Recommended Devices for Future Efforts....................................................32

1
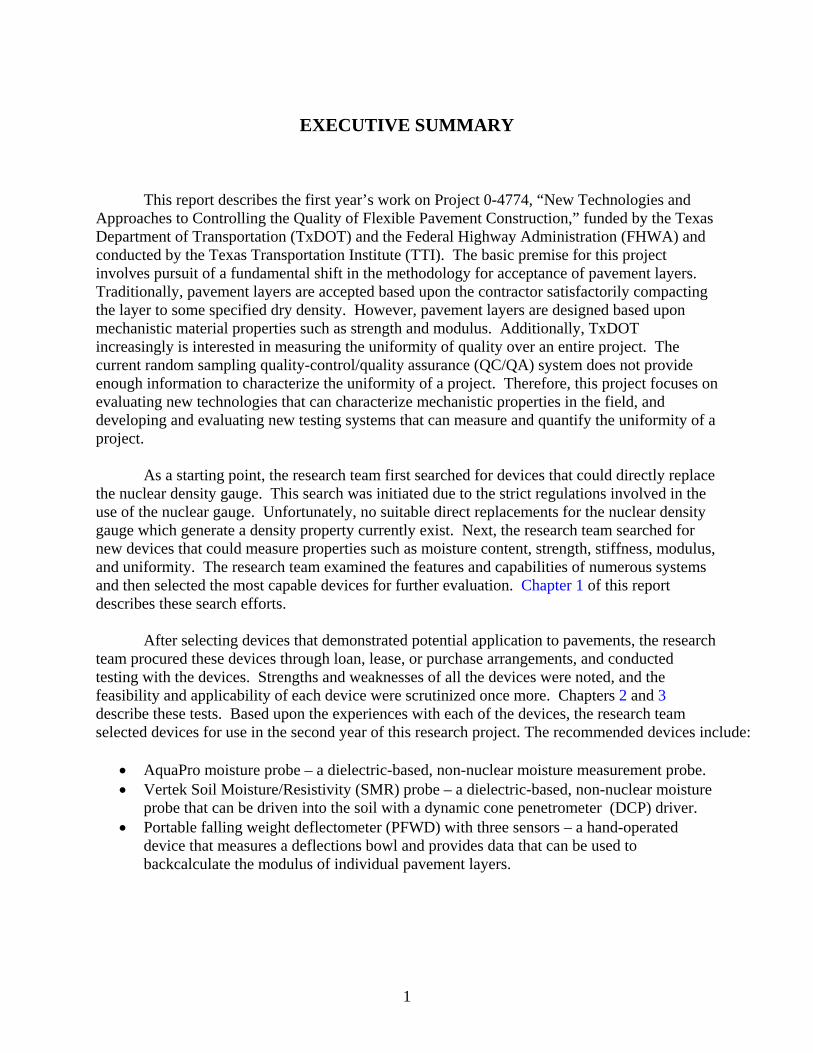
EXECUTIVE SUMMARY
This report describes the first year’s work on Project 0-4774, “New Technologies and
Approaches to Controlling the Quality of Flexible Pavement Construction,” funded by the Texas Department of Transportation (TxDOT) and the Federal Highway Administration (FHWA) and conducted by the Texas Transportation Institute (TTI). The basic premise for this project involves pursuit of a fundamental shift in the methodology for acceptance of pavement layers. Traditionally, pavement layers are accepted based upon the contractor satisfactorily compacting the layer to some specified dry density. However, pavement layers are designed based upon mechanistic material properties such as strength and modulus. Additionally, TxDOT increasingly is interested in measuring the uniformity of quality over an entire project. The current random sampling quality-control/quality assurance (QC/QA) system does not provide enough information to characterize the uniformity of a project. Therefore, this project focuses on evaluating new technologies that can characterize mechanistic properties in the field, and developing and evaluating new testing systems that can measure and quantify the uniformity of a project.
As a starting point, the research team first searched for devices that could directly replace
the nuclear density gauge. This search was initiated due to the strict regulations involved in the use of the nuclear gauge. Unfortunately, no suitable direct replacements for the nuclear density gauge which generate a density property currently exist. Next, the research team searched for new devices that could measure properties such as moisture content, strength, stiffness, modulus, and uniformity. The research team examined the features and capabilities of numerous systems and then selected the most capable devices for further evaluation. Chapter 1 of this report describes these search efforts.
After selecting devices that demonstrated potential application to pavements, the research
team procured these devices through loan, lease, or purchase arrangements, and conducted testing with the devices. Strengths and weaknesses of all the devices were noted, and the feasibility and applicability of each device were scrutinized once more. Chapters 2 and 3 describe these tests. Based upon the experiences with each of the devices, the research team selected devices for use in the second year of this research project. The recommended devices include:
• AquaPro moisture probe – a dielectric-based, non-nuclear moisture measurement probe. • Vertek Soil Moisture/Resistivity (SMR) probe – a dielectric-based, non-nuclear moisture
probe that can be driven into the soil with a dynamic cone penetrometer (DCP) driver. • Portable falling weight deflectometer (PFWD) with three sensors – a hand-operated
device that measures a deflections bowl and provides data that can be used to backcalculate the modulus of individual pavement layers.
2
• Dynamic cone penetrometer – a device with a conical tip that is driven into the soil and traditionally used to measure bearing capacity, but has been related to modulus and Texas Triaxial Classification.
• Instrumented vibratory roller – a system utilizing an accelerometer on the arm of a vibrating smooth-drum roller to measure displacement of the roller drum. Such a system can potentially measure the uniformity and stiffness properties of a project.
• Automated proof roller – a system utilizing sensors to automatically measure the rut depth resulting from a proof rolling operation. Such a system potentially can measure uniformity and evaluate the stability/strength properties of a project.
• Ground-penetrating radar (GPR) – a system traditionally used for measuring layer thicknesses, GPR shows promise for evaluating the uniformity of a project and can potentially measure moisture content of soils and bases. Additionally, GPR can measure hot-mix asphalt (HMA) density.
• Pavement Quality Indicator (PQI) – a hand-held, dielectric-based spot-measurement system for HMA pavement density. This device particularly shows promise for use in TxDOT density profile and joint density testing operations.
• Pavetracker Plus - a new dielectric-based spot-measurement system for HMA pavement density that potentially has identical application as the PQI.
• Infrared imaging - a technology that provides the ability to measure the uniformity of HMA paving operations.
• TxDOT falling weight deflectometer – TxDOT’s standard field tool for structural evaluation of pavements, this device potentially could be used as a final quality assurance check on a completed pavement structure. Additionally, the level of coverage with this device could provide enough information to evaluate uniformity of the project.
The research team recommends the primary focus of future work on this project consist of further development of systems that provide virtually 100 percent coverage. These systems include instrumented vibratory rollers, automated proof rollers, ground-penetrating radar, and infrared imaging. TTI has operating instrumented roller, GPR, and infrared imaging systems, and the components to create an automated proof rolling system. The second phase of this project should focus on evaluating a system of controlling flexible pavement construction where a 100 percent coverage device is first used on the section. After analysis in the field of the 100 percent coverage data, the research team will perform spot tests at specific locations to evaluate what changes in material properties exist. Finally, the team will make efforts to collect field samples for laboratory testing. These samples will be used to evaluate the relationship between field test data and laboratory properties. In this manner, the research team will evaluate a model system that could control future construction projects.
3
CHAPTER 1
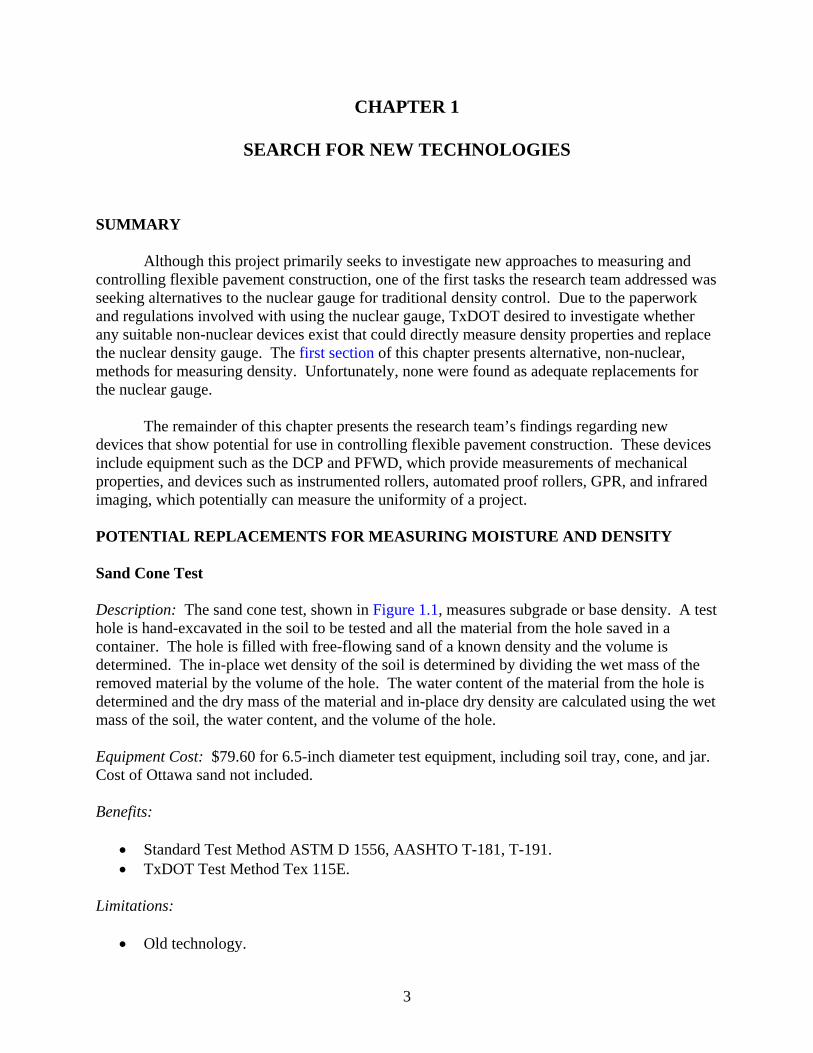
SEARCH FOR NEW TECHNOLOGIES SUMMARY Although this project primarily seeks to investigate new approaches to measuring and controlling flexible pavement construction, one of the first tasks the research team addressed was seeking alternatives to the nuclear gauge for traditional density control. Due to the paperwork and regulations involved with using the nuclear gauge, TxDOT desired to investigate whether any suitable non-nuclear devices exist that could directly measure density properties and replace the nuclear density gauge. The first section of this chapter presents alternative, non-nuclear, methods for measuring density. Unfortunately, none were found as adequate replacements for the nuclear gauge. The remainder of this chapter presents the research team’s findings regarding new devices that show potential for use in controlling flexible pavement construction. These devices include equipment such as the DCP and PFWD, which provide measurements of mechanical properties, and devices such as instrumented rollers, automated proof rollers, GPR, and infrared imaging, which potentially can measure the uniformity of a project. POTENTIAL REPLACEMENTS FOR MEASURING MOISTURE AND DENSITY Sand Cone Test Description: The sand cone test, shown in Figure 1.1, measures subgrade or base density. A test hole is hand-excavated in the soil to be tested and all the material from the hole saved in a container. The hole is filled with free-flowing sand of a known density and the volume is determined. The in-place wet density of the soil is determined by dividing the wet mass of the removed material by the volume of the hole. The water content of the material from the hole is determined and the dry mass of the material and in-place dry density are calculated using the wet mass of the soil, the water content, and the volume of the hole. Equipment Cost: $79.60 for 6.5-inch diameter test equipment, including soil tray, cone, and jar. Cost of Ottawa sand not included. Benefits:
• Standard Test Method ASTM D 1556, AASHTO T-181, T-191. • TxDOT Test Method Tex 115E.
Limitations:
• Old technology.
4
• Labor intensive (takes about 10 minutes per test). • Highly plastic soils could deform or compress during excavation of test hole. • Some granular materials may not maintain stable sides in test hole. • Not suitable for granular materials with high void ratios.
Recommendations: The sand cone test is not recommended for further testing because it was viewed as a step backwards and requires much more labor and time to perform. Additionally, in an emergency situation (if nuclear gauges were banned), standard test methods already exist with this device.
Figure 1.1. Sand Cone Test. Balloon Density Test Description: The balloon density test measures density of subgrade and base materials. Similar to the sand cone method, a soil sample is removed, weighed and dried, then weighed again and the moisture content determined. The volume of the hole is measured by forcing water into a balloon to fill the hole and then reading the volume on a graduated cylinder. Equipment Cost: $416.00. Benefits:
• Standard Test Method ASTM D 2167, AASHTO T-205. Limitations: Same as sand cone. Recommendations: The balloon density test is not recommended for further testing because of its labor intensiveness and outdated methodology.
5
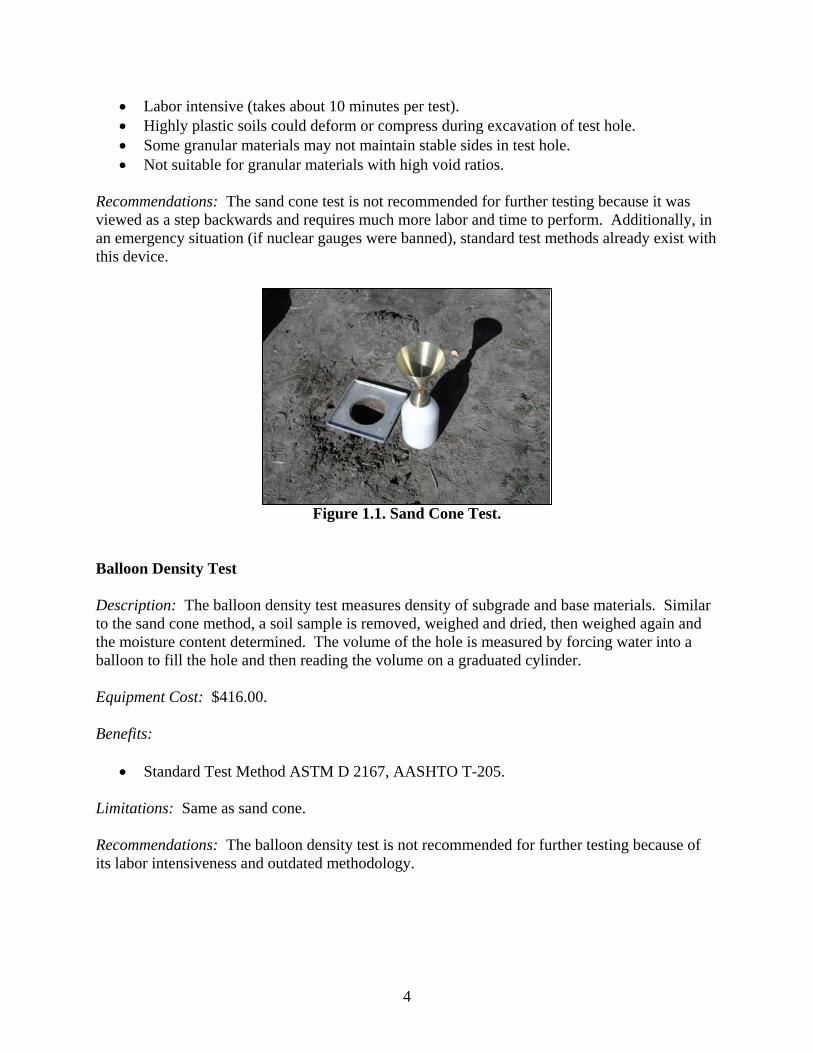
Density Tube Sampler Description: The density tube sampler, shown in Figure 1.2, measures the in-place density of subgrade materials. A relatively undisturbed soil sample is obtained by driving a thin-walled cylinder of known volume into the soil with a dropping weight. Next, the sample is trimmed even with the ends of the sampling cylinder, providing a sample of known volume. Finally, the moisture content of the sample is measured and dry density computed. Equipment Cost: $292.00 (includes 4-inch density tube sampler and 10 sample tubes). Benefits:
• ASTM D 2937, AASHTO T-20. • Direct measure of density. • Simple and inexpensive.
Limitations:
• Driven tube cannot easily penetrate very hard natural soils or heavily compacted soils. • The cylinder may not readily retain soils of low plasticity. • The presence of particles coarser than 3/16-inch may introduce significant errors in
density measurements by causing voids along the wall of the cylinder during driving, and when coarse materials have to be dislodged by the trimming of the sample obtained by the cylinder.
• For rapid estimation of density, a quick measurement of moisture content is needed. Recommendations: The density tube sampler is recommended for further investigation because of its inherent simplicity and relatively minimal time required to collect the test sample.
Figure 1.2. Density Tube Sampler.
6
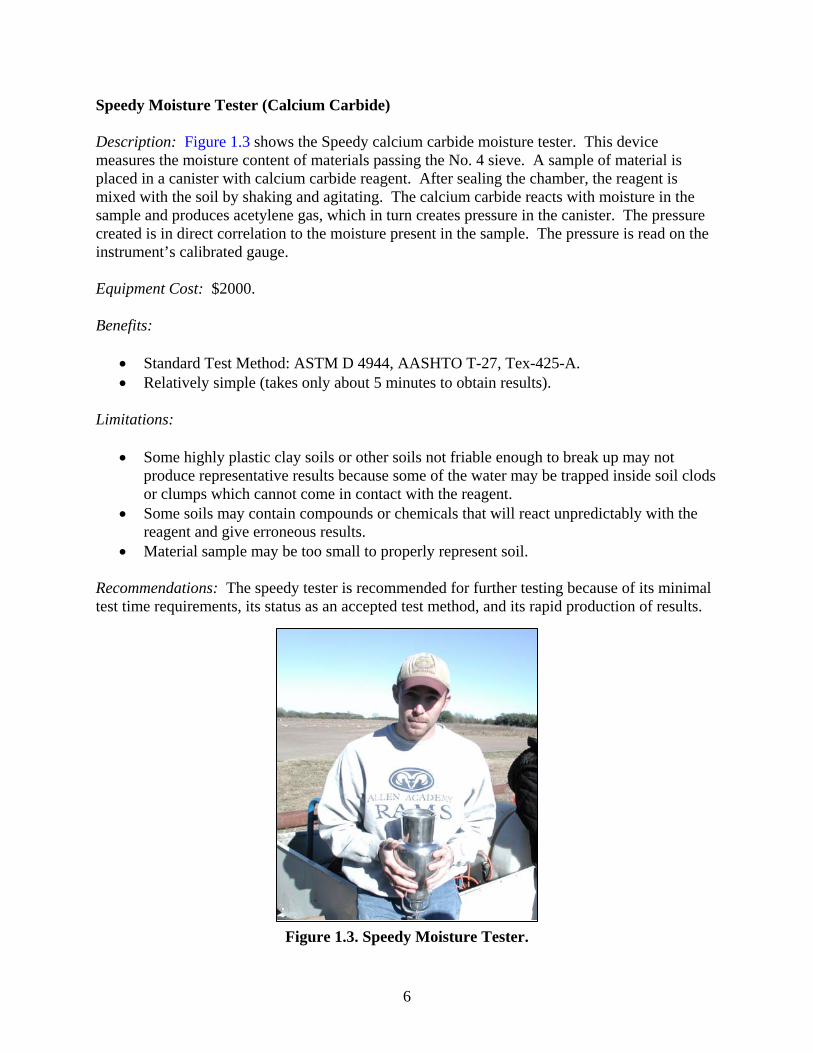
Speedy Moisture Tester (Calcium Carbide) Description: Figure 1.3 shows the Speedy calcium carbide moisture tester. This device measures the moisture content of materials passing the No. 4 sieve. A sample of material is placed in a canister with calcium carbide reagent. After sealing the chamber, the reagent is mixed with the soil by shaking and agitating. The calcium carbide reacts with moisture in the sample and produces acetylene gas, which in turn creates pressure in the canister. The pressure created is in direct correlation to the moisture present in the sample. The pressure is read on the instrument’s calibrated gauge. Equipment Cost: $2000. Benefits:
• Standard Test Method: ASTM D 4944, AASHTO T-27, Tex-425-A. • Relatively simple (takes only about 5 minutes to obtain results).
Limitations:
• Some highly plastic clay soils or other soils not friable enough to break up may not produce representative results because some of the water may be trapped inside soil clods or clumps which cannot come in contact with the reagent.
• Some soils may contain compounds or chemicals that will react unpredictably with the reagent and give erroneous results.
• Material sample may be too small to properly represent soil. Recommendations: The speedy tester is recommended for further testing because of its minimal test time requirements, its status as an accepted test method, and its rapid production of results.
Figure 1.3. Speedy Moisture Tester.
7
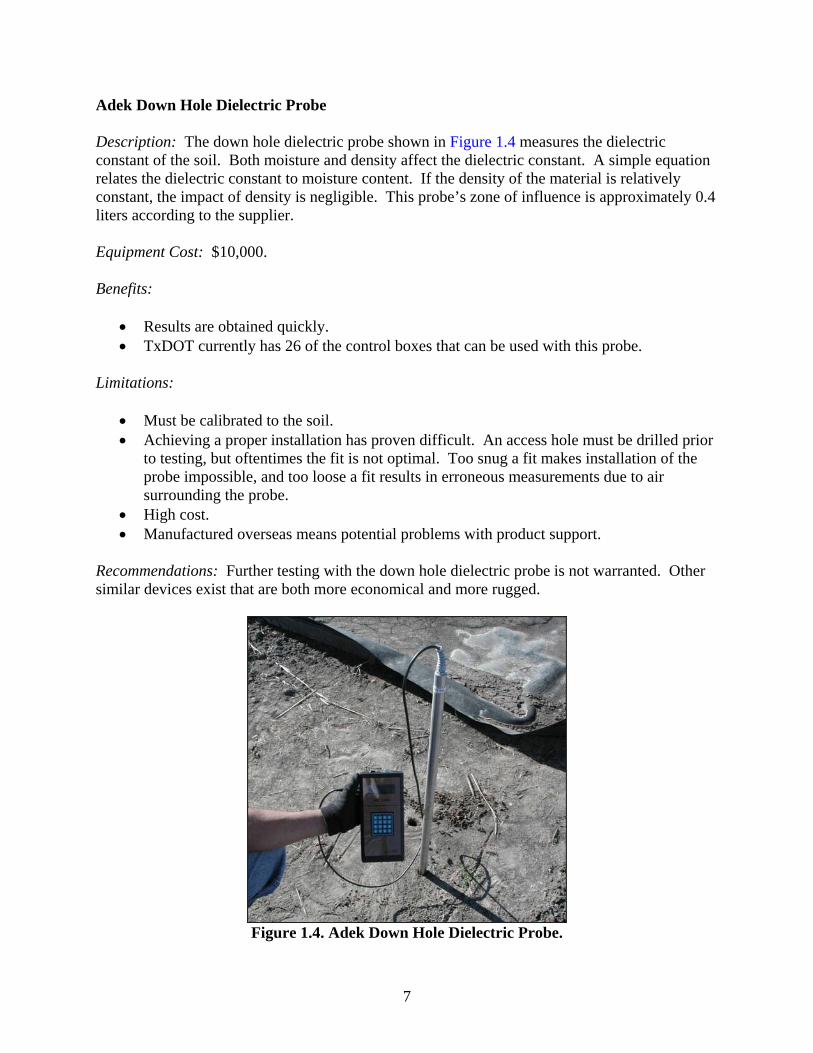
Adek Down Hole Dielectric Probe Description: The down hole dielectric probe shown in Figure 1.4 measures the dielectric constant of the soil. Both moisture and density affect the dielectric constant. A simple equation relates the dielectric constant to moisture content. If the density of the material is relatively constant, the impact of density is negligible. This probe’s zone of influence is approximately 0.4 liters according to the supplier. Equipment Cost: $10,000. Benefits:
• Results are obtained quickly. • TxDOT currently has 26 of the control boxes that can be used with this probe.
Limitations:
• Must be calibrated to the soil. • Achieving a proper installation has proven difficult. An access hole must be drilled prior
to testing, but oftentimes the fit is not optimal. Too snug a fit makes installation of the probe impossible, and too loose a fit results in erroneous measurements due to air surrounding the probe.
• High cost. • Manufactured overseas means potential problems with product support.
Recommendations: Further testing with the down hole dielectric probe is not warranted. Other similar devices exist that are both more economical and more rugged.
Figure 1.4. Adek Down Hole Dielectric Probe.
8
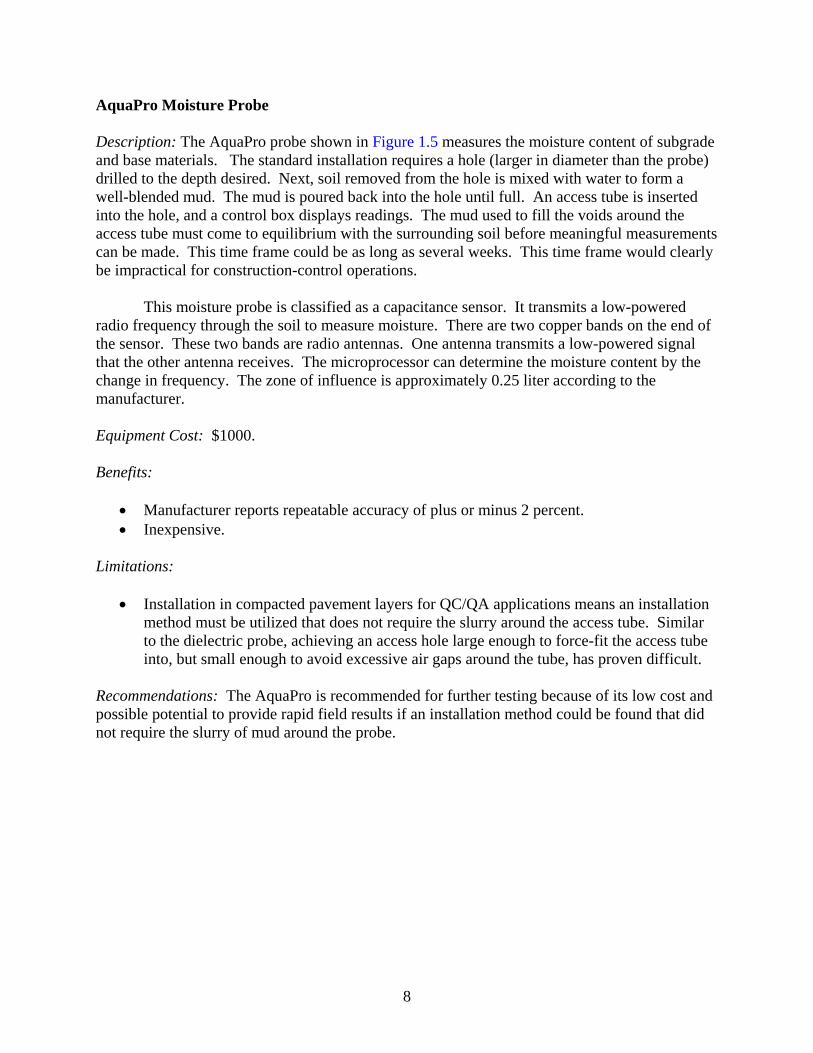
AquaPro Moisture Probe Description: The AquaPro probe shown in Figure 1.5 measures the moisture content of subgrade and base materials. The standard installation requires a hole (larger in diameter than the probe) drilled to the depth desired. Next, soil removed from the hole is mixed with water to form a well-blended mud. The mud is poured back into the hole until full. An access tube is inserted into the hole, and a control box displays readings. The mud used to fill the voids around the access tube must come to equilibrium with the surrounding soil before meaningful measurements can be made. This time frame could be as long as several weeks. This time frame would clearly be impractical for construction-control operations.
This moisture probe is classified as a capacitance sensor. It transmits a low-powered radio frequency through the soil to measure moisture. There are two copper bands on the end of the sensor. These two bands are radio antennas. One antenna transmits a low-powered signal that the other antenna receives. The microprocessor can determine the moisture content by the change in frequency. The zone of influence is approximately 0.25 liter according to the manufacturer. Equipment Cost: $1000. Benefits:
• Manufacturer reports repeatable accuracy of plus or minus 2 percent. • Inexpensive.
Limitations:
• Installation in compacted pavement layers for QC/QA applications means an installation method must be utilized that does not require the slurry around the access tube. Similar to the dielectric probe, achieving an access hole large enough to force-fit the access tube into, but small enough to avoid excessive air gaps around the tube, has proven difficult.
Recommendations: The AquaPro is recommended for further testing because of its low cost and possible potential to provide rapid field results if an installation method could be found that did not require the slurry of mud around the probe.
9
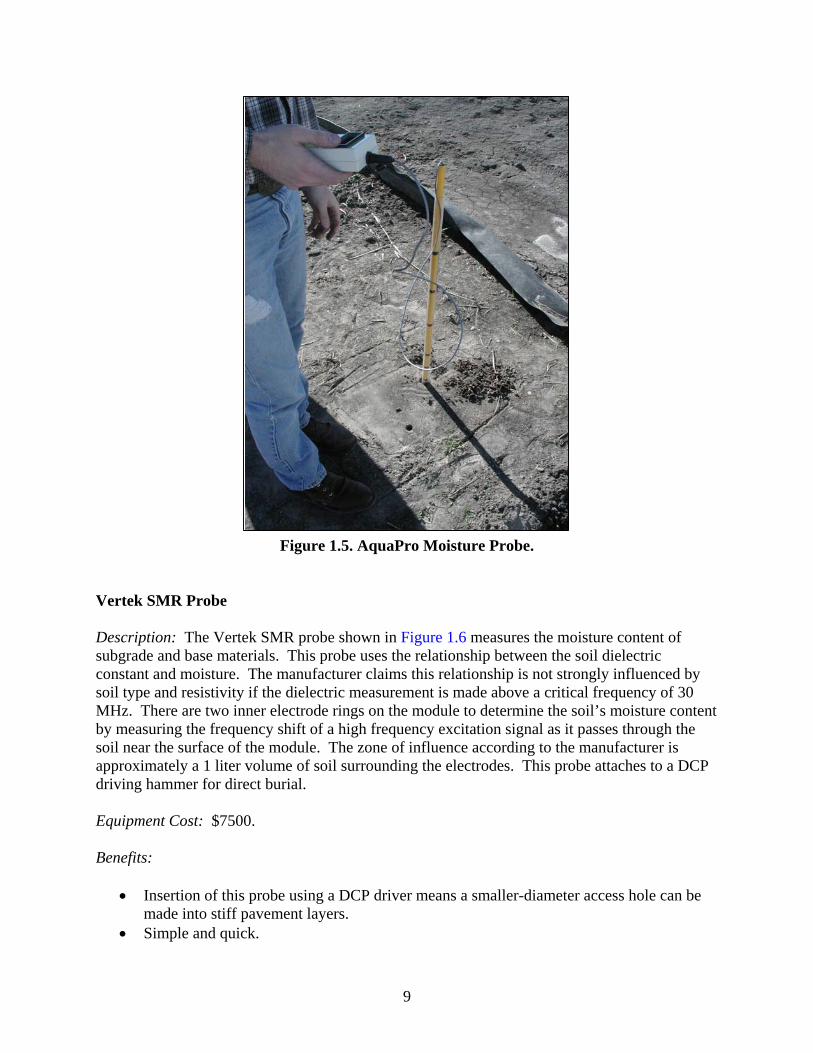
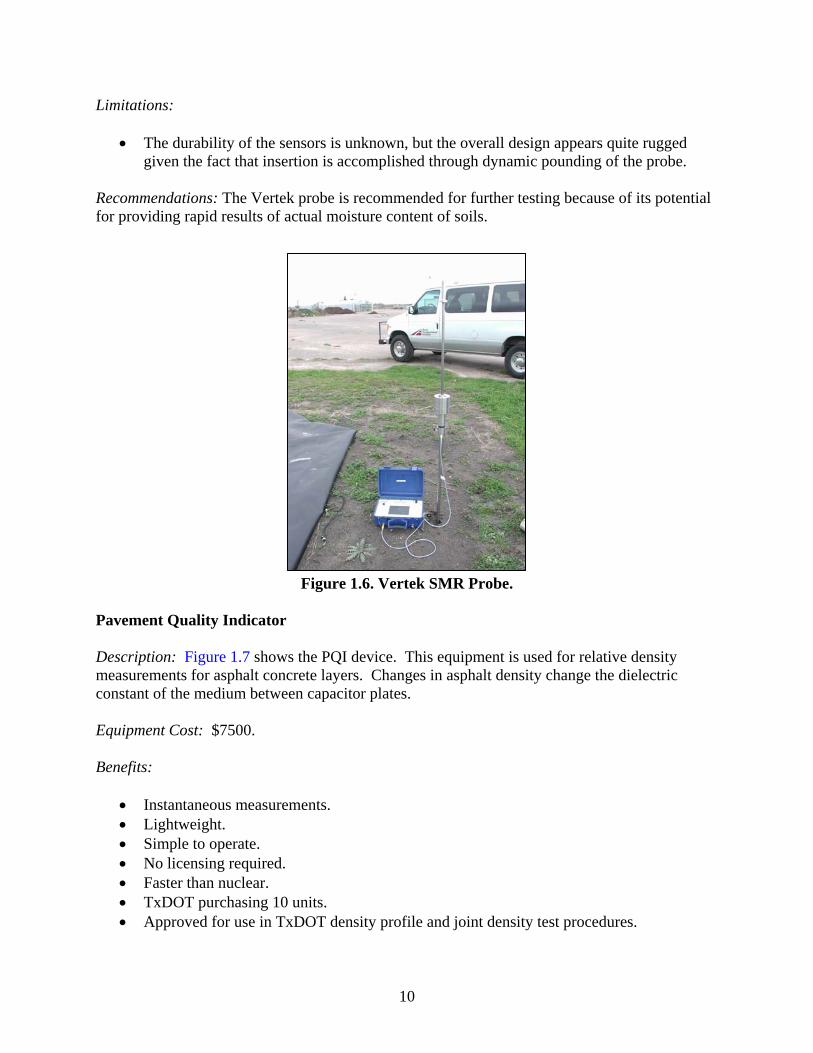
Figure 1.5. AquaPro Moisture Probe. Vertek SMR Probe Description: The Vertek SMR probe shown in Figure 1.6 measures the moisture content of subgrade and base materials. This probe uses the relationship between the soil dielectric constant and moisture. The manufacturer claims this relationship is not strongly influenced by soil type and resistivity if the dielectric measurement is made above a critical frequency of 30 MHz. There are two inner electrode rings on the module to determine the soil’s moisture content by measuring the frequency shift of a high frequency excitation signal as it passes through the soil near the surface of the module. The zone of influence according to the manufacturer is approximately a 1 liter volume of soil surrounding the electrodes. This probe attaches to a DCP driving hammer for direct burial. Equipment Cost: $7500. Benefits:
• Insertion of this probe using a DCP driver means a smaller-diameter access hole can be made into stiff pavement layers.
• Simple and quick.
10
Limitations:
• The durability of the sensors is unknown, but the overall design appears quite rugged given the fact that insertion is accomplished through dynamic pounding of the probe.
Recommendations: The Vertek probe is recommended for further testing because of its potential for providing rapid results of actual moisture content of soils.
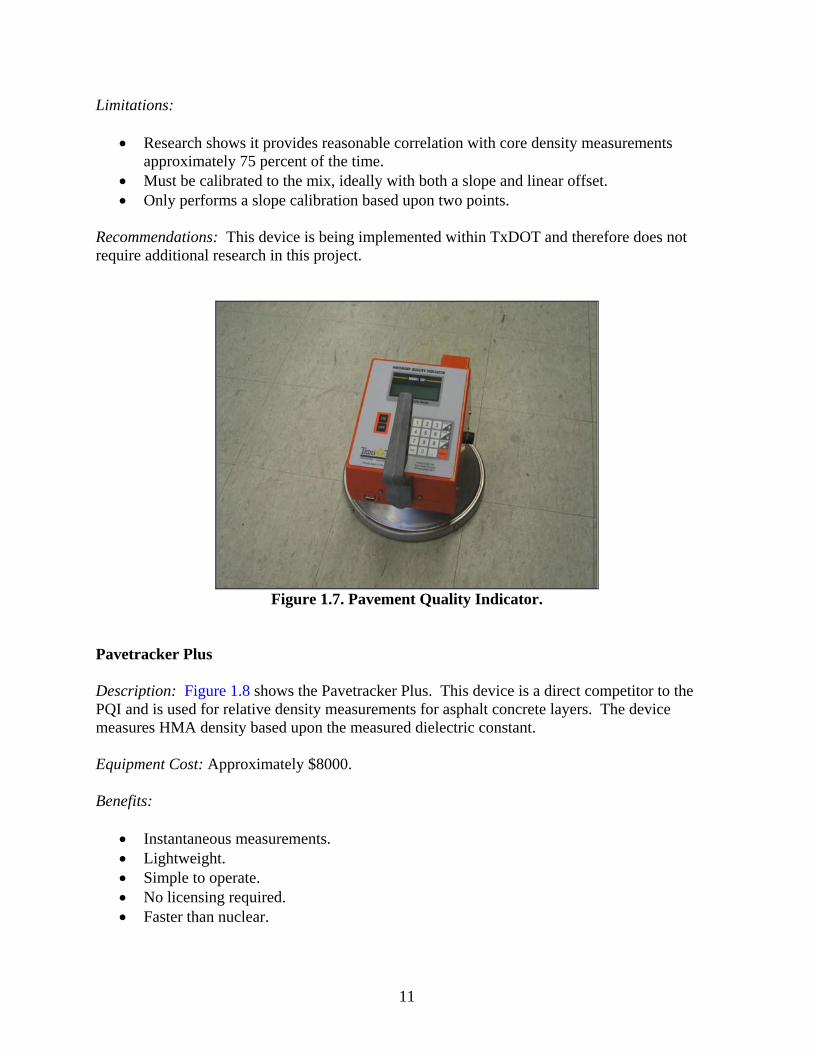
Figure 1.6. Vertek SMR Probe. Pavement Quality Indicator Description: Figure 1.7 shows the PQI device. This equipment is used for relative density measurements for asphalt concrete layers. Changes in asphalt density change the dielectric constant of the medium between capacitor plates. Equipment Cost: $7500. Benefits:
• Instantaneous measurements. • Lightweight. • Simple to operate. • No licensing required. • Faster than nuclear. • TxDOT purchasing 10 units. • Approved for use in TxDOT density profile and joint density test procedures.
11
Limitations:
• Research shows it provides reasonable correlation with core density measurements approximately 75 percent of the time.
• Must be calibrated to the mix, ideally with both a slope and linear offset. • Only performs a slope calibration based upon two points.
Recommendations: This device is being implemented within TxDOT and therefore does not require additional research in this project.
Figure 1.7. Pavement Quality Indicator.
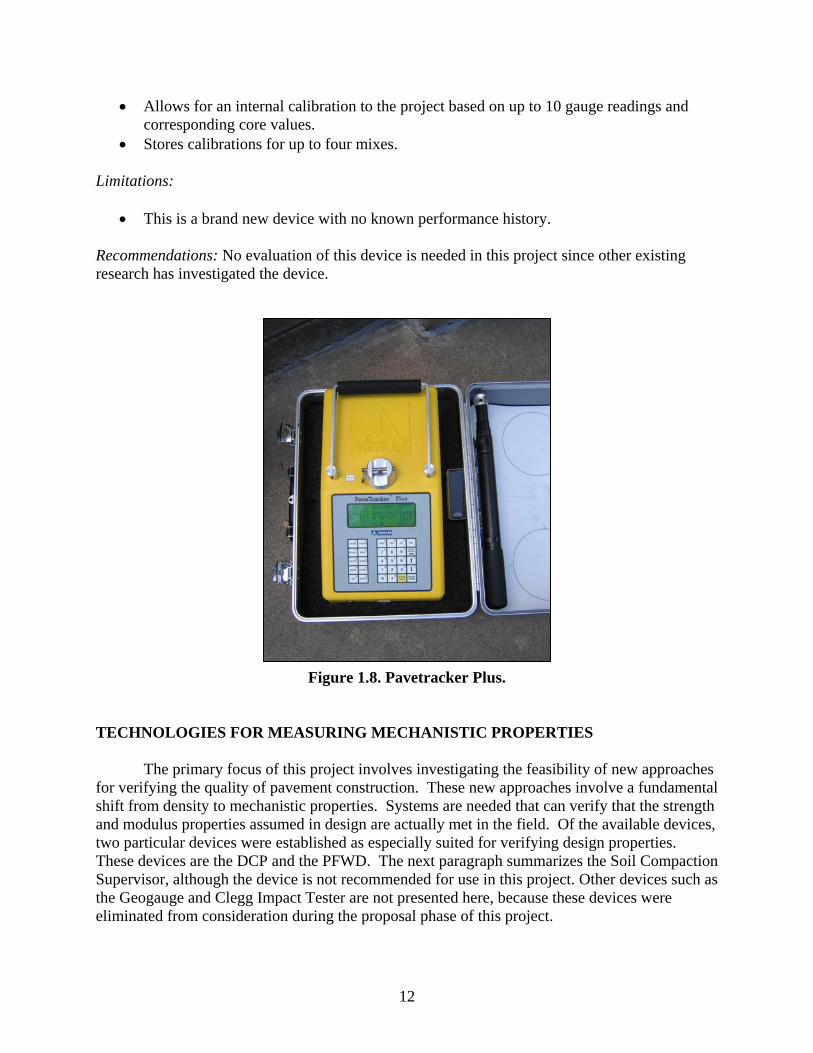
Pavetracker Plus Description: Figure 1.8 shows the Pavetracker Plus. This device is a direct competitor to the PQI and is used for relative density measurements for asphalt concrete layers. The device measures HMA density based upon the measured dielectric constant. Equipment Cost: Approximately $8000. Benefits:
• Instantaneous measurements. • Lightweight. • Simple to operate. • No licensing required. • Faster than nuclear.
12
• Allows for an internal calibration to the project based on up to 10 gauge readings and corresponding core values.
• Stores calibrations for up to four mixes. Limitations:
• This is a brand new device with no known performance history. Recommendations: No evaluation of this device is needed in this project since other existing research has investigated the device.
Figure 1.8. Pavetracker Plus. TECHNOLOGIES FOR MEASURING MECHANISTIC PROPERTIES The primary focus of this project involves investigating the feasibility of new approaches for verifying the quality of pavement construction. These new approaches involve a fundamental shift from density to mechanistic properties. Systems are needed that can verify that the strength and modulus properties assumed in design are actually met in the field. Of the available devices, two particular devices were established as especially suited for verifying design properties. These devices are the DCP and the PFWD. The next paragraph summarizes the Soil Compaction Supervisor, although the device is not recommended for use in this project. Other devices such as the Geogauge and Clegg Impact Tester are not presented here, because these devices were eliminated from consideration during the proposal phase of this project.
13
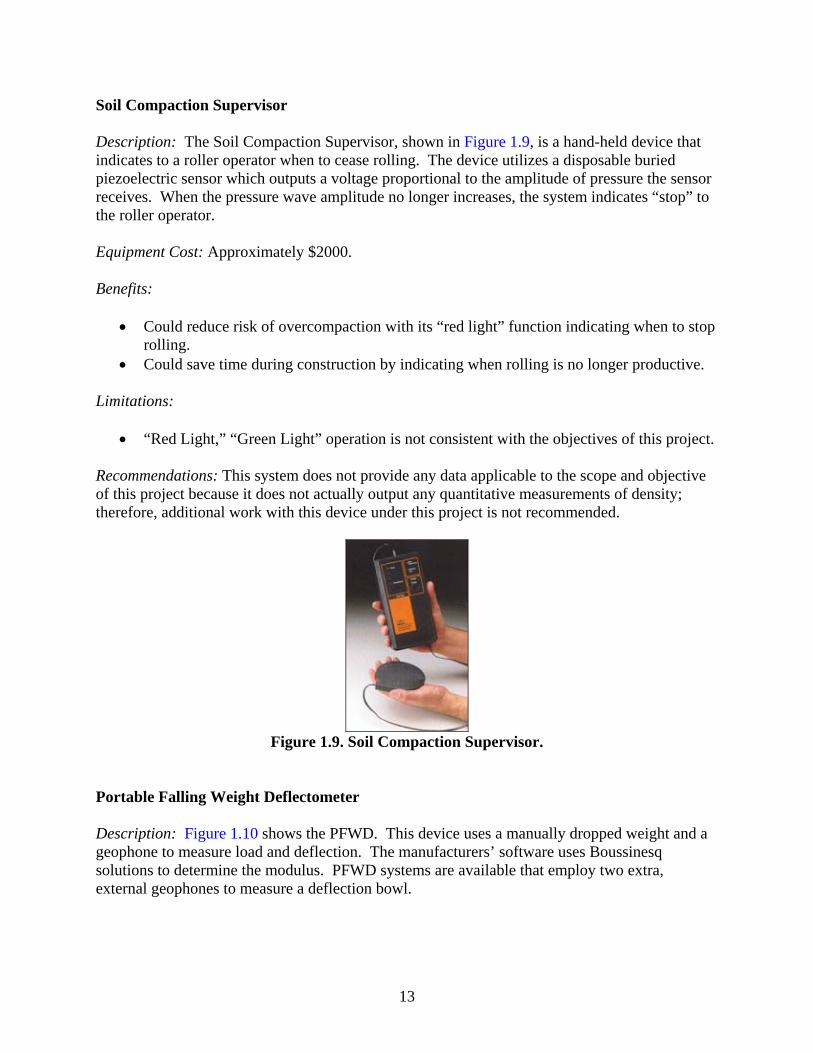
Soil Compaction Supervisor Description: The Soil Compaction Supervisor, shown in Figure 1.9, is a hand-held device that indicates to a roller operator when to cease rolling. The device utilizes a disposable buried piezoelectric sensor which outputs a voltage proportional to the amplitude of pressure the sensor receives. When the pressure wave amplitude no longer increases, the system indicates “stop” to the roller operator. Equipment Cost: Approximately $2000. Benefits:
• Could reduce risk of overcompaction with its “red light” function indicating when to stop rolling.
• Could save time during construction by indicating when rolling is no longer productive. Limitations:
• “Red Light,” “Green Light” operation is not consistent with the objectives of this project. Recommendations: This system does not provide any data applicable to the scope and objective of this project because it does not actually output any quantitative measurements of density; therefore, additional work with this device under this project is not recommended.
Figure 1.9. Soil Compaction Supervisor.
Portable Falling Weight Deflectometer Description: Figure 1.10 shows the PFWD. This device uses a manually dropped weight and a geophone to measure load and deflection. The manufacturers’ software uses Boussinesq solutions to determine the modulus. PFWD systems are available that employ two extra, external geophones to measure a deflection bowl.
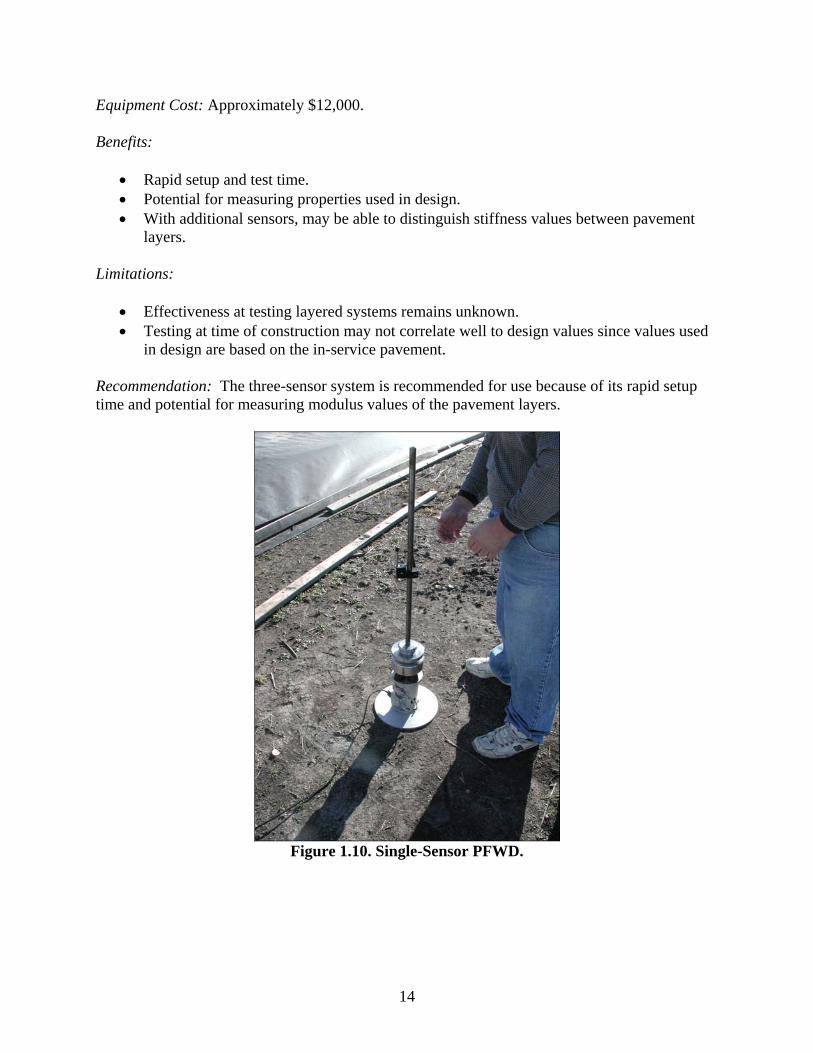
14
Equipment Cost: Approximately $12,000. Benefits:
• Rapid setup and test time. • Potential for measuring properties used in design. • With additional sensors, may be able to distinguish stiffness values between pavement
layers. Limitations:
• Effectiveness at testing layered systems remains unknown. • Testing at time of construction may not correlate well to design values since values used
in design are based on the in-service pavement. Recommendation: The three-sensor system is recommended for use because of its rapid setup time and potential for measuring modulus values of the pavement layers.
Figure 1.10. Single-Sensor PFWD.
15
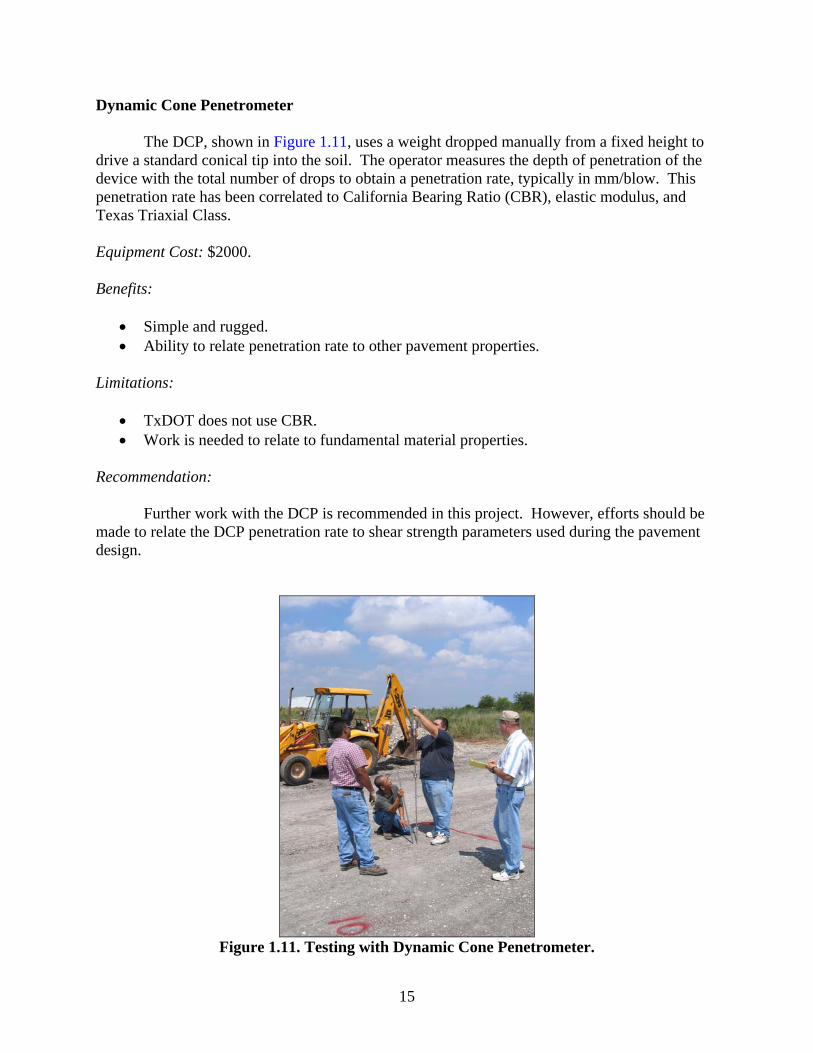
Dynamic Cone Penetrometer The DCP, shown in Figure 1.11, uses a weight dropped manually from a fixed height to drive a standard conical tip into the soil. The operator measures the depth of penetration of the device with the total number of drops to obtain a penetration rate, typically in mm/blow. This penetration rate has been correlated to California Bearing Ratio (CBR), elastic modulus, and Texas Triaxial Class. Equipment Cost: $2000. Benefits:
• Simple and rugged. • Ability to relate penetration rate to other pavement properties.
Limitations:
• TxDOT does not use CBR. • Work is needed to relate to fundamental material properties.
Recommendation: Further work with the DCP is recommended in this project. However, efforts should be made to relate the DCP penetration rate to shear strength parameters used during the pavement design.
Figure 1.11. Testing with Dynamic Cone Penetrometer.
16
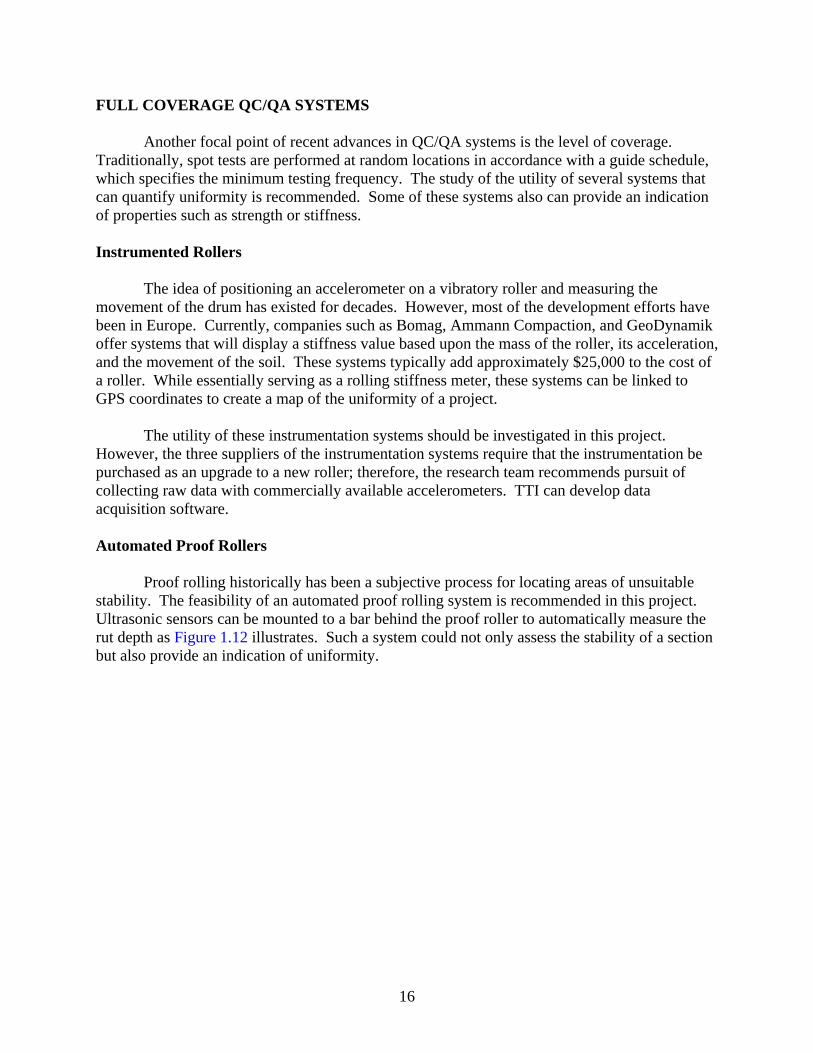
FULL COVERAGE QC/QA SYSTEMS Another focal point of recent advances in QC/QA systems is the level of coverage. Traditionally, spot tests are performed at random locations in accordance with a guide schedule, which specifies the minimum testing frequency. The study of the utility of several systems that can quantify uniformity is recommended. Some of these systems also can provide an indication of properties such as strength or stiffness. Instrumented Rollers The idea of positioning an accelerometer on a vibratory roller and measuring the movement of the drum has existed for decades. However, most of the development efforts have been in Europe. Currently, companies such as Bomag, Ammann Compaction, and GeoDynamik offer systems that will display a stiffness value based upon the mass of the roller, its acceleration, and the movement of the soil. These systems typically add approximately $25,000 to the cost of a roller. While essentially serving as a rolling stiffness meter, these systems can be linked to GPS coordinates to create a map of the uniformity of a project. The utility of these instrumentation systems should be investigated in this project. However, the three suppliers of the instrumentation systems require that the instrumentation be purchased as an upgrade to a new roller; therefore, the research team recommends pursuit of collecting raw data with commercially available accelerometers. TTI can develop data acquisition software. Automated Proof Rollers Proof rolling historically has been a subjective process for locating areas of unsuitable stability. The feasibility of an automated proof rolling system is recommended in this project. Ultrasonic sensors can be mounted to a bar behind the proof roller to automatically measure the rut depth as Figure 1.12 illustrates. Such a system could not only assess the stability of a section but also provide an indication of uniformity.
17
Figure 1.12. Automated Proof Rolling Concept.
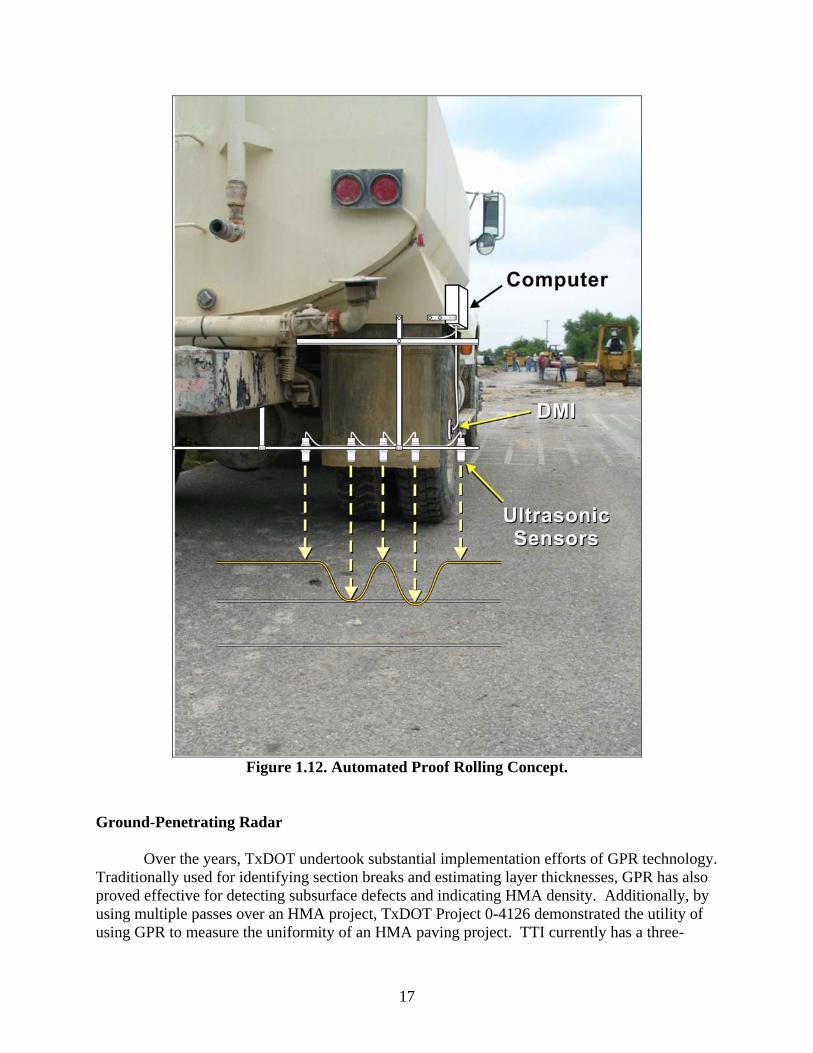
Ground-Penetrating Radar Over the years, TxDOT undertook substantial implementation efforts of GPR technology. Traditionally used for identifying section breaks and estimating layer thicknesses, GPR has also proved effective for detecting subsurface defects and indicating HMA density. Additionally, by using multiple passes over an HMA project, TxDOT Project 0-4126 demonstrated the utility of using GPR to measure the uniformity of an HMA paving project. TTI currently has a three-
18
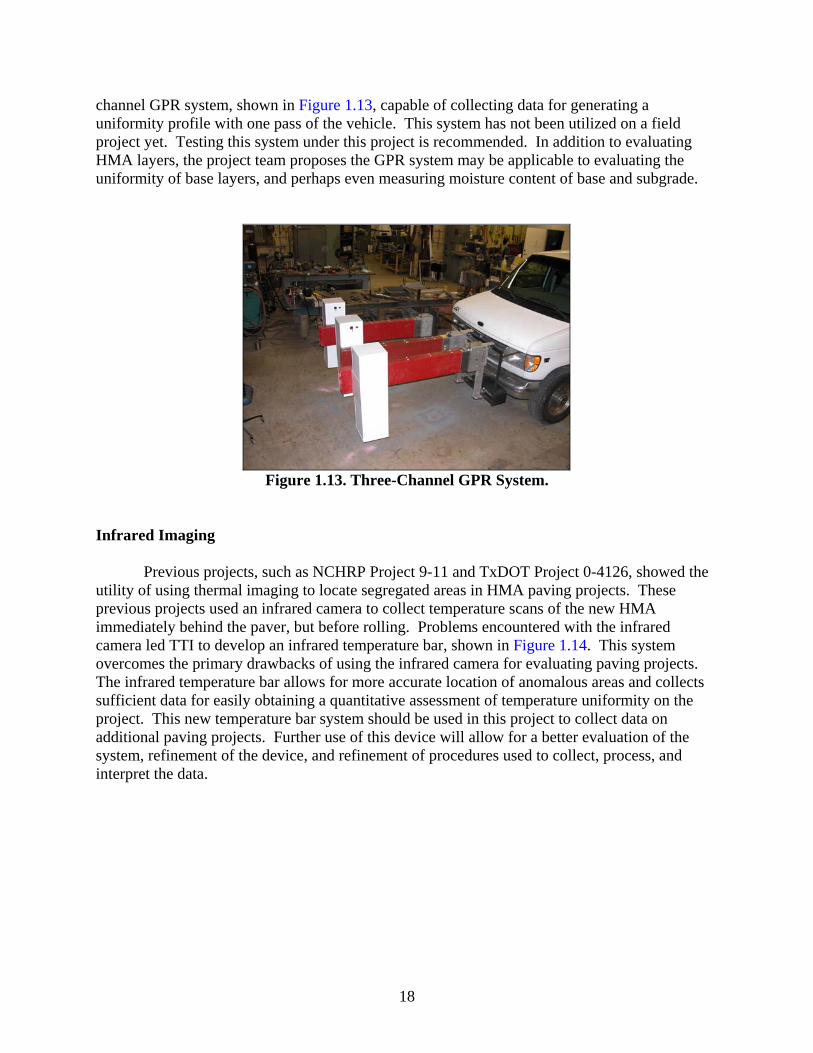
channel GPR system, shown in Figure 1.13, capable of collecting data for generating a uniformity profile with one pass of the vehicle. This system has not been utilized on a field project yet. Testing this system under this project is recommended. In addition to evaluating HMA layers, the project team proposes the GPR system may be applicable to evaluating the uniformity of base layers, and perhaps even measuring moisture content of base and subgrade.
Figure 1.13. Three-Channel GPR System.
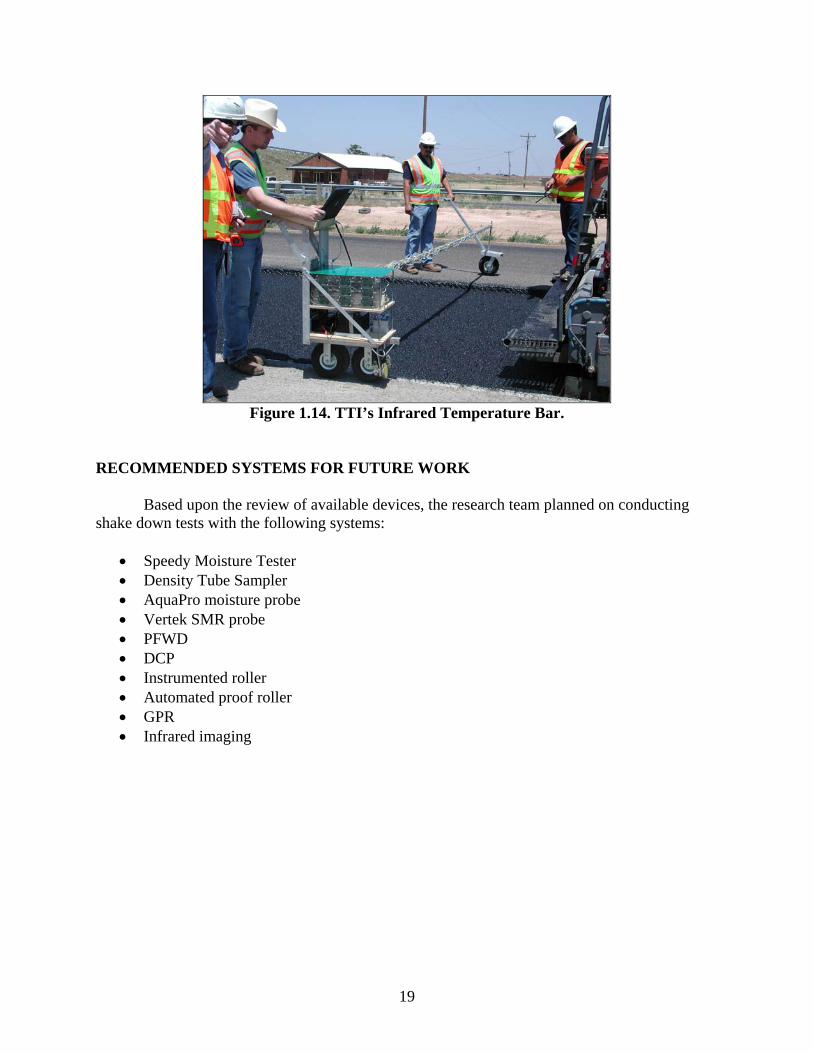
Infrared Imaging Previous projects, such as NCHRP Project 9-11 and TxDOT Project 0-4126, showed the utility of using thermal imaging to locate segregated areas in HMA paving projects. These previous projects used an infrared camera to collect temperature scans of the new HMA immediately behind the paver, but before rolling. Problems encountered with the infrared camera led TTI to develop an infrared temperature bar, shown in Figure 1.14. This system overcomes the primary drawbacks of using the infrared camera for evaluating paving projects. The infrared temperature bar allows for more accurate location of anomalous areas and collects sufficient data for easily obtaining a quantitative assessment of temperature uniformity on the project. This new temperature bar system should be used in this project to collect data on additional paving projects. Further use of this device will allow for a better evaluation of the system, refinement of the device, and refinement of procedures used to collect, process, and interpret the data.
19
Figure 1.14. TTI’s Infrared Temperature Bar.
RECOMMENDED SYSTEMS FOR FUTURE WORK Based upon the review of available devices, the research team planned on conducting shake down tests with the following systems:
• Speedy Moisture Tester • Density Tube Sampler • AquaPro moisture probe • Vertek SMR probe • PFWD • DCP • Instrumented roller • Automated proof roller • GPR • Infrared imaging

21 21
CHAPTER 2
CONTROLLED TESTS OF NEW DEVICES
SUMMARY After completing the literature review of available devices and selecting devices to investigate further, the research team conducted limited controlled tests with several devices that were deemed promising. These tests focused on density and moisture measurement systems and:
• provided the research team an opportunity to better evaluate the potential for using the device in a pavement construction setting.
• revealed that the Speedy moisture tester combined with the density tube sampler could be used to get a reasonable field estimate of moisture and density for subgrade applications.
• showed promising results for using the AquaPro and Vertek non-nuclear moisture probes for measuring the moisture content of soils.
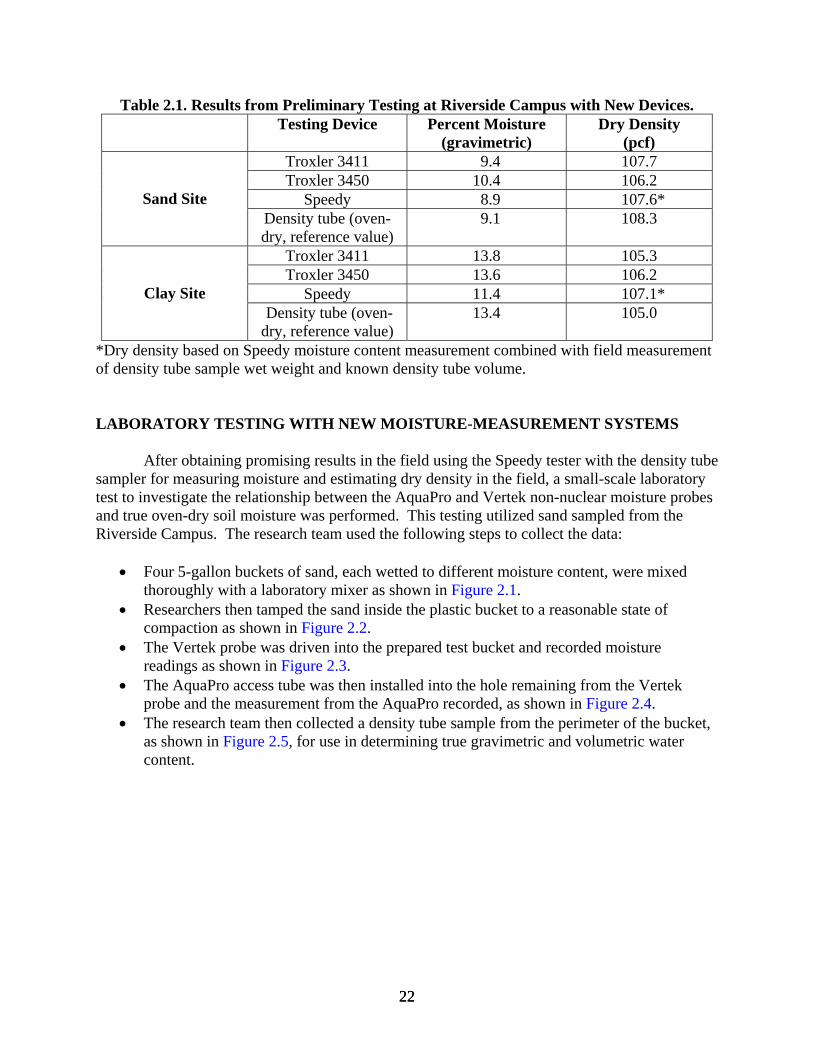
CONTROLLED TESTS AT RIVERSIDE CAMPUS The research team conducted the first phase of testing with the Speedy moisture tester and the density tube sampler. The team conducted tests at Texas A&M’s Riverside Campus at two sites. One site consists of clay, the other site sand. The research team also collected moisture and density data with the Troxler 3411 and 3450 nuclear gauges. After the field testing, the research team returned the density tube samples to the lab and measured the oven-dry moisture content. After measuring the oven-dry moisture content, the dry density was calculated based upon the known volume of the tube sample and the oven-dry sample weight. Table 2.1 presents the results from these tests. The results yielded the following information:
• At the sand site, all techniques resulted in measurements that were reasonably close to the oven-dry (control) results. Measured moisture contents with the devices were within 1.3 percentage points of the oven-dry moisture, and field-measured densities were within 2.1 pounds per cubic foot (pcf) of the oven-dry measured density. Of particular note is that using the Speedy in conjunction with the field-measured wet weight of the density tube sample resulted in a density within 0.7 pcf of the control (oven-dry) measurement.
• At the clay site, all the devices were reasonably close to the oven-dry values. The largest discrepancy exists between the Speedy results and the laboratory oven-dry values. This discrepancy exists because, unlike the oven-dry technique, the Speedy does not detect structural water in clays. This results in a lower Speedy moisture content than the oven-dry value and a slightly inflated dry density estimate based upon the Speedy in conjunction with the density tube sample wet weight. Speedy moisture measurements of clays can be adjusted to more accurately reflect oven-dry values by determining the offset between Speedy and oven-dry measurements for the particular soil.
22 22
Table 2.1. Results from Preliminary Testing at Riverside Campus with New Devices. Testing Device Percent Moisture
(gravimetric) Dry Density
(pcf) Troxler 3411 9.4 107.7 Troxler 3450 10.4 106.2
Speedy 8.9 107.6* Sand Site Density tube (oven-dry, reference value)
9.1 108.3
Troxler 3411 13.8 105.3 Troxler 3450 13.6 106.2
Speedy 11.4 107.1* Clay Site Density tube (oven-dry, reference value)
13.4 105.0
*Dry density based on Speedy moisture content measurement combined with field measurement of density tube sample wet weight and known density tube volume. LABORATORY TESTING WITH NEW MOISTURE-MEASUREMENT SYSTEMS After obtaining promising results in the field using the Speedy tester with the density tube sampler for measuring moisture and estimating dry density in the field, a small-scale laboratory test to investigate the relationship between the AquaPro and Vertek non-nuclear moisture probes and true oven-dry soil moisture was performed. This testing utilized sand sampled from the Riverside Campus. The research team used the following steps to collect the data:
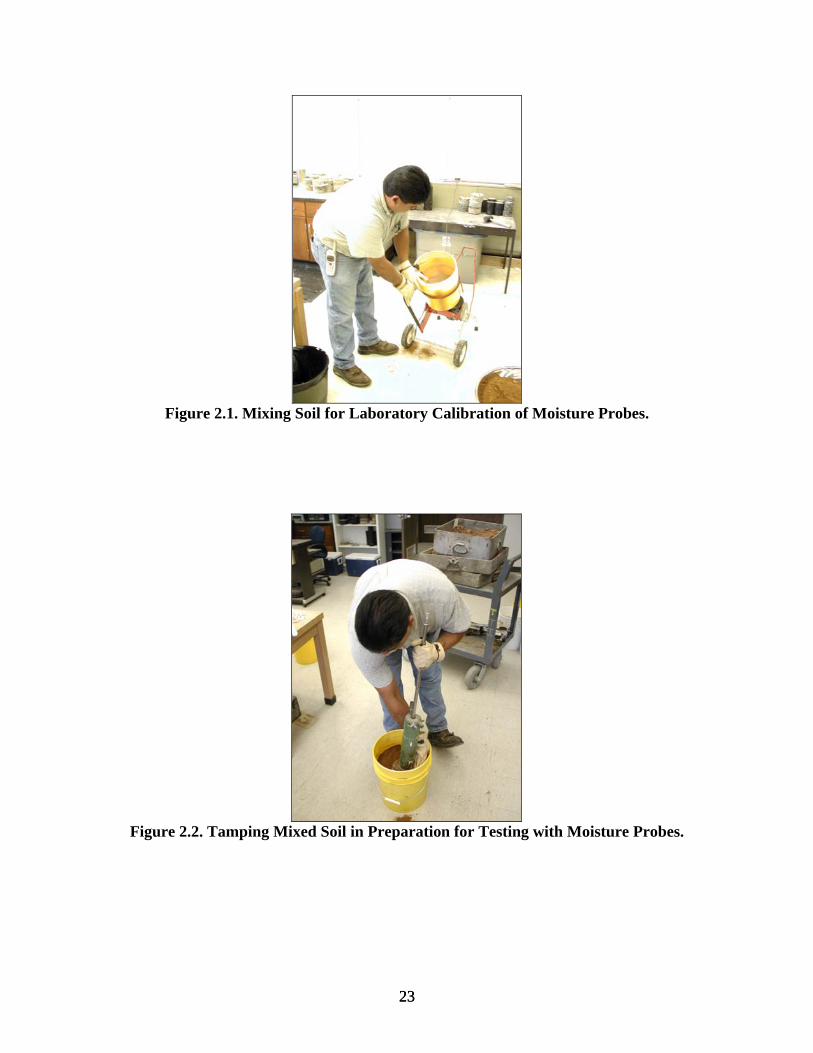
• Four 5-gallon buckets of sand, each wetted to different moisture content, were mixed thoroughly with a laboratory mixer as shown in Figure 2.1.
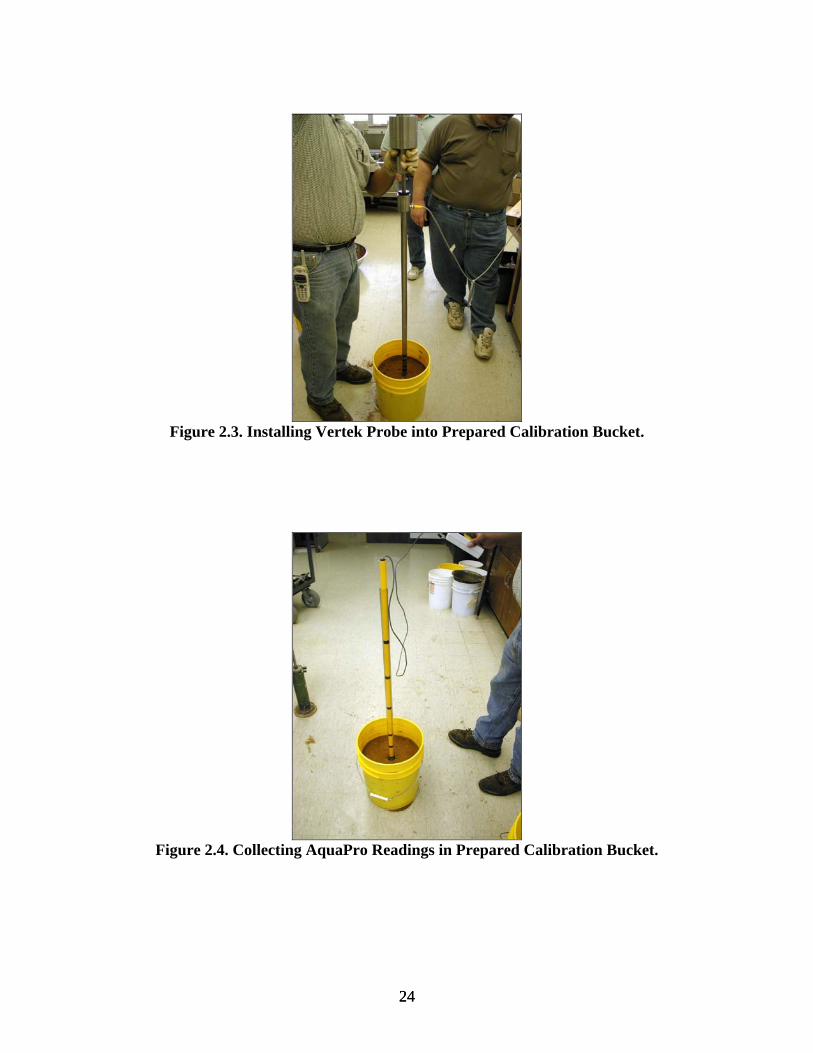
• Researchers then tamped the sand inside the plastic bucket to a reasonable state of compaction as shown in Figure 2.2.
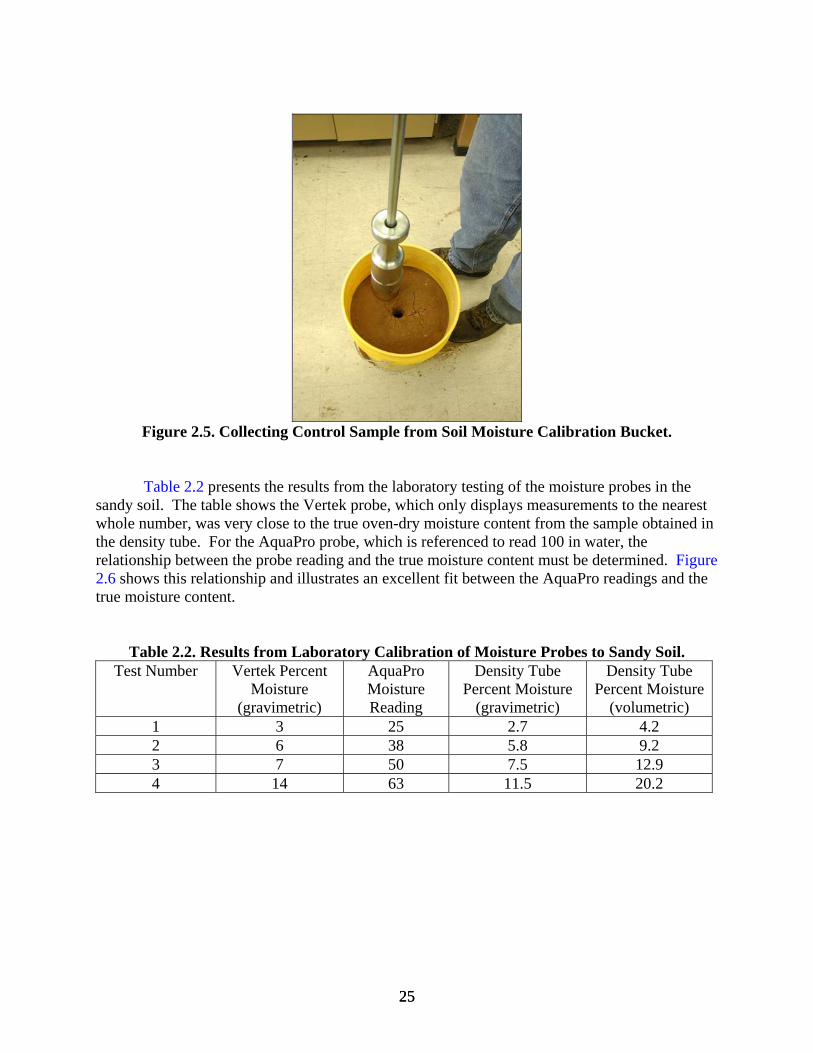
• The Vertek probe was driven into the prepared test bucket and recorded moisture readings as shown in Figure 2.3.
• The AquaPro access tube was then installed into the hole remaining from the Vertek probe and the measurement from the AquaPro recorded, as shown in Figure 2.4.
• The research team then collected a density tube sample from the perimeter of the bucket, as shown in Figure 2.5, for use in determining true gravimetric and volumetric water content.
23 23
Figure 2.1. Mixing Soil for Laboratory Calibration of Moisture Probes.
Figure 2.2. Tamping Mixed Soil in Preparation for Testing with Moisture Probes.
24 24
Figure 2.3. Installing Vertek Probe into Prepared Calibration Bucket.
Figure 2.4. Collecting AquaPro Readings in Prepared Calibration Bucket.
25 25
Figure 2.5. Collecting Control Sample from Soil Moisture Calibration Bucket.
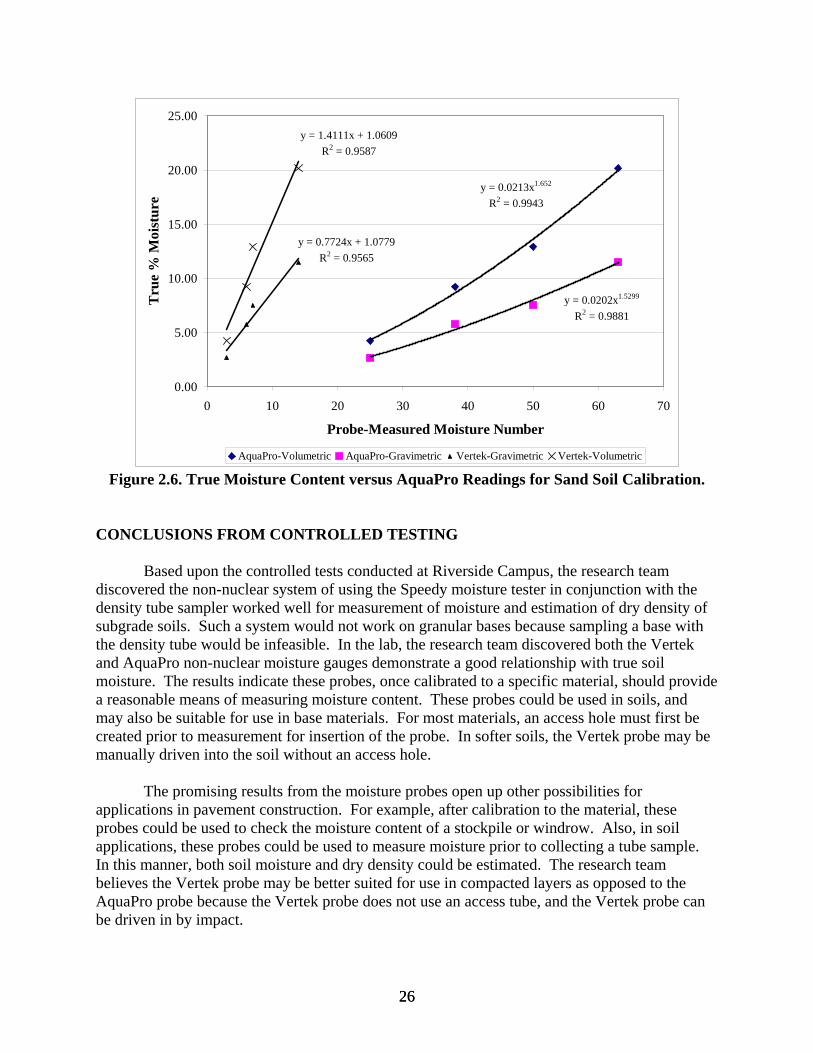
Table 2.2 presents the results from the laboratory testing of the moisture probes in the sandy soil. The table shows the Vertek probe, which only displays measurements to the nearest whole number, was very close to the true oven-dry moisture content from the sample obtained in the density tube. For the AquaPro probe, which is referenced to read 100 in water, the relationship between the probe reading and the true moisture content must be determined. Figure 2.6 shows this relationship and illustrates an excellent fit between the AquaPro readings and the true moisture content.
Table 2.2. Results from Laboratory Calibration of Moisture Probes to Sandy Soil. Test Number Vertek Percent
Moisture (gravimetric)
AquaPro Moisture Reading
Density Tube Percent Moisture
(gravimetric)
Density Tube Percent Moisture
(volumetric) 1 3 25 2.7 4.2 2 6 38 5.8 9.2 3 7 50 7.5 12.9 4 14 63 11.5 20.2
26 26
y = 0.0213x1.652
R2 = 0.9943
y = 0.0202x1.5299
R2 = 0.9881
y = 1.4111x + 1.0609R2 = 0.9587
y = 0.7724x + 1.0779R2 = 0.9565
0.00
5.00
10.00
15.00
20.00
25.00
0 10 20 30 40 50 60 70
Probe-Measured Moisture Number
Tru
e %
Moi
stur
e
AquaPro-Volumetric AquaPro-Gravimetric Vertek-Gravimetric Vertek-Volumetric Figure 2.6. True Moisture Content versus AquaPro Readings for Sand Soil Calibration.
CONCLUSIONS FROM CONTROLLED TESTING Based upon the controlled tests conducted at Riverside Campus, the research team discovered the non-nuclear system of using the Speedy moisture tester in conjunction with the density tube sampler worked well for measurement of moisture and estimation of dry density of subgrade soils. Such a system would not work on granular bases because sampling a base with the density tube would be infeasible. In the lab, the research team discovered both the Vertek and AquaPro non-nuclear moisture gauges demonstrate a good relationship with true soil moisture. The results indicate these probes, once calibrated to a specific material, should provide a reasonable means of measuring moisture content. These probes could be used in soils, and may also be suitable for use in base materials. For most materials, an access hole must first be created prior to measurement for insertion of the probe. In softer soils, the Vertek probe may be manually driven into the soil without an access hole. The promising results from the moisture probes open up other possibilities for applications in pavement construction. For example, after calibration to the material, these probes could be used to check the moisture content of a stockpile or windrow. Also, in soil applications, these probes could be used to measure moisture prior to collecting a tube sample. In this manner, both soil moisture and dry density could be estimated. The research team believes the Vertek probe may be better suited for use in compacted layers as opposed to the AquaPro probe because the Vertek probe does not use an access tube, and the Vertek probe can be driven in by impact.
27
CHAPTER 3
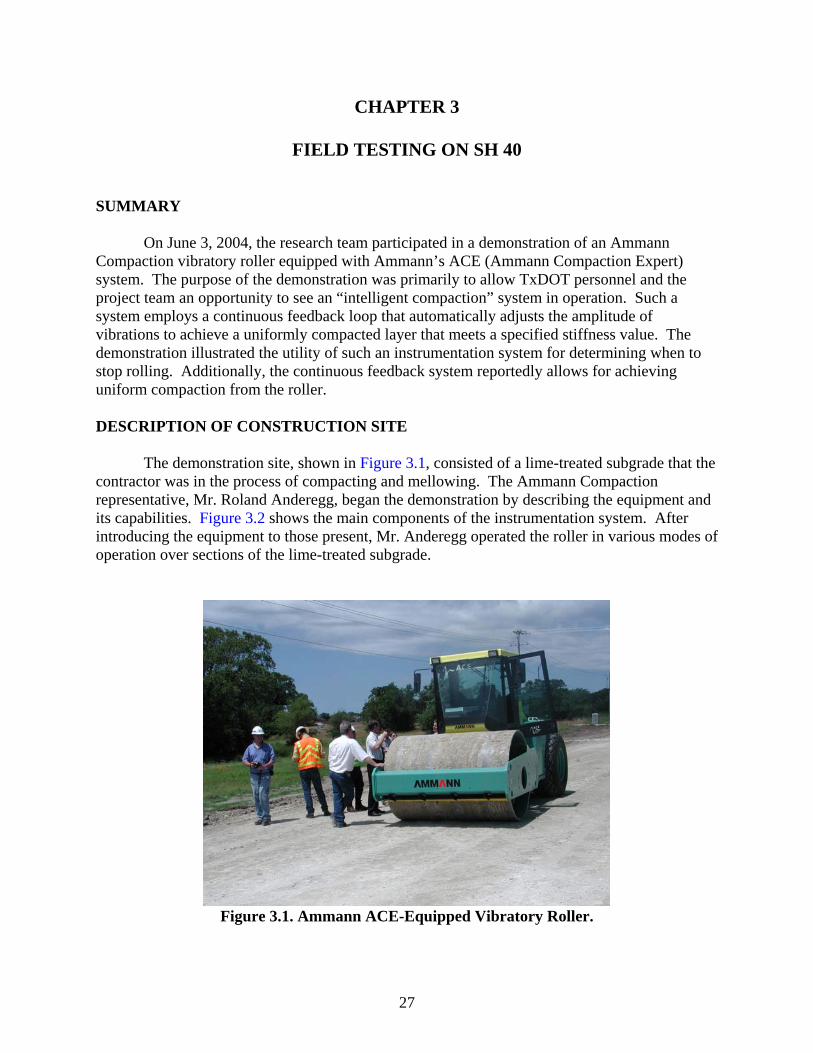
FIELD TESTING ON SH 40 SUMMARY On June 3, 2004, the research team participated in a demonstration of an Ammann Compaction vibratory roller equipped with Ammann’s ACE (Ammann Compaction Expert) system. The purpose of the demonstration was primarily to allow TxDOT personnel and the project team an opportunity to see an “intelligent compaction” system in operation. Such a system employs a continuous feedback loop that automatically adjusts the amplitude of vibrations to achieve a uniformly compacted layer that meets a specified stiffness value. The demonstration illustrated the utility of such an instrumentation system for determining when to stop rolling. Additionally, the continuous feedback system reportedly allows for achieving uniform compaction from the roller.
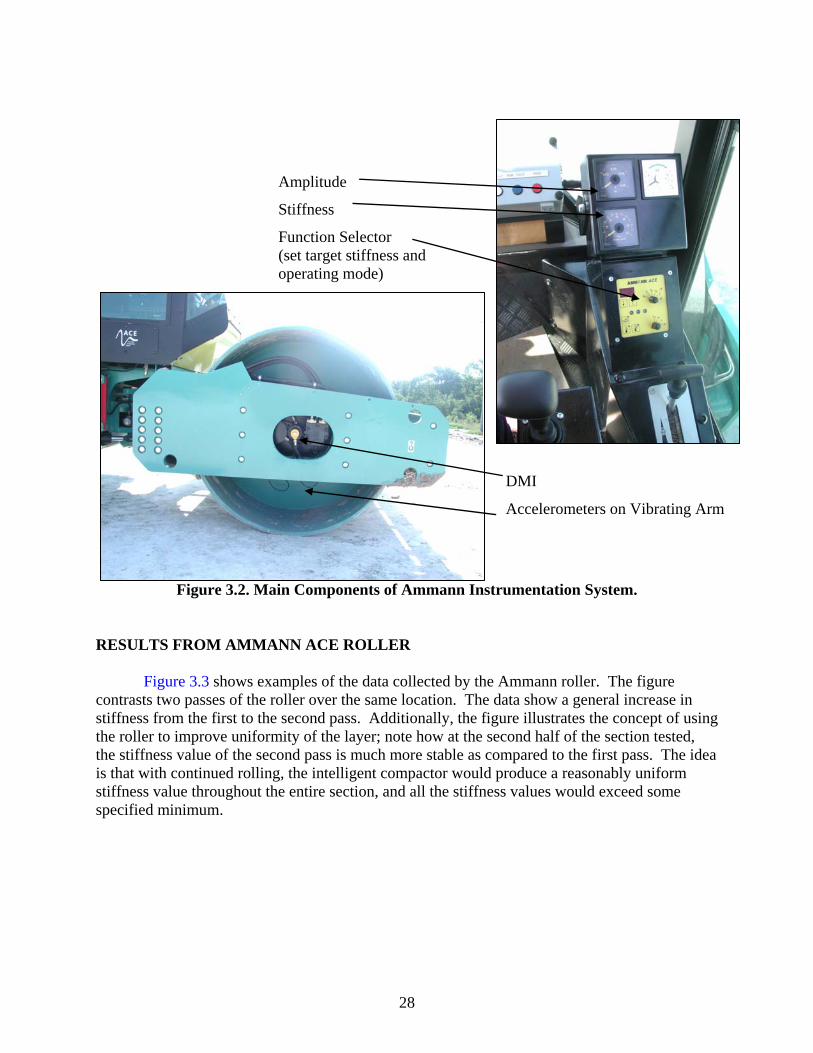
DESCRIPTION OF CONSTRUCTION SITE The demonstration site, shown in Figure 3.1, consisted of a lime-treated subgrade that the contractor was in the process of compacting and mellowing. The Ammann Compaction representative, Mr. Roland Anderegg, began the demonstration by describing the equipment and its capabilities. Figure 3.2 shows the main components of the instrumentation system. After introducing the equipment to those present, Mr. Anderegg operated the roller in various modes of operation over sections of the lime-treated subgrade.
Figure 3.1. Ammann ACE-Equipped Vibratory Roller.
28
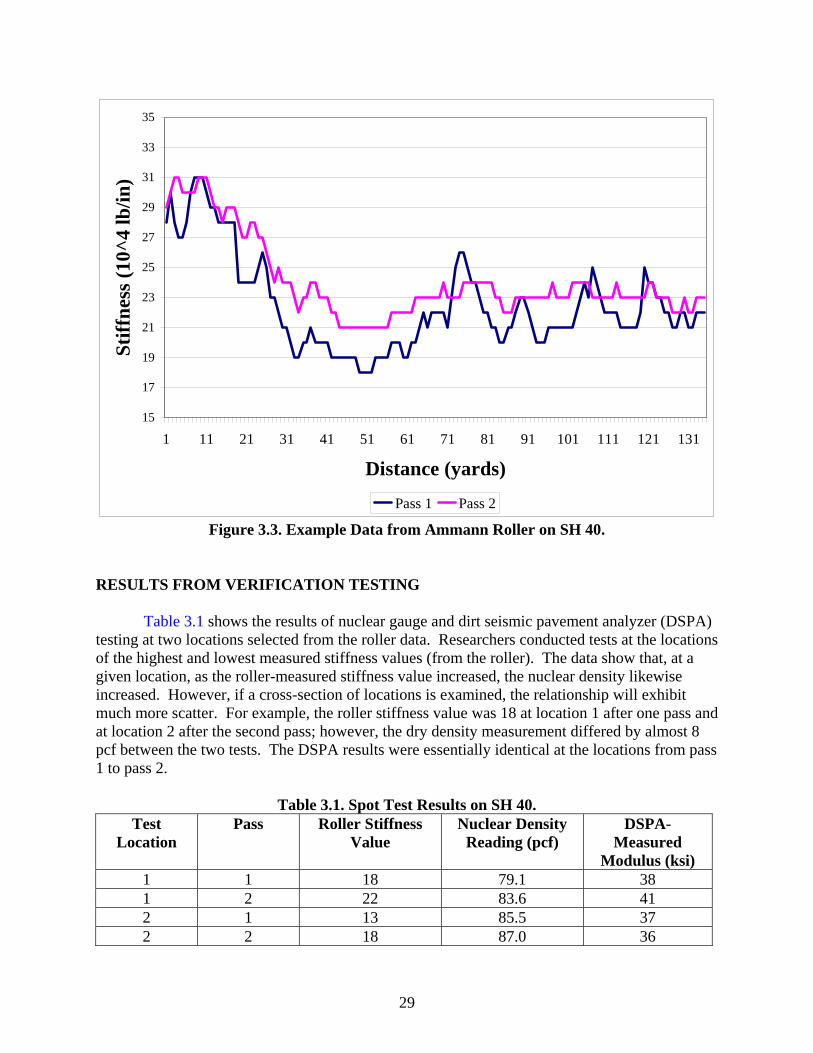
Figure 3.2. Main Components of Ammann Instrumentation System. RESULTS FROM AMMANN ACE ROLLER Figure 3.3 shows examples of the data collected by the Ammann roller. The figure contrasts two passes of the roller over the same location. The data show a general increase in stiffness from the first to the second pass. Additionally, the figure illustrates the concept of using the roller to improve uniformity of the layer; note how at the second half of the section tested, the stiffness value of the second pass is much more stable as compared to the first pass. The idea is that with continued rolling, the intelligent compactor would produce a reasonably uniform stiffness value throughout the entire section, and all the stiffness values would exceed some specified minimum.
Amplitude
Stiffness
Function Selector (set target stiffness and operating mode)
DMI
Accelerometers on Vibrating Arm
29
15
17
19
21
23
25
27
29
31
33
35
1 11 21 31 41 51 61 71 81 91 101 111 121 131
Distance (yards)
Stiff
ness
(10^
4 lb
/in)
Pass 1 Pass 2
Figure 3.3. Example Data from Ammann Roller on SH 40. RESULTS FROM VERIFICATION TESTING Table 3.1 shows the results of nuclear gauge and dirt seismic pavement analyzer (DSPA) testing at two locations selected from the roller data. Researchers conducted tests at the locations of the highest and lowest measured stiffness values (from the roller). The data show that, at a given location, as the roller-measured stiffness value increased, the nuclear density likewise increased. However, if a cross-section of locations is examined, the relationship will exhibit much more scatter. For example, the roller stiffness value was 18 at location 1 after one pass and at location 2 after the second pass; however, the dry density measurement differed by almost 8 pcf between the two tests. The DSPA results were essentially identical at the locations from pass 1 to pass 2.
Table 3.1. Spot Test Results on SH 40. Test
Location Pass Roller Stiffness
Value Nuclear Density
Reading (pcf) DSPA-
Measured Modulus (ksi)
1 1 18 79.1 38 1 2 22 83.6 41 2 1 13 85.5 37 2 2 18 87.0 36
30
CONCLUSIONS FROM TEST SITE The concept of instrumented vibratory rollers and intelligent compaction should be pursued further. However, the research team believes some questions should be answered before proceeding further with the technology in Texas. Comparing the roller data to density data may not be reliable, since other factors (particularly moisture content) impact stiffness. Comparison to current stiffness testing devices (such as the PFWD and DSPA) may likewise be unreliable due to the substantial difference in the zone of influence that exists between the hand-held devices and the instrumented roller system. The next chapter describes the future direction for this project, including the research team’s approach to instrumented rollers.
31
CHAPTER 4
RECOMMENDATIONS FOR FUTURE PROJECT EFFORTS
SUMMARY
In the first year of this project, the research team examined available technologies that may be useful for controlling flexible pavement construction. Devices were examined that could measure properties such as moisture, strength, stiffness, modulus, and uniformity. Based upon their review of the devices, the research team narrowed down the field of potential devices and prepared a recommended approach for the final (year 2) phase of this project. This chapter presents these recommendations.
RECOMMENDED DEVICES FOR FUTURE EFFORTS Table 4.1 summarizes the recommended devices for use in future efforts and their application. Unfortunately, no direct replacement for the nuclear density gauge currently exists for subgrade or base materials. For measuring moisture with new systems, the most promising devices are the AquaPro and Vertek moisture probes. In unconsolidated layers, or windrows, either probe could be used with relative ease. However, for testing compacted layers, experience shows the Vertek probe can be installed easier. For measuring mechanical properties, the research team believes the most promising systems are the three-sensor PFWD and the DCP. These systems are easy to operate and provide results quickly. Full coverage devices are considered to have the most potential for innovation in controlling flexible pavement construction. Such devices not only quantify the uniformity of a project, but can also provide data to determine where to perform spot testing. When a suspect location is identified, a spot-specific system can be used to determine the mechanistic properties of the location. If the location truly is deficient, the limits of the location could be identified and the contractor directed to rework the section. If the suspect location meets specifications, then one could reasonably assume the remainder of the section likewise meets project requirements. Full coverage systems include:
• Instrumented vibratory rollers. • Automated proof rollers. • Ground-penetrating radar. • Infrared imaging.
32
Table 4.1. Summary of Recommended Devices for Future Efforts. Device Property Measured Level of Coverage Pavement Layers
AquaPro Moisture Spot Subgrade, Base? Vertek SMR Probe Moisture Spot Subgrade, Base? PFWD – 3 sensor Modulus Spot Subgrade, Base
DCP Strength Spot Subgrade, Base? Instrumented Roller Uniformity, Stiffness Full Subgrade, Base
Automated Proof Roller
Uniformity, Strength Full Subgrade, Base
GPR Uniformity, Density, Moisture?
Partial/Full Base, HMA
Infrared Imaging Uniformity Full HMA FWD Uniformity, Modulus Partial Subgrade, Base, HMA
Note: Question mark after pavement layer means applicability of the device to that layer is questionable.
RECOMMENDED APPROACH TO INSTRUMENTED VIBRATORY ROLLERS
Ammann Compaction, Bomag, and GeoDynamik all produce instrumentation systems for vibratory rollers; however, the systems must be purchased in conjunction with a roller. As of this report date, these systems add approximately $25,000 to $30,000 to the roller cost. A portable system that could be quickly installed and removed would be more beneficial for TxDOT purposes. Additionally, a better understanding of the zone of influence and data interpretation is needed. For these reasons, the research team acquired and developed software for a basic instrumentation system for installation on any roller. The research team tested this system during the construction of test sites at Texas A&M’s Riverside Campus in August 2004.
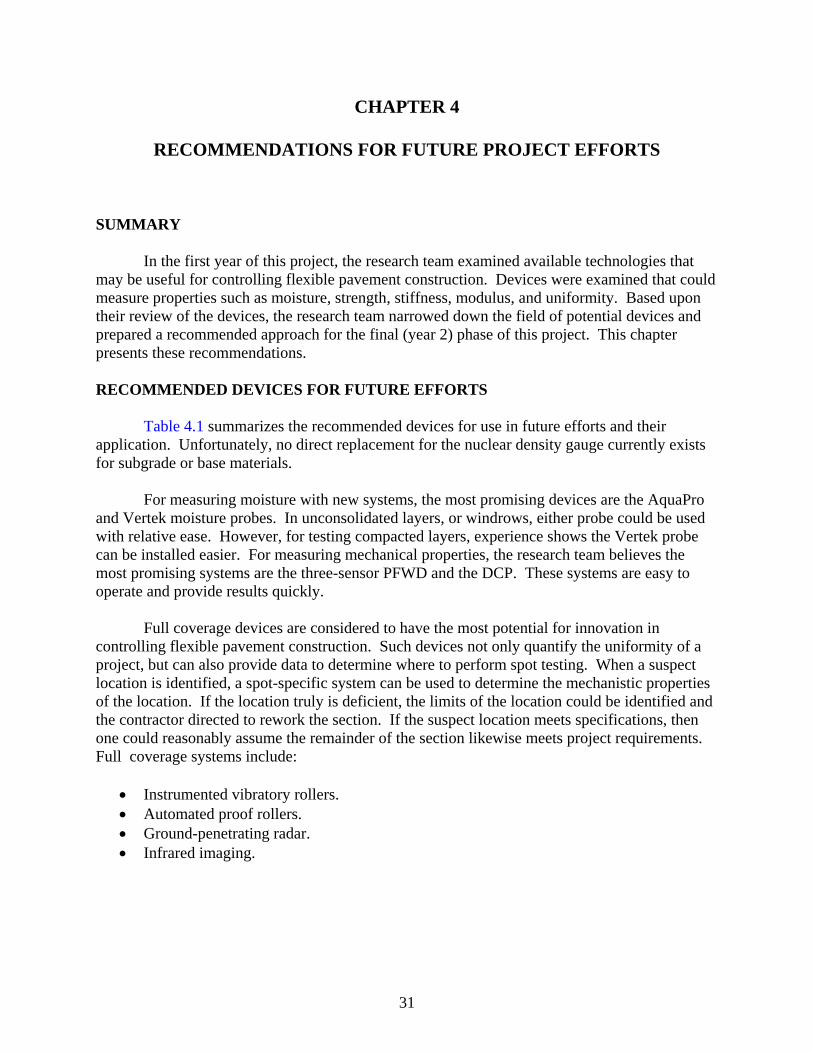
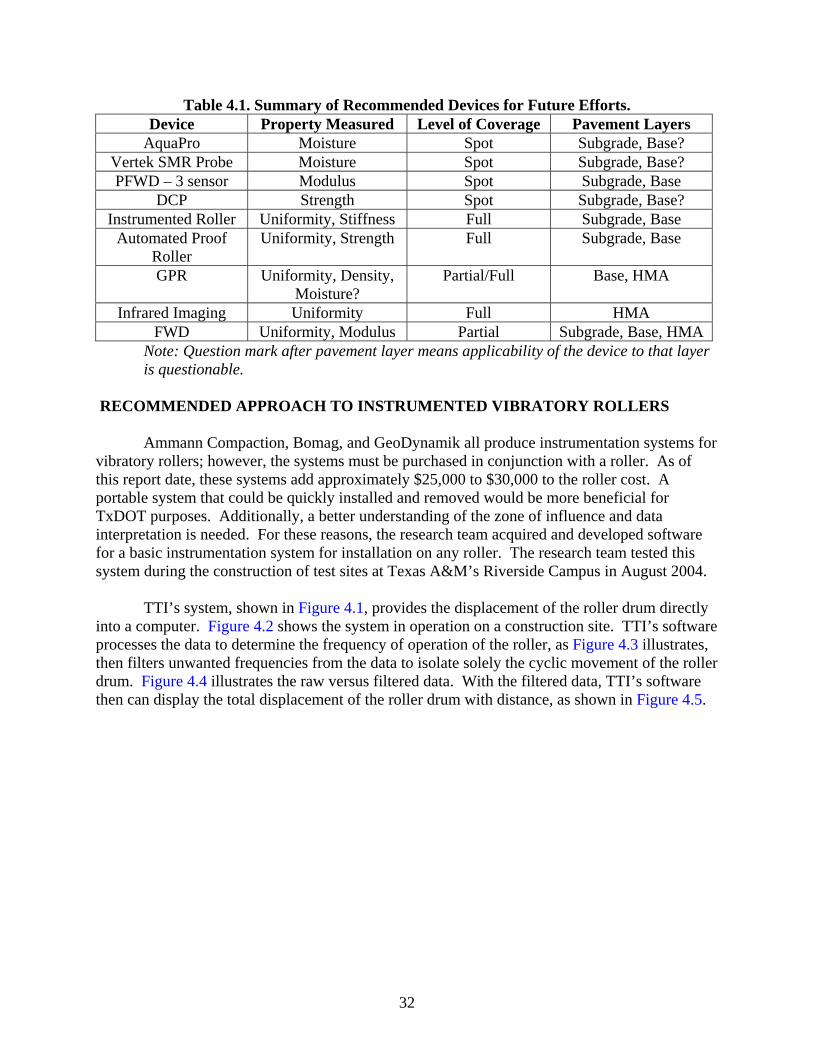
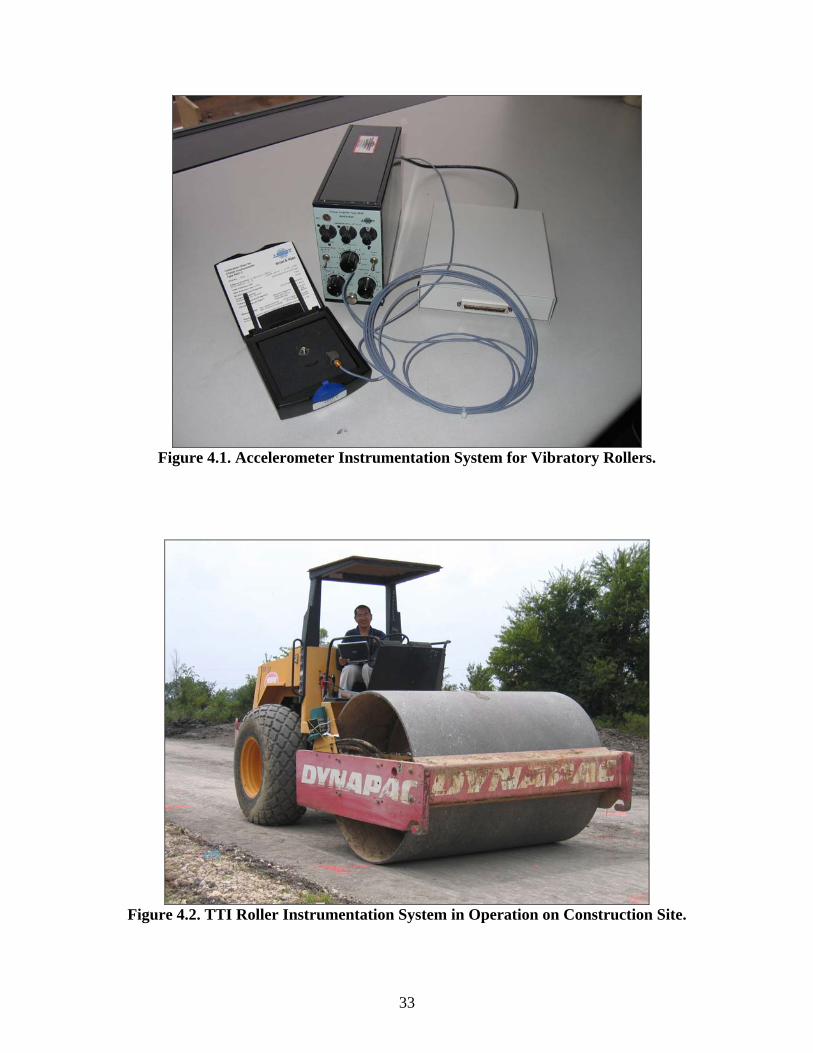
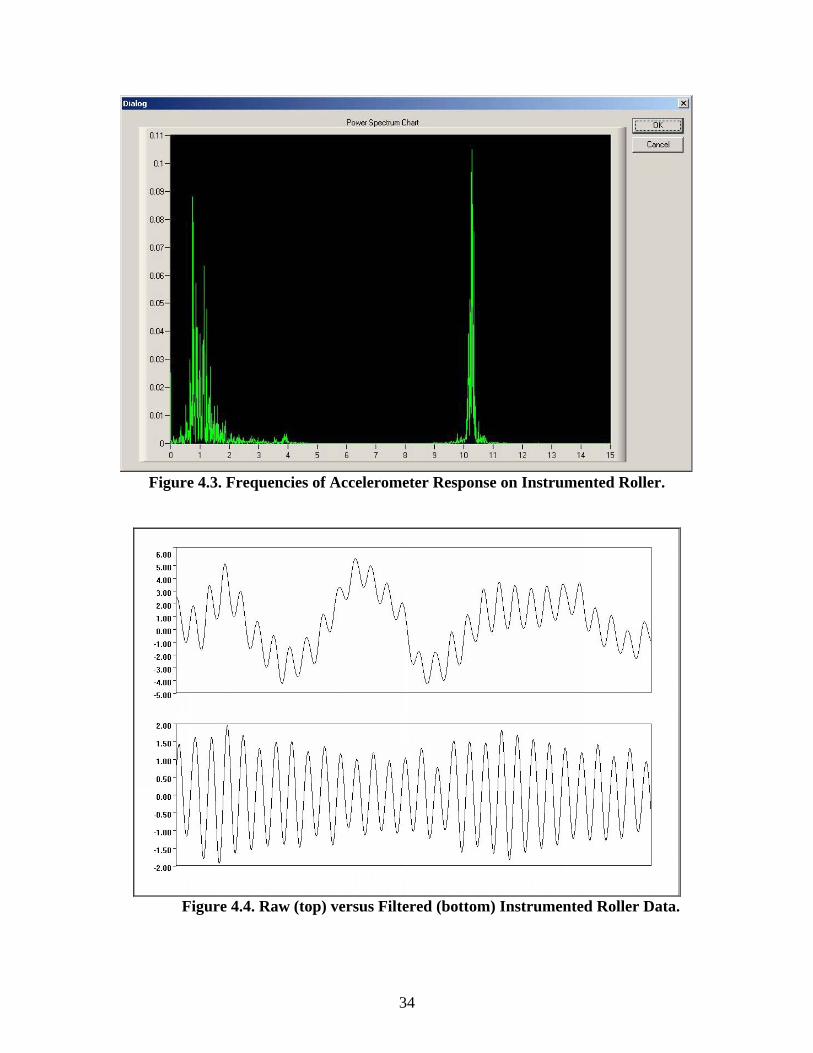
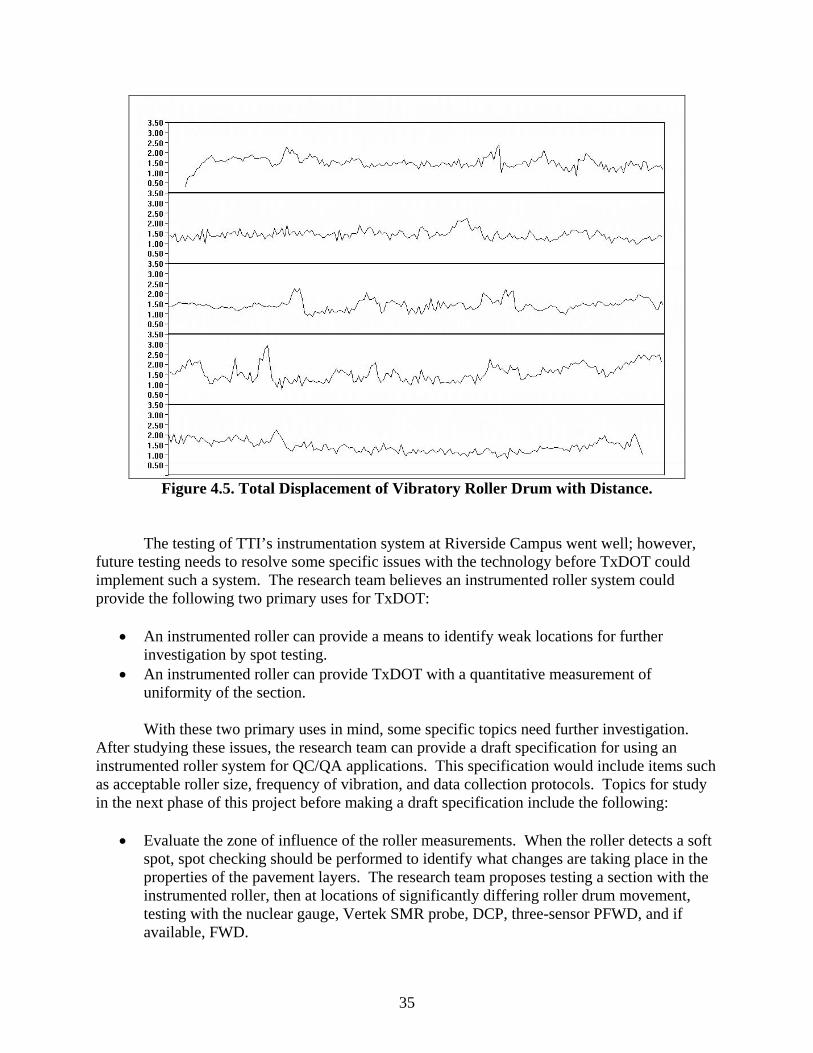
TTI’s system, shown in Figure 4.1, provides the displacement of the roller drum directly into a computer. Figure 4.2 shows the system in operation on a construction site. TTI’s software processes the data to determine the frequency of operation of the roller, as Figure 4.3 illustrates, then filters unwanted frequencies from the data to isolate solely the cyclic movement of the roller drum. Figure 4.4 illustrates the raw versus filtered data. With the filtered data, TTI’s software then can display the total displacement of the roller drum with distance, as shown in Figure 4.5.
33
Figure 4.1. Accelerometer Instrumentation System for Vibratory Rollers.
Figure 4.2. TTI Roller Instrumentation System in Operation on Construction Site.
34
Figure 4.3. Frequencies of Accelerometer Response on Instrumented Roller.
Figure 4.4. Raw (top) versus Filtered (bottom) Instrumented Roller Data.
35
Figure 4.5. Total Displacement of Vibratory Roller Drum with Distance.
The testing of TTI’s instrumentation system at Riverside Campus went well; however,
future testing needs to resolve some specific issues with the technology before TxDOT could implement such a system. The research team believes an instrumented roller system could provide the following two primary uses for TxDOT:
• An instrumented roller can provide a means to identify weak locations for further
investigation by spot testing. • An instrumented roller can provide TxDOT with a quantitative measurement of
uniformity of the section.
With these two primary uses in mind, some specific topics need further investigation. After studying these issues, the research team can provide a draft specification for using an instrumented roller system for QC/QA applications. This specification would include items such as acceptable roller size, frequency of vibration, and data collection protocols. Topics for study in the next phase of this project before making a draft specification include the following:
• Evaluate the zone of influence of the roller measurements. When the roller detects a soft
spot, spot checking should be performed to identify what changes are taking place in the properties of the pavement layers. The research team proposes testing a section with the instrumented roller, then at locations of significantly differing roller drum movement, testing with the nuclear gauge, Vertek SMR probe, DCP, three-sensor PFWD, and if available, FWD.
36
• Evaluate data processing techniques. One of the instrumentation manufacturers claims to be able to determine if a location consists of layered soil by analysis of roller data from multiple passes. Work is needed that studies whether valid conclusions can be made from instrumented roller data regarding the layering of the section. Research work needs to identify if a data collection/processing protocol exists that could isolate the layer of interest.
• Evaluate the optimal roller size. Work should be initiated to evaluate the optimal size roller for instrumentation. Effects such as the zone of influence, ease of use, and potential damage to the pavement should be examined.
• Evaluate the optimal roller frequency. The impact of roller frequency on the zone of influence should be studied, and recommendations made accordingly.
RECOMMENDED DATA COLLECTION AND EVALUATION PLAN FOR FUTURE WORK Subgrade For subgrade layers, the research suggests an approach to evaluate the new systems as follows:
• Perform rolling over the subgrade with an instrumented vibratory roller. Mark several locations of high and low movement.
• At the marked locations, perform spot tests with the following devices: PFWD, DCP, Vertek SMR, and nuclear gauge. Collect a direct push sample from the center of the test location.
• Seal the direct push sample to return to the laboratory. • Perform proof rolling over the section with the automated proof roller. Mark sections of
the least and greatest displacement. • At the marked locations, perform spot tests and collect a direct push sample from the
center of the test location. Seal the direct push sample to return to the laboratory. • At the laboratory, extrude the direct push samples and trim them to have squared ends
and a known volume. • Test each sample for seismic modulus with the free-free laboratory testing system. • Test each sample for resilient modulus. • Test each sample for shear strength.
Base For base layers, the research suggests an approach to evaluate the new systems as follows:
• Perform rolling over the compacted base with an instrumented vibratory roller. Mark several locations of high and low movement.
• At the marked locations, perform spot tests with the following devices: PFWD, FWD, DCP, Vertek SMR, and nuclear gauge.
37
• Perform proof rolling over the section with the automated proof roller. Mark sections of the least and greatest displacement.
• At the marked locations, perform spot tests with the PFWD, FWD, DCP, Vertek SMR, and nuclear gauge.
HMA
• During the paving operation, collect infrared imaging data over the section. • After completion of the final rolling, collect a pass over the section with the three-
channel GPR system. • Mark locations of significantly varying temperature from the infrared data. • Mark locations of significantly varying surface dielectric from the GPR data. • At each marked location, collect a stationary GPR reading and density measurements
with the nuclear gauge, PQI, and Pavetracker Plus. • Core each marked location and return the cores to the laboratory. • At the laboratory, test each core for bulk density, asphalt content, and gradation.
CONCLUSIONS In the first year of this project, the research team analyzed the benefits of several spot-specific testing systems for potential use for controlling flexible pavement construction. Systems were evaluated that could measure moisture content, density, strength, stiffness/modulus, and uniformity. Currently, no devices exist that are direct replacements for the nuclear density gauge. For subgrade soils, non-nuclear methods exist that can yield reasonable estimates of dry density and moisture content; however, these methods are based on collecting manually driven tube samples of known volume. These methods have been around for quite some time, and the research team believes future efforts should focus on newer technologies that can relate better to the parameters of the pavement design. Thus, the future work with subgrades using spot-specific systems should focus on the dielectric-based moisture measurement systems and the DCP and PFWD systems for measuring strength and modulus, respectively. With base layers, no suitable alternative for spot-checking density exists. The only option currently is the sand cone test. Neither TxDOT nor the research team (nor most technicians) desire to revert to this test. The primary focus of future work on this project should focus on further development of systems that provide 100 percent coverage. These systems include instrumented vibratory rollers, automated proof rollers, ground-penetrating radar, and infrared imaging. The portable instrumentation system for vibratory rollers is functioning; the second phase of this project will evaluate and further refine this system. Additionally, sensors for automated proof rolling have been obtained; the system will be assembled and tested in the second phase of this project. The research team produced an infrared imaging system for use on upcoming projects; additionally, a multiple-channel GPR system has been produced and will be evaluated in the second phase of this project.
38
The ultimate objective of the 100 percent coverage devices is two-fold. First, these devices can quantify uniformity. Second, these devices can serve as rapid screening tools to decide where spot testing is necessary. The second phase of this project will focus on evaluating a system of controlling flexible pavement construction where the section first gets tested with a 100 percent coverage device. After analysis in the field of the 100-percent coverage data, the spot tests will be performed at specific locations to evaluate what changes in properties exist. Finally, efforts will be made to collect field samples for laboratory testing. The research team will use these samples to evaluate the relationship between field test data and laboratory properties. In this manner, the research team will evaluate a model system that could control future construction projects.