Embed Size (px)
Citation preview
New Zealand motor vehicle registration statistics
Prepared and published byLand Transport New Zealand
Private Bag, Palmerston North, New Zealand
ISSN 0114–7234© Copyright 2007
2006
LAN 10650 MV Reg Stats - 2006.in1 1LAN 10650 MV Reg Stats - 2006.in1 1 28/02/2008 3:51:56 p.m.28/02/2008 3:51:56 p.m.
Cars
Table 1 Annual registration of new cars, 1926–2006 3Table 2 Registration of new cars, by make 4Table 3 Registration of new cars, by cc rating 7Table 4 Main countries of origin of new cars 8Table 4a Main countries of previous registration of ex-overseas (used-imports) cars 8Table 5 Annual registration of ex-overseas cars, 1936–2006 9Table 6 Registration of ex-overseas cars, by make 10Table 7 New cars, by make and postal district, North Island 13Table 8 New cars, by make and postal district, South Island 16
Commercials
Table 9 Annual registration of new commercials, 1925–2006 18Table 10 Registration of new commercials, by make 19Table 11 Main countries of origin of new commercials 21Table 11a Main countries of previous registration of ex-overseas (used-imports) commercials 21Table 12 Registration of new commercials by gross vehicle weight 22Table 13 New commercials, by make and postal district, North Island 23Table 14 New commercials, by make and postal district, South Island 25Table 15 Registration of ex-overseas commercials, by make 27
Tractors
Table 16 Annual registration of new tractors, 1947–2006 29Table 17 Registration of new tractors, by make 30Table 18 New tractors, by make and postal district, North Island 32Table 19 New tractors, by make and postal district, South Island 34
Motorcycles and mopeds
Table 20 Annual registration of new motorcycles over 60cc, 1926–2006 35Table 21 Annual registration of new mopeds and motorcycles under 61cc, 1952–2006 36Table 22 Registration of new motorcycles over 60cc, by make 37Table 23 Registration of new mopeds and motorcycles under 61cc, by make 39Table 24 New motorcycles over 60cc, by make and postal district, North Island 41Table 25 New motorcycles over 60cc, by make and postal district, South Island 43Table 26 New mopeds and motorcycles under 61cc, by make and postal district, North Island 44Table 27 New mopeds and motorcycles under 61cc, by make and postal district, South Island 45
General
Table 28 Vehicles registered during the year 2006 46Table 29 Vehicles registered during the year, by vehicle type and fuel type 47Table 30 Age profi le of the major vehicle types, by type and age group, as at year end 2006 48Table 31 Total licensed vehicles, by vehicle type, as at year end June 2006 50Table 32 Total change of ownership transactions for 2006, by vehicle type and sale type 51Table 33 Change of ownership transactions for 2006, North Island by vehicle type, sale type and postal district 52Table 34 Change of ownership transactions for 2006, South Island by vehicle type, sale type and postal district 54Table 35 Cars registered in 2006, 'NZ new' only, by make and model 56Table 36 Licensed vehicles as at year end 2006, by vehicle type and postal district 59Table 37 Fuel types: total vehicles as at year end 2006, by vehicle type and fuel type 60Table 38 Colours of cars as at year end 2006 61Table 39 Vehicle fl eet as at 30 June 62
Glossary of terms 63
Contents
Our contact details
For general enquiries, or more information about Land Transport New Zealand, please email [email protected]
Land Transport New Zealand
Private BagPalmerston NorthNew Zealand
Help desks
General enquiries 0800 699 000Driver licensing 0800 822 422Road user charges 0800 655 644Motor vehicle registration 0800 108 809Overdimension permits 0800 683 774
LAN 10650 MV Reg Stats - 2006.in2 2LAN 10650 MV Reg Stats - 2006.in2 2 28/02/2008 3:54:17 p.m.28/02/2008 3:54:17 p.m.
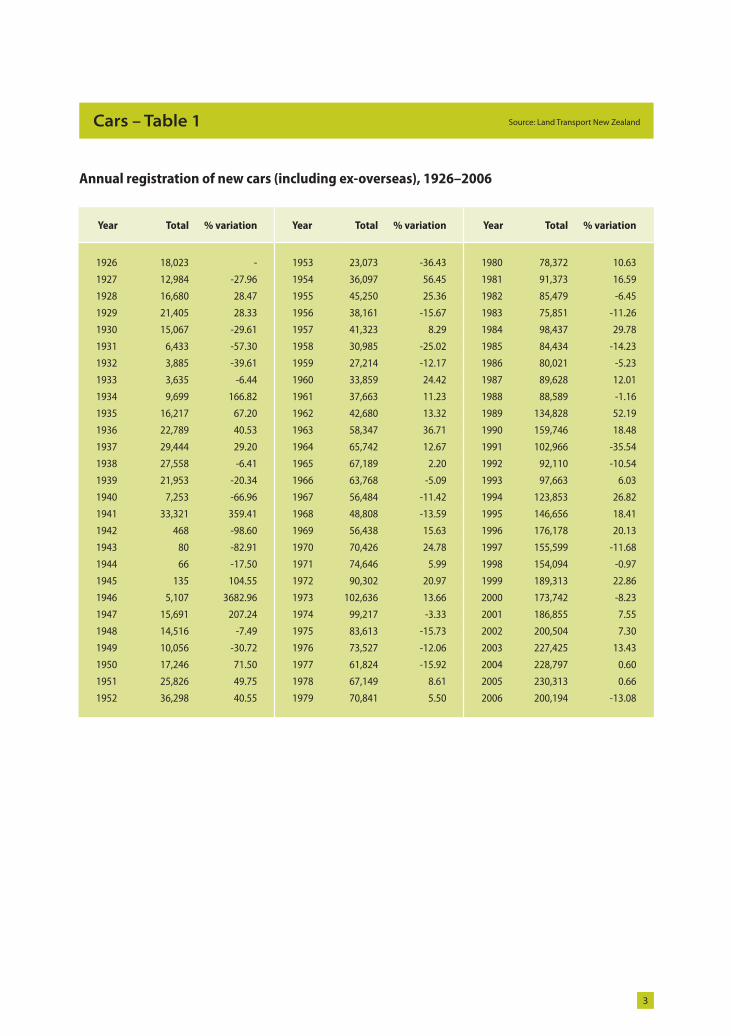
Year Total % variation Year Total % variation Year Total % variation
1926 18,023 - 1953 23,073 -36.43 1980 78,372 10.63
1927 12,984 -27.96 1954 36,097 56.45 1981 91,373 16.59
1928 16,680 28.47 1955 45,250 25.36 1982 85,479 -6.45
1929 21,405 28.33 1956 38,161 -15.67 1983 75,851 -11.26
1930 15,067 -29.61 1957 41,323 8.29 1984 98,437 29.78
1931 6,433 -57.30 1958 30,985 -25.02 1985 84,434 -14.23
1932 3,885 -39.61 1959 27,214 -12.17 1986 80,021 -5.23
1933 3,635 -6.44 1960 33,859 24.42 1987 89,628 12.01
1934 9,699 166.82 1961 37,663 11.23 1988 88,589 -1.16
1935 16,217 67.20 1962 42,680 13.32 1989 134,828 52.19
1936 22,789 40.53 1963 58,347 36.71 1990 159,746 18.48
1937 29,444 29.20 1964 65,742 12.67 1991 102,966 -35.54
1938 27,558 -6.41 1965 67,189 2.20 1992 92,110 -10.54
1939 21,953 -20.34 1966 63,768 -5.09 1993 97,663 6.03
1940 7,253 -66.96 1967 56,484 -11.42 1994 123,853 26.82
1941 33,321 359.41 1968 48,808 -13.59 1995 146,656 18.41
1942 468 -98.60 1969 56,438 15.63 1996 176,178 20.13
1943 80 -82.91 1970 70,426 24.78 1997 155,599 -11.68
1944 66 -17.50 1971 74,646 5.99 1998 154,094 -0.97
1945 135 104.55 1972 90,302 20.97 1999 189,313 22.86
1946 5,107 3682.96 1973 102,636 13.66 2000 173,742 -8.23
1947 15,691 207.24 1974 99,217 -3.33 2001 186,855 7.55
1948 14,516 -7.49 1975 83,613 -15.73 2002 200,504 7.30
1949 10,056 -30.72 1976 73,527 -12.06 2003 227,425 13.43
1950 17,246 71.50 1977 61,824 -15.92 2004 228,797 0.60
1951 25,826 49.75 1978 67,149 8.61 2005 230,313 0.66
1952 36,298 40.55 1979 70,841 5.50 2006 200,194 -13.08
Annual registration of new cars (including ex-overseas), 1926–2006
3
Source: Land Transport New ZealandCars – Table 1
LAN 10650 MV Reg Stats - 2006.in3 3LAN 10650 MV Reg Stats - 2006.in3 3 28/02/2008 3:54:17 p.m.28/02/2008 3:54:17 p.m.
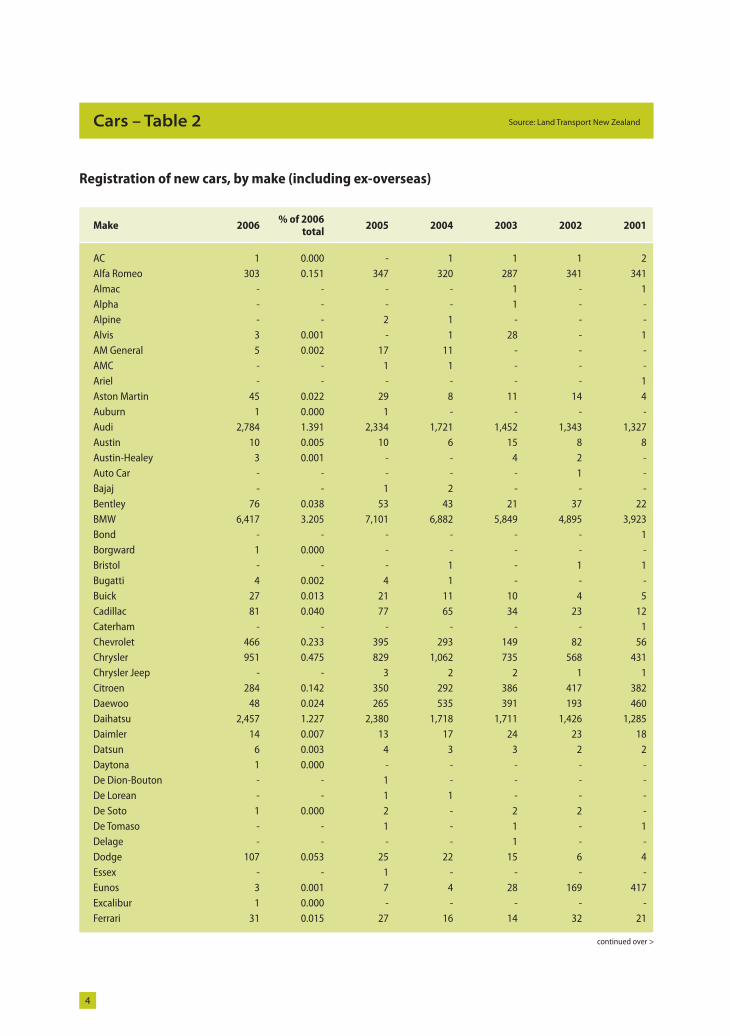
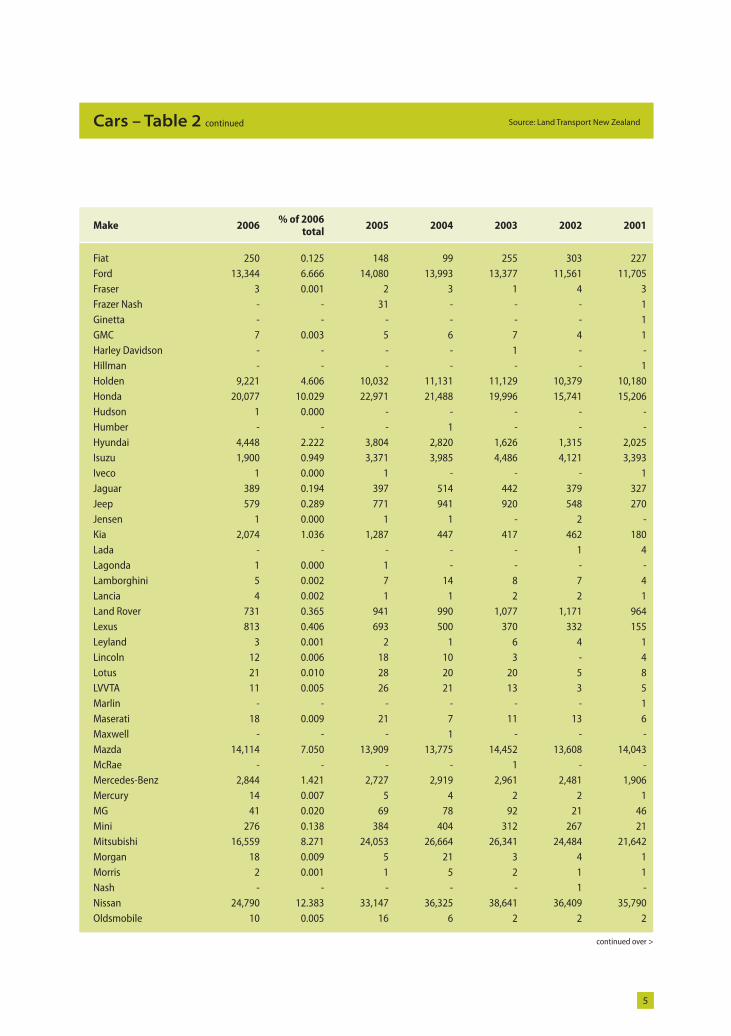
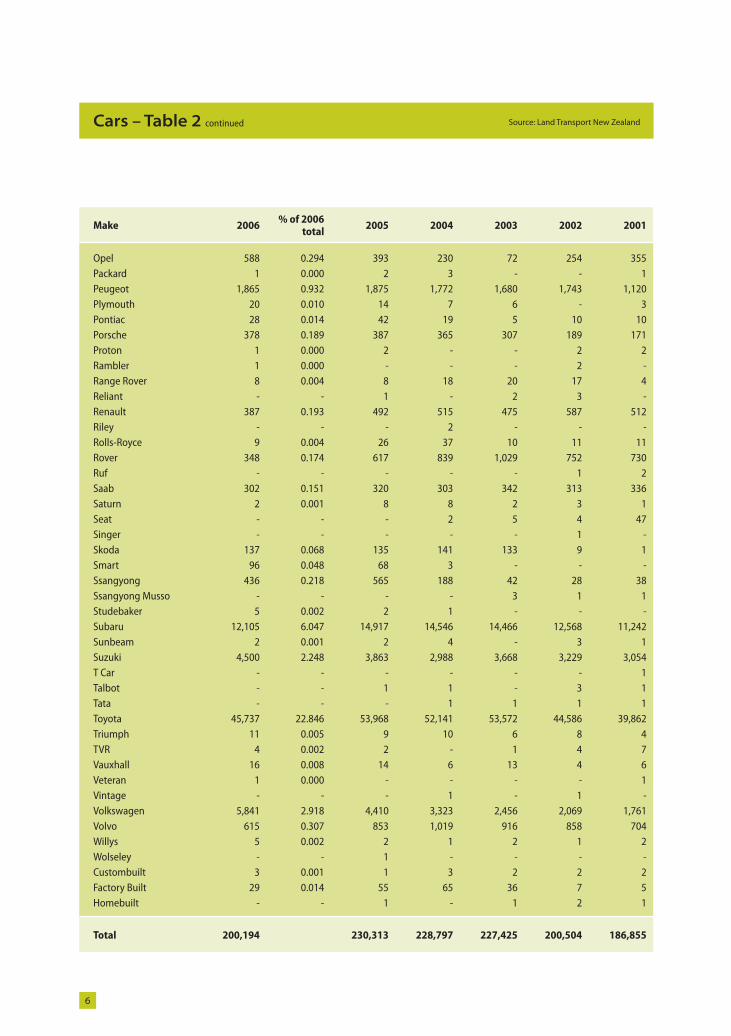
Registration of new cars, by make (including ex-overseas)
4
Source: Land Transport New ZealandCars – Table 2
Make 2006% of 2006
total2005 2004 2003 2002 2001
AC 1 0.000 - 1 1 1 2Alfa Romeo 303 0.151 347 320 287 341 341Almac - - - - 1 - 1Alpha - - - - 1 - -Alpine - - 2 1 - - -Alvis 3 0.001 - 1 28 - 1AM General 5 0.002 17 11 - - -AMC - - 1 1 - - -Ariel - - - - - - 1Aston Martin 45 0.022 29 8 11 14 4Auburn 1 0.000 1 - - - -Audi 2,784 1.391 2,334 1,721 1,452 1,343 1,327Austin 10 0.005 10 6 15 8 8Austin-Healey 3 0.001 - - 4 2 -Auto Car - - - - - 1 -Bajaj - - 1 2 - - -Bentley 76 0.038 53 43 21 37 22BMW 6,417 3.205 7,101 6,882 5,849 4,895 3,923Bond - - - - - - 1Borgward 1 0.000 - - - - -Bristol - - - 1 - 1 1Bugatti 4 0.002 4 1 - - -Buick 27 0.013 21 11 10 4 5Cadillac 81 0.040 77 65 34 23 12Caterham - - - - - - 1Chevrolet 466 0.233 395 293 149 82 56Chrysler 951 0.475 829 1,062 735 568 431Chrysler Jeep - - 3 2 2 1 1Citroen 284 0.142 350 292 386 417 382Daewoo 48 0.024 265 535 391 193 460Daihatsu 2,457 1.227 2,380 1,718 1,711 1,426 1,285Daimler 14 0.007 13 17 24 23 18Datsun 6 0.003 4 3 3 2 2Daytona 1 0.000 - - - - -De Dion-Bouton - - 1 - - - -De Lorean - - 1 1 - - -De Soto 1 0.000 2 - 2 2 -De Tomaso - - 1 - 1 - 1Delage - - - - 1 - -Dodge 107 0.053 25 22 15 6 4Essex - - 1 - - - -Eunos 3 0.001 7 4 28 169 417Excalibur 1 0.000 - - - - -Ferrari 31 0.015 27 16 14 32 21
continued over >
LAN 10650 MV Reg Stats - 2006.in4 4LAN 10650 MV Reg Stats - 2006.in4 4 28/02/2008 3:54:17 p.m.28/02/2008 3:54:17 p.m.
5
Source: Land Transport New ZealandCars – Table 2 continued
continued over >
Make 2006% of 2006
total2005 2004 2003 2002 2001
Fiat 250 0.125 148 99 255 303 227Ford 13,344 6.666 14,080 13,993 13,377 11,561 11,705Fraser 3 0.001 2 3 1 4 3Frazer Nash - - 31 - - - 1Ginetta - - - - - - 1GMC 7 0.003 5 6 7 4 1Harley Davidson - - - - 1 - -Hillman - - - - - - 1Holden 9,221 4.606 10,032 11,131 11,129 10,379 10,180Honda 20,077 10.029 22,971 21,488 19,996 15,741 15,206Hudson 1 0.000 - - - - -Humber - - - 1 - - -Hyundai 4,448 2.222 3,804 2,820 1,626 1,315 2,025Isuzu 1,900 0.949 3,371 3,985 4,486 4,121 3,393Iveco 1 0.000 1 - - - 1Jaguar 389 0.194 397 514 442 379 327Jeep 579 0.289 771 941 920 548 270Jensen 1 0.000 1 1 - 2 -Kia 2,074 1.036 1,287 447 417 462 180Lada - - - - - 1 4Lagonda 1 0.000 1 - - - -Lamborghini 5 0.002 7 14 8 7 4Lancia 4 0.002 1 1 2 2 1Land Rover 731 0.365 941 990 1,077 1,171 964Lexus 813 0.406 693 500 370 332 155Leyland 3 0.001 2 1 6 4 1Lincoln 12 0.006 18 10 3 - 4Lotus 21 0.010 28 20 20 5 8LVVTA 11 0.005 26 21 13 3 5Marlin - - - - - - 1Maserati 18 0.009 21 7 11 13 6Maxwell - - - 1 - - -Mazda 14,114 7.050 13,909 13,775 14,452 13,608 14,043McRae - - - - 1 - -Mercedes-Benz 2,844 1.421 2,727 2,919 2,961 2,481 1,906Mercury 14 0.007 5 4 2 2 1MG 41 0.020 69 78 92 21 46Mini 276 0.138 384 404 312 267 21Mitsubishi 16,559 8.271 24,053 26,664 26,341 24,484 21,642Morgan 18 0.009 5 21 3 4 1Morris 2 0.001 1 5 2 1 1Nash - - - - - 1 -Nissan 24,790 12.383 33,147 36,325 38,641 36,409 35,790Oldsmobile 10 0.005 16 6 2 2 2
LAN 10650 MV Reg Stats - 2006.in5 5LAN 10650 MV Reg Stats - 2006.in5 5 28/02/2008 3:54:18 p.m.28/02/2008 3:54:18 p.m.
6
Source: Land Transport New ZealandCars – Table 2 continued
Make 2006% of 2006
total2005 2004 2003 2002 2001
Opel 588 0.294 393 230 72 254 355Packard 1 0.000 2 3 - - 1Peugeot 1,865 0.932 1,875 1,772 1,680 1,743 1,120Plymouth 20 0.010 14 7 6 - 3Pontiac 28 0.014 42 19 5 10 10Porsche 378 0.189 387 365 307 189 171Proton 1 0.000 2 - - 2 2Rambler 1 0.000 - - - 2 -Range Rover 8 0.004 8 18 20 17 4Reliant - - 1 - 2 3 -Renault 387 0.193 492 515 475 587 512Riley - - - 2 - - -Rolls-Royce 9 0.004 26 37 10 11 11Rover 348 0.174 617 839 1,029 752 730Ruf - - - - - 1 2Saab 302 0.151 320 303 342 313 336Saturn 2 0.001 8 8 2 3 1Seat - - - 2 5 4 47Singer - - - - - 1 -Skoda 137 0.068 135 141 133 9 1Smart 96 0.048 68 3 - - -Ssangyong 436 0.218 565 188 42 28 38Ssangyong Musso - - - - 3 1 1Studebaker 5 0.002 2 1 - - -Subaru 12,105 6.047 14,917 14,546 14,466 12,568 11,242Sunbeam 2 0.001 2 4 - 3 1Suzuki 4,500 2.248 3,863 2,988 3,668 3,229 3,054T Car - - - - - - 1Talbot - - 1 1 - 3 1Tata - - - 1 1 1 1Toyota 45,737 22.846 53,968 52,141 53,572 44,586 39,862Triumph 11 0.005 9 10 6 8 4TVR 4 0.002 2 - 1 4 7Vauxhall 16 0.008 14 6 13 4 6Veteran 1 0.000 - - - - 1Vintage - - - 1 - 1 -Volkswagen 5,841 2.918 4,410 3,323 2,456 2,069 1,761Volvo 615 0.307 853 1,019 916 858 704Willys 5 0.002 2 1 2 1 2Wolseley - - 1 - - - -Custombuilt 3 0.001 1 3 2 2 2Factory Built 29 0.014 55 65 36 7 5Homebuilt - - 1 - 1 2 1
Total 200,194 230,313 228,797 227,425 200,504 186,855
LAN 10650 MV Reg Stats - 2006.in6 6LAN 10650 MV Reg Stats - 2006.in6 6 28/02/2008 3:54:18 p.m.28/02/2008 3:54:18 p.m.
7
Source: Land Transport Safety AuthorityTable numberCars – Table 3
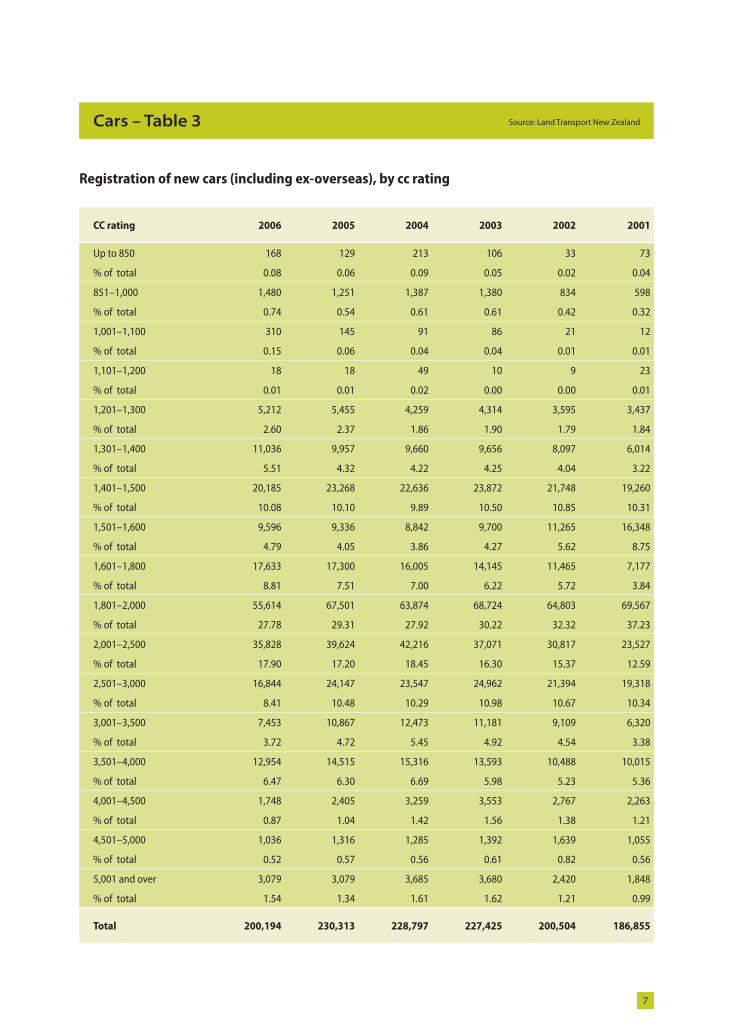
Registration of new cars (including ex-overseas), by cc rating
7
Source: Land Transport New Zealand
CC rating 2006 2005 2004 2003 2002 2001
Up to 850 168 129 213 106 33 73
% of total 0.08 0.06 0.09 0.05 0.02 0.04
851–1,000 1,480 1,251 1,387 1,380 834 598
% of total 0.74 0.54 0.61 0.61 0.42 0.32
1,001–1,100 310 145 91 86 21 12
% of total 0.15 0.06 0.04 0.04 0.01 0.01
1,101–1,200 18 18 49 10 9 23
% of total 0.01 0.01 0.02 0.00 0.00 0.01
1,201–1,300 5,212 5,455 4,259 4,314 3,595 3,437
% of total 2.60 2.37 1.86 1.90 1.79 1.84
1,301–1,400 11,036 9,957 9,660 9,656 8,097 6,014
% of total 5.51 4.32 4.22 4.25 4.04 3.22
1,401–1,500 20,185 23,268 22,636 23,872 21,748 19,260
% of total 10.08 10.10 9.89 10.50 10.85 10.31
1,501–1,600 9,596 9,336 8,842 9,700 11,265 16,348
% of total 4.79 4.05 3.86 4.27 5.62 8.75
1,601–1,800 17,633 17,300 16,005 14,145 11,465 7,177
% of total 8.81 7.51 7.00 6.22 5.72 3.84
1,801–2,000 55,614 67,501 63,874 68,724 64,803 69,567
% of total 27.78 29.31 27.92 30.22 32.32 37.23
2,001–2,500 35,828 39,624 42,216 37,071 30,817 23,527
% of total 17.90 17.20 18.45 16.30 15.37 12.59
2,501–3,000 16,844 24,147 23,547 24,962 21,394 19,318
% of total 8.41 10.48 10.29 10.98 10.67 10.34
3,001–3,500 7,453 10,867 12,473 11,181 9,109 6,320
% of total 3.72 4.72 5.45 4.92 4.54 3.38
3,501–4,000 12,954 14,515 15,316 13,593 10,488 10,015
% of total 6.47 6.30 6.69 5.98 5.23 5.36
4,001–4,500 1,748 2,405 3,259 3,553 2,767 2,263
% of total 0.87 1.04 1.42 1.56 1.38 1.21
4,501–5,000 1,036 1,316 1,285 1,392 1,639 1,055
% of total 0.52 0.57 0.56 0.61 0.82 0.56
5,001 and over 3,079 3,079 3,685 3,680 2,420 1,848
% of total 1.54 1.34 1.61 1.62 1.21 0.99
Total 200,194 230,313 228,797 227,425 200,504 186,855
LAN 10650 MV Reg Stats - 2006.in7 7LAN 10650 MV Reg Stats - 2006.in7 7 28/02/2008 3:54:19 p.m.28/02/2008 3:54:19 p.m.
8
Source: Land Transport Safety AuthorityTable numberCars – Table 4
8
Source: Land Transport New Zealand
2006 2005 2004 2003 2002 2001
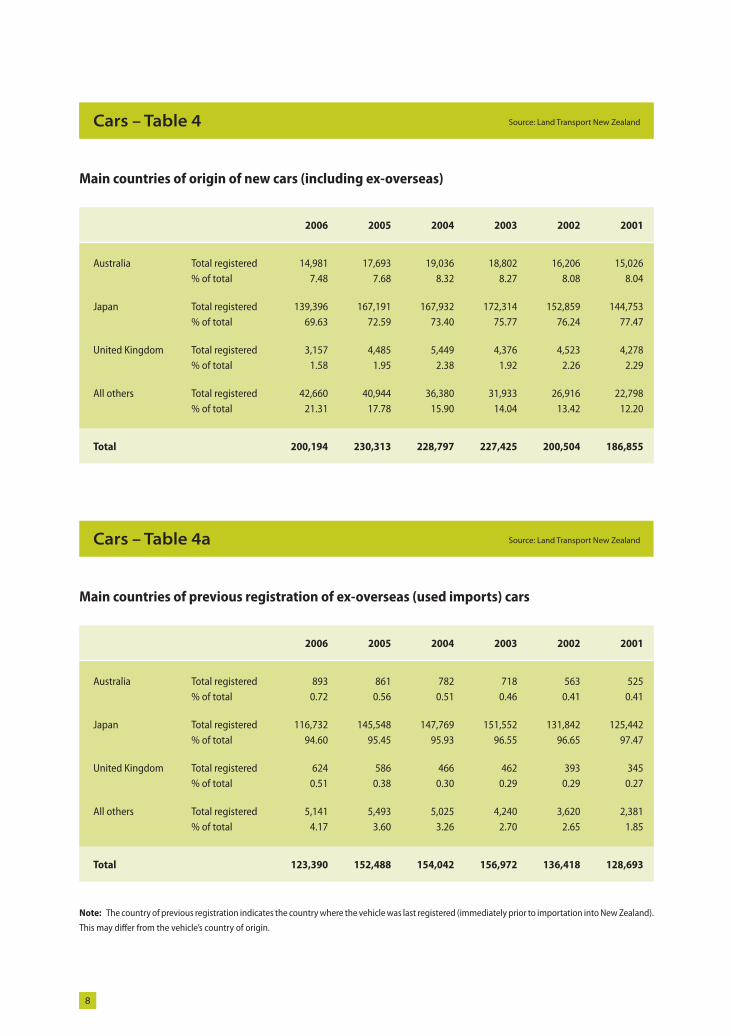
Australia Total registered 14,981 17,693 19,036 18,802 16,206 15,026% of total 7.48 7.68 8.32 8.27 8.08 8.04
Japan Total registered 139,396 167,191 167,932 172,314 152,859 144,753% of total 69.63 72.59 73.40 75.77 76.24 77.47
United Kingdom Total registered 3,157 4,485 5,449 4,376 4,523 4,278% of total 1.58 1.95 2.38 1.92 2.26 2.29
All others Total registered 42,660 40,944 36,380 31,933 26,916 22,798% of total 21.31 17.78 15.90 14.04 13.42 12.20
Total 200,194 230,313 228,797 227,425 200,504 186,855
Main countries of origin of new cars (including ex-overseas)
Cars – Table 4a Source: Land Transport New Zealand
2006 2005 2004 2003 2002 2001
Australia Total registered 893 861 782 718 563 525% of total 0.72 0.56 0.51 0.46 0.41 0.41
Japan Total registered 116,732 145,548 147,769 151,552 131,842 125,442% of total 94.60 95.45 95.93 96.55 96.65 97.47
United Kingdom Total registered 624 586 466 462 393 345% of total 0.51 0.38 0.30 0.29 0.29 0.27
All others Total registered 5,141 5,493 5,025 4,240 3,620 2,381% of total 4.17 3.60 3.26 2.70 2.65 1.85
Total 123,390 152,488 154,042 156,972 136,418 128,693
Main countries of previous registration of ex-overseas (used imports) cars
Note: The country of previous registration indicates the country where the vehicle was last registered (immediately prior to importation into New Zealand).
This may diff er from the vehicle’s country of origin.
LAN 10650 MV Reg Stats - 2006.in8 8LAN 10650 MV Reg Stats - 2006.in8 8 28/02/2008 3:54:19 p.m.28/02/2008 3:54:19 p.m.
9
Source: Land Transport New ZealandCars – Table 5
Year Total % of all cars registered
% var. from prev. year
Year Total % of all cars registered
% var. from prev. year
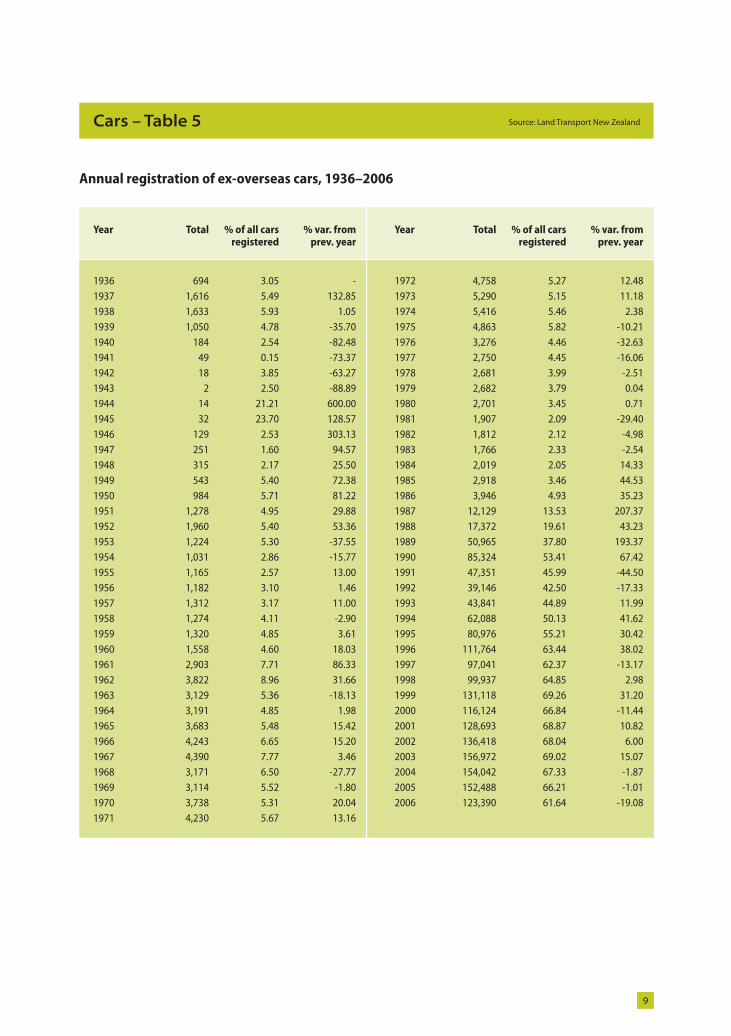
1936 694 3.05 - 1972 4,758 5.27 12.481937 1,616 5.49 132.85 1973 5,290 5.15 11.181938 1,633 5.93 1.05 1974 5,416 5.46 2.381939 1,050 4.78 -35.70 1975 4,863 5.82 -10.211940 184 2.54 -82.48 1976 3,276 4.46 -32.631941 49 0.15 -73.37 1977 2,750 4.45 -16.061942 18 3.85 -63.27 1978 2,681 3.99 -2.511943 2 2.50 -88.89 1979 2,682 3.79 0.041944 14 21.21 600.00 1980 2,701 3.45 0.711945 32 23.70 128.57 1981 1,907 2.09 -29.401946 129 2.53 303.13 1982 1,812 2.12 -4.981947 251 1.60 94.57 1983 1,766 2.33 -2.541948 315 2.17 25.50 1984 2,019 2.05 14.331949 543 5.40 72.38 1985 2,918 3.46 44.531950 984 5.71 81.22 1986 3,946 4.93 35.231951 1,278 4.95 29.88 1987 12,129 13.53 207.371952 1,960 5.40 53.36 1988 17,372 19.61 43.231953 1,224 5.30 -37.55 1989 50,965 37.80 193.371954 1,031 2.86 -15.77 1990 85,324 53.41 67.421955 1,165 2.57 13.00 1991 47,351 45.99 -44.501956 1,182 3.10 1.46 1992 39,146 42.50 -17.331957 1,312 3.17 11.00 1993 43,841 44.89 11.991958 1,274 4.11 -2.90 1994 62,088 50.13 41.621959 1,320 4.85 3.61 1995 80,976 55.21 30.421960 1,558 4.60 18.03 1996 111,764 63.44 38.021961 2,903 7.71 86.33 1997 97,041 62.37 -13.171962 3,822 8.96 31.66 1998 99,937 64.85 2.981963 3,129 5.36 -18.13 1999 131,118 69.26 31.201964 3,191 4.85 1.98 2000 116,124 66.84 -11.441965 3,683 5.48 15.42 2001 128,693 68.87 10.821966 4,243 6.65 15.20 2002 136,418 68.04 6.001967 4,390 7.77 3.46 2003 156,972 69.02 15.071968 3,171 6.50 -27.77 2004 154,042 67.33 -1.871969 3,114 5.52 -1.80 2005 152,488 66.21 -1.011970 3,738 5.31 20.04 2006 123,390 61.64 -19.081971 4,230 5.67 13.16
Annual registration of ex-overseas cars, 1936–2006
LAN 10650 MV Reg Stats - 2006.in9 9LAN 10650 MV Reg Stats - 2006.in9 9 28/02/2008 3:54:19 p.m.28/02/2008 3:54:19 p.m.
10
Source: Land Transport New ZealandCars – Table 6
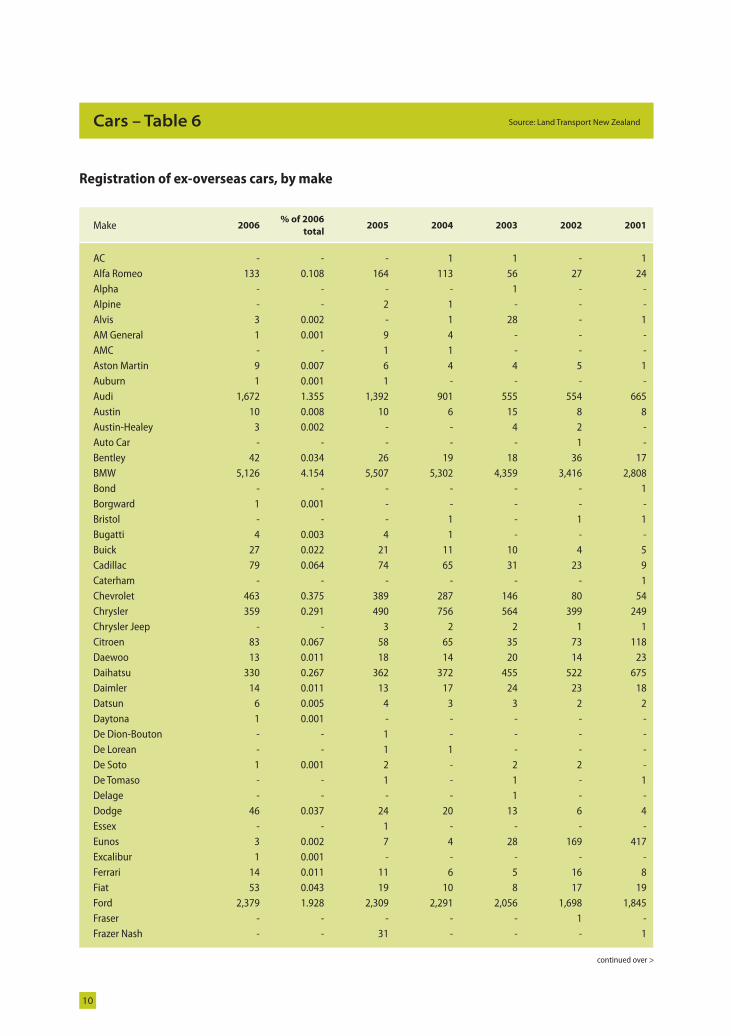
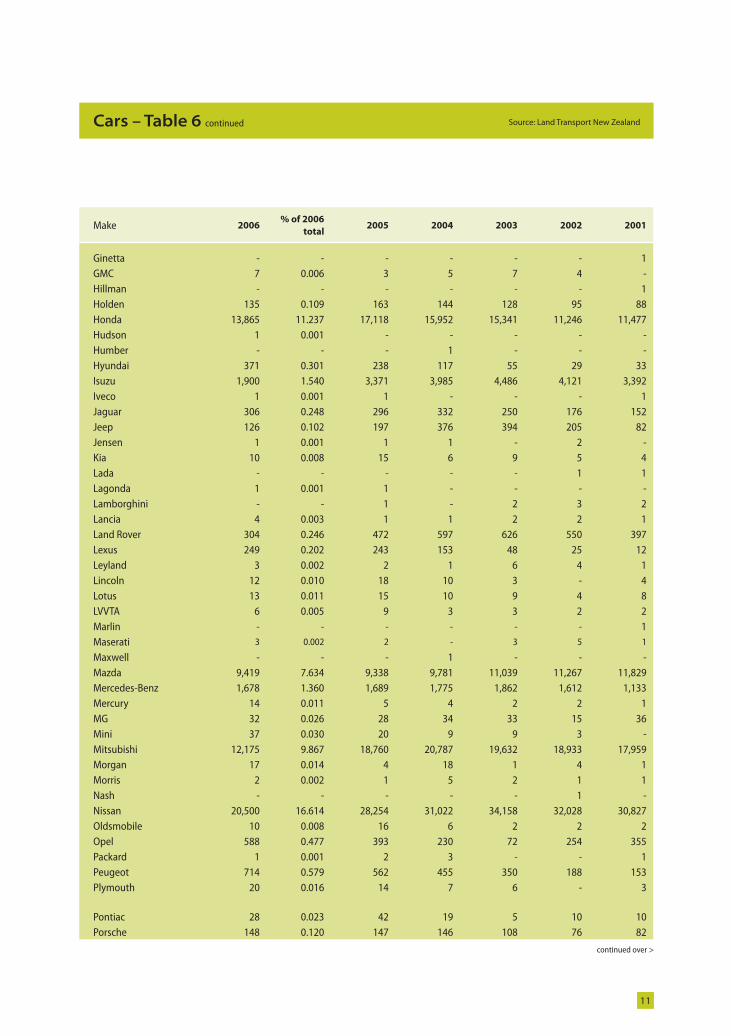
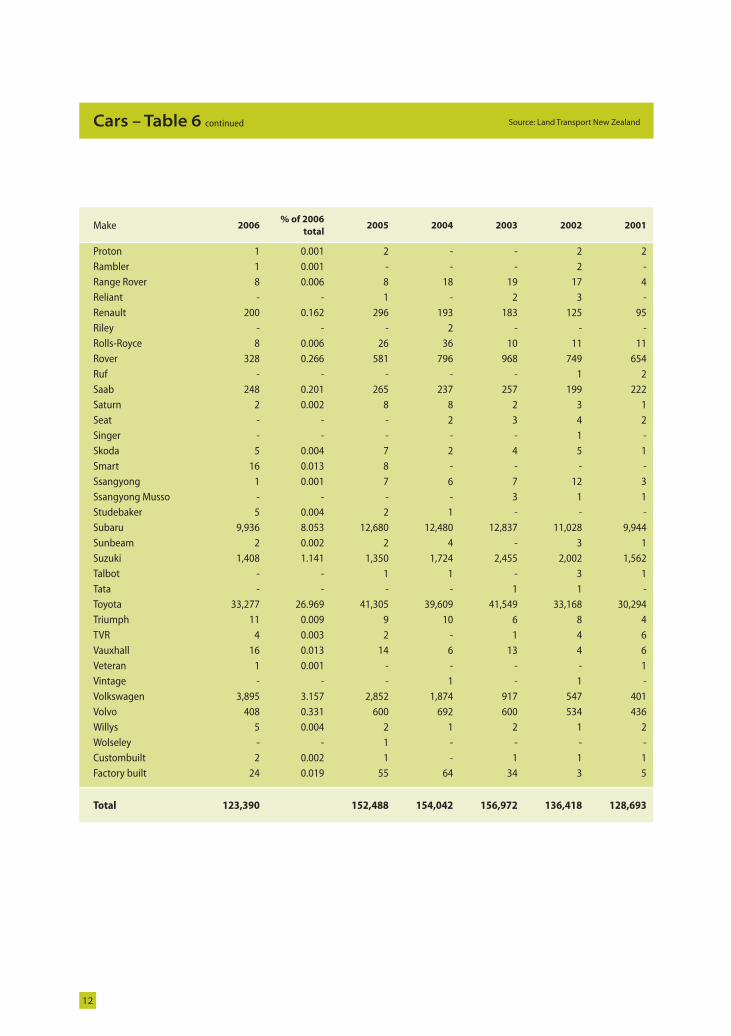
Registration of ex-overseas cars, by make
Make 2006% of 2006
total2005 2004 2003 2002 2001
AC - - - 1 1 - 1Alfa Romeo 133 0.108 164 113 56 27 24Alpha - - - - 1 - -Alpine - - 2 1 - - -Alvis 3 0.002 - 1 28 - 1AM General 1 0.001 9 4 - - -AMC - - 1 1 - - -Aston Martin 9 0.007 6 4 4 5 1Auburn 1 0.001 1 - - - -Audi 1,672 1.355 1,392 901 555 554 665Austin 10 0.008 10 6 15 8 8Austin-Healey 3 0.002 - - 4 2 -Auto Car - - - - - 1 -Bentley 42 0.034 26 19 18 36 17BMW 5,126 4.154 5,507 5,302 4,359 3,416 2,808Bond - - - - - - 1Borgward 1 0.001 - - - - -Bristol - - - 1 - 1 1Bugatti 4 0.003 4 1 - - -Buick 27 0.022 21 11 10 4 5Cadillac 79 0.064 74 65 31 23 9Caterham - - - - - - 1Chevrolet 463 0.375 389 287 146 80 54Chrysler 359 0.291 490 756 564 399 249Chrysler Jeep - - 3 2 2 1 1Citroen 83 0.067 58 65 35 73 118Daewoo 13 0.011 18 14 20 14 23Daihatsu 330 0.267 362 372 455 522 675Daimler 14 0.011 13 17 24 23 18Datsun 6 0.005 4 3 3 2 2Daytona 1 0.001 - - - - -De Dion-Bouton - - 1 - - - -De Lorean - - 1 1 - - -De Soto 1 0.001 2 - 2 2 -De Tomaso - - 1 - 1 - 1Delage - - - - 1 - -Dodge 46 0.037 24 20 13 6 4Essex - - 1 - - - -Eunos 3 0.002 7 4 28 169 417Excalibur 1 0.001 - - - - -Ferrari 14 0.011 11 6 5 16 8Fiat 53 0.043 19 10 8 17 19Ford 2,379 1.928 2,309 2,291 2,056 1,698 1,845Fraser - - - - - 1 -Frazer Nash - - 31 - - - 1
continued over >
LAN 10650 MV Reg Stats - 2006.in10 10LAN 10650 MV Reg Stats - 2006.in10 10 28/02/2008 3:54:20 p.m.28/02/2008 3:54:20 p.m.
11
Source: Land Transport New ZealandCars – Table 6 continued
continued over >
Make 2006% of 2006
total2005 2004 2003 2002 2001
Ginetta - - - - - - 1GMC 7 0.006 3 5 7 4 -Hillman - - - - - - 1Holden 135 0.109 163 144 128 95 88Honda 13,865 11.237 17,118 15,952 15,341 11,246 11,477Hudson 1 0.001 - - - - -Humber - - - 1 - - -Hyundai 371 0.301 238 117 55 29 33Isuzu 1,900 1.540 3,371 3,985 4,486 4,121 3,392Iveco 1 0.001 1 - - - 1Jaguar 306 0.248 296 332 250 176 152Jeep 126 0.102 197 376 394 205 82Jensen 1 0.001 1 1 - 2 -Kia 10 0.008 15 6 9 5 4Lada - - - - - 1 1Lagonda 1 0.001 1 - - - -Lamborghini - - 1 - 2 3 2Lancia 4 0.003 1 1 2 2 1Land Rover 304 0.246 472 597 626 550 397Lexus 249 0.202 243 153 48 25 12Leyland 3 0.002 2 1 6 4 1Lincoln 12 0.010 18 10 3 - 4Lotus 13 0.011 15 10 9 4 8LVVTA 6 0.005 9 3 3 2 2Marlin - - - - - - 1Maserati 3 0.002 2 - 3 5 1
Maxwell - - - 1 - - -Mazda 9,419 7.634 9,338 9,781 11,039 11,267 11,829Mercedes-Benz 1,678 1.360 1,689 1,775 1,862 1,612 1,133Mercury 14 0.011 5 4 2 2 1MG 32 0.026 28 34 33 15 36Mini 37 0.030 20 9 9 3 -Mitsubishi 12,175 9.867 18,760 20,787 19,632 18,933 17,959Morgan 17 0.014 4 18 1 4 1Morris 2 0.002 1 5 2 1 1Nash - - - - - 1 -Nissan 20,500 16.614 28,254 31,022 34,158 32,028 30,827Oldsmobile 10 0.008 16 6 2 2 2Opel 588 0.477 393 230 72 254 355Packard 1 0.001 2 3 - - 1Peugeot 714 0.579 562 455 350 188 153Plymouth 20 0.016 14 7 6 - 3
Pontiac 28 0.023 42 19 5 10 10Porsche 148 0.120 147 146 108 76 82
LAN 10650 MV Reg Stats - 2006.in11 11LAN 10650 MV Reg Stats - 2006.in11 11 28/02/2008 3:54:20 p.m.28/02/2008 3:54:20 p.m.
12
Source: Land Transport New ZealandCars – Table 6 continued
Make 2006% of 2006
total2005 2004 2003 2002 2001
Proton 1 0.001 2 - - 2 2Rambler 1 0.001 - - - 2 -Range Rover 8 0.006 8 18 19 17 4Reliant - - 1 - 2 3 -Renault 200 0.162 296 193 183 125 95Riley - - - 2 - - -Rolls-Royce 8 0.006 26 36 10 11 11Rover 328 0.266 581 796 968 749 654Ruf - - - - - 1 2Saab 248 0.201 265 237 257 199 222Saturn 2 0.002 8 8 2 3 1Seat - - - 2 3 4 2Singer - - - - - 1 -Skoda 5 0.004 7 2 4 5 1Smart 16 0.013 8 - - - -Ssangyong 1 0.001 7 6 7 12 3Ssangyong Musso - - - - 3 1 1Studebaker 5 0.004 2 1 - - -Subaru 9,936 8.053 12,680 12,480 12,837 11,028 9,944Sunbeam 2 0.002 2 4 - 3 1Suzuki 1,408 1.141 1,350 1,724 2,455 2,002 1,562Talbot - - 1 1 - 3 1Tata - - - - 1 1 -Toyota 33,277 26.969 41,305 39,609 41,549 33,168 30,294Triumph 11 0.009 9 10 6 8 4TVR 4 0.003 2 - 1 4 6Vauxhall 16 0.013 14 6 13 4 6Veteran 1 0.001 - - - - 1Vintage - - - 1 - 1 -Volkswagen 3,895 3.157 2,852 1,874 917 547 401Volvo 408 0.331 600 692 600 534 436Willys 5 0.004 2 1 2 1 2Wolseley - - 1 - - - -Custombuilt 2 0.002 1 - 1 1 1Factory built 24 0.019 55 64 34 3 5
Total 123,390 152,488 154,042 156,972 136,418 128,693
LAN 10650 MV Reg Stats - 2006.in12 12LAN 10650 MV Reg Stats - 2006.in12 12 28/02/2008 3:54:20 p.m.28/02/2008 3:54:20 p.m.
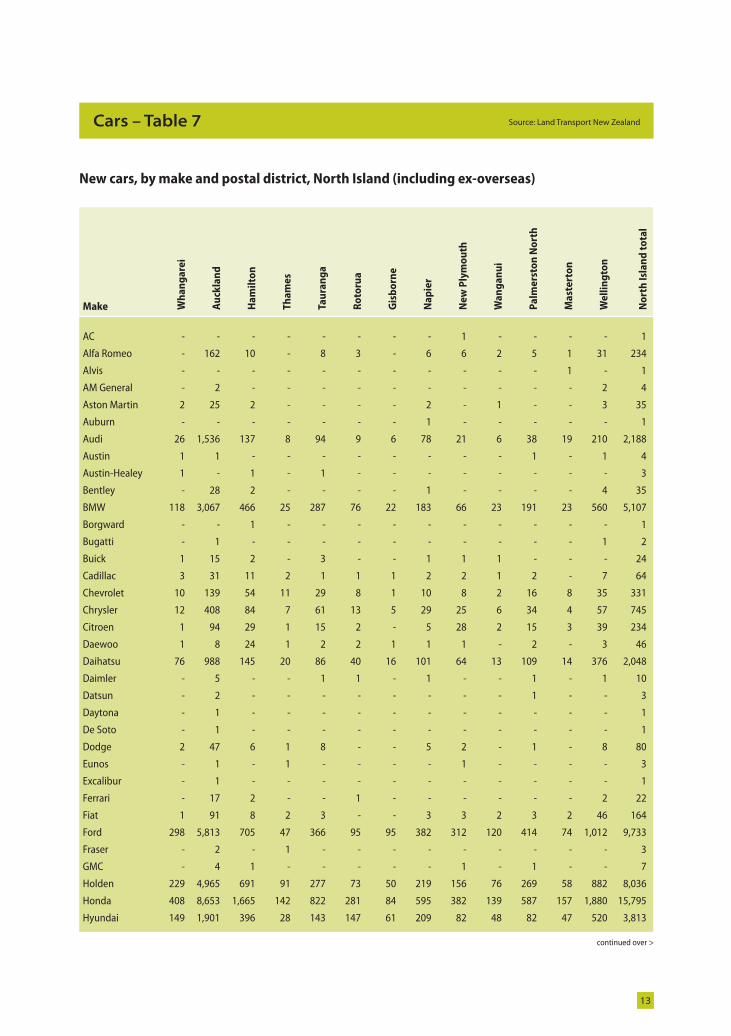
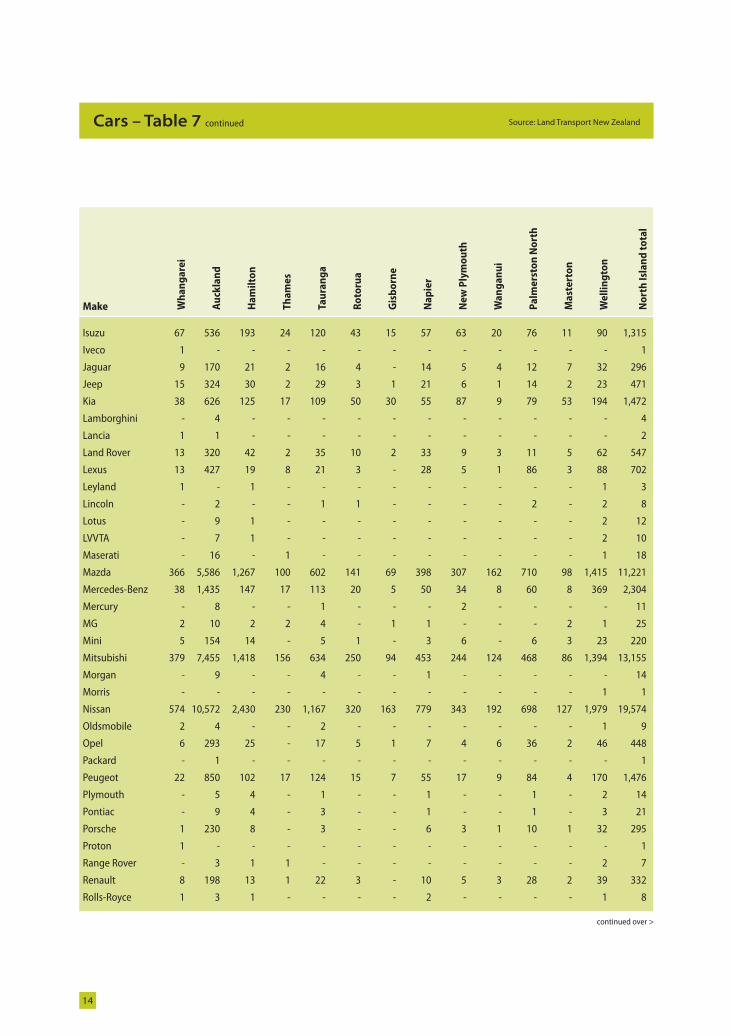
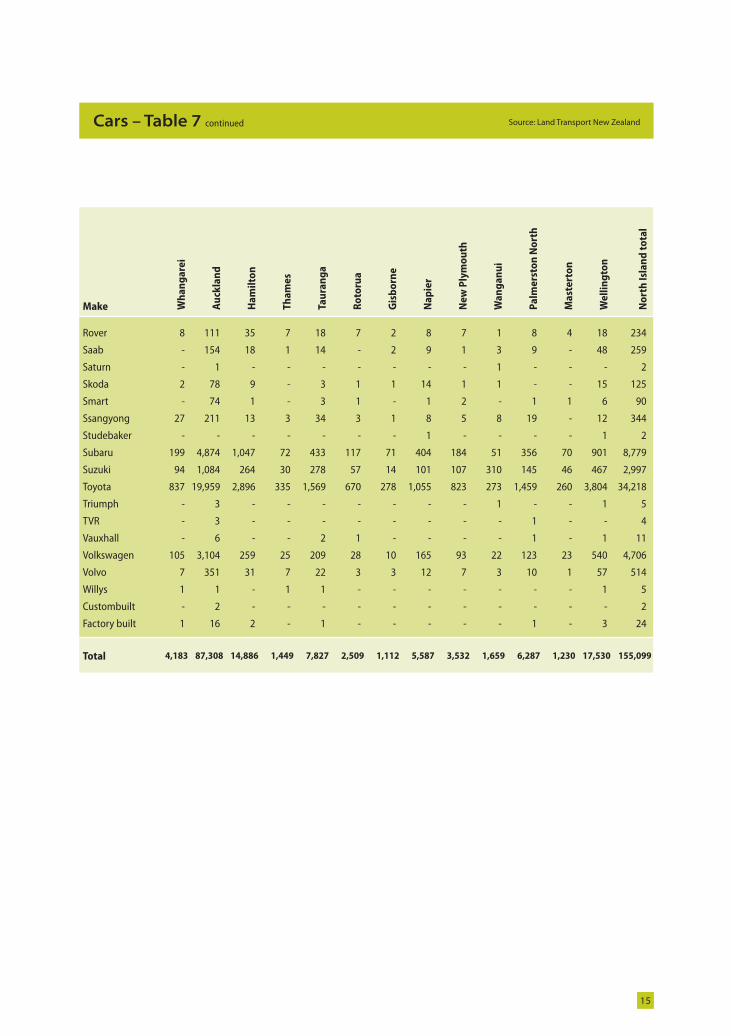
Table 7
New cars, by make and postal district, North Island (including ex-overseas)
13
Source: Land Transport New ZealandCars – Table 7
continued over >
Make Wh
an
ga
rei
Au
ckla
nd
Ha
mil
ton
Th
am
es
Tau
ran
ga
Ro
toru
a
Gis
bo
rne
Na
pie
r
Ne
w P
lym
ou
th
Wa
ng
an
ui
Pa
lme
rsto
n N
ort
h
Ma
ste
rto
n
We
llin
gto
n
No
rth
Isl
an
d t
ota
l
AC - - - - - - - - 1 - - - - 1
Alfa Romeo - 162 10 - 8 3 - 6 6 2 5 1 31 234
Alvis - - - - - - - - - - - 1 - 1
AM General - 2 - - - - - - - - - - 2 4
Aston Martin 2 25 2 - - - - 2 - 1 - - 3 35
Auburn - - - - - - - 1 - - - - - 1
Audi 26 1,536 137 8 94 9 6 78 21 6 38 19 210 2,188
Austin 1 1 - - - - - - - - 1 - 1 4
Austin-Healey 1 - 1 - 1 - - - - - - - - 3
Bentley - 28 2 - - - - 1 - - - - 4 35
BMW 118 3,067 466 25 287 76 22 183 66 23 191 23 560 5,107
Borgward - - 1 - - - - - - - - - - 1
Bugatti - 1 - - - - - - - - - - 1 2
Buick 1 15 2 - 3 - - 1 1 1 - - - 24
Cadillac 3 31 11 2 1 1 1 2 2 1 2 - 7 64
Chevrolet 10 139 54 11 29 8 1 10 8 2 16 8 35 331
Chrysler 12 408 84 7 61 13 5 29 25 6 34 4 57 745
Citroen 1 94 29 1 15 2 - 5 28 2 15 3 39 234
Daewoo 1 8 24 1 2 2 1 1 1 - 2 - 3 46
Daihatsu 76 988 145 20 86 40 16 101 64 13 109 14 376 2,048
Daimler - 5 - - 1 1 - 1 - - 1 - 1 10
Datsun - 2 - - - - - - - - 1 - - 3
Daytona - 1 - - - - - - - - - - - 1
De Soto - 1 - - - - - - - - - - - 1
Dodge 2 47 6 1 8 - - 5 2 - 1 - 8 80
Eunos - 1 - 1 - - - - 1 - - - - 3
Excalibur - 1 - - - - - - - - - - - 1
Ferrari - 17 2 - - 1 - - - - - - 2 22
Fiat 1 91 8 2 3 - - 3 3 2 3 2 46 164
Ford 298 5,813 705 47 366 95 95 382 312 120 414 74 1,012 9,733
Fraser - 2 - 1 - - - - - - - - - 3
GMC - 4 1 - - - - - 1 - 1 - - 7
Holden 229 4,965 691 91 277 73 50 219 156 76 269 58 882 8,036
Honda 408 8,653 1,665 142 822 281 84 595 382 139 587 157 1,880 15,795
Hyundai 149 1,901 396 28 143 147 61 209 82 48 82 47 520 3,813
LAN 10650 MV Reg Stats - 2006.in13 13LAN 10650 MV Reg Stats - 2006.in13 13 28/02/2008 3:54:21 p.m.28/02/2008 3:54:21 p.m.
14
Source: Land Transport New ZealandCars – Table 7 continued
Make Wh
an
ga
rei
Au
ckla
nd
Ha
mil
ton
Th
am
es
Tau
ran
ga
Ro
toru
a
Gis
bo
rne
Na
pie
r
Ne
w P
lym
ou
th
Wa
ng
an
ui
Pa
lme
rsto
n N
ort
h
Ma
ste
rto
n
We
llin
gto
n
No
rth
Isl
an
d t
ota
l
Isuzu 67 536 193 24 120 43 15 57 63 20 76 11 90 1,315
Iveco 1 - - - - - - - - - - - - 1
Jaguar 9 170 21 2 16 4 - 14 5 4 12 7 32 296
Jeep 15 324 30 2 29 3 1 21 6 1 14 2 23 471
Kia 38 626 125 17 109 50 30 55 87 9 79 53 194 1,472
Lamborghini - 4 - - - - - - - - - - - 4
Lancia 1 1 - - - - - - - - - - - 2
Land Rover 13 320 42 2 35 10 2 33 9 3 11 5 62 547
Lexus 13 427 19 8 21 3 - 28 5 1 86 3 88 702
Leyland 1 - 1 - - - - - - - - - 1 3
Lincoln - 2 - - 1 1 - - - - 2 - 2 8
Lotus - 9 1 - - - - - - - - - 2 12
LVVTA - 7 1 - - - - - - - - - 2 10
Maserati - 16 - 1 - - - - - - - - 1 18
Mazda 366 5,586 1,267 100 602 141 69 398 307 162 710 98 1,415 11,221
Mercedes-Benz 38 1,435 147 17 113 20 5 50 34 8 60 8 369 2,304
Mercury - 8 - - 1 - - - 2 - - - - 11
MG 2 10 2 2 4 - 1 1 - - - 2 1 25
Mini 5 154 14 - 5 1 - 3 6 - 6 3 23 220
Mitsubishi 379 7,455 1,418 156 634 250 94 453 244 124 468 86 1,394 13,155
Morgan - 9 - - 4 - - 1 - - - - - 14
Morris - - - - - - - - - - - - 1 1
Nissan 574 10,572 2,430 230 1,167 320 163 779 343 192 698 127 1,979 19,574
Oldsmobile 2 4 - - 2 - - - - - - - 1 9
Opel 6 293 25 - 17 5 1 7 4 6 36 2 46 448
Packard - 1 - - - - - - - - - - - 1
Peugeot 22 850 102 17 124 15 7 55 17 9 84 4 170 1,476
Plymouth - 5 4 - 1 - - 1 - - 1 - 2 14
Pontiac - 9 4 - 3 - - 1 - - 1 - 3 21
Porsche 1 230 8 - 3 - - 6 3 1 10 1 32 295
Proton 1 - - - - - - - - - - - - 1
Range Rover - 3 1 1 - - - - - - - - 2 7
Renault 8 198 13 1 22 3 - 10 5 3 28 2 39 332
Rolls-Royce 1 3 1 - - - - 2 - - - - 1 8
continued over >
LAN 10650 MV Reg Stats - 2006.in14 14LAN 10650 MV Reg Stats - 2006.in14 14 28/02/2008 3:54:21 p.m.28/02/2008 3:54:21 p.m.
15
Source: Land Transport New ZealandCars – Table 7 continued
Make Wh
an
ga
rei
Au
ckla
nd
Ha
mil
ton
Th
am
es
Tau
ran
ga
Ro
toru
a
Gis
bo
rne
Na
pie
r
Ne
w P
lym
ou
th
Wa
ng
an
ui
Pa
lme
rsto
n N
ort
h
Ma
ste
rto
n
We
llin
gto
n
No
rth
Isl
an
d t
ota
l
Rover 8 111 35 7 18 7 2 8 7 1 8 4 18 234
Saab - 154 18 1 14 - 2 9 1 3 9 - 48 259
Saturn - 1 - - - - - - - 1 - - - 2
Skoda 2 78 9 - 3 1 1 14 1 1 - - 15 125
Smart - 74 1 - 3 1 - 1 2 - 1 1 6 90
Ssangyong 27 211 13 3 34 3 1 8 5 8 19 - 12 344
Studebaker - - - - - - - 1 - - - - 1 2
Subaru 199 4,874 1,047 72 433 117 71 404 184 51 356 70 901 8,779
Suzuki 94 1,084 264 30 278 57 14 101 107 310 145 46 467 2,997
Toyota 837 19,959 2,896 335 1,569 670 278 1,055 823 273 1,459 260 3,804 34,218
Triumph - 3 - - - - - - - 1 - - 1 5
TVR - 3 - - - - - - - - 1 - - 4
Vauxhall - 6 - - 2 1 - - - - 1 - 1 11
Volkswagen 105 3,104 259 25 209 28 10 165 93 22 123 23 540 4,706
Volvo 7 351 31 7 22 3 3 12 7 3 10 1 57 514
Willys 1 1 - 1 1 - - - - - - - 1 5
Custombuilt - 2 - - - - - - - - - - - 2
Factory built 1 16 2 - 1 - - - - - 1 - 3 24
Total 4,183 87,308 14,886 1,449 7,827 2,509 1,112 5,587 3,532 1,659 6,287 1,230 17,530 155,099
LAN 10650 MV Reg Stats - 2006.in15 15LAN 10650 MV Reg Stats - 2006.in15 15 28/02/2008 3:54:22 p.m.28/02/2008 3:54:22 p.m.
16
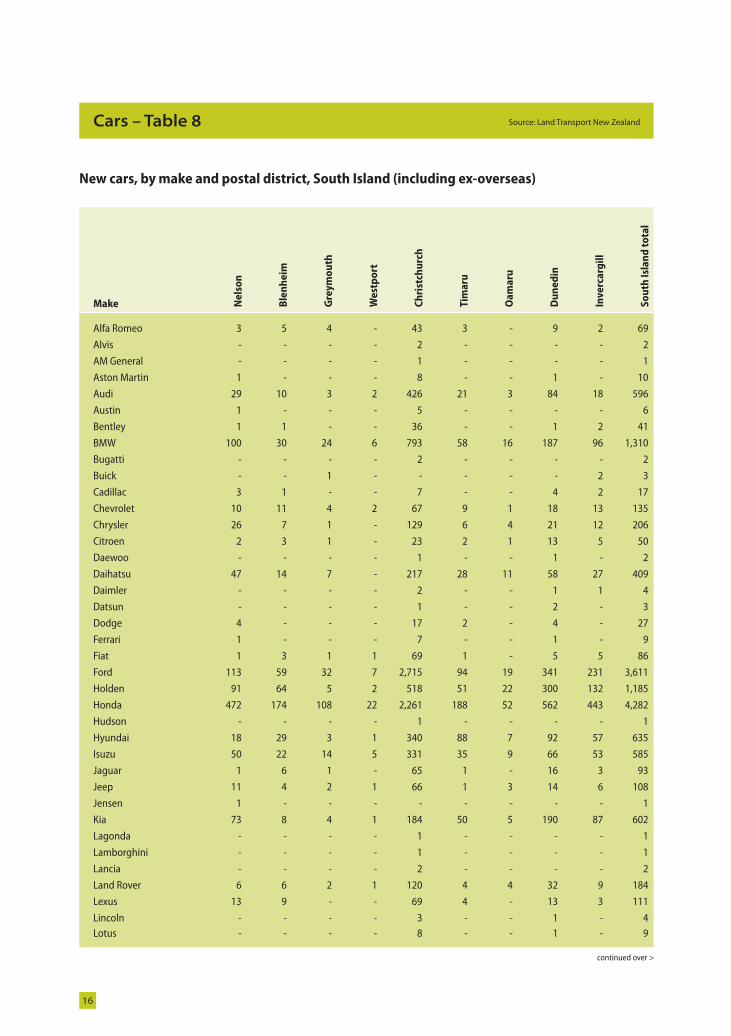
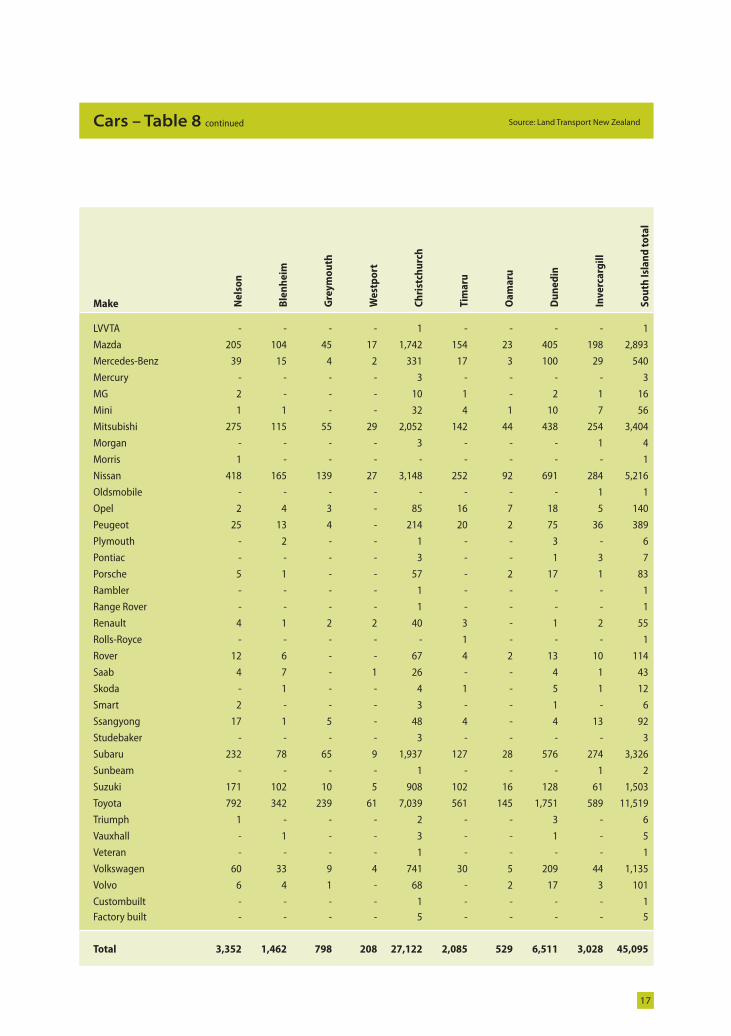
Source: Land Transport New ZealandCars – Table 8
New cars, by make and postal district, South Island (including ex-overseas)
Make Ne
lso
n
Ble
nh
eim
Gre
ym
ou
th
We
stp
ort
Ch
rist
chu
rch
Tim
aru
Oa
ma
ru
Du
ne
din
Inv
erc
arg
ill
So
uth
Isl
an
d t
ota
l
Alfa Romeo 3 5 4 - 43 3 - 9 2 69
Alvis - - - - 2 - - - - 2
AM General - - - - 1 - - - - 1
Aston Martin 1 - - - 8 - - 1 - 10
Audi 29 10 3 2 426 21 3 84 18 596
Austin 1 - - - 5 - - - - 6
Bentley 1 1 - - 36 - - 1 2 41
BMW 100 30 24 6 793 58 16 187 96 1,310
Bugatti - - - - 2 - - - - 2
Buick - - 1 - - - - - 2 3
Cadillac 3 1 - - 7 - - 4 2 17
Chevrolet 10 11 4 2 67 9 1 18 13 135
Chrysler 26 7 1 - 129 6 4 21 12 206
Citroen 2 3 1 - 23 2 1 13 5 50
Daewoo - - - - 1 - - 1 - 2
Daihatsu 47 14 7 - 217 28 11 58 27 409
Daimler - - - - 2 - - 1 1 4
Datsun - - - - 1 - - 2 - 3
Dodge 4 - - - 17 2 - 4 - 27
Ferrari 1 - - - 7 - - 1 - 9
Fiat 1 3 1 1 69 1 - 5 5 86
Ford 113 59 32 7 2,715 94 19 341 231 3,611
Holden 91 64 5 2 518 51 22 300 132 1,185
Honda 472 174 108 22 2,261 188 52 562 443 4,282
Hudson - - - - 1 - - - - 1
Hyundai 18 29 3 1 340 88 7 92 57 635
Isuzu 50 22 14 5 331 35 9 66 53 585
Jaguar 1 6 1 - 65 1 - 16 3 93
Jeep 11 4 2 1 66 1 3 14 6 108
Jensen 1 - - - - - - - - 1
Kia 73 8 4 1 184 50 5 190 87 602
Lagonda - - - - 1 - - - - 1
Lamborghini - - - - 1 - - - - 1
Lancia - - - - 2 - - - - 2
Land Rover 6 6 2 1 120 4 4 32 9 184
Lexus 13 9 - - 69 4 - 13 3 111
Lincoln - - - - 3 - - 1 - 4Lotus - - - - 8 - - 1 - 9
continued over >
LAN 10650 MV Reg Stats - 2006.in16 16LAN 10650 MV Reg Stats - 2006.in16 16 28/02/2008 3:54:22 p.m.28/02/2008 3:54:22 p.m.
17
Source: Land Transport New ZealandCars – Table 8 continued
Make Ne
lso
n
Ble
nh
eim
Gre
ym
ou
th
We
stp
ort
Ch
rist
chu
rch
Tim
aru
Oa
ma
ru
Du
ne
din
Inv
erc
arg
ill
So
uth
Isl
an
d t
ota
l
LVVTA - - - - 1 - - - - 1
Mazda 205 104 45 17 1,742 154 23 405 198 2,893
Mercedes-Benz 39 15 4 2 331 17 3 100 29 540
Mercury - - - - 3 - - - - 3
MG 2 - - - 10 1 - 2 1 16
Mini 1 1 - - 32 4 1 10 7 56
Mitsubishi 275 115 55 29 2,052 142 44 438 254 3,404
Morgan - - - - 3 - - - 1 4
Morris 1 - - - - - - - - 1
Nissan 418 165 139 27 3,148 252 92 691 284 5,216
Oldsmobile - - - - - - - - 1 1
Opel 2 4 3 - 85 16 7 18 5 140
Peugeot 25 13 4 - 214 20 2 75 36 389
Plymouth - 2 - - 1 - - 3 - 6
Pontiac - - - - 3 - - 1 3 7
Porsche 5 1 - - 57 - 2 17 1 83
Rambler - - - - 1 - - - - 1
Range Rover - - - - 1 - - - - 1
Renault 4 1 2 2 40 3 - 1 2 55
Rolls-Royce - - - - - 1 - - - 1
Rover 12 6 - - 67 4 2 13 10 114
Saab 4 7 - 1 26 - - 4 1 43
Skoda - 1 - - 4 1 - 5 1 12
Smart 2 - - - 3 - - 1 - 6
Ssangyong 17 1 5 - 48 4 - 4 13 92
Studebaker - - - - 3 - - - - 3
Subaru 232 78 65 9 1,937 127 28 576 274 3,326
Sunbeam - - - - 1 - - - 1 2
Suzuki 171 102 10 5 908 102 16 128 61 1,503
Toyota 792 342 239 61 7,039 561 145 1,751 589 11,519
Triumph 1 - - - 2 - - 3 - 6
Vauxhall - 1 - - 3 - - 1 - 5
Veteran - - - - 1 - - - - 1
Volkswagen 60 33 9 4 741 30 5 209 44 1,135
Volvo 6 4 1 - 68 - 2 17 3 101
Custombuilt - - - - 1 - - - - 1Factory built - - - - 5 - - - - 5
Total 3,352 1,462 798 208 27,122 2,085 529 6,511 3,028 45,095
LAN 10650 MV Reg Stats - 2006.in17 17LAN 10650 MV Reg Stats - 2006.in17 17 28/02/2008 3:54:23 p.m.28/02/2008 3:54:23 p.m.
18
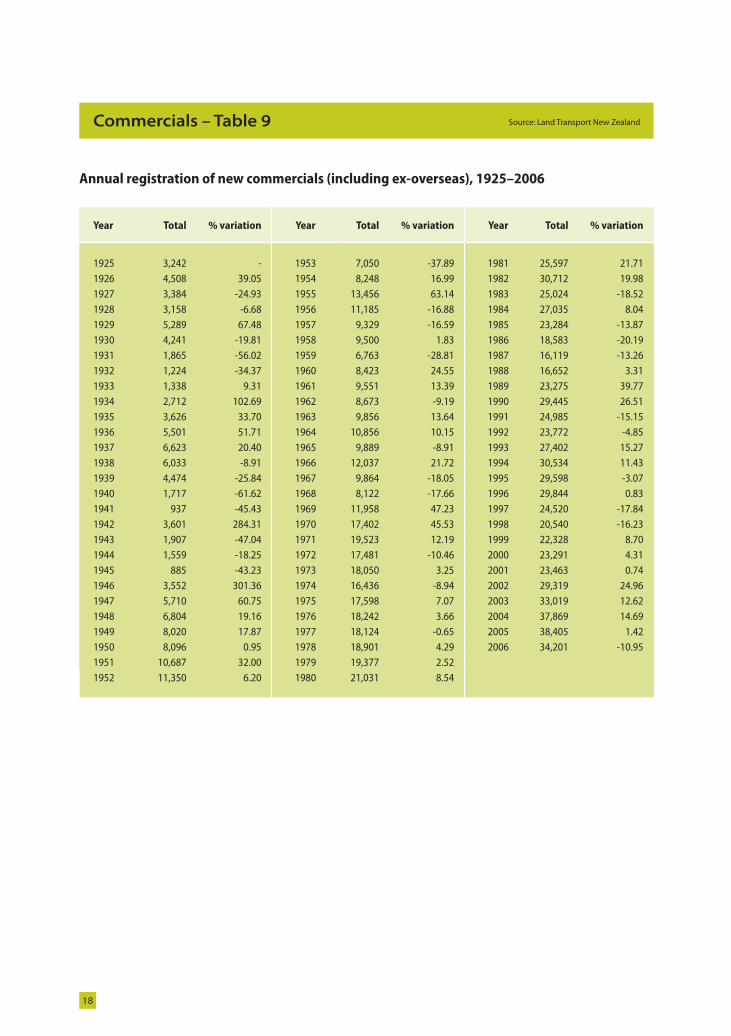
Source: Land Transport New ZealandCommercials – Table 9
Year Total % variation Year Total % variation Year Total % variation
1925 3,242 - 1953 7,050 -37.89 1981 25,597 21.711926 4,508 39.05 1954 8,248 16.99 1982 30,712 19.981927 3,384 -24.93 1955 13,456 63.14 1983 25,024 -18.521928 3,158 -6.68 1956 11,185 -16.88 1984 27,035 8.041929 5,289 67.48 1957 9,329 -16.59 1985 23,284 -13.871930 4,241 -19.81 1958 9,500 1.83 1986 18,583 -20.191931 1,865 -56.02 1959 6,763 -28.81 1987 16,119 -13.261932 1,224 -34.37 1960 8,423 24.55 1988 16,652 3.311933 1,338 9.31 1961 9,551 13.39 1989 23,275 39.771934 2,712 102.69 1962 8,673 -9.19 1990 29,445 26.511935 3,626 33.70 1963 9,856 13.64 1991 24,985 -15.151936 5,501 51.71 1964 10,856 10.15 1992 23,772 -4.851937 6,623 20.40 1965 9,889 -8.91 1993 27,402 15.271938 6,033 -8.91 1966 12,037 21.72 1994 30,534 11.431939 4,474 -25.84 1967 9,864 -18.05 1995 29,598 -3.071940 1,717 -61.62 1968 8,122 -17.66 1996 29,844 0.831941 937 -45.43 1969 11,958 47.23 1997 24,520 -17.841942 3,601 284.31 1970 17,402 45.53 1998 20,540 -16.231943 1,907 -47.04 1971 19,523 12.19 1999 22,328 8.701944 1,559 -18.25 1972 17,481 -10.46 2000 23,291 4.311945 885 -43.23 1973 18,050 3.25 2001 23,463 0.741946 3,552 301.36 1974 16,436 -8.94 2002 29,319 24.961947 5,710 60.75 1975 17,598 7.07 2003 33,019 12.621948 6,804 19.16 1976 18,242 3.66 2004 37,869 14.691949 8,020 17.87 1977 18,124 -0.65 2005 38,405 1.421950 8,096 0.95 1978 18,901 4.29 2006 34,201 -10.951951 10,687 32.00 1979 19,377 2.521952 11,350 6.20 1980 21,031 8.54
Annual registration of new commercials (including ex-overseas), 1925–2006
LAN 10650 MV Reg Stats - 2006.in18 18LAN 10650 MV Reg Stats - 2006.in18 18 28/02/2008 3:54:23 p.m.28/02/2008 3:54:23 p.m.
19
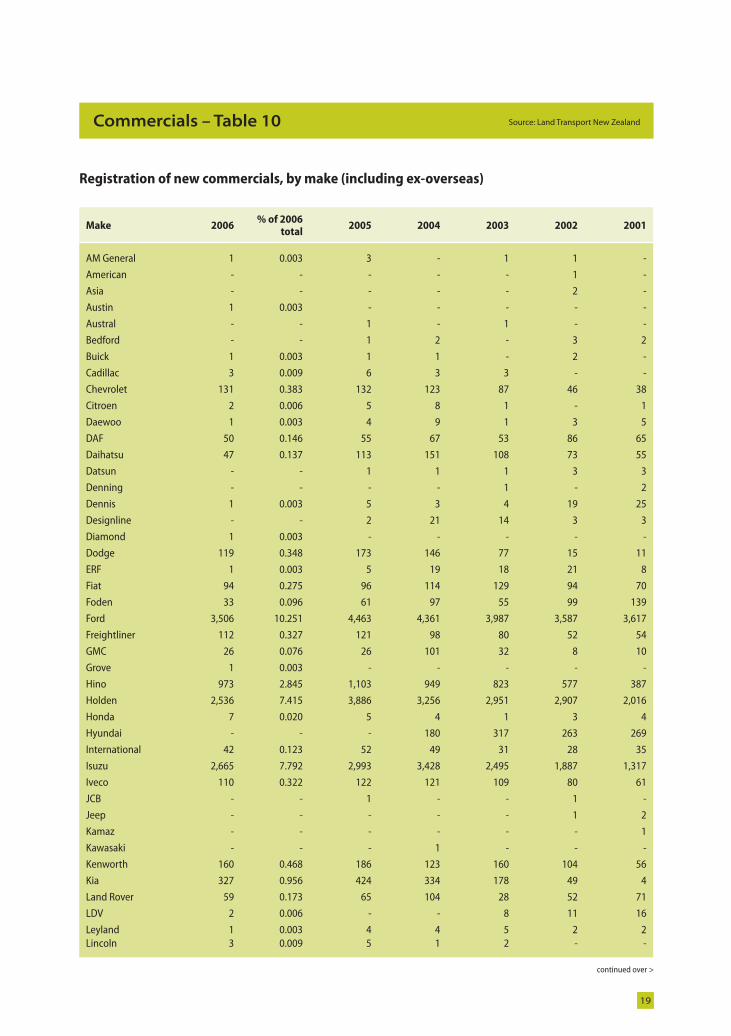
Source: Land Transport New ZealandCommercials – Table 10
Registration of new commercials, by make (including ex-overseas)
continued over >
Make 2006% of 2006
total2005 2004 2003 2002 2001
AM General 1 0.003 3 - 1 1 -
American - - - - - 1 -
Asia - - - - - 2 -
Austin 1 0.003 - - - - -
Austral - - 1 - 1 - -
Bedford - - 1 2 - 3 2
Buick 1 0.003 1 1 - 2 -
Cadillac 3 0.009 6 3 3 - -
Chevrolet 131 0.383 132 123 87 46 38
Citroen 2 0.006 5 8 1 - 1
Daewoo 1 0.003 4 9 1 3 5
DAF 50 0.146 55 67 53 86 65
Daihatsu 47 0.137 113 151 108 73 55
Datsun - - 1 1 1 3 3
Denning - - - - 1 - 2
Dennis 1 0.003 5 3 4 19 25
Designline - - 2 21 14 3 3
Diamond 1 0.003 - - - - -
Dodge 119 0.348 173 146 77 15 11
ERF 1 0.003 5 19 18 21 8
Fiat 94 0.275 96 114 129 94 70
Foden 33 0.096 61 97 55 99 139
Ford 3,506 10.251 4,463 4,361 3,987 3,587 3,617
Freightliner 112 0.327 121 98 80 52 54
GMC 26 0.076 26 101 32 8 10
Grove 1 0.003 - - - - -
Hino 973 2.845 1,103 949 823 577 387
Holden 2,536 7.415 3,886 3,256 2,951 2,907 2,016
Honda 7 0.020 5 4 1 3 4
Hyundai - - - 180 317 263 269
International 42 0.123 52 49 31 28 35
Isuzu 2,665 7.792 2,993 3,428 2,495 1,887 1,317
Iveco 110 0.322 122 121 109 80 61
JCB - - 1 - - 1 -
Jeep - - - - - 1 2
Kamaz - - - - - - 1
Kawasaki - - - 1 - - -
Kenworth 160 0.468 186 123 160 104 56
Kia 327 0.956 424 334 178 49 4
Land Rover 59 0.173 65 104 28 52 71
LDV 2 0.006 - - 8 11 16
Leyland 1 0.003 4 4 5 2 2Lincoln 3 0.009 5 1 2 - -
LAN 10650 MV Reg Stats - 2006.in19 19LAN 10650 MV Reg Stats - 2006.in19 19 28/02/2008 3:54:23 p.m.28/02/2008 3:54:23 p.m.
20
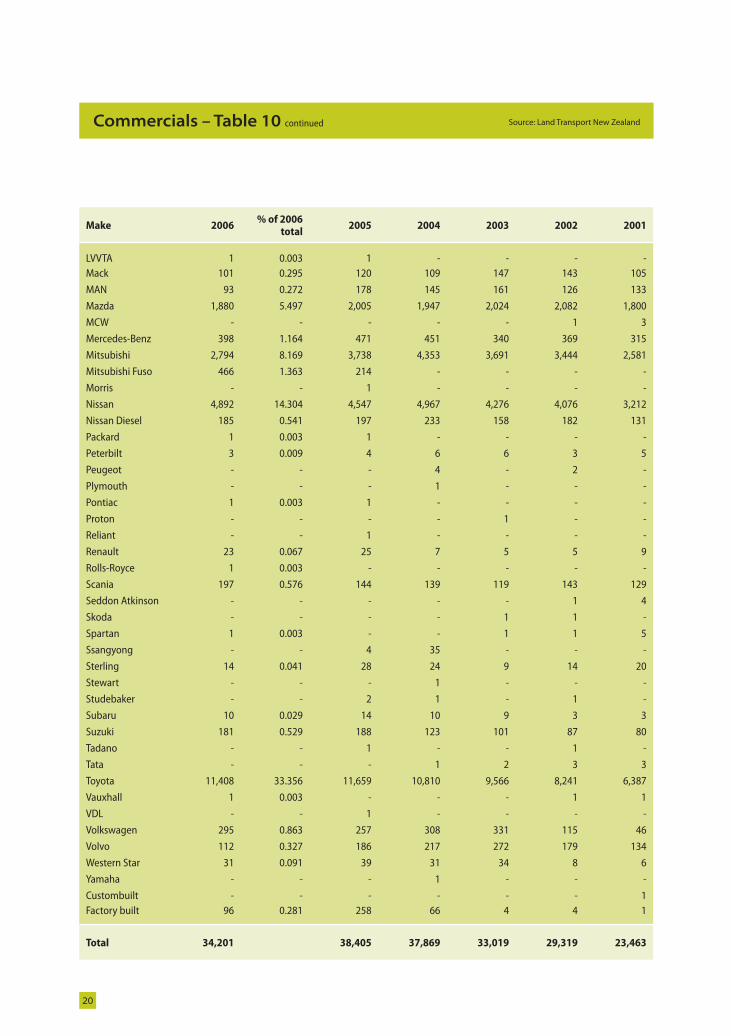
Source: Land Transport New ZealandCommercials – Table 10 continued
Make 2006% of 2006
total2005 2004 2003 2002 2001
LVVTA 1 0.003 1 - - - -Mack 101 0.295 120 109 147 143 105
MAN 93 0.272 178 145 161 126 133
Mazda 1,880 5.497 2,005 1,947 2,024 2,082 1,800
MCW - - - - - 1 3
Mercedes-Benz 398 1.164 471 451 340 369 315
Mitsubishi 2,794 8.169 3,738 4,353 3,691 3,444 2,581
Mitsubishi Fuso 466 1.363 214 - - - -
Morris - - 1 - - - -
Nissan 4,892 14.304 4,547 4,967 4,276 4,076 3,212
Nissan Diesel 185 0.541 197 233 158 182 131
Packard 1 0.003 1 - - - -
Peterbilt 3 0.009 4 6 6 3 5
Peugeot - - - 4 - 2 -
Plymouth - - - 1 - - -
Pontiac 1 0.003 1 - - - -
Proton - - - - 1 - -
Reliant - - 1 - - - -
Renault 23 0.067 25 7 5 5 9
Rolls-Royce 1 0.003 - - - - -
Scania 197 0.576 144 139 119 143 129
Seddon Atkinson - - - - - 1 4
Skoda - - - - 1 1 -
Spartan 1 0.003 - - 1 1 5
Ssangyong - - 4 35 - - -
Sterling 14 0.041 28 24 9 14 20
Stewart - - - 1 - - -
Studebaker - - 2 1 - 1 -
Subaru 10 0.029 14 10 9 3 3
Suzuki 181 0.529 188 123 101 87 80
Tadano - - 1 - - 1 -
Tata - - - 1 2 3 3
Toyota 11,408 33.356 11,659 10,810 9,566 8,241 6,387
Vauxhall 1 0.003 - - - 1 1
VDL - - 1 - - - -
Volkswagen 295 0.863 257 308 331 115 46
Volvo 112 0.327 186 217 272 179 134
Western Star 31 0.091 39 31 34 8 6
Yamaha - - - 1 - - -
Custombuilt - - - - - - 1Factory built 96 0.281 258 66 4 4 1
Total 34,201 38,405 37,869 33,019 29,319 23,463
LAN 10650 MV Reg Stats - 2006.in20 20LAN 10650 MV Reg Stats - 2006.in20 20 28/02/2008 3:54:24 p.m.28/02/2008 3:54:24 p.m.
21
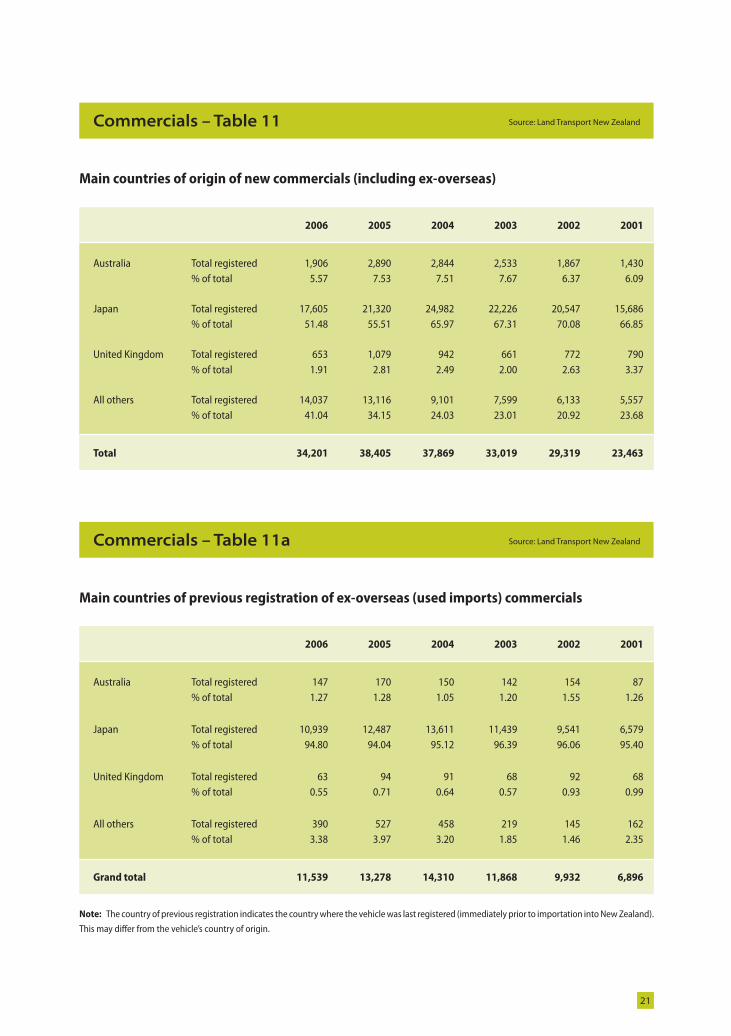
Source: Land Transport New ZealandCommercials – Table 11
2006 2005 2004 2003 2002 2001
Australia Total registered 1,906 2,890 2,844 2,533 1,867 1,430% of total 5.57 7.53 7.51 7.67 6.37 6.09
Japan Total registered 17,605 21,320 24,982 22,226 20,547 15,686% of total 51.48 55.51 65.97 67.31 70.08 66.85
United Kingdom Total registered 653 1,079 942 661 772 790% of total 1.91 2.81 2.49 2.00 2.63 3.37
All others Total registered 14,037 13,116 9,101 7,599 6,133 5,557% of total 41.04 34.15 24.03 23.01 20.92 23.68
Total 34,201 38,405 37,869 33,019 29,319 23,463
2006 2005 2004 2003 2002 2001
Australia Total registered 147 170 150 142 154 87% of total 1.27 1.28 1.05 1.20 1.55 1.26
Japan Total registered 10,939 12,487 13,611 11,439 9,541 6,579% of total 94.80 94.04 95.12 96.39 96.06 95.40
United Kingdom Total registered 63 94 91 68 92 68% of total 0.55 0.71 0.64 0.57 0.93 0.99
All others Total registered 390 527 458 219 145 162% of total 3.38 3.97 3.20 1.85 1.46 2.35
Grand total 11,539 13,278 14,310 11,868 9,932 6,896
Main countries of origin of new commercials (including ex-overseas)
Commercials – Table 11a Source: Land Transport New Zealand
Main countries of previous registration of ex-overseas (used imports) commercials
Note: The country of previous registration indicates the country where the vehicle was last registered (immediately prior to importation into New Zealand).
This may diff er from the vehicle’s country of origin.
LAN 10650 MV Reg Stats - 2006.in21 21LAN 10650 MV Reg Stats - 2006.in21 21 28/02/2008 3:54:24 p.m.28/02/2008 3:54:24 p.m.
22
Source: Land Transport New ZealandCommercials – Table 12
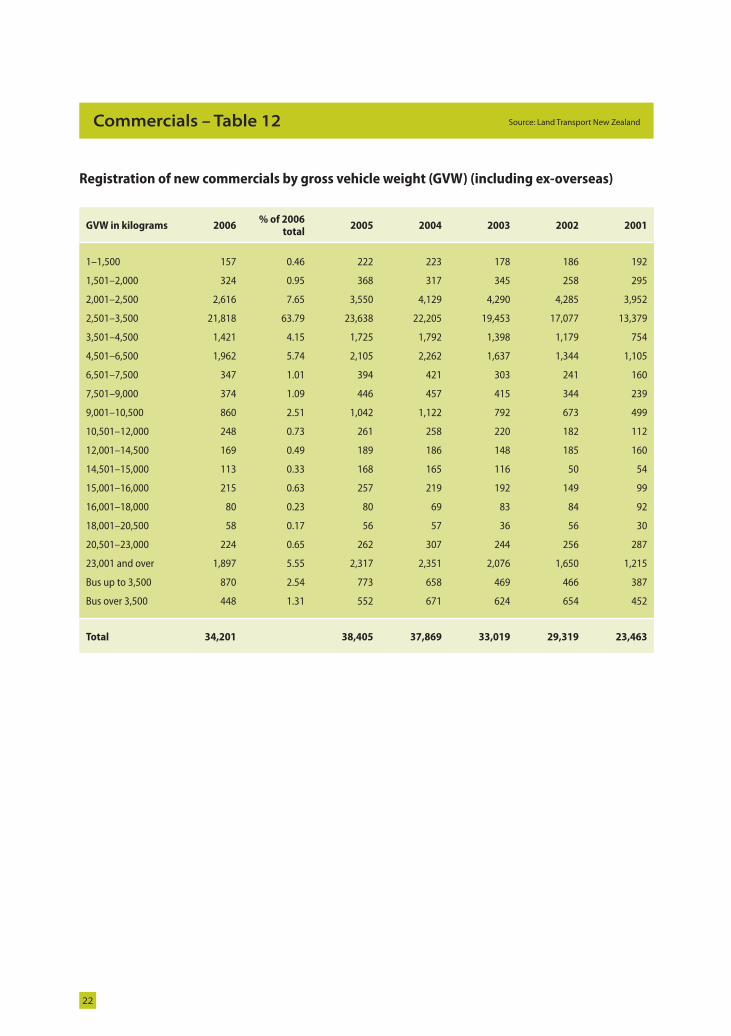
Registration of new commercials by gross vehicle weight (GVW) (including ex-overseas)
GVW in kilograms 2006% of 2006
total2005 2004 2003 2002 2001
1–1,500 157 0.46 222 223 178 186 192
1,501–2,000 324 0.95 368 317 345 258 295
2,001–2,500 2,616 7.65 3,550 4,129 4,290 4,285 3,952
2,501–3,500 21,818 63.79 23,638 22,205 19,453 17,077 13,379
3,501–4,500 1,421 4.15 1,725 1,792 1,398 1,179 754
4,501–6,500 1,962 5.74 2,105 2,262 1,637 1,344 1,105
6,501–7,500 347 1.01 394 421 303 241 160
7,501–9,000 374 1.09 446 457 415 344 239
9,001–10,500 860 2.51 1,042 1,122 792 673 499
10,501–12,000 248 0.73 261 258 220 182 112
12,001–14,500 169 0.49 189 186 148 185 160
14,501–15,000 113 0.33 168 165 116 50 54
15,001–16,000 215 0.63 257 219 192 149 99
16,001–18,000 80 0.23 80 69 83 84 92
18,001–20,500 58 0.17 56 57 36 56 30
20,501–23,000 224 0.65 262 307 244 256 287
23,001 and over 1,897 5.55 2,317 2,351 2,076 1,650 1,215
Bus up to 3,500 870 2.54 773 658 469 466 387
Bus over 3,500 448 1.31 552 671 624 654 452
Total 34,201 38,405 37,869 33,019 29,319 23,463
LAN 10650 MV Reg Stats - 2006.in22 22LAN 10650 MV Reg Stats - 2006.in22 22 28/02/2008 3:54:24 p.m.28/02/2008 3:54:24 p.m.
23
Source: Land Transport New ZealandCommercials – Table 13
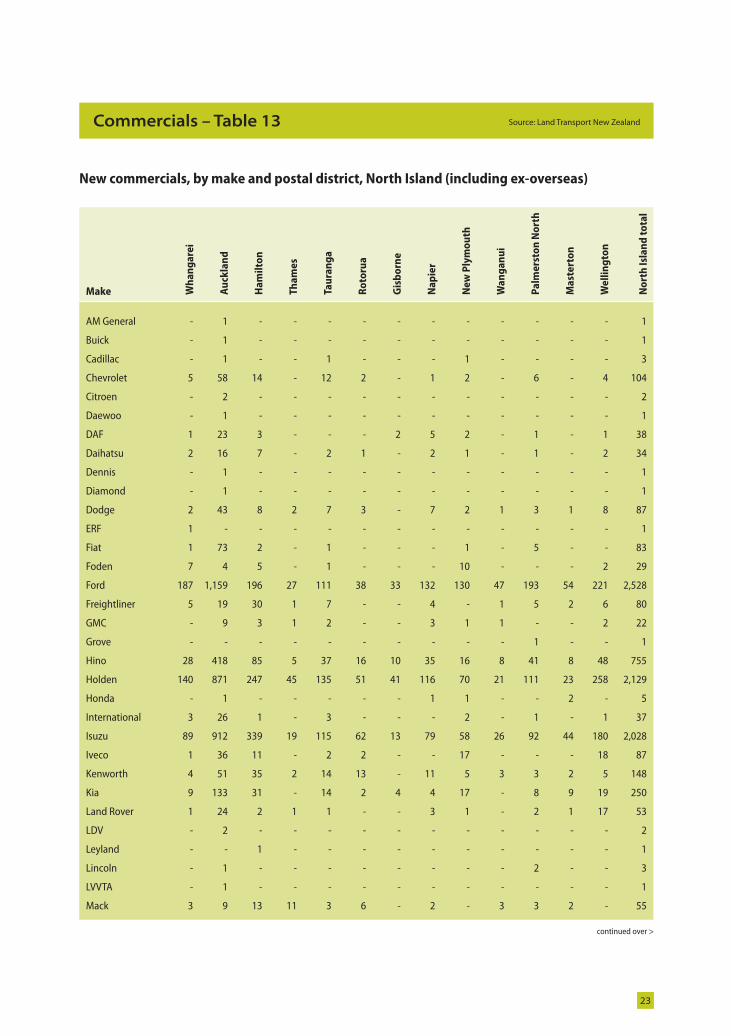
New commercials, by make and postal district, North Island (including ex-overseas)
continued over >
Make Wh
an
ga
rei
Au
ckla
nd
Ha
mil
ton
Th
am
es
Tau
ran
ga
Ro
toru
a
Gis
bo
rne
Na
pie
r
Ne
w P
lym
ou
th
Wa
ng
an
ui
Pa
lme
rsto
n N
ort
h
Ma
ste
rto
n
We
llin
gto
n
No
rth
Isl
an
d t
ota
l
AM General - 1 - - - - - - - - - - - 1
Buick - 1 - - - - - - - - - - - 1
Cadillac - 1 - - 1 - - - 1 - - - - 3
Chevrolet 5 58 14 - 12 2 - 1 2 - 6 - 4 104
Citroen - 2 - - - - - - - - - - - 2
Daewoo - 1 - - - - - - - - - - - 1
DAF 1 23 3 - - - 2 5 2 - 1 - 1 38
Daihatsu 2 16 7 - 2 1 - 2 1 - 1 - 2 34
Dennis - 1 - - - - - - - - - - - 1
Diamond - 1 - - - - - - - - - - - 1
Dodge 2 43 8 2 7 3 - 7 2 1 3 1 8 87
ERF 1 - - - - - - - - - - - - 1
Fiat 1 73 2 - 1 - - - 1 - 5 - - 83
Foden 7 4 5 - 1 - - - 10 - - - 2 29
Ford 187 1,159 196 27 111 38 33 132 130 47 193 54 221 2,528
Freightliner 5 19 30 1 7 - - 4 - 1 5 2 6 80
GMC - 9 3 1 2 - - 3 1 1 - - 2 22
Grove - - - - - - - - - - 1 - - 1
Hino 28 418 85 5 37 16 10 35 16 8 41 8 48 755
Holden 140 871 247 45 135 51 41 116 70 21 111 23 258 2,129
Honda - 1 - - - - - 1 1 - - 2 - 5
International 3 26 1 - 3 - - - 2 - 1 - 1 37
Isuzu 89 912 339 19 115 62 13 79 58 26 92 44 180 2,028
Iveco 1 36 11 - 2 2 - - 17 - - - 18 87
Kenworth 4 51 35 2 14 13 - 11 5 3 3 2 5 148
Kia 9 133 31 - 14 2 4 4 17 - 8 9 19 250
Land Rover 1 24 2 1 1 - - 3 1 - 2 1 17 53
LDV - 2 - - - - - - - - - - - 2
Leyland - - 1 - - - - - - - - - - 1
Lincoln - 1 - - - - - - - - 2 - - 3
LVVTA - 1 - - - - - - - - - - - 1
Mack 3 9 13 11 3 6 - 2 - 3 3 2 - 55
LAN 10650 MV Reg Stats - 2006.in23 23LAN 10650 MV Reg Stats - 2006.in23 23 28/02/2008 3:54:25 p.m.28/02/2008 3:54:25 p.m.
24
Source: Land Transport New ZealandCommercials – Table 13 continued
Make Wh
an
ga
rei
Au
ckla
nd
Ha
mil
ton
Th
am
es
Tau
ran
ga
Ro
toru
a
Gis
bo
rne
Na
pie
r
Ne
w P
lym
ou
th
Wa
ng
an
ui
Pa
lme
rsto
n N
ort
h
Ma
ste
rto
n
We
llin
gto
n
No
rth
Isl
an
d t
ota
l
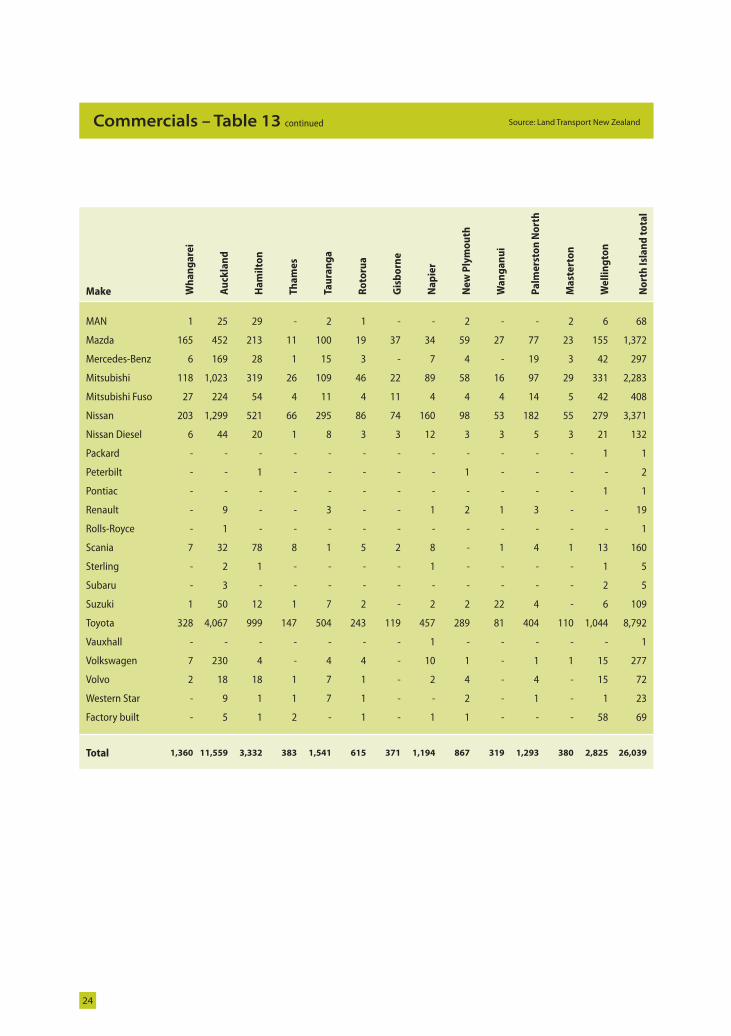
MAN 1 25 29 - 2 1 - - 2 - - 2 6 68
Mazda 165 452 213 11 100 19 37 34 59 27 77 23 155 1,372
Mercedes-Benz 6 169 28 1 15 3 - 7 4 - 19 3 42 297
Mitsubishi 118 1,023 319 26 109 46 22 89 58 16 97 29 331 2,283
Mitsubishi Fuso 27 224 54 4 11 4 11 4 4 4 14 5 42 408
Nissan 203 1,299 521 66 295 86 74 160 98 53 182 55 279 3,371
Nissan Diesel 6 44 20 1 8 3 3 12 3 3 5 3 21 132
Packard - - - - - - - - - - - - 1 1
Peterbilt - - 1 - - - - - 1 - - - - 2
Pontiac - - - - - - - - - - - - 1 1
Renault - 9 - - 3 - - 1 2 1 3 - - 19
Rolls-Royce - 1 - - - - - - - - - - - 1
Scania 7 32 78 8 1 5 2 8 - 1 4 1 13 160
Sterling - 2 1 - - - - 1 - - - - 1 5
Subaru - 3 - - - - - - - - - - 2 5
Suzuki 1 50 12 1 7 2 - 2 2 22 4 - 6 109
Toyota 328 4,067 999 147 504 243 119 457 289 81 404 110 1,044 8,792
Vauxhall - - - - - - - 1 - - - - - 1
Volkswagen 7 230 4 - 4 4 - 10 1 - 1 1 15 277
Volvo 2 18 18 1 7 1 - 2 4 - 4 - 15 72
Western Star - 9 1 1 7 1 - - 2 - 1 - 1 23
Factory built - 5 1 2 - 1 - 1 1 - - - 58 69
Total 1,360 11,559 3,332 383 1,541 615 371 1,194 867 319 1,293 380 2,825 26,039
LAN 10650 MV Reg Stats - 2006.in24 24LAN 10650 MV Reg Stats - 2006.in24 24 28/02/2008 3:54:26 p.m.28/02/2008 3:54:26 p.m.
25
Source: Land Transport New ZealandCommercials – Table 14
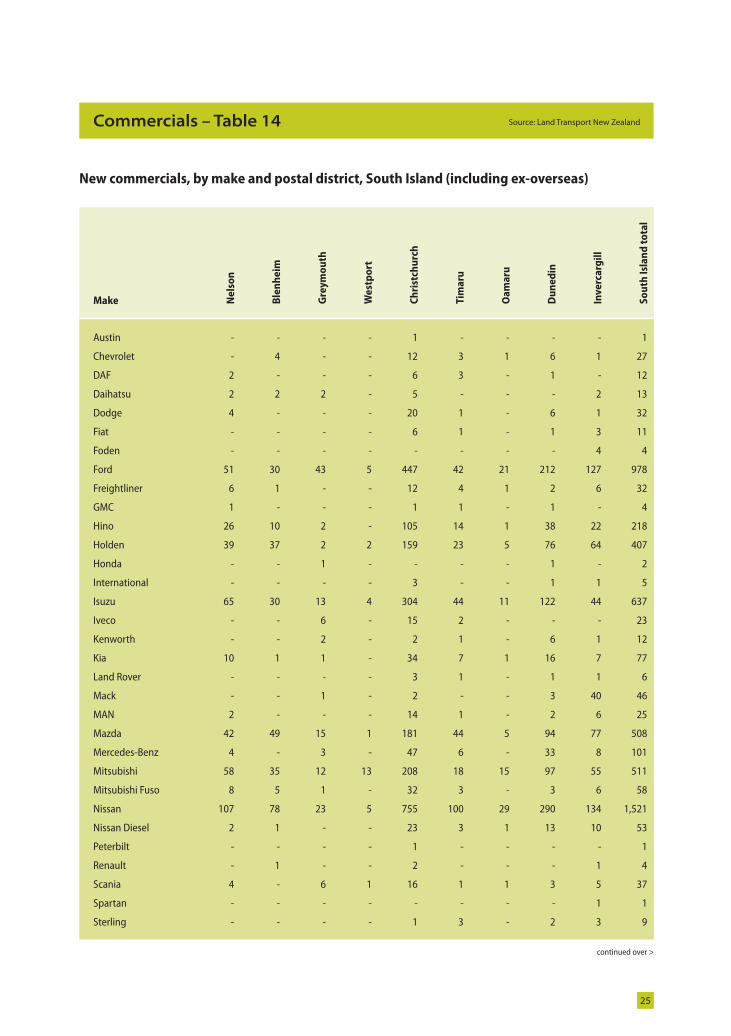
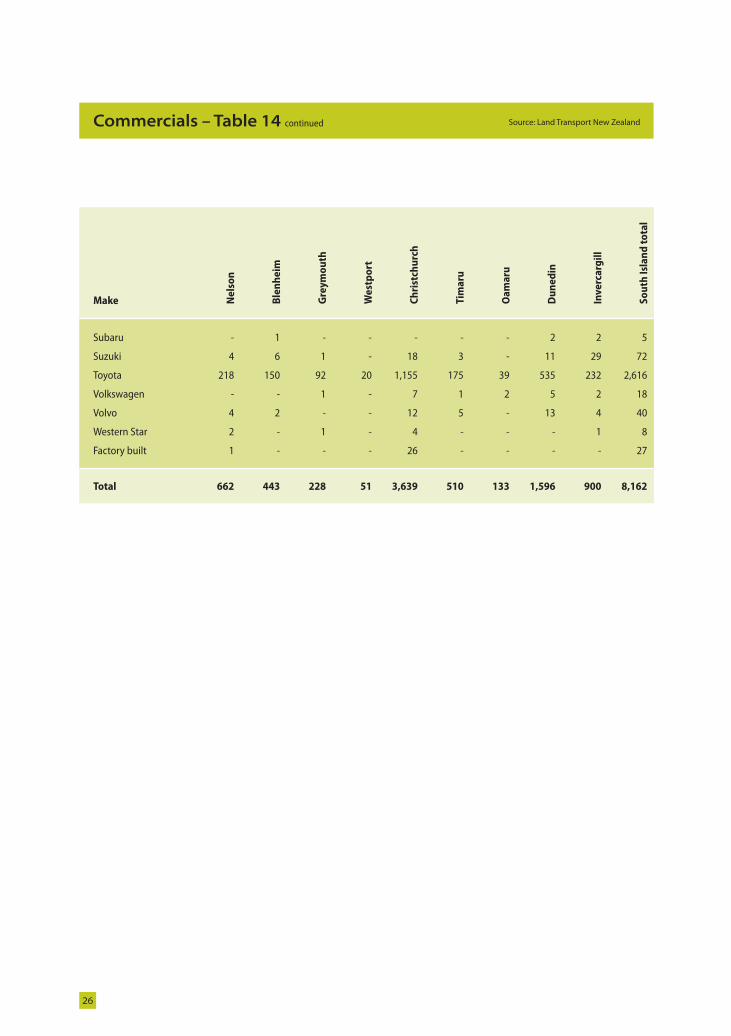
New commercials, by make and postal district, South Island (including ex-overseas)
continued over >
Make Ne
lso
n
Ble
nh
eim
Gre
ym
ou
th
We
stp
ort
Ch
rist
chu
rch
Tim
aru
Oa
ma
ru
Du
ne
din
Inv
erc
arg
ill
So
uth
Isl
an
d t
ota
l
Austin - - - - 1 - - - - 1
Chevrolet - 4 - - 12 3 1 6 1 27
DAF 2 - - - 6 3 - 1 - 12
Daihatsu 2 2 2 - 5 - - - 2 13
Dodge 4 - - - 20 1 - 6 1 32
Fiat - - - - 6 1 - 1 3 11
Foden - - - - - - - - 4 4
Ford 51 30 43 5 447 42 21 212 127 978
Freightliner 6 1 - - 12 4 1 2 6 32
GMC 1 - - - 1 1 - 1 - 4
Hino 26 10 2 - 105 14 1 38 22 218
Holden 39 37 2 2 159 23 5 76 64 407
Honda - - 1 - - - - 1 - 2
International - - - - 3 - - 1 1 5
Isuzu 65 30 13 4 304 44 11 122 44 637
Iveco - - 6 - 15 2 - - - 23
Kenworth - - 2 - 2 1 - 6 1 12
Kia 10 1 1 - 34 7 1 16 7 77
Land Rover - - - - 3 1 - 1 1 6
Mack - - 1 - 2 - - 3 40 46
MAN 2 - - - 14 1 - 2 6 25
Mazda 42 49 15 1 181 44 5 94 77 508
Mercedes-Benz 4 - 3 - 47 6 - 33 8 101
Mitsubishi 58 35 12 13 208 18 15 97 55 511
Mitsubishi Fuso 8 5 1 - 32 3 - 3 6 58
Nissan 107 78 23 5 755 100 29 290 134 1,521
Nissan Diesel 2 1 - - 23 3 1 13 10 53
Peterbilt - - - - 1 - - - - 1
Renault - 1 - - 2 - - - 1 4
Scania 4 - 6 1 16 1 1 3 5 37
Spartan - - - - - - - - 1 1
Sterling - - - - 1 3 - 2 3 9
LAN 10650 MV Reg Stats - 2006.in25 25LAN 10650 MV Reg Stats - 2006.in25 25 28/02/2008 3:54:26 p.m.28/02/2008 3:54:26 p.m.
26
Source: Land Transport New ZealandCommercials – Table 14 continued
Make Ne
lso
n
Ble
nh
eim
Gre
ym
ou
th
We
stp
ort
Ch
rist
chu
rch
Tim
aru
Oa
ma
ru
Du
ne
din
Inv
erc
arg
ill
So
uth
Isl
an
d t
ota
l
Subaru - 1 - - - - - 2 2 5
Suzuki 4 6 1 - 18 3 - 11 29 72
Toyota 218 150 92 20 1,155 175 39 535 232 2,616
Volkswagen - - 1 - 7 1 2 5 2 18
Volvo 4 2 - - 12 5 - 13 4 40
Western Star 2 - 1 - 4 - - - 1 8
Factory built 1 - - - 26 - - - - 27
Total 662 443 228 51 3,639 510 133 1,596 900 8,162
LAN 10650 MV Reg Stats - 2006.in26 26LAN 10650 MV Reg Stats - 2006.in26 26 28/02/2008 3:54:26 p.m.28/02/2008 3:54:26 p.m.
27
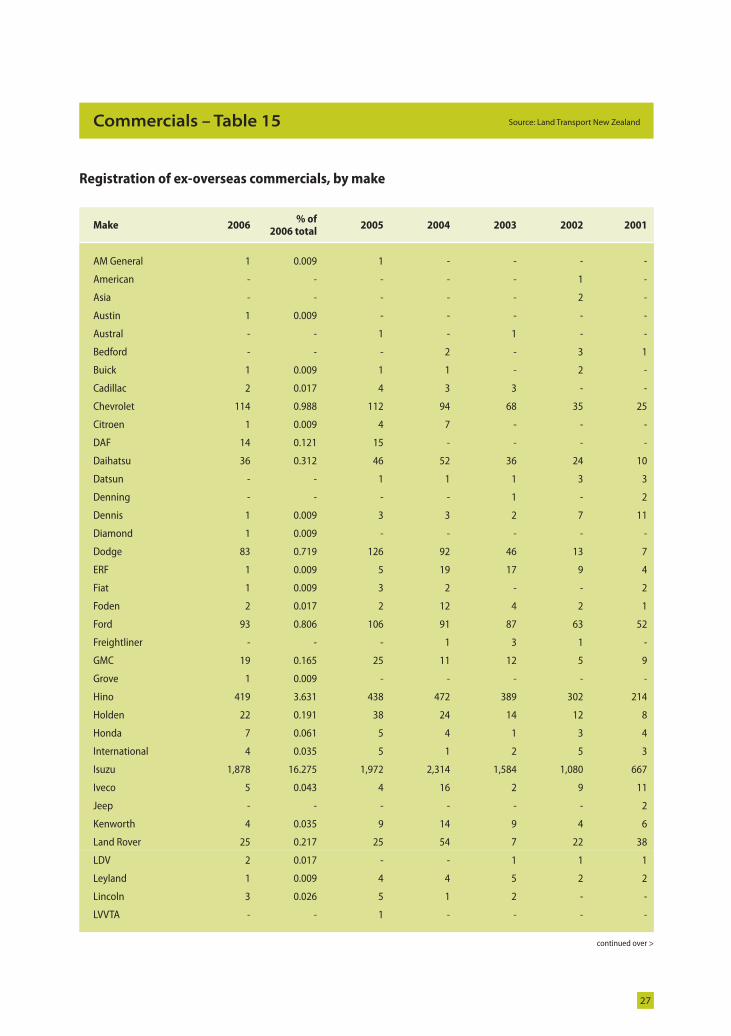
Source: Land Transport New ZealandCommercials – Table 15
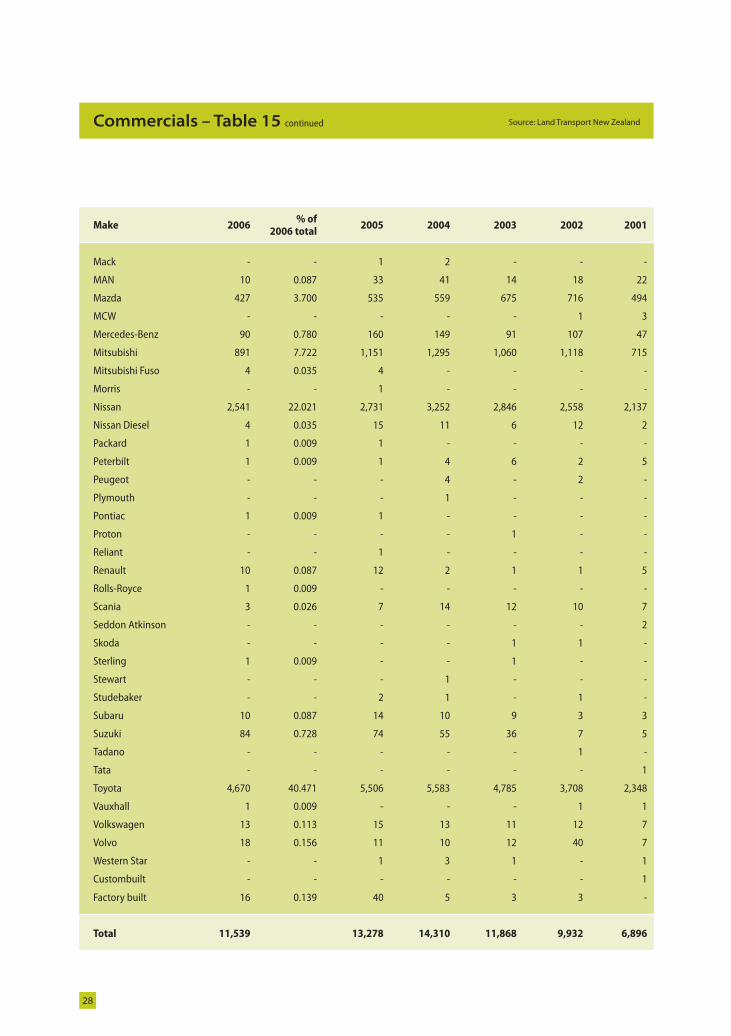
Registration of ex-overseas commercials, by make
continued over >
Make 2006% of
2006 total2005 2004 2003 2002 2001
AM General 1 0.009 1 - - - -
American - - - - - 1 -
Asia - - - - - 2 -
Austin 1 0.009 - - - - -
Austral - - 1 - 1 - -
Bedford - - - 2 - 3 1
Buick 1 0.009 1 1 - 2 -
Cadillac 2 0.017 4 3 3 - -
Chevrolet 114 0.988 112 94 68 35 25
Citroen 1 0.009 4 7 - - -
DAF 14 0.121 15 - - - -
Daihatsu 36 0.312 46 52 36 24 10
Datsun - - 1 1 1 3 3
Denning - - - - 1 - 2
Dennis 1 0.009 3 3 2 7 11
Diamond 1 0.009 - - - - -
Dodge 83 0.719 126 92 46 13 7
ERF 1 0.009 5 19 17 9 4
Fiat 1 0.009 3 2 - - 2
Foden 2 0.017 2 12 4 2 1
Ford 93 0.806 106 91 87 63 52
Freightliner - - - 1 3 1 -
GMC 19 0.165 25 11 12 5 9
Grove 1 0.009 - - - - -
Hino 419 3.631 438 472 389 302 214
Holden 22 0.191 38 24 14 12 8
Honda 7 0.061 5 4 1 3 4
International 4 0.035 5 1 2 5 3
Isuzu 1,878 16.275 1,972 2,314 1,584 1,080 667
Iveco 5 0.043 4 16 2 9 11
Jeep - - - - - - 2
Kenworth 4 0.035 9 14 9 4 6
Land Rover 25 0.217 25 54 7 22 38
LDV 2 0.017 - - 1 1 1
Leyland 1 0.009 4 4 5 2 2
Lincoln 3 0.026 5 1 2 - -
LVVTA - - 1 - - - -
LAN 10650 MV Reg Stats - 2006.in27 27LAN 10650 MV Reg Stats - 2006.in27 27 28/02/2008 3:54:26 p.m.28/02/2008 3:54:26 p.m.
28
Source: Land Transport New ZealandCommercials – Table 15 continued
Make 2006% of
2006 total2005 2004 2003 2002 2001
Mack - - 1 2 - - -
MAN 10 0.087 33 41 14 18 22
Mazda 427 3.700 535 559 675 716 494
MCW - - - - - 1 3
Mercedes-Benz 90 0.780 160 149 91 107 47
Mitsubishi 891 7.722 1,151 1,295 1,060 1,118 715
Mitsubishi Fuso 4 0.035 4 - - - -
Morris - - 1 - - - -
Nissan 2,541 22.021 2,731 3,252 2,846 2,558 2,137
Nissan Diesel 4 0.035 15 11 6 12 2
Packard 1 0.009 1 - - - -
Peterbilt 1 0.009 1 4 6 2 5
Peugeot - - - 4 - 2 -
Plymouth - - - 1 - - -
Pontiac 1 0.009 1 - - - -
Proton - - - - 1 - -
Reliant - - 1 - - - -
Renault 10 0.087 12 2 1 1 5
Rolls-Royce 1 0.009 - - - - -
Scania 3 0.026 7 14 12 10 7
Seddon Atkinson - - - - - - 2
Skoda - - - - 1 1 -
Sterling 1 0.009 - - 1 - -
Stewart - - - 1 - - -
Studebaker - - 2 1 - 1 -
Subaru 10 0.087 14 10 9 3 3
Suzuki 84 0.728 74 55 36 7 5
Tadano - - - - - 1 -
Tata - - - - - - 1
Toyota 4,670 40.471 5,506 5,583 4,785 3,708 2,348
Vauxhall 1 0.009 - - - 1 1
Volkswagen 13 0.113 15 13 11 12 7
Volvo 18 0.156 11 10 12 40 7
Western Star - - 1 3 1 - 1
Custombuilt - - - - - - 1
Factory built 16 0.139 40 5 3 3 -
Total 11,539 13,278 14,310 11,868 9,932 6,896
LAN 10650 MV Reg Stats - 2006.in28 28LAN 10650 MV Reg Stats - 2006.in28 28 28/02/2008 3:54:27 p.m.28/02/2008 3:54:27 p.m.
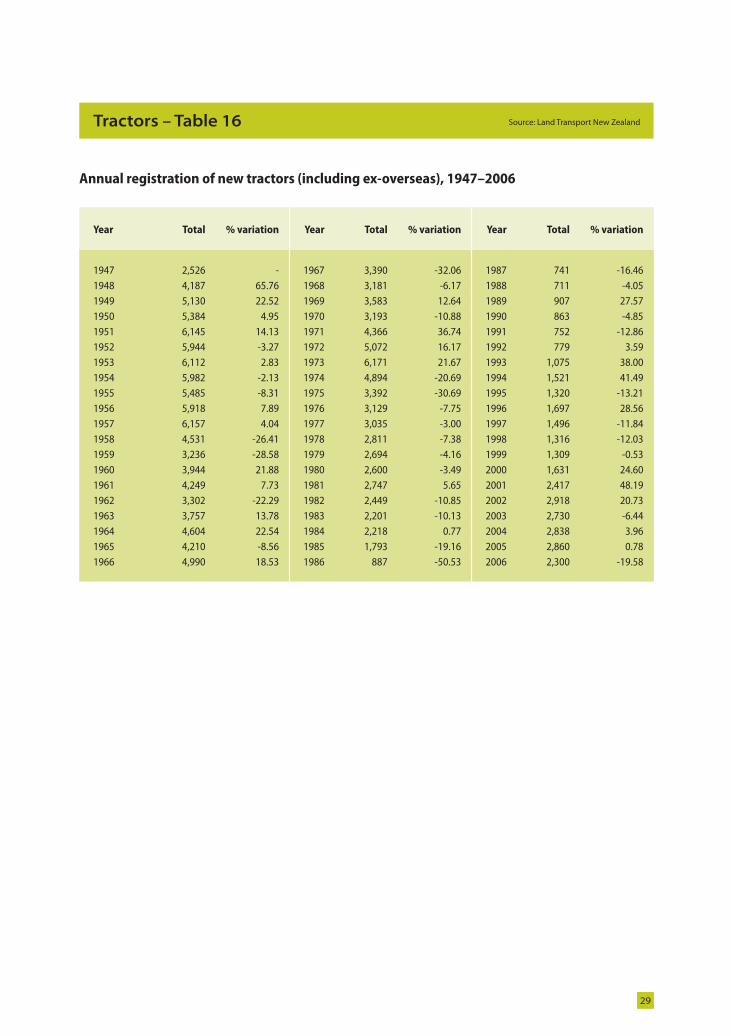
Table 16
29
Source: Land Transport New ZealandTractors – Table 16
Year Total % variation Year Total % variation Year Total % variation
1947 2,526 - 1967 3,390 -32.06 1987 741 -16.461948 4,187 65.76 1968 3,181 -6.17 1988 711 -4.051949 5,130 22.52 1969 3,583 12.64 1989 907 27.571950 5,384 4.95 1970 3,193 -10.88 1990 863 -4.851951 6,145 14.13 1971 4,366 36.74 1991 752 -12.861952 5,944 -3.27 1972 5,072 16.17 1992 779 3.591953 6,112 2.83 1973 6,171 21.67 1993 1,075 38.001954 5,982 -2.13 1974 4,894 -20.69 1994 1,521 41.491955 5,485 -8.31 1975 3,392 -30.69 1995 1,320 -13.211956 5,918 7.89 1976 3,129 -7.75 1996 1,697 28.561957 6,157 4.04 1977 3,035 -3.00 1997 1,496 -11.841958 4,531 -26.41 1978 2,811 -7.38 1998 1,316 -12.031959 3,236 -28.58 1979 2,694 -4.16 1999 1,309 -0.531960 3,944 21.88 1980 2,600 -3.49 2000 1,631 24.601961 4,249 7.73 1981 2,747 5.65 2001 2,417 48.191962 3,302 -22.29 1982 2,449 -10.85 2002 2,918 20.731963 3,757 13.78 1983 2,201 -10.13 2003 2,730 -6.441964 4,604 22.54 1984 2,218 0.77 2004 2,838 3.961965 4,210 -8.56 1985 1,793 -19.16 2005 2,860 0.781966 4,990 18.53 1986 887 -50.53 2006 2,300 -19.58
Annual registration of new tractors (including ex-overseas), 1947–2006
LAN 10650 MV Reg Stats - 2006.in29 29LAN 10650 MV Reg Stats - 2006.in29 29 28/02/2008 3:54:27 p.m.28/02/2008 3:54:27 p.m.
30
Source: Land Transport New ZealandTractors – Table 17
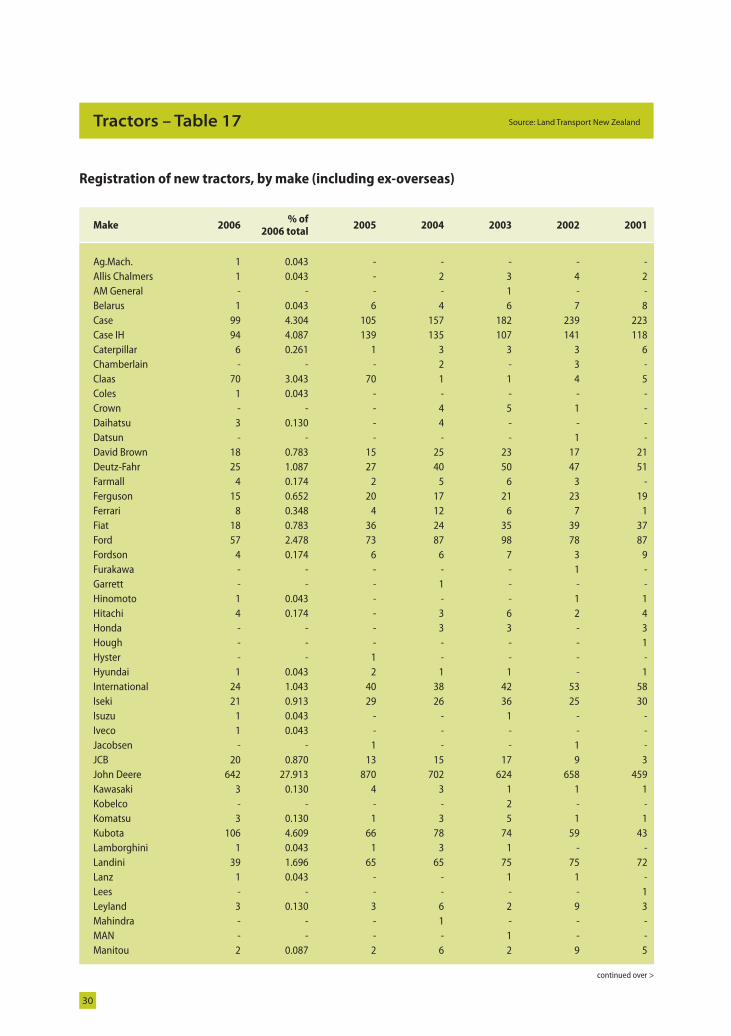
Registration of new tractors, by make (including ex-overseas)
Make 2006% of
2006 total2005 2004 2003 2002 2001
Ag.Mach. 1 0.043 - - - - -Allis Chalmers 1 0.043 - 2 3 4 2AM General - - - - 1 - -Belarus 1 0.043 6 4 6 7 8Case 99 4.304 105 157 182 239 223Case IH 94 4.087 139 135 107 141 118Caterpillar 6 0.261 1 3 3 3 6Chamberlain - - - 2 - 3 -Claas 70 3.043 70 1 1 4 5Coles 1 0.043 - - - - -Crown - - - 4 5 1 -Daihatsu 3 0.130 - 4 - - -Datsun - - - - - 1 -David Brown 18 0.783 15 25 23 17 21Deutz-Fahr 25 1.087 27 40 50 47 51Farmall 4 0.174 2 5 6 3 -Ferguson 15 0.652 20 17 21 23 19Ferrari 8 0.348 4 12 6 7 1Fiat 18 0.783 36 24 35 39 37Ford 57 2.478 73 87 98 78 87Fordson 4 0.174 6 6 7 3 9Furakawa - - - - - 1 -Garrett - - - 1 - - -Hinomoto 1 0.043 - - - 1 1Hitachi 4 0.174 - 3 6 2 4Honda - - - 3 3 - 3Hough - - - - - - 1Hyster - - 1 - - - -Hyundai 1 0.043 2 1 1 - 1International 24 1.043 40 38 42 53 58Iseki 21 0.913 29 26 36 25 30Isuzu 1 0.043 - - 1 - -Iveco 1 0.043 - - - - -Jacobsen - - 1 - - 1 -JCB 20 0.870 13 15 17 9 3John Deere 642 27.913 870 702 624 658 459Kawasaki 3 0.130 4 3 1 1 1Kobelco - - - - 2 - -Komatsu 3 0.130 1 3 5 1 1Kubota 106 4.609 66 78 74 59 43Lamborghini 1 0.043 1 3 1 - -Landini 39 1.696 65 65 75 75 72Lanz 1 0.043 - - 1 1 -Lees - - - - - - 1Leyland 3 0.130 3 6 2 9 3Mahindra - - - 1 - - -MAN - - - - 1 - -Manitou 2 0.087 2 6 2 9 5
continued over >
LAN 10650 MV Reg Stats - 2006.in30 30LAN 10650 MV Reg Stats - 2006.in30 30 28/02/2008 3:54:27 p.m.28/02/2008 3:54:27 p.m.
31
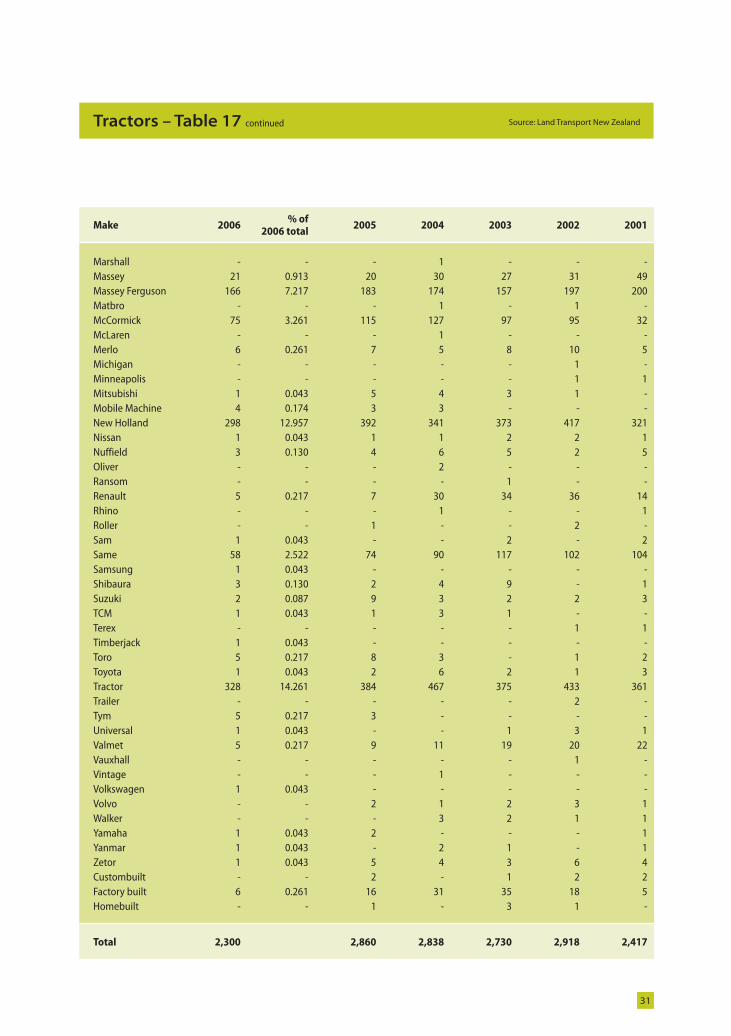
Source: Land Transport New ZealandTractors – Table 17 continued
Make 2006% of
2006 total2005 2004 2003 2002 2001
Marshall - - - 1 - - -Massey 21 0.913 20 30 27 31 49Massey Ferguson 166 7.217 183 174 157 197 200Matbro - - - 1 - 1 -McCormick 75 3.261 115 127 97 95 32McLaren - - - 1 - - -Merlo 6 0.261 7 5 8 10 5Michigan - - - - - 1 -Minneapolis - - - - - 1 1Mitsubishi 1 0.043 5 4 3 1 -Mobile Machine 4 0.174 3 3 - - -New Holland 298 12.957 392 341 373 417 321Nissan 1 0.043 1 1 2 2 1Nuffield 3 0.130 4 6 5 2 5Oliver - - - 2 - - -Ransom - - - - 1 - -Renault 5 0.217 7 30 34 36 14Rhino - - - 1 - - 1Roller - - 1 - - 2 -Sam 1 0.043 - - 2 - 2Same 58 2.522 74 90 117 102 104Samsung 1 0.043 - - - - -Shibaura 3 0.130 2 4 9 - 1Suzuki 2 0.087 9 3 2 2 3TCM 1 0.043 1 3 1 - -Terex - - - - - 1 1Timberjack 1 0.043 - - - - -Toro 5 0.217 8 3 - 1 2Toyota 1 0.043 2 6 2 1 3Tractor 328 14.261 384 467 375 433 361Trailer - - - - - 2 -Tym 5 0.217 3 - - - -Universal 1 0.043 - - 1 3 1Valmet 5 0.217 9 11 19 20 22Vauxhall - - - - - 1 -Vintage - - - 1 - - -Volkswagen 1 0.043 - - - - -Volvo - - 2 1 2 3 1Walker - - - 3 2 1 1Yamaha 1 0.043 2 - - - 1Yanmar 1 0.043 - 2 1 - 1Zetor 1 0.043 5 4 3 6 4Custombuilt - - 2 - 1 2 2Factory built 6 0.261 16 31 35 18 5Homebuilt - - 1 - 3 1 -
Total 2,300 2,860 2,838 2,730 2,918 2,417
LAN 10650 MV Reg Stats - 2006.in31 31LAN 10650 MV Reg Stats - 2006.in31 31 28/02/2008 3:54:28 p.m.28/02/2008 3:54:28 p.m.
32
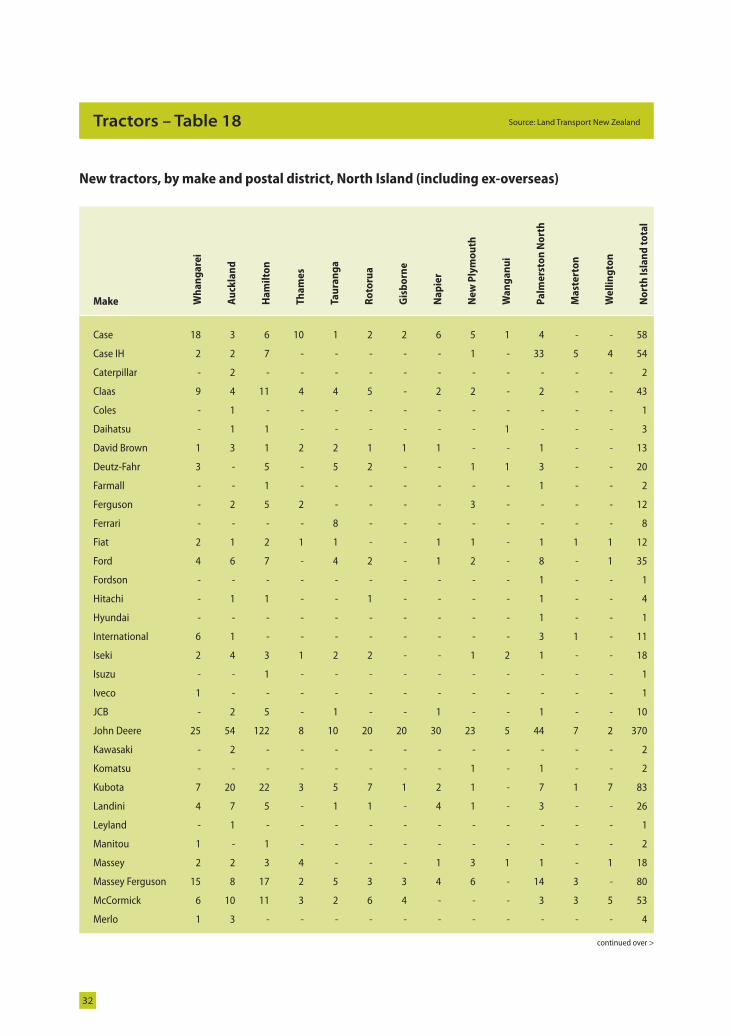
Source: Land Transport Safety AuthorityTable number Source: Land Transport Safety AuthorityTRACTORS – Table 18 Source: Land Transport New ZealandTractors – Table 18
New tractors, by make and postal district, North Island (including ex-overseas)
Make Wh
an
ga
rei
Au
ckla
nd
Ha
mil
ton
Th
am
es
Tau
ran
ga
Ro
toru
a
Gis
bo
rne
Na
pie
r
Ne
w P
lym
ou
th
Wa
ng
an
ui
Pa
lme
rsto
n N
ort
h
Ma
ste
rto
n
We
llin
gto
n
No
rth
Isl
an
d t
ota
l
Case 18 3 6 10 1 2 2 6 5 1 4 - - 58
Case IH 2 2 7 - - - - - 1 - 33 5 4 54
Caterpillar - 2 - - - - - - - - - - - 2
Claas 9 4 11 4 4 5 - 2 2 - 2 - - 43
Coles - 1 - - - - - - - - - - - 1
Daihatsu - 1 1 - - - - - - 1 - - - 3
David Brown 1 3 1 2 2 1 1 1 - - 1 - - 13
Deutz-Fahr 3 - 5 - 5 2 - - 1 1 3 - - 20
Farmall - - 1 - - - - - - - 1 - - 2
Ferguson - 2 5 2 - - - - 3 - - - - 12
Ferrari - - - - 8 - - - - - - - - 8
Fiat 2 1 2 1 1 - - 1 1 - 1 1 1 12
Ford 4 6 7 - 4 2 - 1 2 - 8 - 1 35
Fordson - - - - - - - - - - 1 - - 1
Hitachi - 1 1 - - 1 - - - - 1 - - 4
Hyundai - - - - - - - - - - 1 - - 1
International 6 1 - - - - - - - - 3 1 - 11
Iseki 2 4 3 1 2 2 - - 1 2 1 - - 18
Isuzu - - 1 - - - - - - - - - - 1
Iveco 1 - - - - - - - - - - - - 1
JCB - 2 5 - 1 - - 1 - - 1 - - 10
John Deere 25 54 122 8 10 20 20 30 23 5 44 7 2 370
Kawasaki - 2 - - - - - - - - - - - 2
Komatsu - - - - - - - - 1 - 1 - - 2
Kubota 7 20 22 3 5 7 1 2 1 - 7 1 7 83
Landini 4 7 5 - 1 1 - 4 1 - 3 - - 26
Leyland - 1 - - - - - - - - - - - 1
Manitou 1 - 1 - - - - - - - - - - 2
Massey 2 2 3 4 - - - 1 3 1 1 - 1 18
Massey Ferguson 15 8 17 2 5 3 3 4 6 - 14 3 - 80
McCormick 6 10 11 3 2 6 4 - - - 3 3 5 53
Merlo 1 3 - - - - - - - - - - - 4
continued over >
LAN 10650 MV Reg Stats - 2006.in32 32LAN 10650 MV Reg Stats - 2006.in32 32 28/02/2008 3:54:28 p.m.28/02/2008 3:54:28 p.m.
33
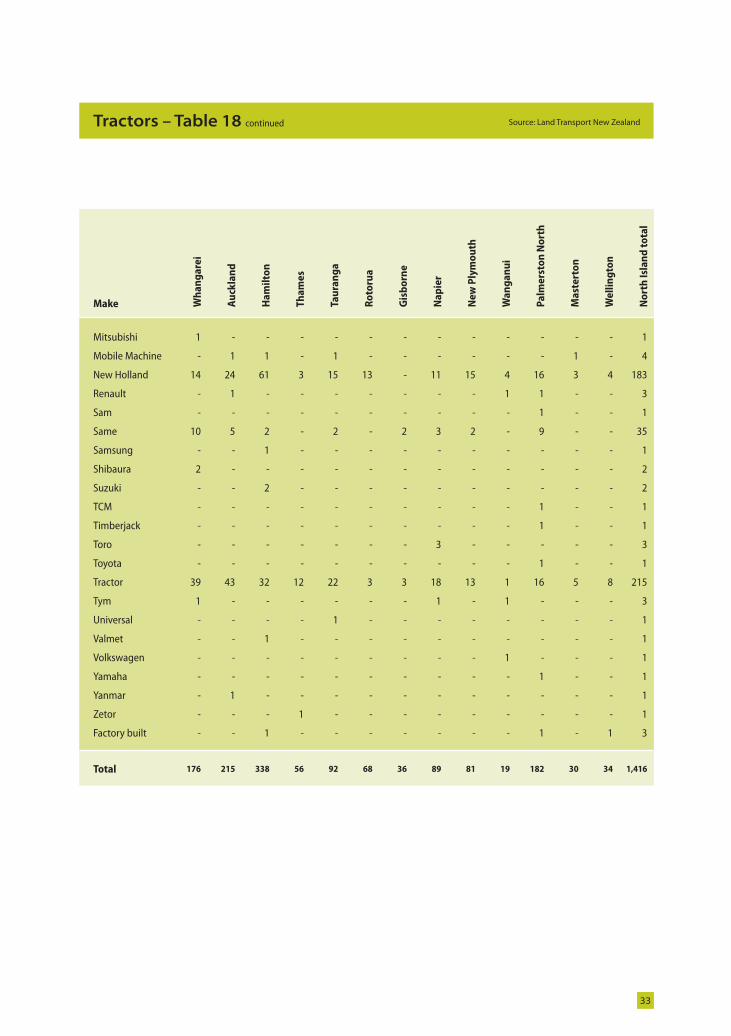
Source: Land Transport New ZealandTractors – Table 18 continued
Make Wh
an
ga
rei
Au
ckla
nd
Ha
mil
ton
Th
am
es
Tau
ran
ga
Ro
toru
a
Gis
bo
rne
Na
pie
r
Ne
w P
lym
ou
th
Wa
ng
an
ui
Pa
lme
rsto
n N
ort
h
Ma
ste
rto
n
We
llin
gto
n
No
rth
Isl
an
d t
ota
l
Mitsubishi 1 - - - - - - - - - - - - 1
Mobile Machine - 1 1 - 1 - - - - - - 1 - 4
New Holland 14 24 61 3 15 13 - 11 15 4 16 3 4 183
Renault - 1 - - - - - - - 1 1 - - 3
Sam - - - - - - - - - - 1 - - 1
Same 10 5 2 - 2 - 2 3 2 - 9 - - 35
Samsung - - 1 - - - - - - - - - - 1
Shibaura 2 - - - - - - - - - - - - 2
Suzuki - - 2 - - - - - - - - - - 2
TCM - - - - - - - - - - 1 - - 1
Timberjack - - - - - - - - - - 1 - - 1
Toro - - - - - - - 3 - - - - - 3
Toyota - - - - - - - - - - 1 - - 1
Tractor 39 43 32 12 22 3 3 18 13 1 16 5 8 215
Tym 1 - - - - - - 1 - 1 - - - 3
Universal - - - - 1 - - - - - - - - 1
Valmet - - 1 - - - - - - - - - - 1
Volkswagen - - - - - - - - - 1 - - - 1
Yamaha - - - - - - - - - - 1 - - 1
Yanmar - 1 - - - - - - - - - - - 1
Zetor - - - 1 - - - - - - - - - 1
Factory built - - 1 - - - - - - - 1 - 1 3
Total 176 215 338 56 92 68 36 89 81 19 182 30 34 1,416
LAN 10650 MV Reg Stats - 2006.in33 33LAN 10650 MV Reg Stats - 2006.in33 33 28/02/2008 3:54:29 p.m.28/02/2008 3:54:29 p.m.
34
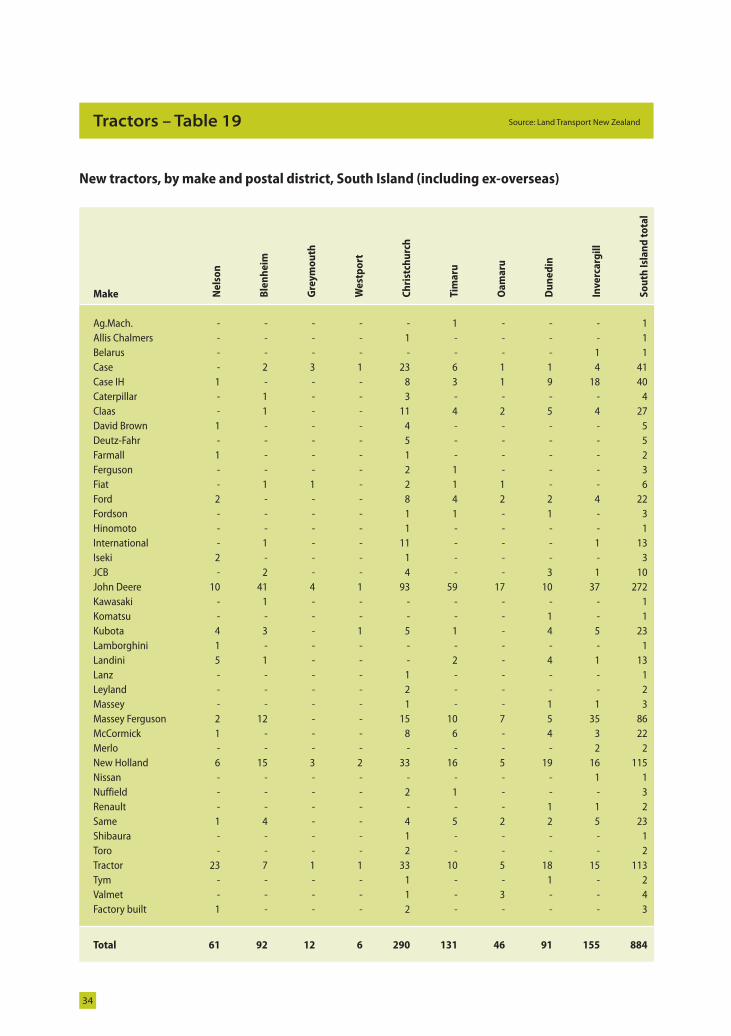
Source: Land Transport New ZealandTractors – Table 19
New tractors, by make and postal district, South Island (including ex-overseas)
Make Ne
lso
n
Ble
nh
eim
Gre
ym
ou
th
We
stp
ort
Ch
rist
chu
rch
Tim
aru
Oa
ma
ru
Du
ne
din
Inv
erc
arg
ill
So
uth
Isl
an
d t
ota
l
Ag.Mach. - - - - - 1 - - - 1Allis Chalmers - - - - 1 - - - - 1Belarus - - - - - - - - 1 1Case - 2 3 1 23 6 1 1 4 41Case IH 1 - - - 8 3 1 9 18 40Caterpillar - 1 - - 3 - - - - 4Claas - 1 - - 11 4 2 5 4 27David Brown 1 - - - 4 - - - - 5Deutz-Fahr - - - - 5 - - - - 5Farmall 1 - - - 1 - - - - 2Ferguson - - - - 2 1 - - - 3Fiat - 1 1 - 2 1 1 - - 6Ford 2 - - - 8 4 2 2 4 22Fordson - - - - 1 1 - 1 - 3Hinomoto - - - - 1 - - - - 1International - 1 - - 11 - - - 1 13Iseki 2 - - - 1 - - - - 3JCB - 2 - - 4 - - 3 1 10John Deere 10 41 4 1 93 59 17 10 37 272Kawasaki - 1 - - - - - - - 1Komatsu - - - - - - - 1 - 1Kubota 4 3 - 1 5 1 - 4 5 23Lamborghini 1 - - - - - - - - 1Landini 5 1 - - - 2 - 4 1 13Lanz - - - - 1 - - - - 1Leyland - - - - 2 - - - - 2Massey - - - - 1 - - 1 1 3Massey Ferguson 2 12 - - 15 10 7 5 35 86McCormick 1 - - - 8 6 - 4 3 22Merlo - - - - - - - - 2 2New Holland 6 15 3 2 33 16 5 19 16 115Nissan - - - - - - - - 1 1Nuffield - - - - 2 1 - - - 3Renault - - - - - - - 1 1 2Same 1 4 - - 4 5 2 2 5 23Shibaura - - - - 1 - - - - 1Toro - - - - 2 - - - - 2Tractor 23 7 1 1 33 10 5 18 15 113Tym - - - - 1 - - 1 - 2Valmet - - - - 1 - 3 - - 4Factory built 1 - - - 2 - - - - 3
Total 61 92 12 6 290 131 46 91 155 884
LAN 10650 MV Reg Stats - 2006.in34 34LAN 10650 MV Reg Stats - 2006.in34 34 28/02/2008 3:54:29 p.m.28/02/2008 3:54:29 p.m.
35
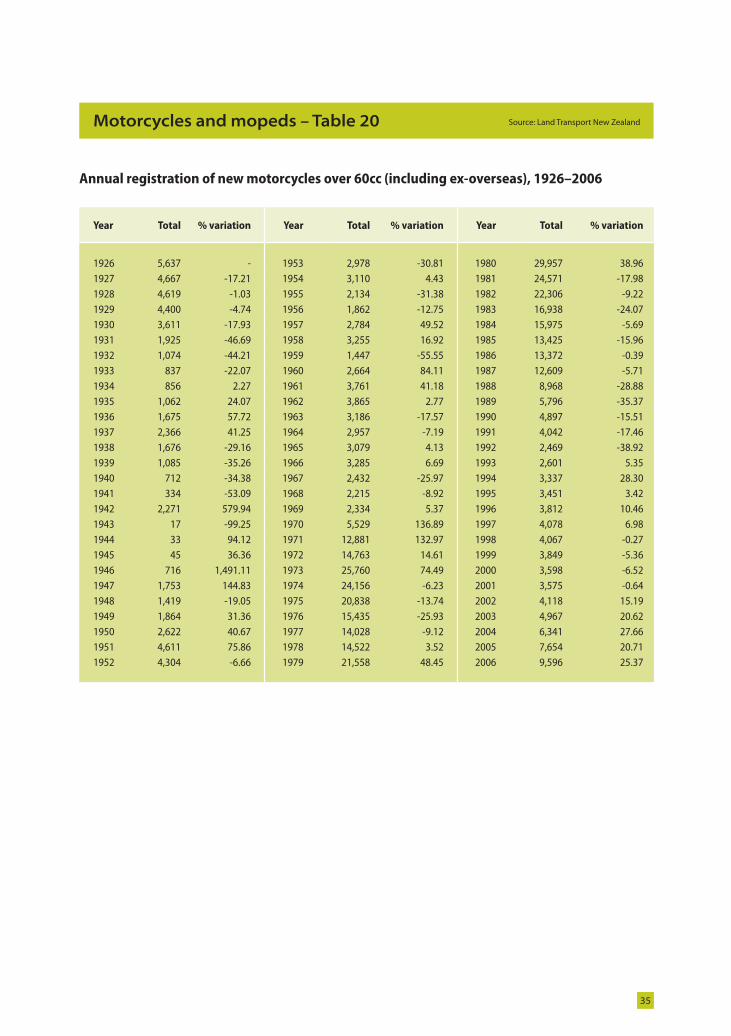
Source: Land Transport New ZealandMotorcycles and mopeds – Table 20
Year Total % variation Year Total % variation Year Total % variation
1926 5,637 - 1953 2,978 -30.81 1980 29,957 38.961927 4,667 -17.21 1954 3,110 4.43 1981 24,571 -17.981928 4,619 -1.03 1955 2,134 -31.38 1982 22,306 -9.221929 4,400 -4.74 1956 1,862 -12.75 1983 16,938 -24.071930 3,611 -17.93 1957 2,784 49.52 1984 15,975 -5.691931 1,925 -46.69 1958 3,255 16.92 1985 13,425 -15.961932 1,074 -44.21 1959 1,447 -55.55 1986 13,372 -0.391933 837 -22.07 1960 2,664 84.11 1987 12,609 -5.711934 856 2.27 1961 3,761 41.18 1988 8,968 -28.881935 1,062 24.07 1962 3,865 2.77 1989 5,796 -35.371936 1,675 57.72 1963 3,186 -17.57 1990 4,897 -15.511937 2,366 41.25 1964 2,957 -7.19 1991 4,042 -17.461938 1,676 -29.16 1965 3,079 4.13 1992 2,469 -38.921939 1,085 -35.26 1966 3,285 6.69 1993 2,601 5.351940 712 -34.38 1967 2,432 -25.97 1994 3,337 28.301941 334 -53.09 1968 2,215 -8.92 1995 3,451 3.421942 2,271 579.94 1969 2,334 5.37 1996 3,812 10.461943 17 -99.25 1970 5,529 136.89 1997 4,078 6.981944 33 94.12 1971 12,881 132.97 1998 4,067 -0.271945 45 36.36 1972 14,763 14.61 1999 3,849 -5.361946 716 1,491.11 1973 25,760 74.49 2000 3,598 -6.521947 1,753 144.83 1974 24,156 -6.23 2001 3,575 -0.641948 1,419 -19.05 1975 20,838 -13.74 2002 4,118 15.191949 1,864 31.36 1976 15,435 -25.93 2003 4,967 20.621950 2,622 40.67 1977 14,028 -9.12 2004 6,341 27.661951 4,611 75.86 1978 14,522 3.52 2005 7,654 20.711952 4,304 -6.66 1979 21,558 48.45 2006 9,596 25.37
Annual registration of new motorcycles over 60cc (including ex-overseas), 1926–2006
LAN 10650 MV Reg Stats - 2006.in35 35LAN 10650 MV Reg Stats - 2006.in35 35 28/02/2008 3:54:30 p.m.28/02/2008 3:54:30 p.m.
36
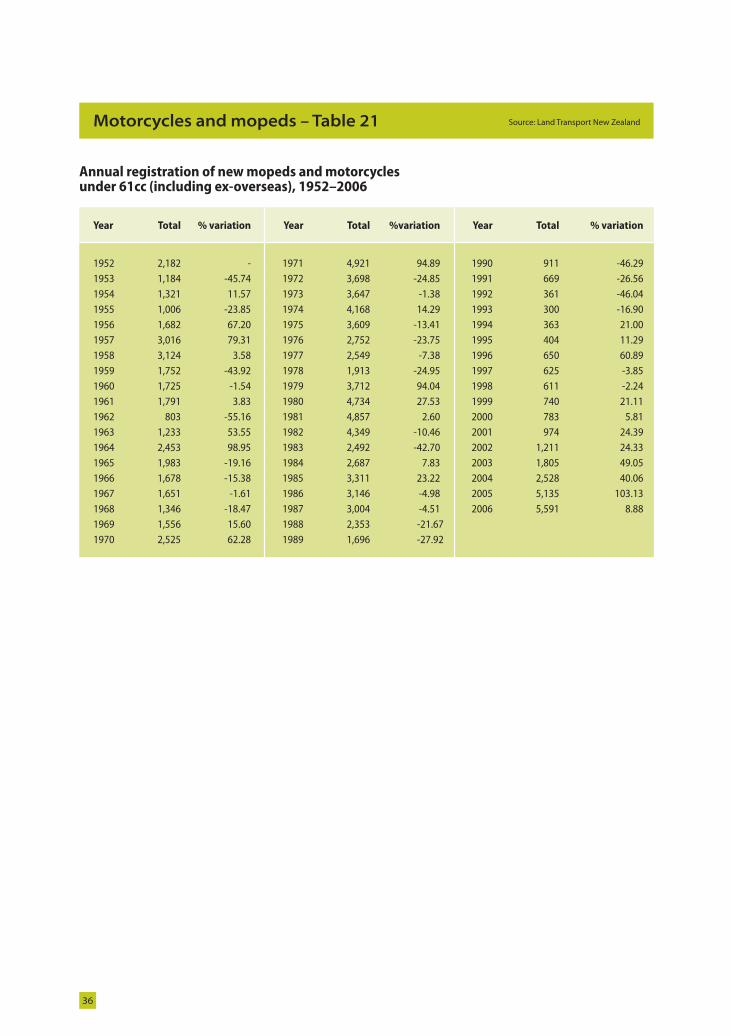
Source: Land Transport New ZealandMotorcycles and mopeds – Table 21
Year Total % variation Year Total %variation Year Total % variation
1952 2,182 - 1971 4,921 94.89 1990 911 -46.291953 1,184 -45.74 1972 3,698 -24.85 1991 669 -26.561954 1,321 11.57 1973 3,647 -1.38 1992 361 -46.041955 1,006 -23.85 1974 4,168 14.29 1993 300 -16.901956 1,682 67.20 1975 3,609 -13.41 1994 363 21.001957 3,016 79.31 1976 2,752 -23.75 1995 404 11.291958 3,124 3.58 1977 2,549 -7.38 1996 650 60.891959 1,752 -43.92 1978 1,913 -24.95 1997 625 -3.851960 1,725 -1.54 1979 3,712 94.04 1998 611 -2.241961 1,791 3.83 1980 4,734 27.53 1999 740 21.111962 803 -55.16 1981 4,857 2.60 2000 783 5.811963 1,233 53.55 1982 4,349 -10.46 2001 974 24.391964 2,453 98.95 1983 2,492 -42.70 2002 1,211 24.331965 1,983 -19.16 1984 2,687 7.83 2003 1,805 49.051966 1,678 -15.38 1985 3,311 23.22 2004 2,528 40.061967 1,651 -1.61 1986 3,146 -4.98 2005 5,135 103.131968 1,346 -18.47 1987 3,004 -4.51 2006 5,591 8.881969 1,556 15.60 1988 2,353 -21.671970 2,525 62.28 1989 1,696 -27.92
Annual registration of new mopeds and motorcycles under 61cc (including ex-overseas), 1952–2006
LAN 10650 MV Reg Stats - 2006.in36 36LAN 10650 MV Reg Stats - 2006.in36 36 28/02/2008 3:54:30 p.m.28/02/2008 3:54:30 p.m.
37
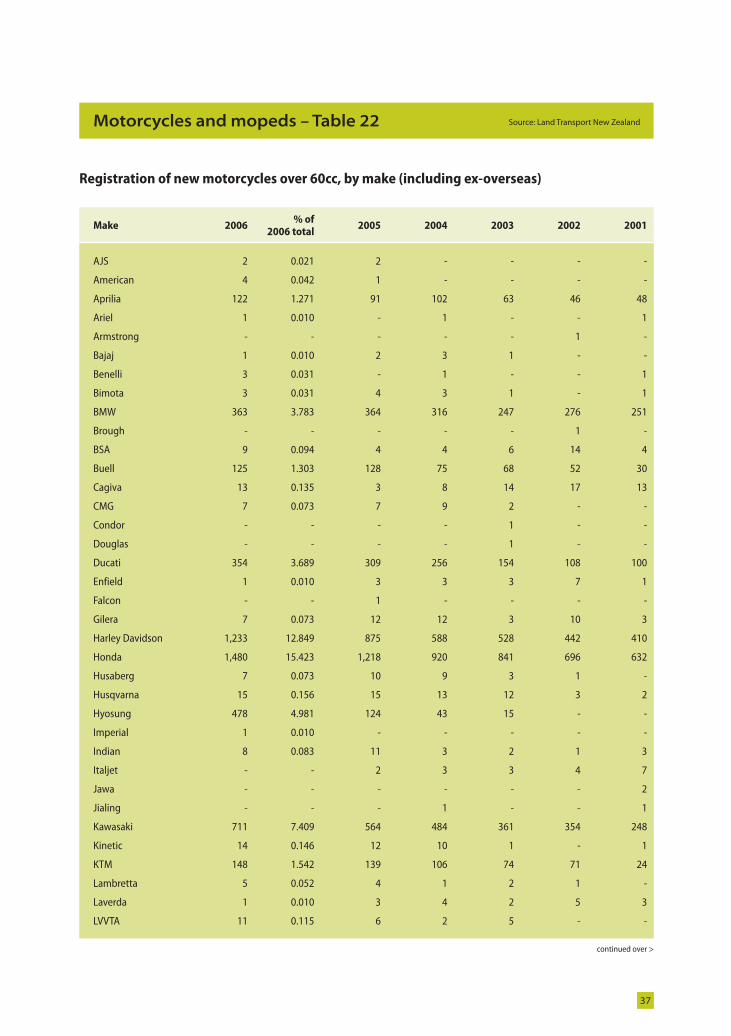
Source: Land Transport New ZealandMotorcycles and mopeds – Table 22
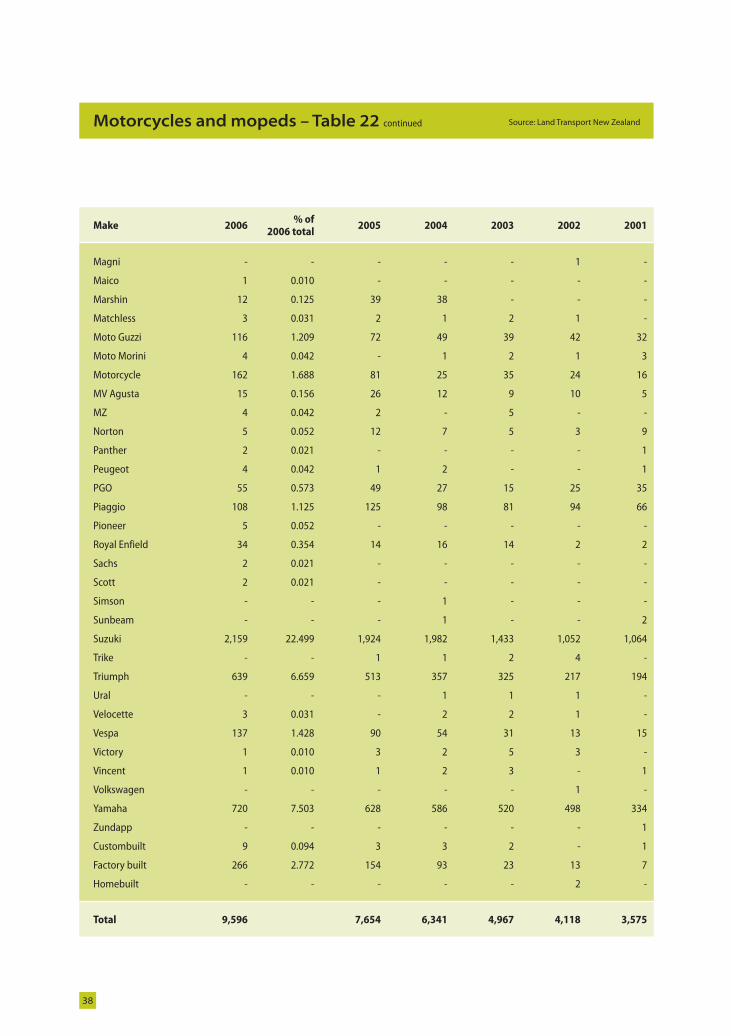
Registration of new motorcycles over 60cc, by make (including ex-overseas)
continued over >
Make 2006% of
2006 total2005 2004 2003 2002 2001
AJS 2 0.021 2 - - - -
American 4 0.042 1 - - - -
Aprilia 122 1.271 91 102 63 46 48
Ariel 1 0.010 - 1 - - 1
Armstrong - - - - - 1 -
Bajaj 1 0.010 2 3 1 - -
Benelli 3 0.031 - 1 - - 1
Bimota 3 0.031 4 3 1 - 1
BMW 363 3.783 364 316 247 276 251
Brough - - - - - 1 -
BSA 9 0.094 4 4 6 14 4
Buell 125 1.303 128 75 68 52 30
Cagiva 13 0.135 3 8 14 17 13
CMG 7 0.073 7 9 2 - -
Condor - - - - 1 - -
Douglas - - - - 1 - -
Ducati 354 3.689 309 256 154 108 100
Enfield 1 0.010 3 3 3 7 1
Falcon - - 1 - - - -
Gilera 7 0.073 12 12 3 10 3
Harley Davidson 1,233 12.849 875 588 528 442 410
Honda 1,480 15.423 1,218 920 841 696 632
Husaberg 7 0.073 10 9 3 1 -
Husqvarna 15 0.156 15 13 12 3 2
Hyosung 478 4.981 124 43 15 - -
Imperial 1 0.010 - - - - -
Indian 8 0.083 11 3 2 1 3
Italjet - - 2 3 3 4 7
Jawa - - - - - - 2
Jialing - - - 1 - - 1
Kawasaki 711 7.409 564 484 361 354 248
Kinetic 14 0.146 12 10 1 - 1
KTM 148 1.542 139 106 74 71 24
Lambretta 5 0.052 4 1 2 1 -
Laverda 1 0.010 3 4 2 5 3
LVVTA 11 0.115 6 2 5 - -
LAN 10650 MV Reg Stats - 2006.in37 37LAN 10650 MV Reg Stats - 2006.in37 37 28/02/2008 3:54:30 p.m.28/02/2008 3:54:30 p.m.
38
Source: Land Transport New ZealandMotorcycles and mopeds – Table 22 continued
Make 2006% of
2006 total2005 2004 2003 2002 2001
Magni - - - - - 1 -
Maico 1 0.010 - - - - -
Marshin 12 0.125 39 38 - - -
Matchless 3 0.031 2 1 2 1 -
Moto Guzzi 116 1.209 72 49 39 42 32
Moto Morini 4 0.042 - 1 2 1 3
Motorcycle 162 1.688 81 25 35 24 16
MV Agusta 15 0.156 26 12 9 10 5
MZ 4 0.042 2 - 5 - -
Norton 5 0.052 12 7 5 3 9
Panther 2 0.021 - - - - 1
Peugeot 4 0.042 1 2 - - 1
PGO 55 0.573 49 27 15 25 35
Piaggio 108 1.125 125 98 81 94 66
Pioneer 5 0.052 - - - - -
Royal Enfield 34 0.354 14 16 14 2 2
Sachs 2 0.021 - - - - -
Scott 2 0.021 - - - - -
Simson - - - 1 - - -
Sunbeam - - - 1 - - 2
Suzuki 2,159 22.499 1,924 1,982 1,433 1,052 1,064
Trike - - 1 1 2 4 -
Triumph 639 6.659 513 357 325 217 194
Ural - - - 1 1 1 -
Velocette 3 0.031 - 2 2 1 -
Vespa 137 1.428 90 54 31 13 15
Victory 1 0.010 3 2 5 3 -
Vincent 1 0.010 1 2 3 - 1
Volkswagen - - - - - 1 -
Yamaha 720 7.503 628 586 520 498 334
Zundapp - - - - - - 1
Custombuilt 9 0.094 3 3 2 - 1
Factory built 266 2.772 154 93 23 13 7
Homebuilt - - - - - 2 -
Total 9,596 7,654 6,341 4,967 4,118 3,575
LAN 10650 MV Reg Stats - 2006.in38 38LAN 10650 MV Reg Stats - 2006.in38 38 28/02/2008 3:54:30 p.m.28/02/2008 3:54:30 p.m.
39
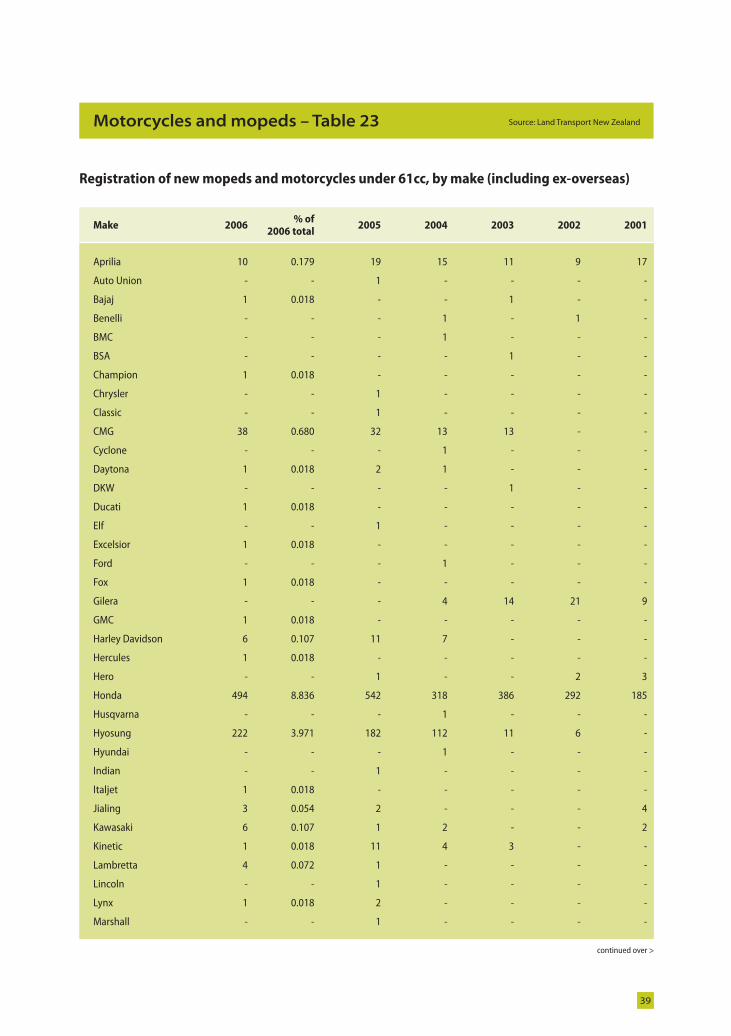
Source: Land Transport New ZealandMotorcycles and mopeds – Table 23
Registration of new mopeds and motorcycles under 61cc, by make (including ex-overseas)
continued over >
Make 2006% of
2006 total2005 2004 2003 2002 2001
Aprilia 10 0.179 19 15 11 9 17
Auto Union - - 1 - - - -
Bajaj 1 0.018 - - 1 - -
Benelli - - - 1 - 1 -
BMC - - - 1 - - -
BSA - - - - 1 - -
Champion 1 0.018 - - - - -
Chrysler - - 1 - - - -
Classic - - 1 - - - -
CMG 38 0.680 32 13 13 - -
Cyclone - - - 1 - - -
Daytona 1 0.018 2 1 - - -
DKW - - - - 1 - -
Ducati 1 0.018 - - - - -
Elf - - 1 - - - -
Excelsior 1 0.018 - - - - -
Ford - - - 1 - - -
Fox 1 0.018 - - - - -
Gilera - - - 4 14 21 9
GMC 1 0.018 - - - - -
Harley Davidson 6 0.107 11 7 - - -
Hercules 1 0.018 - - - - -
Hero - - 1 - - 2 3
Honda 494 8.836 542 318 386 292 185
Husqvarna - - - 1 - - -
Hyosung 222 3.971 182 112 11 6 -
Hyundai - - - 1 - - -
Indian - - 1 - - - -
Italjet 1 0.018 - - - - -
Jialing 3 0.054 2 - - - 4
Kawasaki 6 0.107 1 2 - - 2
Kinetic 1 0.018 11 4 3 - -
Lambretta 4 0.072 1 - - - -
Lincoln - - 1 - - - -
Lynx 1 0.018 2 - - - -
Marshall - - 1 - - - -
LAN 10650 MV Reg Stats - 2006.in39 39LAN 10650 MV Reg Stats - 2006.in39 39 28/02/2008 3:54:31 p.m.28/02/2008 3:54:31 p.m.
40
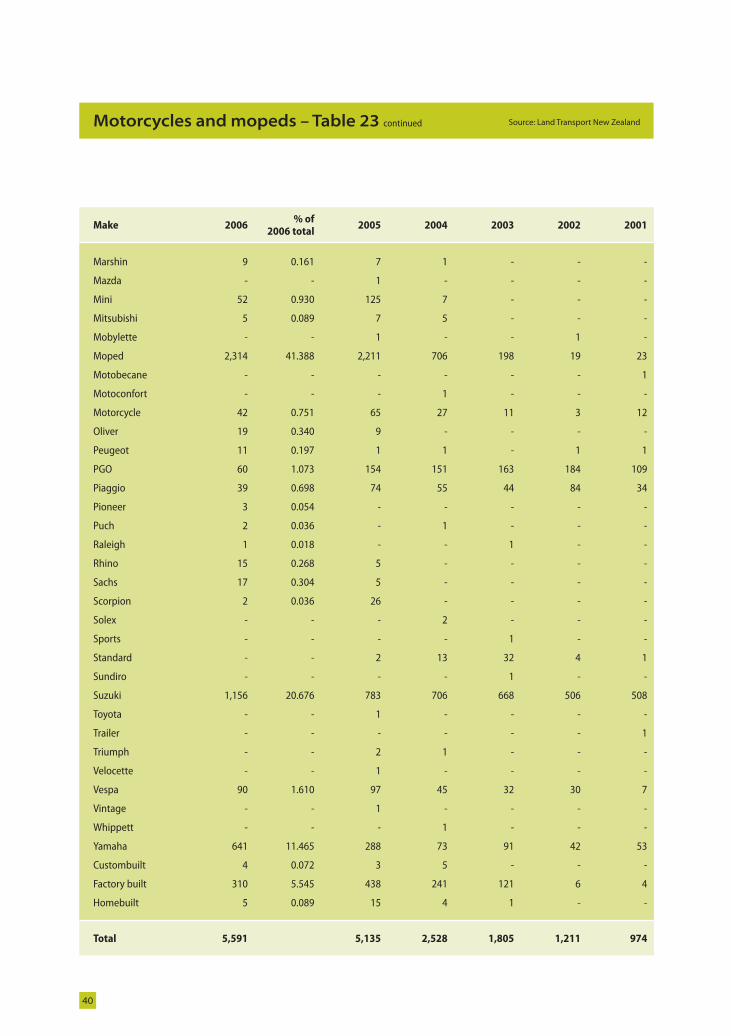
Source: Land Transport New ZealandMotorcycles and mopeds – Table 23 continued
Make 2006% of
2006 total2005 2004 2003 2002 2001
Marshin 9 0.161 7 1 - - -
Mazda - - 1 - - - -
Mini 52 0.930 125 7 - - -
Mitsubishi 5 0.089 7 5 - - -
Mobylette - - 1 - - 1 -
Moped 2,314 41.388 2,211 706 198 19 23
Motobecane - - - - - - 1
Motoconfort - - - 1 - - -
Motorcycle 42 0.751 65 27 11 3 12
Oliver 19 0.340 9 - - - -
Peugeot 11 0.197 1 1 - 1 1
PGO 60 1.073 154 151 163 184 109
Piaggio 39 0.698 74 55 44 84 34
Pioneer 3 0.054 - - - - -
Puch 2 0.036 - 1 - - -
Raleigh 1 0.018 - - 1 - -
Rhino 15 0.268 5 - - - -
Sachs 17 0.304 5 - - - -
Scorpion 2 0.036 26 - - - -
Solex - - - 2 - - -
Sports - - - - 1 - -
Standard - - 2 13 32 4 1
Sundiro - - - - 1 - -
Suzuki 1,156 20.676 783 706 668 506 508
Toyota - - 1 - - - -
Trailer - - - - - - 1
Triumph - - 2 1 - - -
Velocette - - 1 - - - -
Vespa 90 1.610 97 45 32 30 7
Vintage - - 1 - - - -
Whippett - - - 1 - - -
Yamaha 641 11.465 288 73 91 42 53
Custombuilt 4 0.072 3 5 - - -
Factory built 310 5.545 438 241 121 6 4
Homebuilt 5 0.089 15 4 1 - -
Total 5,591 5,135 2,528 1,805 1,211 974
LAN 10650 MV Reg Stats - 2006.in40 40LAN 10650 MV Reg Stats - 2006.in40 40 28/02/2008 3:54:31 p.m.28/02/2008 3:54:31 p.m.
41
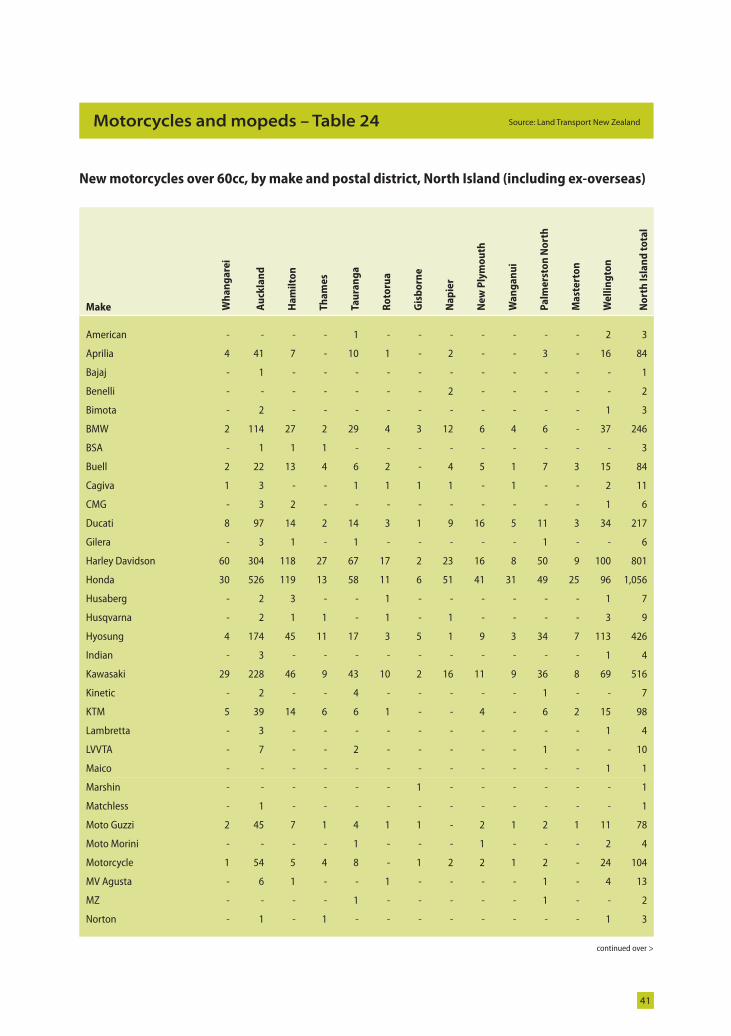
Source: Land Transport New ZealandMotorcycles and mopeds – Table 24
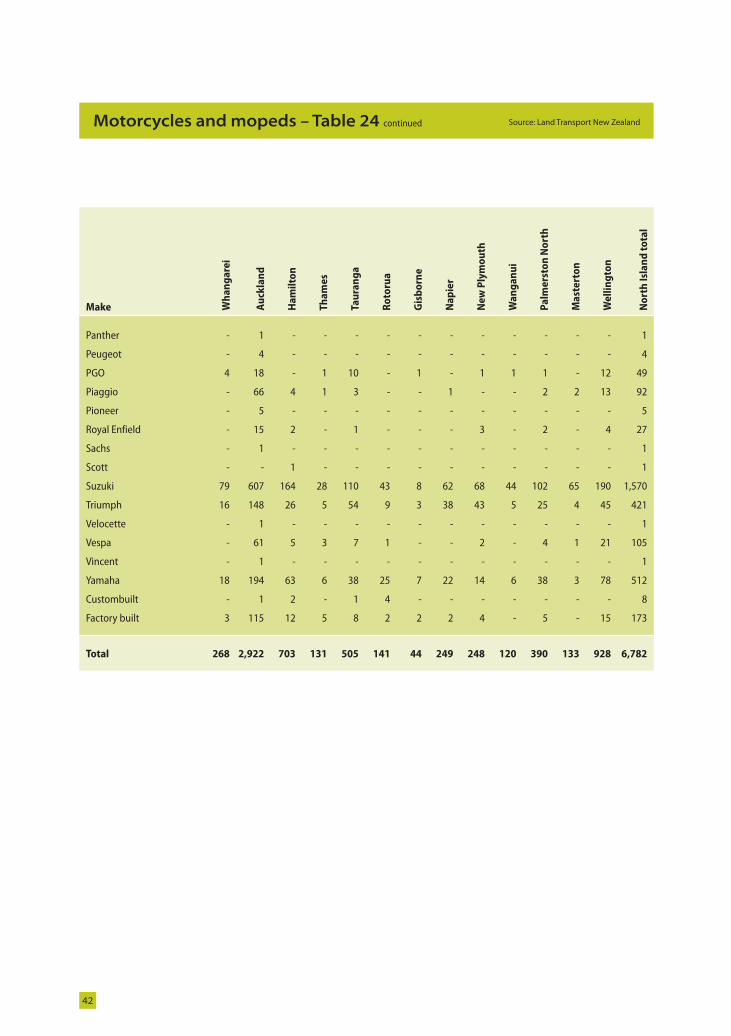
New motorcycles over 60cc, by make and postal district, North Island (including ex-overseas)
continued over >
Make Wh
an
ga
rei
Au
ckla
nd
Ha
mil
ton
Th
am
es
Tau
ran
ga
Ro
toru
a
Gis
bo
rne
Na
pie
r
Ne
w P
lym
ou
th
Wa
ng
an
ui
Pa
lme
rsto
n N
ort
h
Ma
ste
rto
n
We
llin
gto
n
No
rth
Isl
an
d t
ota
l
American - - - - 1 - - - - - - - 2 3
Aprilia 4 41 7 - 10 1 - 2 - - 3 - 16 84
Bajaj - 1 - - - - - - - - - - - 1
Benelli - - - - - - - 2 - - - - - 2
Bimota - 2 - - - - - - - - - - 1 3
BMW 2 114 27 2 29 4 3 12 6 4 6 - 37 246
BSA - 1 1 1 - - - - - - - - - 3
Buell 2 22 13 4 6 2 - 4 5 1 7 3 15 84
Cagiva 1 3 - - 1 1 1 1 - 1 - - 2 11
CMG - 3 2 - - - - - - - - - 1 6
Ducati 8 97 14 2 14 3 1 9 16 5 11 3 34 217
Gilera - 3 1 - 1 - - - - - 1 - - 6
Harley Davidson 60 304 118 27 67 17 2 23 16 8 50 9 100 801
Honda 30 526 119 13 58 11 6 51 41 31 49 25 96 1,056
Husaberg - 2 3 - - 1 - - - - - - 1 7
Husqvarna - 2 1 1 - 1 - 1 - - - - 3 9
Hyosung 4 174 45 11 17 3 5 1 9 3 34 7 113 426
Indian - 3 - - - - - - - - - - 1 4
Kawasaki 29 228 46 9 43 10 2 16 11 9 36 8 69 516
Kinetic - 2 - - 4 - - - - - 1 - - 7
KTM 5 39 14 6 6 1 - - 4 - 6 2 15 98
Lambretta - 3 - - - - - - - - - - 1 4
LVVTA - 7 - - 2 - - - - - 1 - - 10
Maico - - - - - - - - - - - - 1 1
Marshin - - - - - - 1 - - - - - - 1
Matchless - 1 - - - - - - - - - - - 1
Moto Guzzi 2 45 7 1 4 1 1 - 2 1 2 1 11 78
Moto Morini - - - - 1 - - - 1 - - - 2 4
Motorcycle 1 54 5 4 8 - 1 2 2 1 2 - 24 104
MV Agusta - 6 1 - - 1 - - - - 1 - 4 13
MZ - - - - 1 - - - - - 1 - - 2
Norton - 1 - 1 - - - - - - - - 1 3
LAN 10650 MV Reg Stats - 2006.in41 41LAN 10650 MV Reg Stats - 2006.in41 41 28/02/2008 3:54:31 p.m.28/02/2008 3:54:31 p.m.
42
Source: Land Transport New ZealandMotorcycles and mopeds – Table 24 continued
Make Wh
an
ga
rei
Au
ckla
nd
Ha
mil
ton
Th
am
es
Tau
ran
ga
Ro
toru
a
Gis
bo
rne
Na
pie
r
Ne
w P
lym
ou
th
Wa
ng
an
ui
Pa
lme
rsto
n N
ort
h
Ma
ste
rto
n
We
llin
gto
n
No
rth
Isl
an
d t
ota
l
Panther - 1 - - - - - - - - - - - 1
Peugeot - 4 - - - - - - - - - - - 4
PGO 4 18 - 1 10 - 1 - 1 1 1 - 12 49
Piaggio - 66 4 1 3 - - 1 - - 2 2 13 92
Pioneer - 5 - - - - - - - - - - - 5
Royal Enfield - 15 2 - 1 - - - 3 - 2 - 4 27
Sachs - 1 - - - - - - - - - - - 1
Scott - - 1 - - - - - - - - - - 1
Suzuki 79 607 164 28 110 43 8 62 68 44 102 65 190 1,570
Triumph 16 148 26 5 54 9 3 38 43 5 25 4 45 421
Velocette - 1 - - - - - - - - - - - 1
Vespa - 61 5 3 7 1 - - 2 - 4 1 21 105
Vincent - 1 - - - - - - - - - - - 1
Yamaha 18 194 63 6 38 25 7 22 14 6 38 3 78 512
Custombuilt - 1 2 - 1 4 - - - - - - - 8
Factory built 3 115 12 5 8 2 2 2 4 - 5 - 15 173
Total 268 2,922 703 131 505 141 44 249 248 120 390 133 928 6,782
LAN 10650 MV Reg Stats - 2006.in42 42LAN 10650 MV Reg Stats - 2006.in42 42 28/02/2008 3:54:31 p.m.28/02/2008 3:54:31 p.m.
43
Source: Land Transport New ZealandMotorcycles and mopeds – Table 25
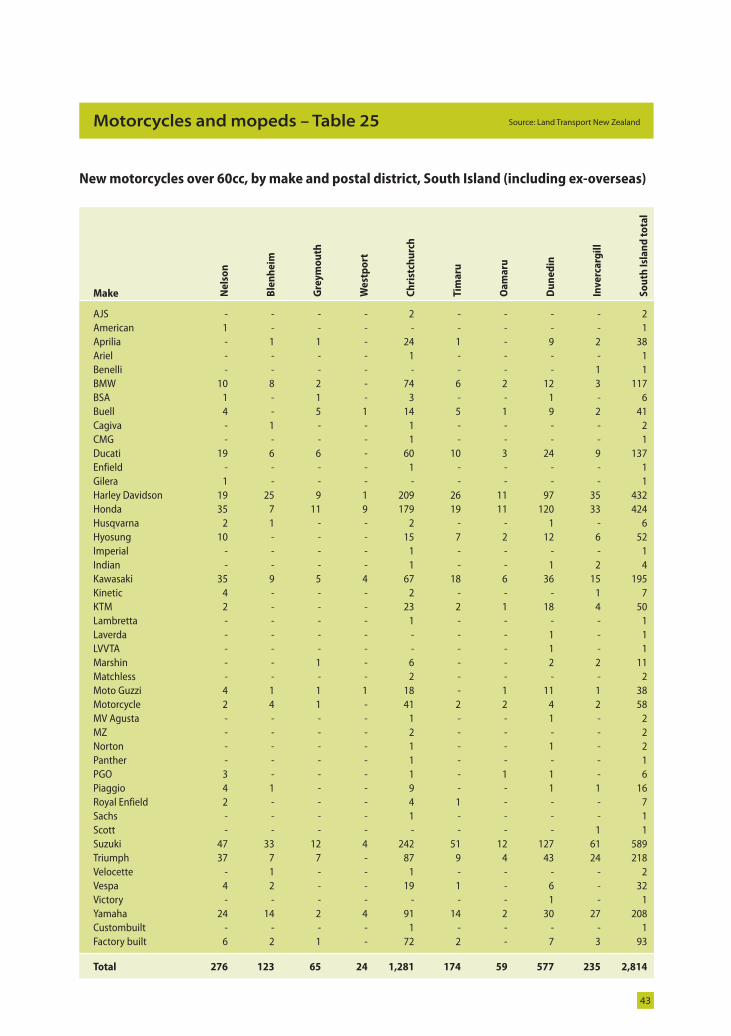
New motorcycles over 60cc, by make and postal district, South Island (including ex-overseas)
Make Ne
lso
n
Ble
nh
eim
Gre
ym
ou
th
We
stp
ort
Ch
rist
chu
rch
Tim
aru
Oa
ma
ru
Du
ne
din
Inv
erc
arg
ill
So
uth
Isl
an
d t
ota
l
AJS - - - - 2 - - - - 2American 1 - - - - - - - - 1Aprilia - 1 1 - 24 1 - 9 2 38Ariel - - - - 1 - - - - 1Benelli - - - - - - - - 1 1BMW 10 8 2 - 74 6 2 12 3 117BSA 1 - 1 - 3 - - 1 - 6Buell 4 - 5 1 14 5 1 9 2 41Cagiva - 1 - - 1 - - - - 2CMG - - - - 1 - - - - 1Ducati 19 6 6 - 60 10 3 24 9 137Enfield - - - - 1 - - - - 1Gilera 1 - - - - - - - - 1Harley Davidson 19 25 9 1 209 26 11 97 35 432Honda 35 7 11 9 179 19 11 120 33 424Husqvarna 2 1 - - 2 - - 1 - 6Hyosung 10 - - - 15 7 2 12 6 52Imperial - - - - 1 - - - - 1Indian - - - - 1 - - 1 2 4Kawasaki 35 9 5 4 67 18 6 36 15 195Kinetic 4 - - - 2 - - - 1 7KTM 2 - - - 23 2 1 18 4 50Lambretta - - - - 1 - - - - 1Laverda - - - - - - - 1 - 1LVVTA - - - - - - - 1 - 1Marshin - - 1 - 6 - - 2 2 11Matchless - - - - 2 - - - - 2Moto Guzzi 4 1 1 1 18 - 1 11 1 38Motorcycle 2 4 1 - 41 2 2 4 2 58MV Agusta - - - - 1 - - 1 - 2MZ - - - - 2 - - - - 2Norton - - - - 1 - - 1 - 2Panther - - - - 1 - - - - 1PGO 3 - - - 1 - 1 1 - 6Piaggio 4 1 - - 9 - - 1 1 16Royal Enfield 2 - - - 4 1 - - - 7Sachs - - - - 1 - - - - 1Scott - - - - - - - - 1 1Suzuki 47 33 12 4 242 51 12 127 61 589Triumph 37 7 7 - 87 9 4 43 24 218Velocette - 1 - - 1 - - - - 2Vespa 4 2 - - 19 1 - 6 - 32Victory - - - - - - - 1 - 1Yamaha 24 14 2 4 91 14 2 30 27 208Custombuilt - - - - 1 - - - - 1Factory built 6 2 1 - 72 2 - 7 3 93
Total 276 123 65 24 1,281 174 59 577 235 2,814
LAN 10650 MV Reg Stats - 2006.in43 43LAN 10650 MV Reg Stats - 2006.in43 43 28/02/2008 3:54:32 p.m.28/02/2008 3:54:32 p.m.
44
Source: Land Transport New ZealandMotorcycles and mopeds – Table 26
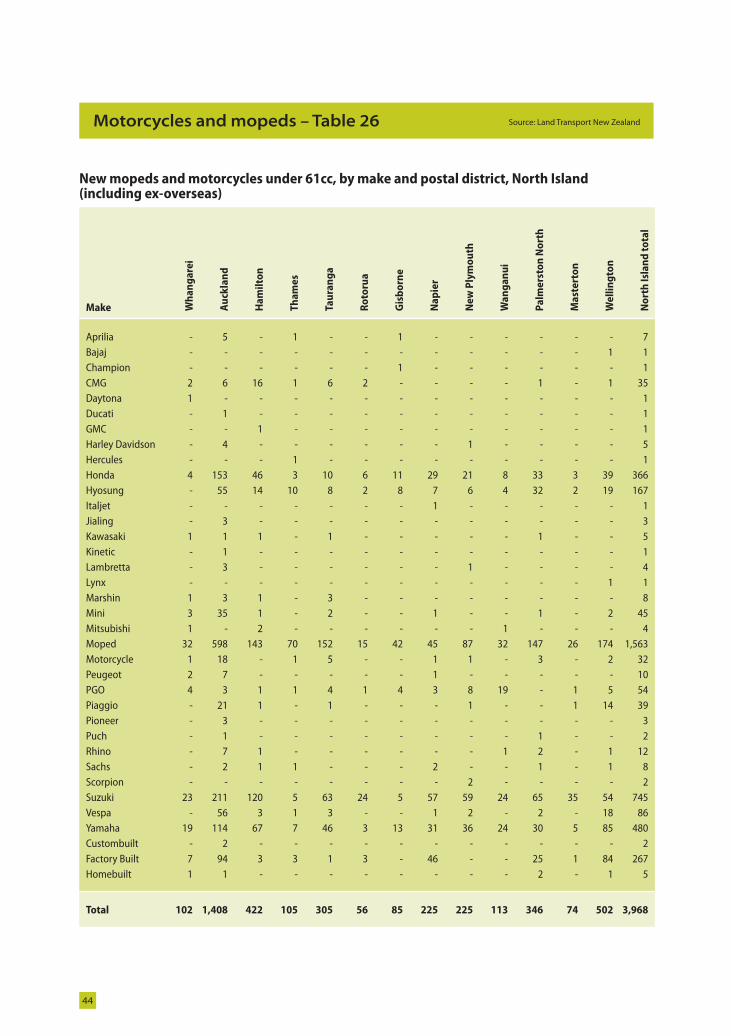
New mopeds and motorcycles under 61cc, by make and postal district, North Island (including ex-overseas)
Make Wh
an
ga
rei
Au
ckla
nd
Ha
mil
ton
Th
am
es
Tau
ran
ga
Ro
toru
a
Gis
bo
rne
Na
pie
r
Ne
w P
lym
ou
th
Wa
ng
an
ui
Pa
lme
rsto
n N
ort
h
Ma
ste
rto
n
We
llin
gto
n
No
rth
Isl
an
d t
ota
l
Aprilia - 5 - 1 - - 1 - - - - - - 7Bajaj - - - - - - - - - - - - 1 1Champion - - - - - - 1 - - - - - - 1CMG 2 6 16 1 6 2 - - - - 1 - 1 35Daytona 1 - - - - - - - - - - - - 1Ducati - 1 - - - - - - - - - - - 1GMC - - 1 - - - - - - - - - - 1Harley Davidson - 4 - - - - - - 1 - - - - 5Hercules - - - 1 - - - - - - - - - 1Honda 4 153 46 3 10 6 11 29 21 8 33 3 39 366Hyosung - 55 14 10 8 2 8 7 6 4 32 2 19 167Italjet - - - - - - - 1 - - - - - 1Jialing - 3 - - - - - - - - - - - 3Kawasaki 1 1 1 - 1 - - - - - 1 - - 5Kinetic - 1 - - - - - - - - - - - 1Lambretta - 3 - - - - - - 1 - - - - 4Lynx - - - - - - - - - - - - 1 1Marshin 1 3 1 - 3 - - - - - - - - 8Mini 3 35 1 - 2 - - 1 - - 1 - 2 45Mitsubishi 1 - 2 - - - - - - 1 - - - 4Moped 32 598 143 70 152 15 42 45 87 32 147 26 174 1,563Motorcycle 1 18 - 1 5 - - 1 1 - 3 - 2 32Peugeot 2 7 - - - - - 1 - - - - - 10PGO 4 3 1 1 4 1 4 3 8 19 - 1 5 54Piaggio - 21 1 - 1 - - - 1 - - 1 14 39Pioneer - 3 - - - - - - - - - - - 3Puch - 1 - - - - - - - - 1 - - 2Rhino - 7 1 - - - - - - 1 2 - 1 12Sachs - 2 1 1 - - - 2 - - 1 - 1 8Scorpion - - - - - - - - 2 - - - - 2Suzuki 23 211 120 5 63 24 5 57 59 24 65 35 54 745Vespa - 56 3 1 3 - - 1 2 - 2 - 18 86Yamaha 19 114 67 7 46 3 13 31 36 24 30 5 85 480Custombuilt - 2 - - - - - - - - - - - 2Factory Built 7 94 3 3 1 3 - 46 - - 25 1 84 267Homebuilt 1 1 - - - - - - - - 2 - 1 5
Total 102 1,408 422 105 305 56 85 225 225 113 346 74 502 3,968
LAN 10650 MV Reg Stats - 2006.in44 44LAN 10650 MV Reg Stats - 2006.in44 44 28/02/2008 3:54:32 p.m.28/02/2008 3:54:32 p.m.
45
Source: Land Transport New ZealandMotorcycles and mopeds – Table 27
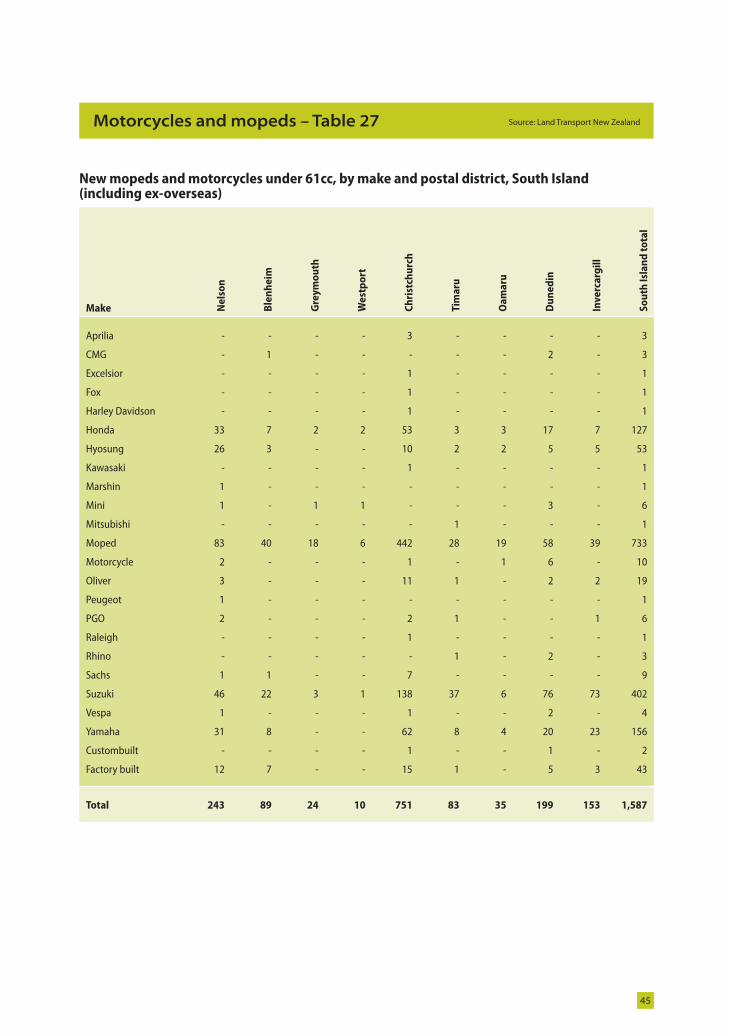
New mopeds and motorcycles under 61cc, by make and postal district, South Island (including ex-overseas)
Make Ne
lso
n
Ble
nh
eim
Gre
ym
ou
th
We
stp
ort
Ch
rist
chu
rch
Tim
aru
Oa
ma
ru
Du
ne
din
Inv
erc
arg
ill
So
uth
Isl
an
d t
ota
l
Aprilia - - - - 3 - - - - 3
CMG - 1 - - - - - 2 - 3
Excelsior - - - - 1 - - - - 1
Fox - - - - 1 - - - - 1
Harley Davidson - - - - 1 - - - - 1
Honda 33 7 2 2 53 3 3 17 7 127
Hyosung 26 3 - - 10 2 2 5 5 53
Kawasaki - - - - 1 - - - - 1
Marshin 1 - - - - - - - - 1
Mini 1 - 1 1 - - - 3 - 6
Mitsubishi - - - - - 1 - - - 1
Moped 83 40 18 6 442 28 19 58 39 733
Motorcycle 2 - - - 1 - 1 6 - 10
Oliver 3 - - - 11 1 - 2 2 19
Peugeot 1 - - - - - - - - 1
PGO 2 - - - 2 1 - - 1 6
Raleigh - - - - 1 - - - - 1
Rhino - - - - - 1 - 2 - 3
Sachs 1 1 - - 7 - - - - 9
Suzuki 46 22 3 1 138 37 6 76 73 402
Vespa 1 - - - 1 - - 2 - 4
Yamaha 31 8 - - 62 8 4 20 23 156
Custombuilt - - - - 1 - - 1 - 2
Factory built 12 7 - - 15 1 - 5 3 43
Total 243 89 24 10 751 83 35 199 153 1,587
LAN 10650 MV Reg Stats - 2006.in45 45LAN 10650 MV Reg Stats - 2006.in45 45 28/02/2008 3:54:33 p.m.28/02/2008 3:54:33 p.m.
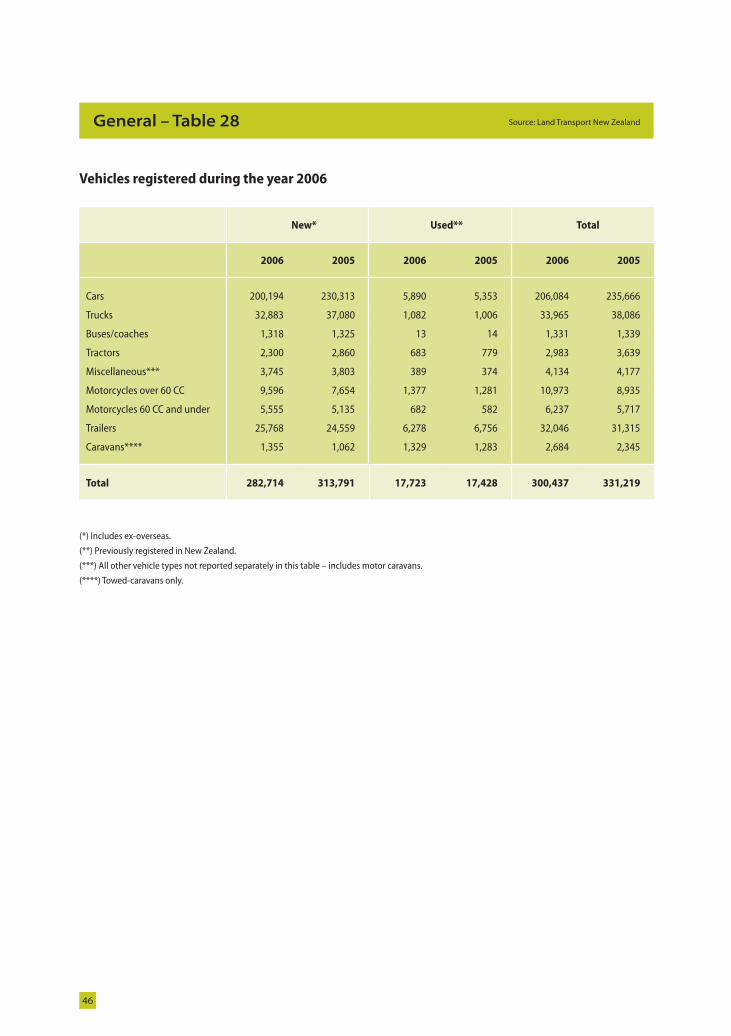
46
Source: Land Transport New ZealandGeneral – Table 28
Vehicles registered during the year 2006
New* Used** Total
2006 2005 2006 2005 2006 2005
Cars 200,194 230,313 5,890 5,353 206,084 235,666
Trucks 32,883 37,080 1,082 1,006 33,965 38,086
Buses/coaches 1,318 1,325 13 14 1,331 1,339
Tractors 2,300 2,860 683 779 2,983 3,639
Miscellaneous*** 3,745 3,803 389 374 4,134 4,177
Motorcycles over 60 CC 9,596 7,654 1,377 1,281 10,973 8,935
Motorcycles 60 CC and under 5,555 5,135 682 582 6,237 5,717
Trailers 25,768 24,559 6,278 6,756 32,046 31,315
Caravans**** 1,355 1,062 1,329 1,283 2,684 2,345
Total 282,714 313,791 17,723 17,428 300,437 331,219
(*) Includes ex-overseas.
(**) Previously registered in New Zealand.
(***) All other vehicle types not reported separately in this table – includes motor caravans.
(****) Towed-caravans only.
LAN 10650 MV Reg Stats - 2006.in46 46LAN 10650 MV Reg Stats - 2006.in46 46 28/02/2008 3:54:33 p.m.28/02/2008 3:54:33 p.m.
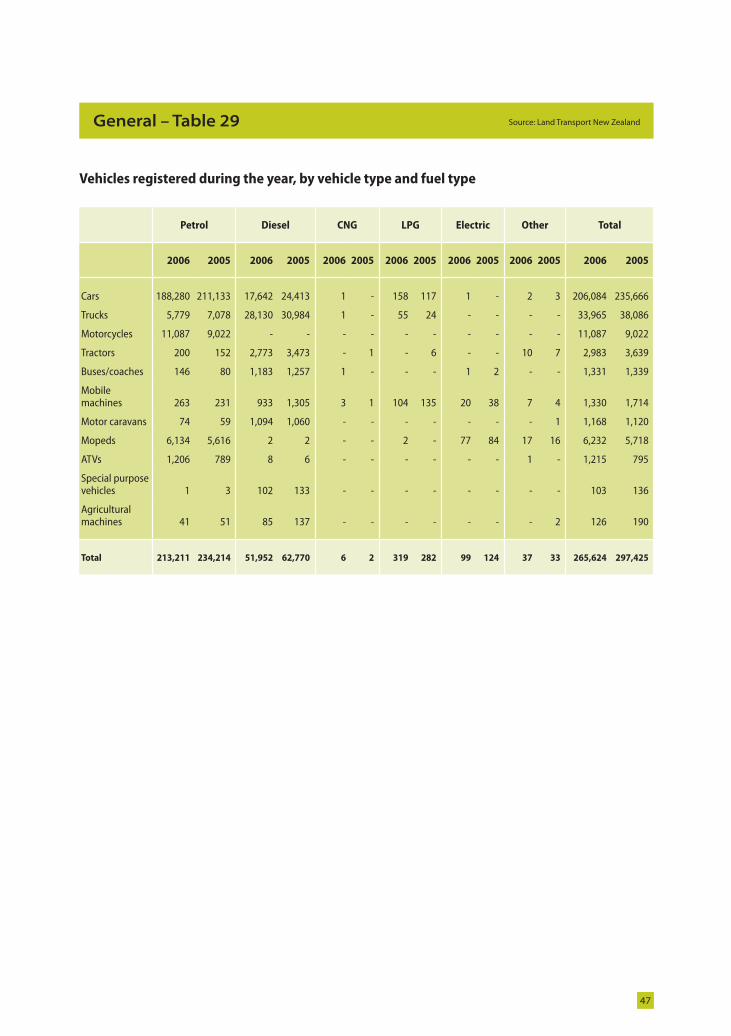
47
Source: Land Transport New ZealandGeneral – Table 29
Vehicles registered during the year, by vehicle type and fuel type
Petrol Diesel CNG LPG Electric Other Total
2006 2005 2006 2005 2006 2005 2006 2005 2006 2005 2006 2005 2006 2005
Cars 188,280 211,133 17,642 24,413 1 - 158 117 1 - 2 3 206,084 235,666
Trucks 5,779 7,078 28,130 30,984 1 - 55 24 - - - - 33,965 38,086
Motorcycles 11,087 9,022 - - - - - - - - - - 11,087 9,022
Tractors 200 152 2,773 3,473 - 1 - 6 - - 10 7 2,983 3,639
Buses/coaches 146 80 1,183 1,257 1 - - - 1 2 - - 1,331 1,339
Mobile machines 263 231 933 1,305 3 1 104 135 20 38 7 4 1,330 1,714
Motor caravans 74 59 1,094 1,060 - - - - - - - 1 1,168 1,120
Mopeds 6,134 5,616 2 2 - - 2 - 77 84 17 16 6,232 5,718
ATVs 1,206 789 8 6 - - - - - - 1 - 1,215 795
Special purpose vehicles 1 3 102 133 - - - - - - - - 103 136
Agricultural machines 41 51 85 137 - - - - - - - 2 126 190
Total 213,211 234,214 51,952 62,770 6 2 319 282 99 124 37 33 265,624 297,425
LAN 10650 MV Reg Stats - 2006.in47 47LAN 10650 MV Reg Stats - 2006.in47 47 28/02/2008 3:54:33 p.m.28/02/2008 3:54:33 p.m.
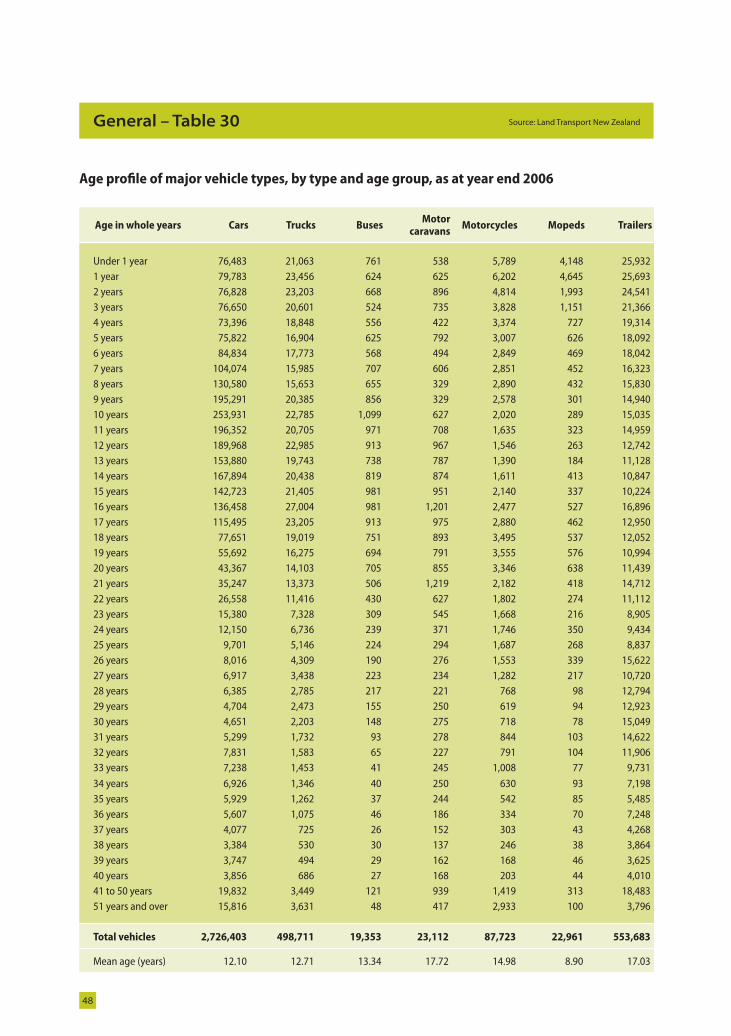
48
Source: Land Transport New ZealandGeneral – Table 30
Age profi le of major vehicle types, by type and age group, as at year end 2006
Age in whole years Cars Trucks BusesMotor
caravansMotorcycles Mopeds Trailers
Under 1 year 76,483 21,063 761 538 5,789 4,148 25,9321 year 79,783 23,456 624 625 6,202 4,645 25,6932 years 76,828 23,203 668 896 4,814 1,993 24,5413 years 76,650 20,601 524 735 3,828 1,151 21,3664 years 73,396 18,848 556 422 3,374 727 19,3145 years 75,822 16,904 625 792 3,007 626 18,0926 years 84,834 17,773 568 494 2,849 469 18,0427 years 104,074 15,985 707 606 2,851 452 16,3238 years 130,580 15,653 655 329 2,890 432 15,8309 years 195,291 20,385 856 329 2,578 301 14,94010 years 253,931 22,785 1,099 627 2,020 289 15,03511 years 196,352 20,705 971 708 1,635 323 14,95912 years 189,968 22,985 913 967 1,546 263 12,74213 years 153,880 19,743 738 787 1,390 184 11,12814 years 167,894 20,438 819 874 1,611 413 10,84715 years 142,723 21,405 981 951 2,140 337 10,22416 years 136,458 27,004 981 1,201 2,477 527 16,89617 years 115,495 23,205 913 975 2,880 462 12,95018 years 77,651 19,019 751 893 3,495 537 12,05219 years 55,692 16,275 694 791 3,555 576 10,99420 years 43,367 14,103 705 855 3,346 638 11,43921 years 35,247 13,373 506 1,219 2,182 418 14,71222 years 26,558 11,416 430 627 1,802 274 11,11223 years 15,380 7,328 309 545 1,668 216 8,90524 years 12,150 6,736 239 371 1,746 350 9,43425 years 9,701 5,146 224 294 1,687 268 8,83726 years 8,016 4,309 190 276 1,553 339 15,62227 years 6,917 3,438 223 234 1,282 217 10,72028 years 6,385 2,785 217 221 768 98 12,79429 years 4,704 2,473 155 250 619 94 12,92330 years 4,651 2,203 148 275 718 78 15,04931 years 5,299 1,732 93 278 844 103 14,62232 years 7,831 1,583 65 227 791 104 11,90633 years 7,238 1,453 41 245 1,008 77 9,731
34 years 6,926 1,346 40 250 630 93 7,19835 years 5,929 1,262 37 244 542 85 5,48536 years 5,607 1,075 46 186 334 70 7,24837 years 4,077 725 26 152 303 43 4,26838 years 3,384 530 30 137 246 38 3,86439 years 3,747 494 29 162 168 46 3,62540 years 3,856 686 27 168 203 44 4,01041 to 50 years 19,832 3,449 121 939 1,419 313 18,48351 years and over 15,816 3,631 48 417 2,933 100 3,796
Total vehicles 2,726,403 498,711 19,353 23,112 87,723 22,961 553,683
Mean age (years) 12.10 12.71 13.34 17.72 14.98 8.90 17.03
LAN 10650 MV Reg Stats - 2006.in48 48LAN 10650 MV Reg Stats - 2006.in48 48 28/02/2008 3:54:33 p.m.28/02/2008 3:54:33 p.m.
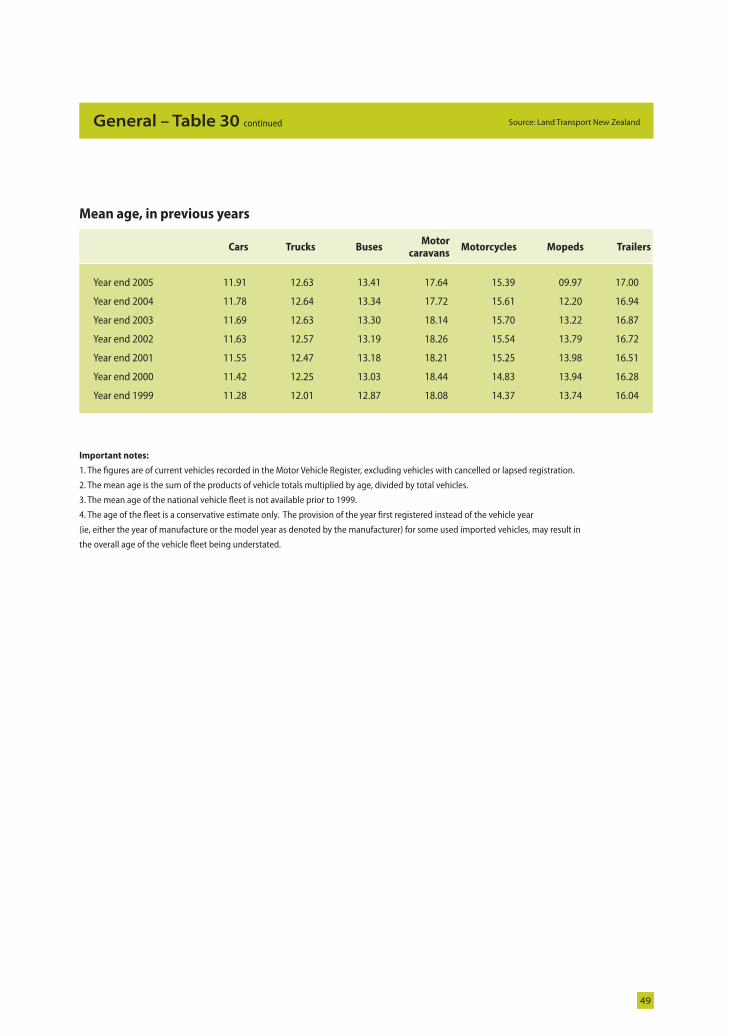
49
Source: Land Transport New ZealandGeneral – Table 30 continued
Mean age, in previous years
Cars Trucks BusesMotor
caravansMotorcycles Mopeds Trailers
Year end 2005 11.91 12.63 13.41 17.64 15.39 09.97 17.00
Year end 2004 11.78 12.64 13.34 17.72 15.61 12.20 16.94
Year end 2003 11.69 12.63 13.30 18.14 15.70 13.22 16.87
Year end 2002 11.63 12.57 13.19 18.26 15.54 13.79 16.72
Year end 2001 11.55 12.47 13.18 18.21 15.25 13.98 16.51
Year end 2000 11.42 12.25 13.03 18.44 14.83 13.94 16.28
Year end 1999 11.28 12.01 12.87 18.08 14.37 13.74 16.04
Important notes:
1. The fi gures are of current vehicles recorded in the Motor Vehicle Register, excluding vehicles with cancelled or lapsed registration.
2. The mean age is the sum of the products of vehicle totals multiplied by age, divided by total vehicles.
3. The mean age of the national vehicle fl eet is not available prior to 1999.
4. The age of the fl eet is a conservative estimate only. The provision of the year fi rst registered instead of the vehicle year
(ie, either the year of manufacture or the model year as denoted by the manufacturer) for some used imported vehicles, may result in
the overall age of the vehicle fl eet being understated.
LAN 10650 MV Reg Stats - 2006.in49 49LAN 10650 MV Reg Stats - 2006.in49 49 28/02/2008 3:54:34 p.m.28/02/2008 3:54:34 p.m.
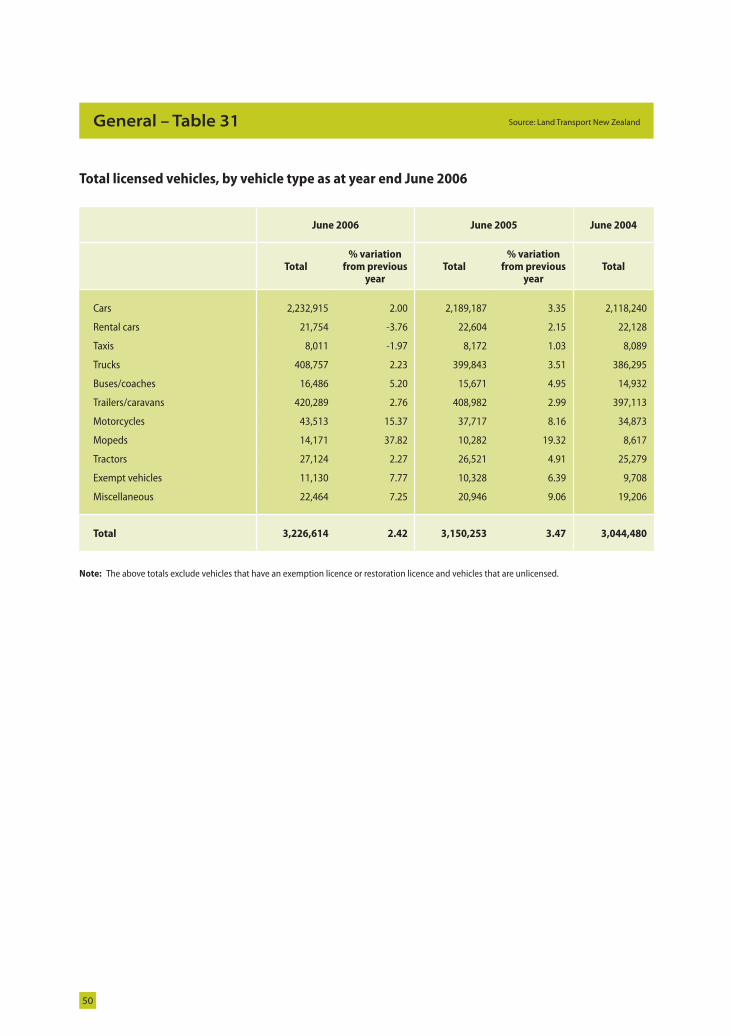
50
Source: Land Transport New ZealandGeneral – Table 31
Total licensed vehicles, by vehicle type as at year end June 2006
June 2006 June 2005 June 2004
Total% variation
from previous year
Total% variation
from previous year
Total
Cars 2,232,915 2.00 2,189,187 3.35 2,118,240
Rental cars 21,754 -3.76 22,604 2.15 22,128
Taxis 8,011 -1.97 8,172 1.03 8,089
Trucks 408,757 2.23 399,843 3.51 386,295
Buses/coaches 16,486 5.20 15,671 4.95 14,932
Trailers/caravans 420,289 2.76 408,982 2.99 397,113
Motorcycles 43,513 15.37 37,717 8.16 34,873
Mopeds 14,171 37.82 10,282 19.32 8,617
Tractors 27,124 2.27 26,521 4.91 25,279
Exempt vehicles 11,130 7.77 10,328 6.39 9,708
Miscellaneous 22,464 7.25 20,946 9.06 19,206
Total 3,226,614 2.42 3,150,253 3.47 3,044,480
Note: The above totals exclude vehicles that have an exemption licence or restoration licence and vehicles that are unlicensed.
LAN 10650 MV Reg Stats - 2006.in50 50LAN 10650 MV Reg Stats - 2006.in50 50 28/02/2008 3:54:34 p.m.28/02/2008 3:54:34 p.m.
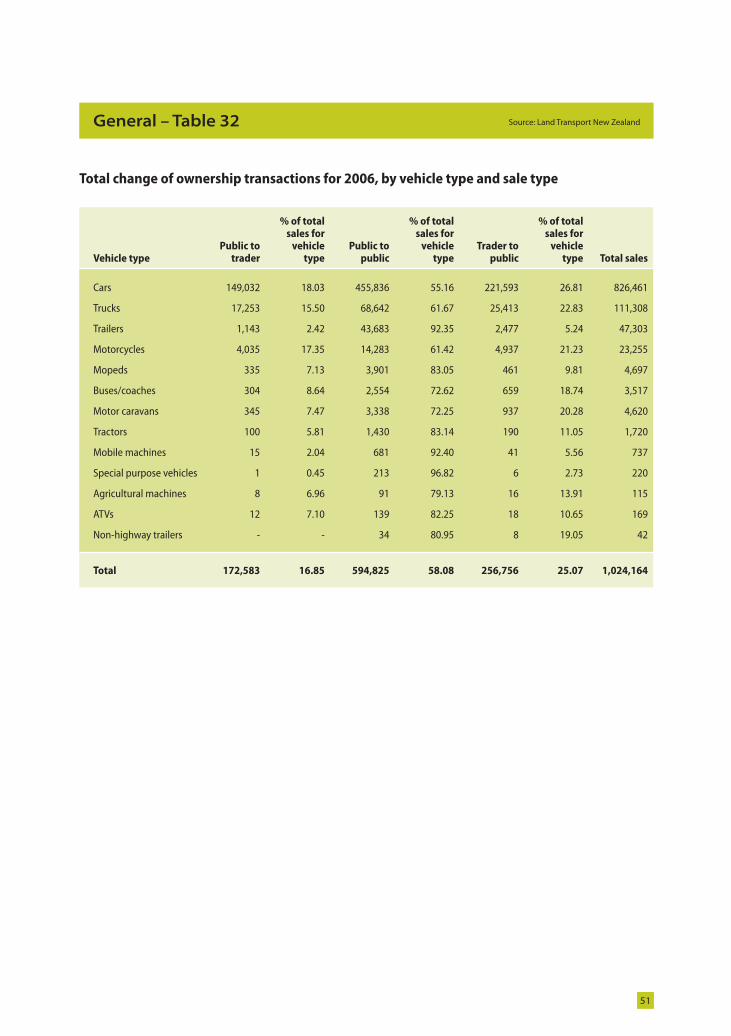
51
Source: Land Transport New ZealandGeneral – Table 32
Total change of ownership transactions for 2006, by vehicle type and sale type
Vehicle typePublic to
trader
% of total sales for
vehicle type
Public to public
% of total sales for
vehicle type
Trader to public
% of total sales for
vehicle type Total sales
Cars 149,032 18.03 455,836 55.16 221,593 26.81 826,461
Trucks 17,253 15.50 68,642 61.67 25,413 22.83 111,308
Trailers 1,143 2.42 43,683 92.35 2,477 5.24 47,303
Motorcycles 4,035 17.35 14,283 61.42 4,937 21.23 23,255
Mopeds 335 7.13 3,901 83.05 461 9.81 4,697
Buses/coaches 304 8.64 2,554 72.62 659 18.74 3,517
Motor caravans 345 7.47 3,338 72.25 937 20.28 4,620
Tractors 100 5.81 1,430 83.14 190 11.05 1,720
Mobile machines 15 2.04 681 92.40 41 5.56 737
Special purpose vehicles 1 0.45 213 96.82 6 2.73 220
Agricultural machines 8 6.96 91 79.13 16 13.91 115
ATVs 12 7.10 139 82.25 18 10.65 169
Non-highway trailers - - 34 80.95 8 19.05 42
Total 172,583 16.85 594,825 58.08 256,756 25.07 1,024,164
LAN 10650 MV Reg Stats - 2006.in51 51LAN 10650 MV Reg Stats - 2006.in51 51 28/02/2008 3:54:34 p.m.28/02/2008 3:54:34 p.m.
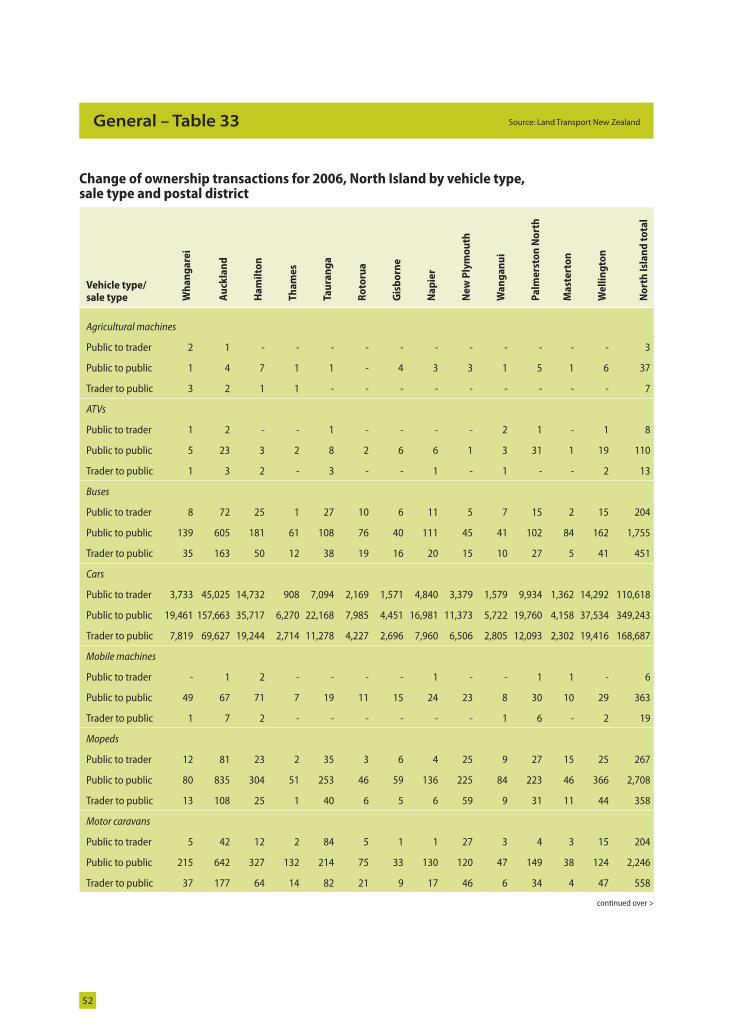
52
Source: Land Transport New ZealandGeneral – Table 33
Change of ownership transactions for 2006, North Island by vehicle type, sale type and postal district
Vehicle type/ sale type W
ha
ng
are
i
Au
ckla
nd
Ha
mil
ton
Th
am
es
Tau
ran
ga
Ro
toru
a
Gis
bo
rne
Na
pie
r
Ne
w P
lym
ou
th
Wa
ng
an
ui
Pa
lme
rsto
n N
ort
h
Ma
ste
rto
n
We
llin
gto
n
No
rth
Isl
an
d t
ota
l
Agricultural machines
Public to trader 2 1 - - - - - - - - - - - 3
Public to public 1 4 7 1 1 - 4 3 3 1 5 1 6 37
Trader to public 3 2 1 1 - - - - - - - - - 7
ATVs
Public to trader 1 2 - - 1 - - - - 2 1 - 1 8
Public to public 5 23 3 2 8 2 6 6 1 3 31 1 19 110
Trader to public 1 3 2 - 3 - - 1 - 1 - - 2 13
Buses
Public to trader 8 72 25 1 27 10 6 11 5 7 15 2 15 204
Public to public 139 605 181 61 108 76 40 111 45 41 102 84 162 1,755
Trader to public 35 163 50 12 38 19 16 20 15 10 27 5 41 451
Cars
Public to trader 3,733 45,025 14,732 908 7,094 2,169 1,571 4,840 3,379 1,579 9,934 1,362 14,292 110,618
Public to public 19,461 157,663 35,717 6,270 22,168 7,985 4,451 16,981 11,373 5,722 19,760 4,158 37,534 349,243
Trader to public 7,819 69,627 19,244 2,714 11,278 4,227 2,696 7,960 6,506 2,805 12,093 2,302 19,416 168,687
Mobile machines
Public to trader - 1 2 - - - - 1 - - 1 1 - 6
Public to public 49 67 71 7 19 11 15 24 23 8 30 10 29 363
Trader to public 1 7 2 - - - - - - 1 6 - 2 19
Mopeds
Public to trader 12 81 23 2 35 3 6 4 25 9 27 15 25 267
Public to public 80 835 304 51 253 46 59 136 225 84 223 46 366 2,708
Trader to public 13 108 25 1 40 6 5 6 59 9 31 11 44 358
Motor caravans
Public to trader 5 42 12 2 84 5 1 1 27 3 4 3 15 204
Public to public 215 642 327 132 214 75 33 130 120 47 149 38 124 2,246
Trader to public 37 177 64 14 82 21 9 17 46 6 34 4 47 558
continued over >
LAN 10650 MV Reg Stats - 2006.in52 52LAN 10650 MV Reg Stats - 2006.in52 52 28/02/2008 3:54:34 p.m.28/02/2008 3:54:34 p.m.
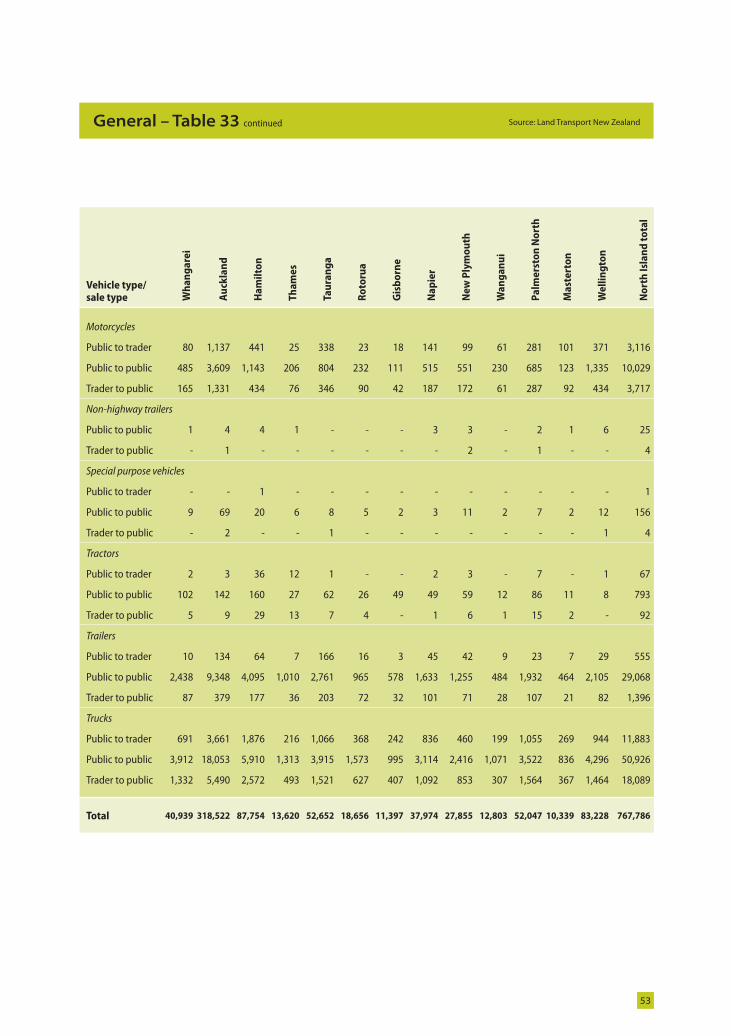
53
Source: Land Transport New ZealandGeneral – Table 33 continued
Vehicle type/ sale type W
ha
ng
are
i
Au
ckla
nd
Ha
mil
ton
Th
am
es
Tau
ran
ga
Ro
toru
a
Gis
bo
rne
Na
pie
r
Ne
w P
lym
ou
th
Wa
ng
an
ui
Pa
lme
rsto
n N
ort
h
Ma
ste
rto
n
We
llin
gto
n
No
rth
Isl
an
d t
ota
l
Motorcycles
Public to trader 80 1,137 441 25 338 23 18 141 99 61 281 101 371 3,116
Public to public 485 3,609 1,143 206 804 232 111 515 551 230 685 123 1,335 10,029
Trader to public 165 1,331 434 76 346 90 42 187 172 61 287 92 434 3,717
Non-highway trailers
Public to public 1 4 4 1 - - - 3 3 - 2 1 6 25
Trader to public - 1 - - - - - - 2 - 1 - - 4
Special purpose vehicles
Public to trader - - 1 - - - - - - - - - - 1
Public to public 9 69 20 6 8 5 2 3 11 2 7 2 12 156
Trader to public - 2 - - 1 - - - - - - - 1 4
Tractors
Public to trader 2 3 36 12 1 - - 2 3 - 7 - 1 67
Public to public 102 142 160 27 62 26 49 49 59 12 86 11 8 793
Trader to public 5 9 29 13 7 4 - 1 6 1 15 2 - 92
Trailers
Public to trader 10 134 64 7 166 16 3 45 42 9 23 7 29 555
Public to public 2,438 9,348 4,095 1,010 2,761 965 578 1,633 1,255 484 1,932 464 2,105 29,068
Trader to public 87 379 177 36 203 72 32 101 71 28 107 21 82 1,396
Trucks
Public to trader 691 3,661 1,876 216 1,066 368 242 836 460 199 1,055 269 944 11,883
Public to public 3,912 18,053 5,910 1,313 3,915 1,573 995 3,114 2,416 1,071 3,522 836 4,296 50,926
Trader to public 1,332 5,490 2,572 493 1,521 627 407 1,092 853 307 1,564 367 1,464 18,089
Total 40,939 318,522 87,754 13,620 52,652 18,656 11,397 37,974 27,855 12,803 52,047 10,339 83,228 767,786
LAN 10650 MV Reg Stats - 2006.in53 53LAN 10650 MV Reg Stats - 2006.in53 53 28/02/2008 3:54:35 p.m.28/02/2008 3:54:35 p.m.
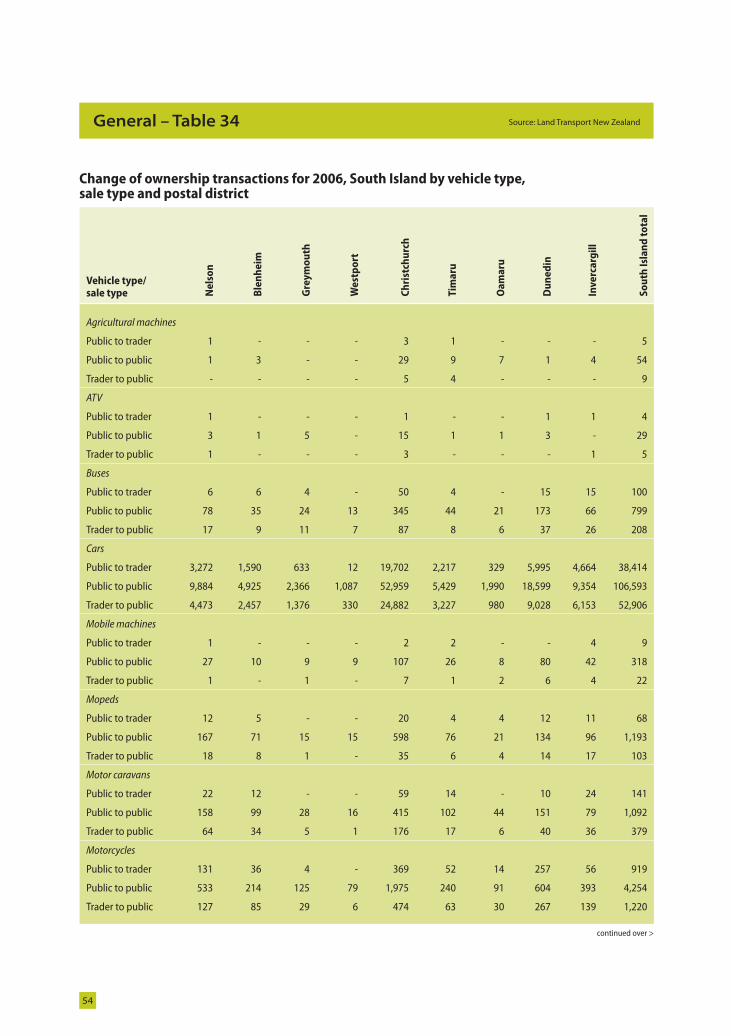
54
Source: Land Transport New ZealandGeneral – Table 34
Change of ownership transactions for 2006, South Island by vehicle type, sale type and postal district
Vehicle type/ sale type N
els
on
Ble
nh
eim
Gre
ym
ou
th
We
stp
ort
Ch
rist
chu
rch
Tim
aru
Oa
ma
ru
Du
ne
din
Inv
erc
arg
ill
So
uth
Isl
an
d t
ota
l
Agricultural machines
Public to trader 1 - - - 3 1 - - - 5
Public to public 1 3 - - 29 9 7 1 4 54
Trader to public - - - - 5 4 - - - 9
ATV
Public to trader 1 - - - 1 - - 1 1 4
Public to public 3 1 5 - 15 1 1 3 - 29
Trader to public 1 - - - 3 - - - 1 5
Buses
Public to trader 6 6 4 - 50 4 - 15 15 100
Public to public 78 35 24 13 345 44 21 173 66 799
Trader to public 17 9 11 7 87 8 6 37 26 208
Cars
Public to trader 3,272 1,590 633 12 19,702 2,217 329 5,995 4,664 38,414
Public to public 9,884 4,925 2,366 1,087 52,959 5,429 1,990 18,599 9,354 106,593
Trader to public 4,473 2,457 1,376 330 24,882 3,227 980 9,028 6,153 52,906
Mobile machines
Public to trader 1 - - - 2 2 - - 4 9
Public to public 27 10 9 9 107 26 8 80 42 318
Trader to public 1 - 1 - 7 1 2 6 4 22
Mopeds
Public to trader 12 5 - - 20 4 4 12 11 68
Public to public 167 71 15 15 598 76 21 134 96 1,193
Trader to public 18 8 1 - 35 6 4 14 17 103
Motor caravans
Public to trader 22 12 - - 59 14 - 10 24 141
Public to public 158 99 28 16 415 102 44 151 79 1,092
Trader to public 64 34 5 1 176 17 6 40 36 379
Motorcycles
Public to trader 131 36 4 - 369 52 14 257 56 919
Public to public 533 214 125 79 1,975 240 91 604 393 4,254
Trader to public 127 85 29 6 474 63 30 267 139 1,220
continued over >
LAN 10650 MV Reg Stats - 2006.in54 54LAN 10650 MV Reg Stats - 2006.in54 54 28/02/2008 3:54:35 p.m.28/02/2008 3:54:35 p.m.
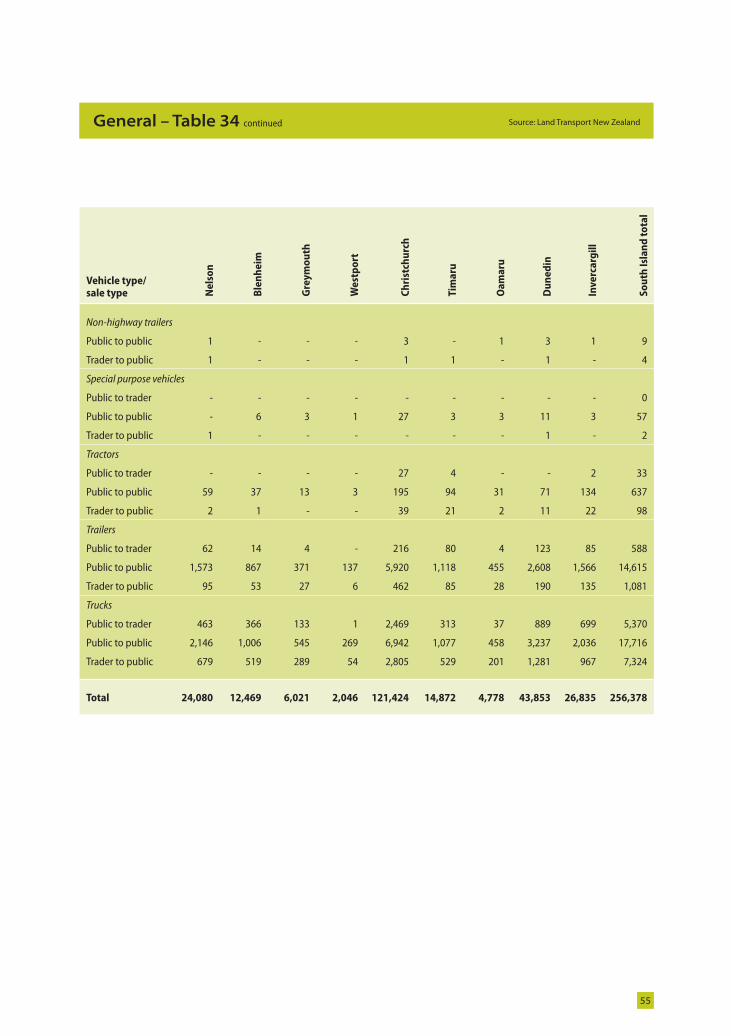
55
Source: Land Transport New ZealandGeneral – Table 34 continued
Vehicle type/ sale type N
els
on
Ble
nh
eim
Gre
ym
ou
th
We
stp
ort
Ch
rist
chu
rch
Tim
aru
Oa
ma
ru
Du
ne
din
Inv
erc
arg
ill
So
uth
Isl
an
d t
ota
l
Non-highway trailers
Public to public 1 - - - 3 - 1 3 1 9
Trader to public 1 - - - 1 1 - 1 - 4
Special purpose vehicles
Public to trader - - - - - - - - - 0
Public to public - 6 3 1 27 3 3 11 3 57
Trader to public 1 - - - - - - 1 - 2
Tractors
Public to trader - - - - 27 4 - - 2 33
Public to public 59 37 13 3 195 94 31 71 134 637
Trader to public 2 1 - - 39 21 2 11 22 98
Trailers
Public to trader 62 14 4 - 216 80 4 123 85 588
Public to public 1,573 867 371 137 5,920 1,118 455 2,608 1,566 14,615
Trader to public 95 53 27 6 462 85 28 190 135 1,081
Trucks
Public to trader 463 366 133 1 2,469 313 37 889 699 5,370
Public to public 2,146 1,006 545 269 6,942 1,077 458 3,237 2,036 17,716
Trader to public 679 519 289 54 2,805 529 201 1,281 967 7,324
Total 24,080 12,469 6,021 2,046 121,424 14,872 4,778 43,853 26,835 256,378
LAN 10650 MV Reg Stats - 2006.in55 55LAN 10650 MV Reg Stats - 2006.in55 55 28/02/2008 3:54:36 p.m.28/02/2008 3:54:36 p.m.
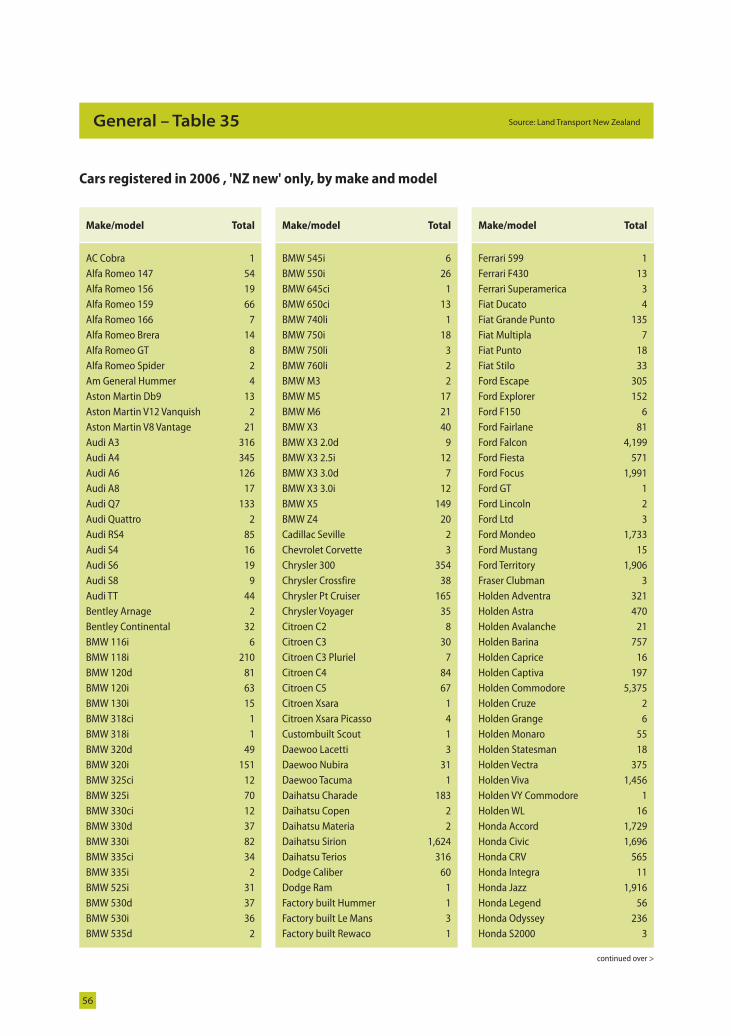
56
Source: Land Transport New ZealandGeneral – Table 35
Cars registered in 2006 , 'NZ new' only, by make and model
Make/model Total
AC Cobra 1Alfa Romeo 147 54Alfa Romeo 156 19Alfa Romeo 159 66Alfa Romeo 166 7Alfa Romeo Brera 14Alfa Romeo GT 8Alfa Romeo Spider 2Am General Hummer 4Aston Martin Db9 13Aston Martin V12 Vanquish 2Aston Martin V8 Vantage 21Audi A3 316Audi A4 345Audi A6 126Audi A8 17Audi Q7 133Audi Quattro 2Audi RS4 85Audi S4 16Audi S6 19Audi S8 9Audi TT 44Bentley Arnage 2Bentley Continental 32BMW 116i 6BMW 118i 210BMW 120d 81BMW 120i 63BMW 130i 15BMW 318ci 1BMW 318i 1BMW 320d 49BMW 320i 151BMW 325ci 12BMW 325i 70BMW 330ci 12BMW 330d 37BMW 330i 82BMW 335ci 34BMW 335i 2BMW 525i 31BMW 530d 37BMW 530i 36BMW 535d 2
Make/model Total
BMW 545i 6BMW 550i 26BMW 645ci 1BMW 650ci 13BMW 740li 1BMW 750i 18BMW 750li 3BMW 760li 2BMW M3 2BMW M5 17BMW M6 21BMW X3 40BMW X3 2.0d 9BMW X3 2.5i 12BMW X3 3.0d 7BMW X3 3.0i 12BMW X5 149BMW Z4 20Cadillac Seville 2Chevrolet Corvette 3Chrysler 300 354Chrysler Crossfire 38Chrysler Pt Cruiser 165Chrysler Voyager 35Citroen C2 8Citroen C3 30Citroen C3 Pluriel 7Citroen C4 84Citroen C5 67Citroen Xsara 1Citroen Xsara Picasso 4Custombuilt Scout 1Daewoo Lacetti 3Daewoo Nubira 31Daewoo Tacuma 1Daihatsu Charade 183Daihatsu Copen 2Daihatsu Materia 2Daihatsu Sirion 1,624Daihatsu Terios 316Dodge Caliber 60Dodge Ram 1Factory built Hummer 1Factory built Le Mans 3Factory built Rewaco 1
Make/model Total
Ferrari 599 1Ferrari F430 13Ferrari Superamerica 3Fiat Ducato 4Fiat Grande Punto 135Fiat Multipla 7Fiat Punto 18Fiat Stilo 33Ford Escape 305Ford Explorer 152Ford F150 6Ford Fairlane 81Ford Falcon 4,199Ford Fiesta 571Ford Focus 1,991Ford GT 1Ford Lincoln 2Ford Ltd 3Ford Mondeo 1,733Ford Mustang 15Ford Territory 1,906Fraser Clubman 3Holden Adventra 321Holden Astra 470Holden Avalanche 21Holden Barina 757Holden Caprice 16Holden Captiva 197Holden Commodore 5,375Holden Cruze 2Holden Grange 6Holden Monaro 55Holden Statesman 18Holden Vectra 375Holden Viva 1,456Holden VY Commodore 1Holden WL 16Honda Accord 1,729Honda Civic 1,696Honda CRV 565Honda Integra 11Honda Jazz 1,916Honda Legend 56Honda Odyssey 236Honda S2000 3
continued over >
LAN 10650 MV Reg Stats - 2006.in56 56LAN 10650 MV Reg Stats - 2006.in56 56 28/02/2008 3:54:36 p.m.28/02/2008 3:54:36 p.m.
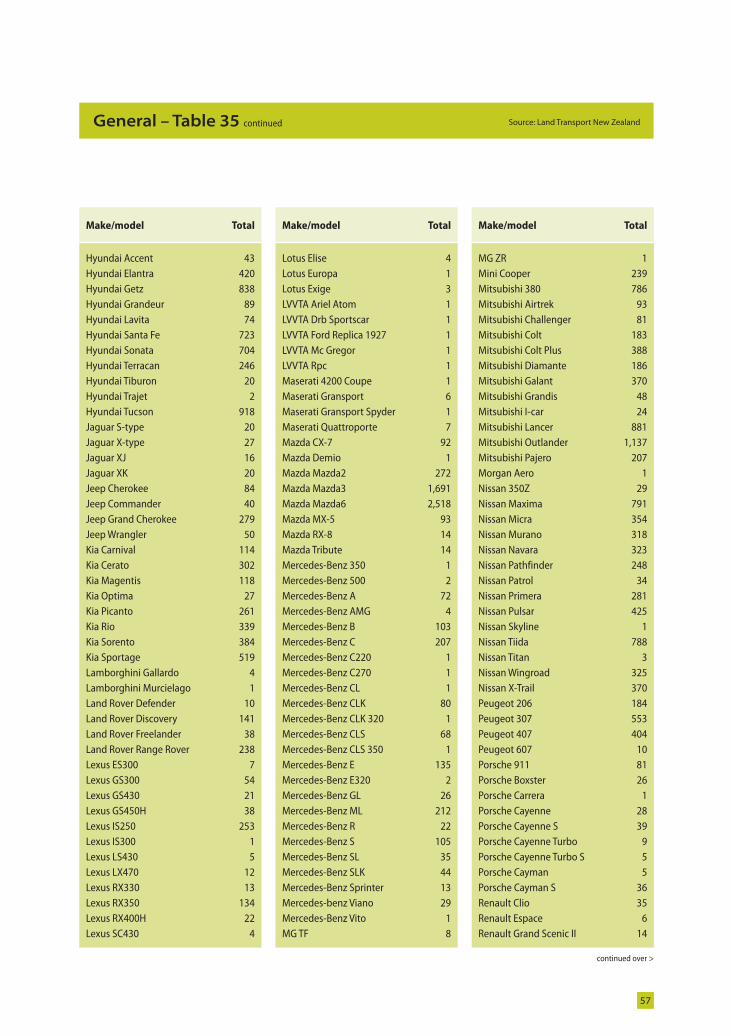
57
Source: Land Transport New ZealandGeneral – Table 35 continued
continued over >
Make/model Total
Hyundai Accent 43Hyundai Elantra 420Hyundai Getz 838Hyundai Grandeur 89Hyundai Lavita 74Hyundai Santa Fe 723Hyundai Sonata 704Hyundai Terracan 246Hyundai Tiburon 20Hyundai Trajet 2Hyundai Tucson 918Jaguar S-type 20Jaguar X-type 27Jaguar XJ 16Jaguar XK 20Jeep Cherokee 84Jeep Commander 40Jeep Grand Cherokee 279Jeep Wrangler 50Kia Carnival 114Kia Cerato 302Kia Magentis 118Kia Optima 27Kia Picanto 261Kia Rio 339Kia Sorento 384Kia Sportage 519Lamborghini Gallardo 4Lamborghini Murcielago 1Land Rover Defender 10Land Rover Discovery 141Land Rover Freelander 38Land Rover Range Rover 238Lexus ES300 7Lexus GS300 54Lexus GS430 21Lexus GS450H 38Lexus IS250 253Lexus IS300 1Lexus LS430 5Lexus LX470 12Lexus RX330 13Lexus RX350 134Lexus RX400H 22Lexus SC430 4
Make/model Total
Lotus Elise 4Lotus Europa 1Lotus Exige 3LVVTA Ariel Atom 1LVVTA Drb Sportscar 1LVVTA Ford Replica 1927 1LVVTA Mc Gregor 1LVVTA Rpc 1Maserati 4200 Coupe 1Maserati Gransport 6Maserati Gransport Spyder 1Maserati Quattroporte 7Mazda CX-7 92Mazda Demio 1Mazda Mazda2 272Mazda Mazda3 1,691Mazda Mazda6 2,518Mazda MX-5 93Mazda RX-8 14Mazda Tribute 14Mercedes-Benz 350 1Mercedes-Benz 500 2Mercedes-Benz A 72Mercedes-Benz AMG 4Mercedes-Benz B 103Mercedes-Benz C 207Mercedes-Benz C220 1Mercedes-Benz C270 1Mercedes-Benz CL 1Mercedes-Benz CLK 80Mercedes-Benz CLK 320 1Mercedes-Benz CLS 68Mercedes-Benz CLS 350 1Mercedes-Benz E 135Mercedes-Benz E320 2Mercedes-Benz GL 26Mercedes-Benz ML 212Mercedes-Benz R 22Mercedes-Benz S 105Mercedes-Benz SL 35Mercedes-Benz SLK 44Mercedes-Benz Sprinter 13Mercedes-benz Viano 29Mercedes-Benz Vito 1MG TF 8
Make/model Total
MG ZR 1Mini Cooper 239Mitsubishi 380 786Mitsubishi Airtrek 93Mitsubishi Challenger 81Mitsubishi Colt 183Mitsubishi Colt Plus 388Mitsubishi Diamante 186Mitsubishi Galant 370Mitsubishi Grandis 48Mitsubishi I-car 24Mitsubishi Lancer 881Mitsubishi Outlander 1,137Mitsubishi Pajero 207Morgan Aero 1Nissan 350Z 29Nissan Maxima 791Nissan Micra 354Nissan Murano 318Nissan Navara 323Nissan Pathfinder 248Nissan Patrol 34Nissan Primera 281Nissan Pulsar 425Nissan Skyline 1Nissan Tiida 788Nissan Titan 3Nissan Wingroad 325Nissan X-Trail 370Peugeot 206 184Peugeot 307 553Peugeot 407 404Peugeot 607 10Porsche 911 81Porsche Boxster 26Porsche Carrera 1Porsche Cayenne 28Porsche Cayenne S 39Porsche Cayenne Turbo 9Porsche Cayenne Turbo S 5Porsche Cayman 5Porsche Cayman S 36Renault Clio 35Renault Espace 6Renault Grand Scenic II 14
LAN 10650 MV Reg Stats - 2006.in57 57LAN 10650 MV Reg Stats - 2006.in57 57 28/02/2008 3:54:36 p.m.28/02/2008 3:54:36 p.m.
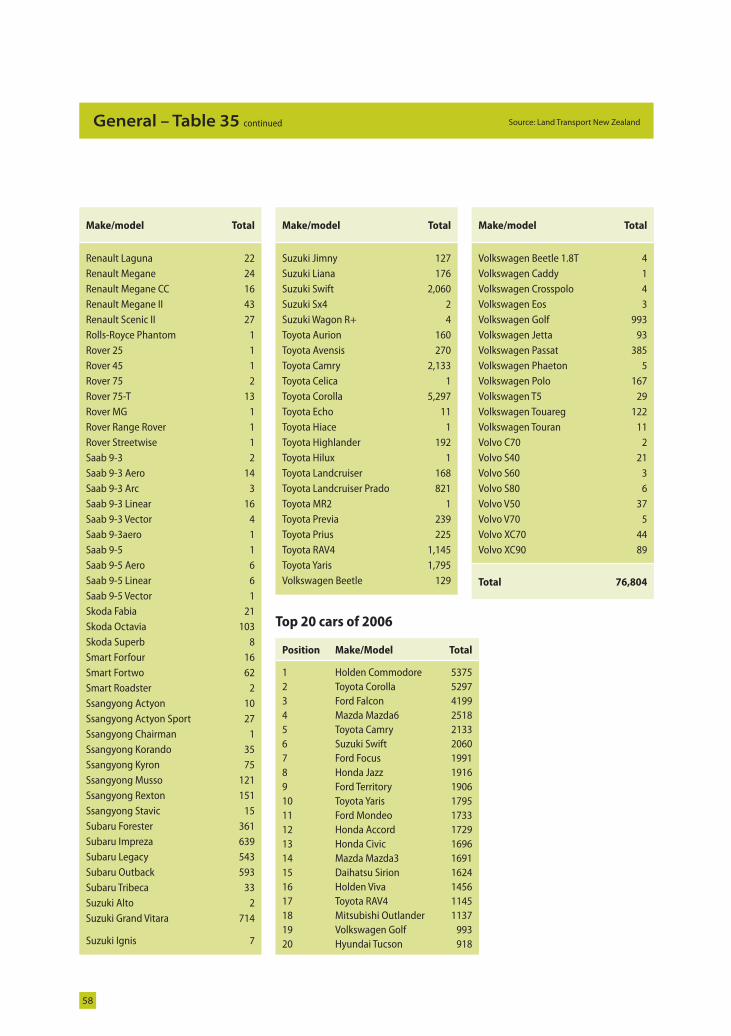
58
Source: Land Transport New ZealandGeneral – Table 35 continued
Make/model Total
Renault Laguna 22Renault Megane 24Renault Megane CC 16Renault Megane II 43Renault Scenic II 27Rolls-Royce Phantom 1Rover 25 1Rover 45 1Rover 75 2Rover 75-T 13Rover MG 1Rover Range Rover 1Rover Streetwise 1Saab 9-3 2Saab 9-3 Aero 14Saab 9-3 Arc 3Saab 9-3 Linear 16Saab 9-3 Vector 4Saab 9-3aero 1Saab 9-5 1Saab 9-5 Aero 6Saab 9-5 Linear 6Saab 9-5 Vector 1Skoda Fabia 21Skoda Octavia 103Skoda Superb 8Smart Forfour 16Smart Fortwo 62Smart Roadster 2Ssangyong Actyon 10Ssangyong Actyon Sport 27Ssangyong Chairman 1Ssangyong Korando 35Ssangyong Kyron 75Ssangyong Musso 121Ssangyong Rexton 151Ssangyong Stavic 15Subaru Forester 361Subaru Impreza 639Subaru Legacy 543Subaru Outback 593Subaru Tribeca 33Suzuki Alto 2Suzuki Grand Vitara 714
Suzuki Ignis 7
Make/model Total
Suzuki Jimny 127Suzuki Liana 176Suzuki Swift 2,060Suzuki Sx4 2Suzuki Wagon R+ 4Toyota Aurion 160Toyota Avensis 270Toyota Camry 2,133Toyota Celica 1Toyota Corolla 5,297Toyota Echo 11Toyota Hiace 1Toyota Highlander 192Toyota Hilux 1Toyota Landcruiser 168Toyota Landcruiser Prado 821Toyota MR2 1Toyota Previa 239Toyota Prius 225Toyota RAV4 1,145Toyota Yaris 1,795Volkswagen Beetle 129
Top 20 cars of 2006
Position Make/Model Total
1 Holden Commodore 53752 Toyota Corolla 52973 Ford Falcon 41994 Mazda Mazda6 25185 Toyota Camry 21336 Suzuki Swift 20607 Ford Focus 19918 Honda Jazz 19169 Ford Territory 190610 Toyota Yaris 179511 Ford Mondeo 173312 Honda Accord 172913 Honda Civic 169614 Mazda Mazda3 169115 Daihatsu Sirion 162416 Holden Viva 145617 Toyota RAV4 114518 Mitsubishi Outlander 113719 Volkswagen Golf 99320 Hyundai Tucson 918
Make/model Total
Volkswagen Beetle 1.8T 4Volkswagen Caddy 1Volkswagen Crosspolo 4Volkswagen Eos 3Volkswagen Golf 993Volkswagen Jetta 93Volkswagen Passat 385Volkswagen Phaeton 5Volkswagen Polo 167Volkswagen T5 29Volkswagen Touareg 122Volkswagen Touran 11Volvo C70 2Volvo S40 21Volvo S60 3Volvo S80 6Volvo V50 37Volvo V70 5Volvo XC70 44Volvo XC90 89
Total 76,804
LAN 10650 MV Reg Stats - 2006.in58 58LAN 10650 MV Reg Stats - 2006.in58 58 28/02/2008 3:54:36 p.m.28/02/2008 3:54:36 p.m.
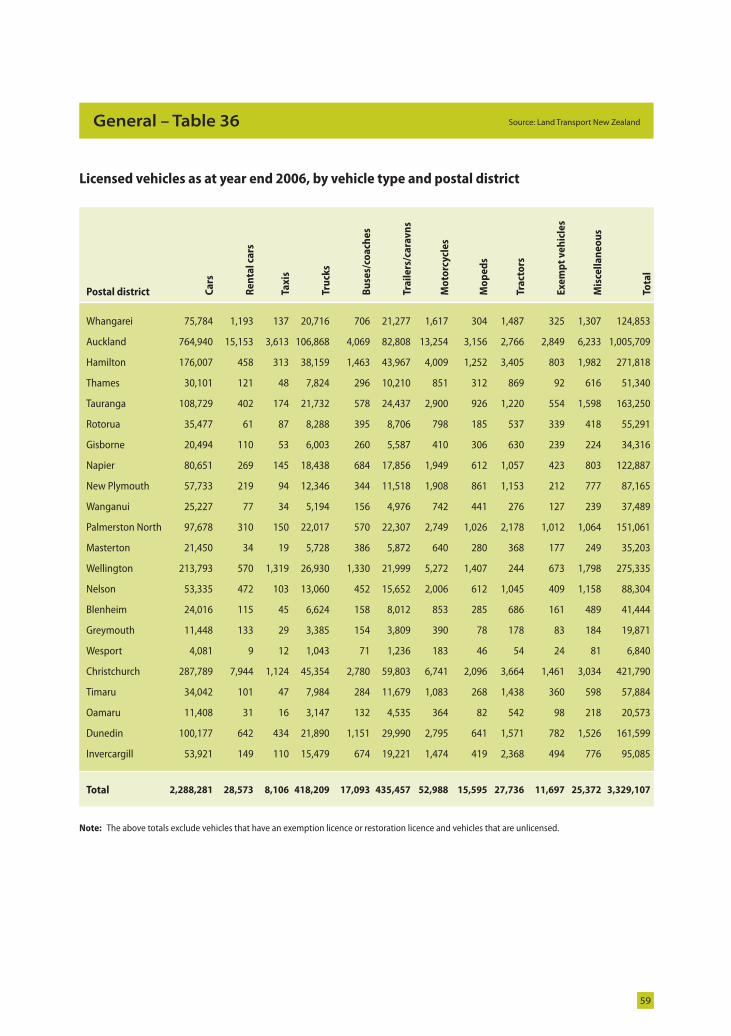
59
Source: Land Transport New ZealandGeneral – Table 36
Licensed vehicles as at year end 2006, by vehicle type and postal district
Postal district Ca
rs
Re
nta
l ca
rs
Tax
is
Tru
cks
Bu
ses/
coa
che
s
Tra
ile
rs/c
ara
vn
s
Mo
torc
ycl
es
Mo
pe
ds
Tra
cto
rs
Ex
em
pt
ve
hic
les
Mis
cell
an
eo
us
Tota
l
Whangarei 75,784 1,193 137 20,716 706 21,277 1,617 304 1,487 325 1,307 124,853
Auckland 764,940 15,153 3,613 106,868 4,069 82,808 13,254 3,156 2,766 2,849 6,233 1,005,709
Hamilton 176,007 458 313 38,159 1,463 43,967 4,009 1,252 3,405 803 1,982 271,818
Thames 30,101 121 48 7,824 296 10,210 851 312 869 92 616 51,340
Tauranga 108,729 402 174 21,732 578 24,437 2,900 926 1,220 554 1,598 163,250
Rotorua 35,477 61 87 8,288 395 8,706 798 185 537 339 418 55,291
Gisborne 20,494 110 53 6,003 260 5,587 410 306 630 239 224 34,316
Napier 80,651 269 145 18,438 684 17,856 1,949 612 1,057 423 803 122,887
New Plymouth 57,733 219 94 12,346 344 11,518 1,908 861 1,153 212 777 87,165
Wanganui 25,227 77 34 5,194 156 4,976 742 441 276 127 239 37,489
Palmerston North 97,678 310 150 22,017 570 22,307 2,749 1,026 2,178 1,012 1,064 151,061
Masterton 21,450 34 19 5,728 386 5,872 640 280 368 177 249 35,203
Wellington 213,793 570 1,319 26,930 1,330 21,999 5,272 1,407 244 673 1,798 275,335
Nelson 53,335 472 103 13,060 452 15,652 2,006 612 1,045 409 1,158 88,304
Blenheim 24,016 115 45 6,624 158 8,012 853 285 686 161 489 41,444
Greymouth 11,448 133 29 3,385 154 3,809 390 78 178 83 184 19,871
Wesport 4,081 9 12 1,043 71 1,236 183 46 54 24 81 6,840
Christchurch 287,789 7,944 1,124 45,354 2,780 59,803 6,741 2,096 3,664 1,461 3,034 421,790
Timaru 34,042 101 47 7,984 284 11,679 1,083 268 1,438 360 598 57,884
Oamaru 11,408 31 16 3,147 132 4,535 364 82 542 98 218 20,573
Dunedin 100,177 642 434 21,890 1,151 29,990 2,795 641 1,571 782 1,526 161,599
Invercargill 53,921 149 110 15,479 674 19,221 1,474 419 2,368 494 776 95,085
Total 2,288,281 28,573 8,106 418,209 17,093 435,457 52,988 15,595 27,736 11,697 25,372 3,329,107
Note: The above totals exclude vehicles that have an exemption licence or restoration licence and vehicles that are unlicensed.
LAN 10650 MV Reg Stats - 2006.in59 59LAN 10650 MV Reg Stats - 2006.in59 59 28/02/2008 3:54:37 p.m.28/02/2008 3:54:37 p.m.
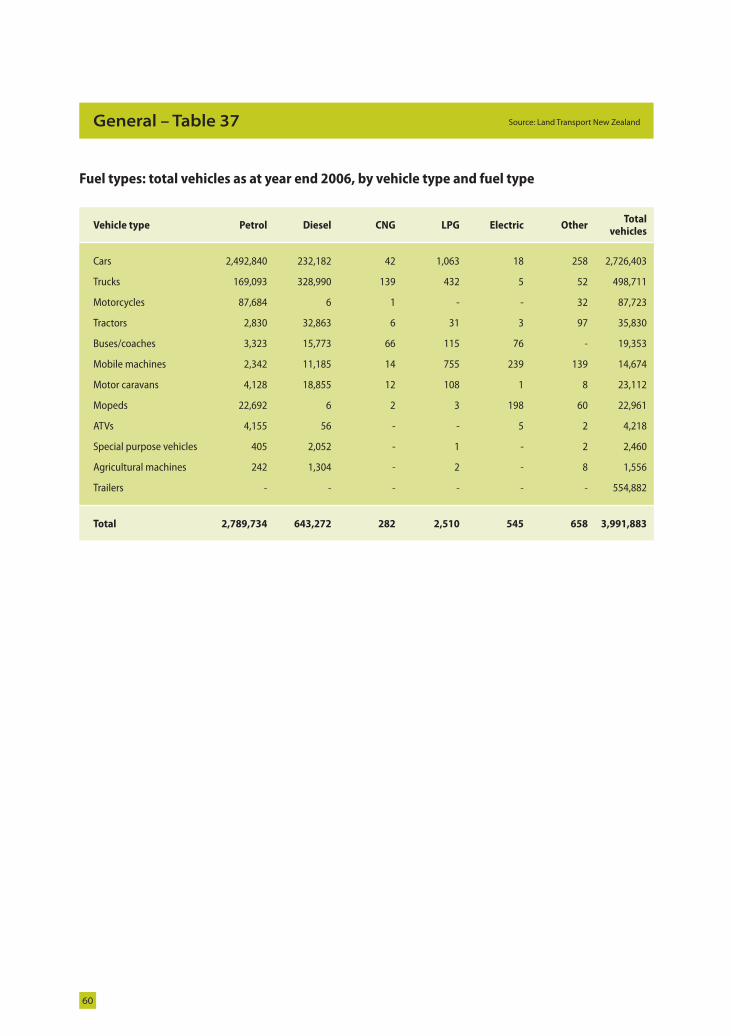
60
Source: Land Transport New ZealandGeneral – Table 37
Fuel types: total vehicles as at year end 2006, by vehicle type and fuel type
Vehicle type Petrol Diesel CNG LPG Electric OtherTotal
vehicles
Cars 2,492,840 232,182 42 1,063 18 258 2,726,403
Trucks 169,093 328,990 139 432 5 52 498,711
Motorcycles 87,684 6 1 - - 32 87,723
Tractors 2,830 32,863 6 31 3 97 35,830
Buses/coaches 3,323 15,773 66 115 76 - 19,353
Mobile machines 2,342 11,185 14 755 239 139 14,674
Motor caravans 4,128 18,855 12 108 1 8 23,112
Mopeds 22,692 6 2 3 198 60 22,961
ATVs 4,155 56 - - 5 2 4,218
Special purpose vehicles 405 2,052 - 1 - 2 2,460
Agricultural machines 242 1,304 - 2 - 8 1,556
Trailers - - - - - - 554,882
Total 2,789,734 643,272 282 2,510 545 658 3,991,883
LAN 10650 MV Reg Stats - 2006.in60 60LAN 10650 MV Reg Stats - 2006.in60 60 28/02/2008 3:54:37 p.m.28/02/2008 3:54:37 p.m.
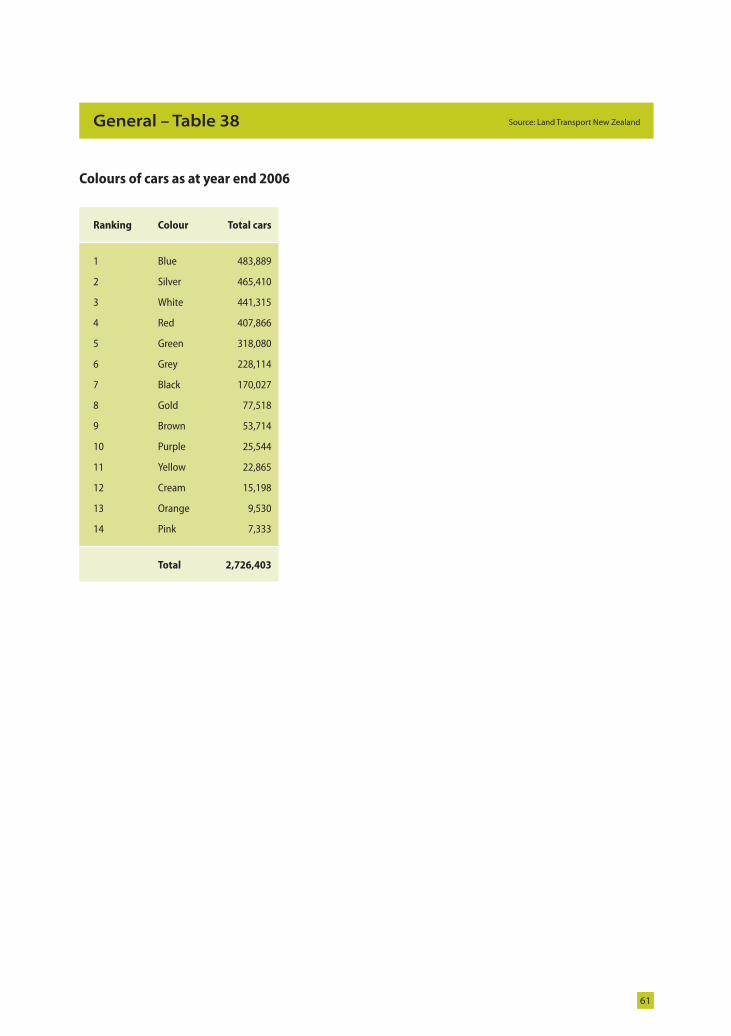
61
Source: Land Transport New ZealandGeneral – Table 38
Colours of cars as at year end 2006
Ranking Colour Total cars
1 Blue 483,889
2 Silver 465,410
3 White 441,315
4 Red 407,866
5 Green 318,080
6 Grey 228,114
7 Black 170,027
8 Gold 77,518
9 Brown 53,714
10 Purple 25,544
11 Yellow 22,865
12 Cream 15,198
13 Orange 9,530
14 Pink 7,333
Total 2,726,403
LAN 10650 MV Reg Stats - 2006.in61 61LAN 10650 MV Reg Stats - 2006.in61 61 28/02/2008 3:54:37 p.m.28/02/2008 3:54:37 p.m.
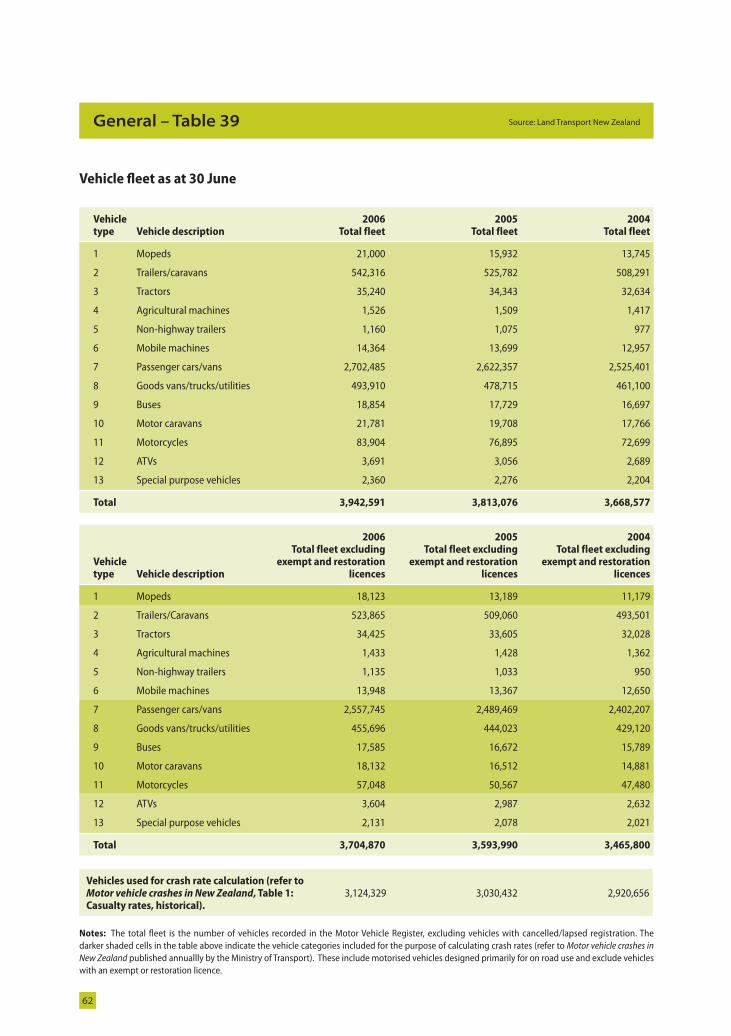
62
Source: Land Transport New ZealandGeneral – Table 39
Vehicle fl eet as at 30 June
Vehicle type Vehicle description
2006Total fleet
2005 Total fleet
2004 Total fleet
1 Mopeds 21,000 15,932 13,745
2 Trailers/caravans 542,316 525,782 508,291
3 Tractors 35,240 34,343 32,634
4 Agricultural machines 1,526 1,509 1,417
5 Non-highway trailers 1,160 1,075 977
6 Mobile machines 14,364 13,699 12,957
7 Passenger cars/vans 2,702,485 2,622,357 2,525,401
8 Goods vans/trucks/utilities 493,910 478,715 461,100
9 Buses 18,854 17,729 16,697
10 Motor caravans 21,781 19,708 17,766
11 Motorcycles 83,904 76,895 72,699
12 ATVs 3,691 3,056 2,689
13 Special purpose vehicles 2,360 2,276 2,204
Total 3,942,591 3,813,076 3,668,577
Vehicle type Vehicle description
2006Total fleet excluding
exempt and restoration licences
2005Total fleet excluding
exempt and restoration licences
2004Total fleet excluding
exempt and restoration licences
1 Mopeds 18,123 13,189 11,179
2 Trailers/Caravans 523,865 509,060 493,501
3 Tractors 34,425 33,605 32,028
4 Agricultural machines 1,433 1,428 1,362
5 Non-highway trailers 1,135 1,033 950
6 Mobile machines 13,948 13,367 12,650
7 Passenger cars/vans 2,557,745 2,489,469 2,402,207
8 Goods vans/trucks/utilities 455,696 444,023 429,120
9 Buses 17,585 16,672 15,789
10 Motor caravans 18,132 16,512 14,881
11 Motorcycles 57,048 50,567 47,480
12 ATVs 3,604 2,987 2,632
13 Special purpose vehicles 2,131 2,078 2,021
Total 3,704,870 3,593,990 3,465,800
Vehicles used for crash rate calculation (refer to Motor vehicle crashes in New Zealand, Table 1: Casualty rates, historical).
3,124,329 3,030,432 2,920,656
Notes: The total fl eet is the number of vehicles recorded in the Motor Vehicle Register, excluding vehicles with cancelled/lapsed registration. The darker shaded cells in the table above indicate the vehicle categories included for the purpose of calculating crash rates (refer to Motor vehicle crashes in
New Zealand published annuallly by the Ministry of Transport). These include motorised vehicles designed primarily for on road use and exclude vehicles with an exempt or restoration licence.
LAN 10650 MV Reg Stats - 2006.in62 62LAN 10650 MV Reg Stats - 2006.in62 62 28/02/2008 3:54:38 p.m.28/02/2008 3:54:38 p.m.
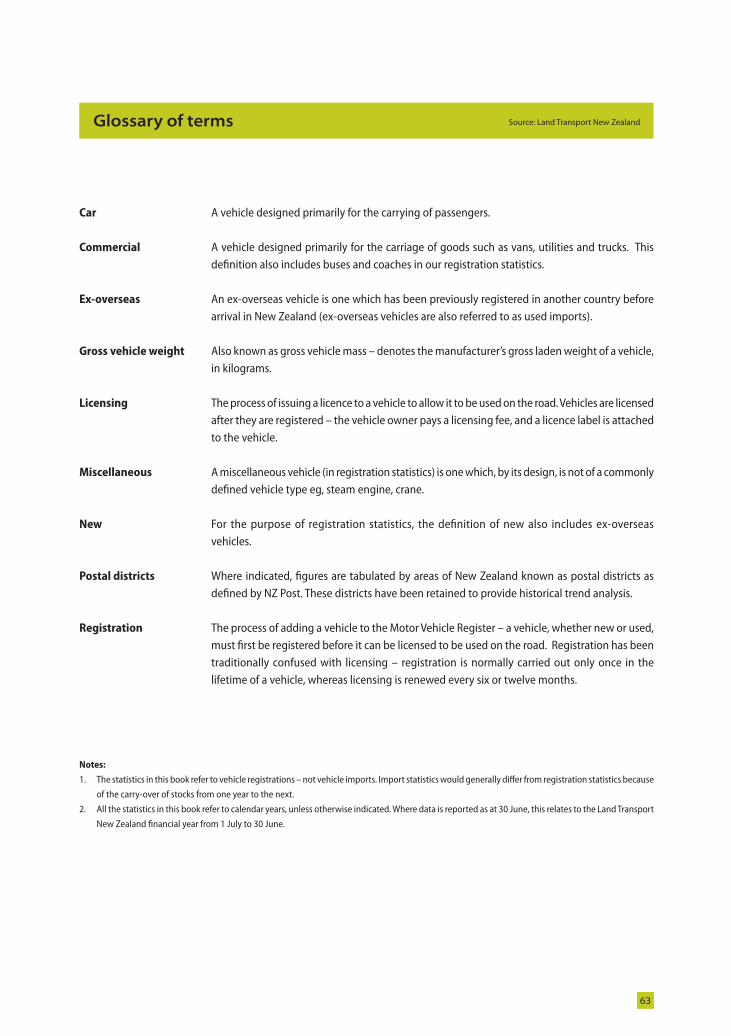
63
Source: Land Transport New ZealandGlossary of terms
Car A vehicle designed primarily for the carrying of passengers. Commercial A vehicle designed primarily for the carriage of goods such as vans, utilities and trucks. This
defi nition also includes buses and coaches in our registration statistics. Ex-overseas An ex-overseas vehicle is one which has been previously registered in another country before
arrival in New Zealand (ex-overseas vehicles are also referred to as used imports). Gross vehicle weight Also known as gross vehicle mass – denotes the manufacturer’s gross laden weight of a vehicle,
in kilograms. Licensing The process of issuing a licence to a vehicle to allow it to be used on the road. Vehicles are licensed
after they are registered – the vehicle owner pays a licensing fee, and a licence label is attached to the vehicle.
Miscellaneous A miscellaneous vehicle (in registration statistics) is one which, by its design, is not of a commonly
defi ned vehicle type eg, steam engine, crane. New For the purpose of registration statistics, the defi nition of new also includes ex-overseas
vehicles. Postal districts Where indicated, fi gures are tabulated by areas of New Zealand known as postal districts as
defi ned by NZ Post. These districts have been retained to provide historical trend analysis. Registration The process of adding a vehicle to the Motor Vehicle Register – a vehicle, whether new or used,
must fi rst be registered before it can be licensed to be used on the road. Registration has been traditionally confused with licensing – registration is normally carried out only once in the lifetime of a vehicle, whereas licensing is renewed every six or twelve months.
Notes:
1. The statistics in this book refer to vehicle registrations – not vehicle imports. Import statistics would generally diff er from registration statistics because
of the carry-over of stocks from one year to the next.
2. All the statistics in this book refer to calendar years, unless otherwise indicated. Where data is reported as at 30 June, this relates to the Land Transport
New Zealand fi nancial year from 1 July to 30 June.
LAN 10650 MV Reg Stats - 2006.in63 63LAN 10650 MV Reg Stats - 2006.in63 63 28/02/2008 3:54:38 p.m.28/02/2008 3:54:38 p.m.

64
Source: Land Transport Safety AuthorityTable number
LAN 10650 MV Reg Stats - 2006.in64 64LAN 10650 MV Reg Stats - 2006.in64 64 28/02/2008 3:54:38 p.m.28/02/2008 3:54:38 p.m.