Embed Size (px)
Citation preview
Robert E. Ratner, MD
Former Chief Scientific and Medical Officer
American Diabetes Association
Professor of Medicine
Georgetown University School of Medicine
Disclosed no conflict of interest
Newer Therapies
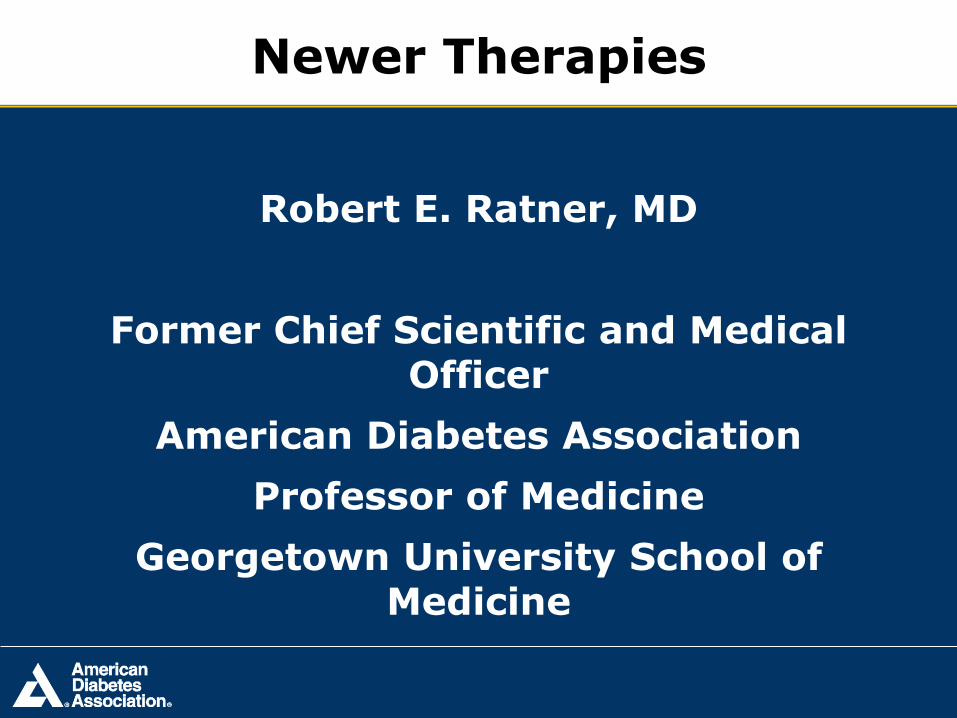
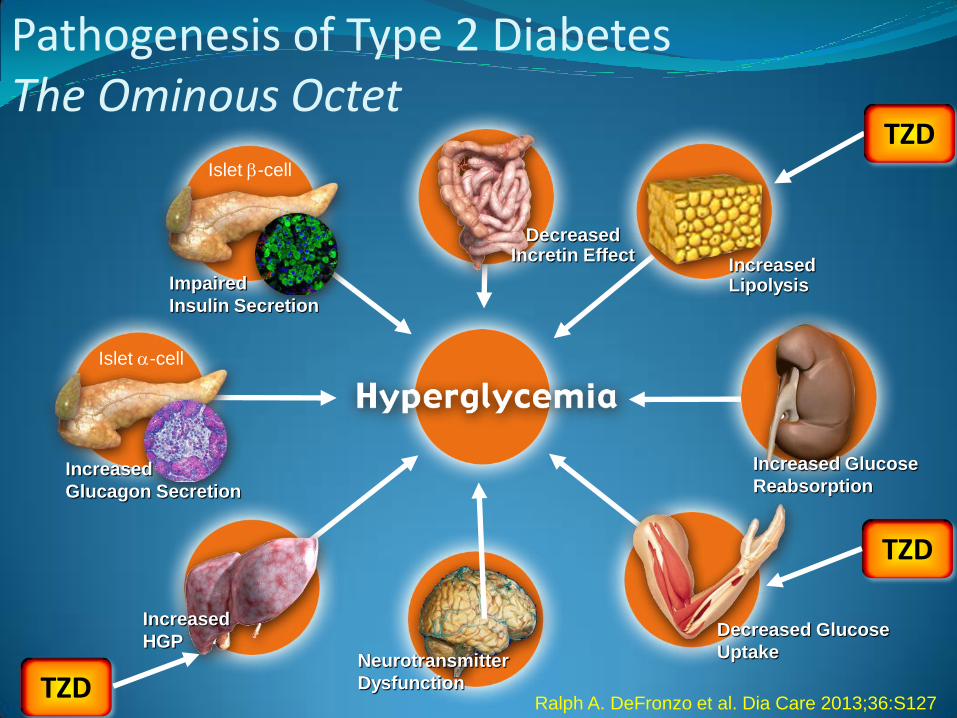
Pathogenesis of Type 2 Diabetes The Ominous Octet
Islet b-cell
Impaired
Insulin Secretion
Neurotransmitter
Dysfunction
Decreased Glucose
Uptake
Islet a-cell
Increased
Glucagon Secretion
Increased Lipolysis
Increased Glucose
Reabsorption
Increased HGP
Decreased Incretin Effect
DeFronzo RA. DiabCare 2013;36:S127
MET
SGLT2i
GLP1RA
GLP1RA
GLP1RA
GLP1RA
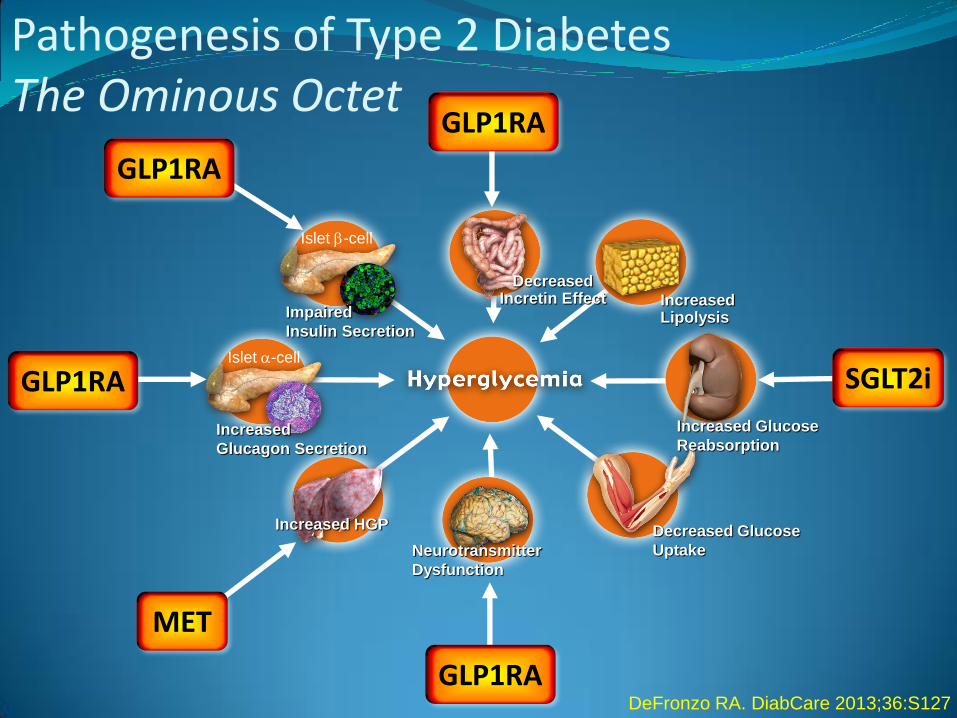
Pathogenesis of Type 2 Diabetes The Ominous Octet
Islet b-cell
Impaired
Insulin Secretion
Neurotransmitter
Dysfunction
Decreased Glucose
Uptake
Islet a-cell
Increased
Glucagon Secretion
Increased Lipolysis
Increased Glucose
Reabsorption
Increased HGP
Decreased Incretin Effect
DeFronzo RA. DiabCare 2013;36:S127
MET
SGLT2i
DPP IVi
DPP IVi
DPP IVi
Pathogenesis of Type 2 Diabetes The Ominous Octet
Islet b-cell
Impaired
Insulin Secretion
Neurotransmitter
Dysfunction
Decreased Glucose
Uptake
Islet a-cell
Increased
Glucagon Secretion
Increased Lipolysis
Increased Glucose
Reabsorption
Increased
HGP
Decreased Incretin Effect
Ralph A. DeFronzo et al. Dia Care 2013;36:S127 TZD
TZD
TZD
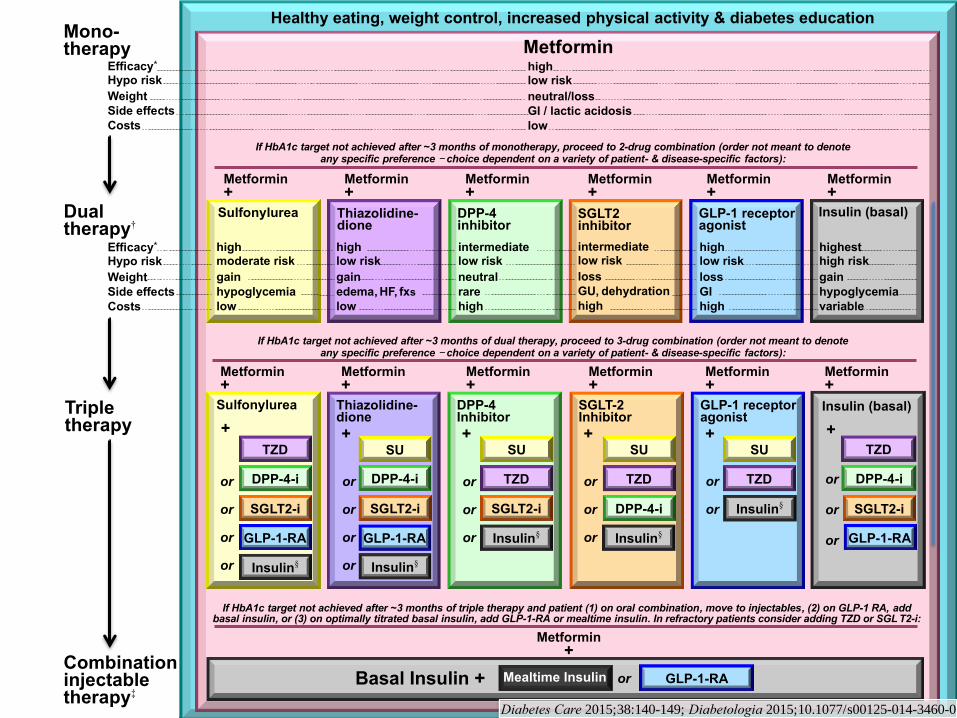
Healthy eating, weight control, increased physical activity & diabetes education
Metformin high low risk
neutral/loss
GI / lactic acidosis
low
If HbA1c target not achieved after ~3 months of monotherapy, proceed to 2-drug combination (order not meant to denote any specific preference - choice dependent on a variety of patient- & disease-specific factors):
Metformin +
Metformin +
Metformin +
Metformin +
Metformin +
high low risk
gain
edema, HF, fxs
low
Thiazolidine- dione
intermediate low risk
neutral
rare
high
DPP-4 inhibitor
highest high risk
gain
hypoglycemia
variable
Insulin (basal)
Metformin +
Metformin +
Metformin +
Metformin +
Metformin +
Basal Insulin +
Sulfonylurea
+
TZD
DPP-4-i
GLP-1-RA
Insulin§
or
or
or
or
Thiazolidine-dione
+ SU
DPP-4-i
GLP-1-RA
Insulin§
TZD
DPP-4-i
or
or
or
GLP-1-RA
high low risk
loss
GI
high
GLP-1 receptor agonist
Sulfonylurea
high moderate risk
gain
hypoglycemia
low
SGLT2 inhibitor
intermediate low risk
loss
GU, dehydration
high
SU
TZD
Insulin§
GLP-1 receptor agonist
+
SGLT-2 Inhibitor +
SU
TZD
Insulin§
Metformin +
Metformin +
or
or
or
or
SGLT2-i
or
or
or
SGLT2-i
Mono- therapy
Efficacy* Hypo risk
Weight
Side effects
Costs
Dual therapy†
Efficacy* Hypo risk
Weight
Side effects
Costs
Triple therapy
or
or
DPP-4 Inhibitor
+ SU
TZD
Insulin§
SGLT2-i
or
or
or
SGLT2-i
or
DPP-4-i
If HbA1c target not achieved after ~3 months of dual therapy, proceed to 3-drug combination (order not meant to denote any specific preference - choice dependent on a variety of patient- & disease-specific factors):
If HbA1c target not achieved after ~3 months of triple therapy and patient (1) on oral combination, move to injectables, (2) on GLP-1 RA, add basal insulin, or (3) on optimally titrated basal insulin, add GLP-1-RA or mealtime insulin. In refractory patients consider adding TZD or SGL T2-i:
Metformin +
Combination injectable therapy‡
GLP-1-RA Mealtime Insulin
Insulin (basal)
+
Diabetes Care 2015;38:140-149; Diabetologia 2015;10.1077/s00125-014-3460-0
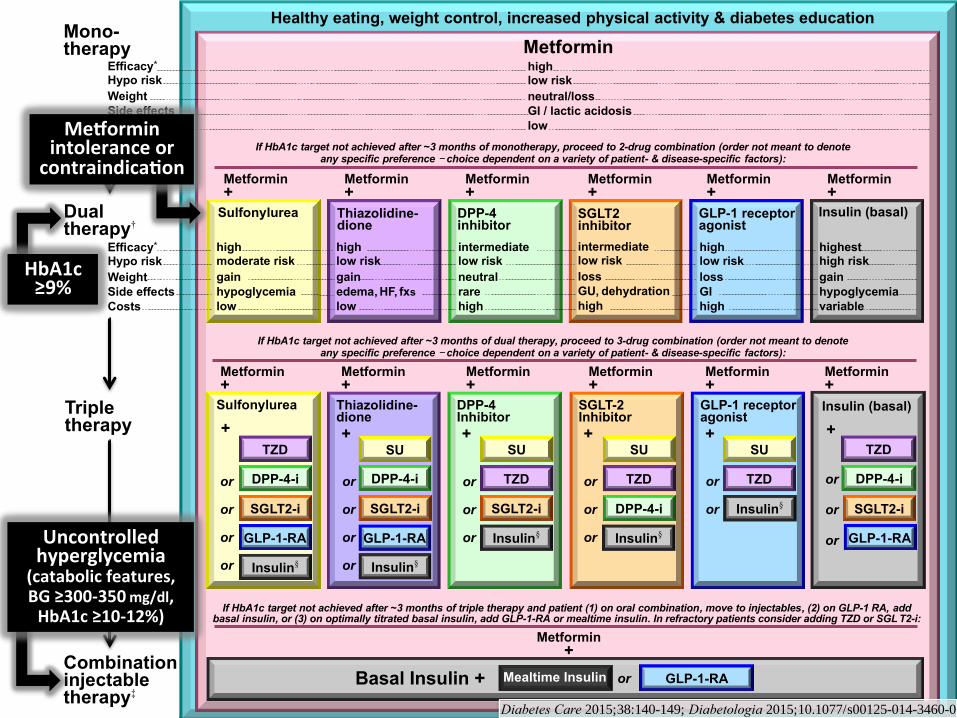
Healthy eating, weight control, increased physical activity & diabetes education
Metformin high low risk
neutral/loss
GI / lactic acidosis
low
If HbA1c target not achieved after ~3 months of monotherapy, proceed to 2-drug combination (order not meant to denote any specific preference - choice dependent on a variety of patient- & disease-specific factors):
Metformin +
Metformin +
Metformin +
Metformin +
Metformin +
high low risk
gain
edema, HF, fxs
low
Thiazolidine- dione
intermediate low risk
neutral
rare
high
DPP-4 inhibitor
highest high risk
gain
hypoglycemia
variable
Insulin (basal)
Metformin +
Metformin +
Metformin +
Metformin +
Metformin +
Basal Insulin +
Sulfonylurea
+
TZD
DPP-4-i
GLP-1-RA
Insulin§
or
or
or
or
Thiazolidine-dione
+ SU
DPP-4-i
GLP-1-RA
Insulin§
TZD
DPP-4-i
GLP-1-RA
high low risk
loss
GI
high
GLP-1 receptor agonist
Sulfonylurea
high moderate risk
gain
hypoglycemia
low
SGLT2 inhibitor
intermediate low risk
loss
GU, dehydration
high
SU
TZD
Insulin§
GLP-1 receptor agonist
+
SGLT-2 Inhibitor +
SU
TZD
Insulin§
Metformin +
Metformin +
or
or
or
or
SGLT2-i
or
or
or
SGLT2-i
Mono- therapy
Efficacy* Hypo risk
Weight
Side effects
Costs
Dual therapy†
Efficacy* Hypo risk
Weight
Side effects
Costs
Triple therapy
or
or
DPP-4 Inhibitor
+ SU
TZD
Insulin§
SGLT2-i
or
or
or
SGLT2-i
or
DPP-4-i
If HbA1c target not achieved after ~3 months of dual therapy, proceed to 3-drug combination (order not meant to denote any specific preference - choice dependent on a variety of patient- & disease-specific factors):
If HbA1c target not achieved after ~3 months of triple therapy and patient (1) on oral combination, move to injectables, (2) on GLP-1 RA, add basal insulin, or (3) on optimally titrated basal insulin, add GLP-1-RA or mealtime insulin. In refractory patients consider adding TZD or SGL T2-i:
Metformin +
Combination injectable therapy‡
GLP-1-RA Mealtime Insulin
HbA1c≥9%
Me orminintoleranceorcontraindica on
Uncontrolledhyperglycemia
(catabolicfeatures,BG≥300-350mg/dl,HbA1c≥10-12%)
Insulin (basal)
+
or
or
or
Diabetes Care 2015;38:140-149; Diabetologia 2015;10.1077/s00125-014-3460-0
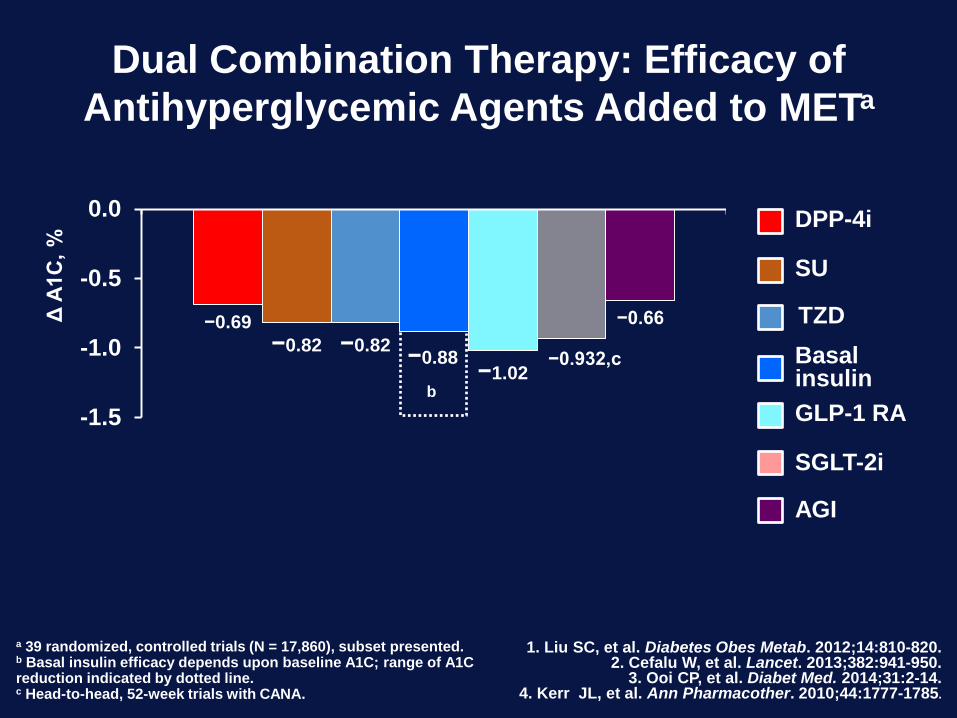
−0.69
−0.82 −0.82 −0.88
−1.02 −0.932,c
−0.66
-1.5
-1.0
-0.5
0.0
Δ A
1C
, %
Dual Combination Therapy: Efficacy of
Antihyperglycemic Agents Added to METa
a 39 randomized, controlled trials (N = 17,860), subset presented. b Basal insulin efficacy depends upon baseline A1C; range of A1C reduction indicated by dotted line. c Head-to-head, 52-week trials with CANA.
1. Liu SC, et al. Diabetes Obes Metab. 2012;14:810-820. 2. Cefalu W, et al. Lancet. 2013;382:941-950.
3. Ooi CP, et al. Diabet Med. 2014;31:2-14. 4. Kerr JL, et al. Ann Pharmacother. 2010;44:1777-1785.
DPP-4i
TZD
GLP-1 RA
SU
Basal insulin
SGLT-2i
AGI
b
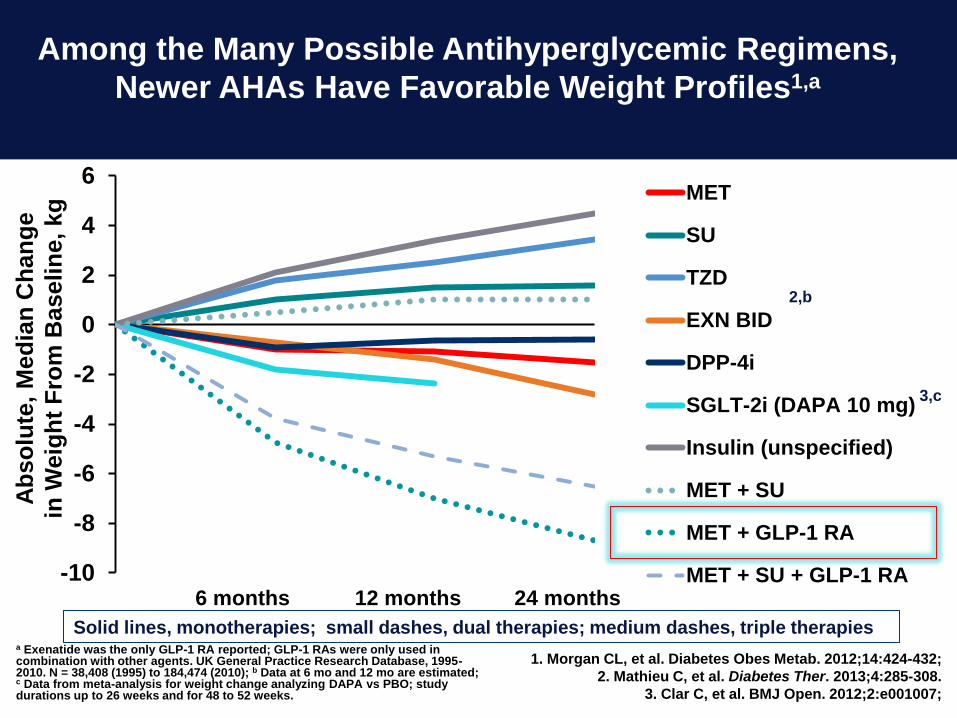
Among the Many Possible Antihyperglycemic Regimens,
Newer AHAs Have Favorable Weight Profiles1,a
a Exenatide was the only GLP-1 RA reported; GLP-1 RAs were only used in combination with other agents. UK General Practice Research Database, 1995-2010. N = 38,408 (1995) to 184,474 (2010); b Data at 6 mo and 12 mo are estimated; c Data from meta-analysis for weight change analyzing DAPA vs PBO; study durations up to 26 weeks and for 48 to 52 weeks.
1. Morgan CL, et al. Diabetes Obes Metab. 2012;14:424-432;
2. Mathieu C, et al. Diabetes Ther. 2013;4:285-308.
3. Clar C, et al. BMJ Open. 2012;2:e001007;
Ab
so
lute
, M
ed
ian
Ch
an
ge
in W
eig
ht
Fro
m B
aselin
e, kg
-10
-8
-6
-4
-2
0
2
4
6
0 6 months 12 months 24 months
MET
SU
TZD
EXN BID
DPP-4i
SGLT-2i (DAPA 10 mg)
Insulin (unspecified)
MET + SU
MET + GLP-1 RA
MET + SU + GLP-1 RA
Solid lines, monotherapies; small dashes, dual therapies; medium dashes, triple therapies
3,c
2,b
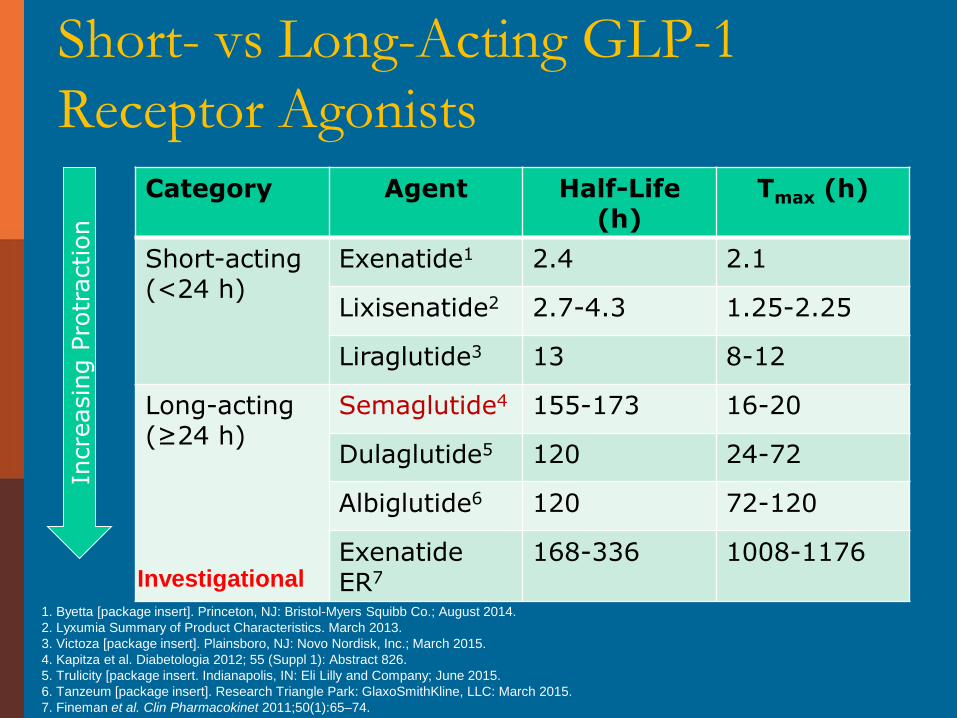
Short- vs Long-Acting GLP-1
Receptor Agonists
Category Agent Half-Life (h)
Tmax (h)
Short-acting (<24 h)
Exenatide1 2.4 2.1
Lixisenatide2 2.7-4.3 1.25-2.25
Liraglutide3 13 8-12
Long-acting (≥24 h)
Semaglutide4 155-173 16-20
Dulaglutide5 120 24-72
Albiglutide6 120 72-120
Exenatide ER7
168-336 1008-1176 Investigational
1. Byetta [package insert]. Princeton, NJ: Bristol-Myers Squibb Co.; August 2014.
2. Lyxumia Summary of Product Characteristics. March 2013.
3. Victoza [package insert]. Plainsboro, NJ: Novo Nordisk, Inc.; March 2015.
4. Kapitza et al. Diabetologia 2012; 55 (Suppl 1): Abstract 826.
5. Trulicity [package insert. Indianapolis, IN: Eli Lilly and Company; June 2015.
6. Tanzeum [package insert]. Research Triangle Park: GlaxoSmithKline, LLC: March 2015.
7. Fineman et al. Clin Pharmacokinet 2011;50(1):65–74.
Incre
asin
g P
rotr
action
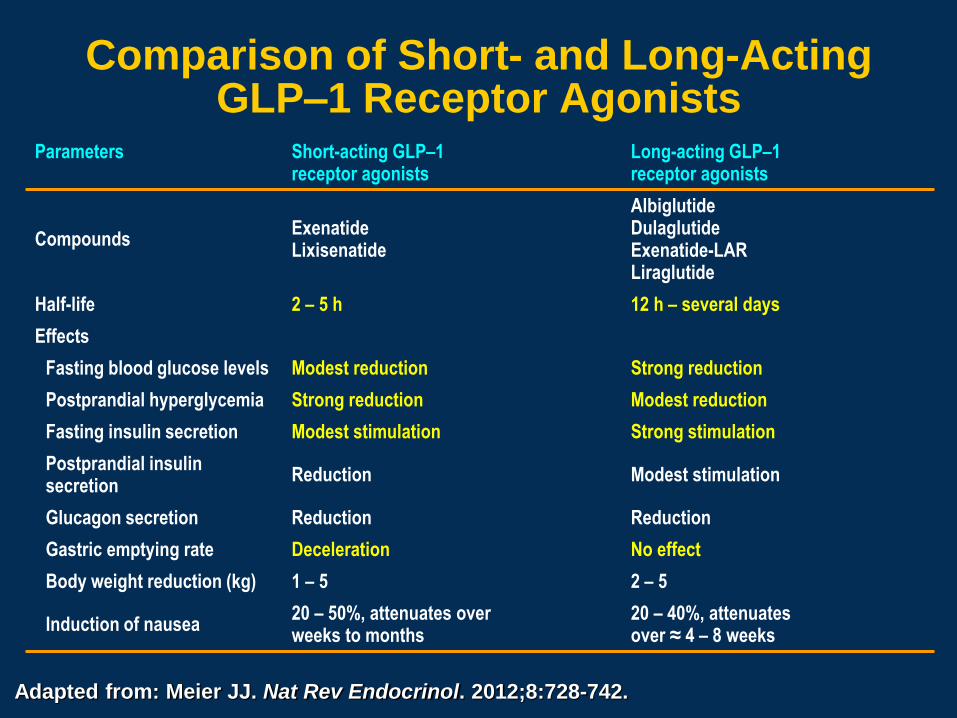
Comparison of Short- and Long-Acting GLP–1 Receptor Agonists
Adapted from: Meier JJ. Nat Rev Endocrinol. 2012;8:728-742.
Parameters Short-acting GLP–1 receptor agonists
Long-acting GLP–1 receptor agonists
Compounds Exenatide Lixisenatide
Albiglutide Dulaglutide Exenatide-LAR Liraglutide
Half-life 2 – 5 h 12 h – several days
Effects
Fasting blood glucose levels Modest reduction Strong reduction
Postprandial hyperglycemia Strong reduction Modest reduction
Fasting insulin secretion Modest stimulation Strong stimulation
Postprandial insulin secretion
Reduction Modest stimulation
Glucagon secretion Reduction Reduction
Gastric emptying rate Deceleration No effect
Body weight reduction (kg) 1 – 5 2 – 5
Induction of nausea 20 – 50%, attenuates over weeks to months
20 – 40%, attenuates over ≈ 4 – 8 weeks
-0.9 -0.8
-1.1
-1.5 -1.5 -1.5
-0.9
-0.6 -0.8
-1.1
-2.0
-1.5
-1.0
-0.5
0.0
0.5Monotherapy
Added toMET
Mean
Δ A
1C
fro
m B
aseli
ne,
%
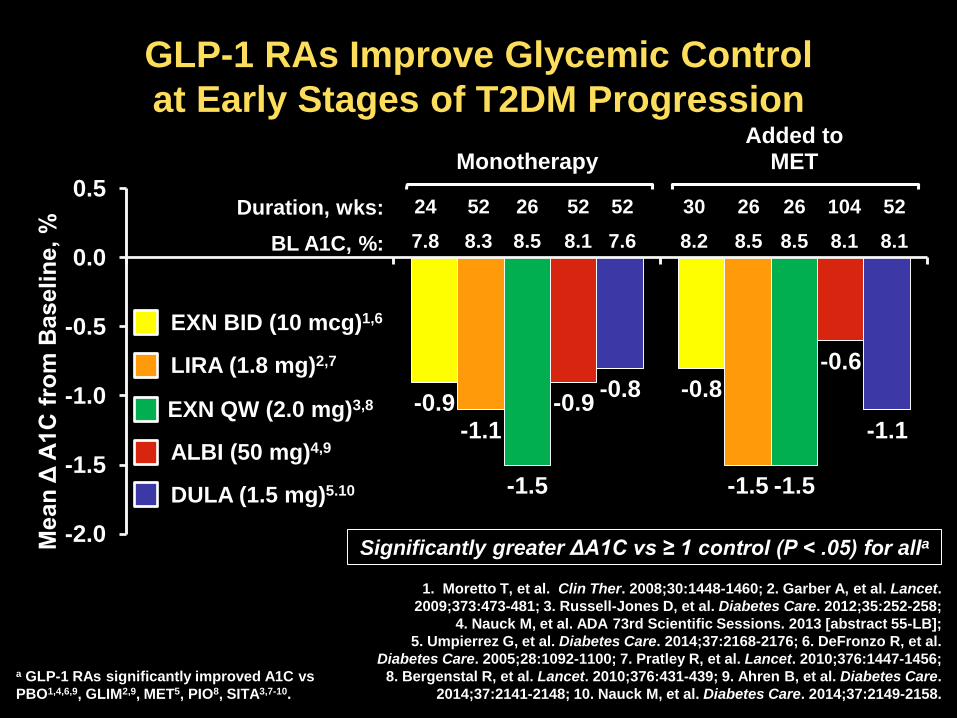
GLP-1 RAs Improve Glycemic Control
at Early Stages of T2DM Progression
1. Moretto T, et al. Clin Ther. 2008;30:1448-1460; 2. Garber A, et al. Lancet.
2009;373:473-481; 3. Russell-Jones D, et al. Diabetes Care. 2012;35:252-258;
4. Nauck M, et al. ADA 73rd Scientific Sessions. 2013 [abstract 55-LB];
5. Umpierrez G, et al. Diabetes Care. 2014;37:2168-2176; 6. DeFronzo R, et al.
Diabetes Care. 2005;28:1092-1100; 7. Pratley R, et al. Lancet. 2010;376:1447-1456;
8. Bergenstal R, et al. Lancet. 2010;376:431-439; 9. Ahren B, et al. Diabetes Care.
2014;37:2141-2148; 10. Nauck M, et al. Diabetes Care. 2014;37:2149-2158.
EXN BID (10 mcg)1,6
LIRA (1.8 mg)2,7
ALBI (50 mg)4,9
EXN QW (2.0 mg)3,8
Duration, wks:
BL A1C, %:
24
7.8
52
8.3
26
8.5
52
8.1
52
7.6
30
8.2
26
8.5
26
8.5
104
8.1
52
8.1
DULA (1.5 mg)5.10
Significantly greater ΔA1C vs ≥ 1 control (P < .05) for alla
a GLP-1 RAs significantly improved A1C vs
PBO1,4,6,9, GLIM2,9, MET5, PIO8, SITA3,7-10.
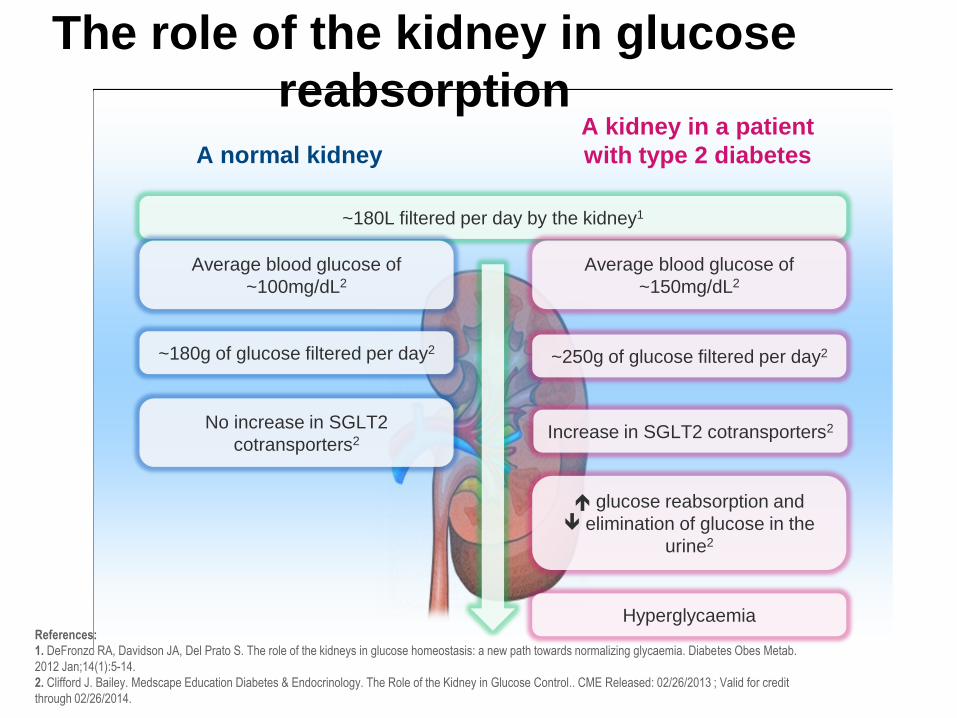
The role of the kidney in glucose
reabsorption
References:
1. DeFronzo RA, Davidson JA, Del Prato S. The role of the kidneys in glucose homeostasis: a new path towards normalizing glycaemia. Diabetes Obes Metab.
2012 Jan;14(1):5-14.
2. Clifford J. Bailey. Medscape Education Diabetes & Endocrinology. The Role of the Kidney in Glucose Control.. CME Released: 02/26/2013 ; Valid for credit
through 02/26/2014.
~180L filtered per day by the kidney1
A normal kidney
A kidney in a patient
with type 2 diabetes
Average blood glucose of
~100mg/dL2
Average blood glucose of
~150mg/dL2
~180g of glucose filtered per day2
No increase in SGLT2
cotransporters2
~250g of glucose filtered per day2
glucose reabsorption and
elimination of glucose in the
urine2
Hyperglycaemia
Increase in SGLT2 cotransporters2
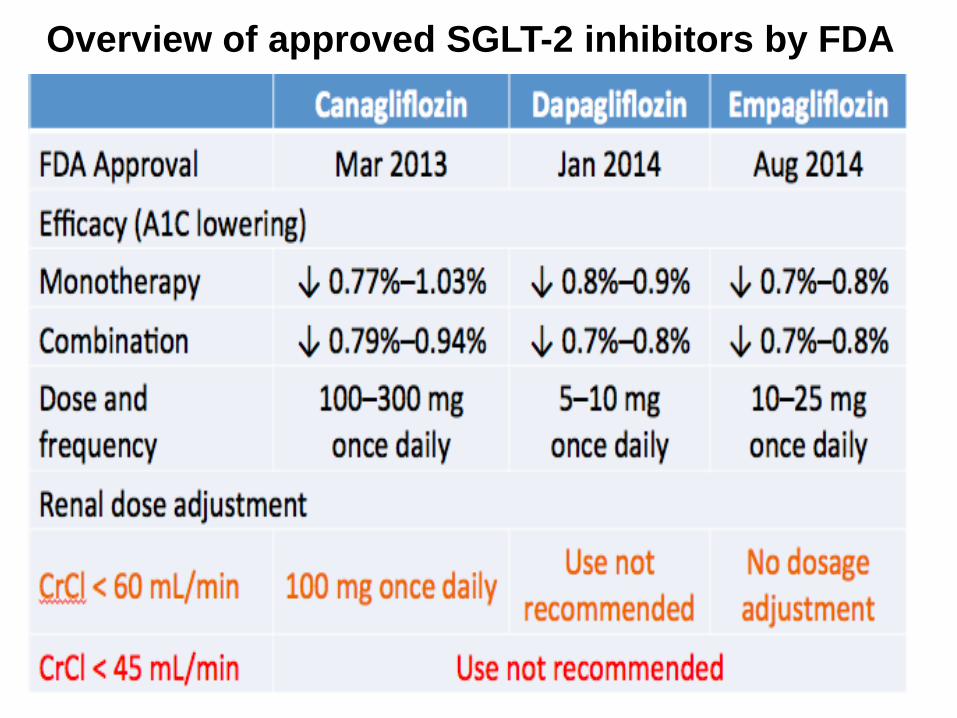
Overview of approved SGLT-2 inhibitors by FDA
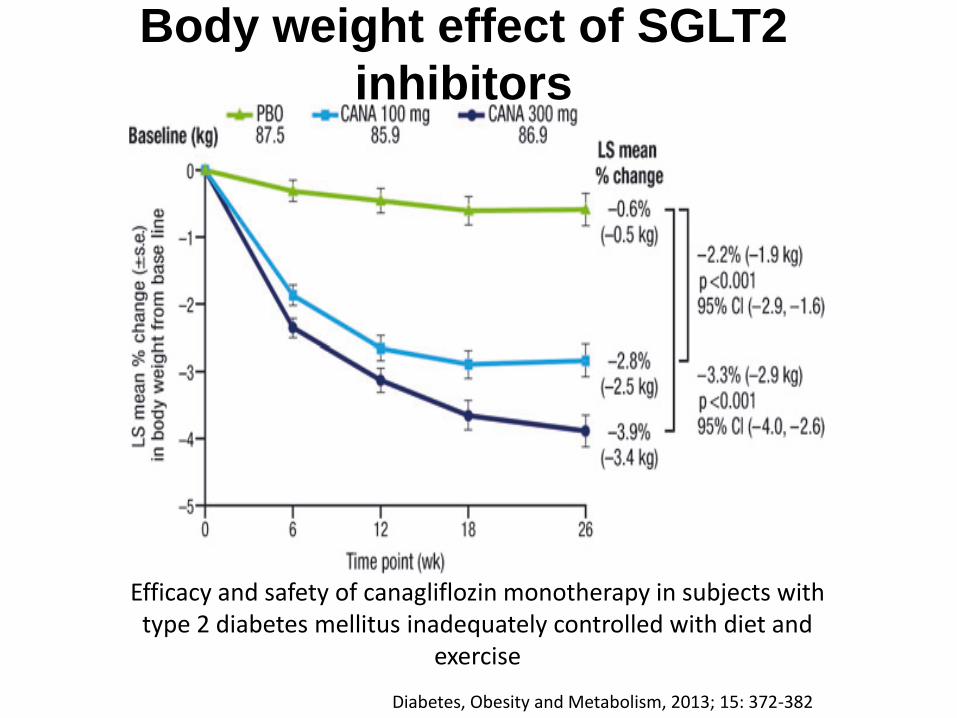
Diabetes, Obesity and Metabolism, 2013; 15: 372-382
Efficacy and safety of canagliflozin monotherapy in subjects with type 2 diabetes mellitus inadequately controlled with diet and
exercise
Body weight effect of SGLT2
inhibitors
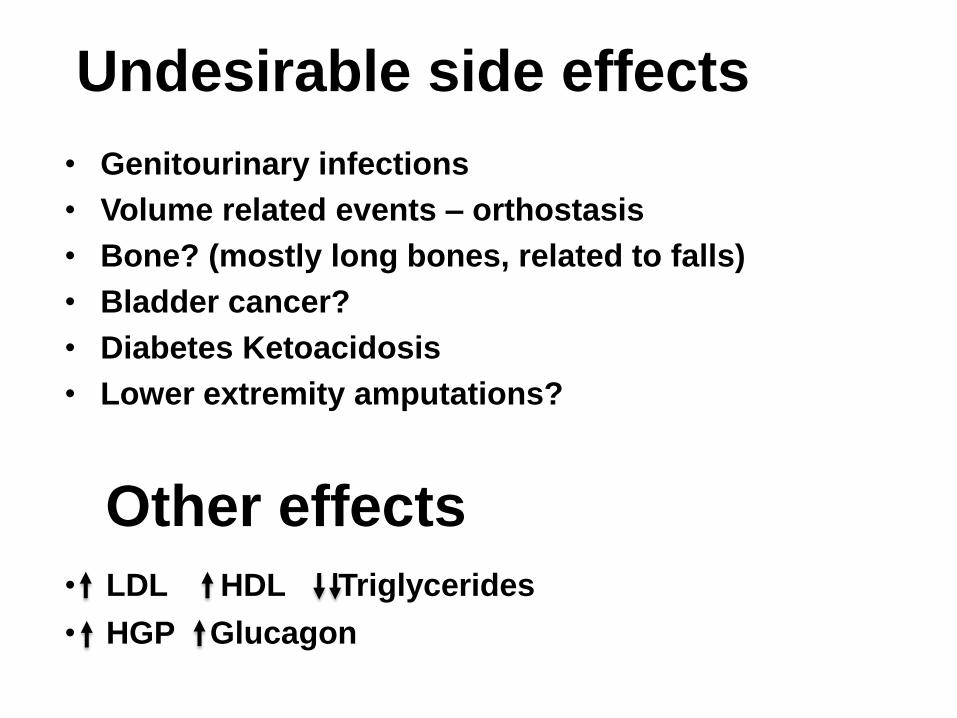
Undesirable side effects
• Genitourinary infections
• Volume related events – orthostasis
• Bone? (mostly long bones, related to falls)
• Bladder cancer?
• Diabetes Ketoacidosis
• Lower extremity amputations?
Other effects
• LDL HDL Triglycerides
• HGP Glucagon
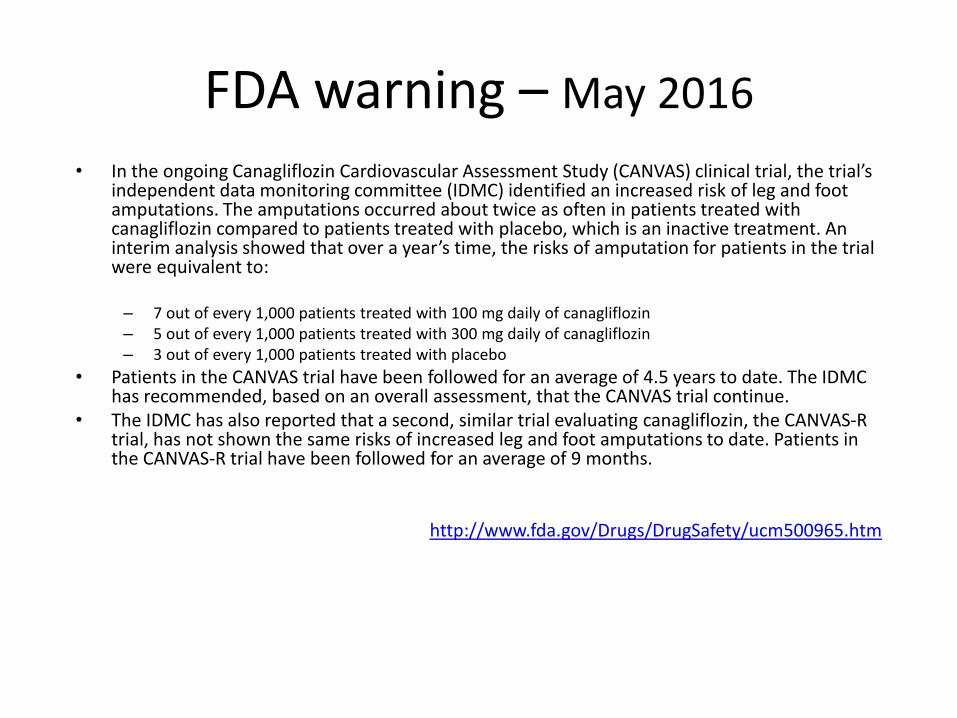
FDA warning – May 2016
• In the ongoing Canagliflozin Cardiovascular Assessment Study (CANVAS) clinical trial, the trial’s independent data monitoring committee (IDMC) identified an increased risk of leg and foot amputations. The amputations occurred about twice as often in patients treated with canagliflozin compared to patients treated with placebo, which is an inactive treatment. An interim analysis showed that over a year’s time, the risks of amputation for patients in the trial were equivalent to:
– 7 out of every 1,000 patients treated with 100 mg daily of canagliflozin – 5 out of every 1,000 patients treated with 300 mg daily of canagliflozin – 3 out of every 1,000 patients treated with placebo
• Patients in the CANVAS trial have been followed for an average of 4.5 years to date. The IDMC has recommended, based on an overall assessment, that the CANVAS trial continue.
• The IDMC has also reported that a second, similar trial evaluating canagliflozin, the CANVAS-R trial, has not shown the same risks of increased leg and foot amputations to date. Patients in the CANVAS-R trial have been followed for an average of 9 months.
http://www.fda.gov/Drugs/DrugSafety/ucm500965.htm
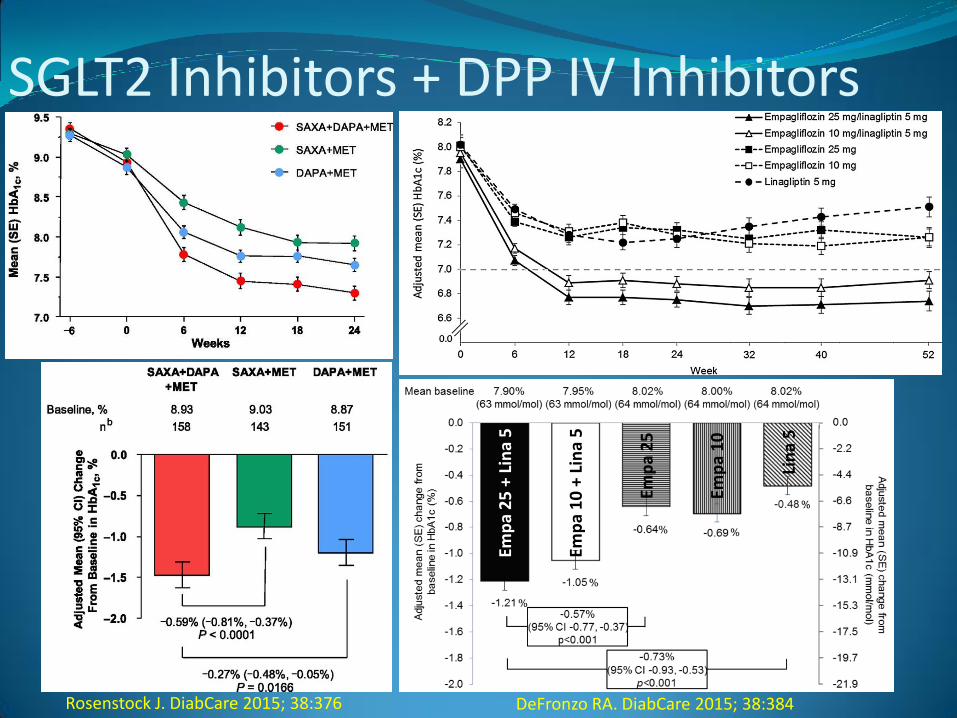
SGLT2 Inhibitors + DPP IV Inhibitors
Rosenstock J. DiabCare 2015; 38:376
Emp
a 2
5 +
Lin
a 5
Emp
a 1
0 +
Lin
a 5
Emp
a 2
5
Emp
a 1
0
Lin
a 5
DeFronzo RA. DiabCare 2015; 38:384
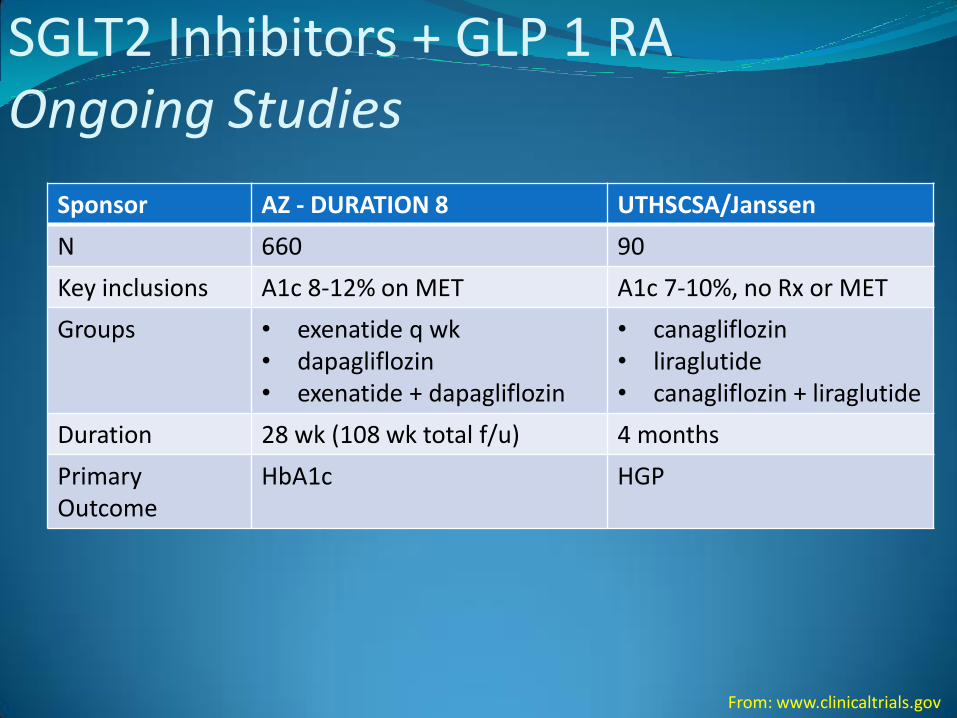
SGLT2 Inhibitors + GLP 1 RA Ongoing Studies
Sponsor AZ - DURATION 8 UTHSCSA/Janssen
N 660 90
Key inclusions A1c 8-12% on MET A1c 7-10%, no Rx or MET
Groups • exenatide q wk • dapagliflozin • exenatide + dapagliflozin
• canagliflozin • liraglutide • canagliflozin + liraglutide
Duration 28 wk (108 wk total f/u) 4 months
Primary Outcome
HbA1c HGP
From: www.clinicaltrials.gov
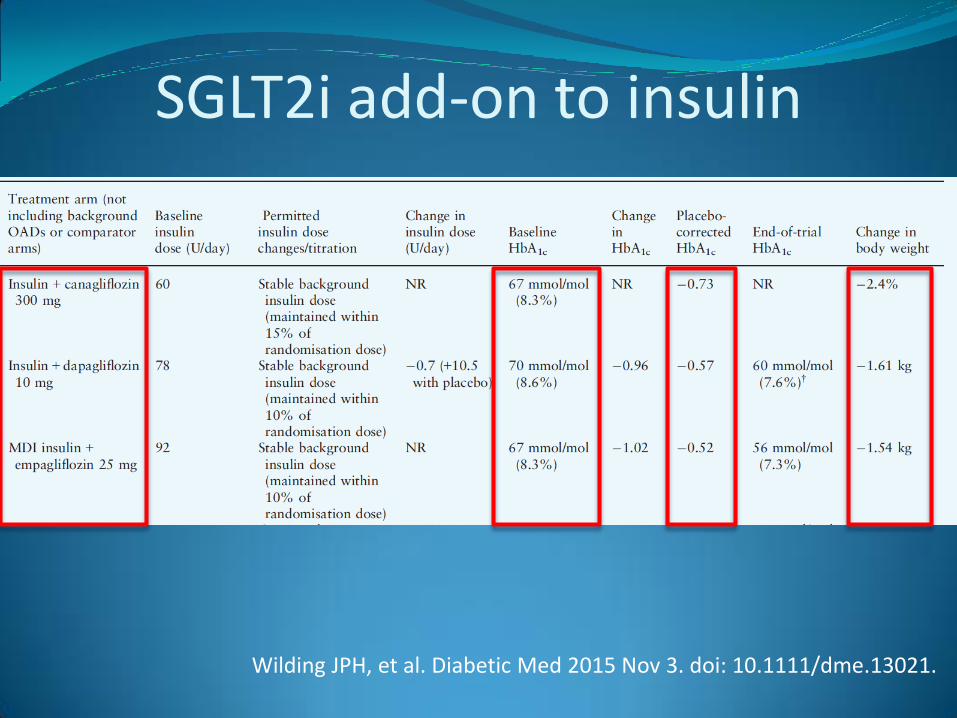
SGLT2i add-on to insulin
Wilding JPH, et al. Diabetic Med 2015 Nov 3. doi: 10.1111/dme.13021.
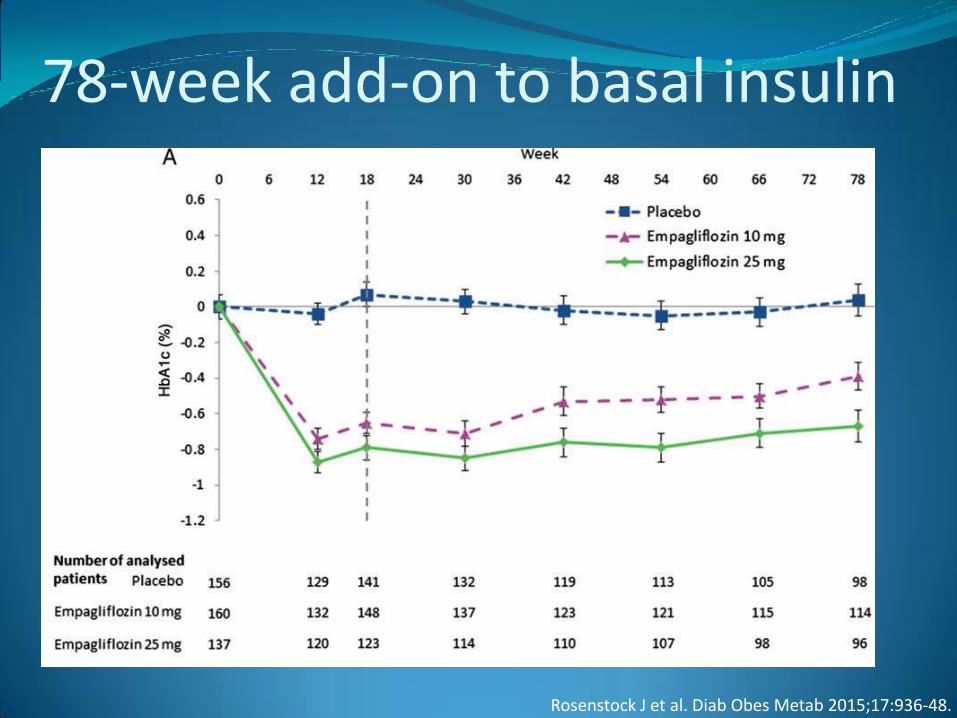
78-week add-on to basal insulin
Rosenstock J et al. Diab Obes Metab 2015;17:936-48.
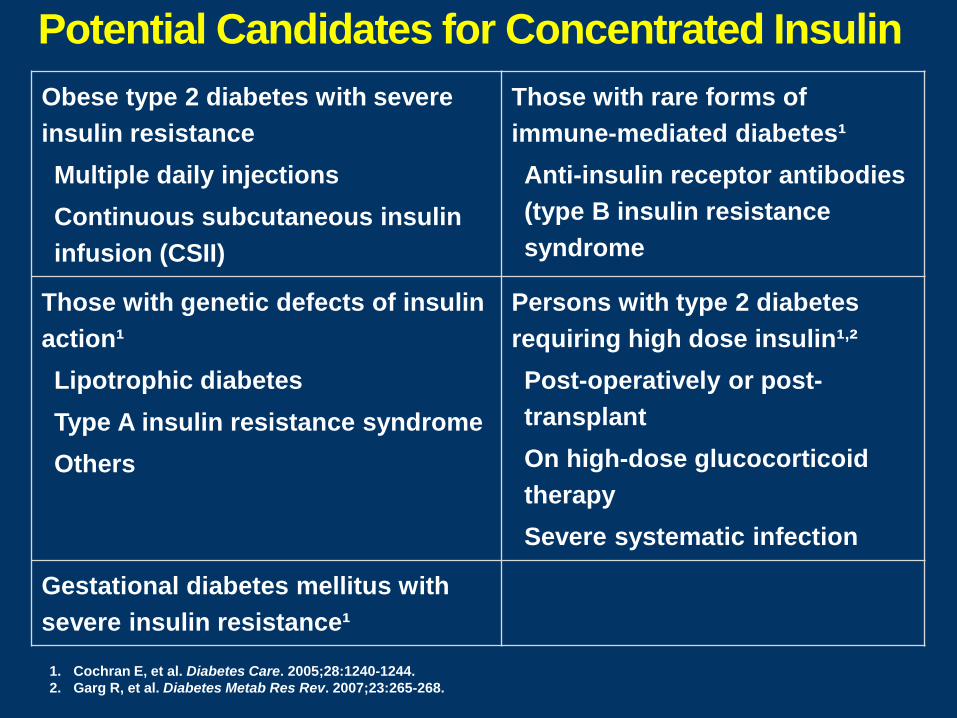
Potential Candidates for Concentrated Insulin
1. Cochran E, et al. Diabetes Care. 2005;28:1240-1244.
2. Garg R, et al. Diabetes Metab Res Rev. 2007;23:265-268.
Obese type 2 diabetes with severe
insulin resistance
Multiple daily injections
Continuous subcutaneous insulin
infusion (CSII)
Those with rare forms of
immune-mediated diabetes¹
Anti-insulin receptor antibodies
(type B insulin resistance
syndrome
Those with genetic defects of insulin
action¹
Lipotrophic diabetes
Type A insulin resistance syndrome
Others
Persons with type 2 diabetes
requiring high dose insulin¹,²
Post-operatively or post-
transplant
On high-dose glucocorticoid
therapy
Severe systematic infection
Gestational diabetes mellitus with
severe insulin resistance¹
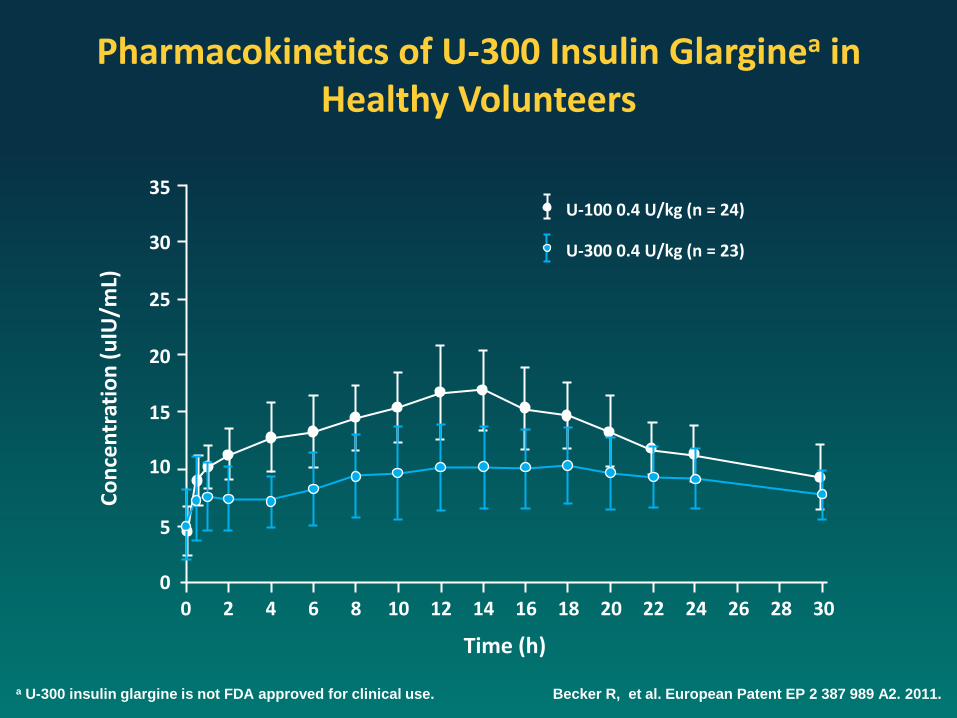
Pharmacokinetics of U-300 Insulin Glarginea in Healthy Volunteers
a U-300 insulin glargine is not FDA approved for clinical use. Becker R, et al. European Patent EP 2 387 989 A2. 2011.
U-100 0.4 U/kg (n = 24)
U-300 0.4 U/kg (n = 23)
35
30
25
20
15
10
5
0 0 2 4 6 8 10 12 14 16 18 20 22 24 26 28 30
Co
nce
ntr
atio
n (
uIU
/mL)
Time (h)
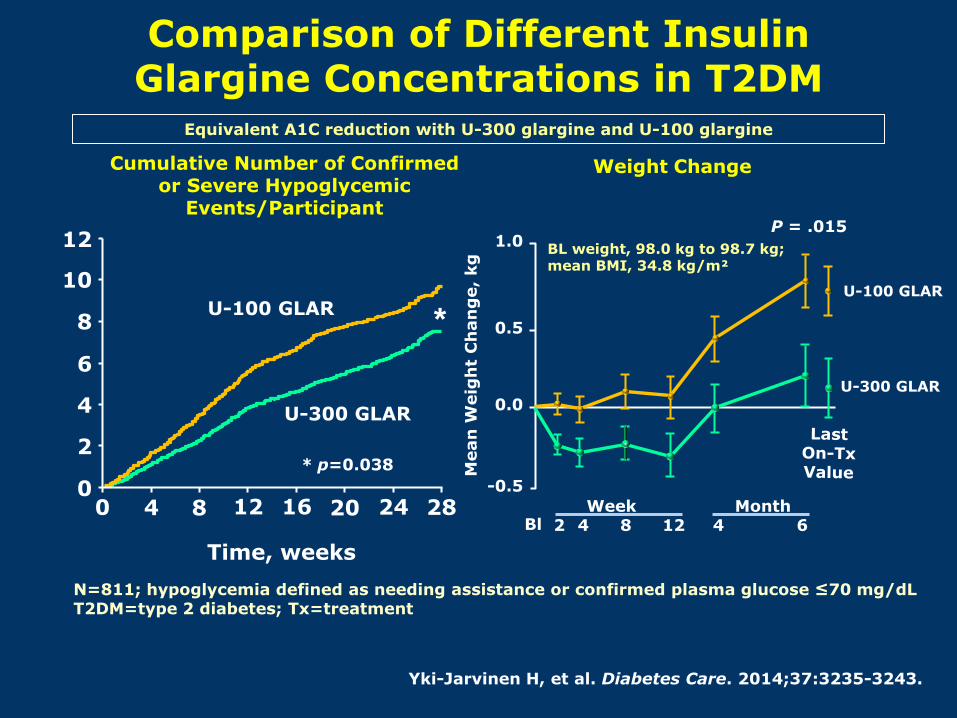
Comparison of Different Insulin Glargine Concentrations in T2DM
N=811; hypoglycemia defined as needing assistance or confirmed plasma glucose ≤70 mg/dL T2DM=type 2 diabetes; Tx=treatment
Equivalent A1C reduction with U-300 glargine and U-100 glargine
Time, weeks
0
4
6
10
12
0 8 20 28
Cumulative Number of Confirmed or Severe Hypoglycemic
Events/Participant
8
2
4 12 24 16
U-100 GLAR
U-300 GLAR
Yki-Jarvinen H, et al. Diabetes Care. 2014;37:3235-3243.
Weight Change
P = .015
U-100 GLAR
U-300 GLAR
1.0
0.5
0.0
-0.5
Bl Week
2 4 8 12 Month
4 6
Mean
Weig
ht
Ch
an
ge,
kg BL weight, 98.0 kg to 98.7 kg;
mean BMI, 34.8 kg/m²
* p=0.038
*
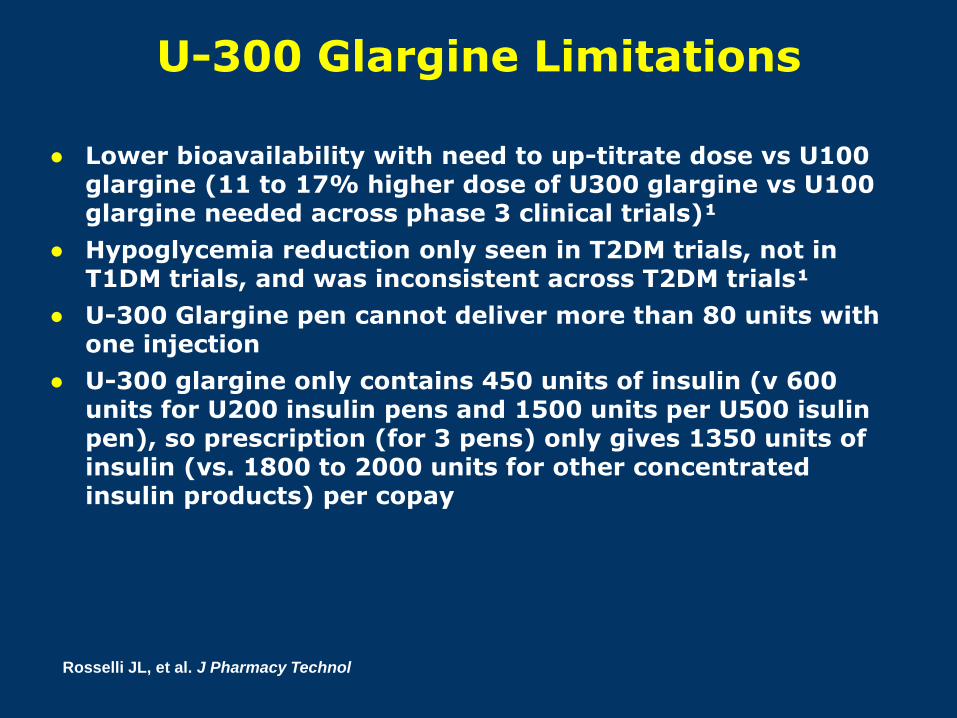
U-300 Glargine Limitations
● Lower bioavailability with need to up-titrate dose vs U100 glargine (11 to 17% higher dose of U300 glargine vs U100 glargine needed across phase 3 clinical trials)¹
● Hypoglycemia reduction only seen in T2DM trials, not in T1DM trials, and was inconsistent across T2DM trials¹
● U-300 Glargine pen cannot deliver more than 80 units with one injection
● U-300 glargine only contains 450 units of insulin (v 600 units for U200 insulin pens and 1500 units per U500 isulin pen), so prescription (for 3 pens) only gives 1350 units of insulin (vs. 1800 to 2000 units for other concentrated insulin products) per copay
Rosselli JL, et al. J Pharmacy Technol
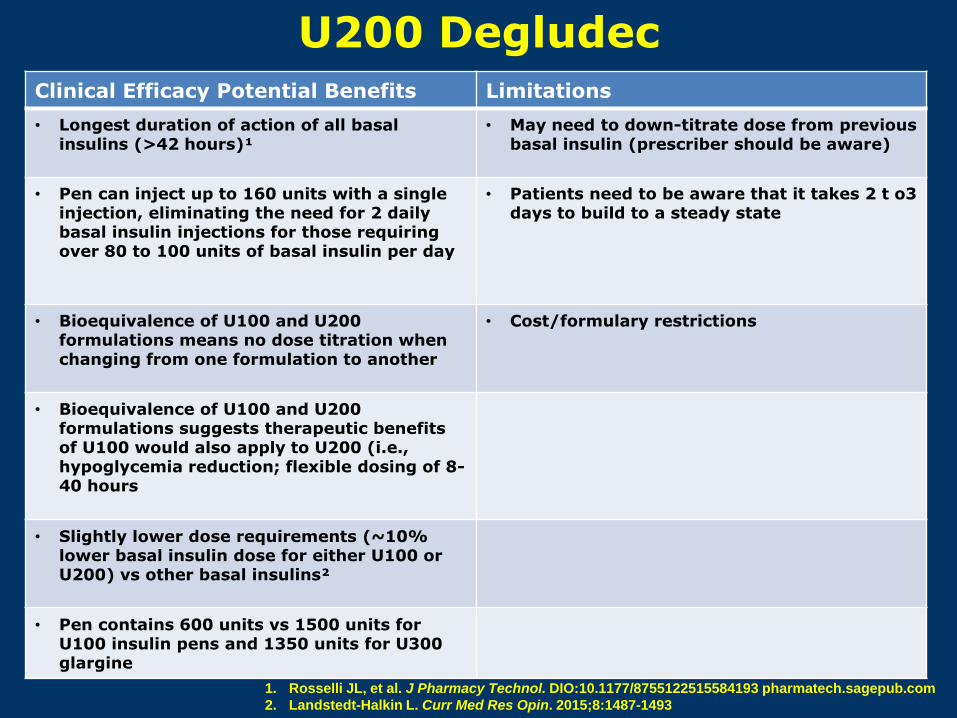
U200 Degludec Clinical Efficacy Potential Benefits Limitations
• Longest duration of action of all basal insulins (>42 hours)¹
• May need to down-titrate dose from previous basal insulin (prescriber should be aware)
• Pen can inject up to 160 units with a single injection, eliminating the need for 2 daily basal insulin injections for those requiring over 80 to 100 units of basal insulin per day
• Patients need to be aware that it takes 2 t o3 days to build to a steady state
• Bioequivalence of U100 and U200 formulations means no dose titration when changing from one formulation to another
• Cost/formulary restrictions
• Bioequivalence of U100 and U200 formulations suggests therapeutic benefits of U100 would also apply to U200 (i.e., hypoglycemia reduction; flexible dosing of 8-40 hours
• Slightly lower dose requirements (~10% lower basal insulin dose for either U100 or U200) vs other basal insulins²
• Pen contains 600 units vs 1500 units for U100 insulin pens and 1350 units for U300 glargine
1. Rosselli JL, et al. J Pharmacy Technol. DIO:10.1177/8755122515584193 pharmatech.sagepub.com
2. Landstedt-Halkin L. Curr Med Res Opin. 2015;8:1487-1493
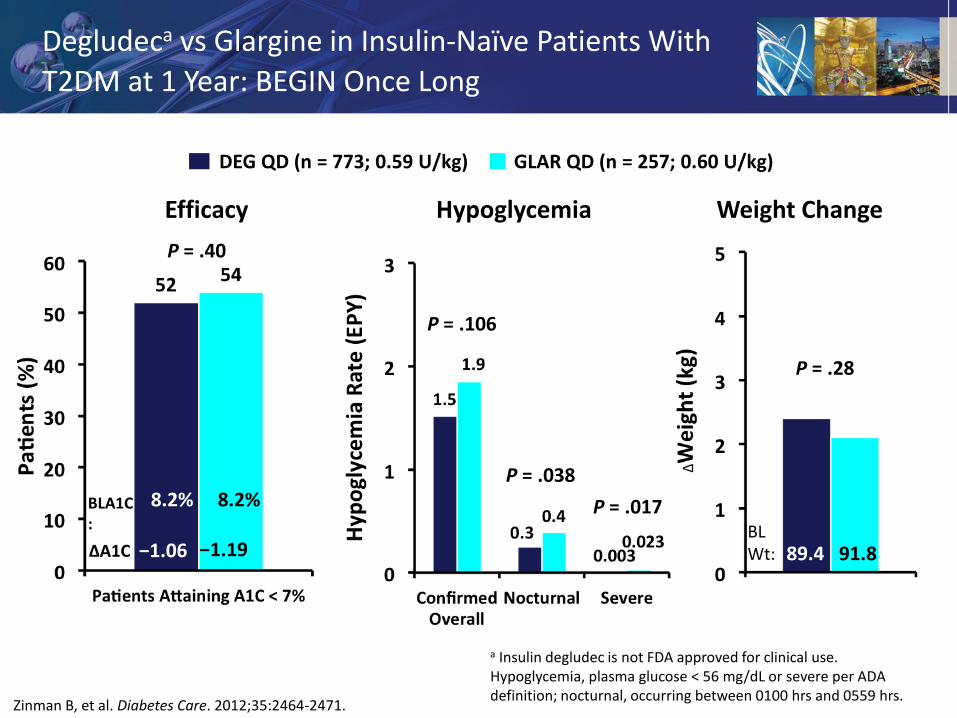
a Insulin degludec is not FDA approved for clinical use. Hypoglycemia, plasma glucose < 56 mg/dL or severe per ADA definition; nocturnal, occurring between 0100 hrs and 0559 hrs.
P = .28
P = .017
P = .106
DEG QD (n = 773; 0.59 U/kg) GLAR QD (n = 257; 0.60 U/kg)
89.4 91.8 BL Wt: ΔA1C −1.19
8.2% 8.2%
Efficacy Weight Change Hypoglycemia
P = .40
P = .038
Zinman B, et al. Diabetes Care. 2012;35:2464-2471.
Degludeca vs Glargine in Insulin-Naïve Patients With
T2DM at 1 Year: BEGIN Once Long
BLA1C:
−1.06
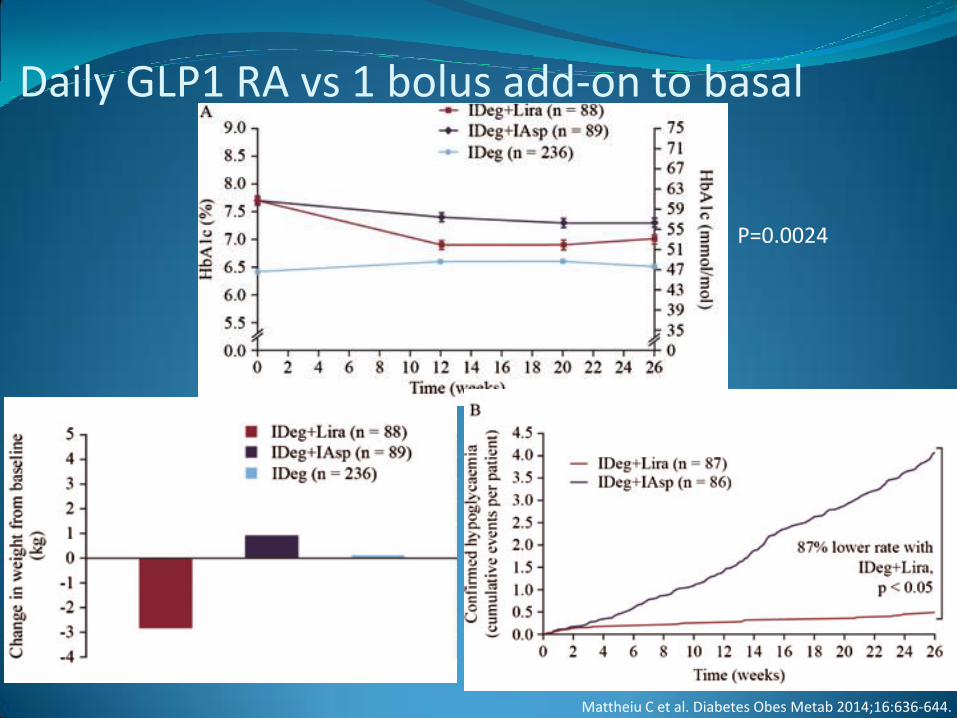
Daily GLP1 RA vs 1 bolus add-on to basal
P=0.0024
P<0.0001
Mattheiu C et al. Diabetes Obes Metab 2014;16:636-644.
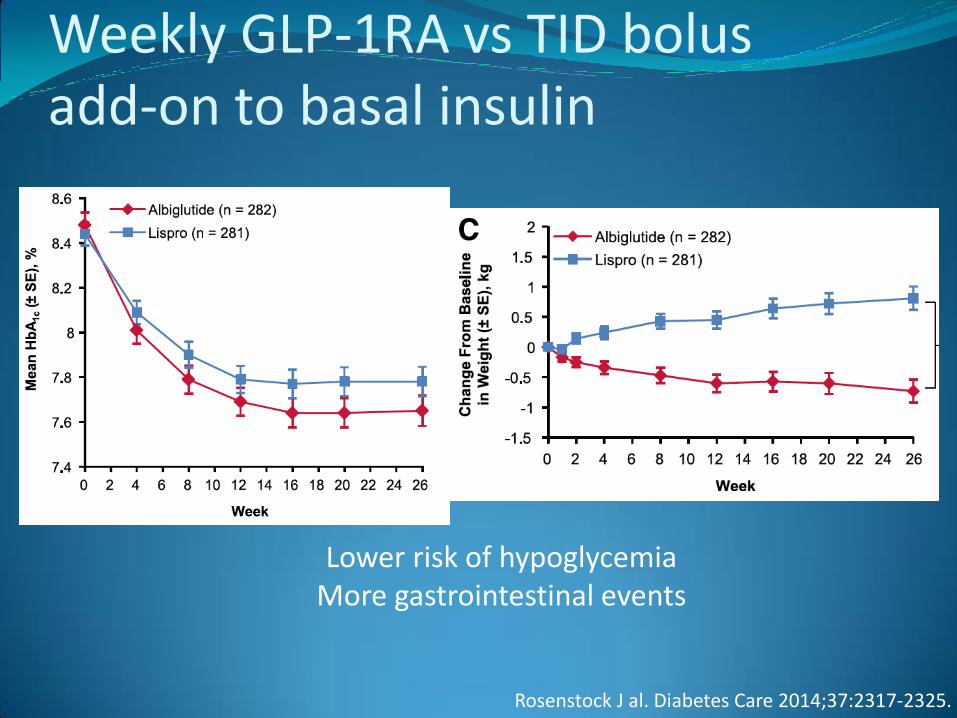
Weekly GLP-1RA vs TID bolus add-on to basal insulin
Non-inferior p=<0.0001
Lower risk of hypoglycemia More gastrointestinal events
Rosenstock J al. Diabetes Care 2014;37:2317-2325.
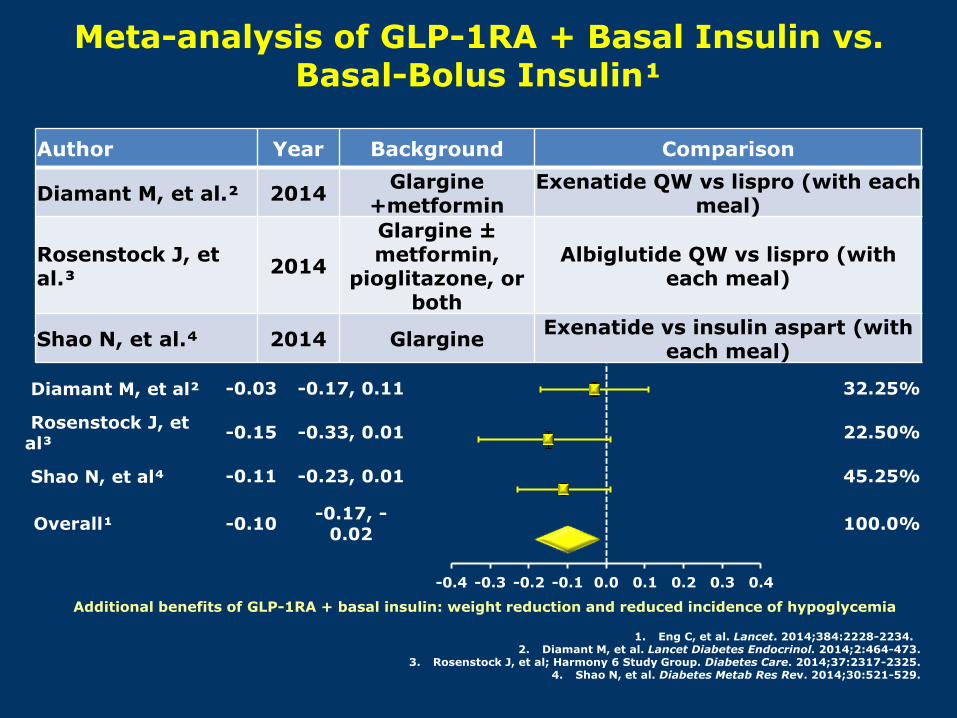
Meta-analysis of GLP-1RA + Basal Insulin vs. Basal-Bolus Insulin¹
1. Eng C, et al. Lancet. 2014;384:2228-2234. 2. Diamant M, et al. Lancet Diabetes Endocrinol. 2014;2:464-473.
3. Rosenstock J, et al; Harmony 6 Study Group. Diabetes Care. 2014;37:2317-2325. 4. Shao N, et al. Diabetes Metab Res Rev. 2014;30:521-529.
Additional benefits of GLP-1RA + basal insulin: weight reduction and reduced incidence of hypoglycemia
-0.4 -0.3 -0.2 -0.1 0.0 0.1 0.2 0.3 0.4
Author Δ
A1C 95% C.I.
Favors GLP-1+Basal
Favors Basal-bolus
Weight
Diamant M, et al² -0.03 -0.17, 0.11 32.25%
Rosenstock J, et al³
-0.15 -0.33, 0.01 22.50%
Shao N, et al⁴ -0.11 -0.23, 0.01 45.25%
Overall¹ -0.10 -0.17, -
0.02 100.0%
Author Year Background Comparison
Diamant M, et al.² 2014 Glargine
+metformin Exenatide QW vs lispro (with each
meal)
Rosenstock J, et al.³
2014
Glargine ± metformin,
pioglitazone, or both
Albiglutide QW vs lispro (with each meal)
Shao N, et al.⁴ 2014 Glargine Exenatide vs insulin aspart (with
each meal)
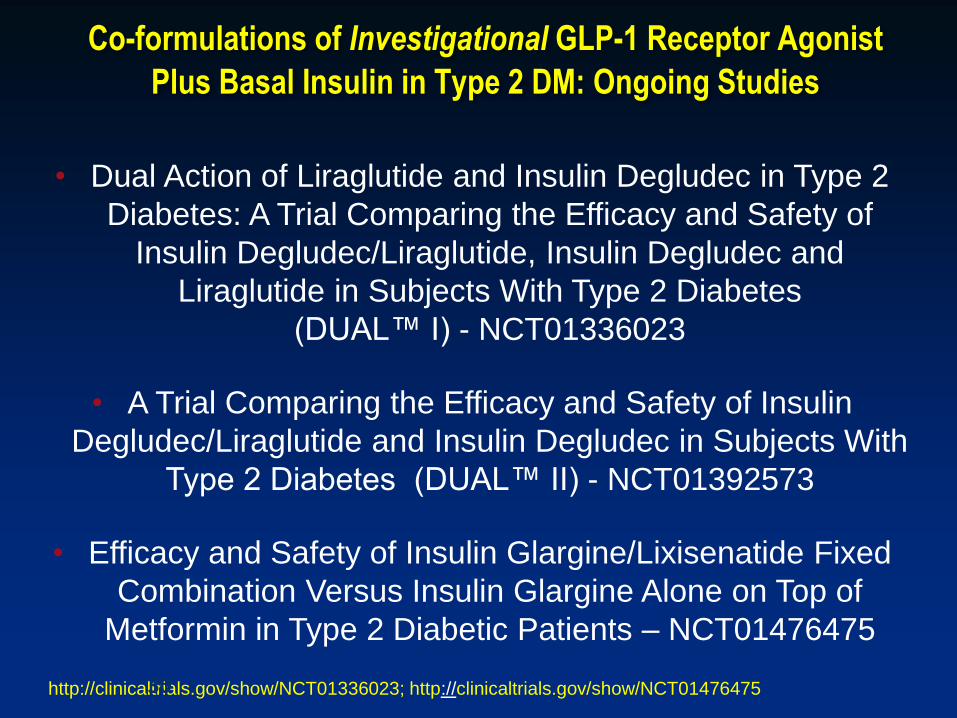
• Dual Action of Liraglutide and Insulin Degludec in Type 2
Diabetes: A Trial Comparing the Efficacy and Safety of
Insulin Degludec/Liraglutide, Insulin Degludec and
Liraglutide in Subjects With Type 2 Diabetes
(DUAL™ I) - NCT01336023
• A Trial Comparing the Efficacy and Safety of Insulin
Degludec/Liraglutide and Insulin Degludec in Subjects With
Type 2 Diabetes (DUAL™ II) - NCT01392573
• Efficacy and Safety of Insulin Glargine/Lixisenatide Fixed
Combination Versus Insulin Glargine Alone on Top of
Metformin in Type 2 Diabetic Patients – NCT01476475
http://clinicaltrials.gov/show/NCT01336023; http://clinicaltrials.gov/show/NCT01476475
Co-formulations of Investigational GLP-1 Receptor Agonist
Plus Basal Insulin in Type 2 DM: Ongoing Studies
30
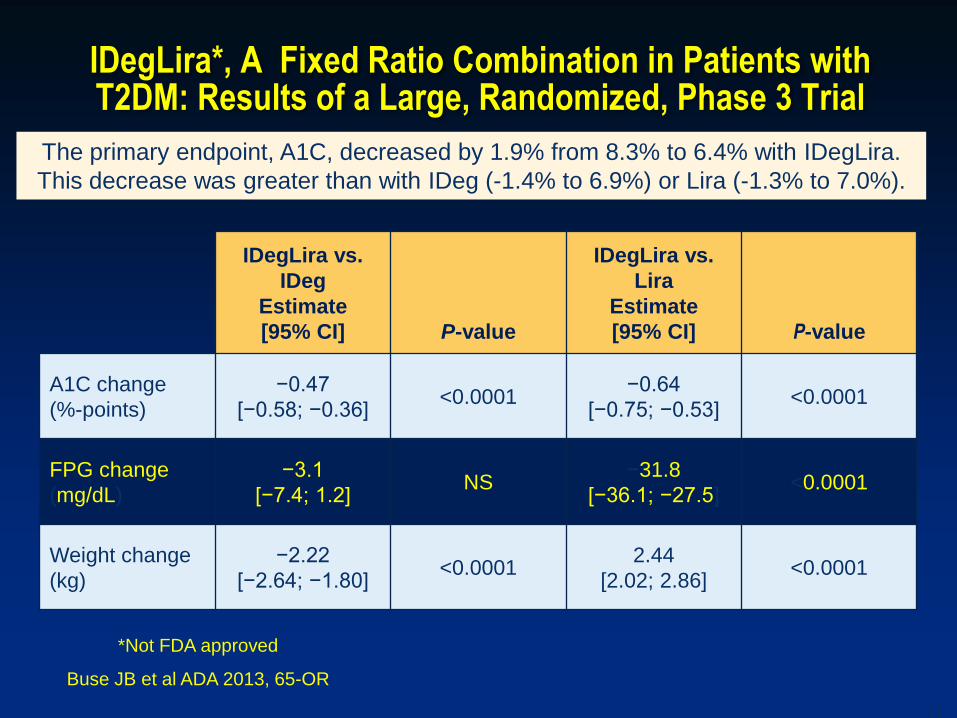
IDegLira*, A Fixed Ratio Combination in Patients with T2DM: Results of a Large, Randomized, Phase 3 Trial
IDegLira vs.
IDeg
Estimate
[95% CI] P-value
IDegLira vs.
Lira
Estimate
[95% CI] P-value
A1C change
(%-points)
−0.47
[−0.58; −0.36] <0.0001
−0.64
[−0.75; −0.53] <0.0001
FPG change
(mg/dL)
−3.1
[−7.4; 1.2] NS
−31.8
[−36.1; −27.5] <0.0001
Weight change
(kg)
−2.22
[−2.64; −1.80] <0.0001
2.44
[2.02; 2.86] <0.0001
31
*Not FDA approved
Buse JB et al ADA 2013, 65-OR
Key Results with IDegLira vs. IDeg or Lira Alone The primary endpoint, A1C, decreased by 1.9% from 8.3% to 6.4% with IDegLira.
This decrease was greater than with IDeg (-1.4% to 6.9%) or Lira (-1.3% to 7.0%).
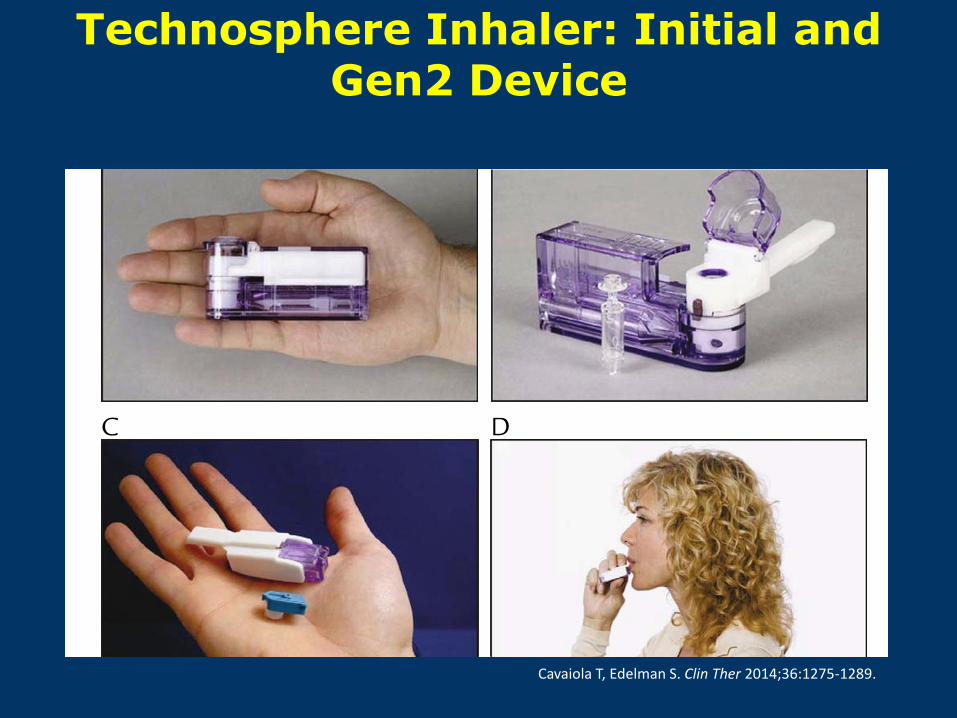
Technosphere Inhaler: Initial and Gen2 Device
Cavaiola T, Edelman S. Clin Ther 2014;36:1275-1289.
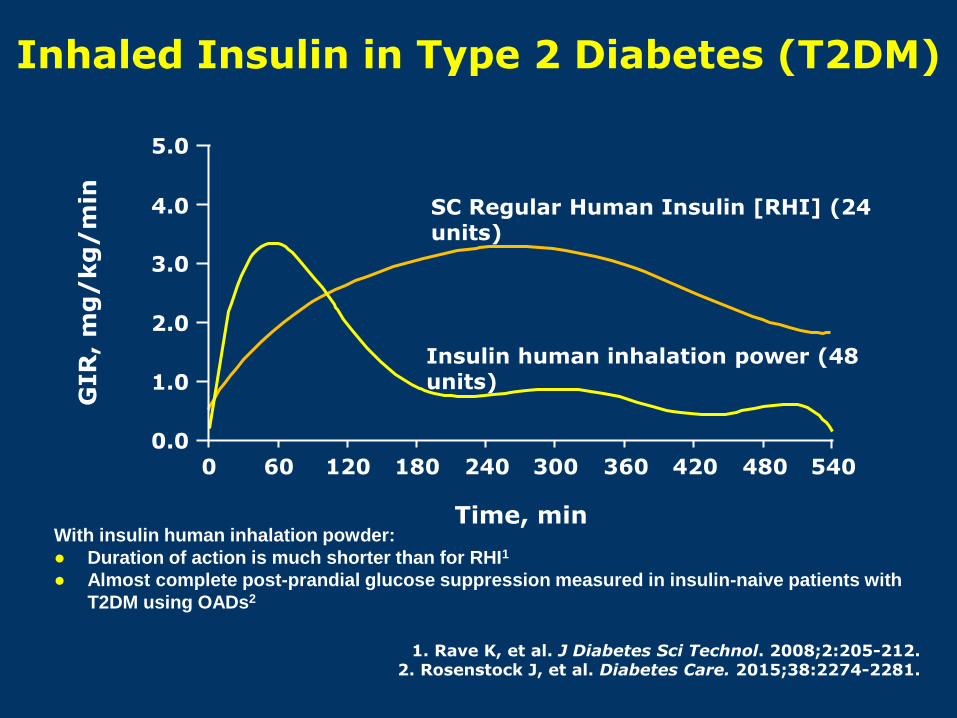
Inhaled Insulin in Type 2 Diabetes (T2DM)
Insulin human inhalation power (48 units)
SC Regular Human Insulin [RHI] (24 units)
5.0
3.0
1.0
GIR
, m
g/
kg
/m
in
0 60 120 180
Time, min
4.0
2.0
0.0 240 300 360 420 480 540
With insulin human inhalation powder:
● Duration of action is much shorter than for RHI1
● Almost complete post-prandial glucose suppression measured in insulin-naive patients with
T2DM using OADs2
1. Rave K, et al. J Diabetes Sci Technol. 2008;2:205-212. 2. Rosenstock J, et al. Diabetes Care. 2015;38:2274-2281.
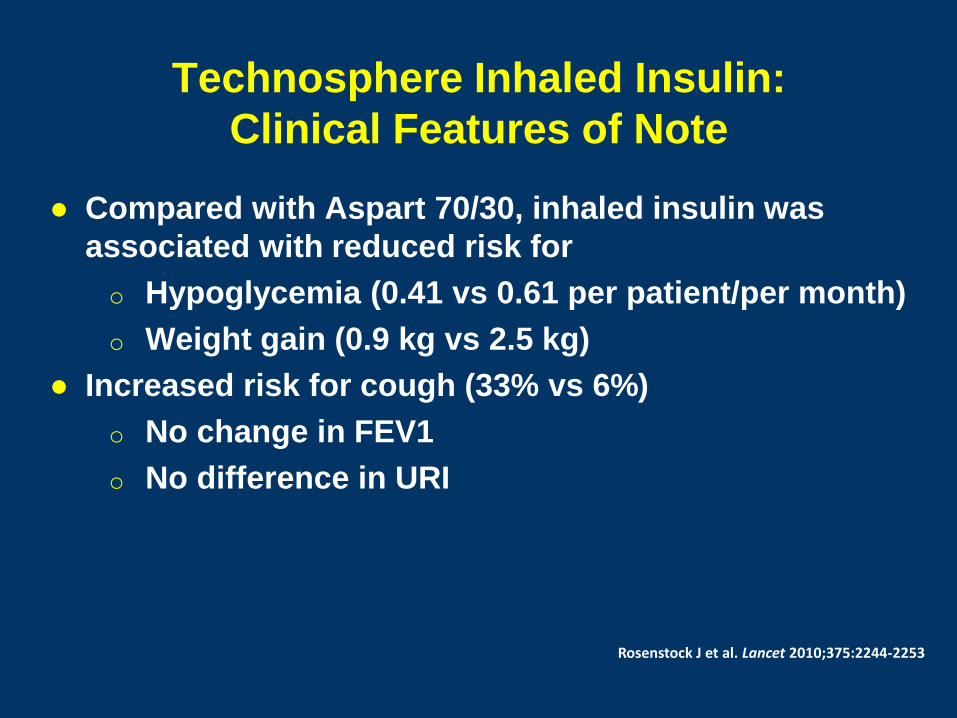
Technosphere Inhaled Insulin:
Clinical Features of Note
● Compared with Aspart 70/30, inhaled insulin was
associated with reduced risk for
o Hypoglycemia (0.41 vs 0.61 per patient/per month)
o Weight gain (0.9 kg vs 2.5 kg)
● Increased risk for cough (33% vs 6%)
o No change in FEV1
o No difference in URI
Rosenstock J et al. Lancet 2010;375:2244-2253
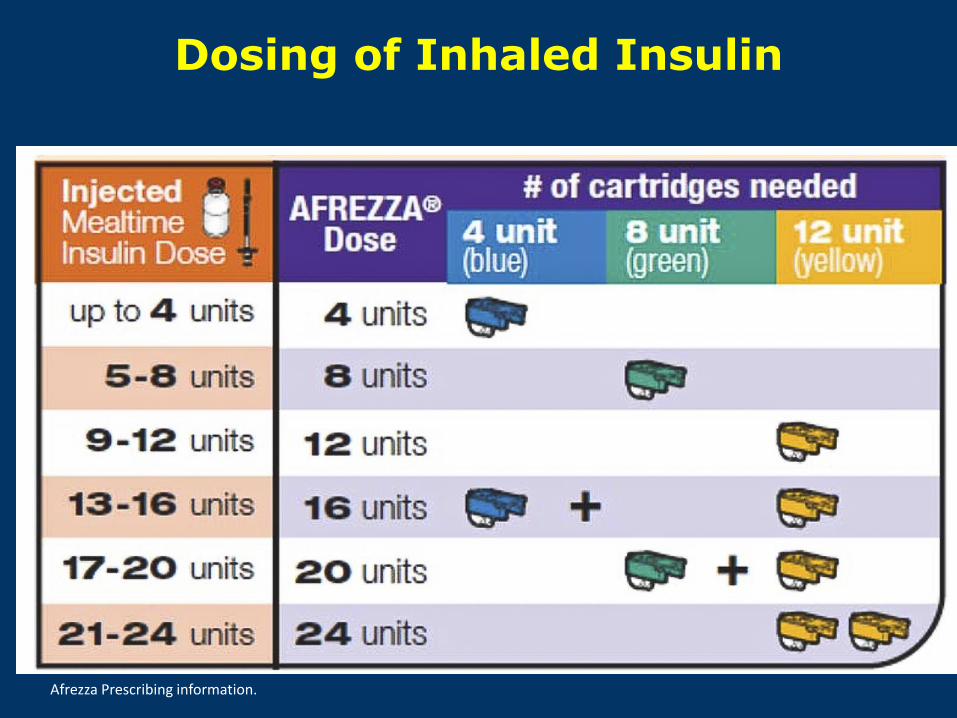
Dosing of Inhaled Insulin
Afrezza Prescribing information.
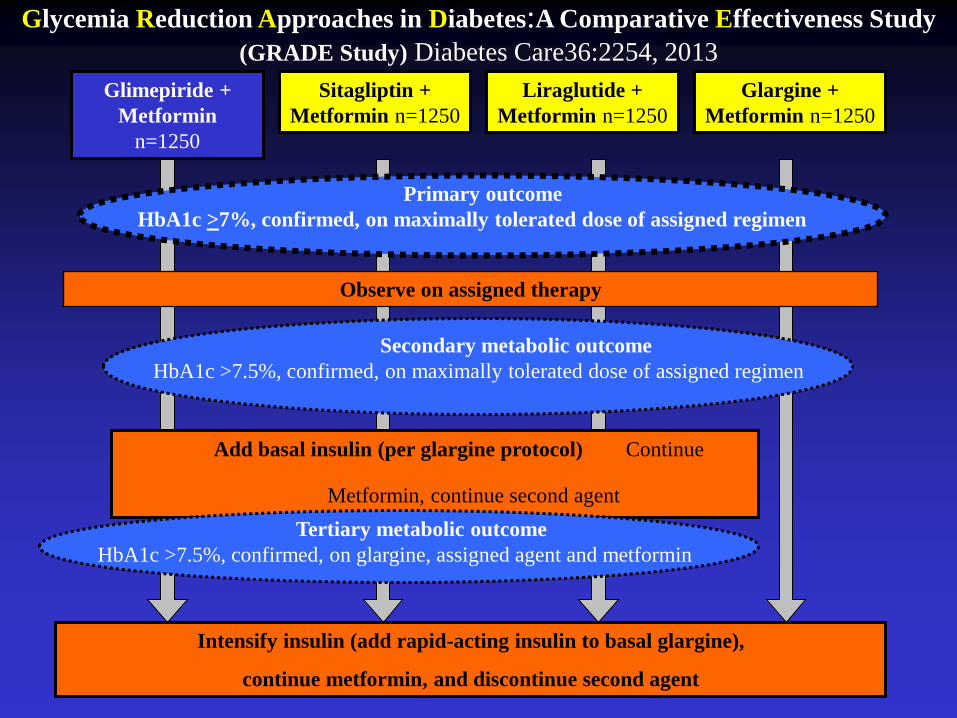
Primary outcome
HbA1c >7%, confirmed, on maximally tolerated dose of assigned regimen
Glimepiride +
Metformin
n=1250
Sitagliptin +
Metformin n=1250
Liraglutide +
Metformin n=1250
Glargine +
Metformin n=1250
Observe on assigned therapy
Secondary metabolic outcome
HbA1c >7.5%, confirmed, on maximally tolerated dose of assigned regimen
Add basal insulin (per glargine protocol) Continue
Metformin, continue second agent Tertiary metabolic outcome
HbA1c >7.5%, confirmed, on glargine, assigned agent and metformin
Intensify insulin (add rapid-acting insulin to basal glargine),
continue metformin, and discontinue second agent
Glycemia Reduction Approaches in Diabetes:A Comparative Effectiveness Study
(GRADE Study) Diabetes Care36:2254, 2013
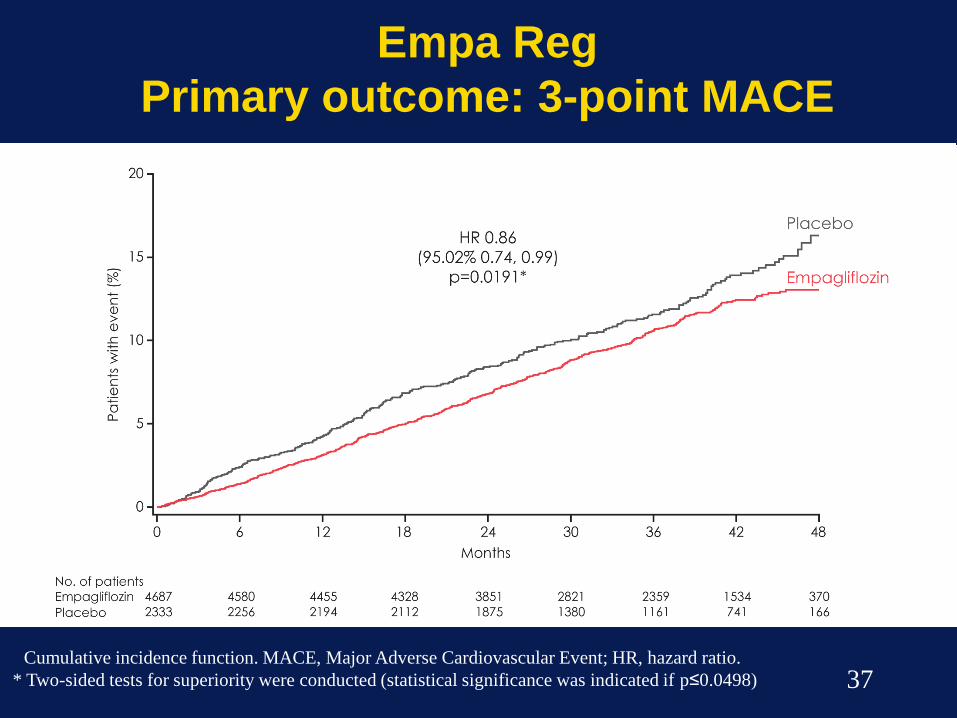
Empa Reg
Primary outcome: 3-point MACE
37 Cumulative incidence function. MACE, Major Adverse Cardiovascular Event; HR, hazard ratio.
* Two-sided tests for superiority were conducted (statistical significance was indicated if p≤0.0498)
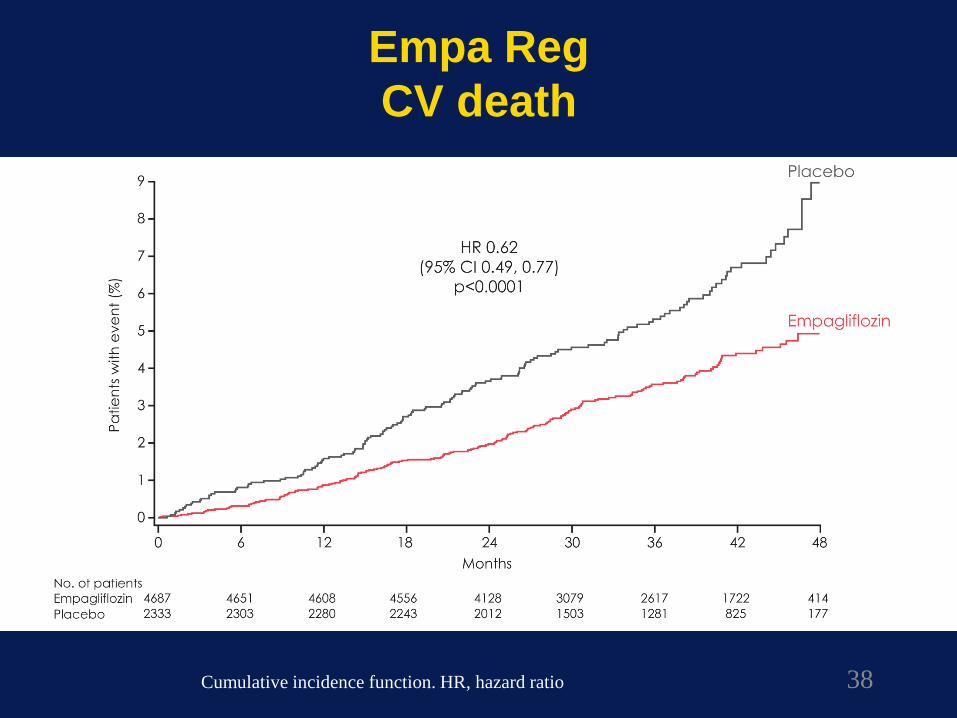
Empa Reg
CV death
38 Cumulative incidence function. HR, hazard ratio
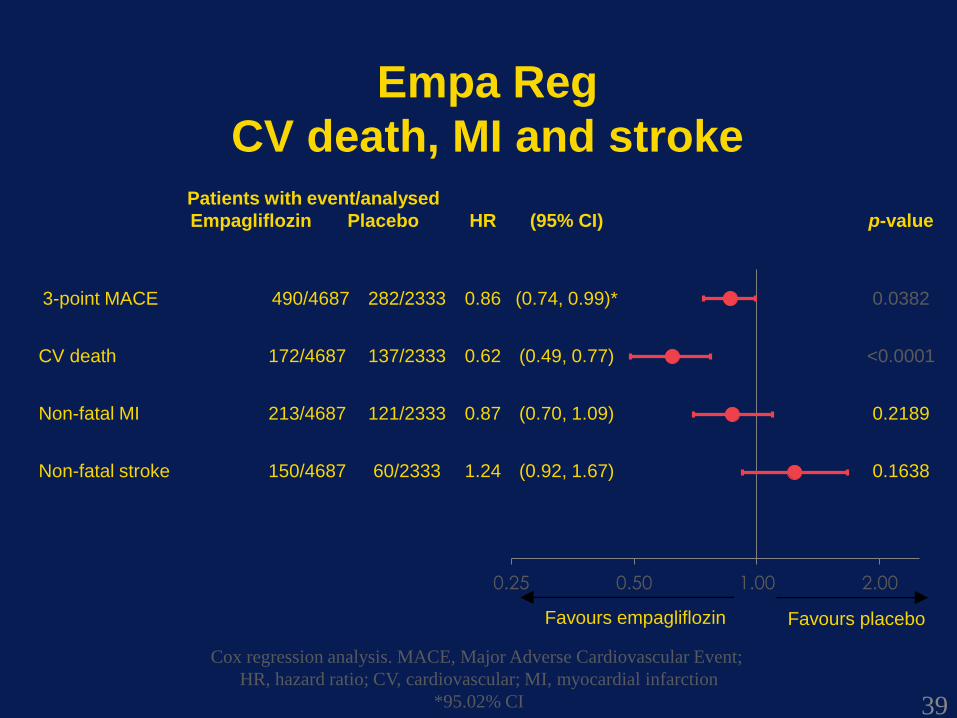
Patients with event/analysed
Empagliflozin Placebo HR (95% CI) p-value
3-point MACE 490/4687 282/2333 0.86 (0.74, 0.99)* 0.0382
CV death 172/4687 137/2333 0.62 (0.49, 0.77) <0.0001
Non-fatal MI 213/4687 121/2333 0.87 (0.70, 1.09) 0.2189
Non-fatal stroke 150/4687 60/2333 1.24 (0.92, 1.67) 0.1638
0.25 0.50 1.00 2.00
Empa Reg
CV death, MI and stroke
39
Favours empagliflozin Favours placebo
Cox regression analysis. MACE, Major Adverse Cardiovascular Event;
HR, hazard ratio; CV, cardiovascular; MI, myocardial infarction
*95.02% CI
Empa Reg
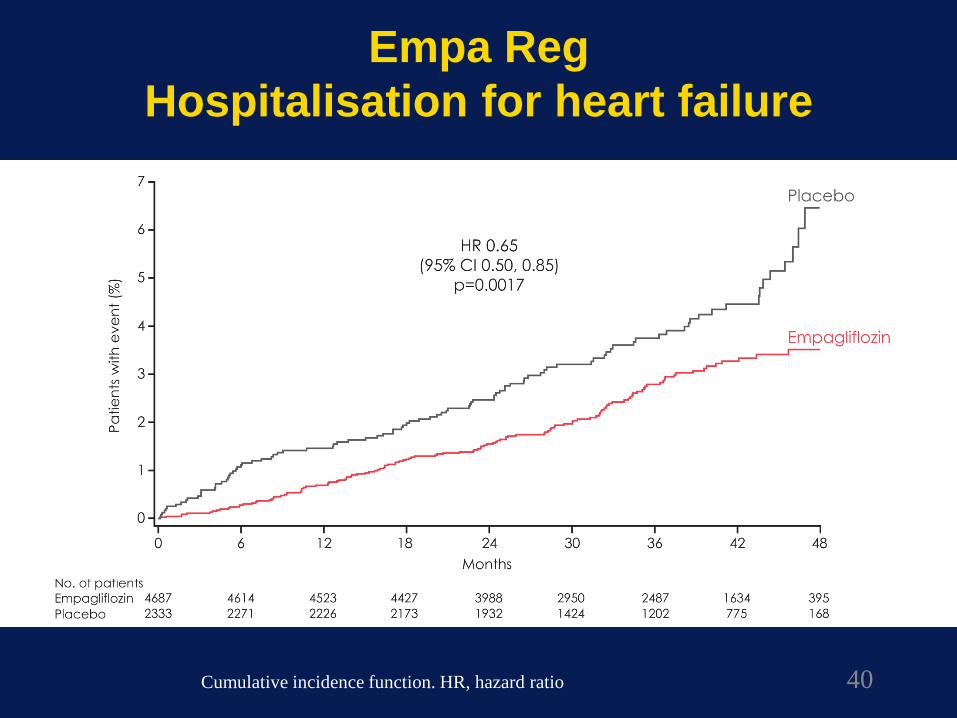
Hospitalisation for heart failure
40 Cumulative incidence function. HR, hazard ratio
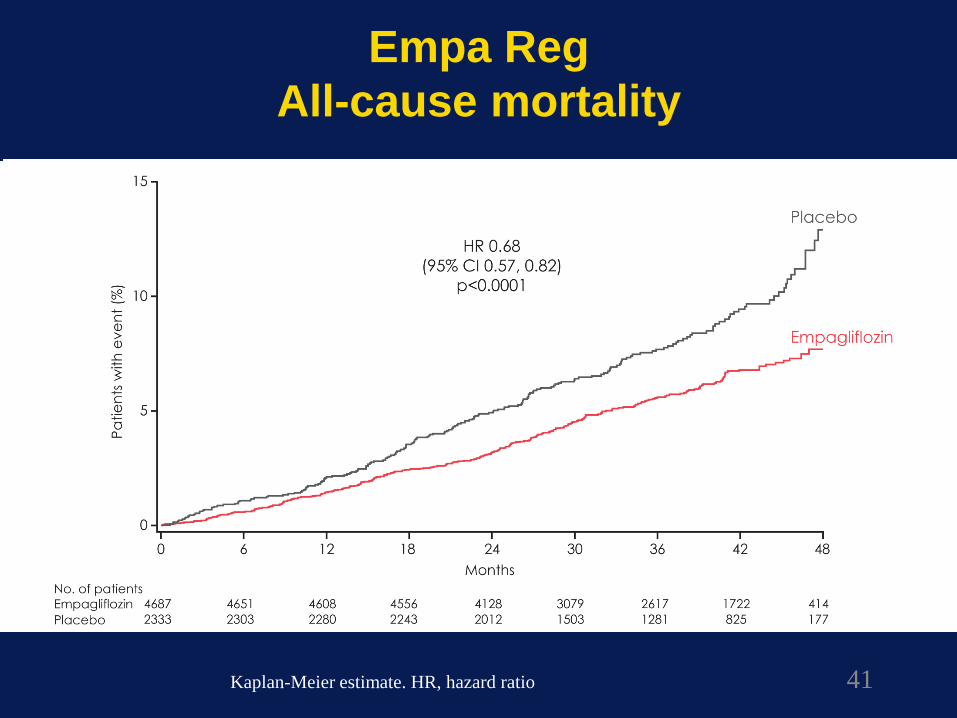
Empa Reg
All-cause mortality
41
Kaplan-Meier estimate. HR, hazard ratio
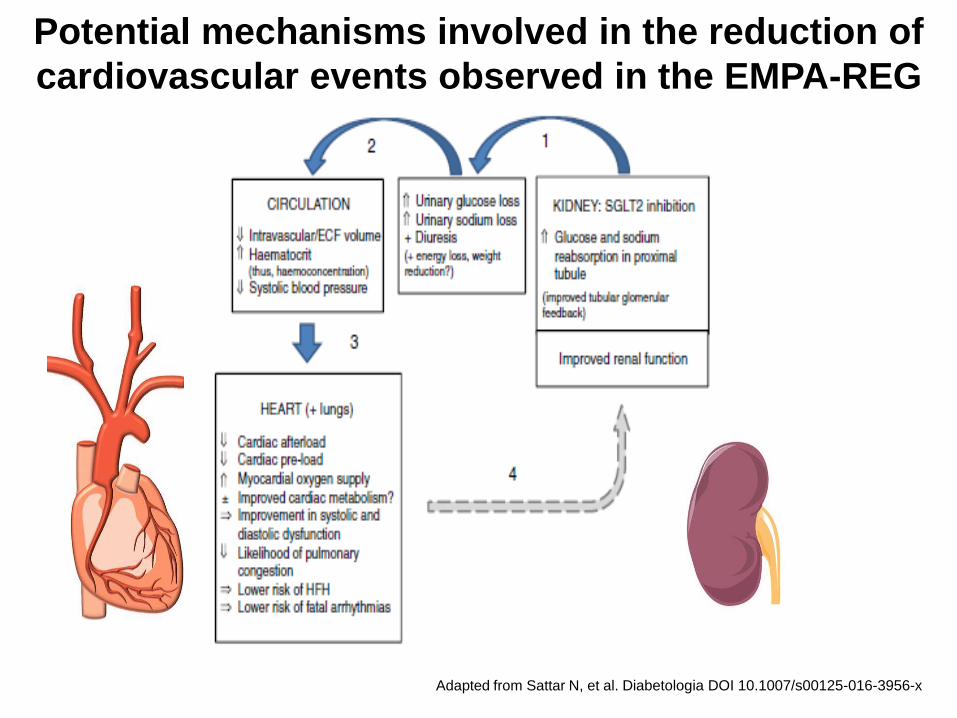
Potential mechanisms involved in the reduction of
cardiovascular events observed in the EMPA-REG
OUTCOME trial
Adapted from Sattar N, et al. Diabetologia DOI 10.1007/s00125-016-3956-x
0
20
40
60
80
100
0 6 12 18 24 30 36 42 48 54
Pa
tie
nts
wit
h a
n E
ve
nt
(%)
Months
Placebo
Liraglutide
0
4
8
12
16
20
0 6 12 18 24 30 36 42 48 54
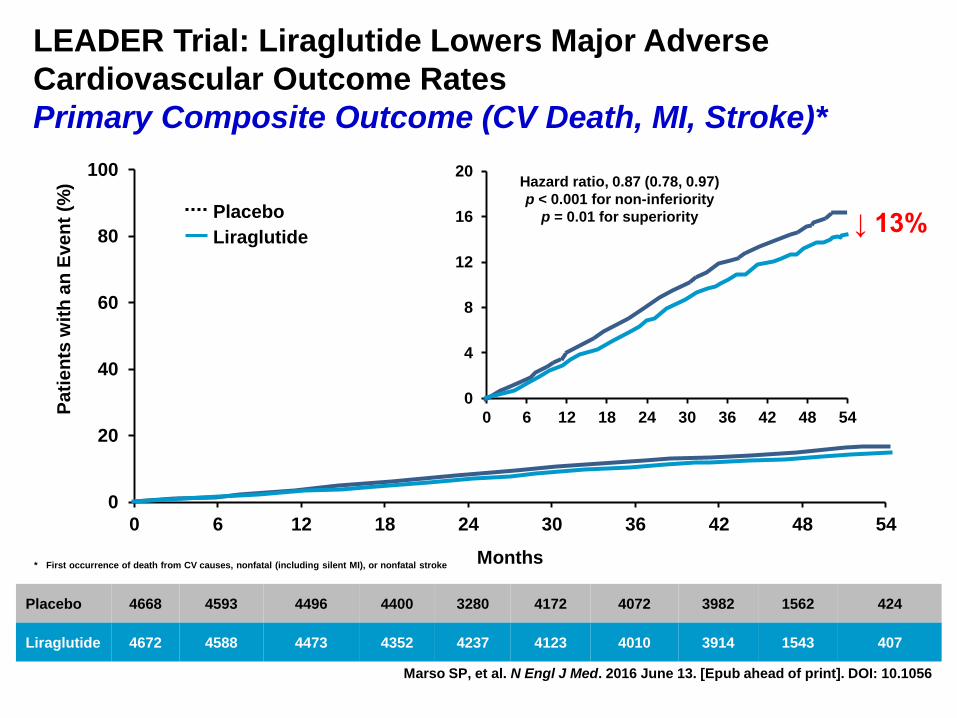
LEADER Trial: Liraglutide Lowers Major Adverse
Cardiovascular Outcome Rates
Primary Composite Outcome (CV Death, MI, Stroke)*
Hazard ratio, 0.87 (0.78, 0.97)
p < 0.001 for non-inferiority
p = 0.01 for superiority
Marso SP, et al. N Engl J Med. 2016 June 13. [Epub ahead of print]. DOI: 10.1056
Placebo 4668 4593 4496 4400 3280 4172 4072 3982 1562 424
Liraglutide 4672 4588 4473 4352 4237 4123 4010 3914 1543 407
* First occurrence of death from CV causes, nonfatal (including silent MI), or nonfatal stroke
↓ 13%
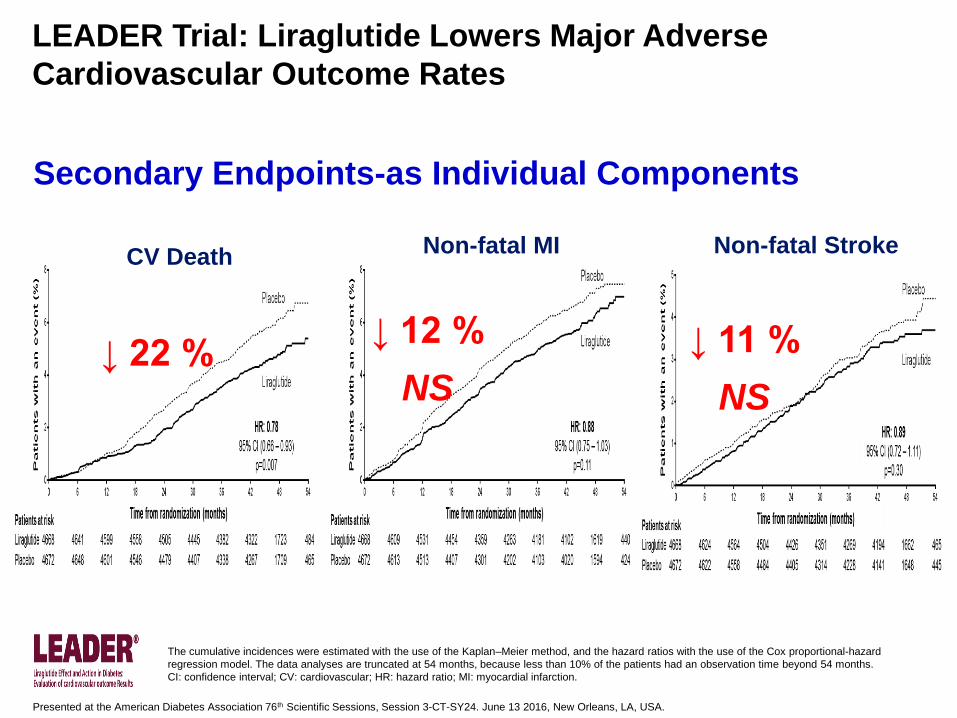
Secondary Endpoints-as Individual Components
The cumulative incidences were estimated with the use of the Kaplan–Meier method, and the hazard ratios with the use of the Cox proportional-hazard
regression model. The data analyses are truncated at 54 months, because less than 10% of the patients had an observation time beyond 54 months.
CI: confidence interval; CV: cardiovascular; HR: hazard ratio; MI: myocardial infarction.
Presented at the American Diabetes Association 76th Scientific Sessions, Session 3-CT-SY24. June 13 2016, New Orleans, LA, USA.
↓ 22 % ↓ 12 %
NS
↓ 11 %
NS
CV Death Non-fatal MI Non-fatal Stroke
LEADER Trial: Liraglutide Lowers Major Adverse
Cardiovascular Outcome Rates
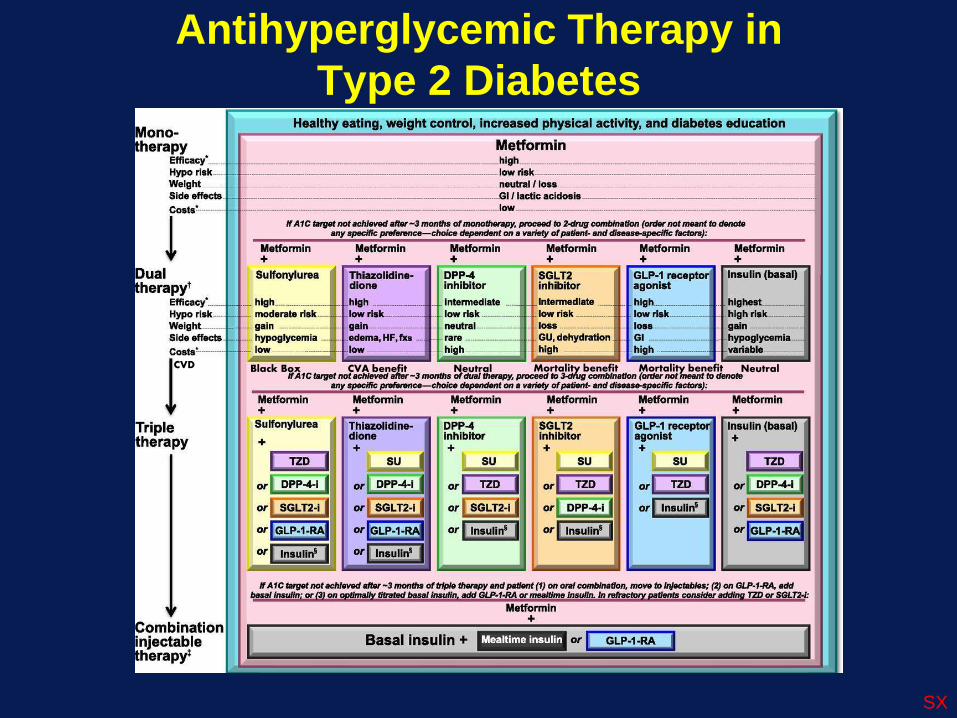
Antihyperglycemic Therapy in
Type 2 Diabetes
American Diabetes Association Standards of Medical Care in Diabetes. Approaches to Glycemic Treatment. Diabetes Care 2016; 39 (Suppl. 1): SX
CVD Black Box CVA benefit Neutral Mortality benefit Mortality benefit Neutral
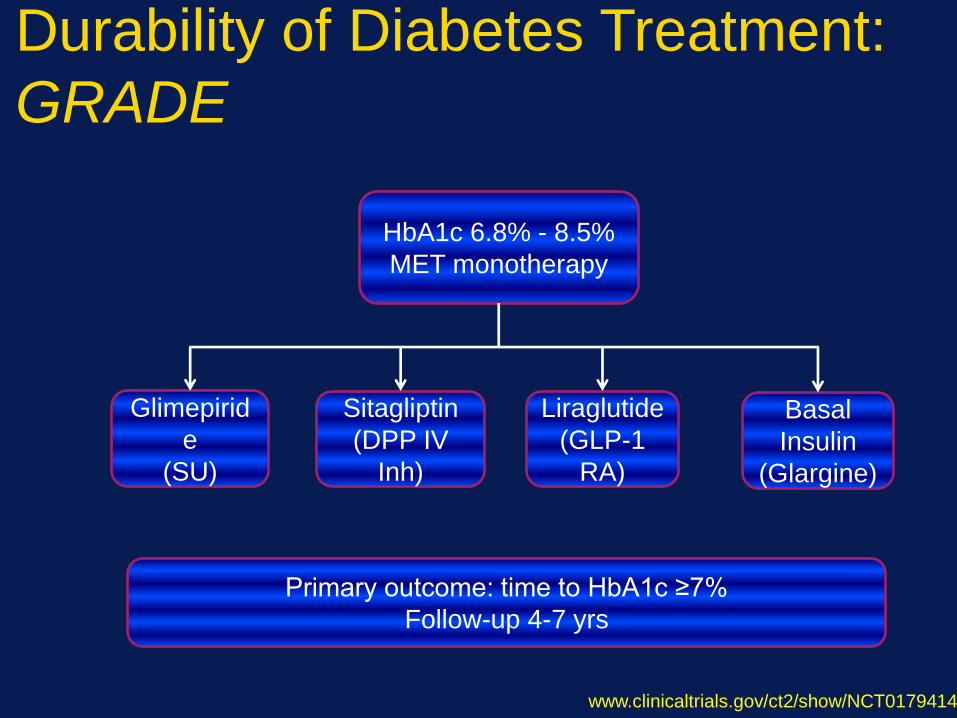
Durability of Diabetes Treatment:
GRADE
HbA1c 6.8% - 8.5%
MET monotherapy
Glimepirid
e
(SU)
Sitagliptin
(DPP IV
Inh)
Liraglutide
(GLP-1
RA)
Basal
Insulin
(Glargine)
Primary outcome: time to HbA1c ≥7%
Follow-up 4-7 yrs
www.clinicaltrials.gov/ct2/show/NCT01794143